the effect of african growth on future global energy, emissions, and regional development
TRANSCRIPT

The effect of African growth on future global energy,emissions, and regional development
Katherine Calvin & Shonali Pachauri &Enrica De Cian & Ioanna Mouratiadou
Received: 29 December 2012 /Accepted: 25 September 2013# Springer Science+Business Media Dordrecht 2013
Abstract Today Africa is a small emitter, but it has a large and faster-than-average growingpopulation and per capita income that could drive future energy demand and, if unconstrained,emissions. This paper uses a multi-model comparison to characterize the potential future energydevelopment for Continental and Sub-Saharan Africa under different assumptions about popu-lation and income. Our results suggest that population and economic growth rates will stronglyinfluence Africa’s future energy use and emissions. We show that affluence is only one face ofthe medal and the range of future emissions is also contingent on technological and politicalfactors. Higher energy intensity improvements occur when Africa grows faster. In contrast,climate intensity varies less with economic growth and it is mostly driven by climate policy.African emissions could account for between 5 % and 20 % of global emissions, with Sub-Saharan Africa contributing between 4 % and 10 % of world emissions in 2100. In all scenariosconsidered, affluence levels remain low until the middle of the century, suggesting that thepopulation could remain dependent on traditional bioenergy to meet most residential energy
Climatic ChangeDOI 10.1007/s10584-013-0964-4
This article is part of a Special Issue on “The Impact of Economic Growth and Fossil Fuel Availability onClimate Protection” with Guest Editors Elmar Kriegler, Ottmar Edenhofer, Ioanna Mouratiadou, GunnarLuderer, and Jae Edmonds.
Electronic supplementary material The online version of this article (doi:10.1007/s10584-013-0964-4)contains supplementary material, which is available to authorized users.
K. Calvin (*)Joint Global Change Research Institute/PNNL, College Park, MD, USAe-mail: [email protected]
S. PachauriEnergy Program, International Institute for Applied Systems Analysis (IIASA), Schlossplatz 1,A-2361 Laxenburg, Austriae-mail: [email protected]
E. De CianFondazione Eni Enrico Mattei (FEEM) and Euro-Mediterranean Center on Climate Change (CMCC),Venice, Italye-mail: [email protected]
I. MouratiadouPotsdam Institute for Climate Impact Research/PIK, P.O. Box 601203, 14412 Potsdam, Germanye-mail: [email protected]

needs. Although the share of electricity in final energy, electric capacity and electricity use percapita all rise with income, even by mid-century they do not reach levels observed in developedcountries today.
1 Introduction
Today, Africa is a small contributor to global emissions. In 2009, continental Africa accountedfor 3.2% of global CO2 fossil fuel emissions and Sub-Saharan Africa for less than 1% of globalemissions (IEA 2010). Emissions are low because economic activity is smaller than in otherregions and most of the population still lacks access to electricity and clean-burning fuels(Pachauri et al. 2013). Currently, Africa produces only 4 % of global Gross Domestic Product(GDP) (Newell and Iler 2013) and it uses only 5.9 % of the global final energy (IEA 2010).However, African population could grow significantly in the future and, by 2100, more than25 % of the world’s population could live there (UN Population Division 2009). By dint ofsheer numbers, Africa could become a place to be reckoned with. Africa’s future energy use andshare of global emissions will depend on socioeconomic, technical, and political factors thatwill shape its energy intensity of GDP and the carbon intensity of energy. Economic growth isonly one face of the medal. Consider for example France and the United States. They havesimilar per capita income, but per capita emissions in the United States are three times those ofFrance. This difference is driven by a number of factors, including the heavy reliance on nuclearpower in France, the preference for big cars, and the very low efficiency levels of buildings inthe US. Which development pathway Africa follows will influence its emissions and couldpotentially impact global emissions due to the projected size of Africa’s population. Given thevery low level of per capita income in Africa today, many different development pathways arepossible and Africa’s emission pathway over the coming century remains highly uncertain.
Economic growth is, however, a very approximate indicator of human well-being anddevelopment. Future development in Africa will necessitate extending access and supplies ofmodern energy to most of its population. Sub-Saharan Africa has lagged far behind the restof the world in providing its population with access to electricity (only 14 % of rural and63 % of urban residents were electrified in 2010) and modern fuels (over 80 % still rely ontraditional solid fuels for cooking) (WB 2013). Evidence of the pivotal catalytic role ofaccess to adequate, affordable, reliable and suitable energy types for lifting people out ofpoverty and enhancing their welfare is irrefutable (Cabraal et al. 2005; Desai et al. 2004;Modi et al. 2005; Pachauri et al. 2012).
The linkage between economic activity, energy use, and emissions has been extensivelyanalyzed globally and for several key regions, such as the United States, Europe, China, andIndia (Nakicenovic and Swart 2000; Blanford et al. 2009; Blanford et al. 2012). A similarassessment is lacking for Africa. Indeed, very few future scenarios exist for the Africancontinent. They either focus on selected countries (e.g. South Africa, see Winkler et al. 2011;Erickson et al. 2009, or Eritrea, see Buskirk 2006), or when larger in scope, on the first halfof this century (EIA 2013a, b; IEA 2010, 2012; MIT 2012). Modeling comparison exercises,such as the Special Report on Emissions Scenarios (Nakicenovic and Swart 2000) and theEnergy Modeling Forum studies (see Clarke et al. 2009, for example) have also neverfocused on this region and commonly Africa has either been grouped with other largeregions or only included in world totals. Bigger economies have attracted the attention ofregional modeling comparison exercises, such as Europe (Böhringer et al. 2009), USA(Clarke et al. 2007; Fawcett et al. 2009), China and India (Calvin et al. 2012). Admittedly,the lack of scenarios and historical data for some African countries makes the process ofmodel calibration and evaluation more challenging for this region.
Climatic Change

This paper fills this gap by using a multi-model comparison to explore possible populationand economic growth pathways for Africa throughout the century. It looks at how these factorswill transform the energy system and emissions, in four energy-economy models with differentviews about future technological development, opportunities, and economic structure. Thepaper also explores to what extent future economic growth could improve access to modernforms of energy in the region and whether climate policy can hasten or hinder this. The paper isorganized as follows. Section 2 describes the assumptions regarding key drivers of the Africaneconomy, population and GDP. Section 3 discusses the future trends of energy and emissionswithout and with climate policy. Section 4 uses the baseline and policy results discussed in thetwo previous sections to assess the effects on energy-related development indicators. The finalsection concludes with key findings of this study and identifies areas for further research.
2 Population and economic growth in the African economy
We analyze future pathways for Africa by comparing the results of the four models thatparticipated in the “Roadmaps towards sustainable energy futures” (RoSE) project: GCAM(Calvin et al. this issue), IPAC (Jiang 2006), REMIND (Bauer et al. this issue) andWITCH (DeCian et al. this issue). All four models represent Africa, though with different geographicalaggregations. In REMIND and WITCH, Africa represents Sub-Saharan Africa, while inGCAM and IPAC it represents the whole continent, including North Africa and South Africa1.
The scenarios explored in this paper have been developed within the framework of the RoSEproject (see Kriegler et al. this issue). We focus on four baseline and four policy scenarios thatallow examining the role of economic and population growth2 under two policy regimes (no-policy baseline and 550 ppmv CO2 equivalent stabilization target). Three of the sets of theeconomic-population growth assumptions, namely slow, medium, and fast economic growth(respectively BAU FS Gr, BAU DEF and BAU SL Gr Scenarios for baseline, and 550 FS Gr,550 DEF, and 550 SL Gr for policy) assume medium population. In this case, Africanpopulation stabilizes after 2050 and in 2100 accounts for 28 % of the world’s population(87 % of which live in Sub-Saharan Africa)3. The fourth set of assumptions represents apessimistic pathway characterized by very low per capita income, driven by high population,slow growth and slow convergence across world regions (BAU HI Pop Scenario for baselineand 550 HI Pop for policy). The BAU HI Pop baseline echoes a vision of a fragmented world,where extreme poverty, regionalism, and high population could increase the vulnerability ofeconomies heavily dependent on agriculture, making them more vulnerable to climate change
1 The individual models use different criteria to map countries to regions. GCAM and IPAC focus ongeographic proximity and as such all regions include contiguous countries. REMIND and WITCH aggregatecountries to regions based on their development and therefore include North Africa with Middle East andSouth Africa with Korea and Australia (WITCH) and with the Rest of the World (REMIND).2 The GDP per capita scenarios have been developed using the methodology described in Hawksworth(2006). The methodology is based on a Solow-Swan model with capital and quality adjusted labor as inputfactor and exogenous assumption about future Total Factor Productivity (TFP) growth. Population scenariosare from the UN, historic GDP and investment information are from the Penn World Tables and data oneducation levels are from Barro and Lee (2010). Variations in the speed of growth are obtained by varying theTFP growth of the US. The other regions are assumed to converge to the technology frontier at a slow or fastspeed. All models used in the comparison exercise, represent economic entities in Market Exchange Rate(MER). As a consequence, the Purchasing Parity Power (PPP) GDP per capita scenarios have been convertedinto MER using a projection of the PPP to MER ratio for the 21st century.3 As noticed in other studies for Africa, this share is significantly larger than the expected share of China orIndia (Cilliers and Moyer 2011).
Climatic Change

Tab
le1
GDPpercapita
(Growth
RateandAbsolute)
across
modelsandscenarios
GDPpercapita
Average
annual
grow
thrate
2005–210
0
BAU
SLGr(Slow)
BAU
DEF(M
edium)
BAU
FSGr(Fast)
HIPop
Con
tinentalAfrica
GCAM
2.7%
3.1%
3.5%
1.6%
IPAC
2.6%
3.0%
3.3%
1.5%
Sub
-Saharan
Africa
REMIN
D3.2%
3.6%
4.0%
1.7%
WITCH
3.3%
3.6%
4.1%
1.8%
GDPpercapita
in20
50(100020
05$perperson
)
BAU
SLGr(Slow)
BAU
DEF(M
edium)
BAU
FSGr(Fast)
HIPop
Con
tinentalAfrica
GCAM
$4.7
$5.1
$5.4
$2.6
IPAC
$4.5
$4.8
$5.0
$2.5
Sub
-Saharan
Africa
REMIN
D$3
.7$3
.9$4
.2$1
.6
WITCH
$3.7
$3.8
$4.3
$1.7
Using
theseassumptions,GDPin
2060
varies
across
scenariosfrom
$8and$18Trillion,arangecomparableto
theotherfew
projectio
nsavailable.
For
exam
ple,
theAfrican
DevelopmentB
ankoptim
istic
scenario
(AfD
B20
11)foresees
aGDPlevelin20
60equaltoUS$17Trillion
atcurrentm
arketp
rices.The
MIT
JointP
rogram
EnergyandClim
ate
Outlook
2012
projectio
nsforContin
entalAfricaarevery
closeto
ourBAUSLGrScenario.
In20
50,G
DPpercapitareaches20
04$1
,949
perperson
,whilepopulatio
ngrow
sto
2,19
1million(M
IT20
12).Itisim
portanttokeep
inmindthattheseareprojectio
nsin
MERandthereforeun
derestim
atefuture
grow
thandincomelevelsin
Africa.Our
numbers
wou
ldbe
between1.3and1.7high
erin
PPPterm
s
Climatic Change

impacts. It is important to note that these scenarios were designed to explore the sensitivity ofenergy and emissions to population and GDP assumptions, not to explore uncertainty. There-fore results presented in this paper should not be construed as a full uncertainty range.
The different models implemented the scenarios by modifying exogenous parameters insuch a way to replicate the specified assumptions for population and economic growth (seeTable 1)4. Specifically, in all models population was exogenously set to match the figuresprovided in the 2008 Revision of the UN Population Prospects (UN 2009). GDP per capitatrajectories were replicated by adjusting the productivity of all production factors (WITCH)or of labor (REMIND, GCAM, IPAC). Further, fossil fuel resource availability and extrac-tion costs have also been harmonized, but no attempt has been made to harmonize energyintensity. In the next section we explore the implications of baseline scenarios on the futureenergy system and emissions. We also examine the implications of limiting CO2-equivalentconcentrations to 550 ppmv in the different population and economic growth scenarios.
3 Future energy systems and emissions
3.1 Future trends in absence of climate policy
Economic growth will drive Africa’s demand for energy. However, despite the harmonization inGDP per capita and population, models foresee a broad range in baseline final energy and CO2
emissions (Fig. 1), even when accounting for different geographical definitions of Africa. Finalenergy consumption growth rates (2005–2100) vary between 1.2 % (BAU HI Pop in WITCH)and 2.4 % (BAU FS Gr in REMIND) per year in Sub-Saharan Africa and between 1.5 % (BAUHI Pop in IPAC) and 2.3 % (BAU FS Gr in GCAM) per year in Continental Africa. Theresulting variation in energy consumption in 2100 indicates that models embed very differentviews about the relationship between income and energy services, energy efficiency, and thecost and availability of different fuel carriers and technologies, and their evolution throughoutthe century. In all models, the BAU HI Pop Scenario has the lowest final energy consumption.Although this scenario has approximately one billion more people in 2100 than the otherscenarios, GDP per capita is significantly lower (see Table 1). The latter effect dominates,resulting in lower energy consumption.
Energy system CO2 emissions grow between 2.7 % (BAU HI Pop in WITCH) and 3.8 %(BAU FS Gr in REMIND) per year (2005–2100) in Sub-Saharan Africa and between 1.6 %(BAU HI Pop in IPAC) and 2.9 % (BAU FS Gr in GCAM) in Continental Africa. For three ofthe models, the BAU FSGr Scenario has the highest CO2 emissions in 2100, followed by BAUDEF, BAU SL Gr, and finally BAU HI Pop. In the case of IPAC, faster growth is associated toincreased use of nuclear energy, both in absolute terms and percentage terms, and thereforelower fossil fuel use and lower emissions compared to the BAU SL Gr and BAU DEFScenarios.
To help understand the differences in emissions across models, we use the Kaya identity(Kaya 1990) to decompose emissions. The Kaya identity highlights the contribution of thedrivers of population, GDP per capita, final energy intensity, and emissions intensity:
Emissions ¼ Population⋅GDP
Population
� �⋅
Final Energy Use
GDP
� �⋅
Emissions
Final Energy Use
� �
4 Table 1 shows the results of scenario implementation in the individual models.
Climatic Change

Since the first two of these factors have been harmonized (see Table 1), all variation inemissions can be attributed to differences in energy intensity of GDP (Fig. 2a, b) and to carbonintensity of energy (Fig. 2c, d), which are technical factors reflecting different visions abouttechnology and energy options for the African economy. African energy intensity variessignificantly across models in absolute terms, but there is agreement on the relative trends withhigher energy intensity improvements being observed in scenarios with faster growth. Changesin energy intensity reflect the substitutability between capital and energy and assumptions aboutenergy efficiency improvements over time. These improvements are exogenous in all models5,except WITCH where they are endogenously linked to R&D investments.
In contrast, carbon intensity is mostly affected by the composition of the energy mix(Figure 3 and Figure 1 in the Supplementary Material, SM). In most models and scenarios,we observe a shift away from traditional biomass6 to more modern energy carriers and fossilfuels throughout the century (Fig. 3). However, the degree of electrification, but also theemployment of various fossil fuels in the form of liquids, solids or gases is very differentacross models. GCAM, IPAC, and REMIND, which show a sharp increase in carbonintensity in the first half of the century, feature a higher increase in final energy from coal(other solids), while in the WITCH model, traditional biomass continues to account for alarge share of final energy. Solids use is largely reduced by 2100 in all models, and replacedto a large extend by electricity7. By the end of the century, models with lower carbonintensities (IPAC and REMIND) are associated to higher electrification rates. Differences inthe sources of energy used for the production of electricity further contribute to differencesin carbon intensity levels across models, with GCAM and WITCH relying more on fossilfuels, REMIND on greater deployment of solar8 and IPAC on nuclear (SM Figure 1).
Overall, carbon intensity appears to be mostly model-specific, and with the exception ofIPAC, it shows very little variation with economic growth assumptions. Only the BAU HIPop Scenario shows a lower increase in carbon intensity of energy. In IPAC, the BAU FS GrScenario has a strong decline in carbon intensity, due to the increased use of nuclear energymentioned above. Compared to the global trends9, in most scenarios African energyintensity declines faster than the world average, with the range varying between −3.6 and−1.3 %. In contrast, the carbon intensity grows more rapidly than the world average in most
5 In REMIND the efficiency parameters are assumed to change at the same rate as labor efficiency, plus anadditional adjustment factor is applied that varies per region and final energy type and results in continuity ofpast trends and a converging behavior between regions (EJ/capita over GDP PPP/capita) (Luderer et al. 2013).6 Traditional biomass is usually defined as unprocessed fuelwood, agricultural residues, and animal dung, aswell as charcoal, normally combusted on open fires or in very inefficient stoves. Traditional biomass isrepresented as a function of GDP per capita in the WITCH and GCAM models, and exogenous assumptionsare employed in REMIND.7 Electrification rates are driven by numerous factors. Some mechanisms that influence electrification rates,e.g. in the case of REMIND, include a) possibility of substitution between transport energy, electricity, andnon-electric energy for stationary end uses within the nested Constant Elasticity of Substitution productionfunction, b) calibration of the energy efficiencies of the stationary electricity CES leaf, c) provision of energythrough numerous competing technologies characterized by different efficiencies, lifetimes, investment costs,fixed and variable operation and maintenance costs, learning rates, etc.8 Reasons motivating differences in the deployment of solar and nuclear across models include a) in REMINDsolar (and wind) technologies are characterized by endogenous technological change through learning-by-doing, where investment costs decrease by pre-specified rates for each doubling of cumulated capacity, b)solar is not considered in the WITCH model, c) in REMIND and IPAC a sharper increase of gas and coalprices in the second half of the century is observed.9 Global energy intensity growth rates range between −2.2 and −1.1 %, while carbon intensity rates rangebetween −0.1 and 0.9 %.
Climatic Change

models and scenarios. REMIND and WITCH, which represent Sub-Saharan Africa, showthe largest rates of energy intensity reduction and of carbon intensity increase.
3.2 Future trends with climate policy
Future energy systems and emissions could follow a different pathway in the presence ofGreenhouse Gas emissions (GHG) regulations or if Africa joined a global agreement thatstabilizes GHG concentrations by the end of the century. The imposition of such a policyforces significant abatement in Africa (Fig. 4a, b). At least 70 % of emissions must be abatedby the end of the century in all models and scenarios. Some models show more than 100 %emissions reductions in a given year, indicating a heavy reliance on bioenergy in combina-tion with CO2 capture and storage (BECCS).
We use the Kaya Identity to isolate the contribution of reductions in energy use and of shiftsin the fuel mix, and examine how climate policy modifies the change in energy intensity andcarbon intensity (Fig. 4c–f). The WITCH model reduces energy intensity significantly in
a b
c d
Fig. 1 Final energy and energy system CO2 emissions without climate policy
Climatic Change

response to a climate policy, while the other models only reduce energy intensity 20 to 30 %.Differences in results across models are due to differing assumptions about (1) the availabilityof more energy efficient technologies and the presence of endogenous technical change, (2) theelasticity of demand, (3) the possibility to substitute energy with capital, and (4) the response ofenergy prices to climate policy. For example, GCAM is a technology-rich model with a lowprice elasticity of demand. With these assumptions, GCAM has a fairly low reduction in energyintensity. In WITCH, energy efficiency improvement is endogenously affected by R&Dinvestments and climate policy, thus, setting a price on carbon induces an increase in thoseinvestments (see also De Cian et al. this issue).
All models eventually reduce carbon intensity more than energy intensity, though withdifferent time profiles. For example, WITCH points at the role of energy efficiency im-provements in the short-term, while decarbonization plays a more important role in the long-run. This combination of energy efficiency measures and decarbonization is also due to the factthat some carbon free technologies are subject to endogenous learning and therefore are adoptedmore broadly in the long term when costs are lower. In contrast, GCAM and REMIND have
a b
c d
Fig. 2 Energy intensity and carbon intensity without climate policy
Climatic Change

more low carbon supply options, leading to a more significant reduction in carbon intensity thanenergy intensity
While all models reduce their use of freely-venting fossil fuels under a climate policy, thechoice of low-carbon fuels to replace them varies across models and to a lesser extent acrossscenarios (Fig. 5 and SM Figure 2). GCAM tends to deploy CO2 capture and storage (CCS)technologies to decarbonize the energy system in Continental Africa, while IPAC relies onincreased nuclear and bioenergy. In Sub-Saharan Africa, both models rely on the use ofBECCS, in addition to the expansion of renewable energy sources in REMIND and energyreductions in WITCH, to meet climate policy goals.
All models suggest that Africa has a large mitigation potential compared to the globalaverage (SM Figure 3). In the WITCH and REMIND models, Africa has a large potential forBECCS enabling more stringent reductions than in other regions. GCAM has similar potentialfor low-carbon fuels as other regions. However, Africa is a rapidly developing region and themodel assumes it is easier to build new low-carbon capacity in such a region than shutdown orretrofit existing capacity in more developed regions.
4 Future energy scenarios and implications for development
In Africa, access rates to modern forms of energy are well below global averages and thereforeimproving energy access is a priority for the population of this continent. This section examines
a b
c d
Fig. 3 Final energy use per capita in 2050 and 2100 without climate policy
Climatic Change

to what extent the baseline and policy scenarios, presented in the previous section, can achievesome development-related energy goals. Although none of the RoSE models is explicitlydesigned to address the linkages between energy and poverty or equity in development, andsector disaggregation and representation of socio-economic heterogeneity is limited, some
a b
c d
e f
Fig. 4 Reduction in emissions, energy intensity and carbon intensity from imposing a climate policy
Climatic Change
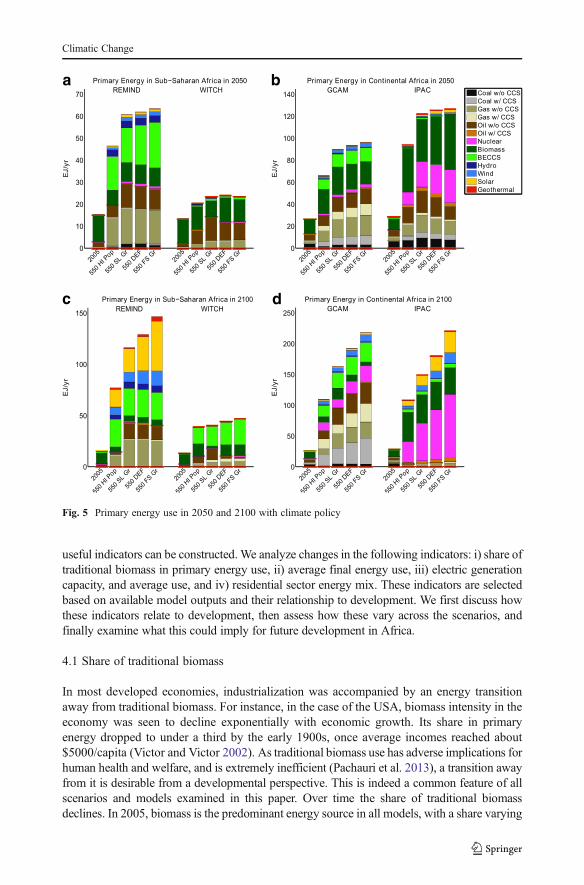
useful indicators can be constructed.We analyze changes in the following indicators: i) share oftraditional biomass in primary energy use, ii) average final energy use, iii) electric generationcapacity, and average use, and iv) residential sector energy mix. These indicators are selectedbased on available model outputs and their relationship to development. We first discuss howthese indicators relate to development, then assess how these vary across the scenarios, andfinally examine what this could imply for future development in Africa.
4.1 Share of traditional biomass
In most developed economies, industrialization was accompanied by an energy transitionaway from traditional biomass. For instance, in the case of the USA, biomass intensity in theeconomy was seen to decline exponentially with economic growth. Its share in primaryenergy dropped to under a third by the early 1900s, once average incomes reached about$5000/capita (Victor and Victor 2002). As traditional biomass use has adverse implications forhuman health and welfare, and is extremely inefficient (Pachauri et al. 2013), a transition awayfrom it is desirable from a developmental perspective. This is indeed a common feature of allscenarios and models examined in this paper. Over time the share of traditional biomassdeclines. In 2005, biomass is the predominant energy source in all models, with a share varying
a
c d
b
Fig. 5 Primary energy use in 2050 and 2100 with climate policy
Climatic Change

from 80 % in REMIND andWITCH for Sub-Saharan Africa, to 30–40 % in GCAM and IPACfor the entire continent. Across all the models and scenarios, the share of primary biomass isprojected to fall to below a third when income reaches a level of between $3600/capita and$4200/capita (approximately $10/capita/day and above) (Fig. 6a, b). However, for the BAU HIPop Scenario, average income is projected to stay below $5000/capita till 2040 and the share ofprimary biomass correspondingly high (even as high as 44% for Sub-Saharan Africa, accordingto the WITCH model). Imposing a climate policy, results in an even slower transition awayfrom traditional biomass. This persistently high level of biomass intensity in the region,suggests that a large share of the population could continue to rely primarily on biomass tomeet its residential needs for the next couple of decades.
4.2 Average final energy use
While there is no universally accepted minimum threshold of final energy use per capitadeemed necessary for economic development, some early estimates set a threshold of1 kW/capita or 31 GJ/capita/year (Goldemberg et al. 1985). More recently estimates in therange of 50–70 GJ/capita have been suggested as necessary to provide for basic humandevelopment (Nilsson et al. 2012; Smil 2003). Even if such a threshold exists, recent researchsuggests that this level may not be constant. Some decoupling with economic growth isexpected over time, and the threshold may vary significantly across nations depending on
a b
c d
Fig. 6 Traditional biomass share in total primary energy till 2100 and electricity use per capita till 2050
Climatic Change

which aspects of human development are considered (Steinberger and Roberts 2010). However,the exact welfare impacts of changes in average final energy use depend ultimately on how thisuse is distributed across a population. Across most models and all scenarios, average finalenergy use is projected to remain below 50 GJ/capita till 2050, far below the average in mostOECD countries today (Fig. 3). This level may not be inconsistent with achieving develop-mental objectives on the continent. However, achieving these goals is likely to be morechallenging under the BAU HI Pop Scenario and the climate policy scenarios (SM Figure 2),since average final energy use in these cases is projected to be lower across all models.
In order to explore what the scenario projections might imply for the numbers of Africansthat could remain below a threshold level of final energy use in 2030, we carry out a thoughtexperiment based on an ex-post distributional assumption. We assume the income distributionin Sub-Saharan Africa follows the trend assumed by theGlobal Energy Assessment-Mix (GEA-M) scenario (Riahi et al. 2012). Further, we assume that final energy distribution mirrors thisincome distribution (see (Chakravarty and Tavoni 2013) for recent research that follows thisapproach). All the scenarios and models project a rise in average final energy use over time.However, under these distributional assumptions, 11 %–27% of sub-Saharan Africans in 2030,and even as many as 12 % by 2050 could have an average use that is below a threshold thatmeets even basic direct residential energy needs10, unless dedicated policies that enhance equityare implemented.
4.3 Electricity capacity and average use
Energy in the form of electricity is crucial to modern life, as certain activities, like lighting,refrigeration, running household appliances, and operating equipment cannot easily use otherenergy forms. For this reason, access to electricity is considered an important indicator ofmodernization and development. Sub-Saharan Africa suffers acutely from a lack of access toelectricity and poor quality of supply, where it does exist (Bazilian et al. 2012). Only a third ofthe region’s population is electrified even today (IEA 2012). Excluding South Africa, the entireinstalled generation capacity of Sub-Saharan Africa is about 40 GW, less than that in Mexicoalone (EIA 2013b). Thus, a growth in installed capacity and electricity generation is critical topower development in the region (Eberhard et al. 2011). Pachauri et al. (2013) estimate that anadditional 20 GWof installed capacity by 2030 would be required to provide basic electricityaccess to all households in Sub-Saharan Africa (420 kWh/year/household to meet basic lightingand minor appliance use). Bazilian et al. (2012) estimate that providing everyone in Sub-Saharan Africa (excluding South Africa) with moderate access (both for direct residentialpurposes and economy-wide productive uses) would require an installed generation capacityof about 374GWor an annual growth rate in capacity of 13 % for the next 20 years. Even underthe BAU FS Gr Scenarios, the models do not predict an average growth of 13 % per year ininstalled capacity. Further, electricity use per capita under all scenarios in Sub-Saharan Africa isprojected to stay below 1500 kWh/capita till the middle of the century (equivalent to theaverage use in North Africa today) (Fig. 6c, d). With imposition of climate policies, largerelectric capacity is added in REMIND and IPAC compared to the baseline scenarios withgreater deployment of carbon-free solar and nuclear technologies, but the models project loweraverage electricity use. Whether more rapid electricity capacity growth results in higherconnectivity for the entire population will rest ultimately on the effectiveness of policies that
10 We assume 5 GJ/capita of final energy is needed for meeting basic domestic cooking and electricity needs,as stipulated by the UN Secretary-General’s advisory group (AGECC 2010).
Climatic Change

enhance equity in access to and use of electricity on the sub-continent, something the modelsare unable to capture as yet.
4.4 Residential energy mix
Households in developing regions employ a range of fuels and technologies to meet theirenergy demands. However, among poor households, reliance on solid fuels (e.g. traditionalbiomass), self-collected and burnt in inefficient devices is extremely high (Pachauri et al.2012). With growing affluence and urbanization, a transition to using more efficient liquid,gaseous and grid carriers has been observed in other nations (Pachauri and Jiang 2008). Sucha transition has positive developmental benefits as it reduces drudgery and health impacts forhouseholds associated with solid fuel use.
Only one of the models participating in the RoSE project includes a breakdown ofresidential sector final energy use by type of energy. According to the GCAM projections,a clear transition away from traditional biomass use towards more efficient liquid, gaseousand grid sources of energy results in a decline in per capita final energy use between 2005and 2030 (Figure 4 in SM). While not much variation in the total final residential energy useper capita is observed across the three medium population scenarios, there is a faster increasein the use of more convenient grid sources under the BAU FS Gr Scenario. Under the BAUHI Pop Scenario, the total final residential energy use per capita in 2050 is lower and theshare of traditional biomass is significantly higher as compared to that in the other scenarios.Further, under climate policy, the transition away from traditional biomass is much slower.
Asmost of residential energy use in the region is used for cooking or lighting, applying somesimplifying assumptions, allows us to estimate the likely continued reliance on traditional solidfuels for cooking. Assuming that no electricity and only half of liquid fuels are used for thermalpurposes, and applying standard efficiencies of conversion in end-use devices (Ekholm et al.2010), we project that in 2050, under the BAU SL Gr, BAU DEF and BAU FS Gr Scenarios,about 30 % of total cooking energy needs may still be met from solid fuels, whereas under theBAU HI Pop Scenario, about half of cooking energy needs may still be met using solid fuels.Under the climate scenarios, this share is projected to remain closer to two-thirds in 2030. Thiscontinued reliance on solid fuels for cooking in the region will have associated with it adversehealth andwelfare costs for its population unless widespread dissemination and use of advancedbiomass cookstoves, that have performance characteristics similar to gas stoves, is encouraged.
5 Conclusions
This paper uses the RoSE population and economic growth pathways for the twenty-firstcentury to characterize the potential future energy and emissions development for Conti-nental Africa and for Sub-Saharan Africa. Population and economic growth rates influencethe scale of African’s economy, and its future energy use and emissions. However, ouranalysis shows that affluence levels are only one face of the medal, and the range of futureemissions is only partly explained by the different economic trends. We show that techno-logical factors could also be important.
In a medium economic and population growth scenario (BAUDEF), the share of global CO2
emissions of Continental Africa is approximately 20 % in 2100 in both GCAM and IPAC. Therange for Sub-Saharan Africa is between 4.0 % and 9.8 %. This variation indicates that Africangrowth can be fueled by very different energy mixes and economic structures. A commonfinding across models is that in the absence of climate policy, the demand for fossil energy
Climatic Change

increases over time with economic growth to meet the growing energy needs and to replace theuse of traditional bioenergy. Instead, should the growth of average per capita income remainlow (as in the BAU HI Pop case), a large fraction of the population could continue to rely ontraditional biomass. Regarding what the scenarios might imply for achieving somedevelopment-related energy goals, our analysis suggests that the share of electricity in finalenergy, electric capacity, and electricity use per capita all rise, while the traditional biomassshare declines with growing affluence. Yet, the average levels of final energy and electricity useprojected by the models across the different scenarios, even under fast economic growth (BAUFS Gr), could fail to ensure a minimum threshold use for everyone. Climate policy could resultin more rapid electric capacity growth if carbon-free sources become competitive, but loweraverage electricity use in the short-run. The models cannot really inform us of whether thehigher electricity capacity enables greater access for the entire population. Despite the funda-mental role of economic growth in increasing energy access and some potential co-benefits withclimate policy, it is likely that dedicated policies that enhance equity across the region will beneeded.
The analysis carried out here makes an important contribution to the scenarios literatureby focusing on a region that has been rather underexplored to date. Since Africa starts from alow base, both in terms of per capita income and per capita energy use, its potential futuredevelopment is uncertain. Which development pathway Africa follows will influence itsemissions and could potentially impact global emissions due to the projected size of Africa’seconomy and population. At the same time, this analysis raises issues for further researchand investigation. A more explicit incorporation of efficiencies of end-use technologies infuture analysis and model development would strengthen links between macroeconomicgrowth trends and energy service demands, which are what ultimately link to development.In addition, further comparative analysis across regions, would allow for a better under-standing of the drivers of energy demand in the region and for assessing similarities anddifferences in patterns of change from other developing regions. Furthermore, this researchdoes not address institutional and financial issues, and such additions could be explored infuture work. Finally, a more refined analysis of the development and welfare impacts ofdiffering socio-economic and energy futures in the region will require future model-basedscenario analysis to incorporate greater heterogeneity and disaggregation that capturesdifferences across population sub-groups and end-use sub-sectors.
Acknowledgments This work was funded by Stiftung Mercator (www.stiftung-mercator.de).
References
African Development Bank Group (AfDB) (2011) Africa in 50 Years' Time. The Road Towards InclusiveGrowth. African Development Bank, Tunis, Tunisia
AGECC (2010) Energy for a sustainable future: summary report and recommendations. The UN Secretary-General’s Advisory Group on Energy and Climate Change (AGECC), New York
Barro RJ, Lee JW (2010) A New Data Set of Educational Attainment in the World, 1950–2010. NBERWorking Paper No. 15902. http://www.nber.org/people/robert_barro
Bauer N, Mouratiadou I, Luderer G, Baumstark L, Brecha R, Edenhofer O, Kriegler E (this issue). Globalfossil energy markets and climate change mitigation - an analysis with ReMIND. Climatic Change
Bazilian M et al (2012) Energy access scenarios to 2030 for the power sector in Sub-Saharan Africa. UtilPolicy 20:1–16
Climatic Change

Blanford GJ, Richels RG, Rutherford TF (2009) Feasible climate targets: the roles of economic growth,coalition development and expectations. Energy Econ 31:S82–S93
Blanford G, Tavoni M, Rose S (2012) Baseline projections of energy and emissions in Asia. Energy Econ34:S284–S292
Böhringer C, Löschel A, Moslener U, Rutherford TF (2009) EU climate policy up to 2020: an economicimpact assessment. Energy Econ 31(2):295–305
Buskirk R (2006) Analysis of long-range clean energy investment scenarios for Eritrea, East Africa. EnergyPolicy 34:1807–1817
Cabraal AR, Barnes DF, Agarwal SG (2005) Productive uses of energy for rural development. Annu RevEnviron Resour 30:117–144
Calvin K et al (2012) The role of Asia in mitigating climate change: results from the Asia modeling exercise.Energy Econ 34(suppl 3):S251–S260
Calvin K, Wise M, Luckow P, Kyle P, Clarke L, Edmonds J (this issue) Implications of uncertain future energyresources on bioenergy use and terrestrial carbon emissions. Climatic Change
Chakravarty S, Tavoni M (2013) Energy poverty alleviation and climate change mitigation: is there a tradeoff?Nota di Lavoro
Cilliers JBH, Moyer J (2011) African futures 2050. The next forty years. http://www.ifs.du.edu/assets/documents/Africa%20Futures%202050%20ISS%20Pardee%20IFs.pdf
Clarke L et al (2007) Scenarios of greenhouse gas emissions and atmospheric concentrations. In: U.S. ClimateChange Science Program and the Subcommittee on Global Change Research (ed) Synthesis and assess-ment product 2.1 Sub-report 2.1A. Department of Energy, Washington, DC, p 154
Clarke L, Edmonds J, Krey V, Richels R, Rose S, Tavoni M (2009) International climate policy architectures:Overview of the EMF 22 International Scenarios. Energy Econ 31:S64–S81
De Cian E, Sferra F, Tavoni M (this issue) The influence of economic growth, population, and fossil fuelscarcity on energy investments. Climatic Change
Desai M,Mehta S, Smith K (2004) Indoor smoke from solid fuels: assessing the environmental burden of disease atnational and local levels. Environmental burden of disease series No. 4. World Health Organization, Geneva
Eberhard A, Rosnes O, Shkaratan M, Vennemo H (2011) Africa’s power infrastructure: investment, integra-tion, efficiency. In: Foster V, Briceño-Garmendia C (eds). World Bank, Washington DC
EIA (2013a) International energy outlook 2013. U.S. Energy Information Administration. DOE/EIA-0484(2013)EIA (2013b) International energy statistics. U.S. Energy Information Administration. http://www.eia.gov/
countries/data.cfmEkholm T, Krey V, Pachauri S, Riahi K (2010) Determinants of household energy consumption in India.
Energy Policy 38:5696–5707Erickson P, Heaps C, Lazarus M (2009) Greenhouse gas mitigation in developing countries. Stockholm
Environment InstituteFawcett A, Delachesnaye P, Reilly J, Weyant J (2009) Overview of EMF 22 U.S. Transition scenarios. Energy
Econ 31:S198–S221Goldemberg J, Johansson TB, Reddy A, Williams RH (1985) Basic needs and much more with one kilowatt
per capita. Ambio 14:190–200Hawksworth J (2006) The World in 2050. How big will the major emerging market economies get and how
can the OECD compete? PricewaterhouseCoopers Report.IEA (2010) World energy outlook 2010. International Energy Agency, ParisIEA (2012) World energy outlook 2012. International Energy Agency, ParisJiang K, Hu X, Songli Z (2006) Multi-Gas mitigation analysis by IPAC. Energy J Spec Issue 3:425–440Kaya Y (1990) Impact of carbon dioxide emission control on GNP growth: interpretation of proposed scenarios.
Paper presented to the IPCC Energy and Industry subgroups, Responses Strategies Working Group, ParisKriegler E, Mouratiadou I, Brecha R, Calvin K, De Cian E, Edmonds J, Jiang K, Luderer G, Tavoni M,
Edenhofer O (this issue) Will economic growth and fossil fuel scarcity help or hinder climate stabiliza-tion? Overview of the RoSE multi-model study. Climatic Change
Luderer G, Leimbach M, Bauer N, Kriegler E, Aboumahboub T, Arroyo Curras T, Baumstark L, Bertram C,Giannousakis A, Hilaire J, Klein D, Mouratiadou I, Pietzcker R, Piontek F, Roming N,Schultes A, SchwanitzJ, Strefler J (2013). Description of the REMIND model (Version 1.5) (August 19, 2013). Available at SSRN:http://ssrn.com/abstract=2312844 or doi:10.2139/ssrn.2312844
MIT (2012) http://globalchange.mit.edu/research/publications/other/special/2012OutlookModi Vet al (2005) Energy services for the millennium development goals. Energy Sector Management Assistance
Programme (ESMAP), United Nations Development Programme (UNDP), Washington D.C, p 102Newell RG, Iler S (2013) The global energy outlook, NBER Working Paper No. 18967Nilsson M, Heaps C, Persson Å, Carson M, Pachauri S, Kok M, Olsson M, Rehman I, Schaeffer R, Wood D,
van Vuuren D, Riahi K, Americano B, Mulugetta Y (2012) Energy for a shared development agenda:global scenarios and governance implications. Stockholm Environment Institute, Stockholm
Climatic Change

Pachauri S, Jiang L (2008) The household energy transition in India and China. Energy Policy 36:4022–4035Pachauri S et al. (2012) Chapter 19 - Energy access for development. Global energy assessment - toward a
sustainable future. Cambridge University Press, Cambridge, UK and New York, NY, USA and theInternational Institute for Applied Systems Analysis, Laxenburg, Austria, pp. 1401–1458
Pachauri S, van Ruijven BJ, Nagai Y, Riahi K, van Vuuren DP, Brew-Hammond A, Nakicenovic N (2013)Pathways to achieve universal household access to modern energy by 2030. Environ Rese Lett 8
Riahi K et al. (2012) Chapter 17 - Energy pathways for sustainable development. Global Energy assessment -toward a sustainable future. Cambridge University Press, Cambridge, UK and New York, NY, USA andthe International Institute for Applied Systems Analysis, Laxenburg, Austria, pp. 1203–1306
Smil V (2003) Energy at the crossroads: global perspectives and uncertainties. The MIT Press, CambridgeSteinberger JK, Roberts JT (2010) From constraint to sufficiency: the decoupling of energy and carbon from
human needs, 1975–2005. Ecol Econ 70:425–433Nakicenovic and Swart (2000) IPCC special report on emissions scenarios. Cambridge Univ. PressUN (2009) World population prospects: the 2008 revision, long-range projections supplement. United
Nations, Department of Economic and Social Affairs, Population DivisionVictor NM, Victor DG (2002) Macro patterns in the Use of traditional biomass fuels. Program on energy and
sustainable development. Stanford University, Stanford, p 31WB (2013) Overview. Vol. 2 of Global tracking framework.World Bank. Sustainable energy for all, Washington DCWinkler H, Hughes A, Marquard A, HawM, Merven B (2011) South Africa’s greenhouse gas emissions under
business-as-usual: the technical basis of ‘Growth without constraints’ in the long-term mitigationscenarios. Energy Policy 39:5818–5828
Climatic Change