the economics software.pdf
TRANSCRIPT
Praise for The Economics of Software Quality
“This book provides the best treatment on the subject of economics of software quality that I’ve seen. Peppered with valuable industry data, in-depth analysis, empirical methods for quality improvement, and economic analysis of quality, this book is a must-read for anyone who is interested in this subject. With the many real-life and up-to-date examples and stories linking software quality to daily-life activities, readers will find this book an enjoyable read.”
—Stephen H. Kan, Senior Technical Staff Member and Program Manager, Software Quality—IBM Systems and
Technology Group, and author of Metrics and Models in Software Quality Engineering
“Finally, a book that defines the cost and economics of software quality and their relationship to business value. Facts such as the inability of testing alone to produce quality software, the value of engineering-in quality, and the posi-tive ROI are illustrated in compelling ways. Additionally, this book is a must-read for understanding, managing, and eliminating ‘technical debt’ from software systems.”
—Dan Galorath, CEO, Galorath Incorporated & SEER by Galorath
“Congrats to Capers and Olivier as they release their relevant, extensive, and timely research on the costs of defects in today’s software industry. The authors don’t stop with the causes of defects; they explore injection points, removal, and prevention approaches to avoid the ‘technical mortgage’ associated with defective software products. In today’s ‘quick-to-market’ world, an emphasis on strengthening the engineering in software engineering is refreshing. If you’re a software developer, manager, student, or user, this book will challenge your perspective on software quality. Many thanks!”
—Joe Schofield, Sandia National Laboratories; Vice President, IFPUG; CQA, CFPS, CSMS,
LSS BB, SEI-certified instructor
“Whether consulting, working on projects, or teaching, whenever I need credible, detailed, relevant metrics and insights into the current capabilities and performance of the software engineering profession, I always turn to Capers Jones’s work first. In this important new book, he and Olivier Bonsignour make
the hard-headed, bottom-line, economic case, with facts and data, about why software quality is so important. I know I’ll turn to this excellent reference again and again.”
—Rex Black, President, RBCS (www.rbcs-us.com), and author of seven books on software quality and testing, including
Managing the Testing Process, Third Edition
“This masterpiece of a book will empower those who invest in software—and the businesses and products that depend on it—to do so wisely. It is a ground-breaking work that rigorously applies principles of finance, economics, man-agement, quality, and productivity to scrutinize holistically the value propositions and myths underlying the vast sums invested in software. A must-read if you want to get your money’s worth from your software investments.”
—Leon A. Kappelman, Professor of Information Systems, College of Business, University of North Texas
“Capers Jones is the foremost leader in the software industry today for soft-ware metrics. The Economics of Software Quality is a comprehensive, data-rich study of challenges of quality software across the many application domains. It is an essential read for software quality professionals who wish to better under-stand the challenges they face and the cost and effectiveness of potential solu-tions. It is clear that much research and thought has been put into this.”
—Maysa-Maria Peterson Lach, Senior Principal Software Engineer, Raytheon Missile Systems
“In no other walk of life do we resist the necessity and validity of precise, rigor-ous measurement, as software practitioners have so vigorously resisted for more than fifty years. Capers Jones took up the challenge of bringing sanity and pre-dictability to software production more than three decades ago, and now with Olivier Bonsignour, he brings forth his latest invaluable expression of confi-dence in applying standard engineering and economic discipline to what too often remains the ‘Wild, Wild West’ of software development.”
—Douglas Brindley, President & CEO, Software Productivity Research, LLC

The Economics of Software Quality

This page intentionally left blank

The Economics of Software Quality
Capers JonesOlivier Bonsignour
Upper Saddle River, NJ • Boston • Indianapolis • San Francisco New York • Toronto • Montreal • London • Munich • Paris • Madrid Capetown • Sydney • Tokyo • Singapore • Mexico City
Many of the designations used by manufacturers and sellers to distinguish their products are claimed as trademarks. Where those designations appear in this book, and the publisher was aware of a trademark claim, the designations have been printed with initial capital letters or in all capitals.
The authors and publisher have taken care in the preparation of this book, but make no expressed or implied warranty of any kind and assume no responsibility for errors or omissions. No liability is assumed for incidental or consequential damages in connection with or arising out of the use of the information or programs contained herein.
The publisher offers excellent discounts on this book when ordered in quantity for bulk purchases or special sales, which may include electronic versions and/or custom covers and content particular to your business, training goals, marketing focus, and branding interests. For more information, please contact:
U.S. Corporate and Government Sales(800) [email protected]
For sales outside the United States, please contact:
International [email protected]
Visit us on the Web: informit.com/aw
Library of Congress Cataloging-in-Publication Data
Jones, Capers. The economics of software quality / Capers Jones, Olivier Bonsignour p. cm. ISBN 978-0-13-258220-9 (hardcover: alk. Paper) 1. Computer software—Quality control— Economic aspects. 2. Software maintenance—Economic aspects. 3. Computer software— Validation. 4. Computer software—verification. I. Subramanyam, Jitendra. II. Title. QA76.76.Q35J674 2012 005.1’4—dc23
20110145858
Copyright © 2012 Pearson Education, Inc.
All rights reserved. Printed in the United States of America. This publication is protected by copyright, and permission must be obtained from the publisher prior to any prohibited reproduction, storage in a retrieval system, or transmission in any form or by any means, electronic, mechanical, photocopying, recording, or likewise. For information regarding permissions, write to:
Pearson Education, Inc.Rights and Contracts Department501 Boylston Street, Suite 900Boston, MA 02116Fax: (617) 671-3447
ISBN-13: 978-0-13-258220-9ISBN-10: 0-13-258220-1
Text printed in the United States on recycled paper at Courier in Westford, Massachusetts.First printing, July 2011
PublisherPaul Boger
Acquisitions EditorBernard Goodwin
Managing EditorJohn Fuller
Full-Service Production ManagerJulie B. Nahil
Copy EditorChristal White
IndexerInfodex Indexing Services
ProofreaderChristine Clark
Editorial AssistantMichelle Housley
Cover DesignerNicolas Herlem
CompositorLaurelTech

This book is dedicated to Watts Humphrey and Allan Albrecht. Watts was a tireless champion of software quality.
Allan developed the most effective metric for studying software quality economics.

This page intentionally left blank
ix
Contents
Foreword � � � � � � � � � � � � � � � � � � � � � � � � � � � � � � � � � � � � � � � � � � � � � � � � � � � � � xix
Preface � � � � � � � � � � � � � � � � � � � � � � � � � � � � � � � � � � � � � � � � � � � � � � � � � � � � � � � xxi
Acknowledgments � � � � � � � � � � � � � � � � � � � � � � � � � � � � � � � � � � � � � � � � � � xxvii
About the Authors � � � � � � � � � � � � � � � � � � � � � � � � � � � � � � � � � � � � � � � � � � � xxxi
Chapter 1: Defining Software Quality and Economic Value � � � � � � � � � � � � � 1
Introduction . . . . . . . . . . . . . . . . . . . . . . . . . . . . . . . . . . . . . . . . . . . 1Why Is Software Quality Important? . . . . . . . . . . . . . . . . . . . 1
Defining Software Quality . . . . . . . . . . . . . . . . . . . . . . . . . . . . . . . . 8Defining Economic Value and
Defining the Value of Software Quality . . . . . . . . . . . . . . . . . . . 17The Economic Value of Software and Quality
to Enterprises that Build Internal Software for Their Own Use . . . . . . . . . . . . . . . . . . . . . . . . . . . . . . 19
The Economic Value of Software and Quality to Internal Software Users . . . . . . . . . . . . . . . . . . 22
The Economic Value of Software and Quality to Commercial Software Vendors . . . . . . . . . . . . 24
The Economic Value of Software and Quality to COTS Users and Customers . . . . . . . . . . . . . . 26
The Economic Value of Software and Quality to Embedded Software Companies . . . . . . . . . . . 28
The Economic Value of Software and Quality to Embedded Equipment Users . . . . . . . . . . . . . . 30
The Economic Value of Software and Software Quality to Other Business Sectors . . . . . . . . . . . . . . . . . . 32
Multiple Roles Occurring Simultaneously . . . . . . . . . . . . . . 33Summary and Conclusions . . . . . . . . . . . . . . . . . . . . . . . . . . . . . . . 33
Chapter 2: Estimating and Measuring Software Quality � � � � � � � � � � � � � � � 35
Introduction . . . . . . . . . . . . . . . . . . . . . . . . . . . . . . . . . . . . . . . . . . 35Using Function Point Metrics for Defect Potentials . . . . . . . . . . . . 39Software Defect Potentials . . . . . . . . . . . . . . . . . . . . . . . . . . . . . . . 39
x Contents
The Special Case of Software Requirements . . . . . . . . . . . . . 45The Origins of Software Requirements . . . . . . . . . . . . . . . . 50The Size, Structure, and Completeness of
Software Requirements . . . . . . . . . . . . . . . . . . . . . . . . . . . 52Minimizing Software Requirements Defects . . . . . . . . . . . . . 55Conclusions about Software Requirements Defects . . . . . . . 64The Special Case of Coding Defects . . . . . . . . . . . . . . . . . . . 65
Estimating Software Defect Prevention . . . . . . . . . . . . . . . . . . . . . . 71Estimating Software Defect Detection
and Defect Removal . . . . . . . . . . . . . . . . . . . . . . . . . . . . . . . . . . 74Measuring Application Structural Quality . . . . . . . . . . . . . . . . . . . 77
Measuring Reliability . . . . . . . . . . . . . . . . . . . . . . . . . . . . . . 78Measuring Performance Efficiency . . . . . . . . . . . . . . . . . . . . 79Measuring Security . . . . . . . . . . . . . . . . . . . . . . . . . . . . . . . . 80Measuring Maintainability . . . . . . . . . . . . . . . . . . . . . . . . . . 81Measuring Size . . . . . . . . . . . . . . . . . . . . . . . . . . . . . . . . . . . 83Summary of Application Structural Quality
Measurement Attributes . . . . . . . . . . . . . . . . . . . . . . . . . . 83Examples of Structural Quality Assessments . . . . . . . . . . . . . . . . . . 88
Bypassing the Architecture . . . . . . . . . . . . . . . . . . . . . . . . . . 88Failure to Control Processing Volumes . . . . . . . . . . . . . . . . . 90Application Resource Imbalances . . . . . . . . . . . . . . . . . . . . . 91Security Weaknesses . . . . . . . . . . . . . . . . . . . . . . . . . . . . . . . 92Lack of Defensive Mechanisms . . . . . . . . . . . . . . . . . . . . . . 93Desiderata for Systems Evaluating
Structural Quality . . . . . . . . . . . . . . . . . . . . . . . . . . . . . . . 94Three Problems That Distort Software Economic Analysis . . . . . . . 95
Leakage from Software Historical Data . . . . . . . . . . . . . . . . 97Economic Problems with Lines of
Code (LOC) Metrics . . . . . . . . . . . . . . . . . . . . . . . . . . . . 105Economic Problems with Cost-per-Defect Metrics . . . . . . . 110Case A: Poor Quality . . . . . . . . . . . . . . . . . . . . . . . . . . . . . 111Case B: Good Quality . . . . . . . . . . . . . . . . . . . . . . . . . . . . 111Case C: Zero Defects . . . . . . . . . . . . . . . . . . . . . . . . . . . . . 114Useful Rules of Thumb for Predicting
Software Defect Potentials . . . . . . . . . . . . . . . . . . . . . . . 115Summary and Conclusions on Software
Quality Estimation and Measurement . . . . . . . . . . . . . . . . . . . . 117
xiContents
Chapter 3: Software Defect Prevention � � � � � � � � � � � � � � � � � � � � � � � � � � � 119
Introduction . . . . . . . . . . . . . . . . . . . . . . . . . . . . . . . . . . . . . . . . . 119The Early History of Defect Prevention
Studies in the 1970s at IBM . . . . . . . . . . . . . . . . . . . . . . 120Synergistic Combinations of Defect
Prevention Methods . . . . . . . . . . . . . . . . . . . . . . . . . . . . 125Defect Potentials and Defect Origins . . . . . . . . . . . . . . . . . 127Defect Prevention, Patterns, and Certified
Reusable Materials . . . . . . . . . . . . . . . . . . . . . . . . . . . . . 132Software Defect Prevention and Application Size . . . . . . . . 133
Analysis of Defect Prevention Results . . . . . . . . . . . . . . . . . . . . . . 135Agile Embedded Users . . . . . . . . . . . . . . . . . . . . . . . . . . . . 136Automated Quality Predictions . . . . . . . . . . . . . . . . . . . . . 136Benchmarks of Software Quality Data . . . . . . . . . . . . . . . . 137Capability Maturity Model Integrated (CMMI) . . . . . . . . 138Certification Programs . . . . . . . . . . . . . . . . . . . . . . . . . . . . 140Cost-per-Defect Measures . . . . . . . . . . . . . . . . . . . . . . . . . 142Cost of Quality (COQ) . . . . . . . . . . . . . . . . . . . . . . . . . . . 146Cyclomatic Complexity Measures (and Related
Complexity Measures) . . . . . . . . . . . . . . . . . . . . . . . . . . 149Defect Measurements and Defect Tracking . . . . . . . . . . . . 156Formal Inspections . . . . . . . . . . . . . . . . . . . . . . . . . . . . . . . 159Function Point Quality Measures . . . . . . . . . . . . . . . . . . . . 164ISO Quality Standards, IEEE Quality
Standards, and Other Industry Standards . . . . . . . . . . . . 171Quality Function Deployment (QFD) . . . . . . . . . . . . . . . . 174Risk Analysis . . . . . . . . . . . . . . . . . . . . . . . . . . . . . . . . . . . 177Six Sigma . . . . . . . . . . . . . . . . . . . . . . . . . . . . . . . . . . . . . . 184Static Analysis . . . . . . . . . . . . . . . . . . . . . . . . . . . . . . . . . . 185
Summary and Conclusions of Software Defect Prevention . . . . . . 188
Chapter 4: Pretest Defect Removal � � � � � � � � � � � � � � � � � � � � � � � � � � � � � � 191
Introduction . . . . . . . . . . . . . . . . . . . . . . . . . . . . . . . . . . . . . . . . . 191Small Project Pretest Defect Removal . . . . . . . . . . . . . . . . . . . . . . 196Large System Pretest Defect Removal . . . . . . . . . . . . . . . . . . . . . . 201Analysis of Pretest Defect Removal Activities . . . . . . . . . . . . . . . . 208
Personal Desk Checking . . . . . . . . . . . . . . . . . . . . . . . . . . . 208Informal Peer Reviews . . . . . . . . . . . . . . . . . . . . . . . . . . . . 209
xii Contents
Automated Text Checking for Documents . . . . . . . . . . . . . 211Proofs of Correctness . . . . . . . . . . . . . . . . . . . . . . . . . . . . . 220Scrum Sessions . . . . . . . . . . . . . . . . . . . . . . . . . . . . . . . . . . 222Poka Yoke . . . . . . . . . . . . . . . . . . . . . . . . . . . . . . . . . . . . . 224Kaizen . . . . . . . . . . . . . . . . . . . . . . . . . . . . . . . . . . . . . . . . 226Pair Programming . . . . . . . . . . . . . . . . . . . . . . . . . . . . . . . 231Client Reviews of Specifications . . . . . . . . . . . . . . . . . . . . . 235Independent Verification and Validation (IV&V) . . . . . . . . 237Software Quality Assurance (SQA) Reviews . . . . . . . . . . . 239Phase Reviews . . . . . . . . . . . . . . . . . . . . . . . . . . . . . . . . . . 246Inspections (Requirements, Architecture,
Design, Code, and Other Deliverables) . . . . . . . . . . . . . . 249User Documentation Editing and Proofreading . . . . . . . . . 265Automated Static Analysis of Source Code . . . . . . . . . . . . . 267
Summary and Conclusions about Pretest Defect Removal . . . . . . 277
Chapter 5: Software Testing � � � � � � � � � � � � � � � � � � � � � � � � � � � � � � � � � � � 279
Introduction . . . . . . . . . . . . . . . . . . . . . . . . . . . . . . . . . . . . . . . . . 279Black Box and White Box Testing . . . . . . . . . . . . . . . . . . . 291Functional and Nonfunctional Testing . . . . . . . . . . . . . . . . 293Automated and Manual Testing . . . . . . . . . . . . . . . . . . . . . 293Discussion of the General Forms of Software Testing . . . . 294Subroutine Testing . . . . . . . . . . . . . . . . . . . . . . . . . . . . . . . 294PSP/TSP Unit Testing . . . . . . . . . . . . . . . . . . . . . . . . . . . . . 295Extreme Programming (XP) Unit Testing . . . . . . . . . . . . . . 296Unit Testing . . . . . . . . . . . . . . . . . . . . . . . . . . . . . . . . . . . . 296New Function Testing . . . . . . . . . . . . . . . . . . . . . . . . . . . . 297Regression Testing . . . . . . . . . . . . . . . . . . . . . . . . . . . . . . . 299Integration Testing . . . . . . . . . . . . . . . . . . . . . . . . . . . . . . . 300System Testing . . . . . . . . . . . . . . . . . . . . . . . . . . . . . . . . . . 301The Specialized Forms of Software Testing . . . . . . . . . . . . 303Stress or Capacity Testing . . . . . . . . . . . . . . . . . . . . . . . . . 303Performance Testing . . . . . . . . . . . . . . . . . . . . . . . . . . . . . . 304Viral Protection Testing . . . . . . . . . . . . . . . . . . . . . . . . . . . 304Penetration Testing . . . . . . . . . . . . . . . . . . . . . . . . . . . . . . . 308Security Testing . . . . . . . . . . . . . . . . . . . . . . . . . . . . . . . . . 309Platform Testing . . . . . . . . . . . . . . . . . . . . . . . . . . . . . . . . . 310Supply Chain Testing . . . . . . . . . . . . . . . . . . . . . . . . . . . . . 311Clean Room Testing . . . . . . . . . . . . . . . . . . . . . . . . . . . . . . 311
xiiiContents
Litigation Testing . . . . . . . . . . . . . . . . . . . . . . . . . . . . . . . . 312Cloud Testing . . . . . . . . . . . . . . . . . . . . . . . . . . . . . . . . . . . 313Service Oriented Architecture (SOA) Testing . . . . . . . . . . . 313Independent Testing . . . . . . . . . . . . . . . . . . . . . . . . . . . . . . 314Nationalization Testing . . . . . . . . . . . . . . . . . . . . . . . . . . . 315Case Study Testing . . . . . . . . . . . . . . . . . . . . . . . . . . . . . . . 316The Forms of Testing Involving Users or Clients . . . . . . . . 316Agile Testing . . . . . . . . . . . . . . . . . . . . . . . . . . . . . . . . . . . 317Usability Testing . . . . . . . . . . . . . . . . . . . . . . . . . . . . . . . . 317Field Beta Testing . . . . . . . . . . . . . . . . . . . . . . . . . . . . . . . . 318Lab Testing . . . . . . . . . . . . . . . . . . . . . . . . . . . . . . . . . . . . 319Customer Acceptance Testing . . . . . . . . . . . . . . . . . . . . . . 320Test Planning . . . . . . . . . . . . . . . . . . . . . . . . . . . . . . . . . . . 320Test Case Design Methods . . . . . . . . . . . . . . . . . . . . . . . . . 321Errors or Bugs in Test Cases . . . . . . . . . . . . . . . . . . . . . . . 323Numbers of Testing Stages for Software Projects . . . . . . . . 324Testing Pattern Variations by Industry and
Type of Software . . . . . . . . . . . . . . . . . . . . . . . . . . . . . . 325Testing Pattern Variations by Size of Application. . . . . . . . 329Testing Stages Noted in Lawsuits Alleging
Poor Quality . . . . . . . . . . . . . . . . . . . . . . . . . . . . . . . . . . 331Using Function Points to Estimate Test Case Volumes . . . . 332Using Function Points to Estimate the Numbers of
Test Personnel . . . . . . . . . . . . . . . . . . . . . . . . . . . . . . . . 335Using Function Points to Estimate Testing
Effort and Costs . . . . . . . . . . . . . . . . . . . . . . . . . . . . . . . 337Testing by Developers or by Professional
Test Personnel . . . . . . . . . . . . . . . . . . . . . . . . . . . . . . . . 342Summary and Conclusions on Software Testing . . . . . . . . . . . . . . 344
Chapter 6: Post-Release Defect Removal � � � � � � � � � � � � � � � � � � � � � � � � � 347
Introduction . . . . . . . . . . . . . . . . . . . . . . . . . . . . . . . . . . . . . . . . . 347Post-Release Defect Severity Levels . . . . . . . . . . . . . . . . . . 349Severity Levels from a Structural
Quality Perspective . . . . . . . . . . . . . . . . . . . . . . . . . . . . . 351Maintainability of Software . . . . . . . . . . . . . . . . . . . . . . . . 358Defect Discovery Rates by Software
Application Users . . . . . . . . . . . . . . . . . . . . . . . . . . . . . . 362Invalid Defect Reports . . . . . . . . . . . . . . . . . . . . . . . . . . . . 363
xiv Contents
Abeyant Defects That Occur Under Unique Conditions . . . . . . . . . . . . . . . . . . . . . . . . . . . . . 365
Duplicate Defects Reported by Many Customers . . . . . . . . 366First-Year Defect Discovery Rates . . . . . . . . . . . . . . . . . . . 367Measuring Defect Detection Efficiency (DDE)
and Defect Removal Efficiency (DRE) . . . . . . . . . . . . . . 368Variations in Post-Release Defect Reports . . . . . . . . . . . . . 370Variations in Methods of Reporting
Software Defects . . . . . . . . . . . . . . . . . . . . . . . . . . . . . . . 374Who Repairs Defects after They Are Reported? . . . . . . . . . 378Case Study 1: Development Personnel Tasked with
Maintenance Defect Repairs . . . . . . . . . . . . . . . . . . . . . . 379Case Study 2: Maintenance Specialists Handle
Defect Repairs . . . . . . . . . . . . . . . . . . . . . . . . . . . . . . . . 380Comparing the Case Studies . . . . . . . . . . . . . . . . . . . . . . . . 381Litigation Due to Poor Quality . . . . . . . . . . . . . . . . . . . . . 381Cost Patterns of Post-Release Defect Repairs . . . . . . . . . . . 384Software Occupation Groups Involved with
Defect Repairs . . . . . . . . . . . . . . . . . . . . . . . . . . . . . . . . 385Examining the Independent Variables of
Post-Release Defect Repairs . . . . . . . . . . . . . . . . . . . . . . 392The Size of the Application in Function Points. . . . . . . . . . 393Error-Prone Modules in Software Applications . . . . . . . . . 404
User and Industry Costs from Post-Release Defects . . . . . . . . . . . 409Impact of Security Flaws on Corporations
and Government Agencies . . . . . . . . . . . . . . . . . . . . . . . 414Customer Logistics for Defect Reports and
Repair Installation . . . . . . . . . . . . . . . . . . . . . . . . . . . . . 416Case Study 1: A Small Application by a
Small Company . . . . . . . . . . . . . . . . . . . . . . . . . . . . . . . 417Case Study 2: A Large Application by a
Large Company . . . . . . . . . . . . . . . . . . . . . . . . . . . . . . . 420Measurement Issues in Maintenance and
Post-Release Defect Repairs . . . . . . . . . . . . . . . . . . . . . . 425Summary and Conclusions on Post-Release Defects . . . . . . . . . . . 431
Chapter 7: Analyzing the Economics of Software Quality � � � � � � � � � � � � � 433
Introduction . . . . . . . . . . . . . . . . . . . . . . . . . . . . . . . . . . . . . . . . . 433The Economic Value of Software . . . . . . . . . . . . . . . . . . . . . . . . . 435
xvContents
Methods of Measuring Value . . . . . . . . . . . . . . . . . . . . . . . 435Funding Approval and Application Size . . . . . . . . . . . . . . . 443The Impact of Software Construction Difficulties on
Software Quality . . . . . . . . . . . . . . . . . . . . . . . . . . . . . . 444Revenue Generation from Software . . . . . . . . . . . . . . . . . . 449Difference Between Software and Other Industries . . . . . . 453Cost Reduction from Software . . . . . . . . . . . . . . . . . . . . . . 454
Economic Impact of Low-Quality and High-Quality Software . . . . . . . . . . . . . . . . . . . . . . . . . . . . . . . 460
Software Development and Maintenance . . . . . . . . . . . . . . 461Software as a Marketed Commodity . . . . . . . . . . . . . . . . . 462Software as a Method of Human Effort Reduction . . . . . . 463Software and Innovative New Kinds of Products . . . . . . . . 463Technical Debt—A Measure of the Effect of
Software Quality on Software Costs . . . . . . . . . . . . . . . 465A Framework for Quantifying Business Value . . . . . . . . . . 470Moving Beyond Functional Quality . . . . . . . . . . . . . . . . . . 476The Impact of Software Structure on Quality . . . . . . . . . . 476The Impact of Staff Training on Quality . . . . . . . . . . . . . . 477The Impact of Professional Certification
on Quality . . . . . . . . . . . . . . . . . . . . . . . . . . . . . . . . . . . 478The Impact of Technology Investment on Quality . . . . . . . 479The Impact of Project Management on Quality . . . . . . . . . 480The Impact of Quality-Control Methodologies
and Tools on Quality . . . . . . . . . . . . . . . . . . . . . . . . . . . 481The Impact of High and Low Quality on
Software Schedules . . . . . . . . . . . . . . . . . . . . . . . . . . . . . 484The Impact of High and Low Quality on
Software Staffing . . . . . . . . . . . . . . . . . . . . . . . . . . . . . . 484The Impact of High and Low Quality on
Software Development Effort . . . . . . . . . . . . . . . . . . . . . 486The Impact of High and Low Quality on
Development Productivity Rates . . . . . . . . . . . . . . . . . . 486The Impact of High and Low Quality on
Software Development Costs . . . . . . . . . . . . . . . . . . . . . 487The Impact of High and Low Quality on Development
Cost per Function Point . . . . . . . . . . . . . . . . . . . . . . . . . 489The Impact of High and Low Quality on Project
Cancellation Rates . . . . . . . . . . . . . . . . . . . . . . . . . . . . . 490
xvi Contents
The Impact of High and Low Quality on the Timing of Cancelled Projects . . . . . . . . . . . . . . . . . . . . . 491
The Impact of High and Low Quality on Cancelled Project Effort . . . . . . . . . . . . . . . . . . . . . . . . . 492
The Impact of High and Low Quality on Effort Compared to Average Projects . . . . . . . . . . . . . . . 492
The Impact of High and Low Quality on Software Test Stages . . . . . . . . . . . . . . . . . . . . . . . . . . . . 494
The Impact of High and Low Quality on Testing as a Percent of Development . . . . . . . . . . . . . . . 496
The Impact of High and Low Quality on Test Cases per Function Point . . . . . . . . . . . . . . . . . . . . . . . . . . . . . 497
The Impact of High and Low Quality on Numbers of Test Cases Created . . . . . . . . . . . . . . . . . . . . . . . . . . . 498
The Impact of High and Low Quality on Test Coverage . . . . . . . . . . . . . . . . . . . . . . . . . . . . . . . . . 498
The Impact of Professional Testers on High and Low Quality . . . . . . . . . . . . . . . . . . . . . . . . . . 500
The Impact of High and Low Quality on Software Defect Potentials . . . . . . . . . . . . . . . . . . . . . . . . . . . . . . . 501
The Impact of High and Low Quality on Total Software Defects . . . . . . . . . . . . . . . . . . . . . . . . . . 503
The Impact of High and Low Quality on Defect Detection Efficiency (DDE) . . . . . . . . . . . . . . . . . . . 504The Impact of High Quality and Low Quality on Defect
Removal Efficiency (DRE) . . . . . . . . . . . . . . . . . . . . . . . 504The Impact of High and Low Quality on
Total Defect Removal . . . . . . . . . . . . . . . . . . . . . . . . . . . 505The Impact of High and Low Quality on Defects
Delivered to Customers . . . . . . . . . . . . . . . . . . . . . . . . . 507The Impact of High and Low Quality on Delivered
Defects per Function Point . . . . . . . . . . . . . . . . . . . . . . . 507Impact of High and Low Quality on Delivered
Defect Severity Levels . . . . . . . . . . . . . . . . . . . . . . . . . . . 508The Impact of High and Low Quality on Severe
Defects per Function Point . . . . . . . . . . . . . . . . . . . . . . . 509The Impact of High and Low Quality on
Software Reliability . . . . . . . . . . . . . . . . . . . . . . . . . . . . 510
xviiContents
The Impact of High and Low Quality on Maintenance and Support . . . . . . . . . . . . . . . . . . . . . . . 511
The Impact of High and Low Quality on Maintenance and Support Costs . . . . . . . . . . . . . . . . . . . 512
The Impact of High and Low Quality on Maintenance Defect Volumes . . . . . . . . . . . . . . . . . . . . . . . . . . . . . . . 513
The Impact of High and Low Quality on Software Enhancements . . . . . . . . . . . . . . . . . . . . . . . . . . . . . . . . 514
The Impact of High and Low Quality on Enhancement Costs . . . . . . . . . . . . . . . . . . . . . . . . . . . . 515
The Impact of High and Low Software Quality on Maintenance and Enhancement Staffing . . . . . . . . . . . . . 516
The Impact of High and Low Quality on Total Effort for Five Years . . . . . . . . . . . . . . . . . . . . . . . . . . . . . . . . . 517
The Impact of High and Low Quality on Total Cost of Ownership (TCO) . . . . . . . . . . . . . . . . . . . . . . . . . . . . . 520
The Impact of High and Low Quality on Cost of Quality (COQ) . . . . . . . . . . . . . . . . . . . . . . . . . 523
The Impact of High and Low Quality on TCO and COQ per Function Point . . . . . . . . . . . . . . . . 529
The Impact of High and Low Quality on the Useful Life of Applications . . . . . . . . . . . . . . . . . . . . 529
The Impact of High and Low Quality on Software Application Tangible Value . . . . . . . . . . . . . . . 535
The Impact of High and Low Quality on Return on Investment (ROI) . . . . . . . . . . . . . . . . . . . . . . 536
The Impact of High and Low Quality on the Costs of Cancelled Projects . . . . . . . . . . . . . . . . . 537
The Impact of High and Low Quality on Cancellation Cost Differentials . . . . . . . . . . . . . . . . . . . . 538
The Distribution of High-, Average-, and Low-Quality Software Projects . . . . . . . . . . . . . . . . . . . . 538
Summary and Conclusions on the Economics of Software Quality . . . . . . . . . . . . . . . . . . . . . . . . . . . . . . . . . . . . 541
High-Quality Results for 10,000 Function Points . . . . . . . 541Low-Quality Results for 10,000 Function Points . . . . . . . . 542
References and Readings � � � � � � � � � � � � � � � � � � � � � � � � � � � � � � � � � � � � � � 545
Index � � � � � � � � � � � � � � � � � � � � � � � � � � � � � � � � � � � � � � � � � � � � � � � � � � � � � 561

This page intentionally left blank
xix
Foreword
As a major telecommunications company, our business consists of a complex mix of products and services. Some are decades old, and some are only emerg-ing. In just one part of our business, customers now access sophisticated busi-ness processes via myriad mobile devices operating on multiple platforms, technologies, and standards. The mobile access revolution is only one example of the continual change we must master. In several of our new markets, some of our competitors were not even on the radar ten years ago.
The IT systems that service our customers have been built over decades of changing regulatory frameworks, intense competition, and M&A activity; these systems provide mission-critical network management, billing, and customer ser-vice infrastructure for our existing and emerging products. We simply don’t have the luxury of crafting Greenfield solutions in response to pressing business needs.
Despite the complex nature of IT, our shareholders expect nothing less than continuous improvement in service quality with simultaneous cost reduc-tions. This has been the case in our market for quite some time and a major operational focus for my organization. One area on which we have focused in addressing this challenge is measuring software development productivity and quality. As the CIO, I oversee the company’s internal information technology organization and infrastructure, as well as all evolving software applications. When you get down to it, the core expertise of our business is encoded in the software that automates our mission-critical processes. It is that software layer of our IT stack that fundamentally drives our time to market, our risk profile, and our cost structure.
We measure software productivity to allocate resources and make informed tradeoffs in our investments. We measure software quality at a structural level, in addition to the functional level through testing, to make the right trade-offs between delivery speed, business risk, and technical debt—the longer-term costs of maintaining and enhancing the delivered solutions.
For several years now, we have been successfully measuring the quality of our development projects and including these metrics in some of our Service Level Agreements. We are now starting to put productivity measurements across our portfolio side-by-side with quality measurements to get a truer pic-ture of where we are trading present delivery agility for future business agility.
xx Foreword
The Economics of Software Quality is a landmark for three reasons. It is practical, it is data-driven, and it goes beyond the traditional treatments of quality to demonstrate how to manage structural quality—an important ele-ment of software quality for our business. Just as we invest in our enterprise architecture to actively manage the evolution of our core application software, we are putting a strong focus on the analysis and measurement of these applica-tions at the structural level. These measures enable my organization to take a proactive stance to building a better future for our business and for me to closely manage the economic fundamentals in meeting and exceeding share-holder expectations.
As we look forward to an exciting period of rapid growth in fixed-line, mobile, data, and on-demand products and services, I can assure you that this is one book my management team and I will keep close at hand.
—Thaddeus ArroyoChief Information Officer, AT&T Services, Inc.
F� Thaddeus Arroyo, Chief Information Officer, is responsible for AT&T’s information technology. He was appointed to his current position in January 2007, following the close of the merger between AT&T, BellSouth, and Cingu-lar. In his role, he is responsible for directing the company’s internal informa-tion technology organization and infrastructure, including Internet and intranet capabilities, developing applications systems across the consumer and mobility markets, enterprise business segments, and AT&T’s corporate systems. He also oversees AT&T’s enterprise data centers.
xxi
Preface
This book is aimed at software managers, executives, and quality assurance personnel who are involved in planning, estimating, executing, and maintaining software. Managers and stakeholders need to understand the economics of soft-ware quality when planning and developing new applications and enhancing or maintaining existing ones.
The goal of this book is to quantify the factors that influence software qual-ity and provide readers with enough information for them to predict and meas-ure quality levels of their projects and applications.
To serve this goal, we consolidate an expansive body of software quality data—data on software structural quality, software assurance processes and techniques, and the marginal costs and benefits of improving software quality. The book provides quantitative data on how high and low quality affect soft-ware project schedules, staffing, development costs, and maintenance costs. This information should enable software managers to set and track progress toward quality targets and to make the right trade-offs between speed to mar-ket and business risk.
We quantify the positive economic value of software quality and the high costs of poor software quality using software quality data from large organizations in the private and public sectors. This is not a “how to do it” book—there are many good how-to books on processes and techniques for test-ing, inspections, static analysis, and other quality topics. We hope to have added a substantial amount of software quality data from real-world applications to complement those how-to books and enable IT managers to quantify the relative efficacy and economic value of these techniques.
In small projects, individual human skills and experience play a major role in successful outcomes. Quality is important, but individual skill tends to be the dominant driver of high quality.
But as projects grow larger, with development teams from 20 on up to more than 1,000 personnel, individual skills tend to regress to the mean. Quality becomes progressively more important because, historically, the costs of finding and fixing bugs have been the largest known expense for large software appli-cations. This is true of both new development as well as enhancement and maintenance.
Most discussions of software quality focus almost exclusively on functional quality. In this book, we expand our treatment beyond functional quality to
xxii Preface
cover nonfunctional and structural quality. Measuring structural quality requires going beyond the quality of individual components to the quality of the application as a whole. We show how to clearly define and repeatably meas-ure nonfunctional and structural quality.
Reliable measurements of all three kinds of quality—structural, nonfunc-tional, and functional—are essential for a complete treatment of the economics of software quality. We use these quality metrics to compare a number of qual-ity improvement techniques at each stage of the software development life cycle and quantify their efficacy using data from real-world applications.
To achieve high-quality levels for large systems, a synergistic set of methods is needed. These include defect prevention methods, which can reduce defect levels; pretest defect removal methods such as inspections and static analysis; and more than 40 kinds of testing.
Several newer kinds of development methods also have beneficial impacts on software quality compared to traditional “waterfall” development. These include Agile development, Crystal development, Extreme Programming (XP), Personal Software Process (PSP), the Rational Unified Process (RUP), the Team Software Process (TSP), and several others.
The generally poor measurement practices of the software industry have blurred understanding of software quality economics. Many executives and even some quality personnel tend to regard software quality as an expense. They also tend to regard quality as a topic that lengthens schedules and raises development costs.
However, from an analysis of about 13,000 software projects between 1973 and today, it is gratifying to observe that high quality levels are invariably associated with shorter-than-average development schedules and lower-than-average development costs.
The reason for this is that most projects that run late and exceed their budg-ets show no overt sign of distress until testing begins. When testing begins, a deluge of high-severity defects tends to stretch out testing intervals and cause massive bursts of overtime. In general, testing schedules for low-quality, large software projects are two to three times longer and more than twice as costly as testing for high-quality projects. If defects remain undetected and unremoved until testing starts, it is too late to bring a software project back under control. It is much more cost-effective to prevent defects or to remove them prior to testing.
Another poor measurement practice that has concealed the economic value of software quality is the usage of the cost-per-defect metric. It has become an urban legend that “it costs 100 times as much to fix a bug after delivery as dur-ing development.” Unfortunately, the cost-per-defect metric actually penalizes quality and achieves its lowest values for the buggiest software. As quality
xxiiiPreface
improves, cost per defect rises until a level of zero defects is reached, where the cost-per-defect metric cannot be used at all.
The real economic value of high quality is only partially related to defect repair costs. It is true that high quality leads to fewer defects and therefore to lower defect repair costs. But its major economic benefits are due to the fact that high quality
• Reduces the odds of large-system cancellations
• Reduces the odds of litigation for outsourced projects
• Shortens development schedules
• Lowers development costs
• Lowers maintenance costs
• Reduces warranty costs
• Increases customer satisfaction
This book contains seven chapters. The Introduction in Chapter 1 discusses the fact that software has become one of the most widely used products in human history. As this book is written, a majority of all business activities are driven by software. A majority of government operations are controlled by software, such as civilian taxes, military and defense systems, and both state and local government organizations. Because software is so pervasive, high and low quality levels affect every citizen in significant ways.
Chapter 1 defines software quality, considering the topic of quality is ambig-uous both for software itself and for other manufactured products. There are many diverse views of what “quality” actually means. Chapter 1 examines all of the common views and concludes that effective definitions for quality need to be predictable in advance and measurable when they occur. Because this book deals with quantification and economic topics, there is emphasis on qual-ity factors that can be measured precisely, such as defects and defect removal efficiency. In addition to these well-defined metrics, we show how to precisely measure software structural quality. Other definitions of quality, such as fitness, use, or aesthetic factors, are important but not always relevant to economic analysis.
Chapter 2 is about estimating and measuring software quality. It is impor-tant for executives, clients, stakeholders, venture capitalists, and others with a financial interest in software to understand how quality can be predicted before projects start and measured during development and after release. Because software quality involves requirements, architecture, design, and many
xxiv Preface
other noncode artifacts, the traditional lines of code metric is inadequate. This book uses function point metrics and structural quality metrics for quantifying quality. The function point metric is independent of code and therefore can deal with noncoding defects such as “toxic requirements.” Structural quality metrics get to the root causes of application quality and serve as foundational measures of software costs and business risks.
Chapters 3 deals with the important topic of defect prevention. The set of methods that reduce defect potentials and minimize errors are difficult to study because they cannot be studied in isolation, but need numerous cases where a specific method was used and similar cases where the method was not used. Examples of methods that have demonstrated success in terms of defect preven-tion include Six Sigma, quality function deployment (QFD), test-driven develop-ment (TDD), and formal inspections. The kaizen and poka yoke inspections from Japan are also defect prevention methods. Some of these, such as inspections, happen to be effective as both defect prevention and defect removal methods.
Chapter 4 deals with pretest defect removal methods in use today. The term “pretest” refers to quality and defect removal methods that occur prior to the start of testing. Among these methods are peer reviews, formal inspections, and static analysis. Although the literature on pretest defect removal is sparse com-pared to the literature on testing, these methods are important and have great value. Effective pretest methods such as inspections and static analysis shorten test schedules and raise testing efficiency. Twenty-five different kinds of pretest defect removal are discussed.
Chapter 5 deals with testing, which is the traditional quality control tech-nique for software projects. Although there is an extensive literature on testing, there is a surprising lack of quantified data on topics such as defect detection efficiency (DDE) and defect removal efficiency (DRE). If testing is performed without effective defect prevention methods and without pretest defect removal, most forms of testing are usually less than 35% efficient in finding bugs and quite expensive as well. A synergistic combination of defect prevention, pretest removal, and formal well-planned testing can raise test removal efficiency sub-stantially. The goal of effective quality control is to approach 99% in terms of cumulative defect removal efficiency. Forty kinds of testing stages are discussed in Chapter 5.
Chapter 6 deals with post-release defect removal, which is an unfortunate fact of life for software applications. Cumulative defect removal efficiency in the United States is only about 85%, so all software applications are delivered with latent defects. As a result, customers will always find bugs, and software organizations will always need customer support and maintenance personnel
xxvPreface
available to repair the bugs. However, state-of-the-art combinations of defect prevention, pretest removal, and testing can top 96% in terms of defect removal efficiency on average and even achieve 99% in a few cases.
Chapter 7 consolidates all of the authors’ data and shows side-by-side results for low-quality, average-quality, and high-quality software projects. Both the methods used to achieve high quality and the quantitative results of achieving high quality are discussed.
Using structural quality data from 295 applications from 75 organizations worldwide, we define and quantify the notion of technical debt—the cost of fix-ing problems in working software that, if left unfixed, will likely cause severe business disruption. We juxtapose this with a framework for quantifying the loss of business value due to poor quality. Together with technical debt, this business value framework provides a platform for future software economics research.

This page intentionally left blank
xxvii
Acknowledgments
By Capers JonesThere are two authors for this book, and we each want to acknowledge those who helped in its creation.
As always, thanks to my wife Eileen for her support of the many months of time spent in writing 16 books over a 25-year period.
While this book was in process, two friends and colleagues passed away. Special thanks should go to both Al Albrecht and Watts Humphrey.
Allan J. Albrecht was one of the original creators of function point metrics, without which this book would not be possible. Al and I first met in 1978 when he gave a talk on function points at the joint IBM/SHARE/GUIDE conference in Monterey, California. Although we both worked for IBM, Al was located in White Plains, New York, and I was located in San Jose, California, so we had not met until the conference.
Al’s talk and the function point metric made economic analysis of software feasible and provided insights that older metrics such as “lines of code” and “cost per defect” could not replicate.
Al Albrecht, IBM, and the conference management kindly gave permission to publish Al’s paper in my second book, Programming Productivity: Issues for the Eighties through the IEEE Press in 1979. From this point on, all of my technical books have used function points for quantitative information about software quality, productivity, and economic topics.
After Al retired from IBM, we both worked together for about five years in the area of expanding the usage of function point metrics. Al created the first certification exam for function points and taught the metric to many of our colleagues.
Al was an electrical engineer by training and envisioned function point metrics as providing a firm basis for both quality and productivity studies for all kinds of software applications. Today, in 2011, function points are the most widely used software metric and almost the only metric that has substantial volumes of benchmark information available.
About two weeks before Al Albrecht passed away, the software industry also lost Watts Humphrey. Watts, too, was a colleague at IBM. Watts was an inven-tor and a prolific writer of excellent books, as well as an excellent public speaker and often keynoted software conferences.
xxviii Acknowledgments
After retiring from IBM, Watts started a second career at the Software Engineering Institute (SEI) where he pioneered the development of the original version of the capability maturity model (CMM).
Watts was one of the first software researchers to recognize that quality is the driving force for effective software development methods. It would be pointless to improve productivity unless quality improved faster and further because otherwise higher productivity would only create more defects. At both IBM and the SEI, Watts supported many quality initiatives, such as formal inspections, formal testing, and complete defect measurements, from the start of software projects through their whole useful lives.
Watts also created both the Personal Software Process (PSP) and the Team Software Process (TSP), which are among the most effective methods for combining high quality and high performance.
Watts’s work in software process improvement was recognized by his receipt of the National Medal of Technology from President George Bush in 2005.
In recent years, Watts took part in a number of seminars and conferences, so we were able to meet face-to-face several times a year, usually in cities where software conferences were being held.
In this book, the importance of quality as being on the critical path to suc-cessful software development is an idea that Watts long championed. And the ability to measure quality, productivity, and other economic factors would not be possible without the function point metric developed by Al Albrecht.
Many other people contributed to this book, but the pioneering work of Al and Watts were the key factors that made the book possible.
By Olivier BonsignourFirst and foremost, I would like to thank Capers Jones. It has been a pleasure working with him on this book.
I owe a debt to my colleagues Lev Lesokhin and Bill Curtis at CAST. Lev and Bill were the first ones to suggest this project and have been exceptional sound-ing boards throughout. Their imprint on the ideas, organization, and content is so extensive that they should be considered coauthors of this book.
I’ve borrowed from the work of other colleagues at CAST. First of all, Jiten-dra Subramanyam, who has done a tremendous job helping me elaborate the content of this book. Also, my work with Bill Curtis and Vincent Delaroche—on the distinction between software structural quality at the application level, as opposed to quality at the component level—appears in Chapter 2. This attribute of software quality—that the whole is greater than the sum of its parts—is critical to the analysis and measurement of software quality. The defi-nition of software structural quality metrics in that chapter is based on work I did with Bill and with Vincent. The framework in Chapter 7 for calculating the
xxixAcknowledgments
business loss caused by poor structural quality is also based on Bill’s work. Jay Sappidi did the groundbreaking work of collecting and analyzing our first batch of structural quality data and crafting a definition of Technical Debt. Much of the structural quality analysis in Chapters 6 and 7 is based on Jay’s work.
The product engineering team at CAST—Razak Ellafi, Philippe-Emmanuel Douziech, and their fellow engineers—continue to create a magnificent product that admirably serves the needs of hundreds of organizations worldwide. The CAST Application Intelligence Platform is not only a piece of fine engineering, it is also the generator of all the structural quality data in this book.

This page intentionally left blank
xxxi
About the Authors
Capers Jones is currently the President and CEO of Capers Jones & Associates LLC. He is also the founder and former chairman of Software Produc-tivity Research LLC (SPR). He holds the title of Chief Scientist Emeritus at SPR. Capers Jones founded SPR in 1984.
Before founding SPR, Capers was Assistant Director of Programming Technology for the ITT Corporation at the Programming Technology Center in Stratford, Connecticut. He was also a
manager and researcher at IBM in California.Capers is a well-known author and international public speaker. Some of his
books have been translated into six languages. All of his books have been trans-lated into Japanese, and his newest books are available in Chinese editions as well.
Among his book titles are Patterns of Software Systems Failure and Success (Prentice Hall 1994), Applied Software Measurement, Third Edition (McGraw-Hill, 2008), Software Quality: Analysis and Guidelines for Success ( International Thomson, 1997), Estimating Software Costs, Second Edition (McGraw-Hill, 2007), and Software Assessments, Benchmarks, and Best Practices (Addison-Wesley, 2000). The third edition of his book Applied Software Measurement was published in the spring of 2008. His book entitled Software Engineering Best Practices was published by McGraw-Hill in October 2009. His current book is The Economics of Software Quality, with Olivier Bonsignour as coauthor.
Capers and his colleagues have collected historical data from more than 600 corporations and more than 30 government organizations. This historical data is a key resource for judging the effectiveness of software process improvement methods. More than 13,000 projects have been reviewed.
In addition to his technical books, Mr. Jones has also received recognition as an historian after the publication of The History and Future of Narragansett Bay in 2006 by Universal Publishers.
His research studies include quality estimation, quality measurement, software cost and schedule estimation, software metrics, and risk analysis.
xxxii About the Authors
Mr. Jones has consulted at more than 150 large corporations and also at a number of government organizations such as NASA, the U.S. Air Force, the U.S. Navy, the Internal Revenue Service, and the U.S. Courts. He has also worked with several state governments.
Olivier Bonsignour is responsible for Research & Development and Product Management in a continual effort to build the world’s most advanced Application Intelligence technology.
Prior to joining CAST, Mr. Bonsignour was the CIO for DGA, the advanced research division of the French Ministry of Defense. Prior to that role, also at DGA, he was in charge of application develop-ment and a project director working on IT systems that support operations. A pioneer in the develop-ment of distributed systems and object oriented
development, he joined CAST after having been an early adopter of CAST tech-nology in 1996.
Mr. Bonsignour holds a graduate degree in engineering and computer science from the National Institute of Applied Sciences (INSA), Lyon, and a master’s degree in management from the executive program at IAE Aix-en-Provence. In his free time, Mr. Bonsignour enjoys swimming, cycling, and skiing, as well as sailing his boat off the coast of France.
Chapter 1
Defining Software Quality and Economic Value
Introduction
This book deals with two topics that have been ambiguous and difficult to pin down for many years: software quality and economic value.
The reason for the ambiguity, as noted in the Preface, is that there are many different points of view, and each point of view has a different interpretation of the terms. For example, software quality does not mean the same thing to a customer as it does to a developer. Economic value has a different meaning to vendors than it has to consumers. For vendors, revenue is the key element of value, and for consumers, operational factors represent primary value. Both of these are discussed later in the book.
By examining a wide spectrum of views and extracting the essential points from each view, the authors hope that workable definitions can be established that are comparatively unambiguous.
Software quality, as covered in this book, goes well beyond functional quality (the sort of thing to which customers might react to in addition to usability and reliable performance). Quality certainly covers these aspects but extends further to nonfunctional quality (how well the software does what it is meant to do) and to structural quality (how well it can continue to serve business needs as they evolve and change as business conditions do).
Why Is Software Quality Important?
Computer usage in industrial countries starts at or before age 6, and by age 16 almost 60% of young people in the United States have at least a working
1
Chapter 1 Defining Software Quality and Economic Value2
knowledge of computers and software. Several skilled hackers have been apprehended who were only 16 years of age.
The approximate population of the United States in 2010 was about 309,800,135 based on Census Bureau estimates. Out of the total population about 30% use computers daily either for business purposes or for recreational purposes or both; that is, about 92,940,040 Americans are daily computer users.
About 65% of the U.S. population use embedded software in the form of smart phones, digital cameras, digital watches, automobile brakes and engine controls, home appliances, and entertainment devices. Many people are not aware that embedded software controls such devices, but it does. In other words, about 201,370,087 U.S. citizens own and use devices that contain embedded software.
Almost 100% of the U.S. population has personal data stored in various online databases maintained by the Census Bureau, the Internal Revenue Service, state governments, municipal governments, banks, insurance companies, credit card companies, and credit scoring companies.
Moving on to business, data from various sources such as Forbes, Manta, Business Week, the Department of Commerce Bureau of Labor Statistics, and others reports that the United States has about 22,553,779 companies (as of the end of 2010). Of these companies about 65% use computers and software for business operations, retail sales, accounting, and other purposes—so about 14,659,956 U.S. companies use computers and software. (Corporate software usage ranges from a basic spreadsheet up to entire enterprise resource planning [ERP] packages plus hundreds of other applications.)
Based on data from the Manta website, the software deployed in the United States is provided by about 77,186 software companies and another 10,000 U.S. companies that create devices with embedded software. A great deal of embedded software and the device companies themselves have moved to China, Taiwan, Japan, India, and other offshore countries. An exception to offshore migration is the manufacture of embedded software for military equipment and weapons systems, which tends to stay in the United States for security reasons.
The U.S. military services and the Department of Defense (DoD) own and deploy more software than any other organizations in history. In fact, the DoD probably owns and deploys more software than the military organizations of all other countries combined. Our entire defense community is now dependent on software for command and control, logistics support, and the actual operation of weapons systems. Our national defense systems are highly computerized, so software quality is a critical component of the U.S. defense strategy.
Introduction 3
Without even knowing it, we are awash in a sea of software that operates most of our manufacturing equipment, keeps records on virtually all citizens, and operates the majority of our automobiles, home appliances, and entertainment devices. Our transportation systems, medical systems, and government operations all depend on computers and software and hence also depend on high software quality levels.
While software is among the most widely used products in human history, it also has one of the highest failure rates of any product in human history due primarily to poor quality.
Based on observations among the authors’ clients plus observations during expert witness assignments, the cancellation rate for applications in the 10,000 function point size range is about 31%. The average cost for these cancelled projects is about $35,000,000. By contrast, projects in the 10,000 function point size range that are successfully completed and have high quality levels only cost about $20,000,000.
When projects developed by outsource vendors are cancelled and clients sue for breach of contract, the average cost of litigation is about $5,000,000 for the plaintiff and $7,000,000 for the defendant. If the defendants lose, then awards for damages can top $25,000,000. However because most U.S. courts bar suits for consequential damages, the actual losses by the defendants can be much larger.
Of the authors’ clients who are involved with outsourcing, about 5% of agreements tend to end up in court for breach of contract. The claims by the plaintiffs include outright failure, delivery of inoperable software, or delivery of software with such high defect volumes that usage is harmful rather than useful.
As of 2011, the average cost per function point in the United States is about $1,000 to build software applications and another $1,000 to maintain and support them for five years: $2,000 per function point in total. For projects that use effective combinations of defect prevention and defect removal activities and achieve high quality levels, average development costs are only about $700 per function point and maintenance, and support costs drop to about $500 per function point: $1,200 per function point in total.
Expressed another way, the software engineering population of the United States is currently around 2,400,000 when software engineers and related occupations such as systems analysis are considered. On any given day, due to poor quality control, about 1,000,000 of these workers spend the day finding and fixing bugs (and, unwittingly, injecting new bugs as part of the process).
Chapter 1 Defining Software Quality and Economic Value4
So all of these statistics point to the fact that better software quality control in the forms of defect prevention and more effective defect removal could free up about 720,000 software personnel for more productive work than just bug repairs, easily reducing U.S. software development and maintenance costs by about 50%.
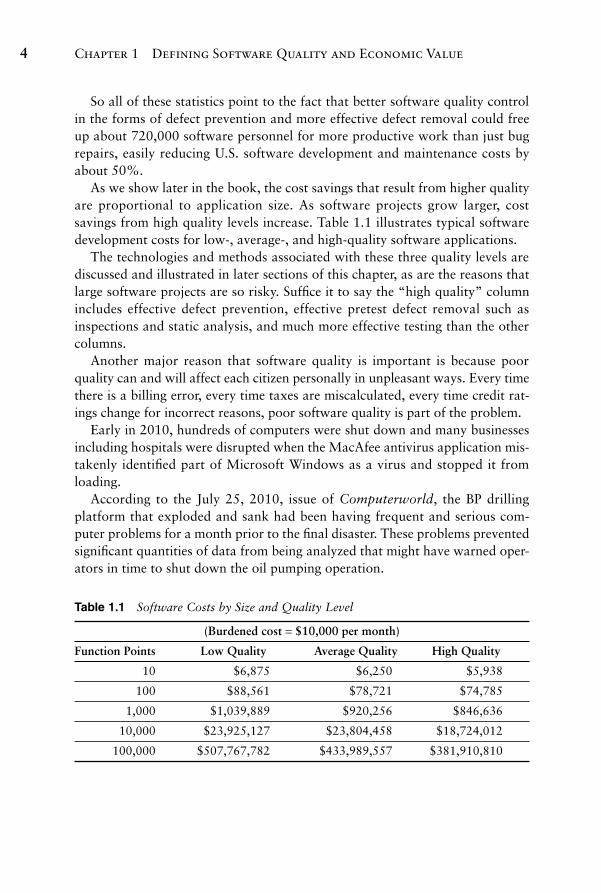
As we show later in the book, the cost savings that result from higher quality are proportional to application size. As software projects grow larger, cost savings from high quality levels increase. Table 1.1 illustrates typical software development costs for low, average, and highquality software applications.
The technologies and methods associated with these three quality levels are discussed and illustrated in later sections of this chapter, as are the reasons that large software projects are so risky. Suffice it to say the “high quality” column includes effective defect prevention, effective pretest defect removal such as inspections and static analysis, and much more effective testing than the other columns.
Another major reason that software quality is important is because poor quality can and will affect each citizen personally in unpleasant ways. Every time there is a billing error, every time taxes are miscalculated, every time credit ratings change for incorrect reasons, poor software quality is part of the problem.
Early in 2010, hundreds of computers were shut down and many businesses including hospitals were disrupted when the MacAfee antivirus application mistakenly identified part of Microsoft Windows as a virus and stopped it from loading.
According to the July 25, 2010, issue of Computerworld, the BP drilling platform that exploded and sank had been having frequent and serious computer problems for a month prior to the final disaster. These problems prevented significant quantities of data from being analyzed that might have warned operators in time to shut down the oil pumping operation.
Table 1.1 Software Costs by Size and Quality Level
(Burdened cost = $10,000 per month)
Function Points Low Quality Average Quality High Quality
10 $6,875 $6,250 $5,938
100 $88,561 $78,721 $74,785
1,000 $1,039,889 $920,256 $846,636
10,000 $23,925,127 $23,804,458 $18,724,012
100,000 $507,767,782 $433,989,557 $381,910,810
Introduction 5
If your automobile braking system does not operate correctly, if a home appliance fails unexpectedly, or if a hospital makes a medical mistake, there is a good chance that poor software quality was part of the problem.
If an airline flight is delayed more than about two hours or if there is a widespread power outage that affects an entire geographic region such as New England, the odds, again, are good that poor software quality was part of the problem.
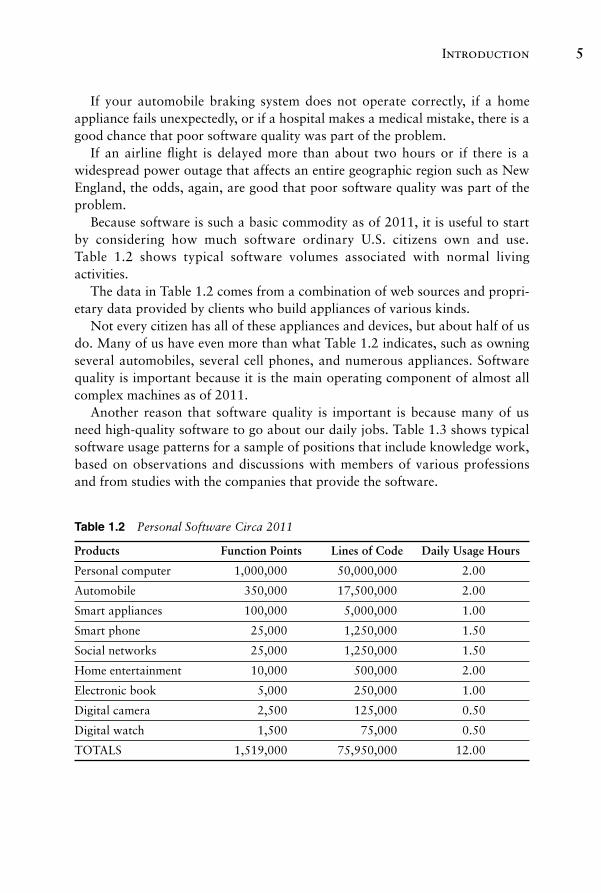
Because software is such a basic commodity as of 2011, it is useful to start by considering how much software ordinary U.S. citizens own and use. Table 1.2 shows typical software volumes associated with normal living activities.
The data in Table 1.2 comes from a combination of web sources and proprietary data provided by clients who build appliances of various kinds.
Not every citizen has all of these appliances and devices, but about half of us do. Many of us have even more than what Table 1.2 indicates, such as owning several automobiles, several cell phones, and numerous appliances. Software quality is important because it is the main operating component of almost all complex machines as of 2011.
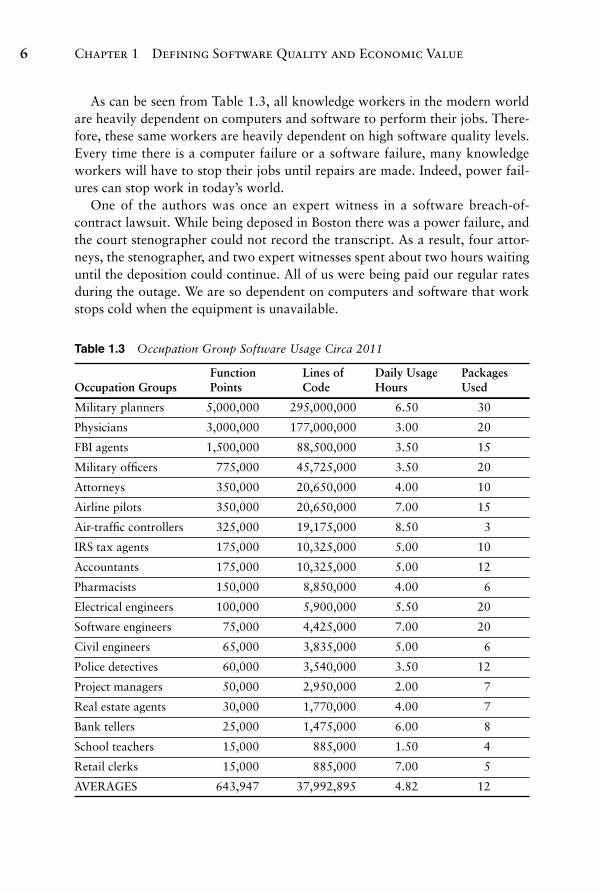
Another reason that software quality is important is because many of us need highquality software to go about our daily jobs. Table 1.3 shows typical software usage patterns for a sample of positions that include knowledge work, based on observations and discussions with members of various professions and from studies with the companies that provide the software.
Table 1.2 Personal Software Circa 2011
Products Function Points Lines of Code Daily Usage Hours
Personal computer 1,000,000 50,000,000 2.00
Automobile 350,000 17,500,000 2.00
Smart appliances 100,000 5,000,000 1.00
Smart phone 25,000 1,250,000 1.50
Social networks 25,000 1,250,000 1.50
Home entertainment 10,000 500,000 2.00
Electronic book 5,000 250,000 1.00
Digital camera 2,500 125,000 0.50
Digital watch 1,500 75,000 0.50
TOTALS 1,519,000 75,950,000 12.00
Chapter 1 Defining Software Quality and Economic Value6
As can be seen from Table 1.3, all knowledge workers in the modern world are heavily dependent on computers and software to perform their jobs. Therefore, these same workers are heavily dependent on high software quality levels. Every time there is a computer failure or a software failure, many knowledge workers will have to stop their jobs until repairs are made. Indeed, power failures can stop work in today’s world.
One of the authors was once an expert witness in a software breachof contract lawsuit. While being deposed in Boston there was a power failure, and the court stenographer could not record the transcript. As a result, four attorneys, the stenographer, and two expert witnesses spent about two hours waiting until the deposition could continue. All of us were being paid our regular rates during the outage. We are so dependent on computers and software that work stops cold when the equipment is unavailable.
Table 1.3 Occupation Group Software Usage Circa 2011
Function Lines of Daily Usage Packages Occupation Groups Points Code Hours Used
Military planners 5,000,000 295,000,000 6.50 30
Physicians 3,000,000 177,000,000 3.00 20
FBI agents 1,500,000 88,500,000 3.50 15
Military officers 775,000 45,725,000 3.50 20
Attorneys 350,000 20,650,000 4.00 10
Airline pilots 350,000 20,650,000 7.00 15
Airtraffic controllers 325,000 19,175,000 8.50 3
IRS tax agents 175,000 10,325,000 5.00 10
Accountants 175,000 10,325,000 5.00 12
Pharmacists 150,000 8,850,000 4.00 6
Electrical engineers 100,000 5,900,000 5.50 20
Software engineers 75,000 4,425,000 7.00 20
Civil engineers 65,000 3,835,000 5.00 6
Police detectives 60,000 3,540,000 3.50 12
Project managers 50,000 2,950,000 2.00 7
Real estate agents 30,000 1,770,000 4.00 7
Bank tellers 25,000 1,475,000 6.00 8
School teachers 15,000 885,000 1.50 4
Retail clerks 15,000 885,000 7.00 5
AVERAGES 643,947 37,992,895 4.82 12
Introduction 7
Similar occurrences take place after hurricanes and natural disasters that shut down power. Many retail establishments are unable to record sales information, and some stay closed even though workers and potential customers are both available. If computers and software are out of service, many businesses can no longer operate.
Software and computers are so deeply enmeshed in modern business and government operations that the global economy is at serious risk. As military planners know, nuclear explosions in the atmosphere emit an electromagnetic pulse (EMP) that damages transistors and electrical circuits. They can also cause explosions of liquid fuels such as gasoline and can detonate stored weapons.
Such “ebombs” can be designed and detonated high enough so that they don’t cause injuries or death to people, but instead cause major destruction of electronic devices such as radar, electric power generation, television, computers, and the like.
As of 2011, it is thought that most major countries already have ebombs in their arsenals. CBS news reported that one or more ebombs shut down the electric capacity of Baghdad without doing physical damage to buildings or personnel during the second Iraq war. This could be one of the reasons why restoring power to Baghdad after the hostilities ended has been so difficult.
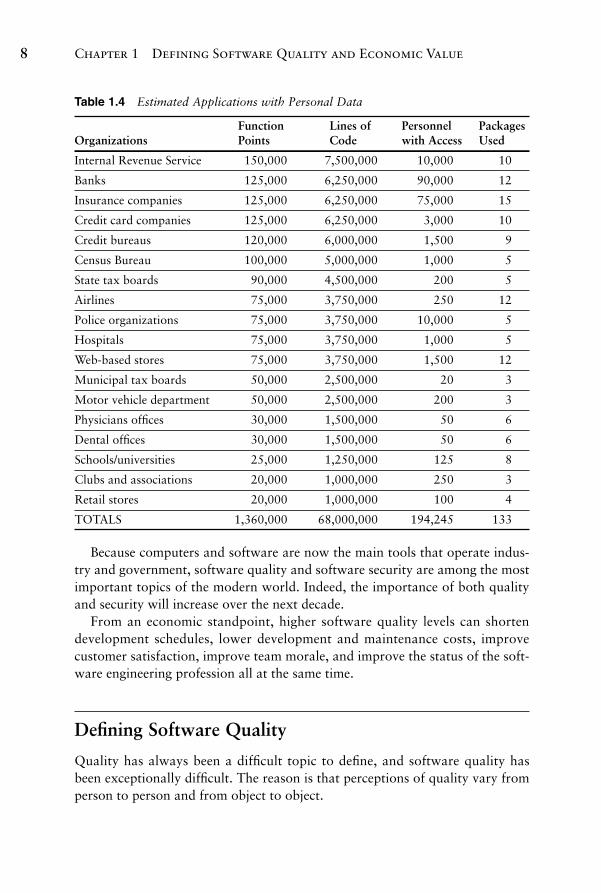
A final reason that software quality is important is because dozens of government agencies and thousands of companies have personal information about us stored in their computers. Therefore, both quality and security are critical topics in 2011.
Table 1.4 shows examples of the kinds of organizations that record personal information and the probable number of people who work in those organizations who might have access to data about our finances, our Social Security numbers, our healthcare records, our dates of birth, our jobs, our families, our incomes, and many other personal topics.
Given the number of government agencies and corporations that record vital data about citizens, and the number of people who have access to that data, it is no wonder that identity theft is likely to hit about 15% of U.S. citizens within the next five years.
A Congressional report showed that the number of U.S. cyber attacks increased from about 43,000 in 2008 to more than 80,000 in 2009. As this book is being written, probably more than 10,000 U.S. hackers are actively engaged in attempting to steal credit card and financial information. Computers, networks, and smart phones are all at considerable risk. Security vulnerabilities are linked closely to poor quality, and many attacks are based on known quality flaws.
Chapter 1 Defining Software Quality and Economic Value8
Table 1.4 Estimated Applications with Personal Data
Function Lines of Personnel Packages Organizations Points Code with Access Used
Internal Revenue Service 150,000 7,500,000 10,000 10
Banks 125,000 6,250,000 90,000 12
Insurance companies 125,000 6,250,000 75,000 15
Credit card companies 125,000 6,250,000 3,000 10
Credit bureaus 120,000 6,000,000 1,500 9
Census Bureau 100,000 5,000,000 1,000 5
State tax boards 90,000 4,500,000 200 5
Airlines 75,000 3,750,000 250 12
Police organizations 75,000 3,750,000 10,000 5
Hospitals 75,000 3,750,000 1,000 5
Webbased stores 75,000 3,750,000 1,500 12
Municipal tax boards 50,000 2,500,000 20 3
Motor vehicle department 50,000 2,500,000 200 3
Physicians offices 30,000 1,500,000 50 6
Dental offices 30,000 1,500,000 50 6
Schools/universities 25,000 1,250,000 125 8
Clubs and associations 20,000 1,000,000 250 3
Retail stores 20,000 1,000,000 100 4
TOTALS 1,360,000 68,000,000 194,245 133
Because computers and software are now the main tools that operate industry and government, software quality and software security are among the most important topics of the modern world. Indeed, the importance of both quality and security will increase over the next decade.
From an economic standpoint, higher software quality levels can shorten development schedules, lower development and maintenance costs, improve customer satisfaction, improve team morale, and improve the status of the software engineering profession all at the same time.
Defining Software Quality
Quality has always been a difficult topic to define, and software quality has been exceptionally difficult. The reason is that perceptions of quality vary from person to person and from object to object.
9Defining Software Quality
For software quality for a specific application, the perceptions of quality differ among clients, developers, users, managers, software quality personnel, testers, senior executives, and other stakeholders. The perceptions of quality also differ among quality consultants, academics, and litigation attorneys. Many definitions have been suggested over the years, but none have been totally satisfactory or totally adopted by the software industry, including those embodied in international standards.
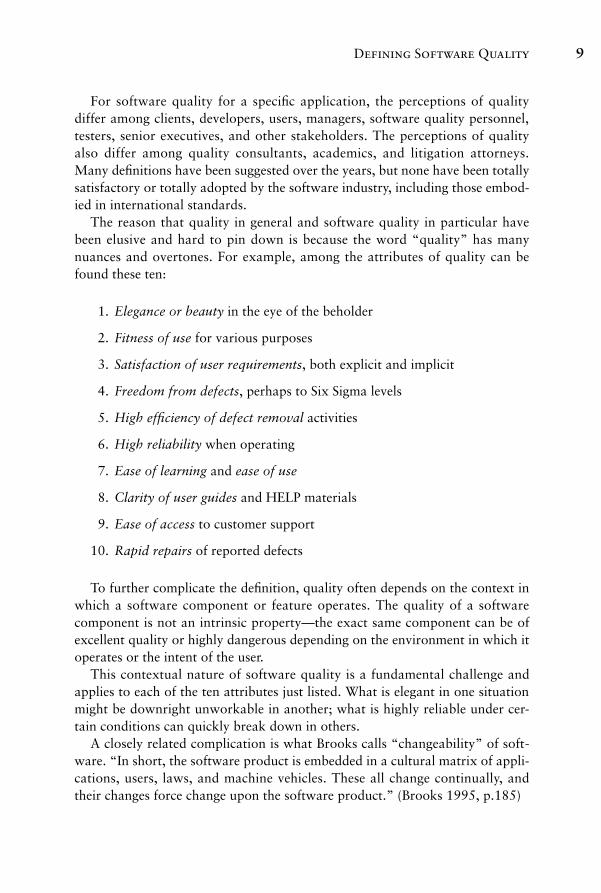
The reason that quality in general and software quality in particular have been elusive and hard to pin down is because the word “quality” has many nuances and overtones. For example, among the attributes of quality can be found these ten:
1. Elegance or beauty in the eye of the beholder
2. Fitness of use for various purposes
3. Satisfaction of user requirements, both explicit and implicit
4. Freedom from defects, perhaps to Six Sigma levels
5. High efficiency of defect removal activities
6. High reliability when operating
7. Ease of learning and ease of use
8. Clarity of user guides and HELP materials
9. Ease of access to customer support
10. Rapid repairs of reported defects
To further complicate the definition, quality often depends on the context in which a software component or feature operates. The quality of a software component is not an intrinsic property—the exact same component can be of excellent quality or highly dangerous depending on the environment in which it operates or the intent of the user.
This contextual nature of software quality is a fundamental challenge and applies to each of the ten attributes just listed. What is elegant in one situation might be downright unworkable in another; what is highly reliable under certain conditions can quickly break down in others.
A closely related complication is what Brooks calls “changeability” of software. “In short, the software product is embedded in a cultural matrix of applications, users, laws, and machine vehicles. These all change continually, and their changes force change upon the software product.” (Brooks 1995, p.185)
Chapter 1 Defining Software Quality and Economic Value10
This brings us to the distinction between testing and software quality. Software quality is often loosely equated with the activities of testing or quality assurance. However, contextuality and Brooks’ notion of changeability of software are the reasons why software quality cannot be equated with testing or quality assurance.
Testing can only tackle known unknowns. If you don’t know what you’re testing for, you are not, by definition, conducting tests. But software, by its very nature is subject to unknown unknowns. No amount of functional or nonfunctional testing can be designed to detect and correct these problems. For example, the behavior of the application can change when
• One or more application components are switched out for new components
• Components change for technology reasons (such as version upgrades)
• Components change for business reasons (such as for new features or a change in workflow)
• Or the application’s environment (perhaps the technology stack, for example) changes
It is impossible to devise tests for these conditions in advance. However, from experience we know that some applications are more robust, reliable, and dependable than others when the environment around them changes. Some applications are much easier to modify or extend in response to pressing business needs. These attributes of an application—robustness, dependability, modifiability, and so on—are reliable indicators of application quality that go beyond the defects identified during testing or the process inefficiencies or compliance lapses indentified in quality assurance. Therefore, the quality of an application can and must be defined in such a way as to accommodate these indicators of quality that outrun those identified in testing and quality assurance. How the concepts of contextuality and changeability can be accounted for in defining and measuring software quality is addressed at length in Chapter 2.
There are seven criteria that should be applied to definitions of software quality in order to use the definition in a business environment for economic analysis:
1. The quality definition should be predictable before projects start.
2. The quality definition should be measurable during and after projects are finished.
3. The quality definition should be provable if litigation occurs.
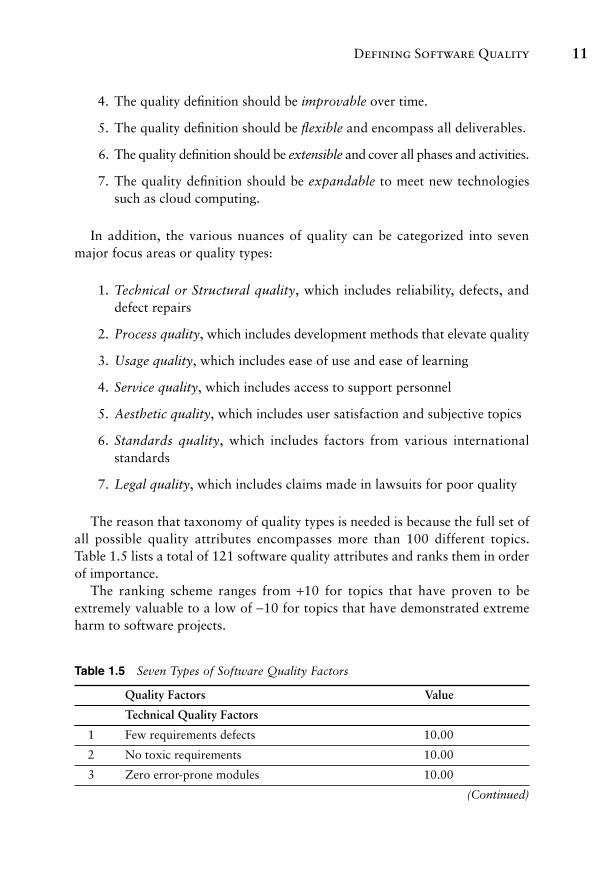
11Defining Software Quality
4. The quality definition should be improvable over time.
5. The quality definition should be flexible and encompass all deliverables.
6. The quality definition should be extensible and cover all phases and activities.
7. The quality definition should be expandable to meet new technologies such as cloud computing.
In addition, the various nuances of quality can be categorized into seven major focus areas or quality types:
1. Technical or Structural quality, which includes reliability, defects, and defect repairs
2. Process quality, which includes development methods that elevate quality
3. Usage quality, which includes ease of use and ease of learning
4. Service quality, which includes access to support personnel
5. Aesthetic quality, which includes user satisfaction and subjective topics
6. Standards quality, which includes factors from various international standards
7. Legal quality, which includes claims made in lawsuits for poor quality
The reason that taxonomy of quality types is needed is because the full set of all possible quality attributes encompasses more than 100 different topics. Table 1.5 lists a total of 121 software quality attributes and ranks them in order of importance.
The ranking scheme ranges from +10 for topics that have proven to be extremely valuable to a low of −10 for topics that have demonstrated extreme harm to software projects.
Table 1.5 Seven Types of Software Quality Factors
Quality Factors Value
Technical Quality Factors
1 Few requirements defects 10.00
2 No toxic requirements 10.00
3 Zero errorprone modules 10.00
(Continued)
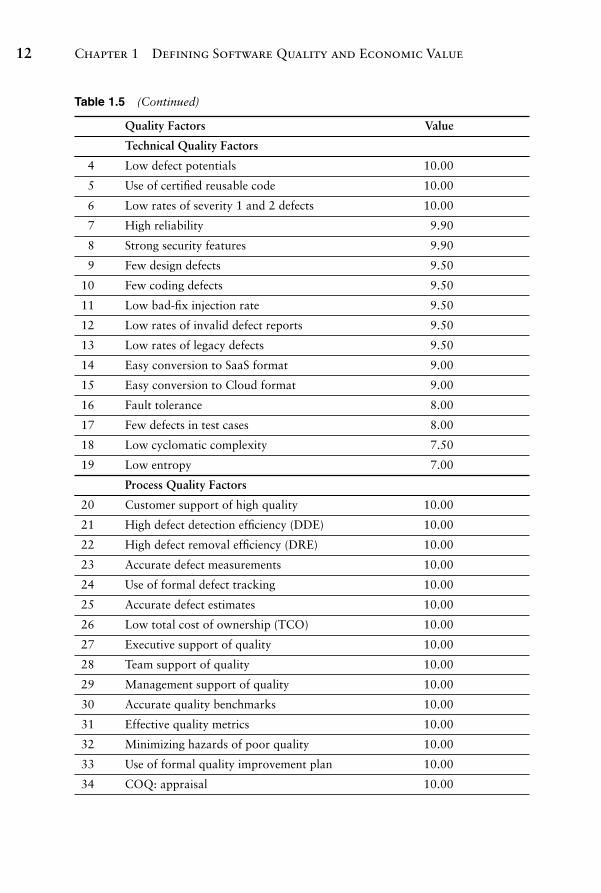
Chapter 1 Defining Software Quality and Economic Value12
Table 1.5 (Continued)
Quality Factors Value
Technical Quality Factors
4 Low defect potentials 10.00
5 Use of certified reusable code 10.00
6 Low rates of severity 1 and 2 defects 10.00
7 High reliability 9.90
8 Strong security features 9.90
9 Few design defects 9.50
10 Few coding defects 9.50
11 Low badfix injection rate 9.50
12 Low rates of invalid defect reports 9.50
13 Low rates of legacy defects 9.50
14 Easy conversion to SaaS format 9.00
15 Easy conversion to Cloud format 9.00
16 Fault tolerance 8.00
17 Few defects in test cases 8.00
18 Low cyclomatic complexity 7.50
19 Low entropy 7.00
Process Quality Factors
20 Customer support of high quality 10.00
21 High defect detection efficiency (DDE) 10.00
22 High defect removal efficiency (DRE) 10.00
23 Accurate defect measurements 10.00
24 Use of formal defect tracking 10.00
25 Accurate defect estimates 10.00
26 Low total cost of ownership (TCO) 10.00
27 Executive support of quality 10.00
28 Team support of quality 10.00
29 Management support of quality 10.00
30 Accurate quality benchmarks 10.00
31 Effective quality metrics 10.00
32 Minimizing hazards of poor quality 10.00
33 Use of formal quality improvement plan 10.00
34 COQ: appraisal 10.00
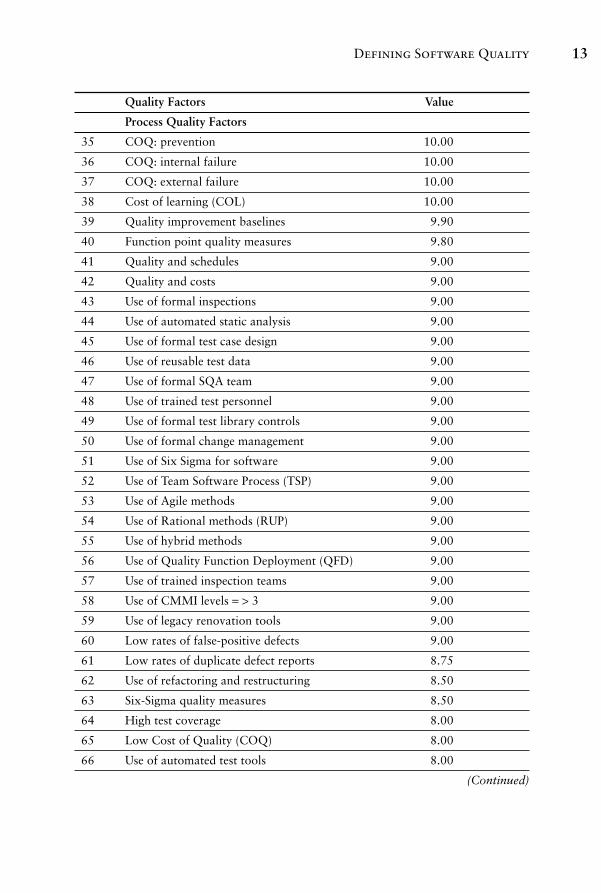
13Defining Software Quality
Quality Factors Value
Process Quality Factors
35 COQ: prevention 10.00
36 COQ: internal failure 10.00
37 COQ: external failure 10.00
38 Cost of learning (COL) 10.00
39 Quality improvement baselines 9.90
40 Function point quality measures 9.80
41 Quality and schedules 9.00
42 Quality and costs 9.00
43 Use of formal inspections 9.00
44 Use of automated static analysis 9.00
45 Use of formal test case design 9.00
46 Use of reusable test data 9.00
47 Use of formal SQA team 9.00
48 Use of trained test personnel 9.00
49 Use of formal test library controls 9.00
50 Use of formal change management 9.00
51 Use of Six Sigma for software 9.00
52 Use of Team Software Process (TSP) 9.00
53 Use of Agile methods 9.00
54 Use of Rational methods (RUP) 9.00
55 Use of hybrid methods 9.00
56 Use of Quality Function Deployment (QFD) 9.00
57 Use of trained inspection teams 9.00
58 Use of CMMI levels = > 3 9.00
59 Use of legacy renovation tools 9.00
60 Low rates of falsepositive defects 9.00
61 Low rates of duplicate defect reports 8.75
62 Use of refactoring and restructuring 8.50
63 SixSigma quality measures 8.50
64 High test coverage 8.00
65 Low Cost of Quality (COQ) 8.00
66 Use of automated test tools 8.00
(Continued)
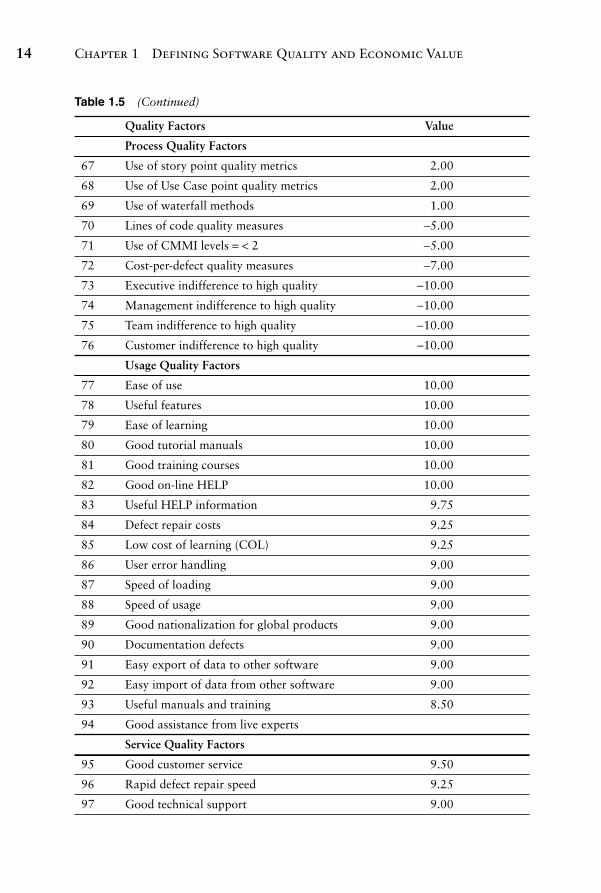
Chapter 1 Defining Software Quality and Economic Value14
Table 1.5 (Continued)
Quality Factors Value
Process Quality Factors
67 Use of story point quality metrics 2.00
68 Use of Use Case point quality metrics 2.00
69 Use of waterfall methods 1.00
70 Lines of code quality measures −5.00
71 Use of CMMI levels = < 2 −5.00
72 Costperdefect quality measures −7.00
73 Executive indifference to high quality −10.00
74 Management indifference to high quality −10.00
75 Team indifference to high quality −10.00
76 Customer indifference to high quality −10.00
Usage Quality Factors
77 Ease of use 10.00
78 Useful features 10.00
79 Ease of learning 10.00
80 Good tutorial manuals 10.00
81 Good training courses 10.00
82 Good online HELP 10.00
83 Useful HELP information 9.75
84 Defect repair costs 9.25
85 Low cost of learning (COL) 9.25
86 User error handling 9.00
87 Speed of loading 9.00
88 Speed of usage 9.00
89 Good nationalization for global products 9.00
90 Documentation defects 9.00
91 Easy export of data to other software 9.00
92 Easy import of data from other software 9.00
93 Useful manuals and training 8.50
94 Good assistance from live experts
Service Quality Factors
95 Good customer service 9.50
96 Rapid defect repair speed 9.25
97 Good technical support 9.00
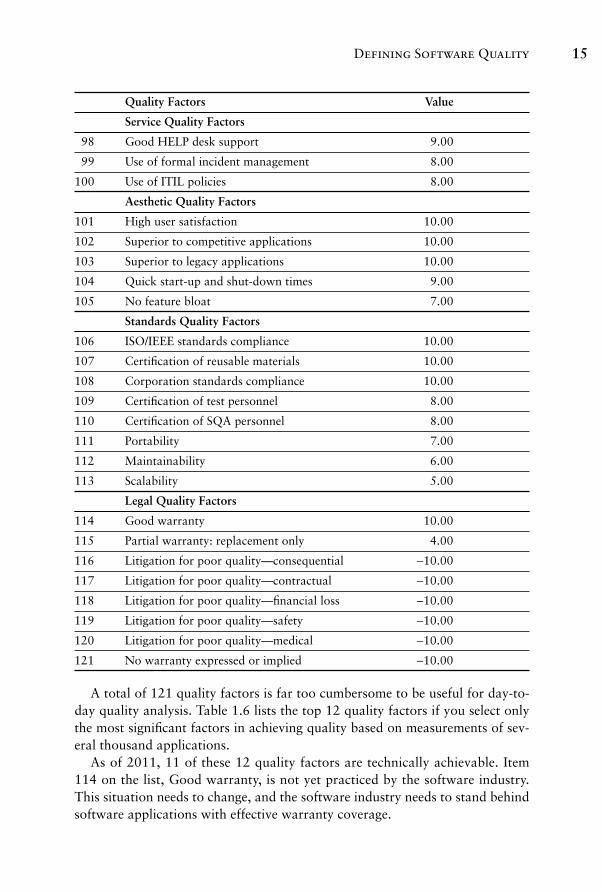
15Defining Software Quality
Quality Factors Value
Service Quality Factors
98 Good HELP desk support 9.00
99 Use of formal incident management 8.00
100 Use of ITIL policies 8.00
Aesthetic Quality Factors
101 High user satisfaction 10.00
102 Superior to competitive applications 10.00
103 Superior to legacy applications 10.00
104 Quick startup and shutdown times 9.00
105 No feature bloat 7.00
Standards Quality Factors
106 ISO/IEEE standards compliance 10.00
107 Certification of reusable materials 10.00
108 Corporation standards compliance 10.00
109 Certification of test personnel 8.00
110 Certification of SQA personnel 8.00
111 Portability 7.00
112 Maintainability 6.00
113 Scalability 5.00
Legal Quality Factors
114 Good warranty 10.00
115 Partial warranty: replacement only 4.00
116 Litigation for poor quality—consequential −10.00
117 Litigation for poor quality—contractual −10.00
118 Litigation for poor quality—financial loss −10.00
119 Litigation for poor quality—safety −10.00
120 Litigation for poor quality—medical −10.00
121 No warranty expressed or implied −10.00
A total of 121 quality factors is far too cumbersome to be useful for daytoday quality analysis. Table 1.6 lists the top 12 quality factors if you select only the most significant factors in achieving quality based on measurements of several thousand applications.
As of 2011, 11 of these 12 quality factors are technically achievable. Item 114 on the list, Good warranty, is not yet practiced by the software industry. This situation needs to change, and the software industry needs to stand behind software applications with effective warranty coverage.
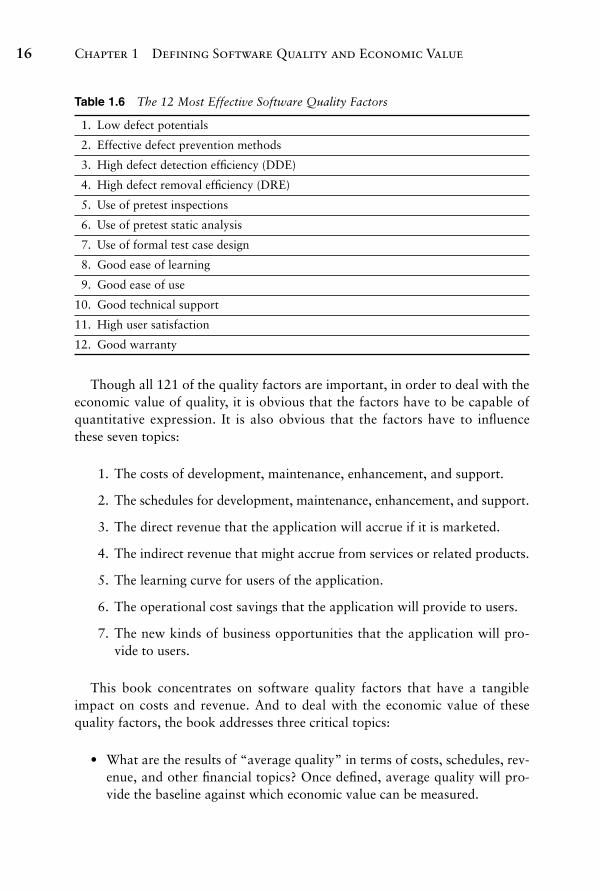
Chapter 1 Defining Software Quality and Economic Value16
Table 1.6 The 12 Most Effective Software Quality Factors
1. Low defect potentials
2. Effective defect prevention methods
3. High defect detection efficiency (DDE)
4. High defect removal efficiency (DRE)
5. Use of pretest inspections
6. Use of pretest static analysis
7. Use of formal test case design
8. Good ease of learning
9. Good ease of use
10. Good technical support
11. High user satisfaction
12. Good warranty
Though all 121 of the quality factors are important, in order to deal with the economic value of quality, it is obvious that the factors have to be capable of quantitative expression. It is also obvious that the factors have to influence these seven topics:
1. The costs of development, maintenance, enhancement, and support.
2. The schedules for development, maintenance, enhancement, and support.
3. The direct revenue that the application will accrue if it is marketed.
4. The indirect revenue that might accrue from services or related products.
5. The learning curve for users of the application.
6. The operational cost savings that the application will provide to users.
7. The new kinds of business opportunities that the application will provide to users.
This book concentrates on software quality factors that have a tangible impact on costs and revenue. And to deal with the economic value of these quality factors, the book addresses three critical topics:
• What are the results of “average quality” in terms of costs, schedules, revenue, and other financial topics? Once defined, average quality will provide the baseline against which economic value can be measured.
17Defining Economic Value and Defining the Value of Software Quality
• What are the results of “high quality” in terms of cost reduction, schedule reduction, higher revenues, new market opportunities, and other financial topics?
• What are the consequences of “low quality” in terms of cost increases, schedule increases, reduced revenue, loss of customers, and other financial topics?
Usually, more insights result from polar opposites than from average values. Therefore the book concentrates on the economic value from high quality and the economic losses from low quality.
While average quality is important, it is not very good, nor has it ever been very good for software. Therefore, it is important to know that only betterthanaverage software quality has tangible economic values associated with it.
Conversely, low software quality brings with it some serious economic consequences, including the threat of classaction litigation, the threat of breach of contract litigation, and, for embedded software in medical devices, even the potential threat of criminal charges.
Defining Economic Value and Defining the Value of Software Quality
Not only is “quality” an ambiguous term because of multiple viewpoints, but the term “value” is also ambiguous for the same reason. Indeed the concept of economic value has been a difficult one for every industry and for all forms of economic theory for more than 150 years.
Some economic theories link value to cost of production and to the price of various commodities. Other economic theories link value to usage of the same commodities. John Ruskin even assigned a moral element to value that dealt with whether wealth or various commodities were used for beneficial or harmful purposes. All of these theoretical economic views about value are interesting but somewhat outside the scope of this book.
For software, the perception of economic value can vary between enterprises that produce software and enterprises that consume or use software. These two views correspond to classic economic theories that assign value based on either production or on usage—both are discussed.
But software has another view of value that is not dealt with very often in standard economic theories. In modern businesses and governments, the people who pay for internal software application development are neither the producers nor the consumers.
Chapter 1 Defining Software Quality and Economic Value18
Many software projects are commissioned and funded by executives or senior managers who will probably never actually use the software itself. These senior executives have a perception of value that needs to be considered—at the executive level, value of software can be delineated in a few different ways:
1. Software that can lower current operational costs
2. Software that can increase revenue by selling more current products
3. Software that can increase revenue by creating innovative new lines of business or by producing novel new products
For the first 20 years of the software industry between about 1950 and 1970, operating cost reduction was the primary economic reason for building software applications. Many clerical and paperpushing jobs were converted from manual labor to computers.
From about 1970 to 1990, computers and software started to be aimed at improving manufacturing and marketing capabilities so that companies could build and sell more of their current products. Robotic manufacturing and sophisticated customer support and inventory management systems made significant changes in industrial production, marketing, and sales methodologies.
From about 1990 through today, computers and software have been rapidly creating new kinds of businesses that never existed before in all of human history. Consider the products and business models that are now based on the Internet and the World Wide Web.
Modern companies such as Amazon, Google, and eBay are doing forms of business that could not be done at all without software and the Web. At a lower level, computer gaming is now a multibillion dollar industry that is selling immersive 3D products that could not exist without software. In other words, the third dimension of economic value is “innovation” and the creation of entirely new kinds of products and new business models.
In sum, when considering the economics of software and also of software quality, we need to balance three distinct threads of analysis:
1. Operating cost reductions
2. Revenue from increasing market share of current products or services
3. Revenue from inventing entirely new kinds of products and services
To come to grips with both the value of software itself and economic value of software quality, it is useful to explore a sample of these disparate views,
19
including both the value of high quality levels and the economic harm from poor quality levels. In Chapter 7 we present quantitative frameworks for measuring the operating costs and the business impact of software quality.
The Economic Value of Software and Quality to Enterprises That Build Internal Software for Their Own Use
Building software internally for corporate or government operations was the first application for computers in a business setting. The reason this was the first response is because there were no other alternatives in the late 1950s and early 1960s due to the lack of other sources for software.
In the 1960s when computers first began to be widely used for business purposes, there were few COTS companies and no enterpriseresource planning companies (ERP) at all. The outsource business was in its infancy, and offshore outsourcing was almost 20 years in the future. The initial use of computers was to replace laborintensive paper operations with faster computerized applications. For example, insurance claims handling, accounting, billing, taxation, and inventory management were all early examples of computerization of business operations.
The software for these business applications were built by the companies or government groups that needed them. This began an interesting new economic phenomenon of large companies accumulating large software staffs for building custom software even though software had nothing to do with their primary business operations.
By the 1990s, many banks, insurance companies, and manufacturing companies had as many as 10% of their total employment engaged in the development, maintenance, and support of custom internal software.
The same phenomenon occurred for the federal government, for all 50 of the state governments, and for about the 125 largest municipal governments.
In 2011, the 1,000 largest U.S. companies employed more than 1,000,000 software engineers and other software occupations. Some of these companies are very sophisticated and build software well, but many are not sophisticated and have major problems with cost overruns, schedule slippage, and outright cancellation of critical software projects.
The same statement is true of government software development. Some agencies are capable and build software well. But many are not capable and experience cancellations, overruns, and poor quality after deployment.
Examples of enterprises that build their own custom software include Aetna, Citizens, Proctor and Gamble, Ford and General Motors, Exxon Oil, the federal government, the state of California, the city of New York, and thousands of others.
Defining Economic Value and Defining the Value of Software Quality
Chapter 1 Defining Software Quality and Economic Value20
Most internal software development groups operate as cost centers and are not expected to be profitable. However, they may charge other operating units for their services. Some software groups are funded by corporations as overhead functions, in which case they work for free. Very few operate as profit centers and sell their services to other companies as well as to internal business units.
Between about 1965 and 1985 these internal development groups were building applications for two main purposes:
1. To reduce operational costs by automating laborintensive manual activities
2. To allow companies to offer new and improved services to customers
By the end of the last century and continuing through 2011, the work patterns have shifted. About 75% of “new” applications in 2011 were replacements for aging legacy applications built more than 15 years ago. These aging legacy applications require so much work to keep them running and up to date that more than 50% of internal software staffs now work on modifying existing software.
And, of course, the software personnel spend a high percentage of every working day finding and fixing bugs.
Since the early 1990s outsource vendors, COTS vendors, and open source vendors have entered the picture. As a result, the roles of internal software groups are evolving. Due to the recession of 2008 through 2010, many internal software groups have been downsized, and many others are being transferred to outsourcing companies.
As of 2011 only about 20% of the work of internal software groups involves innovation and new forms of software. The new forms of innovative software center on web applications, cloud computing, and business intelligence. However, numerous software projects are still being built by internal software groups even if the majority of these “new” projects are replacements or consolidations of aging legacy applications.
The economic value of software quality for internal software projects centers on these topics:
• Reduced cancellation rates for large applications
• Earlier delivery dates for new applications
• Reduced resistance from operating units for accepting new software
• Faster learning curves for bringing users up to speed for new software
• More and better services and products for clients
21
• Reduced development costs for new applications
• Reduced maintenance costs for released applications
• Reduced customer support costs for released applications
• Reduced executive dissatisfaction with the IT function
The economic consequences of low quality for inhouse development include
• Protracted delays in delivering new applications
• Major cost overruns for new applications
• High probability of outright cancellation for large new applications
• Damages to business operations from poor quality
• Damages to customer records from poor quality
• Executive outrage over poor performance of IT group
• High odds of replacing inhouse development with outsourcing
• Long learning curves for new applications due to poor quality
• Poor customer satisfaction
• High maintenance costs due to poor quality
• High customer support costs due to poor quality
The internal software development community does not do a very good job on software quality compared to the embedded software community, the systems software community, the defense software community, or even the commercial software community. One of the reasons why many companies are moving to outsource vendors is because internal software quality has not been effective.
Among the gaps in software quality control for the internal software community can be found poor quality measurements, failure to use effective defect prevention techniques, failure to use pretest inspections and static analysis tools, and failure to have adequately staffed Software Quality Assurance (SQA) teams. In general, the internal software community tests software applications but does not perform other necessary quality activities.
Poor quality control tends to increase executive dissatisfaction with the IT community, lower user satisfaction, and raise the odds that enterprises will want to shift to outsourcing vendors.
Defining Economic Value and Defining the Value of Software Quality
Chapter 1 Defining Software Quality and Economic Value22
The Economic Value of Software and Quality to Internal Software Users
As of mid2010 the Bureau of Labor Statistics reported that employment for the United States is about 139,000,000. (Unfortunately, this number is down about 7,000,000 from the 2007 peak before the “Great Recession” when U.S. employment topped 146,000,000.)
Of these U.S. workers, about 20% are daily software and computer users, roughly 27,800,000. Some of these people who work for small companies use only a few commercial software packages such as spreadsheets and word processors. However, about 40% of these workers are employed by either companies or government agencies that are large enough to build internal software. In other words, there are about 11,120,000 workers who use internally developed software applications as part of their daily jobs.
Note that these users of computers and software are not “customers” in the sense that they personally pay for the software that they use. The software is provided by corporations and government agencies so that the workers can carry out their daily jobs.
Examples of common kinds of internal software used by companies circa 2011 include retail sales, order entry, accounts payable and receivable, airline and train reservations, hotel reservations, insurance claims handling, vehicle fleet control, automobile renting and leasing, shipping, and cruise line bookings. Other examples include hospital administration, Medicare and Medicaid, and software used by the Internal Revenue Service (IRS) for taxation.
In today’s world, internal development of software is primarily focused on applications that are specific to a certain business and hence not available from COTS vendors. Of course, the large enterpriseresource planning (ERP) companies such as SAP, Oracle, PeopleSoft, and the like have attempted to reduce the need for inhouse development. Even the most complete ERP implementations still cover less than 50% of corporate software uses.
In the future, Software as a Service (SaaS), Serviceoriented Architecture (SOA), and cloud computing will no doubt displace many inhouse applications with equivalent Webbased services, but that time is still in the future.
The economic value of highquality internal software to users and stakeholders has these factors:
• Reduction in cancelled projects
• Reduction in schedule delays
• Reduction in cost overruns
23
• Reduction in user resistance to new applications
• Rapid deployment of new applications
• Short learning curves to get up to speed in new applications
• Higher user satisfaction
• Higher reliability
• Better and more reliable customer service
• Reduced maintenance costs for released applications
• Reduced customer support costs for released applications
The economic consequences of low quality for internal users and stakeholders include
• Risk of cancelled projects
• Schedule delays for large applications
• Cost overruns for large applications
• Business transaction errors that damage customers or clients
• Business transaction errors that damage financial data
• Possible classaction litigation from disgruntled customers
• Possible litigation from customers suffering business losses
• Possible litigation from shareholders about poor quality
• Protracted delays in delivering new services
• Poor customer satisfaction
• High maintenance costs due to poor quality
• High customer support costs due to poor quality
For more than 50 years, internal software has been a mainstay of many corporations. However, due in large part to poor quality levels, a number of corporations and some government agencies are reevaluating the costs and value of internal development. Outsourcing is increasing, and international outsourcing is increasing even more quickly.
Defining Economic Value and Defining the Value of Software Quality
Chapter 1 Defining Software Quality and Economic Value24
Process improvements are also popular among internal software development groups. These range from being moderately successful to being extremely successful. As is discussed throughout this book, success tends to correlate with improved quality levels.
The Economic Value of Software and Quality to Commercial Software Vendors
Because there are now thousands of commercial software companies and many thousands of commercial software applications, it is interesting to realize that this entire multibillion dollar industry is younger than many readers of this book.
The commercial software business is a byproduct of the development of electronic computers and only began to emerge in the 1960s. Word processing only entered the commercial market in about 1969 as an evolution of electric typewriters augmented by storage for repetitive text such as forms and questionnaires.
Spreadsheets first became commercial products circa 1978 with VisiCalc, although there were earlier implementations of computerized spreadsheets by IBM and other computer and software companies.
A spreadsheet patent was filed in 1971 by Reny Pardo and Remy Landau. This patent became famous because it was originally rejected by the U.S. patent office as being pure mathematics. It was only in 1983 that the Patent Office was overruled by the courts and software implementations of mathematical algorithms were deemed to be patentable.
As this book is written, there are more than 77,000 software companies in the United States. The software industry has generated enormous revenue and enormous personal wealth for many founders such as Bill Gates of Microsoft, Steve Jobs of Apple, Larry Ellison of Oracle, Larry Page and Sergey Brin of Google, Jeff Bezos of Amazon, and quite a few more.
As of 2011, about 75% of the revenue of software companies comes from selling more and more copies of existing applications such as Windows and Microsoft Office. About 25% of the revenue of software companies comes from innovation or the creation of new kinds of products and services, as demonstrated by Google, Amazon, and hundreds of others.
This is an important distinction because in the long run innovation is the factor that generates the greatest economic value. Companies and industries that stop innovating will eventually lose revenues and market share due to saturation of the markets with existing products.
One other interesting issue about innovation is that of “copy cats.” After a new kind of software application hits the market, fastfollowers often sweep
25
right into the same market with products that copy the original features but include new features as well. In the commercial software business these fast followers tend to be more successful than the original products, as can be seen by looking at the sales history of VisiCalc and Microsoft Excel.
A number of software companies are now among the largest and wealthiest companies in the world. There are also thousands of medium and small software companies as well as giants. Examples of software companies include CAST, Microsoft, Symantec, IBM, Google, Oracle, SAP, Iolo, Quicken, Computer Aid Inc. and hundreds of others.
The primary value topic for commercial software itself is direct revenue, with secondary value deriving from maintenance contracts, consulting services, and related applications.
For example, most companies that lease large enterprise resourceplanning (ERP) packages such as Oracle also bring in consulting teams to help deploy the packages and train users. They almost always have maintenance contracts that can last for many years.
As to the economic value of software quality in a commercial context, the value of quality to the commercial vendors themselves stems from these topics:
• Reduced cancellation rates for large applications
• Earlier delivery dates for new applications
• Favorable reviews by the press and user groups
• Reduced development costs for new applications
• Reduced maintenance costs for released applications
• Reduced customer support costs for released applications
• Increased market share if quality is better than competitors
• Fewer security flaws in released applications
The economic consequences of low quality for commercial vendors include
• Possible classaction litigation from disgruntled customers
• Possible litigation from customers suffering business losses
• Protracted delays in delivering new applications
• Unfavorable reviews by the press and user associations
• Poor customer satisfaction
Defining Economic Value and Defining the Value of Software Quality
Chapter 1 Defining Software Quality and Economic Value26
• Loss of customers if competitive quality is better
• High maintenance costs due to poor quality
• High customer support costs due to poor quality
• Elevated numbers of security flaws in released applications
The commercial software world has only a marginal reputation for software quality. Some companies such as IBM do a good job overall. Others such as Symantec, Oracle, and Microsoft might try to do good jobs but tend to release software with quite a few bugs still latent.
If the commercial software vendors were really at stateofthe art levels of quality control, then software warranties would be both common and effective. Today, the bulk of commercial software “warranties” include only replacement of media. There are no guarantees that software will work effectively on the part of commercial software vendors.
The Economic Value of Software and Quality to COTS Users and Customers
As of 2011 there are about 14,659,956 U.S. companies that use computers and software. But the largest 1,000 companies probably use 50% of the total quantity of COTS packages.
There are more than 150,000 government organizations that use computers and COTS software when federal, state, and municipal agencies are considered as a set (roughly 100,000 federal and military sites; 5,000 state sites; and 50,000 municipal sites).
The main economic reason that companies, government agencies, and individuals purchase or lease commercial software packages is that packaged software is the least expensive way of gaining access to the features and functions that the package offers.
If we need an accounting system, an inventory system, and billing system, or even something as fundamental as a word processor or a spreadsheet, then acquiring a package has been the most costeffective method for more than 50 years.
For a company or user to attempt to develop applications with features that match those in commercial packages, it would take months or even years. We buy software for the same reason we buy washing machines and automobiles: they are available right now; they can be put to use immediately; and if we are lucky, they will not have too many bugs or defects.
In the future, SaaS, SOA, and cloud computing will no doubt displace many applications with equivalent Webbased services. However, this trend is only
27
just beginning and will probably take another ten years or more to reach maturity.
The open source companies such as Mozilla and the availability of Webbased packages such as Google Applications and Open Office are starting to offer alternatives to commercial packages that are free in many cases. As of 2011 usage of commercial software is still more common than usage of open source or Webbased alternatives, but when the two compete headtohead, the open source versions seem to be adding new customers at a faster rate.
Examples of companies that use COTS packages include manufacturing companies, law firms, medical offices, small hospitals, small banks, retail stores, and thousands of other companies. All government units at the federal, state, and municipal levels use COTS packages in large numbers, as do the military services. These enterprises use the software to either raise their own profitability or to lower operating costs, or both.
The economic value of high software quality to corporate and government consumers of commercial software has these factors:
• Rapid deployment of COTS applications
• Quicker deployment of new services and functions
• Short learning curves to get up to speed in COTS applications
• Minimizing the risks of inhouse development
• Minimizing the risks of outsource development
• Reduced maintenance costs for released applications
• Reduced customer support costs for released applications
The economic consequences of low quality for COTS users include
• Business transaction errors that damage customers or clients
• Business transaction errors that damage financial data
• Possible classaction litigation from disgruntled customers
• Possible litigation from customers suffering business losses
• Possible litigation from shareholders about poor quality
• Protracted delays in delivering new services
• Poor customer satisfaction
Defining Economic Value and Defining the Value of Software Quality
Chapter 1 Defining Software Quality and Economic Value28
• High maintenance costs due to poor quality
• High customer support costs due to poor quality
As an example of the hazards of poor quality from COTS packages, one of the authors lives in Narragansett, Rhode Island. When the town acquired a new property tax software package, tax bills were about a month late in being sent to homeowners, and there were many errors in the calculations. The system also lagged in producing financial reports for the town council. Eventually, the package was withdrawn, and an alternate package from another vendor was used in its place.
A study by one of the authors of the corporate software portfolio for a large manufacturing company in the Fortune 500 class found that out of 3,200 applications in the portfolio, 1,120 were COTS packages acquired from about 75 different vendors.
The total initial cost for these COTS applications was about $168,000,000. Annual leases amounted to about $42,000,000.
Approximately 149 people were devoted exclusively to the operation and maintenance of the COTS packages. In a single year, about 18,072 highseverity bugs were reported against the COTS applications in the portfolio.
Indeed, bugs in COTS packages are so common that one large commercial software vendor was sued by its own shareholders, who claimed that poor quality was lowering the value of their investments. The case was settled, but the fact that such a case was even filed illustrates that the COTS vendors need better quality control.
COTS packages are valuable and useful to be sure. But due to the marginal to poor software quality practices of the commercial vendors, customers and users need to expect and prepare for significant quantities of bugs or defects and significant staffing and effort to keep COTS packages up and running.
The Economic Value of Software and Quality to Embedded Software Companies
Embedded software is present in thousands of products in 2011. For consumer products such as digital watches, digital cameras, smart phones, and similar devices, high quality is fairly common; bugs or low quality is fairly rare.
For more complex devices that might affect human life or safety, the quality levels are still quite good, but bugs or errors can have serious consequences for both those who use the software and for the companies that produce the devices. Bugs or errors in medical devices, automobile brake systems, aircraft navigation devices, and weapons systems can lead to death, injuries, and enormous recall and recovery costs.
29
The economic value of software for embedded software producers derives primarily from sales of physical equipment rather than the software itself. Examples of companies that create devices with embedded software include Boeing, Motorola, AT&T, Nokia, medical equipment companies such as Advanced Bionics, and many others. In total probably 10,000 companies produce embedded devices and the software within them.
As of 2011, about 45% of the revenue of embedded software companies has come from selling more and more copies of existing products such as digital watches, digital hearing aids, and digital cameras.
About 55% of the revenue of embedded software companies has come from innovation or the creation of new kinds of products and services that did not exist before, such as cochlear implants, the Amazon Kindle and other eBook readers, and the control systems of modern automobiles and aircraft.
The economic value of software quality inside embedded software devices stems from these topics:
• Reduced cancellation rates for complex devices
• Creating new kinds of devices never marketed before
• Earlier delivery of new devices
• Rapid approvals by government oversight organizations
• Rapid customer acceptance of new devices
• Reduced development costs for new devices
• Reduced maintenance costs for released devices
• Reduced customer support costs for released devices
• Increased market share if quality is better than competitors
The economic consequences of low quality for embedded vendors include
• Possible criminal charges if devices causes death or injury
• Possible classaction litigation from disgruntled customers
• Possible litigation from customers suffering business losses
• Possible government action against medical devices for poor quality
• Possible shareholder litigation for poor quality
• Protracted or negative approvals by government oversight groups
Defining Economic Value and Defining the Value of Software Quality
Chapter 1 Defining Software Quality and Economic Value30
• Poor customer satisfaction
• Loss of customers if competitor’s quality is better
• High maintenance costs for devices with poorquality software
• High customer support costs for devices with poorquality software
Because complex devices won’t operate without highquality software, the embedded software world has one of the best reputations for software quality and also for customer support. Some companies such as Advanced Bionics, Motorola, Apple, and Garmin do a good job overall.
A sign of betterthanaverage quality control in the embedded domain is the fact that many embedded device companies have product warranties. In general, warranties are more common and more complete for embedded software than for other forms of software.
The Economic Value of Software and Quality to Embedded Equipment Users
The economic value of software to users of equipment controlled by embedded software is the ability to operate complex devices that would not exist without the embedded software. Examples of such devices include robotic manufacturing, undersea oil exploration, medical equipment such as MRI devices and cochlear implants, navigation packages on board ships and aircraft, and all forms of modern communication including television, radio, and wireless.
The major difference between embedded software and other kinds of software is that users are operating physical devices and might not even be aware that the devices are controlled by software. Even if users know that embedded software is in a device, they have no direct control over the software other than the controls on the devices themselves. For example, users can make many adjustments to digital cameras but only by means of using the knobs, buttons, and screens that the cameras have and not by direct changes to the embedded software itself.
The main economic reason that companies, government agencies, and individuals acquire embedded devices is because there are no other alternatives available. You either have a computerized magnetic resonance imaging device (MRI) or you can’t perform that kind of diagnosis. There are no other choices.
Embedded devices have also lowered the costs and expanded features in many consumer products. For example, a number of modern digital watches integrate standard time keeping with stop watches, elapsed time keeping, and even tide calculations and the phases of the moon.
31
Modern digital cameras have a host of functions that were not available on normal film cameras, such as electronic zooming in addition to optical zooming; redeye correction; and the ability to switch between still and animated photography at will.
Usage of embedded devices has been growing exponentially for about 25 years. As of 2011 at least 150,000,000 U.S. citizens own digital watches, digital cameras, or other personal embedded devices.
Approximately 1,500,000 U.S. patients have digital pacemakers, and the rate of increase is more than 5% per year. There are more than 5,000 installed MRI devices, and more than 1,000,000 U.S. patients undergo MRI diagnoses per year.
According to Wikipedia about 30,000 U.S. citizens now hear as a result of having cochlear implant surgery. (Cochlear implants use a combination of an external microphone and an internal computer surgically implanted under the skin. Small wires from the processor replace the damaged cilia in the inner ear. Cochlear implant devices are fully software controlled, and the software can be upgraded as necessary.)
Most modern factories for complex devices such as automobiles are now either fully or partly equipped with robotic machine tools.
Almost all modern automobiles now use embedded devices for controlling antilock brakes (which would otherwise be impossible); fuel injection; navigation packages; and in some cases controlling suspension and steering. Automobile entertainment devices such as satellite radios, standard radios, DVD players, and the like are also controlled by embedded devices and software.
The economic value of high embedded software quality to corporate and government consumers involves these factors:
• New features and functions only available from embedded devices
• Onsite upgrades to new embedded software versions
• Reduced maintenance due to reduction in mechanical parts
• Rapid deployment of new equipment
• Fewer product malfunctions
• Quicker deployment of new services and functions
The economic consequences of low quality for embedded device users include
• Possible death or injury from software bugs in medical devices
• Possible death or injury from software bugs in automobiles
Defining Economic Value and Defining the Value of Software Quality
Chapter 1 Defining Software Quality and Economic Value32
• Possible death or injury from software bugs in aircraft
• Disruption of robotic manufacturing due to bugs or errors
• Inability to make repairs without replacing embedded devices
• Possible classaction litigation from disgruntled customers
• Possible litigation from customers suffering business losses
• Protracted delays in delivering new services
• Poor customer satisfaction
• High customer support costs due to poor quality
Modern devices controlled by embedded software are one of the greatest machine revolutions in all of history. There are now dozens of complicated devices such as drone aircraft, remotely controlled submarines, MRI medical devices, cochlear implants, and robotic manufacturing that would be impossible without embedded devices and the software that controls them.
Embedded software and embedded devices are advancing medical diagnosis and medical treatments for conditions such as deafness and heart conditions. Today, there are thousands of embedded devices carrying out functions that were totally impossible before about 1975.
The Economic Value of Software and Software Quality to Other Business Sectors
There are a number of other business sectors that might be discussed in the context of the value of software and the value of software quality. Among these can be found
• Outsource software vendors and outsource software clients and users
• Defense software vendors and defense software clients and users
• Systems software vendors and systems software clients and users
• Open source software vendors and open source software clients and users
• Gaming software vendors and gaming software clients and users
• Smart phone software vendors and smart phone software clients and users
33Summary and Conclusions
The views of both value and the value of software quality in these business sectors, however, are similar to the sectors already discussed. High quality benefits costs, schedules, and customer satisfaction. Low quality leads to cost and schedule overruns and dissatisfied customers.
Multiple Roles Occurring Simultaneously
Many large enterprises have multiple roles going on simultaneously. For example, a major corporation such as AT&T performs all of these roles at the same time:
• They build internal IT software for their own use.
• They build web applications for marketing and customer support.
• They build embedded software for sale or lease to clients.
• They build systems software for sale or lease to clients.
• They commission domestic outsource groups to build software under contract.
• They commission offshore outsource groups to build software under contract.
• They purchase and lease COTS packages.
• They acquire and utilize open source software.
• They offer business services that depend upon software.
This is a very common pattern. Many large corporations build and consume software of multiple types. However, regardless of the pattern, software quality is a critical success factor on both the development and the consumption sides of the equation.
Summary and Conclusions
The topic of software quality has been difficult to define for more than 50 years. The topic of economic value has been difficult to define for more than 150 years. When the two topics are combined into a single book, it is necessary to start by considering all of the alternatives that surround both terms.
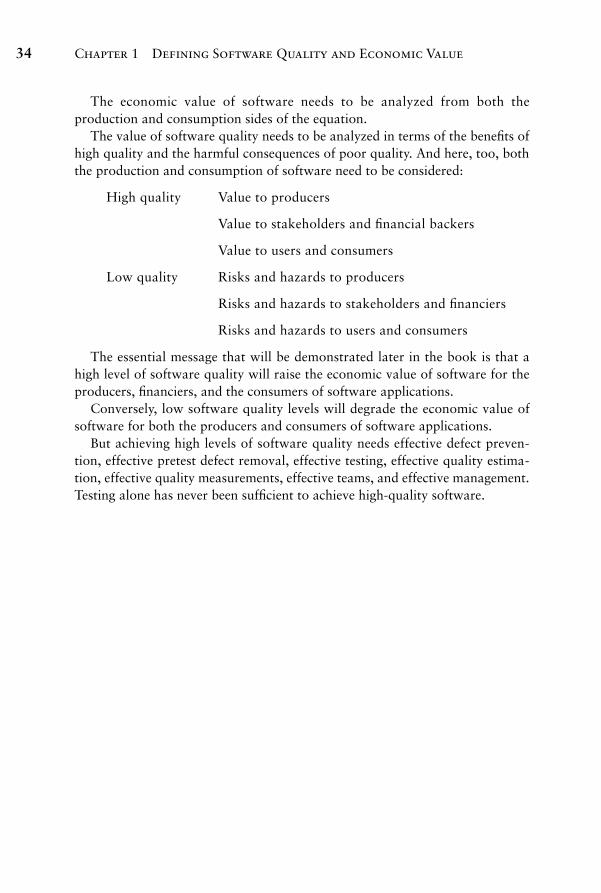
Chapter 1 Defining Software Quality and Economic Value34
The economic value of software needs to be analyzed from both the production and consumption sides of the equation.
The value of software quality needs to be analyzed in terms of the benefits of high quality and the harmful consequences of poor quality. And here, too, both the production and consumption of software need to be considered:
High quality Value to producers
Value to stakeholders and financial backers
Value to users and consumers
Low quality Risks and hazards to producers
Risks and hazards to stakeholders and financiers
Risks and hazards to users and consumers
The essential message that will be demonstrated later in the book is that a high level of software quality will raise the economic value of software for the producers, financiers, and the consumers of software applications.
Conversely, low software quality levels will degrade the economic value of software for both the producers and consumers of software applications.
But achieving high levels of software quality needs effective defect prevention, effective pretest defect removal, effective testing, effective quality estimation, effective quality measurements, effective teams, and effective management. Testing alone has never been sufficient to achieve highquality software.
Index
Ada programming language, 434Aesthetic quality, 11, 15Agile development
antagonisms, 127, 136embedded users, 136at IBM, 257iterations, 136at large companies, 257–258meetings, 223overview, 136sprints, 136, 223stand-ups, 223testing, 317unit test, 285
Aid to the handicapped, 459–460Airbus A380 wiring defects, litigation,
413–414Akao, Yoji, 62Albrecht, Allan, 164–165, 170Algorithmic complexity, 150Algorithms
extracting from code, 167extracting from legacy code, 47requirements, software defect
potentials, 46requirements gathering, 218
Alpha testing, 318Analyzing similar applications, 49Antitrust investigation, IBM, 434APAR (authorized program analysis
report), 371Application resource imbalances, 91–92Applications. See also Embedded
software; Size of applications.components of, 52financial value, requirements
gathering, 219tangible value of, 535–536useful life, 529–535work value of, 219
Applied Software Measurement, 40, 98Appmarq repository, 138, 465–470Architecture
bypassing, 88–90defect prevention, 128–129inspections, pretest defect removal,
204–205software defect potentials, 41
Attributes of software quality. See Software quality, factors; specific attributes.
Authorized program analysis report (APAR), 371
Automated quality predictions, 136–137Automated static analysis of source
code, 267–276Automatic testing
cost and effort, estimating, 338–339estimating test case volume, 333frequency of use, 289overview, 293–294personnel requirements,
estimating, 336stages, 284
Automobile industry, analogy to software industry, 446–447
Automobiles, embedded software, 31Availability, static analysis, 268Average quality projects
economic value of, 16effort, vs. high/low quality projects,
492–494
Babbage, Charles, 434, 454Backfiring, 66–69Bad fixes
litigation, 286–287measuring software quality, 38origin of term, 38
Benchmark groups, 138
561
Benchmarks of software quality dataAppmarq repository, 138, 465–470benchmark groups, 138client reviews of specifications, 237defect prevention, 137–138overview, 137–138
Best practices, 244Beta testing. See Field Beta testing.Bezos, Jeff, 24Black, Rex, 286Black box testing, 291–293Books and publications
Applied Software Measurement, 40, 98
Estimating Software Costs, 40The Mythical Man Month, 227,
247, 380Quality Is Free, 146, 243Software Assessments...and Best
Practices, 40Software Engineering Best
Practices, 40BP drilling bug, 4Breach of contract, litigation, 382–384Brin, Sergey, 24Brooks, Fred, 227, 247, 380Bug fixes
bad, 38, 286–287manpower requirements, 3
Bugs. See Defects; specific bugs.Business agility, economic value of
software quality, 472–473Business data, computer use in the
United States, 2Business losses due to poor quality,
474–475Business productivity, economic
value of software quality, 473–474
Business risks, 181Business rules
extracting from code, 47, 167requirements, software defect
potentials, 46Business topics, requirements
gathering, 219Business value, economic value of
software quality, 470–475Bypassing the architecture, 88–90
C++ vs. CHILL, 105Call center performance, 427Cancellation of projects
10,000 function point size, 3cost, 3, 537–538effort, effects of software quality, 492litigation, 3, 464–465rates, effects of software quality,
490–491reasons for, 492–494timing of, 491
Capability Maturity Model (CMM), 139Capability Maturity Model Integrated
(CMMI), 136, 138–139Capacity testing, 303Capture-recapture method, 264Cars. See Automobiles.CAST
structural quality vs. severe defects, 85–87
study of software quality, 465Certification
effects on economic value of software quality, 478–479
of organizations, 141of professional skills, 140–141of reusable materials, 133
Certification groups, 140–141. See also specific groups.
Certified reusable materials, 132–133Certified reuse combined with patterns,
125–126Change control problems, litigation, 382Changeability, 9CHECKPOINT tool, 106–107CHILL vs. C++, 105Clean room testing, 311–312Client reviews, pretest defect removal
effort and costs, 200per 1,000 function points, 198per 10,000 function points, 204, 206specifications, 235–237
Cloud testing, 313CMM (Capability Maturity Model), 139CMMI (Capability Maturity Model
Integrated), 136, 138–139Cochlear implants, 31, 51Code complexity, 150–151Code counting, 68
Index562
Index 563
Code inspections. See Formal inspections.
Codingconventions for maintainability, 82defect prevention, 129–130
Coding defectsbackfiring, 66–69code counting, 68converting between function points
and logical code statements, 67by language level, 70language levels, 65–67, 70logical code statements vs. physical
lines of code, 67–68overview, 65–71quantifying function point totals, 66software defect potentials, 41source code volume, determining,
67–69summary of, 41
Combinatorial complexity, 150–151, 335
Comments, clarity and completeness, 360Commercial software. See COTS
(commercial off the shelf) software.Communication, economic value of
software, 457–460Compatibility testing. See Platform
testing.Completeness, requirements, 52–55Complex equipment operations,
economic value of software, 455–456
Complexityalgorithmic, 150code, 150–151combinatorial, 150–151computational, 151cyclomatic, 149–150, 155data, 151defect prevention, 149–155diagnostic, 151entropic, 151essential, 151–152fan, 152flow, 152function point, 152graph, 152Halstead, 152
information, 152–153logical, 153mnemonic, 153most significant to software quality,
154–155organizational, 153perceptional, 153problem, 153process, 154root causes, 155semantic, 154syntactic, 154topologic, 154
Component testing. See New function testing.
Computational complexity, 151Computer gaming, testing stages, 327Computer use in the United States
business data, 2military data, 2by occupation, 6overview (2010), 2–3personal data, 2personal use circa 2011, 5
Conformance to requirements, software defect potentials, 45
Consumerist website, 409Contact method, 225Contract revenue, 450Control flow
requirements, software defect potentials, 47
requirements gathering, 219COQ (Cost of Quality)
defect prevention, 146–148economic value of software quality,
523–529requirements gathering, 219
COS (cost of security), 415Cost drivers, function point metrics,
168–169Cost reductions, economic value of
softwareaid to the handicapped, 459–460communication, 457–460data collection and analysis, 456–457email, 459high-frequency recurring
calculations, 455
Index564
by quality level, 4requirements, software defect
potentials, 47requirements gathering, 218security flaws, 414–415software enhancements, 515–516testing, estimating, 337–342
COTS (commercial off the shelf) software
requirements, 55testing stages, 327–328
COTS (commercial off the shelf) software users
defining value of software quality, 26–28
economic consequences of low quality, 27–28
examples of, 27history of, 26–27number of, 2011, 26open-source competition, 27value of high quality, 27
COTS (commercial off the shelf) software vendors
defining value of software quality, 24–26
economic consequences of low quality, 25–26
examples of, 25history of, 24–25litigation against, 381–384value of high quality, 25
Counting rules, 167Critical violations, 352–358, 466Crosby, Phil, 146, 243Cullinane, 434Curtis, Bill, 139, 231, 470Custom software development. See
Internal software development.Customer defect reports, IBM studies,
404–409Customer satisfaction
economic value of software quality, 474
IBM studies of, 302, 390SQA (software quality assurance)
measurement, 245Cyber attacks, increase from
2008 to 2009, 7
Cost reductions, economic value of software (cont.)
in manual effort, 455operating complex equipment,
455–456overview, 454–455social networks, 460training programs, 457
Cost-per-defect metric. See also Metrics.abeyant defects, 366vs. cost per function point, 143–145defect prevention, 142–145economic analysis, 96–97, 110–115flaws, 96–97, 110–115good quality product, 111–114invalid defect reports, 364penalty for quality, 142–145poor quality product, 111quality vs. cost per defect, 112–115used by IBM, 110zero defect product, 114–115
Costscanceled projects, effects of software
quality, 3, 537–538software development, economic value
of software quality, 487–489tracking, 97–104
Costs, of software quality. See also Economic value of software quality.
certification of reusable materials, 133client reviews, pretest defect
removal, 200COQ (Cost of Quality), 415COS (cost of security), 415desk checking, pretest defect
removal, 200function point analysis, 138litigation, 384, 391maintenance and support, 511–513maintenance of error-prone modules,
407–408manpower for bug fixes, 3–4per function point, 3post-release defect repairs, 37–38,
388–392, 424–425post-release defects, 409–414by program size, 4project cancellation, 3
Index 565
design, 129requirements, 128test cases, 130test plans, 130user documentation, 131websites, 131–132
Defect prevention, estimatingbelow average methods, 73definition, 71effective methods, 72–73harmful methods, 73IBM historical data, 72methods for, 72–73neutral methods, 73required data points, 71–72
Defect prevention, formal inspectionscombined with formal testing, 121defect removal, 121–122effects of, 120–121quantifying results, 122
Defect prevention, methodologies. See also Defect prevention, results analysis.
antagonistic methods, 126–127certified reuse combined with patterns,
125–126embedded software, 126harmful combinations, 127IBM, 122increasing defect potentials, 127large business applications, 126military and defense software, 126relative efficiency, 123–125small business applications, 126synergistic combinations, 125–127technical software, 126
Defect prevention, results analysis. See also Defect prevention, methodologies.
Agile embedded users, 136automated quality predictions,
136–137benchmarks of software quality data,
137–138certification of organizations, 141certification of professional skills,
140–141CMMI (Capability Maturity Model
Integrated), 138–139
Cyclomatic complexityIBM studies of, 298, 321maintainability of software, 359measuring, 149–150root causes, 155
Data collection and analysis, economic value of software, 456–457
Data complexity, 151Data mining, function point metrics, 167Data types, 2Databases
defect prevention, 131software defect potentials, 42
DDE (defect detection efficiency)current U.S. average, 38vs. DRE, 38, 75economic value of software
quality, 504IBM efficiency studies, 74–76measuring software quality, 38
Defect preventionby application size, 133–135certified reusable materials, 132–133definition, 37efficiency levels, 120formal testing, effects of, 121IBM historical data, 72IBM studies of, 119–125measuring software quality, 37negative results of, 122origin of term, 37patterns, 132–133test coverage, 120
Defect prevention, defect originsarchitecture, 128–129coding, 129–130databases, 131design, 129requirements, 128test cases, 130test plans, 130user documentation, 131websites, 131–132
Defect prevention, defect potentials. See also Software defect potentials.
architecture, 128–129coding, 129–130databases, 131
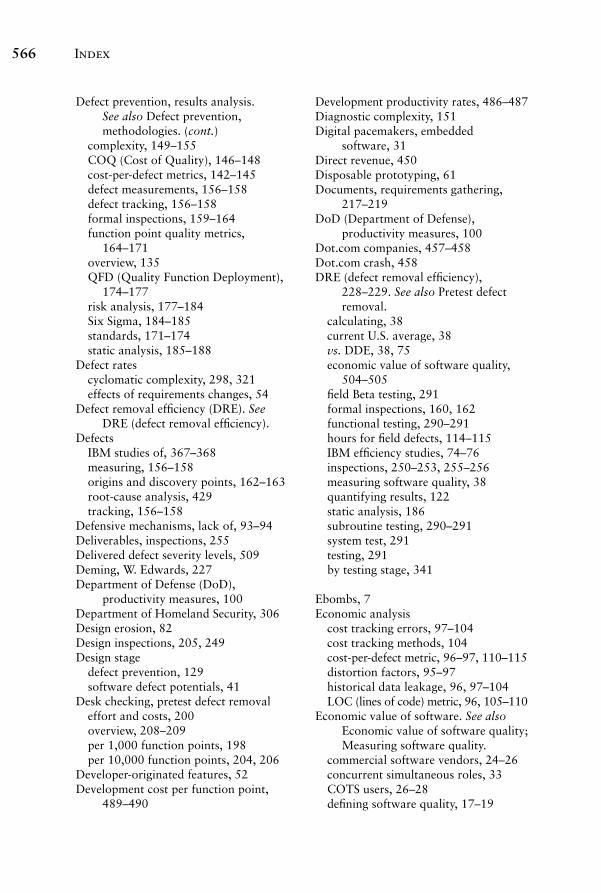
Index566
Development productivity rates, 486–487Diagnostic complexity, 151Digital pacemakers, embedded
software, 31Direct revenue, 450Disposable prototyping, 61Documents, requirements gathering,
217–219DoD (Department of Defense),
productivity measures, 100Dot.com companies, 457–458Dot.com crash, 458DRE (defect removal efficiency),
228–229. See also Pretest defect removal.
calculating, 38current U.S. average, 38vs. DDE, 38, 75economic value of software quality,
504–505field Beta testing, 291formal inspections, 160, 162functional testing, 290–291hours for field defects, 114–115IBM efficiency studies, 74–76inspections, 250–253, 255–256measuring software quality, 38quantifying results, 122static analysis, 186subroutine testing, 290–291system test, 291testing, 291by testing stage, 341
Ebombs, 7Economic analysis
cost tracking errors, 97–104cost tracking methods, 104cost-per-defect metric, 96–97, 110–115distortion factors, 95–97historical data leakage, 96, 97–104LOC (lines of code) metric, 96, 105–110
Economic value of software. See also Economic value of software quality; Measuring software quality.
commercial software vendors, 24–26concurrent simultaneous roles, 33COTS users, 26–28defining software quality, 17–19
Defect prevention, results analysis. See also Defect prevention, methodologies. (cont.)
complexity, 149–155COQ (Cost of Quality), 146–148cost-per-defect metrics, 142–145defect measurements, 156–158defect tracking, 156–158formal inspections, 159–164function point quality metrics,
164–171overview, 135QFD (Quality Function Deployment),
174–177risk analysis, 177–184Six Sigma, 184–185standards, 171–174static analysis, 185–188
Defect ratescyclomatic complexity, 298, 321effects of requirements changes, 54
Defect removal efficiency (DRE). See DRE (defect removal efficiency).
DefectsIBM studies of, 367–368measuring, 156–158origins and discovery points, 162–163root-cause analysis, 429tracking, 156–158
Defensive mechanisms, lack of, 93–94Deliverables, inspections, 255Delivered defect severity levels, 509Deming, W. Edwards, 227Department of Defense (DoD),
productivity measures, 100Department of Homeland Security, 306Design erosion, 82Design inspections, 205, 249Design stage
defect prevention, 129software defect potentials, 41
Desk checking, pretest defect removaleffort and costs, 200overview, 208–209per 1,000 function points, 198per 10,000 function points, 204, 206
Developer-originated features, 52Development cost per function point,
489–490
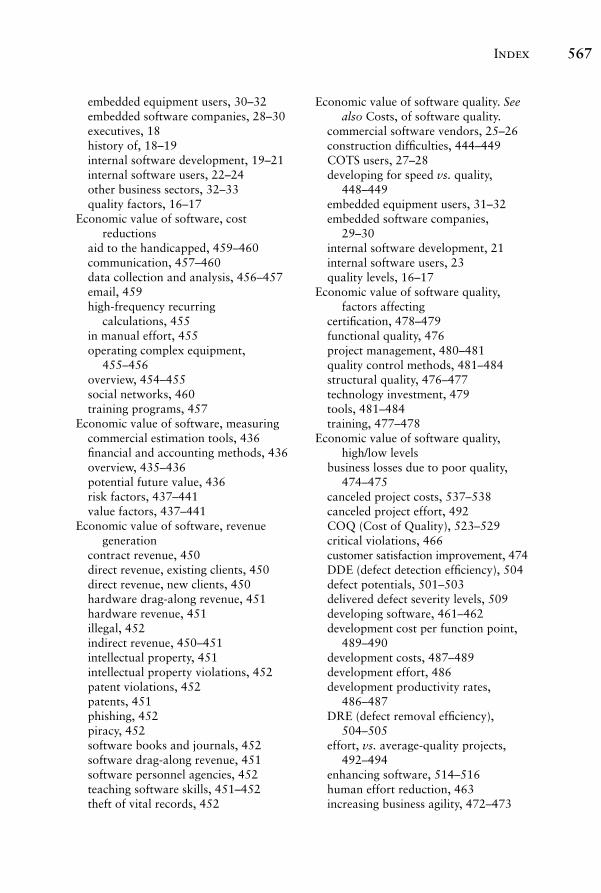
Index 567
Economic value of software quality. See also Costs, of software quality.
commercial software vendors, 25–26construction difficulties, 444–449COTS users, 27–28developing for speed vs. quality,
448–449embedded equipment users, 31–32embedded software companies,
29–30internal software development, 21internal software users, 23quality levels, 16–17
Economic value of software quality, factors affecting
certification, 478–479functional quality, 476project management, 480–481quality control methods, 481–484structural quality, 476–477technology investment, 479tools, 481–484training, 477–478
Economic value of software quality, high/low levels
business losses due to poor quality, 474–475
canceled project costs, 537–538canceled project effort, 492COQ (Cost of Quality), 523–529critical violations, 466customer satisfaction improvement, 474DDE (defect detection efficiency), 504defect potentials, 501–503delivered defect severity levels, 509developing software, 461–462development cost per function point,
489–490development costs, 487–489development effort, 486development productivity rates,
486–487DRE (defect removal efficiency),
504–505effort, vs. average-quality projects,
492–494enhancing software, 514–516human effort reduction, 463increasing business agility, 472–473
embedded equipment users, 30–32embedded software companies, 28–30executives, 18history of, 18–19internal software development, 19–21internal software users, 22–24other business sectors, 32–33quality factors, 16–17
Economic value of software, cost reductions
aid to the handicapped, 459–460communication, 457–460data collection and analysis, 456–457email, 459high-frequency recurring
calculations, 455in manual effort, 455operating complex equipment,
455–456overview, 454–455social networks, 460training programs, 457
Economic value of software, measuringcommercial estimation tools, 436financial and accounting methods, 436overview, 435–436potential future value, 436risk factors, 437–441value factors, 437–441
Economic value of software, revenue generation
contract revenue, 450direct revenue, existing clients, 450direct revenue, new clients, 450hardware drag-along revenue, 451hardware revenue, 451illegal, 452indirect revenue, 450–451intellectual property, 451intellectual property violations, 452patent violations, 452patents, 451phishing, 452piracy, 452software books and journals, 452software drag-along revenue, 451software personnel agencies, 452teaching software skills, 451–452theft of vital records, 452
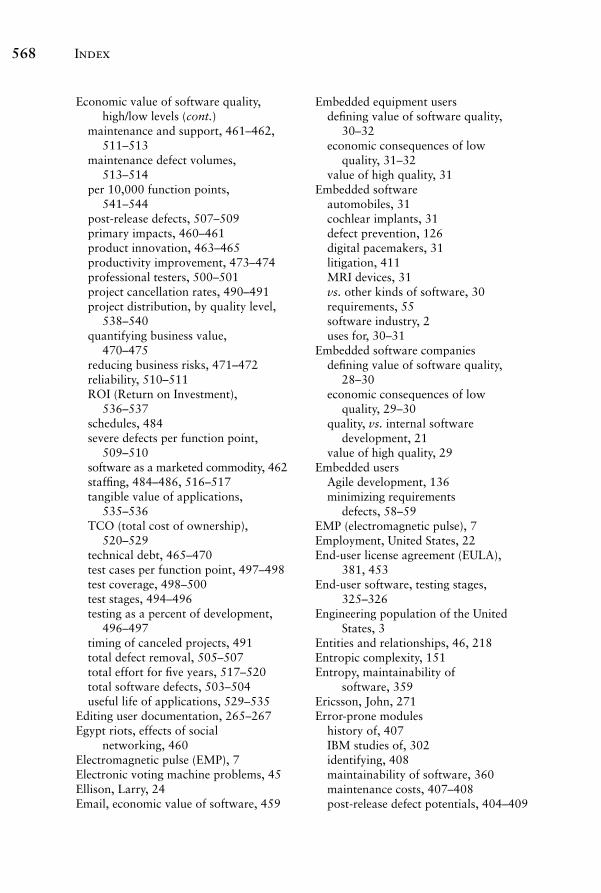
Index568
Embedded equipment usersdefining value of software quality,
30–32economic consequences of low
quality, 31–32value of high quality, 31
Embedded softwareautomobiles, 31cochlear implants, 31defect prevention, 126digital pacemakers, 31litigation, 411MRI devices, 31vs. other kinds of software, 30requirements, 55software industry, 2uses for, 30–31
Embedded software companiesdefining value of software quality,
28–30economic consequences of low
quality, 29–30quality, vs. internal software
development, 21value of high quality, 29
Embedded usersAgile development, 136minimizing requirements
defects, 58–59EMP (electromagnetic pulse), 7Employment, United States, 22End-user license agreement (EULA),
381, 453End-user software, testing stages,
325–326Engineering population of the United
States, 3Entities and relationships, 46, 218Entropic complexity, 151Entropy, maintainability of
software, 359Ericsson, John, 271Error-prone modules
history of, 407IBM studies of, 302identifying, 408maintainability of software, 360maintenance costs, 407–408post-release defect potentials, 404–409
Economic value of software quality, high/low levels (cont.)
maintenance and support, 461–462, 511–513
maintenance defect volumes, 513–514
per 10,000 function points, 541–544
post-release defects, 507–509primary impacts, 460–461product innovation, 463–465productivity improvement, 473–474professional testers, 500–501project cancellation rates, 490–491project distribution, by quality level,
538–540quantifying business value,
470–475reducing business risks, 471–472reliability, 510–511ROI (Return on Investment),
536–537schedules, 484severe defects per function point,
509–510software as a marketed commodity, 462staffing, 484–486, 516–517tangible value of applications,
535–536TCO (total cost of ownership),
520–529technical debt, 465–470test cases per function point, 497–498test coverage, 498–500test stages, 494–496testing as a percent of development,
496–497timing of canceled projects, 491total defect removal, 505–507total effort for five years, 517–520total software defects, 503–504useful life of applications, 529–535
Editing user documentation, 265–267Egypt riots, effects of social
networking, 460Electromagnetic pulse (EMP), 7Electronic voting machine problems, 45Ellison, Larry, 24Email, economic value of software, 459
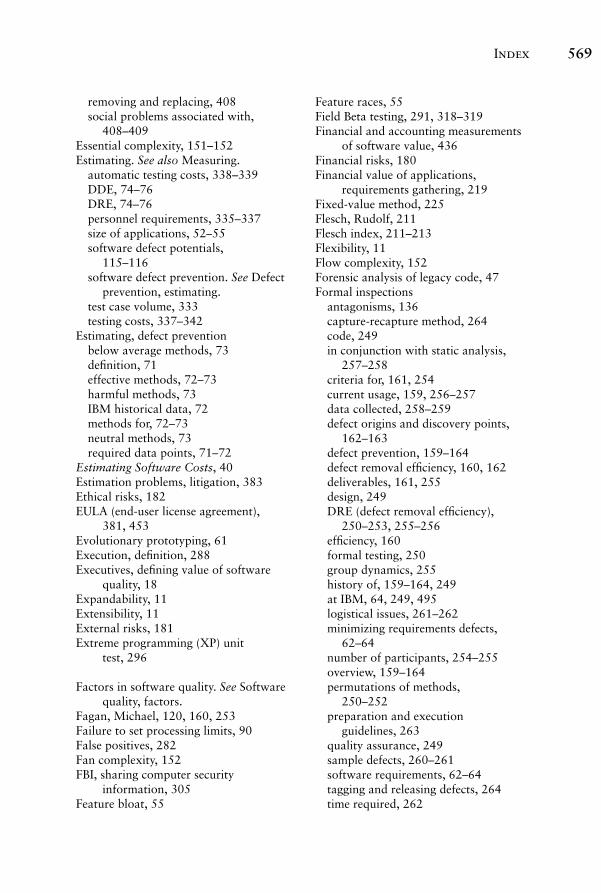
Index 569
Feature races, 55Field Beta testing, 291, 318–319Financial and accounting measurements
of software value, 436Financial risks, 180Financial value of applications,
requirements gathering, 219Fixed-value method, 225Flesch, Rudolf, 211Flesch index, 211–213Flexibility, 11Flow complexity, 152Forensic analysis of legacy code, 47Formal inspections
antagonisms, 136capture-recapture method, 264code, 249in conjunction with static analysis,
257–258criteria for, 161, 254current usage, 159, 256–257data collected, 258–259defect origins and discovery points,
162–163defect prevention, 159–164defect removal efficiency, 160, 162deliverables, 161, 255design, 249DRE (defect removal efficiency),
250–253, 255–256efficiency, 160formal testing, 250group dynamics, 255history of, 159–164, 249at IBM, 64, 249, 495logistical issues, 261–262minimizing requirements defects,
62–64number of participants, 254–255overview, 159–164permutations of methods,
250–252preparation and execution
guidelines, 263quality assurance, 249sample defects, 260–261software requirements, 62–64tagging and releasing defects, 264time required, 262
removing and replacing, 408social problems associated with,
408–409Essential complexity, 151–152Estimating. See also Measuring.
automatic testing costs, 338–339DDE, 74–76DRE, 74–76personnel requirements, 335–337size of applications, 52–55software defect potentials,
115–116software defect prevention. See Defect
prevention, estimating.test case volume, 333testing costs, 337–342
Estimating, defect preventionbelow average methods, 73definition, 71effective methods, 72–73harmful methods, 73IBM historical data, 72methods for, 72–73neutral methods, 73required data points, 71–72
Estimating Software Costs, 40Estimation problems, litigation, 383Ethical risks, 182EULA (end-user license agreement),
381, 453Evolutionary prototyping, 61Execution, definition, 288Executives, defining value of software
quality, 18Expandability, 11Extensibility, 11External risks, 181Extreme programming (XP) unit
test, 296
Factors in software quality. See Software quality, factors.
Fagan, Michael, 120, 160, 253Failure to set processing limits, 90False positives, 282Fan complexity, 152FBI, sharing computer security
information, 305Feature bloat, 55
Index570
Functional quality, 268, 476Functional testing, 290–291, 293Funding projects, 437–444
Gack, Gary, 253, 322Gamma testing, 318Gates, Bill, 24Geneen, Harold, 243General testing
cost and effort, estimating, 338estimating test case volume, 333forms of, 294–302. See also specific
forms.frequency of use, 289overview, 283–284personnel requirements, estimating, 336
Gilb, Tom, 160, 253–254Glass box testing. See White box
testing.Grade-level readability scores, 212Graph complexity, 152Growth
handling over time, 48–49rate vs. schedules, 53
Gunning, Robert, 212Gunning Fog index, 212–213
Halstead, Maurice, 152Halstead complexity, 152Hamer-Hodges, Ken, 306Handicapped aids, 459–460Hardware drag-along revenue, 451Hardware platforms
requirements, software defect potentials, 47
requirements gathering, 218Hardware revenue, 451Health risks, 178Hewlett Packard’s algorithm for
replacing ink cartridges, 409–410High quality, value of. See also
Economic value of software quality, high/low levels.
commercial software vendors, 25COTS users, 27embedded equipment users, 31embedded software companies, 29internal software development,
22–23
Formal inspections, defect preventioncombined with formal testing, 121defect removal, 121–122effects of, 120–121quantifying results, 122
Formal testing, 250Freezing requirements changes, 54Frequency distribution, customer-
reported defects, 302Function points
analysis, cost, 138complexity, 152converting between logical code
statements, 67cost of software, 3cost-per-defect metrics, 143–145largest known projects, 444personnel requirements, estimating,
335–337quantifying totals, 66software defect potentials by, 43test case volume, estimating, 332–335testing, estimating cost and effort,
337–342Function points, quality metrics
adjustment factors, 166–167algorithms, extracting from code, 167benchmark groups, 138business rules, extracting from
code, 167cost drivers, 168–169counting rules, 167current average defect levels, 170data mining, 167defect prevention, 164–171developed by IBM, 66history of, 165inputs, 165inquiries, 165interfaces, 165language levels, 167–168LOC (lines of code) metric, 169logical files, 165outputs, 165overview, 164–171SLOC (source lines of code), 167sociological factors, 170software defect potentials, 39uses for, 169
Index 571
defect root-cause analysis, 429distribution of customer defect
reports, 404–409DRE efficiency, 74–76error-prone modules, 302frequency distribution, customer-
reported defects, 302low-quality effects on productivity
and schedules, 295MVS customers, 390pretest inspections, 484software maintainability,
358–362technical manuals, user opinions of,
266–267test coverage, 321, 499–500testing, effects on schedules, 484training, productivity benefits,
477–478IEEE standards
829-2008: software test documentation, 321
1012-2004: software verification and validation, 321
IFPUG (International Function Point Users Group), 46, 165
Illegal revenue from software, 452Improvability, 11Independent testing, 314–315Independent verification and
validation (IV&V), 205, 237–239
Indirect revenue, 450–451Informal peer reviews, 209–210Information complexity, 152–153Information systems defects, litigation,
411–412Information Technology (IT), testing
stages, 326Inputs
function point metrics, 165requirements, software defect
potentials, 45requirements gathering, 217
Inquiries, function point metrics, 165Inquiry types
requirements, software defect potentials, 46
requirements gathering, 218
Historical data leakage, 96, 97–104Hollerith, Herman, 454House of quality, 62Human effort reduction, economic value
of software quality, 463Humphrey, Watts, 139, 295Hunter, Justin, 322
IBMAgile development, 257antitrust investigation, 434APAR (authorized program analysis
report), 371bad fixes, origin of, 38bypassing requirements, 52capture-recapture method, 264clean room testing, 311–312cost-per-defect metric, 110defect prevention, 37, 72, 122formal inspections, 62–64, 159, 249function point quality metrics,
66, 165JAD (joint application design), 58key defect potentials, 37latent defects, 74–76, 347–348maintenance, definition, 511open door policy, 481phase reviews, 247–248PTM (program trouble
memorandum), 371quantifying language levels, 65–66release numbering, 74–76severity levels, 281–282SQA (software quality
assurance), 244technical writers, compensation, 266unbundling software applications, 434usability testing, 317–318
IBM studies ofcode inspections, and test
schedules, 495customer satisfaction, 302, 390DDE efficiency, 74–76defect data, 367–368defect prevention, 119–125defect rates and cyclomatic
complexity, 298, 321defect repair hours for field defects,
114–115
Index572
Kinkaid, J. Peter, 211KLOC (thousand lines of code),
465–470. See also LOC (lines of code) metric.
Knowledge risks, 182–183Kohli, Bob, 253
Lab testing, 319–320Lack of defensive mechanisms, 93–94Langevin, James, 306Language levels
coding defects by, 70description, 65–66examples, 67function point metrics, 167–168origin of, 65
Languageslife expectancy, 256maintainability of software, 360–361supported by static analysis, 186–187,
272–275Large business applications, defect
prevention, 126Latency, static analysis, 268Latent defects
causes, 348definition, 347discovery by users, 362–363IBM, 74–76, 347–348
Lawsuits. See Litigation.Layered approach to measuring software
quality, 77Legal quality, 11, 15Legal risks, 179Lines of code (LOC) metric. See LOC
(lines of code) metric.Lint tool, 267–268Litigation
Airbus A380 wiring defects, 413–414bad fixes, 286–287barriers to, 381breach of contract, 3, 382–384cancellation of projects, 3, 464–465change control problems, 382client reviews of specifications, 235against commercial software vendors,
381–384costs, 384, 391embedded software, 411
Inspections. See Formal inspections.Installation requirements, 47, 219Integration testing, 300, 325Intellectual property, 451Intellectual property violations, 452Interfaces
function point metrics, 165requirements, software defect
potentials, 46requirements gathering, 218
Internal software developmentdefining value of software quality,
19–21economic consequences of low
quality, 21examples, 19history of, 19–21purposes of, 20quality, vs. embedded software
community, 21value of high quality, 22–23
Internal software userscommon internal software types, 22defining value of software quality,
22–24economic consequences of low
quality, 23employment figures, United States
mid-2010, 22number of, 2011, 22
Invalid defects, 282ISBSG (International Software
Benchmark Standards Group), 138, 370
IT (Information Technology), testing stages, 326
Iterations, 136IV&V (independent verification and
validation), 205, 237–239
Jacobsen, Ivar, 59JAD (joint application design), 58Japan vs. United States. See United States
vs. Japan.Jobs, Steve, 24Juran, Joseph, 146, 227
Kaizen, 226–231King, Ada, 434
Index 573
embedded equipment users, 31–32embedded software companies,
29–30internal software development, 21internal software users, 23on productivity and schedules, 295
MacAfee antivirus bug, 4Maintainability of software. See also
Post-release defects.comments, clarity and
completeness, 360cyclomatic complexity, 359design erosion, 82entropy, 359error-prone modules, 360IBM study, 358–362maintenance assignment scope,
358–359maintenance tools and
workbenches, 360maintenance workloads, 360measuring, 81–82metrics, 358–359naming and coding conventions, 82positive influences, 359–361programming languages, 360–361rate of structural decay, 359static analysis, 270structural diagrams, 360time requirements, 82training for, 359
Maintenance and supportassignment scope, 358–359call center performance, 427costs of software quality, 511–513defect repair effort by activity, 429defect repair schedule ranges,
428–429defect repairs per month, 428defect root-cause analysis, 429economic value of software quality,
461–462, 511–513incoming defect reports per client, 428incoming defect reports per month,
427–428maintenance, IBM definition, 511maintenance assignment scope, 427measurement issues, 425–431
end-user license agreements, 381estimate problems, 383examples, 410–412Hewlett Packard’s algorithm for
replacing ink cartridges, 409–410IBM antitrust investigation, 434inaccurate status checking, 383–384information systems defects, 411–412military and defense software, 411most common charges, 382–384outsourcing, 3provability, 10quality control problems, 382readability of legal documents
(Florida), 212settling out of court, 391SQA measurement data, 245testing stages noted in, 331–332Therac-25 radiation therapy device,
412–413time required, 391Verizon billing algorithms, 410web defects, 411–412
Litigation testing, 312LOC (lines of code) metric
case study, CHILL vs. C++, 105–109economic problems, 105–110flaws, 96, 105–109function point metrics, 169KLOC (thousand lines of code),
465–470as professional malpractice, 105, 109shortcomings, 39SLOC (source lines of code), 167
Localization testing, 315Logic bombs, 81Logical code statements vs. physical lines
of code, 67–68Logical complexity, 153Logical files
function point metrics, 165requirements, software defect
potentials, 46requirements gathering, 218
Low quality, economic consequences of. See also Economic value of software quality, high/low levels.
commercial software vendors, 25–26COTS users, 27–28
Index574
pretest defect removal, 37software defect potentials, 37test defect removal, 37
Meetings, Agile development, 223Metrics. See also Measuring.
data mining, 167function point cost drivers, 168–169function point quality, 164–171KLOC (thousand lines of code),
465–470LOC (lines of code), 96, 105–110maintainability of software,
358–359Metrics, cost-per-defect
abeyant defects, 366vs. cost per function point, 143–145defect prevention, 142–145economic analysis, 96–97, 110–115flaws, 96–97, 110–115function point counting rules, 167good quality product, 111–114invalid defect reports, 364penalty for quality, 142–145poor quality product, 111quality vs. cost per defect, 112–115used by IBM, 110zero defect product, 114–115
Metrics, function point qualityadjustment factors, 166–167algorithms, extracting from code, 167benchmark groups, 138business rules, extracting from code, 167cost drivers, 168–169counting rules, 167current average defect levels, 170data mining, 167defect prevention, 164–171developed by IBM, 66history of, 165inputs, 165inquiries, 165interfaces, 165language levels, 167–168LOC (lines of code) metric, 169logical files, 165outputs, 165overview, 164–171SLOC (source lines of code), 167sociological factors, 170
Maintenance and support (cont.)planning, 374–375post-release defect repair metrics,
427–429profiting from, 375–376staffing, 516–517support ratios, 375tools and workbenches, 360types of maintenance work, 426–427workloads, 360
Maintenance assignment scope, 427Maintenance defect volumes, economic
value of software quality, 513–514Major tasks. See Use cases.Management information system (MIS),
testing stages, 326Manpower for bug fixes, 3–4Manual effort, economic value of
software, 455Manual testing, 293–294McCabe, Tom, 151–152Measurability, definition, 10Measurable software attributes, 77Measurement issues, maintenance,
425–431Measuring. See also Metrics.
maintainability, 81–82security, 80–81
Measuring economic value of softwarecommercial estimation tools, 436financial and accounting methods, 436overview, 435–436potential future value, 436risk factors, 437–441value factors, 437–441
Measuring software quality. See also Economic value of software quality; Metrics; specific topics.
bad fixes, 38DDE (defect detection efficiency), 38defect prevention, 37DRE (defect removal efficiency), 38key topics, 36–37layered approach, 77measurable software attributes, 77.
See also specific attributes.post-release defect removal costs, 38post-release defects, 38pre-release defect removal costs, 37
Index 575
Pacemakers, embedded software, 31Page, Larry, 24Pair programming, 231–234Patent violations, 452Patents, 451Patterns
defect prevention, 132–133static analysis, 275–276
PBX project case study, 105–109Peer reviews, 209–210Peer reviews, pretest defect removal
effort and costs, 201per 1,000 function points, 198
Penetration teams, 309Penetration testing, 308–309Perceptional complexity, 153Performance by Design, 80Performance criteria
requirements, software defect potentials, 47
requirements gathering, 219Performance efficiency
measuring, 79–80Performance by Design, 80static analysis, 269–270
Performance testing, 304Personal computer use, United States
circa 2011, 5Personal data, United States
distribution of, 2organizations tracking, 7
Personal desk checking. See Desk checking.
Phase reviews, 246–248Phases, software development, 246–248Phishing, 452Physical lines of code vs. logical code
statements, 67–68Piracy, 452Platform testing, 310Poka yoke
contact method, 225corrective procedures, 225–226fixed-value method, 225motion sequence method, 225–226name origin, 224pretest defect removal, 224–226
Poppendieck, Tom, 227Population of the United States, 2–3
software defect potentials, 39uses for, 169
Military and defense softwaredefect prevention, 126DoD productivity measures, 100independent testing, 314–315litigation, 411standards, 139testing stages, 329
Military data, computer use in the United States, 2
Mills, Harlan, 312MIS (management information system),
testing stages, 326Mizuno, Shigeru, 62Mnemonic complexity, 153Moral elements of software quality, 17Mortgage record misplacement, 454Motion sequence method, 225–226MRI devices, embedded software, 31Multi-platform environments,
requirements generation and analysis, 49
MVS customers, IBM studies of, 390Mythical Man Month, The, 227,
247, 380
Naming conventions, maintainability, 82Nationalization, 49, 315New function testing, 297–298, 325Nonaka, Ikuro, 222Nonfunctional quality, static
analysis, 268Nonfunctional testing, 293
Occupation groups, computer use, 6Open door policy, IBM, 481Open source software development
competition for COTS, 27testing stages, 327
Organizational complexity, 153Outputs
function point metrics, 165requirements, software defect
potentials, 45requirements gathering, 217
Outsource vendors, testing stages, 327Outsourcing, breach of contract
litigation, 3
Index576
commercial software, 377–378customer logistics, 416–425defect context information, 372distribution of effort, large
application, 421–423distribution of effort, small
application, 418–419effort, by severity level, 423–424embedded software, 377FAQs (frequently asked
questions), 378internal software, 376key issues, 424maintenance information, 372–373military and defense software, 377open source software, 377outsource software, 376–377per client, 428per month, 427–428proprietary information, 373–374PTM (program trouble
memorandum), 371public information, 371–372SaaS (Software as a Service), 376Severity 2 defects, 416–417
Post-release defect severity levelscritical violations, 352–358IBM method, 349–351rule checkers, 352static analysis, 352structural quality perspective,
351–358Post-release defects. See also
Maintainability of software.abeyant defects, 365–366across multiple releases, 370costs, 409–414DDE, measuring, 368–370DRE, measuring, 368–370duplicate reports, 366–367economic value of software quality,
507–509factors influencing, 348–349in first 90 days of use, 350first-year discovery rates, 367–368invalid defect reports, 363–365orthogonal defect reporting, 349–350as possible enhancements, 350security flaws, 414–415
Post-release defect potentials. See also Software defect potentials.
defects found in first year of use, 400, 402–403
delivered defects, by project type and size, 398–399
delivered defects, per function point, 399
DRE, by project type and size, 397error-prone modules, 404–409by project type and size, 395–396Severity 1 and 2, first year of use,
405–406Post-release defect repairs
call center performance, 427case studies, 379–381costs, 388–392, 424–425customer logistics, 416–425defect repair effort by activity, 429defect repair schedule ranges,
428–429defect repairs per month, 428defect root-cause analysis, 429effort by activity, 429incidents per month, 428incoming defect reports per
client, 428incoming defect reports per month,
427–428large applications, 389–392maintenance assignment scope, 427major variables, 392measurement issues, 425–431measuring software quality, 38medium applications, 388metrics, 427–429personnel for, 378–381, 385–392post-release defect repair metrics,
427–429schedule ranges, 428–429small applications, 387–388software occupation groups involved,
385–392types of maintenance work, 426–427variables affecting, 424–425
Post-release defect reportsAPAR (authorized program analysis
report), 371cloud software, 376
Index 577
phase reviews, 246–248poka yoke, 224–226proof reading user documentation,
265–267proofs of correctness, 220–222readability of text documents, 211–219scrums, 222–224small projects, 198SQA reviews, 239–246
Pretest inspections, 484Principle of least authority, 306Priven, Lew, 120, 253–254Problem complexity, 153Process complexity, 154Process quality, 11–14Processing limits, failure to set, 90Product innovation, economic value of
software quality, 463–465Productivity
DoD measures, 100economic value of software quality,
473–474effects of low quality, 295effects of training, 477–478rates, developing, 486–487
Productivity, economic value of software quality, 473–474
Professional testers, economic value of software quality, 500–501
Program trouble memorandum (PTM), 371
Programming languages. See Languages.Programs. See Applications.Project cancellation. See Cancellation
of projects.Project distribution, by quality level,
538–540Project management, effects on
economic value of software quality, 480–481
Proof reading user documentation, 265–267
Proofs of correctness, 220–222Prototyping
appropriate use of, 61disposable, 61evolutionary, 61minimizing requirements defects, 60–61time-box, 61
service pack repairs, 349undocumented features, 364–365valid unique defects, 370
Potential defects. See Defect prevention, defect potentials; Post-release defect potentials; Requirements, software defect potentials; Software defect potentials.
Potential future value, economic value of software, 436
Predetermined criteria, 289Predictability, 10Predicting. See Estimating.Pretest defect removal. See also DRE
(defect removal efficiency).measuring software quality, 37overview, 191–196United States vs. Japan, 227–231
Pretest defect removal, large projectsdefect potentials per 10,000 function
points, 202–203high-quality vs. low-quality, 204–207removal methods, 203, 204–205, 207.
See also specific methods.vs. small projects, 201–202
Pretest defect removal, small projectsdefect potentials, by function points,
196–197effort and costs, 199–202overview, 196–197problems, 199removal methods, 198. See also
specific methods.Pretest defect removal methods. See also
Formal inspections; specific methods.
automated static analysis of source code, 267–276
automated text checking for documents, 211–219
client reviews of specifications, 235–237desk checking, 208–209editing user documentation, 265–267informal peer reviews, 209–210IV&V (independent verification and
validation), 237–239Kaizen, 226–231large projects, 203–207pair programming, 231–234
Index578
Regression testingdistribution in U.S. software
projects, 325DRE (defect removal efficiency), 291overview, 299
Release numbering, IBM system for, 74–76
Reliabilityeconomic value of software quality,
510–511measuring, 78–79static analysis, 269of testing, 44
Reporting defects. See also Post-release defect reports.
APAR (authorized program analysis report), 371
customer defect reports, IBM studies, 404–409
PTM (program trouble memorandum), 371
SOAR (Software Security State of the Art Report), 306
Requirementsambiguity, 51–52bypassing, 52changingdefect rates, 54for commercial software, 55completeness, 52–55components of, 52defect prevention, 128defect rates, 54deliverables, 63developer-originated features, 52for embedded applications, 55feature bloat, 55feature races, 55freezing, 54for individual inventors, 55inspections, pretest defect removal, 204origins of, 50–52requirements creep, 59schedules vs. growth rate, 53size, 52–55software defect potentials, 40standard outline, 56–58structure, 52–55values of, 50–52
Provability, 10PSP/TSP unit test, 295–296PTM (program trouble memorandum), 371
QFD (Quality Function Deployment)defect prevention, 174–177DRE (defect removal efficiency), 176minimizing requirements
defects, 62overview, 174–177
Quality. See Software quality.Quality assurance inspections, 249Quality circles, 230Quality control methods, effects on
economic value of software quality, 481–484
Quality control problems, litigation, 382
Quality Is Free, 146, 243Quality levels. See also High quality;
Low quality.costs by, 4requirements, software defect
potentials, 47requirements gathering, 218
Quality risks, 178–179Quantifying. See also Measuring.
business value, 470–475DRE (defect removal efficiency), 122function point totals, 66language levels, 65–66results of formal inspections, 122software defect potentials, 39
Quantitative data, 279–282
Radice, Ron, 120, 253Rational Unified Process (RUP),
antagonisms, 127, 136Readability of legal documents
(Florida), 212Readability of text documents
automated checking, 211–219Flesch index, 211–213grade-level scores, 212Gunning Fog index, 212–213patterns of taxonomy, 216–217requirements gathering topics,
217–219standard taxonomies, 213–216
Index 579
conformance to requirements, 45control flow, 47costs, 47current U.S. average, 45electronic voting machine
problems, 45entities and relationships, 46gathering process, 45–47hardware platforms, 47inputs, 45inquiry types, 46installation requirements, 47interfaces, 46logical files, 46major tasks, 47. See also Use cases.outputs, 45performance criteria, 47quality levels, 47reuse criteria, 47schedules, 46security criteria, 47software platforms, 47summary of, 40toxic requirements, 45training requirements, 47use cases, 47Y2K problem, 45
Requirements creep, 59Requirements generation and analysis
tool, features and functionsalgorithms, extracting from legacy
code, 47analyzing similar applications, 49automatic application sizing, 48automatic test case definition, 48business rules, extracting from legacy
code, 47dynamic aspects of applications, 48forensic analysis of legacy
code, 47handling growth over time,
48–49identifying common generic
features, 48multi-platform environments, 49nationalization, 49security protection, 49–50
Return on Investment (ROI). See ROI (Return on Investment).
Requirements, gatheringalgorithms, 218application size, 218control flow, 219COQ (Cost of Quality), 219critical business topics, 219development cost, 218for documents, 217–219entities and relationships, 218financial value of the
application, 219hardware platforms, 218inputs, 217inquiry types, 218installation requirements, 219interfaces, 218logical files, 218outputs, 217performance criteria, 219quality levels, 218reuse criteria, 219risk assessment, 219ROI (Return on Investment), 219schedules, 218security criteria, 218software platforms, 218TCO (total cost of ownership), 219training requirements, 219use cases, 219work value of the application, 219
Requirements, minimizing defectsembedding users, 58–59formal inspections, 62–64JAD (joint application design), 58least/most effective techniques,
64–65prototyping, 60–61QFD (Quality Function
Deployment), 62sprints, 58–59standardizing outlines, 56–58use cases, 59–60user stories, 60
Requirements, software defect potentials. See also Software defect potentials.
algorithms, 46application size, 46business rules, 46
Index580
Robo calls, 458ROI (Return on Investment)
economic value of software quality, 536–537
requirements gathering, 219Root causes complexity, 155Rule checkers, 352Rules libraries, 187RUP (Rational Unified Process),
antagonisms, 127, 136Ruskin, John, 17
Safety risks, 178Scenarios. See Use cases.Schedules
code inspections, effects of, 495
economic value of software quality, 484
vs. growth rate, 53low-quality effects on, 295requirements, software defect
potentials, 46requirements gathering, 218testing, effects of, 484
Schwaber, Jeff, 222Scrums
in Agile development, 222–224word origin, 222
Scrums, pretest defect removaleffort and costs, 200overview, 222–224per 1,000 function points, 198
Security. See also Cyber attacks.COQ (Cost of Quality), 415COS (cost of security), 415criteria requirements, software defect
potentials, 47CSIRT (Computer Security Incident
Response Team), 415Department of Homeland
Security, 306FBI, 305infections, analogy to medical
infections, 306logic bombs, 81measuring, 80–81penetration teams, 309penetration testing, 308–309
Reuse criteriarequirements, software defect
potentials, 47requirements gathering, 219
Revenue generation, economic value of software
contract revenue, 450direct revenue, existing clients, 450direct revenue, new clients, 450hardware drag-along revenue, 451hardware revenue, 451illegal, 452indirect revenue, 450–451intellectual property, 451intellectual property violations, 452patent violations, 452patents, 451phishing, 452piracy, 452software books and journals, 452software drag-along revenue, 451software personnel agencies, 452teaching software skills, 451–452theft of vital records, 452
Reverse appraisals, 481Risk analysis
by application size, 177–178business, 181by category, 178–183defect prevention, 177–184economic value of software, 437–441economic value of software quality,
471–472ethical, 182external, 181factors affecting software quality,
437–441financial, 180health and safety, 178knowledge, 182–183legal, 179overlapping topics, 183–184overview, 177–184quality, 178–179requirements gathering, 219security, 178by severity, 178–183social, 181traditional software, 179–180
Index 581
Smart-phone applets, testing stages, 326
SOA (Service Oriented Architecture) testing, 313–314
SOAR (Software Security State of the Art Report), 306
Social interaction among workers, 231Social networks, economic value of
software, 460Social risks, 181Sociological factors, function point
metrics, 170Software. See also Applications.
drag-along revenue, 451as a marketed commodity, 462testing definition, 288value of. See Economic value of
software.Software Assessments...and Best
Practices, 40Software Assurance (SwA), 306Software books and journals,
publishing, 452Software companies
copy cats, 24–25currently, United States, 24fast followers, 24–25
Software defect potentialsby application size, 43architectural defects, 41coding defects, 41database defects, 42definition, 37design defects, 41economic value of software quality,
501–503estimating, 115–116factors affecting, 44–45function point metrics, 39by function points, 43measuring software quality, 37origin of term, 37overview, 39–40post-release. See Post-release defect
potentials.quantifying, 39requirements defects, 40. See also
Requirements, software defect potentials.
principle of least authority, 306requirements gathering, 218requirements generation and analysis,
49–50risk assessment, 178static analysis, 270viral protection testing, 304–308weaknesses, 92–93
Security testing, 309SEI (Software Engineering Institute), 139Semantic complexity, 154Service Oriented Architecture (SOA)
testing, 313–314Service quality
definition, 11importance ranking, 14–15
Settling litigation out of court, 391Severe defects per function point,
509–510Severity levels
IBM, 281–282testing, 281–282
Severity levels, post-release defectscritical violations, 352–358IBM method, 349–351rule checkers, 352static analysis, 352structural quality perspective,
351–358“Silver bullet” approach, 227Six Sigma, 184–185Size of applications
automatic sizing, 48cost of software, 4defect prevention, 133–135estimating from requirements,
52–55measuring, 83requirements, software defect
potentials, 46requirements gathering, 218risk analysis, 177–178software defect potentials, 43static analysis, 270–271testing stages, 329–331
SLOC (source lines of code), 167. See also LOC (lines of code) metric.
Small business applications, defect prevention, 126
Index582
economic value, 16–17high quality, 17influence of, 16legal quality, 11, 15low quality, 17most effective, 16process quality, 11, 12–14service quality, 11, 14–15standards quality, 11, 15technical quality, 11–12usage quality, 11, 14
Software quality assurance (SQA). See SQA (software quality assurance).
Software requirements. See Requirements.
Software Security State of the Art Report (SOAR), 306
Source code volume, determining, 67–69
Source lines of code (SLOC), 167Specialized testing
cost and effort, estimating, 339estimating test case volume,
333–334forms of, 303–316. See also specific
forms.frequency of use, 289–290overview, 284–285personnel requirements, estimating,
336–337Sprints
Agile development, 223definition, 136minimizing requirements defects,
58–59SQA (software quality assurance)
best practices, 244customer satisfaction measurement, 245definition, 240at IBM, 244key classes of software products, 243in large organizations, 244measurement data, 244–245measurement data in litigation, 245organizational placement, 243reviews, pretest defect removal, 205,
206, 239–246staffing levels, 241–243vs. testing, 243
Software defect potentials (cont.)sources of, 37, 40–43test case defects, 42test plan defects, 42United States vs. Japan, 228–229user documentation defects, 42website defects, 43
Software developmentcosts, 487–489economic value of software quality,
461–462effort, 486
Software Engineering Best Practices, 40Software Engineering Institute (SEI), 139Software enhancements, 514–516Software industry
analogy to automobile industry, 446–447
criteria for, 433embedded software, 2EULA (end-user license agreement), 453vs. other industries, 453–454software companies, 2software distribution, 453–454
Software personnel agencies, 452Software platforms
requirements, software defect potentials, 47
requirements gathering, 218Software quality. See also Measuring
software quality.effects on individuals, 4–5importance of, 1–8static analysis, 268vs. testing, 10
Software quality, definingcontextual definitions, 9criteria for, 10–11. See also specific
criteria.focus areas, 11. See also specific areas.overview, 8–9quality attributes, 9. See also specific
attributes.quality types, 11. See also specific
types.Software quality, factors. See also
specific factors.aesthetic quality, 11, 15average quality, 16
Index 583
usage patterns, 275–276weaknesses, 271
Status checking, litigation, 383–384Stewart, Roger, 120, 253–254Stress testing, 303Structural decay, maintainability of
software, 359Structural diagrams, maintainability of
software, 360Structural quality
definition, 11effects on economic value of software
quality, 476–477severity levels, post-release defects,
351–358static analysis, 268–269
Structural quality, measurement examples
application resource imbalances, 91–92
bypassing the architecture, 88–90
failure to set processing limits, 90lack of defensive mechanisms,
93–94security weaknesses, 92–93
Structural quality, measuringlayered approach, 77. See also specific
attributes.maintainability, 81–82measurable software attributes, 77overview, 77performance efficiency, 79–80reliability, 78–79security, 80–81size, 83summary of measurable attributes,
83–85system requirements for, 95
Subroutine testingdefinition, 294distribution in U.S. software
projects, 325DRE (defect removal efficiency),
290–291overview, 294–295
Supply chain testing, 311Support. See Maintenance and support.Sutherland, Ken, 222
Staffing, economic value of software quality, 484–486, 516–517
Standardizingrequirements outlines, 56–58taxonomies, 213–216
Standards. See also specific standards.vs. best practices, 174defect prevention, 171–174organizations, 171–174software defect potentials, 172–174test plan contents, 321
Standards qualitydefinition, 11importance ranking, 15
Stand-ups, 223Static analysis
in conjunction with inspections, 257–258
defect prevention, 185–188DRE (defect removal efficiency), 186languages supported by, 186–187overview, 185–188rules libraries, 187severity levels, post-release
defects, 352tools for, 185–188
Static analysis, pretest defect removaleffort and costs, 201per 1,000 function points, 198per 10,000 function points, 205
Static analysis of source code, automating
availability, 268current usage, 271–272functional quality, 268future additions, 276languages supported, 272–275latency, 268Lint tool, 267–268maintainability, 270nonfunctional quality, 268performance efficiency, 269–270reliability, 269security, 270size, 270–271software product quality, 268structural characteristics, 269–271structural quality, 268–269tools, issues with, 272
Index584
TDD (test-driven development), 322test coverage, 321–322
Test coveragedefect prevention, 120economic value of software quality,
498–500IBM studies of, 321test cases, 321–322
Test defect removal, 37Test planning. See also Test cases.
IEEE guidelines, 321overview, 320–321personnel requirements, estimating,
335–337Test plans
defect prevention, 130software defect potentials, 42standard for contents, 321
Test stageseconomic value of software quality,
494–496performance by occupation
group, 343Test-driven development (TDD), 322Testing
Agile, 317Alpha, 318automated, 293–294black box, 291–293capacity, 303case study, 316clean room, 311–312cloud, 313cost and effort, estimating, 337–342cumulative DRE (defect removal
efficiency), 291defect prevention, 121definition, 287–288by developers vs. professional testers,
342–344effects on IBM schedules, 484efficiency of, 75execution, definition, 288field Beta, 318–319functional, 290–291, 293Gamma, 318independent, 314–315integration, 300, 325invalid defects, 282
SwA (Software Assurance), 306Synergistic defect prevention, 125–127Syntactic complexity, 154System test
definition, 285distribution in U.S. software
projects, 325DRE (defect removal efficiency), 291lab testing, 301–302overview, 301–302
Systems software, testing stages, 328–329
Tagging and releasing defects, 264Takeuichi, Hirotaka, 222Tangible value of applications,
535–536Taxonomies
patterns of, 216–217standardizing, 213–216
TCO (total cost of ownership)economic value of software quality,
520–529requirements gathering, 219
TDD (test-driven development), 322Team Software Process (TSP),
antagonisms, 127, 136Technical debt, 465–470Technical manuals. See User
documentation.Technical quality
definition, 11importance ranking, 11–12
Technical software, defect prevention, 126
Technology investment, effects on economic value of software quality, 479
Test cases. See also Use cases.automatic definition, 48defect prevention, 130design methods, 321–323economic value of software quality,
497–498errors in, 323–324estimating volume, 332–335limitations of combinatorial
complexity, 335software defect potentials, 42
Index 585
Testing, regressiondistribution in U.S. software
projects, 325DRE (defect removal efficiency), 291
Testing, specializedcost and effort, estimating, 339estimating test case volume,
333–334forms of, 303–316. See also specific
forms.frequency of use, 289–290overview, 284–285personnel requirements, estimating,
336–337Testing, subroutine
definition, 294distribution in U.S. software
projects, 325DRE (defect removal efficiency),
290–291overview, 294–295
Testing, system testdefinition, 285distribution in U.S. software
projects, 325DRE (defect removal
efficiency), 291lab testing, 301–302overview, 301–302
Testing, unit testdistribution in U.S. software
projects, 325DRE (defect removal efficiency),
290–291overview, 296–297PSP/TSP unit test, 295–296XP (extreme programming) unit
test, 296Testing, user
cost and effort, estimating, 339–340
estimating test case volume, 334
forms of, 316–321. See also specific forms.
frequency of use, 290overview, 285personnel requirements, estimating,
336–337
lab, 319–320late start, early ending, 248litigation, 312localization, 315manual, 293–294nationalization, 315new function, 297–298, 325nonfunctional, 293penetration testing, 308–309as a percent of development,
496–497performance, 304platform, 310predetermined criteria, 289pretest defect removal, 37, 76quantitative data, 279–282regression, 299reliability of, 44security, 309severity levels, 281–282SOA (Service Oriented Architecture),
313–314software, definition, 288vs. software quality, 10vs. SQA (software quality
assurance), 243stress, 303supply chain, 311test defect removal, 37, 76unit test, 285usability, 317–318viral protection, 304–308white box, 291–293
Testing, automaticcost and effort, estimating, 338–339estimating test case volume, 333frequency of use, 289overview, 284personnel requirements,
estimating, 336Testing, general
cost and effort, estimating, 338estimating test case volume, 333forms of, 294–302. See also specific
forms.frequency of use, 289overview, 283–284personnel requirements,
estimating, 336
Index586
Toxic requirements, 45Tracking defects, 156–158Traditional software risks,
179–180Training
economic value of software, 457effects on economic value of software
quality, 477–478maintainability of software, 359requirements, 47, 219software skills, 451–452
TSP (Team Software Process), antagonisms, 127, 136
Unbundling IBM software applications, 434
Unit testAgile methods, 285distribution in U.S. software
projects, 325DRE (defect removal efficiency),
290–291overview, 296–297PSP/TSP unit test, 295–296XP (extreme programming) unit
test, 296United States vs. Japan
DRE (defect removal efficiency), 228–229
Kaizen, 227–231poka yoke, 224–226pretest defect removal, 227–231quality circles, 230social interaction among
workers, 231software defect potentials,
228–229Usability testing, 317–318. See also User
testing.Usage quality
definition, 11importance ranking, 14
Use cases. See also Test cases.minimizing requirements defects,
59–60requirements, software defect
potentials, 47requirements gathering, 219
Useful life of applications, 529–535
Testing stages. See also specific stages.distribution in U.S. software projects,
324–325DRE (defect removal efficiency), 341frequency of use, 289–290most common, 325noted in litigation, 331–332overview, 283–287
Testing stages, pattern variation bycommercial software, 327–328computer gaming, 327end-user software, 325–326industry, 325–329IT (Information Technology), 326military and defense software, 329MIS (management information
system), 326open source software
development, 327outsource vendors, 327size of application, 329–331smart-phone applets, 326systems software, 328–329type of software, 325–329web applications, 326
Text checking documents, automated, 211–219
Theft of vital records, 452Therac-25 radiation therapy device,
litigation, 412–413Thousand lines of code (KLOC),
465–470Time-box prototyping, 61Tools
commercial project estimation, 436effects on economic value of software
quality, 481–484measuring defects, 157–158requirements generation and analysis.
See Requirements generation and analysis tool.
static analysis, 185–188, 272tracking defects, 157–158
Topologic complexity, 154Total cost of ownership (TCO). See TCO
(total cost of ownership).Total defect removal, economic
value of software quality, 505–507
Index 587
Viral protection testing, 304–308Voice of the customer, 62
Waterfall development, 246Watson, Thomas J., 390Weaknesses, static analysis, 271Web applications, testing
stages, 326Website defects
litigation, 411–412preventing, 131–132software defect potentials, 43
Weinberg, Gerald, 231, 253White box testing, 291–293Wiegers, Karl, 253Work value of applications, 219
XP (extreme programming) unit test, 296
Y2K problem, 45
Zero-defect products, cost-per-defect metric, 114–115
User documentationdefect prevention, 131IBM studies of user opinions, 266–267software defect potentials, 42
User stories, minimizing requirements defects, 60. See also Use cases.
User testing. See also Usability testing.cost and effort, estimating, 339–340estimating test case volume, 334forms of, 316–321. See also specific
forms.frequency of use, 290overview, 285personnel requirements, estimating,
336–337
Value factors, measuring economic value of software, 437–441
Value of software quality. See Costs, of software quality; Economic value of software quality.
Verizonbilling algorithm litigation, 410defect reporting, example, 416–417