the economic impact of germany’s tourism industry
TRANSCRIPT

The Economic Impact of Germany’s Tourism IndustryKey figures from a high-revenue, cross-sectoral industry
Abridged version
The Economic Impact of Germany’s Tourism IndustryKey figures from a high-revenue, cross-sectoral industry
Publication credits
Published byFederal Ministry of Economicsand Technology (BMWi)Public Relations Division/L211019 BerlinGermanywww.bmwi.de
Federal Association of the German Tourism Industry (BTW)Am Weidendamm 1 A10117 BerlinTel: +49 (0)30 7262540Fax: +49 (0)30 [email protected]
Project management and editorial assistance Jörg-Michael Rösner, Nicole von Stockert
Contractor for scientific managementand consulting, translation DIW econ Dr. Ferdinand Pavel, Dr. Anselm Mattes, Daniel WissmannMohrenstraße 5810117 BerlinTel. +49 (0)30 20 60 972-0Fax +49 (0)30 20 60 [email protected]
StatusFebruary 2012
Print Druckerei Fritz Kriechbaumer, Taufkirchen
Design and production PRpetuum GmbH, Munich
Cover image VISUM und fotolia (danielschoenen, Martin Raab, sashpictures, euregiophoto, PictureArt, line-of-sight, Christiane Hering, Felix Horstmann, fotodesign-jegg.de, lassedesignen, Volker Z)
The Federal Ministry of Economics and Technol-ogy has been awarded the audit berufundfamilie (“career and family certificate”) for its family-friendly human resources policy. The certificate is awarded by berufundfamilie gGmbH, an initia-tive of the non-profit Hertie Foundation.
This brochure is published as part of the public relations work of the Federal Ministry of Economics and Technology. It is distributed free of charge and is not intended for sale. The distribution of this brochure at campaign events or at information stands run by political parties is prohibited, and political party-related informa-tion or advertising shall not be inserted in, printed on, or affixed to this publication.
3
The Economic Impact of Germany’s Tourism IndustryKey figures from a high-revenue, cross-sectoral industry
Abridged version

4
Table of Contents
Foreword ..............................................................................................................................................................................................................6
1. Introduction..............................................................................................................................................................................................8
2. Executive Summary ...............................................................................................................................................................................9
3. Methodology .......................................................................................................................................................................................... 10
3.1 Evaluation of tourism demand .........................................................................................................................................................11
3.2 Evaluation of tourism supply ............................................................................................................................................................11
3.3 The impact of tourism on income and employment ............................................................................................................12
4. Results ....................................................................................................................................................................................................... 15
4.1 Expenditures by foreign visitors ......................................................................................................................................................15
4.2 Expenditures by domestic visitors ..................................................................................................................................................16
4.3 Total internal tourism consumption in Germany ...................................................................................................................17
4.4 Tourism supply .........................................................................................................................................................................................18
4.5 Impact of tourism on income and employment .....................................................................................................................19
4.5.1 Income effects ...........................................................................................................................................................................................19
4.5.2 Employment effects ...............................................................................................................................................................................21
5. Conclusion .............................................................................................................................................................................................. 24
Appendix: The Tourism Satellite Account (TSA) of Germany (2010) .............................................................................................25

5
Figures, Boxes and Tables
Figure 1: Classification of visitors ....................................................................................................................................................10
Figure 2: Expenditures by foreign visitors in Germany (2010) ...........................................................................................15
Figure 3: Expenditures by domestic visitors in Germany (2010) ......................................................................................16
Figure 4: Internal tourism consumption in Germany (2010) .............................................................................................17
Figure 5: Tourism ratios by industry in Germany ....................................................................................................................18
Figure 6: Comparison of value added shares of different economic activities (2010), including the health (2005) and tourism industry (2010) .................................................................................20
Figure 7: Direct, indirect and induced income effects of the tourism industry in Germany by economic activity (value added in billions of euros, 2010) ........................................................................21
Figure 8: Comparison of shares of total employment of different economic activities (2007), including the health (2005) and tourism industry (2010) .................................................................................22
Figure 9: Direct, indirect and induced employment effects of the tourism industry in Germany by economic activity (number of employed persons, 2010) ............................................................................23
Box 1: International definition of „tourism“ .........................................................................................................................10
Box 2: Compilation of tourism expenditures .......................................................................................................................11
Box 3: Direct, indirect and induced effects ............................................................................................................................14
Table 1: Tourism characteristic products and industries ...................................................................................................13
Table 2: Value added effects of the tourism industry in Germany (2010) ...................................................................19
Table 3: Employment effects of the tourism industry in Germany (2010) ................................................................22

6
Foreword
Reliable and up-to-date figures for the importance of tourism to the German economy have previously been unavailable. The study funded by the Federal Ministry of Economics now bridges this gap. Using an interna-tionally established procedure that is also in line with Germany’s national accounts, a detailed statistical accounting framework – known as the Tourism Satel-lite Account (TSA) – has been produced. This enables a meaningful evaluation of the impacts on income and employment as key figures for the German tourism industry.
The core tourism industry generated 97 billion euros with a 4.4 % direct income effect on Germany’s entire gross value added in 2010. In order to fully determine the economic significance of tourism, both “indirect” and “induced” effects of the tourist industry must also be taken into account. Taken together, direct, indirect and induced effects mean that tourism contributes 9.7 % of the gross value added. With just under 2.9 mil-lion people directly employed by the tourism industry, or 7 % of the German workforce in 2010, the tourist industry represents a labour-intensive industry with a high employment rate.
These are impressive statistics for a varied and growing industry with a positive image, whose economic power has long been underestimat-ed. The figures we now have enable us to pre-sent in a credible and realistic way the eco-nomic importance of a tourist industry that is dominated by small and medi-um-sized enterprises, and to compare it with the other industries. This report will encourage us to further develop Germany as a tourist destination and to build on the tremendous successes that have already been achieved.
I am particularly grateful to the Federal Association of the German Tourism Industry, with its president Klaus Laepple, and to the consultancy firm DIW econ GmbH for their part in the outstanding and successful co-operation.
Ernst BurgbacherParliamentary State Secretary at the Federal Ministry of Economics and TechnologyFederal Government Commissioner for SMEs and Tourism

7
Foreword
The tourism industry in Germany is attractive and diverse. We provide all that is needed for the most enjoyable weeks of the year: pure pleasure and excel-lent hospitality, as well as ease of travel and the chance to make new friends. The challenges we face in our industry are thrilling, simply because our clients and their interests are so varied. Whether it’s day visitors or those on an extended stay, holidaymakers or business travellers; whether foreign visitors, those travelling within Germany, or Germans travelling abroad: we have developed a range of products and services to cater for everyone’s individual holiday and travel wishes. And as we have seen in the past few years, not even the financial crisis stopped people taking advan-tage of these products and services. Increasing num-bers of foreign travellers are visiting Germany, and Germany is also the most popular travel destination for Germans.
Even though people have always known this – and perhaps not least because of the wide range of prod-ucts and services on offer – it has not always been easy in the last few years to persuade people of the rele-vance of this cross-sectoral industry. No comprehen-sive figures have been available, but this situation has now changed. I am pleased that all the positive experi-ences and developments have now finally been brought together, have been confirmed by the facts and serve, in this way, to provide a clear overall picture of the tourism as an economic factor. We are most grateful to the Federal Ministry of Economics and Technology for its extensive support with the study.
The results of the study speak for themselves and are testament to the impressive level of tour-ist consumption. They are also evidence that we are making a significant contribution to the gross value added in Germany. They show just how many sub-sectors are linked to the tourism industry and benefit from it. And they also attest to the fact that our industry is a driving force for employment. In a nutshell: tourism is not only attractive and diverse, but it is also an important economic factor in Germany – and this is something that we now finally have in black and white.
As you read this report, I hope that you will allow the impressive figures to sink in and to convince you of the economic strength of this industry. I wish you interesting reading.
Klaus LaepplePresident of the Federal Association of theGerman Tourism Industry (BTW)
8
1. Introduction
The German tourism industry, policy makers and the general public have until now no access to reliable statistical information on the economic impact of the tourism industry. Comparing the tourism industry with the rest of the economy or with other industries has therefore not been possible so far. Based on an internationally established methodology, this investi-gation focuses on quantifying the impact of tourism on income and employment levels as key variables for economic and social policy makers.1
A general difficulty in assessing the economic role of tourism is the supply-side orientation of official statis-tics such as the System of National Accounts. Different industries (economic activities) are classified according to the main goods and services that they produce. Based on such information, the economic impact of supply-oriented sectors such as the automobile industry can be readily assessed based on data on production value, value added or employment.
The tourism industry, however, cuts across several sectors such as the accommodation industry, food and beverage serving industries, transport providers, or travel agencies. However, the goods and services that these industries offer are not exclusively consumed by tourists. The obvious difficulty here is that products can only be attributed to tourism to the extent that they are actually consumed by tourists. Specifying the tourism industry therefore requires a demand-side approach.
Specifically, assessing the economic impact of tourism requires to first measure tourism consumption and then to relate these findings to the different sectors that produce the consumed goods and services. In doing so, we complement the official economics statistics with additional information to reveal the economic impact of tourism. To deliver accurate and credible results, this additional information must be consistent with the official economics statistics in Germany, in partic-ular the System of National Accounts and the input-output table.2 A tourism statistics compiled in this way is known as a Tourism Satellite Account (TSA).
1 This investigation was commissioned by the Federal Association of the German Tourism Industry (Bundesverbandes der Deutschen Tourismuswirtschaft e.V. (BTW)) and carried out by DIW econ GmbH, the consulting company of DIW Berlin. The project ran from January to December 2011 and was co-financed by the German Federal Ministry of Economics and Technology (BMWi).
2 The System of National Accounts (SNA) is a crucial part of official economics statistics. The focus of the SNA lies on the production, distribution and expenditure of Gross Domestic Product (GDP). The SNA consists of several parts that deal with the assets, incomes, foreign trade relations and employment in the economy. The input-output tables form another part of the SNA. They describe the interdependencies between different branches of the national economy by their intermediate input consumption (cf. Gabler Wirtschaftslexikon, http://wirtschaftslexikon.gabler.de/Archiv/57339/volkswirtschaftliche-gesamtrechnung-vgr-v5.html).

9
2. Executive Summary
We investigate the overall economic impact of Germa-ny’s tourism industry. Our assessment is based on an internationally established approach which is consis-tent with official economics statistics. The focus of the investigation is on estimating the impact of consump-tion expenditures of tourists on income and employ-ment in Germany. The main results are as follows:
→ Aggregate tourism expenditures in Germany amount to 278.3 billion euros in 2010. The largest part can be attributed to domestic tourists (241.7 billion euros or 87 %). Foreign tourists constitute for the remaining 36.6 billion euros (13 %).
→ Private trips account for a larger share in total tourism expenditures (79 %) than business trips.
→ Three quarters of total tourism expenditures are spent on tourism-characteristic products such as accommodation and restaurant services, air trans-port services, cultural, sports and recreational ser-vices as well as fuel.
→ The remaining quarter of total tourism expendi-tures are spent on the consumption of goods such as clothing, jewellery, electronics or print prod-ucts, which tourists typically buy from retailers during their trips. This stresses the relevance of shopping activities for the tourism industry.
These consumption expenditures have the following direct and indirect impacts on income and employ-ment in Germany:
Impact on income
→ The production of the goods and services that tourists in Germany consume generates a gross value added of 97.0 billion euros (direct effect) in 2010. This amounts to a share of 4.4 % in total gross value added of Germany.
→ The total contribution of tourism to gross value added in Germany increases to 214.1 billion euros once two additional effects are accounted for:
i) additional gross value added generated from the production of intermediate inputs along the value chain (indirect effects), and
ii) the impact of direct and indirect effects on household income (induced effect).
Once indirect and induced effects are accounted for, the total share of tourism in gross value added in Ger-many increases to 9.7 %.
Impact on employment
→ The production of goods and services that tourists in Germany consume generate employment for 2.9 million persons (direct effect). This corresponds to 7.0 % of all employed persons in Germany.
→ The total contribution of tourism to employment in Germany increases to 4.9 million persons once additional effects are accounted for:
i) employment caused by the production of inter-mediate inputs along the value chain (indirect effects), and
ii) the employment effect of direct and indirect effects on household income (induced effect).
Accordingly, the total contribution of tourism to employment in Germany increases to 12.0 %.
The macroeconomic context of these results is as follows:
→ The direct contribution of tourism to gross value added (4.4 %) is similar in magnitude to that of the construction sector (4.3 %), the education sector (4.6 %) or the professional and technical services industry (4.6 %). Gross value added in the automo-bile industry or in the banking and financial ser-vices sector (both 2.5 %) is smaller.
The direct contribution of tourism to employment in Germany (7.0 %) is of similar magnitude to the retail sector (9.2 %) and the education sector (5.9 %). Other sectors, such as construction (3.0 %) or machine build-ing (2.6 %), contribute less.

10
3. Methodology
Our methodology is based on the 2008 Tourism Satel-lite Account: Recommended Methodological Frame-work by the United Nations Statistical Division (UNSD), the United Nations World Tourism Organisa-tion (UNWTO), the OECD and Eurostat. In this way we ensure that all results are internationally comparable and fully compatible with official economic statistics such as the German System of National Accounts.
The starting point of our calculations is the definition of tourism as given in Box 1. The measurement of tourism consumption is based on the demand by tour-istic travellers (subsequently: visitors).3 Visitors are broken down into foreign and domestic as well as into same-day and overnight visitors. They are also catego-rised according to their main purpose of travel – either personal or business related (→ Figure 1).
Box 1: International definition of „tourism“
Tourism consists of trips with…
1. … a principal destination outside the traveller’s usual environment*;2. ... any principal purpose (business, leisure or other personal purpose**)
other than to be employed by a resident entity in the country or place visited;3. ... a duration of less than one year.
UNWTO (2010) - International Recommendations for Tourism Statistics, paragraph 2.9.
* The „usual environment” of an individual, a key concept in tourism, is defined as the geographical area (though not necessarily a contiguous one) within which an individual conducts his/her regular life routines. The definition of the usual environment is not tied to a specific distance in kilometres but is left to the surveyed individuals them-selves. Own vacation homes are always excluded from the usual environment and thus trips to own vacation homes count as tourism trips.
** For example curative stays in rehabilitations clinics or study programmes that take less than a year.
Figure 1: Classification of visitors
visitors
foreignvisitors
domesticvisitors
same-dayvisitors
overnightvisitors
same-dayvisitors
overnightvisitors
personal business personal business personal business personal business
Source: DIW econ
3 Besides tourists, the category of “travellers” comprises other persons travelling for non-touristic purposes. These include, for example, commuters, seasonal workers, diplomats, immigrants, long-term students, crew members of airplanes and other means of transport, or self-employed persons staying for a short period of time to provide specific services. These services may include the installation of equipment, repair, consultancy, etc. It is a prerequisite that there is no implicit or explicit employer-employee relationship with a resident entity.

11Methodology
Following this structure, we calculate the income and employment effects of tourism based on an assess-ment of tourist demand and the associated supply-side activities as described in the remainder of this section.
3.1 Evaluation of tourism demand
Total tourism demand consists of all expenditures by all types of visitors on trips in Germany. This includes all expenditures during all trips as well as all expendi-tures which are directly related to these trips (→ Box 2). Tourism expenditures are then divided into different product categories. These include tourism-characteris-tic products4 (such as food and beverage serving servic-es, accommodation services, air passenger transport services or motor caravans) as well as all other goods and services (such as apparel, telecommunication or insurance services).5 The main focus of this report will be on the expenditures on tourism-characteristic goods and services.
3.2 Evaluation of tourism supply
To meet tourism demand a corresponding supply of goods and services is required. This includes the supply of tourism-characteristic industries such as the accom-modation industry, the food and beverage serving industry, airlines, travel agencies or trade show organ-isers, as well as the supply of non-tourism-characteris-tic industries, such as retail trade or insurance services. However, tourists demand only a fraction of the sup-ply of these industries. For example, local residents also consume restaurant services and commuters also use railway passenger transport services. In some other industries such as retail trade or insurance activities, non-touristic consumers contribute the greatest share of total demand. By using the product-specific tourism demand we calculate the fraction of total supply in each and every product category that is related to the expenditures of tourists (tourism ratios).
Box 2: Compilation of tourism expenditures
We calculate tourism expenditure based on the following three main data sources:
→ Balance of payments statistics by the German Bundesbank (expenditure of foreign same-day and overnight visitors in Germany);
→ Publications on the same-day trips by the German Economic Institute for Tourism (dwif), (expenditure of domestic same-day visitors);
→ The German Travel Monitor by DZT/IPK (expenditure of domestic overnight visitors).
Each of the three data sources captures the total expenditures of the corresponding group of visitors. The total expenditures are allocated to different product categories (top-down approach). In practice, this allocation could only be completed by making some further assumptions. Our approach ensures that the total level of expenditure is captured consistently, even if the allocation itself may not be entirely precise at all points. However, in terms of measuring the economic impacts of the tourism industry, it is the total level of expenditure that is decisive.
4 A product is tourism characteristic if the expenditure on this product represents a large share of a visitor’s expenditures (such as the expenditure on an airline ticket) and/or if total demand for this product is mainly driven by tourists. For example, tourists are the only consumers of travel agency services. “Products” summarize both, goods and services.
5 Tourists spend a much of their expenditure on non-tourism-specific goods and services. Therefore, a considerable share of tourism expenditures falls into the category of “other products”. A further subdivision of this category proved to be limited due to data restrictions. However, this is of minor importance to the main goals of the research project.
12 Methodology
In total, we divide tourism demand into 17 different product categories and tourism supply into 14 differ-ent industries (→ Table 1).
3.3 The impact of tourism on income and employment
We evaluate the effects of tourism on income and employment based on the following information:
→ Gross value added comprises total income gener-ated6, including all direct taxes on this income. It is the most important measure to assess income effects and the economic performance of an indi-vidual industry or an entire economy.
→ The number of persons in employment includes all employees, civil servants, members of the armed forces and persons in marginal employ-ment as well as self-employed and unpaid family workers, independently of the number of hours worked.
We obtain total value added and employment for the different industries and product categories from offi-cial statistics. We then use the specific tourism ratios to calculate the share of value added and employment in each industry and product category that is due to tour-ism demand. For example, if the tourism ratio in the food and beverage serving industry is 60 %7, we attrib-ute a share of 60 % of the industry’s value added to tourism. In this way we arrive at the direct income and employment effects of the tourism industry.
However, a comprehensive evaluation of the econom-ic impact of tourism must take into account the addi-tional income and employment effects that result from the consumption of intermediate inputs along the entire value chain (so-called indirect and induced effects, → Box 3). We use input-output analyses to cal-culate these effects.
6 Income consists of earnings from labour and capital, i. e. wages and salaries as well as profits.
7 This implies that the food and beverage serving industry receives 60 % of its revenues from tourists and 40 % from non-tourists.

13Methodology
Table 1: Tourism characteristic products and industries
1 – Accommodation services
a) Conventional accommodation services
b) Imputed accommodation services*
2 – Food and beverage serving services
3 – Railway passenger transport services
4 – Road and local passenger transport services
5 – Water passenger transport services
6 – Air passenger transport services
7 – Car rental services
8 – Travel agencies and tour operators
9 – Cultural, sports and recreational services
10 – Trade show and convention services
11 – Rehabilitation clinics
12 – Groceries
13 – Caravans and motor homes
14 – Fuels (petrol and diesel)
15 – Bicycles
16 – All other goods
17 – All other services
Acc
omm
odat
ion
serv
ices
Real
est
ate
activ
ities
with
ow
n le
ased
pro
pert
y
Food
and
bev
erag
e se
rvin
g se
rvic
es
Railw
ay p
asse
nger
tran
spor
t
Road
and
loca
l tra
nspo
rt
Wat
er p
asse
nger
tran
spor
t
Air
pass
enge
r tra
nspo
rt
Car r
enta
l ind
ustr
y
Trav
el a
genc
ies
and
tour
ope
rato
rs
Cultu
ral,
spor
ts a
nd re
crea
tiona
l ser
vice
s
Buss
ines
s su
ppor
t act
iviti
es
Hea
lth a
ctiv
ities
Sale
of m
otor
veh
icle
s an
d ot
her r
etai
l
activ
ities
Oth
er in
dust
ries
Source: DIW econ
* Accommodation services associated with stays in vacation homes occupied and used by their owners.
Note that the sale of goods (groceries, caravans and motor homes, fuel, bicycles, and all other goods) to end-consumers entails a retail trade service and a production activity; therefore, two industries are marked in the respective product categories.
Tourism Characteristic Industries
14 Methodology
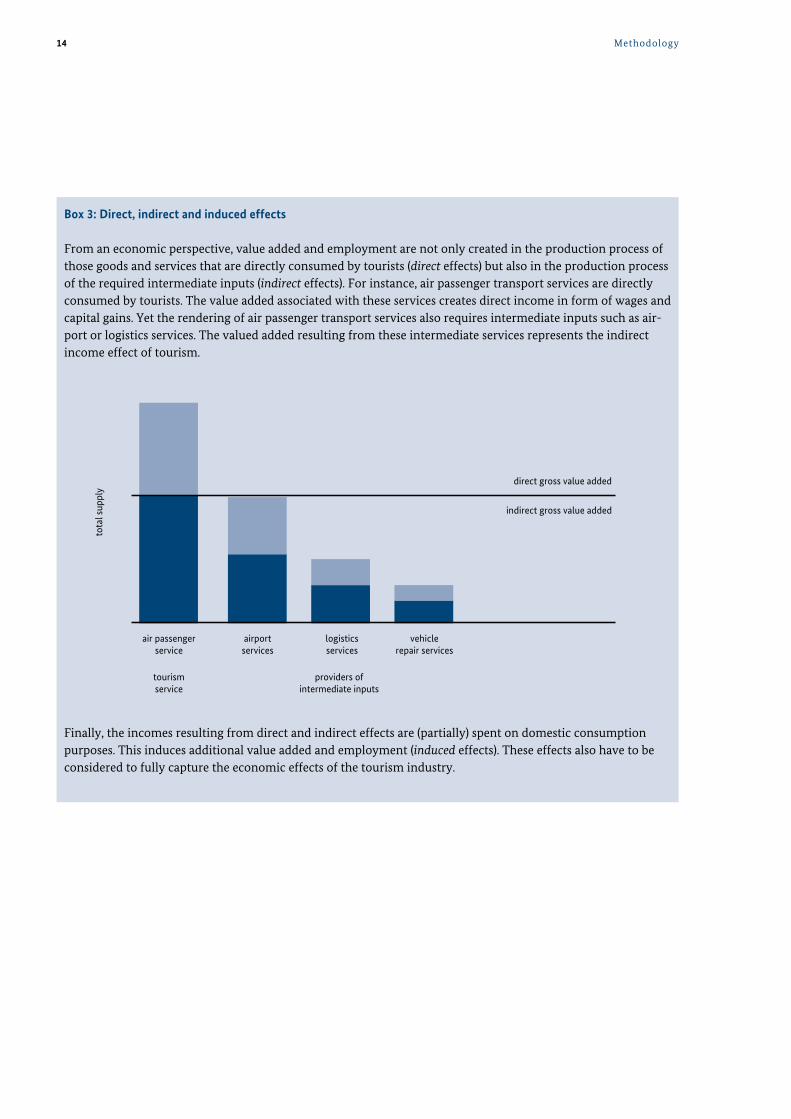
Box 3: Direct, indirect and induced effects
From an economic perspective, value added and employment are not only created in the production process of those goods and services that are directly consumed by tourists (direct effects) but also in the production process of the required intermediate inputs (indirect effects). For instance, air passenger transport services are directly consumed by tourists. The value added associated with these services creates direct income in form of wages and capital gains. Yet the rendering of air passenger transport services also requires intermediate inputs such as air-port or logistics services. The valued added resulting from these intermediate services represents the indirect income effect of tourism.
direct gross value added
tota
l sup
ply
indirect gross value added
value added
air passengerservice
tourismservice
providers ofintermediate inputs
airportservices
logisticsservices
vehiclerepair services
intermediate inputsFinally, the incomes resulting from direct and indirect effects are (partially) spent on domestic consumption purposes. This induces additional value added and employment (induced effects). These effects also have to be considered to fully capture the economic effects of the tourism industry.

15
4. Results
We present the results of the German tourism satellite account for the year 2010 according to the methodo-logical framework set out above. First, we derive tour-ism demand on the basis of expenditures by foreign and domestic visitors. In a second step, we use tourism demand to determine tourism ratios for all product categories and industries. Based on these tourism ratios, we finally calculate the income and employment effects generated by Germany’s tourism industry.
4.1 Expenditures by foreign visitors
In 2010, foreign visitors spent a total of 36.6 billion euros on their trips to Germany (→ Figure 2). The fol-lowing items accounted for the largest shares in total expenditures of foreign visitors:
→ Air passenger transport services (10.1 billion euros or 28 % of total expenditures)
→ Accommodation services (9.5 billion euros or 26 %)→ Food and beverage serving services (5.6 billion
euros or 15 %)
In addition, retail-related expenditures on goods such as apparel, watches or jewellery (all other goods, 4.2 billion euros or 11.5 %) add up to a significant share of total spending by international visitors on trips to Germany.
Foreign visitors in Germany spent least on rental cars (133 million euros) and health care services in rehabili-tation clinics (34 million euros).
Total expenditures by foreign visitors split up by purpose of travel as follows:
→ Foreign overnight visitors on personal trips: 20.6 billion euros
→ Foreign overnight visitors on business trips: 13.5 billion euros
→ Foreign same-day visitors on personal trips: 1.3 billion euros
→ Foreign same-day visitors on business trips: 1.2 billion euros
Figure 2: Expenditures by foreign visitors in Germany (2010)
In total: 36.6 billion euroscultural, sports and recreational services
fuel
groceries
road and local passenger transport services
all other services
rehabilitation clinics
trade shows and conventions
railway passenger transport services
car rental services
water passenger services
all other goods
food and beverage serving services
accomodation services
air passenger transport services
Sourcee: DIW econ (2011); in billions of euros.
2.1 0.51.1
0.71.1
1.00.30.10.2
4.2
5.6
9.5
10.1 0.0
16 Results
4.2 Expenditures by domestic visitors
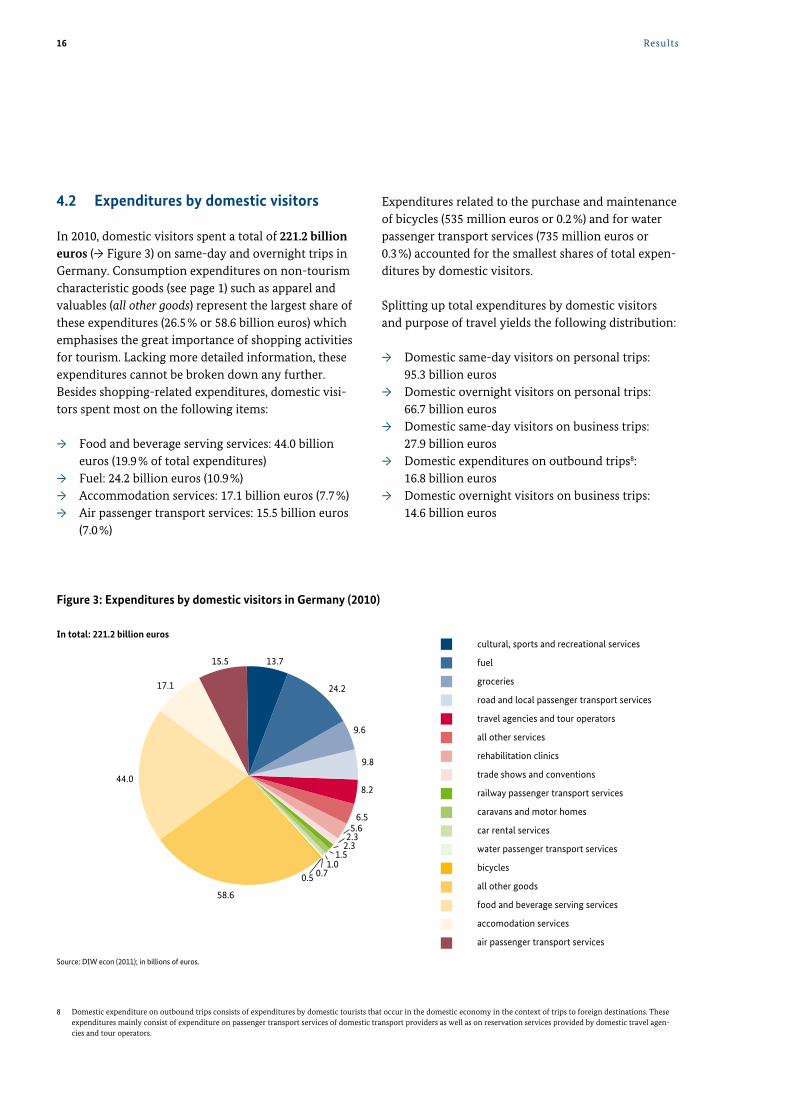
In 2010, domestic visitors spent a total of 221.2 billion euros (→ Figure 3) on same-day and overnight trips in Germany. Consumption expenditures on non-tourism characteristic goods (see page 1) such as apparel and valuables (all other goods) represent the largest share of these expenditures (26.5 % or 58.6 billion euros) which emphasises the great importance of shopping activities for tourism. Lacking more detailed information, these expenditures cannot be broken down any further. Besides shopping-related expenditures, domestic visi-tors spent most on the following items:
→ Food and beverage serving services: 44.0 billion euros (19.9 % of total expenditures)
→ Fuel: 24.2 billion euros (10.9 %)→ Accommodation services: 17.1 billion euros (7.7 %)→ Air passenger transport services: 15.5 billion euros
(7.0 %)
Expenditures related to the purchase and maintenance of bicycles (535 million euros or 0.2 %) and for water passenger transport services (735 million euros or 0.3 %) accounted for the smallest shares of total expen-ditures by domestic visitors.
Splitting up total expenditures by domestic visitors and purpose of travel yields the following distribution:
→ Domestic same-day visitors on personal trips: 95.3 billion euros→ Domestic overnight visitors on personal trips: 66.7 billion euros→ Domestic same-day visitors on business trips: 27.9 billion euros→ Domestic expenditures on outbound trips8: 16.8 billion euros→ Domestic overnight visitors on business trips: 14.6 billion euros
Figure 3: Expenditures by domestic visitors in Germany (2010)
In total: 221.2 billion euroscultural, sports and recreational services
fuel
groceries
road and local passenger transport services
travel agencies and tour operators
all other services
rehabilitation clinics
trade shows and conventions
railway passenger transport services
caravans and motor homes
car rental services
water passenger transport services
bicycles
all other goods
food and beverage serving services
accomodation services
air passenger transport services
Source: DIW econ (2011); in billions of euros.
13.7
24.2
9.6
9.8
8.2
6.5
2.32.3
5.6
1.5 1.0
0.5
58.6
0.7
44.0
17.1
15.5
8 Domestic expenditure on outbound trips consists of expenditures by domestic tourists that occur in the domestic economy in the context of trips to foreign destinations. These expenditures mainly consist of expenditure on passenger transport services of domestic transport providers as well as on reservation services provided by domestic travel agen-cies and tour operators.

17Results
4.3 Total internal tourism consumption in Germany
Total internal tourism consumption comprises all mon-etary and in-kind consumption of foreign and domes-tic tourists in Germany. In 2010, total internal tourism consumption in Germany amounted to 278.3 billion euros (→ Figure 4). Total internal tourism consump-tion mainly consists of tourism the expenditures by foreign and domestic visitors in Germany. Domestic visitors spent 221.3 billion euros (79.5%) and thus the majority of total tourism expenditures. In addition to these monetary expenditures, tourism consumption also includes two types of in kind services that are commonly consumed by tourists: First, services associ-ated with vacation accommodation on own account in owner-occupied vacation homes and apartments (so called imputed accommodation services, 11.2 billion euros), as well as public subsidies for culture, sports and leisure activities which tourists consume (9.2 bil-lion euros).
The following items accounted for the largest shares in internal tourism consumption:
→ Shopping expenditures on all other consumption goods: 62.8 billion euros (22.6 %)
→ Expenditures on food and beverage serving services: 49.7 billion euros (17.8 %)
→ Conventional9 accommodation services: 26.7 billion euros (9.6 %)
→ Air passenger transport services: 25.6 billion euros (9.2 %)
→ Fuel: 24.7 billion euros (8.9 %).
Tourists in Germany spent the least on water passenger transport services (947 million euros or 0.3 %) and on the purchase and maintenance of bicycles (535 million euros or 0.2 %).
Figure 4: Internal tourism consumption in Germany (2010)
In total: 278.3 billion euroscultural, sports and recreational services
fuel
groceries
road and local passenger transport services
travel agencies and tour operators
all other services
rehabilitation clinics
trade shows and conventions
railway passenger transport services
caravans and motor homes
car rental services
water passenger transport services
bicycles
public subsidies for culture, sports and leisure activities
all other goods
food and beverage serving services
conventional accomodation services
imputed accomodation services
air passenger transport servicesSource: DIW econ (2011); in billions of euros.
15.8
24.7
10.8
10.5
8.2
7.5
3.32.61.51.2
0.9
5.6
0.59.2
62.8
49.7
26.7
25.6
11.2
9 Conventional accommodation services in hotels, youth hostels, and rented vacation homes as opposed to in kind services associated with stays of owners in their own vacation homes.
18 Results
4.4 Tourism supply
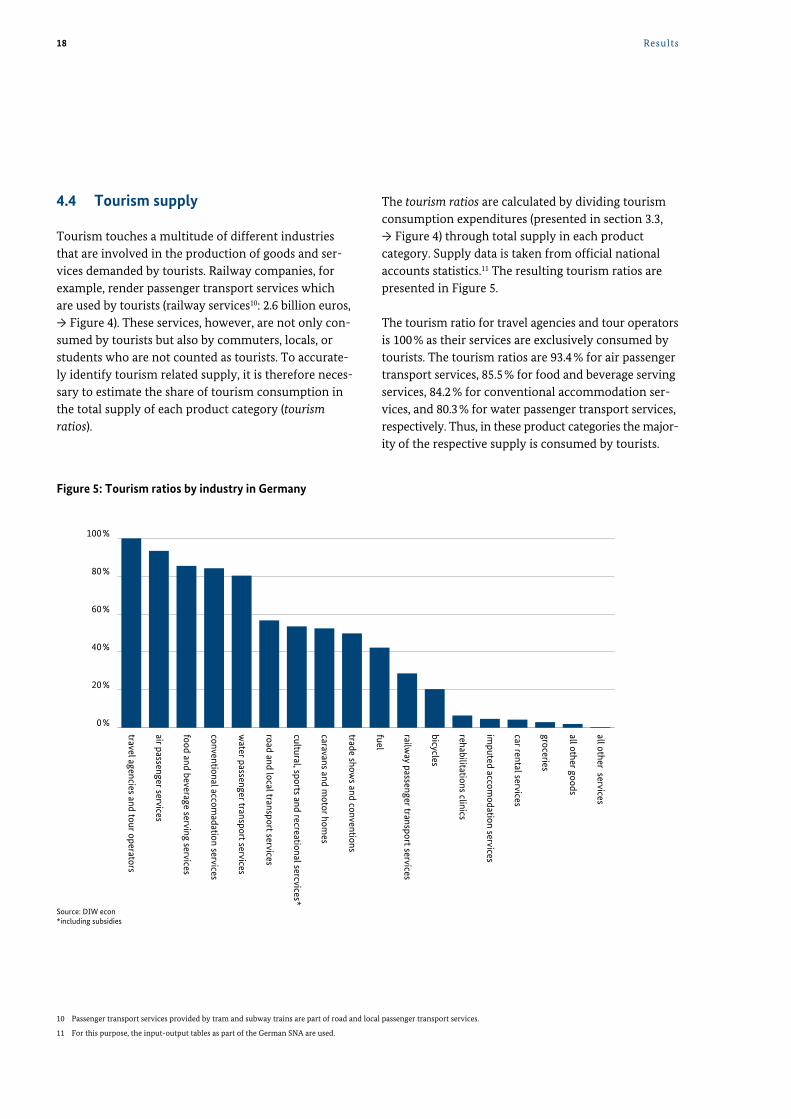
Tourism touches a multitude of different industries that are involved in the production of goods and ser-vices demanded by tourists. Railway companies, for example, render passenger transport services which are used by tourists (railway services10: 2.6 billion euros, → Figure 4). These services, however, are not only con-sumed by tourists but also by commuters, locals, or students who are not counted as tourists. To accurate-ly identify tourism related supply, it is therefore neces-sary to estimate the share of tourism consumption in the total supply of each product category (tourism ratios).
The tourism ratios are calculated by dividing tourism consumption expenditures (presented in section 3.3, → Figure 4) through total supply in each product category. Supply data is taken from official national accounts statistics.11 The resulting tourism ratios are presented in Figure 5.
The tourism ratio for travel agencies and tour operators is 100 % as their services are exclusively consumed by tourists. The tourism ratios are 93.4 % for air passenger transport services, 85.5 % for food and beverage serving services, 84.2 % for conventional accommodation ser-vices, and 80.3 % for water passenger transport services, respectively. Thus, in these product categories the major-ity of the respective supply is consumed by tourists.
Figure 5: Tourism ratios by industry in Germany
Source: DIW econ *including subsidies
0%
20%
40%
60%
80%
100%
all other services
all other goods
groceries
car rental services
imputed accom
odation services
rehabilitations clinics
bicycles
railway passenger transport services
fuel
trade shows and conventions
caravans and motor hom
es
cultural, sports and recreational sercvices*
road and local transport services
water passenger transport services
conventional accomadation services
food and beverage serving services
air passenger services
travel agencies and tour operators
10 Passenger transport services provided by tram and subway trains are part of road and local passenger transport services.
11 For this purpose, the input-output tables as part of the German SNA are used.
19Results
By contrast, tourists only consume a minor fraction of the total supply of other products. For instance, only 3.0 % of all groceries, 2.0 % of all non-tourism charac-teristic goods (apparel, jewellery, furnishings, etc.) and 0.4 % of all other services are related to tourism con-sumption and thus the vast majority of the expenditures on these products are made for purposes unrelated to tourism.12
4.5 Impact of tourism on income and employment
We calculate the direct, indirect and induced effects of the German tourism industry by applying the tourism ratios and the methodology explained in section 2.1.3. Note that the income effects in terms of generated val-ue added are smaller than total tourism expenditures (278 billion euros), because part of the expenditures is used to pay for intermediate inputs needed in the pro-duction of the respective consumer products.
4.5.1 Income effects
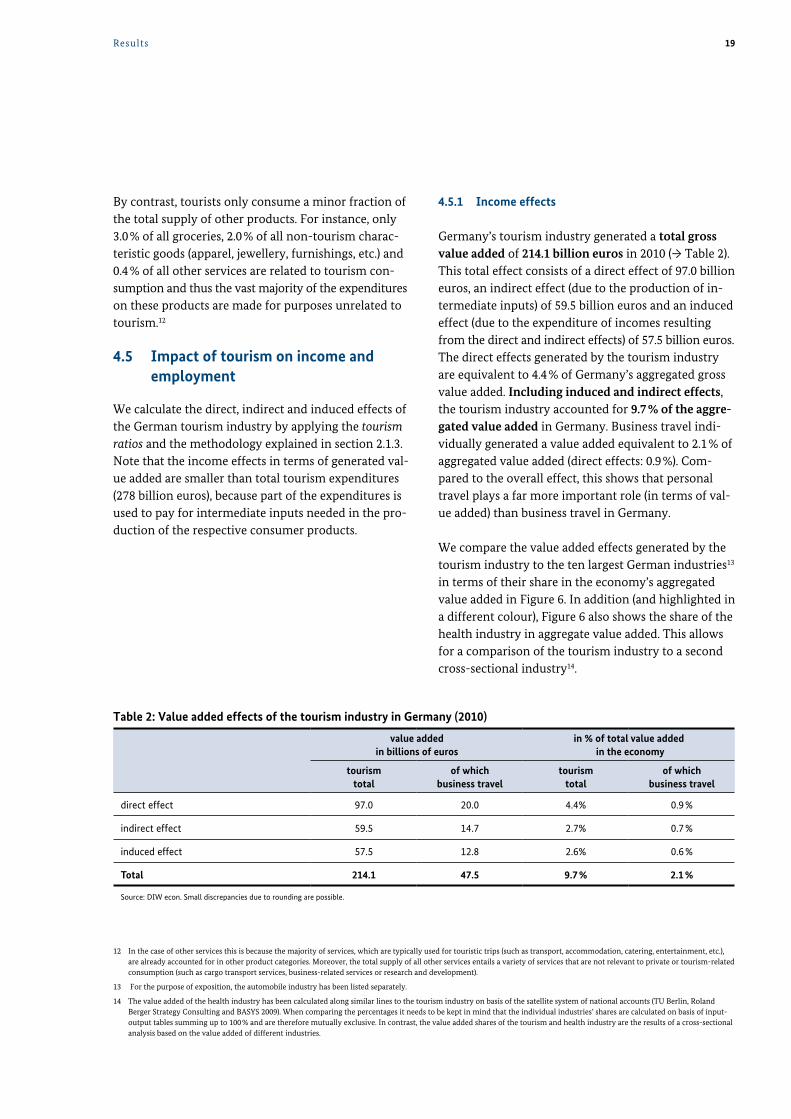
Germany’s tourism industry generated a total gross value added of 214.1 billion euros in 2010 (→ Table 2). This total effect consists of a direct effect of 97.0 billion euros, an indirect effect (due to the production of in -termediate inputs) of 59.5 billion euros and an induced effect (due to the expenditure of incomes resulting from the direct and indirect effects) of 57.5 billion euros. The direct effects generated by the tourism industry are equivalent to 4.4 % of Germany’s aggregated gross value added. Including induced and indirect effects, the tourism industry accounted for 9.7 % of the aggre-gated value added in Germany. Business travel indi-vidually generated a value added equivalent to 2.1 % of aggregated value added (direct effects: 0.9 %). Com-pared to the overall effect, this shows that personal travel plays a far more important role (in terms of val-ue added) than business travel in Germany.
We compare the value added effects generated by the tourism industry to the ten largest German industries13 in terms of their share in the economy’s aggregated value added in Figure 6. In addition (and highlighted in a different colour), Figure 6 also shows the share of the health industry in aggregate value added. This allows for a comparison of the tourism industry to a second cross-sectional industry14.
Table 2: Value added effects of the tourism industry in Germany (2010)
value added in billions of euros
in % of total value added in the economy
tourismtotal
of which business travel
tourismtotal
of which business travel
direct effect 97.0 20.0 4.4% 0.9 %
indirect effect 59.5 14.7 2.7% 0.7 %
induced effect 57.5 12.8 2.6% 0.6 %
Total 214.1 47.5 9.7 % 2.1 %
Source: DIW econ. Small discrepancies due to rounding are possible.
12 In the case of other services this is because the majority of services, which are typically used for touristic trips (such as transport, accommodation, catering, entertainment, etc.), are already accounted for in other product categories. Moreover, the total supply of all other services entails a variety of services that are not relevant to private or tourism-related consumption (such as cargo transport services, business-related services or research and development).
13 For the purpose of exposition, the automobile industry has been listed separately.
14 The value added of the health industry has been calculated along similar lines to the tourism industry on basis of the satellite system of national accounts (TU Berlin, Roland Berger Strategy Consulting and BASYS 2009). When comparing the percentages it needs to be kept in mind that the individual industries’ shares are calculated on basis of input-output tables summing up to 100 % and are therefore mutually exclusive. In contrast, the value added shares of the tourism and health industry are the results of a cross-sectional analysis based on the value added of different industries.
20 Results
0 % 2 % 4 % 6 % 8 % 10 % 12 % 14 %
Tourism industry (2010)
Health industry (2005)
Manufacture of motor vehiclesMonetary intermediation services
Manufacture of machinery and equipment***Legal, accounting and consultancy activities
Retail trade services*Financial service activities**
Wholesale trade servicies*Construction
Freelance professional and technical activitiesEducation
Health and social work acticitiesPublic administration, defence and social security
Real estate activities 11.9
6.3
5.5
4.6
4.6
4.3
4.3
3.8
3.5
3.2
3.2
2.3
2.3
10.2
4.4
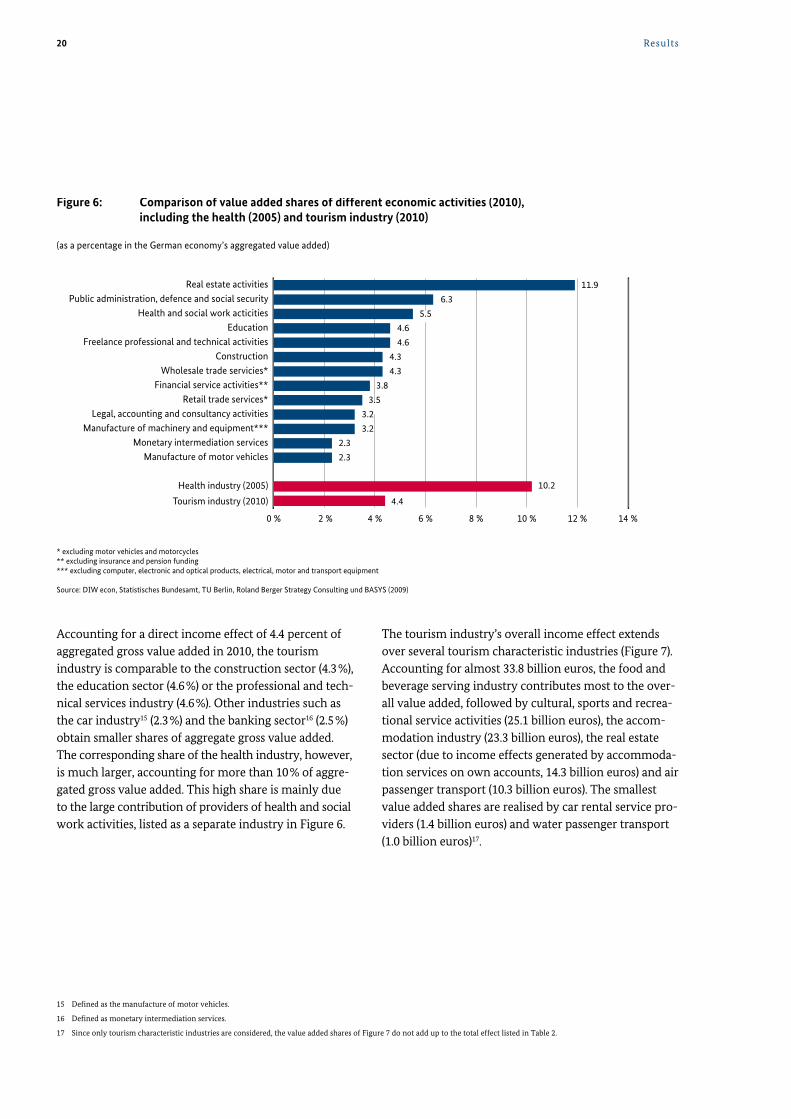
Figure 6: Comparison of value added shares of different economic activities (2010), including the health (2005) and tourism industry (2010)
(as a percentage in the German economy’s aggregated value added)
* excluding motor vehicles and motorcycles** excluding insurance and pension funding*** excluding computer, electronic and optical products, electrical, motor and transport equipment
Source: DIW econ, Statistisches Bundesamt, TU Berlin, Roland Berger Strategy Consulting und BASYS (2009)
Accounting for a direct income effect of 4.4 percent of aggregated gross value added in 2010, the tourism industry is comparable to the construction sector (4.3 %), the education sector (4.6 %) or the professional and tech-nical services industry (4.6 %). Other industries such as the car industry15 (2.3 %) and the banking sector16 (2.5 %) obtain smaller shares of aggregate gross value added. The corresponding share of the health industry, however, is much larger, accounting for more than 10 % of aggre-gated gross value added. This high share is mainly due to the large contribution of providers of health and social work activities, listed as a separate industry in Figure 6.
The tourism industry’s overall income effect extends over several tourism characteristic industries (Figure 7). Accounting for almost 33.8 billion euros, the food and beverage serving industry contributes most to the over-all value added, followed by cultural, sports and recrea-tional service activities (25.1 billion euros), the accom-modation industry (23.3 billion euros), the real estate sector (due to income effects generated by accommoda-tion services on own accounts, 14.3 billion euros) and air passenger transport (10.3 billion euros). The smallest value added shares are realised by car rental service pro-viders (1.4 billion euros) and water passenger transport (1.0 billion euros)17.
15 Defined as the manufacture of motor vehicles.
16 Defined as monetary intermediation services.
17 Since only tourism characteristic industries are considered, the value added shares of Figure 7 do not add up to the total effect listed in Table 2.

21Results
Figure 7: Direct, indirect and induced income effects of the tourism industry in Germany by economic activity (value added in billions of euros, 2010)
Source: DIW econ
0
5
10
15
20
25
30
35
water passenger transport services
car rental services
retail and motor vehicle sale
railway passenger transport services
other business activities
travel agencies and tour operators
health services
road and local transport activites
air passenger transport services
real estate activities
accomodation services
cultural, sports and recreational services
food and beverage serving services
direct indirect included
4.5.2 Employment effects
In 2010, almost 2.9 million jobs depended directly on tourism related consumption (→ Table 3). This corre-sponds to a share of 7.0 % of total employment in Ger-many.18 Including the employment related to the indi-rect and induced effects of tourism consumption, the total contribution of the tourism industry to employ-ment amounts to 4.9 million persons or 12.0 % of total employment in Germany. The direct employment share (7.0 %) of the tourism industry is considerably higher than its income share (4.4 %) which is due to the fact that tourism characteristic industries on average employ more persons per euro of output than do other industries, such as manufacturing of machinery and equipment.
The employment attributable to business travel is shown in Table 3. Business travel accounted for 1.2 million employees or a share of 2.9 % of total employment. As in the case of value added, the employment effect caused by business trips is much smaller than that caused by personal travel.
18 Total employment amounted to 40.5 million persons in 2010.
22 Results
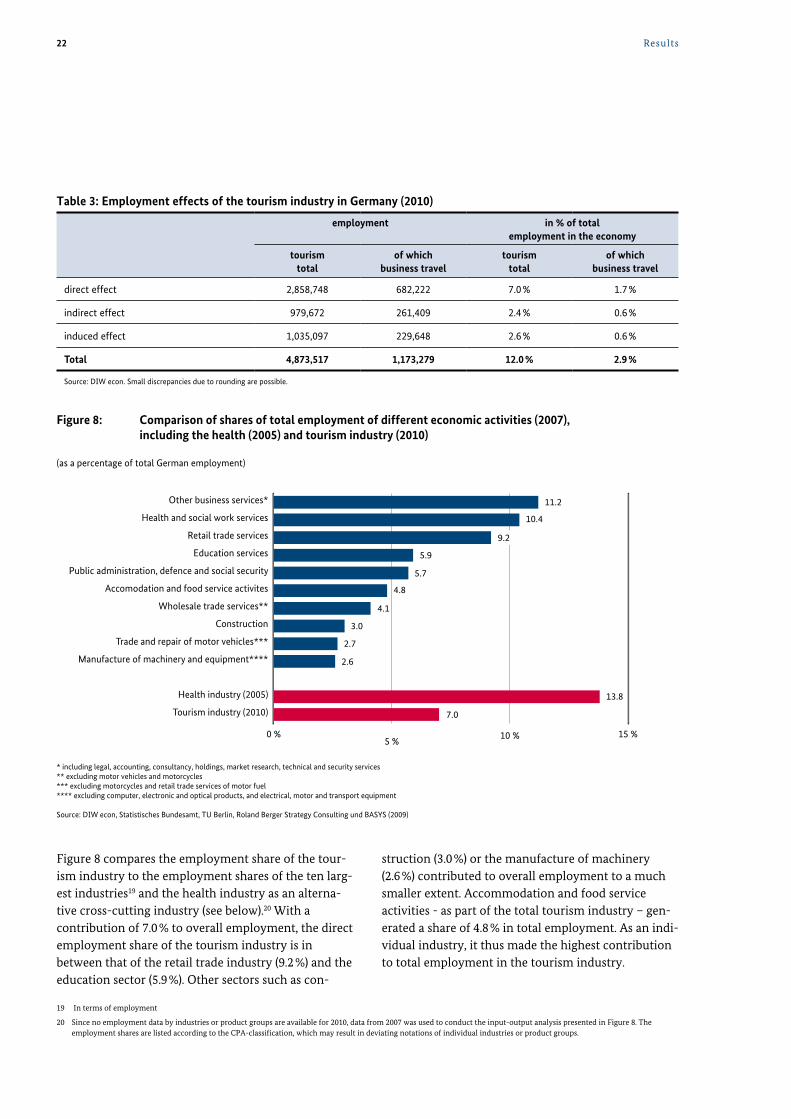
Table 3: Employment effects of the tourism industry in Germany (2010)
employment in % of totalemployment in the economy
tourismtotal
of which business travel
tourismtotal
of which business travel
direct effect 2,858,748 682,222 7.0 % 1.7 %
indirect effect 979,672 261,409 2.4 % 0.6 %
induced effect 1,035,097 229,648 2.6 % 0.6 %
Total 4,873,517 1,173,279 12.0 % 2.9 %
Source: DIW econ. Small discrepancies due to rounding are possible.
0 %5 % 10 % 15 %
Tourism industry (2010)
Health industry (2005)
Manufacture of machinery and equipment****
Trade and repair of motor vehicles***
Construction
Wholesale trade services**
Accomodation and food service activites
Public administration, defence and social security
Education services
Retail trade services
Health and social work services
Other business services* 11.2
10.4
9.2
5.9
5.7
4.8
4.1
3.0
2.7
13.8
2.6
7.0
Figure 8: Comparison of shares of total employment of different economic activities (2007), including the health (2005) and tourism industry (2010)
(as a percentage of total German employment)
* including legal, accounting, consultancy, holdings, market research, technical and security services** excluding motor vehicles and motorcycles*** excluding motorcycles and retail trade services of motor fuel**** excluding computer, electronic and optical products, and electrical, motor and transport equipment
Source: DIW econ, Statistisches Bundesamt, TU Berlin, Roland Berger Strategy Consulting und BASYS (2009)
Figure 8 compares the employment share of the tour-ism industry to the employment shares of the ten larg-est industries19 and the health industry as an alterna-tive cross-cutting industry (see below).20 With a contribution of 7.0 % to overall employment, the direct employment share of the tourism industry is in between that of the retail trade industry (9.2 %) and the education sector (5.9 %). Other sectors such as con-
struction (3.0 %) or the manufacture of machinery (2.6 %) contributed to overall employment to a much smaller extent. Accommodation and food service activities - as part of the total tourism industry – gen-erated a share of 4.8 % in total employment. As an indi-vidual industry, it thus made the highest contribution to total employment in the tourism industry.
19 In terms of employment
20 Since no employment data by industries or product groups are available for 2010, data from 2007 was used to conduct the input-output analysis presented in Figure 8. The employment shares are listed according to the CPA-classification, which may result in deviating notations of individual industries or product groups.

23Results
Just as the tourism industry, the health industry also cuts across several economic activities such as health services, health-related tourism or sports facilities. In 2005, the health industry contributed 13.9 % to total employment in Germany, nearly twice as much as the tourism industry. Health and social work activities as part of the health industry individually generated an employment share of 10.4% and thus the majority of overall employment in the health industry was related to these activities.
Overall tourism employment spreads over various different industries (Figure 9). Most employees in the tourism industry work in the food and beverage serving industry (1.1 million) and accommodation industry (0.8 million). Cultural, sports and recreational services (0.5 million employees), road and local passenger transport services (0.2 million employees) and health services (0.2 million employees in rehabilitation clinics) follow behind. Water passenger transport and car rental services contribute least to overall tourism employment.
Figure 9: Direct, indirect and induced employment effects of the tourism industry in Germany by economic activity (number of employed persons, 2010)
Source: DIW econ
0
200,000
400,000
600,000
800,000
1,000,000
1,200,000
car rental services
water passenger transport services
retail and motor vehicle sale
railway passenger transport services
other business activities
real estate activities
travel agencies and tour operators
air passenger transport services
health services
road and local transport activities
cultural, sports and recreational services
accomodation services
food and beverage serving services
direct indirect induced
empl
oym
ent

24
5. Conclusion
We estimate the economic impact of Germany’s tour-ism industry in 2010. Our methodology is consistent with internationally established procedures as well as official economic statistics in Germany. In our calcula-tions we reconcile data from official sources with the extensive information provided by the tourism indus-try which involved close cooperation with public bod-ies as well as academics and tourism experts. This way, we compile a detailed set of statistics that is comple-mentary to national accounts and input-output tables. The resulting Tourism Satellite Account (TSA) allows for a meaningful assessment of the German tourism industry in terms of income and employment.
The use of a methodology that is fully compatible with official national accounts and internationally recom-mended standards ensures the robustness of the results. This is true, in particular, for the consumption expenditures of the three main groups of visitors (for-eign visitors, domestic overnight visitors, and domestic same-day visitors). Capturing total expenditures first before allocating it into the different expenditure cate-gories avoids under- or overestimation that might occur if individual expenditure items were aggregated into total expenditures. Our approach thus ensures that the impact of tourism in terms of value added and employment that we determine from the aggregate size of domestic tourism consumption is a reasonably precise estimate
The results stress the great economic importance of the tourism industry in Germany. The sector generat-ed a gross value added of 97.0 billion euros in 2010. This is 4.4 % of aggregate German gross value added. Additionally, the tourism industry directly employed almost 2.9 million people. This is 7.0 % of total employment in Germany.
To capture the full economic impact of the tourism industry we add income and employment effects from sectors that supply intermediate inputs to the indus-tries satisfying final tourism demand (so-called indirect effects) and the effects resulting from the consumption expenditures of the persons directly or indirectly employed in the tourism sector (so-called induced effects). In total, these indirect and induced effects amount to 5.3 % of aggregate gross value added and 5.0 % of total employment in 2010. Once we include all direct, indirect and induced effects we calculate that the share of the tourism industry is 9.7 % of German gross value added. The tourism industry’s total share of employment is 12.0 %.
Summarising, our results show that tourism is of considerable importance for the German economy. Further analysis could be carried out to investigate the economic impact of tourism in the German states (Bundesländer) to assess any existing regional differ-ences and to derive state-tailored policy recommen-dations.

25
Appendix: The Tourism Satellite Account (TSA) of Germany (2010)
Appendix 1: Tourism expenditures of foreign visitors in Germany (2010)
in millions of euros Personal trips Business trips In total
overnight visitors1.1
same-day visitors1.2
overnight visitors1.3
same-day visitors1.4
∑1.5
I) Internationally defined tourism characteristic products
1 – Accommodation services 5,443 X 4,077 X 9,519
2 – Food and beverage serving services 3,197 358 1,798 277 5,629
3 – Railway passenger transport services 143 95 43 24 305
4 – Road and local passenger transport services
404 12 286 11 713
5 – Water passenger transport services 176 8 25 2 212
6 – Air passenger transport services 5,973 X 3,649 491 10,112
7 – Car rental services 63 X 70 0 133
8 – Travel agencies and tour operators X X X X X
9 – Cultural, sports and recreational services
1,410 114 525 19 2,068
II) Other tourism characteristic products
10 – Trade show and convention services 1 4 940 5 951
11 – Rehabilitation clinics 35 X X X 35
12 – Groceries 845 89 150 39 1,123
13 – Caravans and motor homes X X X X X
14 – Fuels 328 0 211 0 539
15 – Bicycles X X X X X
III) All other products
16 – All other goods 2,067 544 1,270 332 4,213
17 – All other services 562 27 472 13 1,075
In total 20,647 1,251 13,516 1,214 36,628
Source: DIW econ

26 Appendix
Appendix 2: Tourism expenditures of domestic visitors in Germany (2010)
in millions of euros Personal trips Business trips Inbound share of
outbound trips
In total
overnight visitors
2.1
same-day visitors
2.2
overnight visitors
2.3
same-day visitors
2.4 2.5
∑
2.6
I) Internationally defined tourism characteristic products
1 – Accommodation services 13,298 X 3,837 X X 17,135
2 – Food and beverage serving services 12,809 22,651 1,882 6,704 X 44,047
3 – Railway passenger transport services
690 795 285 430 65 2,265
4 – Road and local passenger transport services
1,238 6,176 331 1,635 377 9,757
5 – Water passenger transport services 366 190 X X 180 735
6 – Air passenger transport services 1,514 X 785 3,973 9,253 15,525
7 – Car rental services 185 224 81 490 64 1,045
8 – Travel agencies and tour operators 1,107 X 959 517 5,617 8,200
9 – Cultural, sports and recreational services
4,915 7,622 550 631 X 13,718
II) Other tourism characteristic products
10 – Trade show and convention services
6 108 2,130 88 0 2,332
11 – Rehabilitation clinics 5,553 X X X 0 5,553
12 – Groceries 3,544 4,651 157 1,283 0 9,635
13 – Caravans and motor homes 503 631 X X 356 1,490
14 – Fuels 4,927 10,893 1,500 6,413 457 24,190
15 – Bicycles 67 468 X X 0 535
III) All other products
16 – All other goods 13,267 38,602 1,330 5,258 164 58,622
17 – All other services 2,718 2,250 737 506 241 6,452
In total 66,706 95,262 14,566 27,929 16,775 221,236
Source: DIW econ (2012)

27Appendix
Appendix 3: Outbound tourism expenditures of domestic residents (2010)
in millions of euros Outbound trips
overnight visitors3.1
same-day visitors3.2
in total3.1 + 3.2 = 3.3
I) Internationally defined tourism characteristic products
1 – Accommodation services 19,812 X 19,812
2 – Food and beverage serving services 10,030 1,850 11,880
3 – Railway passenger transport services 105 68 173
4 – Road and local passenger transport services 5 – Water passenger transport services
2,096 123 2,219
6 – Air passenger transport services 9,244 141 9,385
7 – Car rental services … … …
8 – Travel agencies and tour operators X X X
9 – Cultural, sports and recreational services 4,370 425 4,794
II) Other tourism characteristic products
11 – Rehabilitation clinics 1,265 X 1,265
12 – Groceries 1,981 427 2,413
14 – Fuels 1,093 1,744 2,836
III) All other products
16 – All other goods 9,881 2,656 12,537
17 – All other services 1,639 134 1,773
In total 61,522 7,567 69,089
Source: DIW econ (2012)
28 Appendix
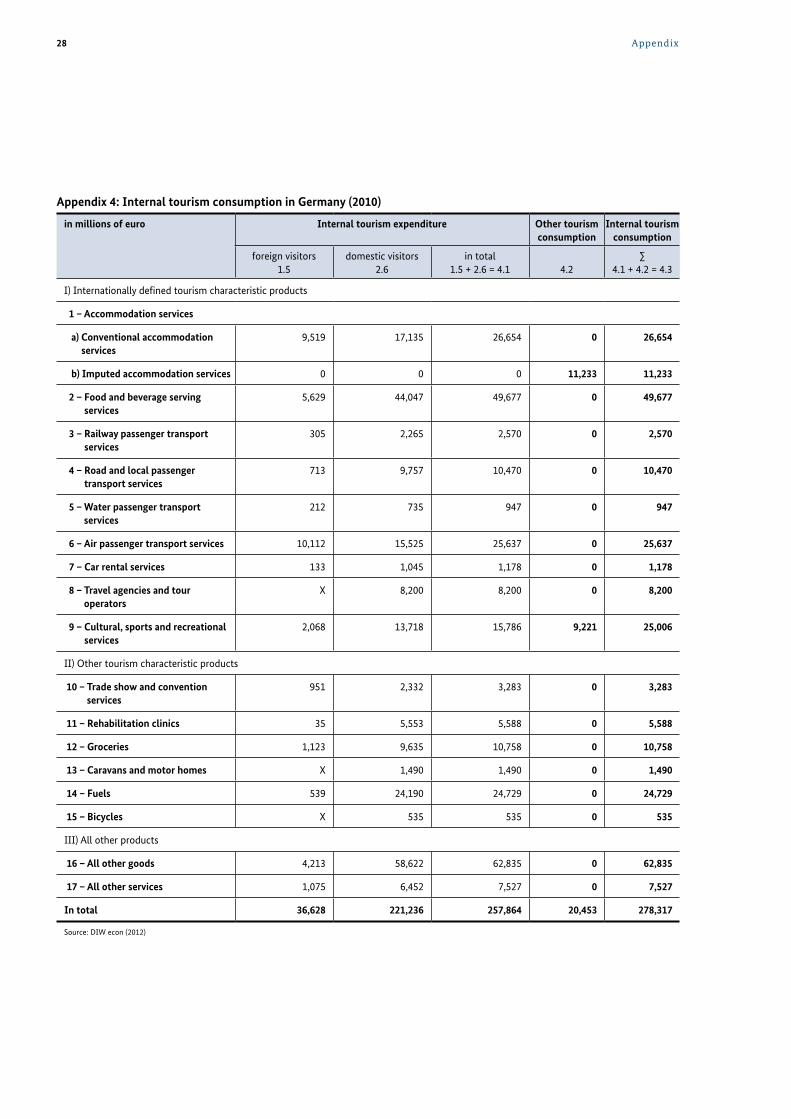
Appendix 4: Internal tourism consumption in Germany (2010)
in millions of euro Internal tourism expenditure Other tourism consumption
Internal tourism consumption
foreign visitors1.5
domestic visitors2.6
in total1.5 + 2.6 = 4.1 4.2
∑4.1 + 4.2 = 4.3
I) Internationally defined tourism characteristic products
1 – Accommodation services
a) Conventional accommodation services
9,519 17,135 26,654 0 26,654
b) Imputed accommodation services 0 0 0 11,233 11,233
2 – Food and beverage serving services
5,629 44,047 49,677 0 49,677
3 – Railway passenger transport services
305 2,265 2,570 0 2,570
4 – Road and local passenger transport services
713 9,757 10,470 0 10,470
5 – Water passenger transport services
212 735 947 0 947
6 – Air passenger transport services 10,112 15,525 25,637 0 25,637
7 – Car rental services 133 1,045 1,178 0 1,178
8 – Travel agencies and tour operators
X 8,200 8,200 0 8,200
9 – Cultural, sports and recreational services
2,068 13,718 15,786 9,221 25,006
II) Other tourism characteristic products
10 – Trade show and convention services
951 2,332 3,283 0 3,283
11 – Rehabilitation clinics 35 5,553 5,588 0 5,588
12 – Groceries 1,123 9,635 10,758 0 10,758
13 – Caravans and motor homes X 1,490 1,490 0 1,490
14 – Fuels 539 24,190 24,729 0 24,729
15 – Bicycles X 535 535 0 535
III) All other products
16 – All other goods 4,213 58,622 62,835 0 62,835
17 – All other services 1,075 6,452 7,527 0 7,527
In total 36,628 221,236 257,864 20,453 278,317
Source: DIW econ (2012)

29Appendix

30 Appendix
Appendix 5: Production accounts of tourism industries and other industries (2010)
in millions of euro Tourism industries
55.1 – 55.2
accommodation activities
5.1a
70.2
real estate activities
5.1b
55.3 – 55.4
food and beverage serving
activities
5.2
60.1
railway transport
5.3
60.2
road and local transport
5.4
61.1 – 61.2
water transport
5.5
I) Internationally defined tourism characteristic products
1 – Accommodation services
a) Conventional accommodation services
25,787
b) Imputed accommodation services 234,645
2 – Food and beverage serving services 37,999
3 – Railway passenger transport services 8,989
4 – Road and local passenger transport services
2 16,370
5 – Water passenger transport services 1,015
6 – Air passenger transport services
7 – Car rental services
8 – Travel agencies and tour operators
9 – Cultural, sports and recreational services
II) Other tourism characteristic products
10 – Trade show and convention services
11 – Rehabilitation clinics
12 – Groceries 203 392
13 – Caravans and motor homes
14 – Fuels 129
15 – Bicycles
III) All other products
16 – All other goods 11 9 20 537 140
17 – All other services 523 77,920 723 6,564 36,514 24,128
I. Total output(at producer prices)
26,524 312,566 39,122 15,575 53,421 25,412
II. Total intermediate consumption (at purchasers‘ prices)
13,585 73,948 20,037 8,905 30,544 16,962
I-II. Total gross value added (at producer prices)v
12,939 238,618 19,085 6,670 22,877 8,450
Compensation of employees 8,181 9,904 12,067 5,214 17,883 1,227
Other taxes less subsidies on production 70 9,596 103 –16 –56 263
Depreciation 863 87,584 1,273 1,368 4,691 3,718
Net operating surplus 3,825 131,535 5,642 105 360 3,242
Ratio of gross value added over output 49 % 76 % 49 % 43 % 43 % 33 %
Source: DIW econ
Tourism industries
all other industries
5.14
Total output of domestic producers
62.1 – 62.2
air transport
5.6
71.1
car rental
5.7
63.3
travel agencies and
tour operators
5.8
92.3-7 o.4, 93.0
cultural, sport and recreatio-
nal industry
5.9
74.8
other business activities
5.10
85.1
health industry
5.11
50. 52
retail trade activities
5.12
tourism industries
5.13
5.13+
5.14=
5.15
25,787 98 25,884
234,645 234,645
37 190 38,226 10,590 48,816
8,989 8,989
81 3 16,456 1,409 17,865
1,015 1,015
21,992 21,992 21,992
26,177 432 26,609 26,609
517 7,567 8,083 8,083
38,521 38,521 2,167 40,688
6,089 6,089 126 6,215
86,285 86,285 86,285
120 715 181,706 182,420
2,328 2,328
129 30,044 30,173
37 37 866 903
40 606 100 500 1,963 1,821,869 1,823,831
4,822 208 52,384 76,733 94,996 210,369 585,883 1,524,175 2,110,058
27,407 26,177 7,856 91,511 82,822 181,380 211,650 1,101,423 3,575,377 4,676,800
23,127 5,522 4,769 33,743 33,172 58,682 93,977 416,972 2,043,018 2,459,990
4,280 20,655 3,086 57,769 49,650 122,698 117,673 684,451 1,532,359 2,216,810
2,895 1,254 1,574 18,398 25,152 78,291 85,883 267,923 931,010 1,198,933
104 222 66 -109 607 -3,299 3,272 10,821 17,565 28,386
976 17,798 753 8,711 1,648 14,168 8,145 151,696 213,659 365,355
305 1,380 693 30,768 22,244 33,538 20,373 254,011 370,125 624,136
16 % 79 % 39 % 63 % 60 % 68 % 56 % 62 % 43 % 47 %

31Appendix
Appendix 5: Production accounts of tourism industries and other industries (2010)
in millions of euro Tourism industries Tourism industries
all other industries
5.14
Total output of domestic producers
55.1 – 55.2
accommodation activities
5.1a
70.2
real estate activities
5.1b
55.3 – 55.4
food and beverage serving
activities
5.2
60.1
railway transport
5.3
60.2
road and local transport
5.4
61.1 – 61.2
water transport
5.5
62.1 – 62.2
air transport
5.6
71.1
car rental
5.7
63.3
travel agencies and
tour operators
5.8
92.3-7 o.4, 93.0
cultural, sport and recreatio-
nal industry
5.9
74.8
other business activities
5.10
85.1
health industry
5.11
50. 52
retail trade activities
5.12
tourism industries
5.13
5.13+
5.14=
5.15
I) Internationally defined tourism characteristic products
1 – Accommodation services
a) Conventional accommodation services
25,787 25,787 98 25,884
b) Imputed accommodation services 234,645 234,645 234,645
2 – Food and beverage serving services 37,999 37 190 38,226 10,590 48,816
3 – Railway passenger transport services 8,989 8,989 8,989
4 – Road and local passenger transport services
2 16,370 81 3 16,456 1,409 17,865
5 – Water passenger transport services 1,015 1,015 1,015
6 – Air passenger transport services 21,992 21,992 21,992
7 – Car rental services 26,177 432 26,609 26,609
8 – Travel agencies and tour operators 517 7,567 8,083 8,083
9 – Cultural, sports and recreational services
38,521 38,521 2,167 40,688
II) Other tourism characteristic products
10 – Trade show and convention services
6,089 6,089 126 6,215
11 – Rehabilitation clinics 86,285 86,285 86,285
12 – Groceries 203 392 120 715 181,706 182,420
13 – Caravans and motor homes 2,328 2,328
14 – Fuels 129 129 30,044 30,173
15 – Bicycles 37 37 866 903
III) All other products
16 – All other goods 11 9 20 537 140 40 606 100 500 1,963 1,821,869 1,823,831
17 – All other services 523 77,920 723 6,564 36,514 24,128 4,822 208 52,384 76,733 94,996 210,369 585,883 1,524,175 2,110,058
I. Total output(at producer prices)
26,524 312,566 39,122 15,575 53,421 25,412 27,407 26,177 7,856 91,511 82,822 181,380 211,650 1,101,423 3,575,377 4,676,800
II. Total intermediate consumption (at purchasers‘ prices)
13,585 73,948 20,037 8,905 30,544 16,962 23,127 5,522 4,769 33,743 33,172 58,682 93,977 416,972 2,043,018 2,459,990
I-II. Total gross value added (at producer prices)v
12,939 238,618 19,085 6,670 22,877 8,450 4,280 20,655 3,086 57,769 49,650 122,698 117,673 684,451 1,532,359 2,216,810
Compensation of employees 8,181 9,904 12,067 5,214 17,883 1,227 2,895 1,254 1,574 18,398 25,152 78,291 85,883 267,923 931,010 1,198,933
Other taxes less subsidies on production 70 9,596 103 –16 –56 263 104 222 66 -109 607 -3,299 3,272 10,821 17,565 28,386
Depreciation 863 87,584 1,273 1,368 4,691 3,718 976 17,798 753 8,711 1,648 14,168 8,145 151,696 213,659 365,355
Net operating surplus 3,825 131,535 5,642 105 360 3,242 305 1,380 693 30,768 22,244 33,538 20,373 254,011 370,125 624,136
Ratio of gross value added over output 49 % 76 % 49 % 43 % 43 % 33 % 16 % 79 % 39 % 63 % 60 % 68 % 56 % 62 % 43 % 47 %
Source: DIW econ
32 Appendix
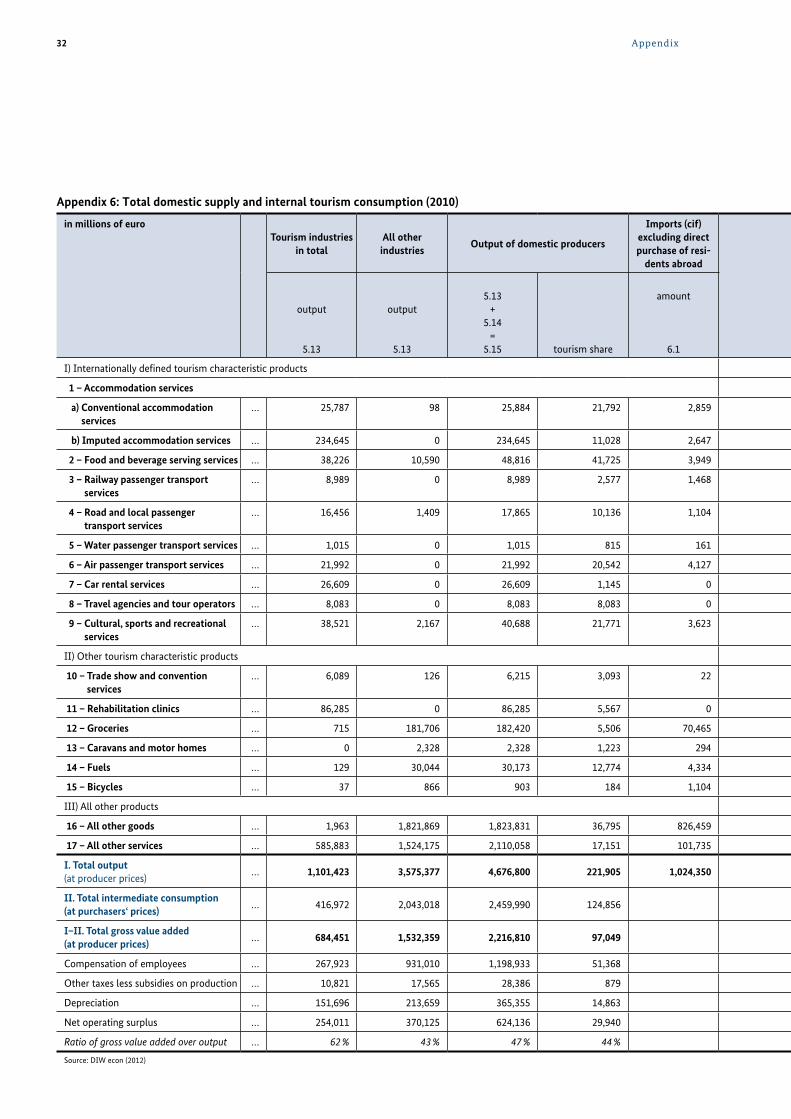
Appendix 6: Total domestic supply and internal tourism consumption (2010)
in millions of euroTourism industries
in totalAll other
industriesOutput of domestic producers
Imports (cif)excluding direct purchase of resi-
dents abroad
output
5.13
output
5.13
5.13+
5.14=
5.15 tourism share
amount
6.1
I) Internationally defined tourism characteristic products
1 – Accommodation services
a) Conventional accommodation services
… 25,787 98 25,884 21,792 2,859
b) Imputed accommodation services … 234,645 0 234,645 11,028 2,647
2 – Food and beverage serving services … 38,226 10,590 48,816 41,725 3,949
3 – Railway passenger transport services
… 8,989 0 8,989 2,577 1,468
4 – Road and local passenger transport services
… 16,456 1,409 17,865 10,136 1,104
5 – Water passenger transport services … 1,015 0 1,015 815 161
6 – Air passenger transport services … 21,992 0 21,992 20,542 4,127
7 – Car rental services … 26,609 0 26,609 1,145 0
8 – Travel agencies and tour operators … 8,083 0 8,083 8,083 0
9 – Cultural, sports and recreational services
… 38,521 2,167 40,688 21,771 3,623
II) Other tourism characteristic products
10 – Trade show and convention services
… 6,089 126 6,215 3,093 22
11 – Rehabilitation clinics … 86,285 0 86,285 5,567 0
12 – Groceries … 715 181,706 182,420 5,506 70,465
13 – Caravans and motor homes … 0 2,328 2,328 1,223 294
14 – Fuels … 129 30,044 30,173 12,774 4,334
15 – Bicycles … 37 866 903 184 1,104
III) All other products
16 – All other goods … 1,963 1,821,869 1,823,831 36,795 826,459
17 – All other services … 585,883 1,524,175 2,110,058 17,151 101,735
I. Total output(at producer prices)
… 1,101,423 3,575,377 4,676,800 221,905 1,024,350
II. Total intermediate consumption(at purchasers‘ prices)
… 416,972 2,043,018 2,459,990 124,856
I–II. Total gross value added (at producer prices)
… 684,451 1,532,359 2,216,810 97,049
Compensation of employees … 267,923 931,010 1,198,933 51,368
Other taxes less subsidies on production … 10,821 17,565 28,386 879
Depreciation … 151,696 213,659 365,355 14,863
Net operating surplus … 254,011 370,125 624,136 29,940
Ratio of gross value added over output … 62 % 43 % 47 % 44 %
Source: DIW econ (2012)
Domestic supply at producer prices
Taxes lesssubsidies
Trade marginsDomestic supply at
purchasers‘ prices
Internal tourism consumption
Tourism ratiosin %
amount
6.2
amount
6.3
wholesale trade services
6.4
retail trade services
6.5
5.15 + 6.1 +
6.3 + 6.4 + 6.5 =
6.6 4.3
4.3/ 6.5in %
=6.6
28,744 2,917 x x 31,660 26,654 84.2 %
237,292 1,707 x x 238,999 11,233 4.7 %
52,765 5,354 x x 58,119 49,677 85.5 %
10,457 -1,492 x x 8,965 2,570 28.7 %
18,969 -514 x x 18,455 10,470 56.7 %
1,176 4 x x 1,180 947 80.3 %
26,119 1,328 x x 27,447 25,637 93.4 %
26,609 788 x x 27,396 1,178 4.3 %
8,083 117 x x 8,200 8,200 100.0 %
44,311 2,425 x x 46,735 25,006 53.5 %
6,238 359 x x 6,597 3,283 49.8 %
86,285 328 x x 86,612 5,588 6.5 %
252,885 21,622 32,284 49,648 356,440 10,758 3.0 %
2,622 56 64 95 2,837 1,490 52.5 %
34,506 19,006 3,671 1,229 58,412 24,729 42.3 %
2,007 43 247 323 2,621 535 20.4 %
2,650,290 161,572 177,281 125,398 3,114,541 62,835 2.0 %
2,211,792 49,516 –213,547 –176,693 1,871,068 7,527 0.4 %
5,701,150 265,134 0 0 5,966,284 278,317 4.7 %
4.4 %

33Appendix
Appendix 6: Total domestic supply and internal tourism consumption (2010)
in millions of euroTourism industries
in totalAll other
industriesOutput of domestic producers
Imports (cif)excluding direct purchase of resi-
dents abroad
Domestic supply at producer prices
Taxes lesssubsidies
Trade marginsDomestic supply at
purchasers‘ prices
Internal tourism consumption
Tourism ratiosin %
output
5.13
output
5.13
5.13+
5.14=
5.15 tourism share
amount
6.1
amount
6.2
amount
6.3
wholesale trade services
6.4
retail trade services
6.5
5.15 + 6.1 +
6.3 + 6.4 + 6.5 =
6.6 4.3
4.3/ 6.5in %
=6.6
I) Internationally defined tourism characteristic products
1 – Accommodation services
a) Conventional accommodation services
… 25,787 98 25,884 21,792 2,859 28,744 2,917 x x 31,660 26,654 84.2 %
b) Imputed accommodation services … 234,645 0 234,645 11,028 2,647 237,292 1,707 x x 238,999 11,233 4.7 %
2 – Food and beverage serving services … 38,226 10,590 48,816 41,725 3,949 52,765 5,354 x x 58,119 49,677 85.5 %
3 – Railway passenger transport services
… 8,989 0 8,989 2,577 1,468 10,457 -1,492 x x 8,965 2,570 28.7 %
4 – Road and local passenger transport services
… 16,456 1,409 17,865 10,136 1,104 18,969 -514 x x 18,455 10,470 56.7 %
5 – Water passenger transport services … 1,015 0 1,015 815 161 1,176 4 x x 1,180 947 80.3 %
6 – Air passenger transport services … 21,992 0 21,992 20,542 4,127 26,119 1,328 x x 27,447 25,637 93.4 %
7 – Car rental services … 26,609 0 26,609 1,145 0 26,609 788 x x 27,396 1,178 4.3 %
8 – Travel agencies and tour operators … 8,083 0 8,083 8,083 0 8,083 117 x x 8,200 8,200 100.0 %
9 – Cultural, sports and recreational services
… 38,521 2,167 40,688 21,771 3,623 44,311 2,425 x x 46,735 25,006 53.5 %
II) Other tourism characteristic products
10 – Trade show and convention services
… 6,089 126 6,215 3,093 22 6,238 359 x x 6,597 3,283 49.8 %
11 – Rehabilitation clinics … 86,285 0 86,285 5,567 0 86,285 328 x x 86,612 5,588 6.5 %
12 – Groceries … 715 181,706 182,420 5,506 70,465 252,885 21,622 32,284 49,648 356,440 10,758 3.0 %
13 – Caravans and motor homes … 0 2,328 2,328 1,223 294 2,622 56 64 95 2,837 1,490 52.5 %
14 – Fuels … 129 30,044 30,173 12,774 4,334 34,506 19,006 3,671 1,229 58,412 24,729 42.3 %
15 – Bicycles … 37 866 903 184 1,104 2,007 43 247 323 2,621 535 20.4 %
III) All other products
16 – All other goods … 1,963 1,821,869 1,823,831 36,795 826,459 2,650,290 161,572 177,281 125,398 3,114,541 62,835 2.0 %
17 – All other services … 585,883 1,524,175 2,110,058 17,151 101,735 2,211,792 49,516 –213,547 –176,693 1,871,068 7,527 0.4 %
I. Total output(at producer prices)
… 1,101,423 3,575,377 4,676,800 221,905 1,024,350 5,701,150 265,134 0 0 5,966,284 278,317 4.7 %
II. Total intermediate consumption(at purchasers‘ prices)
… 416,972 2,043,018 2,459,990 124,856
I–II. Total gross value added (at producer prices)
… 684,451 1,532,359 2,216,810 97,049 4.4 %
Compensation of employees … 267,923 931,010 1,198,933 51,368
Other taxes less subsidies on production … 10,821 17,565 28,386 879
Depreciation … 151,696 213,659 365,355 14,863
Net operating surplus … 254,011 370,125 624,136 29,940
Ratio of gross value added over output … 62 % 43 % 47 % 44 %
Source: DIW econ (2012)

34 Appendix
Appendix 7: Employment related to internal tourism consumption (2010)
employed persons Related to tourism consumption
Total Tourism ratiosin %
I) Internationally defined tourism characteristic products
1 – Accommodation services
a) Conventional accommodation services 587,977 698,407 84.2 %
b) Imputed accommodation services 0 0 4.7 %
2 – Food and beverage serving services 1,125,821 1,317,136 85.5 %
3 – Railway passenger transport services 18,634 65,005 28.7 %
4 – Road and local passenger transport services 159,006 280,268 56.7 %
5 – Water passenger transport services 718 894 80.3 %
6 – Air passenger transport services 42,370 45,360 93.4 %
7 – Car rental services 2,157 50,158 4.3 %
8 – Travel agencies and tour operators 46,819 46,819 100.0 %
9 – Cultural, sports and recreational services 256,142 478,712 53.5 %
II) Other tourism characteristic products
10 – Trade show and convention services 40,141 80,663 49.8 %
11 – Rehabilitation clinics 102,821 1,593,636 6.5 %
12 – Groceries 42,070 1,393,927 3.0 %
13 – Caravans and motor homes 2,510 4,778 52.5 %
14 – Fuels 3,585 8,467 42.3 %
15 – Bicycles 794 3,892 20.4 %
III) All other products
16 – All other goods 197,852 8,894,370 2.2 %
17 – All other services 229,333 25,590,506 0.9 %
In total 2,858,748 40,553,000 7.0 %
Source: DIW econ (2012)