the ec textile and clothing industry 1991/1992aei.pitt.edu/35081/1/a1134.pdf · 14. productivity,...
TRANSCRIPT

*** * * * * ** ** * *****
* * * *
*** * *** * *** * * * * *** * * * *
L'Observatoire europeen
du textile et de l'habillement
THE EC TEXTILE AND
CLOTHING INDUSTRY 1991/1992
-A Factual Report -

i'
.if llP ~ 7 ( rx . I
(;.f) ,,.t:'
THE EC TEXTILE AND CLOTHING INDUSTRY 1991/92
- A Factual Report -/
Prepared by the OETH at the request of the Directorate General Ill of the European Commission 'I
Brussels, April 1993
J '"'--• ~ ' ' .(
CONTENTS:
INTRODUCTION
1. SUMMARY
2. THE ECONOMIC BACKGROUND
3. RECENT DEVELOPMENTS IN PRODUCTION, EMPLOYMENT AND INVESTMENT
3.1 o PRODUCTION
3o2o EMPLOYMENT
3o3o INVESTMENT
4. EVOLUTION OF TRADE
4o 1 o EXTERNAL EC TRADE
4o2o INTERNAL EC TRADE
4o3o OUTWARD PROCESSING TRADE {OPT)
5. DEMAND FOR TEXTILE AND CLOTHING PRODUCTS
5o1o CONSUMPTION
5020 RETAIL SALES
6. COMPETITIVITY OF THE EC TEXTILE AND CLOTHING INDUSTRIES
6. 1. PRODUCTIVITY
6020 LABOUR COSTS
7. TEXTILE MACHINERY TRENDS
PAGE:
1
2
5
8
10
1 1
13
16
17
19
20
22
23
24
8. SPECIAL TOPIC: EASTERN EUROPE AND THE FORMER SOVIET UNION
8.1. THE ECONOMIC BACKGROUND
8.2. TEXTILES AND CLOTHING
9. TABLES AND GRAPHS
10. USERS' NOTES
PAGE:
26
28
32
60
LIST OF TABLES :
1. EC: PRODUCTION OF TEXTILES AND CLOTHING 1985-1992
2. EC: STRUCTURAL DATA ON THE TEXTILE AND CLOTHING INDUSTRY 1988-1992
3. EC: EMPLOYMENT AND INVESTMENT IN THE TEXTILE INDUSTRY IN 1990-1991
4. EC: MFA EXTERNAL TRADE, 1990-1992
5. EC: IMPORTS OF TEXTILES AND CLOTHING 1988-1992
6. EC: EXPORTS OF TEXTILES AND CLOTHING, 1988-1992
7. EC: TEXTILES AND CLOTHING IMPORTS (EXTRA AND INTRA)
8. EC: TEXTILES AND CLOTHING EXPORTS (EXTRA AND INTRA)
9. OPT KEY FIGURES ON IMPORTS 1989-1992
10. EC: OPT IMPORTS AS 0/o OF TOTAL IMPORTS IN 1991
11. IMPORTANCE OF OPT TRADE IN TOTAL TRADE 1989-1992
12. EC: OPT IMPORTS OF MFA CLOTHING BY SOURCE COUNTRY 1991-1992
13. EC: TOTAL IMPORTS- QUOTA UTILISATION 1991
14. PRODUCTIVITY, 1991-1992
15. EC: APPARENT CONSUMPTION OF THE KNITTING INDUSTRY & WOVEN CLOTHING, 1990-1992
16. INDICES OF PRODUCER PRICES
17. INDICES OF CONSUMER PRICES
18. RETAIL SALES INDEX: CLOTHING, FOOTWEAR & LEATHER GOODS, 1990-1992
19. SPINNING MACHINERY
20. WEAVING MACHINERY
21. HUNGARY: TEXTILES & CLOTHING, 1980-1992
22. POLAND: TEXTILES & CLOTHING, 1985-1992
23. EC: PECO TRADE IN MFA T&C PRODUCTS -1992
24. RUSSIA: PRODUCTION AND IMPORTS, 1980-1992
25. RUSSIA: PRODUCTION INDICES, 1986-1991
26. USSR: PRODUCTION OF TEXTILES & CLOTHING, 1980-1990

INTRODUCTION
The purpose of this report is to present a factual analysis of the situation in the EC textile and clothing industry in 1992, together with recent trends.
In the analysis below, the emphasis has been on changes in 1992, where this information has been available. Comparisons have been made also with the situation in 1985 and 1988. Information for individual member states is given, where appropriate.
An analysis of the textile and clothing industries in Central and Eastern Europe and the former Soviet Union features as a special topic.
The OETH would like to thank the many organisations and individuals who have contributed material and comments for this report.
1

1. SUMMARY
1.1. The world economy continued to be depressed in 1992, although there was some recovery in the United States. World trade showed little signs of faster growth overall, but was much more buoyant for Far Eastern countries than for the countries of Western Europe.
1.2. The slow growth of GOP in the leading EC countries, together with the slow growth in their trade, was a major reason for the continued state of depression in the EC' s textile and clothing industries, which saw in 1992 further falls in production, and especially in employment. Investment has also been falling. The EC's balance of trade deficit for textiles and clothing, however, scarcely changed in 1992.
1.3. In 1992 the production of both textiles and clothing in the EC continued to fall - for the third year consecutively- and at a slightly higher rate than in the previous year. Compared with the reduction of production of textiles (3.4%) and of clothing (3.1 %), the reduction of production in manufacturing as a whole was less, at 1.3%.
Textile and clothing production not only did worse than the average for manufacturing in 1992, but far worse over the whole period 1985-92, especially in the case of clothing.
1.4. Employment has continued to fall in the industry, in both the textile and clothing sectors: 165,000 jobs were lost in 1992, which represents a higher proportion of employment (6o/o) than in earlier years. In 1992, the number of jobs lost in this sector represented about 20o/o of the employment contraction in manufacturing industry as a whole.
1.5. Investment in the EC's textile and clothing industries has fallen in recent years. The decline started earlier in the textile industry than the clothing industry. Investment per employee differs among member states. It has been highest in the Benelux countries, at a high level in Denmark, Germany, Italy and France, but at a low level in Greece, the UK, Portugal and Spain.
2
1.6. Imports of textiles and clothing from outside the EC rose by over 2°.k in terms of tonnage in 1992 (nearly 3% for MFA categories). Exports rose by 6% (3% for MFA categories). The ratio of exports to imports improved for MFA textiles from 77% to 78%, while that for MFA clothing remained unchanged at 18%.
In terms of ECUs, the balance of trade improved for MFA textiles (and remained strongly positive for the EC as a whole), while that for clothing deteriorated slightly. Despite the slowdown of imports and the moderate export recovery, the long-run tendency for the EC' s international trade competitiveness to deteriorate almost certainly remains.
1. 7. Trade in textiles and clothing among member states rose in 1992 by moderate rates (1.5% in textiles imports and 3% in clothing}. On a more long-term basis, there is evidence showing that trade within the EC has increased faster than exports to non-EC countries and slower than imports from outside the EC.
1.8. Total OPT clothing imports into the EC, of every MFA category, accounted in 1992 for some 1 Oo/o of total EC imports of clothing, in tonnage terms. This proportion has changed relatively little since 1989, despite the fact that import quotas have been under-utilised and that some major suppliers enjoy free access for their OPT exports to the EC.
During 1992, OPT imports of clothing into the EC rose by some 13o/o. Recent trends suggest that the distribution of OPT imports among member states may tend to be more balanced in the future (at present Germany represents 62°ft» of the EC total), and that the weight of Eastern European countries {with the exception of ex-Yugoslavia} will continue to increase.
1.9. Consumers' textile and clothing expenditure fell in 1992. The estimated apparent consumption of woven clothing in the EC fell slightly in constant prices, as compared with 1991 . There was a rise between 1990 and 1992 of about 2°ft» in constant prices. The estimated apparent consumption of the EC knitting industry fell in 1992. However, there was a rise between 1990 and 1992, in constant prices, of about 7%.
In line with the evolution of demand, retail sales of clothing fell in the EC as a whole in 1992, after little change between 1990 and 1991. The fall in sales in 1992 affected all the largest countries in the EC.
3

1.1 0. Productivity. measured by output per employee is higher in manufacturing as a whole than in textiles, and higher in textiles than in clothing. Between 1991 and 1992, output per employee rose faster in textiles and clothing than in manufacturing. In individual countries, high output per employee and high investment per employee tend to go together.
1. 11. The textile machinery market showed mixed trends in 1992. There was a severe fall in shipments of short-staple (cotton) spindles, to all areas except the former Comecon countries. In contrast, there was an overall increase in shipments of long-staple (wool) spindles, including an increase to the EC.
In weaving, there was an overall increase in shipments of shuttle-less looms, but deliveries to the EC fell substantially.
1. 12. Looking at the situation more generally, the EC textile and clothing industries, and the industries associated with them, will no doubt benefit, in the short-run, as the present recession comes to an end. In the long-run, however, many different scenarios are possible.
4

2. THE ECONOMIC BACKGROUND
The world economy continued to be depressed in 1992, although there was some recovery in the United States. World trade showed little signs of faster growth overall, but was much more buoyant for Far Eastern countries than for the countries of Western Europe.
The slow growth of GOP in the leading EC countries, together with the slow growth in their trade, was a major reason for the continued state of depression in the EC's textile and clothing industries.
In spite of a modest recovery, world economic activity remained weak in 1992: world GOP grew by 1.8%, while the volume of world trade expanded by 5o/o. Both figures are below the trend of the last two decades.
The leading seven industrialised countries saw a rise in GOP of 1.6%, after the near stagnation of the year before. Their respective experiences, however, are different. The US economy recorded a satisfactory performance with an increase in real GOP of 2% in 1992. However, despite some strong growth in the second half of last year, the present recovery remains weak. In Japan, the strong rate of growth of 1991 (4o/o) gave way to a significant deceleration in the course of 1992. In spite of a very significant budgetary stimulus, growth is not expected to return towards its previous trend until well into 1994. As a result of this pronounced cyclical movement, the Japanese rate of growth in 1992 was 1.4%, with 1993 expected to record a figure which will be roughly equivalent.
The GOP of the EC rose by 1 . 1 % only in 1992, after rises of 2.8% in 1990 and 1.4% in 1991. The UK experienced a second year of recession while most of the remaining member states recorded rates of growth of between one and two per cent. However, in the second half of 1992, the EC economy is estimated to have actually stagnated and growth prospects for 1993 are poor. This marked slowdown is the result of a combination of cyclical elements and continued tight monetary policies. Business and consumer confidence are at low levels. This constitutes an obstacle to a recovery which can tentatively be assumed to take hold in the second half of 1993.
In 1992, all components of demand were affected by the general weakness of the EC economy. Investment, traditionally the most volatile component, actually stagnated for the second year in succession. Employment declined for the first time since 1983 leading to a strong
5
increase in unemployment which is expected to reach 11 °/o in the course of 1993.
The recent turmoil in the exchange rate mechanism of the EMS is both a result of the deterioration in economic conditions in Europe and a factor contributing to the persistence of depressed economic conditions. The growing imbalances since the last ERM realignment, and cyclical divergences in the EC - strong growth with inflationary pressures in Germany, and weak growth, with inflation under control, in many other countries - led two important currencies leaving the ERM in September 1992. The lira, the pound, the peseta, the escudo and the Irish punt all depreciated against the 0-mark. The pound and the lira have depreciated by 17% and 20% respectively since leaving the ERM.
In the wake of the ERM crisis, short-term interest rates came down in most countries. Long-term rates, however, which respond essentially to inflationary expectations, have come down much less and, in the EC as a whole, are about one point lower than at the beginning of 1992.
Further interest rate reductions, as announced by the Bundesbank in April 1993, could constitute the most significant contribution to a recovery in the EC. However, confidence has been undermined by the impasse in the Uruguay Round negotiations, and the economic and social problems in Central and Eastern Europe, as well as in the former Soviet Union.
World trade growth has slowed over the last three years. The peak growth was 1 Oo/o in 1989 in trade in all commodities and between all market economies. In 1992 the growth was 5%. Trade has however slowed down less than has usually been the case in previous cycles. It has been boosted by the growth in trade between less developed countries, and rapid import growth in North America - 11% for the USA in 1992 and nearly 6% for Canada. This North American development may in part reflect the growing effects of the North American Free Trade Area (NAFT A}.
There has been a continued increase in imports into mainland China, but much of Chinese trade is with the rest of the Far East, and especially with Japan. In the Far East, imports grew strongly in both 1991 and 1992 - by 14% in 1991, and by over 13% in 1992. The contrast with developments in Western European trade has been marked.
The prospects for European exporters are dependent on developments in their export markets, and these do not generally look as strong as markets in the world as a whole. The UK exports a larger proportion of its goods to North America than either France or Germany, and in Europe exports principally to Germany and France. Germany has
6

larger market shares in the Netherlands, the UK and the rest of industrialised Europe than has Britain or France. France sends a high share of its exports to Germany and Italy.
Between 1991 and 1992, UK and French exports were held back by slow import growth in Germany, the Netherlands and Belgium. German import growth was 0.9% only in 1992, as compared with 14°k in 1991. In 1992 the growth in the UK and Germany's export markets was some 2%, while it was 2.5% for France. In 1991, on the other hand, the UK and Germany had export growth of over 3%, while France had export growth of nearly 7%.
The slow growth of GDP in the leading EC countries, together with the associated slow growth in their trade, was no doubt a major reason for the continued state of depression in EC' s manufacturing industries, including their textile and clothing sectors.
The evidence on the demand for textile and clothing products indicates a fall in the apparent consumption of clothing in the EC last year. As regards retail sales, the volume of retail sales of clothing, footwear and leather goods together, fell by 5% in 1992, following virtually no change in 1991.
7

3. RECENT DEVELOPMENTS IN PRODUCTION, EMPLOYMENT AND INVESTMENT
3.1. PRODUCTION
In 1992 the production of both textiles and clothing in the EC continued to fall -for the third year consecutively -and at a slightly higher rate than in the previous year. Compared with the reduction of production of textiles (3.4%) and of clothing (3.1%), the reduction of production in manufacturing as a whole was less, at 1.3%.
Textiles and clothing therefore did worse than the average for manufacturing in 1992, and far worse over the whole period 1985-92, especially in the case of clothing.
The volume of textile. production (including knitwear, but excluding man-made fibres) had fallen in 1991 by 3o/o, but in 1992 the fall compared with 1991 was greater, at 3.4% (Table 1 ). Knitting industry production fell by 4°/o, compared with the previous year.
In 1992, the index of textile production in the EC fell below its 1985 level (to 96.9), after having reached a peak of over 4% above that level in 1989. The index of knitting industry production in 1992 was just below its 1985 level, in volume terms.
EC production of woven clothing fell in 1992 by slightly more than in 1991 - a fall of 3.1 %, as compared with a fall of 3% in the previous year. The index of clothing production in 1992 (at 84.5) was well below its 1985 level.
These figures for textile and for clothing production compare with a fall of 1.3o/o in the index of manufacturing production as a whole, in 1992. The index of manufacturing production for the EC in 1992 was, at 115, well above its 1985 level. Textiles and clothing therefore did worse than the average for manufacturing in 1992, and far worse over the whole period 1985-92, especially in the case of clothing.
Production of man-made fibres was some 5% higher in 1992 than in 1991. The rise occurred both in the production of synthetic and cellulosic filament yarn in 1992, and also of staple. Synthetic filament yarn output was slightly above its 1985 level, but in the other sectors production remained well below this level.
8
Looking at individual Community countries, textile production fell generally in 19921 in all but Belgium and Ireland. The biggest decrease took place in Germany.
Man-made fibre production rose most in Spain and Portugal.
Woven clothing production fell in all but Italy I Belgium/Luxembourg, the UK, and Denmark. It was unchanged in Portugal.
Over the whole period 1985-92, the most marked changes in textile production have been increases in Ireland, Italy I and Belgium/Luxembourg, and falls in France, the UK, Denmark and Greece.
As regards clothing, increases in production between 1985 and 1992 have taken place in the Netherlands, Belgium/Luxembourg, and Portugal. Italian production, after some years below its 1985 level, rose to this level in 1992. Marked falls, compared with 1985, have taken place in France, Denmark, Germany and Ireland, but the falls have been less in the UK, Spain and Greece.
Knitting industry production in member states has evolved very differently since 1985. Substantial increases have taken place in Ireland and Italy (to 189 and 1 28 respectively in 1992) I but appreciable falls, of between 17% to 23% have occurred in the UK, France and Germany.
In 1992 there were considerable differences in the evolution of the EC's output of the different products of the industry.
In fibres and yarns there were substantial increases in combed wool output and in the output of carded and combed wool yarns. There was a particularly large increase in the output of linen yarn. On the other hand, cotton yarn output fell appreciably.
In woven fabrics, the increase in the output of linen fabrics was very marked, while there was a small increase in the output of wool fabrics. The output of cotton fabrics and of synthetic staple fabrics fell substantially. So did the output of household textiles. The output of other home textiles, mainly carpets, held up well. Production of non-wovens increased, but at a lower rate than in previous years.
Among knitted products, the only one to show an appreciable increase in output in 1992 was babies' under-garments. There were especially large falls in the output of women's hosiery and of knitted work clothes.
9
In clothing, made from woven materials, the changes in output were not large. The only sizeable increase was in corsetry, while much the largest fall in output was in swimwear. Other falls took place in the output of dressing gowns and work clothes.
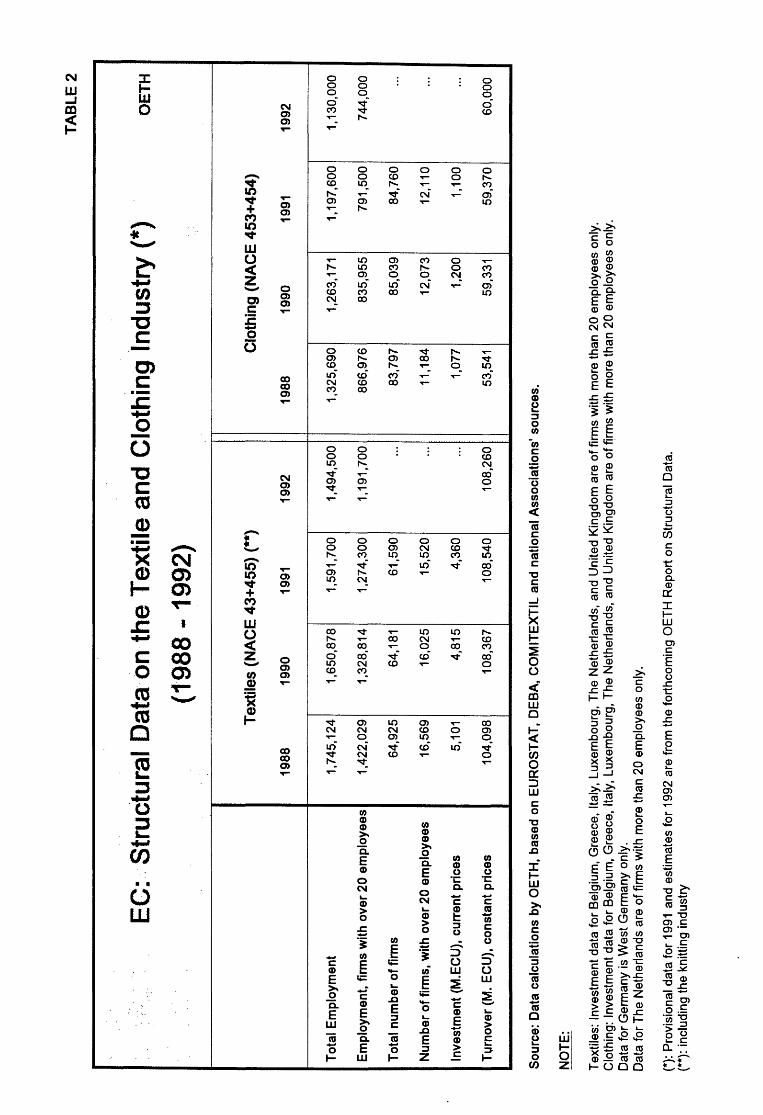
Turnover, in the EC as a whole, rose for textiles between 1988 and 1991, in constant prices, but there was a small fall in 1992 (Table 2). For clothing, the rise was continuous, but the increases between 1990 and 1991, and also in 1992, were quite small. Turnover figures for both clothing and textiles show more positive trends than for production (Table 1 ), and the other variables analysed. This difference, if not due to statistical factors, needs to be evaluated in connection with industrial strategies at the level of the firm.
3.2. EMPlOYMENT
Employment has continued to fall in the industry, in both the textile and clothing sectors, but at a higher rate in 1992, following falls in earlier years. In 1992, the number of jobs lost in this sector represented nearly 20% of the employment contraction in manufacturing industry as a whole.
Employment in both the EC textile and clothing industries fell further in 1992, following falls in the preceding years. The fall is in fact estimated to have been rather higher, at 6% in the case of both textiles and clothing, in 1992, as compared with falls of just over 4% in both sectors in the previous year (Table 2).
The falls in employment, in firms employing more than 20 employees, followed a similar pattern in both textiles and clothing. Both sectors showed a fall in employment of about 6% in 1992.
With a contraction of 165,000 jobs within one year, these industries have been affected more than the steel, electronic and car industries together. This fall in employment represented about 20% of the employment reduction in the manufacturing sector.
The cumulative fall in total employment in textiles and clothing since 1988 (Table 2) has been considerable. It has been over 14% in the case of textiles, and 1 5% in the case of clothing. In absolute terms the
10
loss of employment in textiles was 250,000 over the period, as compared with 195,000 for clothing, reflecting the smaller size of the clothing sector.
Man-made fibre employment, according to CIRFS, rose by 0. 7% per annum between 1988 and 1991, but these figures include employment in five East German lander from 1991. Without this, a fall in employment would have been shown.
Employment figures for individual countries show Italy to be largest employer (Table 3), followed by Germany and the UK. This is true for both textiles and clothing. Germany is much the largest employer in man-made fibres.
Between 1988 and 1992 the largest percentage falls in textile employment have taken place in Spain, followed by the UK (both at over 7% per annum). The UK showed the largest percentage fall in clothing employment (nearly 7% per annum), followed by Spain and Italy (both 4.3% per annum). In textile and clothing employment together, the UK has had much the largest percentage fall (forthcoming OETH report on structural data).
3.3. INVESTMENT
Investment in the EC's textile and clothing industries has fallen in recent years. The decline started earlier in the textile industry than the clothing industry. Investment per employee differs among member states. It has been highest in the Benelux countries, at a high level in Denmark, Germany, Italy and France, but at a low level in Greece, the UK, Portugal and Spain.
The value of investment in the EC's textile industry since 1988 has shown a fall, in current prices (Table 2). At constant prices the fall would have been greater. Overcapacity in the short-staple sector, which is highly capital-intensive, combined with the recession, have been the main reasons for the downward trend. At the same time, and for the same reason, much spinning and weaving capacity, even the most modern, has been shut down.
In the clothing industry, on the other hand, the decrease has been more recent (Table 2}. The change between 1988 and 1990 was a positive one, even after rising prices are taken into account. Nevertheless,
1 1

with a much lower level of investment than in textiles, this sector has remained labour-intensive.
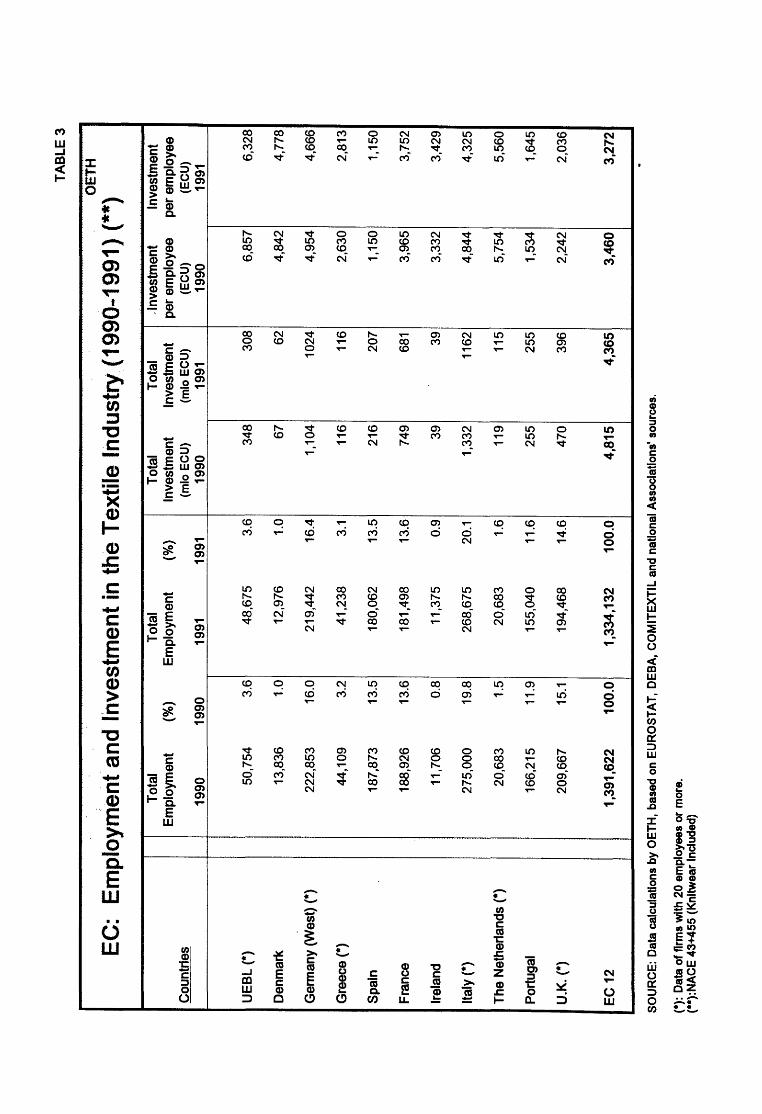
Data for investment in textiles in individual member states show that this was highest in Italy and Germany, the countries with the largest textile industries in the EC, in both 1990 and 1991 (Table 3). France, the third largest producer, had the third largest level of investment.
Investment per employee, on the other hand, was highest in 1991 in Belgium/Luxembourg, followed by the Netherlands, Denmark, Germany and Italy. Investment in knitwear (which is less costly) is included in textile investment. Therefore in countries like Italy and Germany, where knitwear production is important, investment per employee is lower than would otherwise be the case.
It is interesting that the highest investment per employee in 1990 and 1991 took place in the Benelux countries, which hold relatively minor shares in EC output. In both years, the lowest levels of investment per employee occurred in Greece, the UK, Portugal and Spain, in decreasing order.
More specific details on investment, in spinning and weaving equipment, and for the world as a whole, are given in Chapter 7 below.
12

4. EVOLUTION OF TRADE
4. 1 . EXTERNAL EC TRADE
Imports of textiles and clothing from outside the EC rose by over 2% in terms of tonnage in 1992 (nearly 3% for MFA categories). Exports rose by 6% (3% for MFA categories). The ratio of exports to imports improved for MFA textiles from 77% to 78%, while that for MFA clothing remained unchanged at 18%.
In terms of ECUs, the balance of trade improved for MFA textiles (and remained strongly positive for the EC as a whole), while that for clothing deteriorated slightly. Despite the slowdown of imports and the moderate export recovery, the long-run tendency for the EC' s international trade competitiveness to deteriorate remained.
IMPORTS AND EXPORTS - 1992
Imports of MFA textiles (excluding knitwear} rose by 1 o/o in tonnage terms in 1992, while exports rose by 3%. This was a moderate improvement for the EC on 1991, when imports rose by 3o/o and exports stagnated. The balance of trade improved, with the ratio of exports to imports having risen from 77o/o to 78o/o in tonnage terms.
In value terms, there was a fall in imports and a rise in exports, which caused the surplus in the trade balance to rise by 4 7% to 2, 1 70 million ECUs (Table 4).
The rise in MFA clothing imports (including knitwear), in tonnage terms, was 5°1o in 1992 - much below the rise in the previous year (23%}. Clothing exports rose by 5o/o, whereas they had risen only by 1% in 1991 . The balance of trade in clothing deteriorated slightly in tonnage and value terms, but the export/import ratio remained unchanged at 18°/o in terms of tonnage, and at 36°/o .in terms of value (Table 4).
Imports of man-made fibres changed little in 1992. Imports of man-made fibres rose most into Spain (from a relatively low level), France and Italy.
Imports of total textiles and clothing (including non-MFA categories, for example raw materials, man-made fibres and flax products) from outside the EC rose by over 2°1o in terms of tonnage in 1992, while exports rose by 6°1o. In tonnage terms, imports of total textiles and clothing in 1992 were more than double exports.
13
There was a moderate rise in 1992 (3°k) in MFA imoorts of textiles and clothing from countries covered by the textile policy, while imports from countries not covered by the policy hardly changed. Imports from the five 'dominant' countries fell, whereas imports rose from PECOs (substantially) and from ASEAN countries (Table 5). Trends in textiles and clothing were similar.
Exoorts of man-made fibres changed little in 1992, but exports rose for Ireland, Belgium/Luxembourg, France and Germany, but fell steeply in Denmark, Spain, the Netherlands and the UK.
EC exoorts of MFA textiles and clothing to non-EC countries rose by 3°k in 1992. The decrease in exports to the USA, EFTA and Japan was more than offset by a strong increase of exports to the rest of the world (Table 6).
IMPORTS AND EXPORTS - RECENT TRENDS
Looking first at the period since 1988. MFA textile imports were 23% above their 1988 level in 1992. MFA textile exports were 9% higher. MFA clothing imports were 65o/o above their 1988 level, while clothing exports were 22 °k higher (Tables 5 and 6). These figures, together with those covering a greater period of time, suggest a long-term deterioration in the international competitiveness of the EC textiles and clothing industry.
Countries covered by the textile policy were the main suppliers of textiles to the EC between 1988 and 1992. Indeed, they increased their share of the import market for MFA textiles from 69% to 71 °k during the period. The share of ASEAN and PECO countries rose, as did that of China, but the share of the dominant countries fell (Table 5).
In the case of clothing, the countries covered by the textile policy dominated imports: these countries' share of the EC import market for MFA clothing was 95o/o over the period. China, the PECO and the ASEAN countries increased their share, but the share of the dominant countries fell (Table 5).
As markets for EC exports of MFA textiles, EFT A countries and the United States have been decreasing in importance since 1988. They accounted for 33o/o of these exports in 1992, as compared with 38o/o in 1988. Japan has remained a relatively small market for the EC. Exports of textiles to the rest of the world rose from 60o/o to nearly 65 °k over the period (Table 6).
14

As regards exports of MFA clothing, the majority of EC exports go to EFTA countries, the USA and Japan, although the proportions going to EFTA and the USA have fallen between 1988 and 1992. In the same period, however, clothing exports to the rest of the world rose from 32°k to 45% of the EC total (Table 6).
EFTA countries still took as much as 48o/o of EC MFA clothing exports in 1992 in tonnage terms. If the EFTA countries should become members of the EC, then - on the basis of the 1992 figures - EC exports of MFA clothing would be half of what they were in 1992.
Looking at imports from non-EC countries, and exports to non-EC countries since 1985, figures for individual countries are in Tables 7 and 8. These show that the biggest increases in textile imports have been into Spain, followed by Ireland and Greece. Imports of clothing have risen greatly in the case of Spain (nearly fifty times their 1985 level), and considerably in the cases of Portugal, Ireland and Greece. The largest regional market for non-EC textiles and clothing is Germany, followed by the UK.
Germany has seen the largest increase in exports of textiles, followed by France and Belgium, but even Germany's exports in 1992 were at only 32°k above their 1985 level. Clothing exports rose most in the case of Greece, followed by France. Exports of clothing from Italy have changed least since 1985. Germany is the largest exporter of both textiles and clothing to non-EC countries, but in clothing Italy comes second (Table 8).
The EC's exports are in a higher~ class than its imports. In 1992 the average value of textile imports into the EC was 5.6 ECUs per kilo, and of clothing (including knitwear) was 17.1 ECUs. The average export values, by contrast, were 8.6 ECUs for textiles and 33.8 ECUs for clothing (Table 4). Since import and export prices for textiles and clothing are set competitively, it seems clear that the EC's exports of textiles and (especially) clothing are in a higher quality class than its imports.
15
4.2. INTERNAL EC TRADE
Trade in textiles and clothing among member states rose in 1992 by moderate rates (1.5% in textiles and 3% in clothing). On a more longterm basis, there is evidence showing that trade within the EC has increased faster than exports to non-EC countries and slower than imports from outside the EC.
IMPORTS AND EXPORTS - 1992
Looking at trade developments between member states only, both as regards imports and exports, it can be seen that in 1992 imoorts of textiles rose by 1.5%, while exports of textiles rose by 2.4°A>. For clothing, the corresponding figures were of a rise in imports of less than 3%, but a rise in exports of 3. 7% {Table 7 and 8).
The size of imports and exports, among member states, may diverge partly because of time-lags. In addition, goods may be imported into the EC in semi-finished or finished form, and then traded within it. Different classifications may apply in these cases.
The largest EC exporters of textiles to other EC countries were {by decrea-sing order) Belgium, Germany, Italy and France, whereas in clothing Italy, Portugal, Germany, the UK and the Netherlands were the largest exporters in 1992.
For Spain and Portugal, the large increases in clothing imports from other member states {as well as from outside the EC) have clearly been connected with their accession to the European Community. Even so, Spain and Portugal's imports of clothing in 1992, from other EC countries, represented only some 7% of the EC total, in volume terms.
As an exporter of clothing, however, Portugal alone accounted in 1992 for over 15% of the volume of exports among member states (Table 8).
IMPORTS AND EXPORTS -·RECENT TRENDS
Comparing 1985 and 1992, it is clear that EC exports of MFA textiles and clothing to other member states have risen faster than exports to non-EC countries. lmoorts from other member states have risen more slowly than imports from non-EC countries. This suggests that EC firms are relying to an increasing extent on the EC internal market for their sales.
16

There have been big differences between 1985 and 1992 in the trade of individual EC countries. As regards imoorts from other EC countries, by far the biggest increases in textile imports have taken place in the cases of Spain and Portugal. lntra-EC imports of clothing rose greatly also in Spain and Portugal, with smaller increases in Greece and Italy.
As regards exports, the biggest increases in textile exports, compared with 1985, have been from Spain and the UK, followed by Portugal, Belgium, France and Ireland. For clothing, Denmark has had the greatest increase in exports (possibly because of re-exports of non-EC goods), followed by Ireland, the UK and Portugal. In 1992 Italian exports of clothing to other EC countries were scarcely above their 1985 level.
4.3. OUTWARD PROCESSING TRADE (OPT)
Total OPT clothing imports into the EC, of every MFA category, accounted in 1992 for some 10% of total EC imports of clothing, in tonnage terms. This proportion has changed relatively little since 1989, despite the fact that import quotas have been under-utilised and that some major suppliers enjoy free access for their OPT exports to the EC.
During 1992, OPT imports of clothing into the EC rose by some 13%, as compared with 4% for direct imports. Recent trends suggest that the distribution of OPT imports among member states may tend to be more balanced in the future (at present Germany represents 62% of the EC total), and that the weight of Eastern European countries (with the exception of ex-Yugoslavia) will continue to increase.
OPT imports play an important role in the competitive strategy of many EC firms in the clothing industry, especially for certain member countries, although it represents only about 10% of the EC's total clothing imports (Tables 9 and 11). In the case of several clothing categories (anoraks, jackets and shirts), OPT imports are now substantial in relation to total EC production of those categories.
In 1992 OPT imports of clothing into the EC, from non-EC countries, are estimated to have risen by some 13%, in tonnage terms, following a rise of some 22% between 1990 and 1991 . Direct imports of clothing into the EC showed a greater contrast: they rose by 4°/o only in 1992, as compared with a rise of 23% in 1991 (Table 9).
17

Germany is the biggest OPT importer into the EC (62% of the EC total in 1992), followed by Benelux and France (Tables 9 and 11). Recent trends suggest that relative positions may come closer in the future. German OPT imports of clothing rose by 6% only in 1992, but OPT clothing imports rose by higher proportions than this in Benelux, France, Denmark and Italy. The Italian increase ( 170o/o) was by far the greatest, but Italy started from a low base.
The principal OPT clothing exporters to the EC in the first 9 months of 1992 were Poland, ex-Yugoslavia, Hungary, Romania, Tunisia, Morocco, the Czech and Slovak republics, and Turkey, in that order. In previous years ex-Yugoslavia had been the biggest supplier, but in 1992 its OPT clothing exports to the EC are likely to have fallen by over 20%. In contrast, there was a substantial rise in OPT imports from other Eastern European countries, in the first 9 months of 1992 , such as Bulgaria (90o/o), the Czech and Slovak republics (43°/o), Romania (32o/o) and Poland ( 1 5%) (Table 12).
Germany has traditionally dealt mainly with ex-Yugoslavia and Eastern Europe for OPT, and France with Morocco and Tunisia, although recently both France and Italy have drawn heavily on Eastern Europe. It is tempting to attribute the relatively small rise in German OPT imports to the disruption in ex-Yugoslavia, one of Germany's largest OPT partners. It should however be noted that German direct imports of clothing (from within the EC as well as from outside) - which were over eight times as great in 1992 as its OPT imports - fell between 1991 and 1992 by some 4%.
OPT imports from major suppliers, especially from Mediterranean countries, represent in some cases rather low percentages of total clothing imports from those countries (Table 1 0). This suggests that some imports classified as direct may in fact be OPT imports.
There has been considerable under-utilisation of direct and OPT quotas in recent years, most notably in the case of Eastern and Central European countries. Although the available evidence (in Table 13) refers to 1991, it can be argued that policy restrictions do not on the whole represent a major obstacle to additional OPT clothing imports from PECOs, or from Mediterranean countries with preferential arrangements.
OPT imports of textiles into the EC rose by some 31 % in 1992, compared with a rise in direct imports of textiles of some 1 o/o. These OPT imports accounted for only some 0. 5% of total textile imports, suggesting a low level of activity of EC textile firms in this area. However, the quantity of OPT textile imports has nearly doubled in the last two years (Tables 9 and 11).
18

5. DEMAND FOR TEXTILE AND CLOTHING PRODUCTS
5.1. CONSUMPTION
Consumers' textile and clothing expenditure fell in 1992. The estimated apparent consumption of woven clothing in the EC fell slightly in constant prices, as compared with 1991. There was a rise between 1990 and 1992 of about 2% in constant prices. The estimated apparent consumption of the EC knitting industry fell in 1992. However, there was a rise between 1990 and 1992, in constant prices, of about 7%.
In 1992, consumers' textile and clothing expenditure in the EC seemed likely to fall by 1.6%, after a slight growth in 1991. The developments in Germany in 1990 and 1991, with high rates of growth (7.4% and 6.8o/o respectively) owing to an increased demand in the five Eastern Lander, came to an end in 1992. The countries in which consumption was expected to decrease in 1992 were Germany (4°k), France (3%), Italy and the UK (0.5o/o}.
Textiles and clothing account for a declining proportion of total household expenditure, largely as a result of the normal tendency for consumers to spend a smaller proportion on essentials as their income rises. In addition, demand is likely to be price elastic, so that demand falls off when relative prices rise.
The low growth of GNP in 1992 had, therefore, a substantial effect on consumers' expenditure on textiles and clothing.
In 1992 apparent consumption of knitted goods and woven clothing fell slightly in constant prices, after a sizeable increase, especially of knitted goods, in 1991 .
This fall in apparent consumption led to a much smaller rise in imports in 1992 than in 1991, especially of knitted goods.
Import penetration in 1992 (i.e. imports divided by consumption) was 35% for the knitting industry and 21 o/o for woven clothing (Table 15). Import penetration was higher than in either 1990 or 1991.
Actual consumption in the EC is unlikely to have changed as much, especially in 1990-91, as the figures indicate. This is because there were almost certainly stock increases in the knitting and clothing industries in 1991 (OETH Bulletin No.1, January 1993). Stocks of semifinished goods in particular may have been built up, possibly with the
19

impending Single Market in mind. There was however apparently little change in stocks between 1991 and 1992.
Producer prices for clothing rose by 3 o/o in 1992, as compared with 3.4% for consumer prices for clothing. For manufacturing as a whole, producer prices rose by 1.8%, and the general index of consumer prices by 3.6o/o (Tables 16 and 17). Producer and consumer prices for clothing therefore moved together more closely than for manufacturing as a whole.
Import prices for clothing remained virtually unchanged between 1991 and 1992 (while those for textiles fell) (Table 4). Taken together, the figures suggest that consumer prices for clothing moved roughly in line with producer prices, even though import prices were unchanged.
By end-uses, there were considerable differences in the evolution of demand in 1992.
In clothing, which covers about 50o/o of consumption, there was a substantial decrease in demand for woven garments in polyamide and cotton. This was not much compensated by a slight growth in knitwear (mainly in wool and acrylic) and wool woven garments.
The demand for home textiles remained at a strong level for carpets and floor coverings, despite a slackening in building activity. Otherwise, demand appeared to be poor, especially for household textiles.
On the other hand, the demand for technical textiles continued to increase (mainly in continuous yarns), but with smaller growth than in previous years, for example in non-woven fabrics. Some exceptions occurred in uses such as the car industry.
5.2. RETAIL SALES - CLOTHING, FOOTWEAR AND LEATHER GOODS
In line with the evolution of demand, retail sales of clothing fell in the EC as a whole in 1992, after little change between 1990 and 1991. The fall in sales in 1992 affected all the largest countries in the EC.
For the EC as a whole, the volume of retail sales of clothing, footwear and leather goods fell by 5.3% in 1992, following virtually no change between 1990 and 1991 . There were appreciable percentage falls
20
in sales in 1992 in Germany, France, Italy, Denmark, and Luxembourg. There were small increases in Belgium and Greece (Table 18).
Retail sales indices by seasons (summer = March - August of the same year; winter = September - February, of the following year) indicate a very different pattern across Community countries (Table 18).
EC retail sales, in the summer season of 1992, fell by 3.5%, compared with the same period the previous year. This was mainly due to falls in retail sales in Germany and France (6%). There was at the same time a modest rise in retail sales in Belgium and Greece and the UK.
EC retail sales of clothing in the winter season of 1991 /92, remained unchanged, compared with the winter season of 1990/91. There were increases in retail sales in all countries but France, the UK, Belgium and Luxembourg.
Longer term trends in sales are shown on the Graphs. It can be seen that, for the EC as a whole, sales were flat from 1988 to 1990, increased early in 1990 and were sustained until mid-1991, before falling. Sales in Germany (West) rose sharply in 1990 and 1991 , following reunification, but fell off after mid-1991. In France, retail sales have been flat since 1988, while in the UK sales were flat between 1988 and 1989, but began to fall as early as 1990.
Some structural data for retail sales of clothing is available for a limited number of countries, but only for the period 1985 to 1990. As regards the number of retail enterprises, the most striking change was a reported rise of 35% in the number of clothing enterprises in Spain between 1988 and 1990. In 1990 Spain apparently had 70% more clothing enterprises than Germany (Eurostat's data bank MERCURE).
There was a rise of 46o/o in the number of employees in retail clothing enterprises in Spain between 1988 and 1990. Even so, Germany had 75°A> more employees than Spain in 1990.
The average number of employees per retail clothing enterprise was 1.9 for Spain in 1990, but 5.8 per enterprise for Germany. For France in 1989 the average was approximately 2. 7.
21

6. COMPETITIVITY OF THE EC CLOTHING AND TEXTILE INDUSTRIES
6.1. PRODUCTIVITY
Output per employee is higher in manufacturing as a whole than in textiles, and higher in textiles than in clothing. Between 1991 and 1992, output per employee rose faster in textiles and clothing than in manufacturing.ln individual countries, high output per employee and high investment per employee tend to go together.
A partial measure of Productivity is value added per employee. This is not a full measure of productivity, since this would also take into account inputs of capital and other factors of production. Unfortunately, reliable and comparable figures for capital employed are not available. There are however figures for investment in the textile industry by country, and these can be used to give an indication of inputs of capital in recent years.
In manufacturing industry as a whole, value added per head in 1991, at 1985 prices, was 36,200 ECUs. In 1992 it was 4o/o higher. This is for firms employing 20 or more employees (Table 14).
For textiles (including knitting), value added per employee in 1991, for firms employing more than 20 employees, was 24,400 ECUs, at constant 1985 prices. This was one-third less than the average for manufacturing as a whole. In 1992 value added per employee in textiles was 4. 5% higher than in 1991 - a better performance than in manufacturing.
For clothing, value added per employee in 1991 was 17,200 ECUs only, at 1985 prices. This was well below the figure for textiles, and it reflects the less capital-intensive nature of the clothing industry. In 1992 value added per employee in clothing was apparently 11 % higher than in 1991 - which would suggest extremely high substitution of capital for labour.
Value added per employee differs from country to country in the EC. For textiles, output per employee was highest in Belgium, Germany and France, with Italy and Denmark not far behind. Partial figures suggest high productivity in the Netherlands. Output per employee was appreciably lower than in these countries in the UK and Greece, and lowest of all in Portugal (forthcoming OETH report on structural data).
22

These differences do not necessarily indicate differences in total productivity between individual EC countries. The figures take no account, for example, of inputs of factors other than labour, such as capital. They also take no account of the global quality of output in the different countries, a concept encompassing speed and reliability of delivery, modern design and innovative materials, besides strict quality of the final product.
There appears to be a strong correlation between the rankings of countries in terms, respectively, of output and investment per employee (see 3.3). This confirms the importance of investment in physical capital in raising average labour productivity. Differences between countries are very considerable: Belgian textile firms invested as much as 5.5 times per employee as Spanish firms in 1991. But these differences do not translate into the relative importance of each country as a producer. The UK, for instance, which has the fourth largest EC textile industry, has been a poor investor. Portugal, another low investor, has increased its share of EC output of textiles and clothing since 1985.
In order fully to assess competitiveness, it is necessary to take into consideration, in addition to total productivity, factor costs as well as other features of the business environment which affect costs. The relation of prices to costs, and hence profitability, is of course relevant also.
As far as productivity is concerned, unfavourable productivity can be offset by cost advantages, in the form of lower wages, transport costs etc. Data on labour costs (and also working hours) suggest that important differences in these respects remain among member states.
6.2. LABOUR COSTS
Labour cost comparisons are available for spinning and weaving in 1991 (OETH Factual Report 1990/91, Chapter 7.2 and Tables 18-20}. These show that, in terms of US dollars, Denmark was the highest cost EC country, followed by the Netherlands, Belgium and Italy, in that order. Portugal and Greece had the lowest costs in the EC. In Asia, however, labour costs in countries such as China, India, Pakistan and Sri Lanka were far below the Portuguese level.
23

7. TEXTILE MACHINERY TRENDS
The textile machinery market showed mixed trends in 1992. There was a severe fall in shipments of short-staple (cotton) spindles, to all areas except the former Comecon countries. In contrast, there was an overall increase in shipments of long-staple (wool) spindles, including an increase to the EC.
In weaving, there was an overall increase in shipments of shuttle-less looms, but deliveries to the EC fell substantially.
Asia has the largest installed caoacity in spinning and weaving machinery, except for open-ended rotors and shuttle-less looms, where the leading position is held by the former Comecon countries. The relative positions were not changed in 1992, since Asia was by far the largest destination for all types of textile machinery, except for open-ended rotors.
SPINNING
Shipments of short-staple (cotton) spindles in 1992 totalled 3.4 million. This was 26% less than in 1991. The fall in the previous year had been 8°A>. Nearly 60% of the shipments were to Asia and Oceania, but this was 36% down on 1991. Shipments were well down also to Africa, North America, the European Community (by 33%), and EFTA. On the other hand, shipments to the former Comecon countries were up by 34o/o, which reinforced their position as the countries with the second largest installed capacity, next to Asia (Table 19).
Shipments of long-staple (wool) spindles in 1992 were up by 6o/o in 1991, after a fall of 20% the previous year. Much of this investment in long-staple spindles was for use in knitwear. Shipments in 1992 were up in North America (by a multiple of 8), Asia (by 32o/o), the EC (by 26%), and South America. They were down in Africa and the former Comecon countries. Asia took 46o/o of total shipments in 1992, suggesting a move in strategy towards knitwear. The EC took 24o/o, and was the next largest market. Asia continues to have the largest installed capacity, closely followed by the EC.
The world market for open-ended rotors fell by 9o/o in 1992, after a fall of 30% the previous year. This was the lowest level since 1975. There were higher shipments in 1992 to Africa, North America (by a multiple of 2), and the EC (by 12o/o), but lower shipments to Asia and also to the former Comecon countries (a fall of over 50%). North America
24

displaced the former Comecon countries as the largest market in 1992, but the latter countries continued to have much the largest installed capacity of open-ended rotors.
WEAVING
In 1992, 59,000 shuttle-less looms were shipped (as compared with 7,000 looms with shuttles), an increase of 7% on 1991. Deliveries to Asia rose by 7%. They rose also to North America, and to the former Comecon countries. They fell to the EC (by 18%) and to Africa. Asia represented over 60o/o of shipments, followed by the former Comecon countries, with shipments of 20%. The former Comecon countries had the largest installed capacity, followed by Asia (Table 20).
Of the shuttle-less looms shipped in 1992, some 50% of the total were rapier looms, 29% water-jet, and 20°/b air-jet. Compared with 1991, there was an increase in shipments of rapier and water-jet looms, but a decrease in shipments of air-jet looms.
The water-jet market was dominated by Asia, which was also the largest market for the other types of shuttle-less looms. Water-jet looms are used mainly for weaving filament man-made fibres for industrial purposes. Japan, which is strong in man-made fibres, is the principal market for water-jet looms.
For rapier looms, however, the former Comecon countries were nearly as large a market as Asia.
As judged by the percentage share of 1983-92 shipments of open-ended rotors, in relation to 1991 installed capacity, the EFT A countries, the EC and North America have (in decreasing order) the most modern spinning equipment. In shuttle-less looms, however, the leading modernising area has been Asia, followed by the EC and other Western European countries.
As a whole, the performance of the EC textile industry in restructuring its production equipment compares favourably with that of its competitors.
25
8. SPECIAL TOPIC: EASTERN EUROPE AND THE FORMER SOVIET UNION
8.1. THE ECONOMIC BACKGROUND
During 1992 the main aim of economic policy in Central and Eastern Europe, and also in the former Soviet Union, was control of inflation and accumulation of foreign exchange reserves. In the Central and East European countries inflation fell, and the balance of payments on current account improved. Within the rouble zone, however, macroeconomic stabilisation largely failed. The recession deepened further in all these countries, especially the former Soviet Union.
CENTRAL AND EASTERN EUROPE
Real GOP in Central and Eastern Europe (excluding the former Soviet Union) fell in 1992 by about 5%. A tightening of credit caused a fall in output and employment. Both fixed investment and consumption fell further, but there was a sharp increase in exports to DECO countries.
During the course of 1992, industrial output stabilised in Czechoslovakia and Hungary, and picked up considerably in Poland. Trade between these countries started expanding, after reaching a low point in 1991. Real GOP in these countries seems likely to increase in 1993.
Inflation as a whole fell from close to 90o/o in 1991 to about 60% in 1992. The external current account was buoyant, especially in Czechoslovakia and Hungary, and these countries accumulated considerable stocks of foreign currency.
The most striking reform in 1992 was probably Czechoslovakia's implementation of mass privatisation. The government offered vouchers to all adult citizens at a nominal price, and about one-third of all stateowned assets have so far been put up for sale.
Privatisation has been slower in other countries. Hungary has privatised 16-17% of previously state-owned business property. In Poland large scale privatisation has been slow, but the new government, which took office in July 1992, has speeded up the privatisation process. There has also been progress on small scale privatisation. The sale of shops and other businesses has been particularly active in Poland and Czechoslovakia.
26

Official government estimates suggest that the private sector has now risen to about 45 o/o in Poland and more than one-third in Hungary.
THE FORMER SOVIET UNION
The situation in the former Soviet Union has developed far less well. Soon after the formal break-up of the Soviet Union in December 1991, all the former member republics embarked - with varying degrees of commitment - on the transition to a market economy. The results have been generally disappointing. There has been a deep recession, while fiscal and monetary policies have been largely out of control. Little progress has been made with structural reforms.
Russia and the Baltic States have been among the most committed to radical change, while a slower approach has been taken by several other republics, including, until recently, Ukraine.
Output fell steeply in most republics in 1992. In the Soviet Union as a whole real NMP fell by about 20%, and investment activity fell in most republics by 40-50%.
In contrast to the countries of Central and Eastern Europe, most former Soviet republics saw a further fall in exports in 1992. The fall in production reduced the availability of goods, and led governments to check the outflow of resources to other countries. At the same time, currency restraints led to a steep fall in imports from the hard currency area.
Inflation escalated in 1992, as a result of price liberalisation and loose credit policies. Consumer prices multiplied 23 times in Russia and 26 times in the Ukraine. Prices also rose greatly in other republics.
Structural reforms have moved slowly. The main achievements so far have been the liberalisation of prices and the establishment of the right of private entities to engage in economic activity. However, the private sector is thin, and is faced with heavy financial and bureaucratic obstacles. The inflow of private capital has been small- although the laws on foreign direct investment have been liberalised - and has concentrated mainly on the extraction of minerals.
The short-term prospects look poor for most of the republics. Output is likely to decline further. Other republics will suffer from Russia's plans to reduce energy shipments to them, and to move prices closer to world levels. There are few signs of financial stabilisation to break the inflationary spiral.
27

8.2. TEXTILES AND CLOTHING
Output of textiles and clothing fell in general throughout Eastern and Central Europe, and also the former Soviet Union, during 1992. A fall in exports and imports also occurred. These movements in trade and production were related to the breakdown in the former Comecon trading system.
In all the countries of Central and Eastern Europe, their light and heavy industries have suffered from the breakdown of the Comecon system. This has affected trade- and hence production- in textiles and clothing. There has been a switch to trade being conducted on a hard currency basis and, as a consequence, trade between themselves, and with the former Soviet Union, has been severely affected. Attempts have been made to turn to markets in Western Europe, but so far with limited success.
There was a deficit in the EC balance of trade in MFA textiles and clothing products with PECOs, both in value (nearly 800 million ECUs) and in volume terms (50 thousand tonnes). Most interesting is the case of Poland where there was a surplus of EC exports of some 14.5 thousand tonnes. At the same time, Poland accounted for over 20% of the EC deficit (in value terms), in trade in MFA textiles and clothing, with PECOs.
EC imports from PECOs, were in a higher price class than the EC average. In 1992 the average value of MFA textiles and clothing imports into the EC was 10.4 ECU per kilo, and for imports from PECOs it was 12.4 ECU per kilo. The most expensive of the PECOs were goods imported from Poland with 16.4 ECU per kilo.
EC exports to PECOs were in a lower price class than the EC average. In 1992 the average value of MFA textiles and clothing exports from the EC was 12.2 ECU per kilo, and for exports to PECOs it was 11.6 ECU per kilo. The most expensive were goods exported to Romania with 13.1 ECU per kilo (Table 23).
HUNGARY, POLAND, CZECH AND SLOVAK REPUBLICS
In Hungary the output of the textile industry was not very different in 1980 and 1985, but in 1990 textile output was well below the 1985 level. In clothing, output in 1985 was generally rather below the 1980 level, but in 1990 it was much lower. By 1992 the position had worsened further. The output of light industry fell by 24o/o during the first half of 1992 (in constant prices), compared with the first half of 1991 .
28

There was a drop of 34°,4:, in the output of the textile sector, with a steep fall in all types of fabric (Table 21). There was a fall of 12 o/o in the output of the clothing sector, but an increase in the production of women's coats and men's suits. Exports of textiles fell by 32% and of clothing by 8o/o.
A Chinese company acquired an apparel factory in Hungary in 1992, the first large-scale Chinese acquisition in the country. An American company and a Hungarian bank made an offer for a large knitwear enterprise, which had been unable to build up sufficient business to compensate for its loss of the former Soviet market. Production was due to start up again in January 1993. Coats Viyella has entered into a joint venture with a Hungarian cotton spinning company, for production at a factory which Coats Viyella owned before nationalisation.
In Poland the output of the textile sector fell on average in 1992, after a steep fall in 1991, but there was growth in the output of chemical fibres, cotton yarns, silk fabrics and curtains (Table 22). Clothing output rose by 12% during the year, although knitwear production fell by 30o/o. Poland's industry has been much geared to internal demand, but it has recently increased its OPT exports of clothing (Table 12).
The Polish Ministry of Industry and Trade plans to restructure the textile industry with a series of regional and sectoral programmes. Several textile factories are being offered for privatisation, but in general the textile sector has made large losses. The switch to jobbing contracts (OPT) for the West throughout the apparel industry has led to mass redundancies in the cotton, wool and linen sectors.
The most outdated sector in Poland is apparently that using manmade fibres. A recent report by the Boston Consulting Group is negative about prospects for the cotton industry, but argues that woven fabrics will remain competitive in the short-term, despite low productivity, because of low wage costs. The woollen industry needs drastic regrouping, but after this the sector has good prospects. The knitwear and hosiery sector is well equipped, and is seen as the most competitive.
In the Czech and Slovak republics the growth in jobbing contracts (OPT) for Western firms helped stabilise production in the industry in 1992. Recently OPT exports of clothing to the EC have increased considerably (Table 12). Output in most sectors fell steeply after the collapse of the Eastern market, and then stabilised at about 60-65% of 1991 levels for the second half of the year. The industry faced a crisis, however, caused by the collapse of the enterprise to enterprise payment system. The certainty of payment makes Western co-operation especially attractive to Czech producers.
29

An Italian company is said to be interested in taking shares in the Svikon apparel enterprise. An Italian company already has a majority share in the Perla shirt-producing enterprise, which has started working on contract for Western producers. Some of the cotton cloth is locally produced, by firms such as Cottex, which exports most of its cloth for making up abroad. Cottex is however planning ways to regain a share of the Soviet market for its textiles and apparel, since it believes that the Western apparel market is limited.
Textile, clothing and leather enterprises have proved to be among the more popular investments in the first phase of voucher privatisation. Many of the issues were heavily oversubscribed.
According to Comitextil, there was a drop in output in all sectors of the textile industry (including knitwear) in 1992, except for an increase in the output of the silk industry. Exports of textile products in 1992 fell by some 8%. Exports of silk and wool products rose, however, on account of increased exports to the EC and other advanced countries.
The numerous problems in the republics, which caused a fall in home-market as well as export sales, led to a fall in investment in the textile industry of over 40o/o in 1992.
RUSSIA AND THE FORMER SOVIET UNION
In Russia the output of woven cloth and knitted articles did not change appreciably over the period 1980 to 1991 (Table 24). More recently, the output of light industry changed little between 1990 and 1991, while textile output fell slightly and clothing output rose. In 1992, however, there was a drop in production of most light industry goods.
In 1992 the output of textiles and footwear was 16% below the 1990 level. Production in the weaving, hosiery and knitwear sectors fell by between 16o/o and 47%, in 1992, mainly owing to shortages of Russian and imported materials (Table 24). Output of chemical fibres fell by 14% and of dyes by 33%. Production of wool fell by over 11 °/o. Exports of cotton cloth were down over the year.
Sales of consumer textile products fell by around 50% in Russia in 1992, as consumers switched more of their reduced real incomes to food. Imports of textiles decreased substantially - by 56°/f, for cotton cloth, 29% for knitted apparel and 17% for other apparel (Table 24).
Attempts to increase the output of textile equipment by placing contracts with demilitarised defence engineering factories produced few
30
results during the year. The overall output of spinning and weaving machinery fell by almost a third.
Figures are available for the production of cloth, knitted articles and hosiery, by republics of the former Soviet Union (Table 26), for both 1980 and 1990. In the first two categories, output in the Soviet Union as a whole appears to have risen by some 19°A» between the two years. It rose by 29% for hosiery. More interesting is the fact that Russia appeared to account for some 66% of cloth production in 1990, but only for some 40% of the production of knitted articles and of hosiery. The second largest producer in all cases was the Ukraine.
The greatest rate of increase in the production of cloth between 1980 and 1990 occurred in Moldova, followed by Uzbekistan (a much larger producer). In knitted articles, the greatest rate of increase was in Turkmenistan, followed by Tadjikistan, but the rates of increase were less in these cases. Turkmenistan showed the greatest rate of increase in hosiery also, followed by Uzbekistan and Kyrgyzstan.
31

9. TABLES AND GRAPHS

..
· .. EC
: P
rodu
ctio
-n o
f Te
xtile
s an
d C
loth
ing .
. (19
85 ~ 1
992)
19
85=-
100
Te
xtile
s (N
AC
E 4
3)
(inc
l. kn
itwe
ar)
Cou
ntry
1
98
9
19
90
19
91
19
92
Be
lgiu
m/l
ux.
10
4.4
112.
3 10
4.5
107.
1
Den
mar
k 95
.1
86.9
87
.4
84.4
Ger
man
y (W
est)
98
.7
100.
1 98
.7
91.0
Gre
ece
103.
6 99
.7
90.7
83
.2
Spa
in
109.
4 10
6.5
99.4
9
4.8
Fra
nce
92.4
88
.7
83.8
82
.1
Irel
and
111.
0 11
9.1
118.
8 12
5.3
Ita
ly
116.
9 11
3.5
114.
3 11
2.3
The
Net
herl
ands
97
.1
98.8
97
.9
91
.0
Por
tuga
l 10
7.8
114.
5 11
2.2
10
3.7
U.K.
97
.0
92.3
85
.5
85.0
EC
12
104.
3 10
3.4
100.
3 96
.9
Not
e:
Indi
ces
ba
sed
on
volu
me;
E
stim
ate
s a
re in
BO
LD
. %
oft
ota
l19
92
are
bas
ed o
n to
tal
pro
du
ctio
n (
M.
EC
U,
con
sta
nt
pri
ces)
(1
): C
OD
E 4
59
= 4
53
+4
54
+4
56
.
So
urc
e:
EU
RO
ST
AT
Clo
thin
g (
CO
DE
459
)
%o
f to
tal
19
92
1
98
9
19
90
19
91
19
92
(E
C=-
1001
4.8
10
9.9
120.
8 12
8.6
131.
2
1.0
67
.9
67.6
68
.7
72.9
18.4
88
.2
87.0
86
.4
76.7
2.6
89
.5
89.1
92
.7
89.3
5.5
103.
0 10
5.3
97.8
9
3.3
15
.3
79.2
76
.3
72.1
6
6.2
0.6
. 89
.3
90.9
79
.2
76.9
36.1
96
.8
95.6
95
.6
100.
1
1.8
11
1.2
117.
4 12
0.9
11
1.8
2.7
102.
6 11
3.2
113.
9 1
13
.9
11.1
10
1.0
102.
2 93
.0
94.2
100.
0 90
.2
89.9
87
.2
84
.5
TA
BL
E 1
OE
TH
(1) %o
f to
tal
19
92
(E
C=
100J
2.6
0.8
17.0
1.6
5.0
22.4
0.4
37.0
0.8
2.0
10.2
100.
0
EC
: . S
truc
tura
l D
ata
on t
he
Tex
tile
and
Clo
thin
g In
du
stry
(*)
(198
8 ..
1992
)
Te
xtile
s (N
AC
E 4
3+
45
5)
(**)
C
loth
ing
(N
AC
E 4
53
+4
54
)
19
88
1
99
0
1991
1
99
2
19
88
1
99
0
1991
To
tal
Em
plo
yme
nt
1,74
5,12
4 1,
650,
878
1,59
1,70
0 1,
494,
500
1,32
5,69
0 1,
263,
171
1,19
7,60
0
Em
plo
yme
nt,
fir
ms
with
ove
r 2
0 e
mp
loye
es
1,42
2,02
9 1,
328,
814
1,27
4,30
0 1,
191,
700
866,
976
835,
955
To
tal
nu
mb
er
of f
irm
s 64
,925
64
,181
61
,590
...
83,7
97
85,0
39
Nu
mb
er
of f
irm
s, w
ith o
ver
20
em
plo
yee
s 16
,569
16
,025
15
,520
...
11,1
84
12,0
73
Inve
stm
en
t (M
.EC
U),
cu
rre
nt
pri
ces
5,10
1 4,
815
4,36
0 ...
1,07
7 1,
200
T1,1
rnov
er (
M.
EC
U),
co
nst
an
t p
rice
s 10
4,09
8 10
8,36
7 10
8,54
0 10
8,26
0 53
,541
59
,331
Sou
rce:
Dat
a ca
lcu
latio
ns
by
OE
TH
, b
ase
d o
n E
UR
OS
TA
T,
DE
BA
, C
OM
ITE
XT
IL a
nd n
atio
na
l Ass
oci
atio
ns'
so
urc
es.
Tex
tiles
: In
vest
men
t da
ta f
or B
elgi
um,
Gre
ece,
Ita
ly,
Luxe
mbo
urg,
The
Net
herla
nds,
and
Uni
ted
Kin
gdom
are
of f
irms
with
mor
e th
an 2
0 em
ploy
ees
only
. C
loth
ing:
Inv
estm
ent
data
fo
r B
elgi
um,
Gre
ece,
Ita
ly,
Luxe
mbo
urg,
The
Net
herla
nds,
and
Uni
ted
Kin
gdom
are
of ~rms w
ith m
ore
than
20
empl
oyee
s on
ly.
Dat
a fo
r G
erm
any
is W
est
Ger
man
y on
ly.
Dat
a fo
r T
he N
ethe
rland
s ar
e o
f firm
s w
ith m
ore
than
20
empl
oyee
s on
ly.
(*):
Pro
visi
on
al
data
for
199
1 an
d es
timat
es f
or
1992
are
fro
m t
he f
orth
com
ing
OE
TH
Rep
ort
on S
truc
tura
l Dat
a.
(**)
: in
clud
ing
the
knitt
ing
indu
stry
791,
500
84,7
60
12,1
10
1 '10
0
59,3
70
TA
BL
E 2
OE
TH
19
92
1,13
0,00
0
744,
000 . ..
. .. . ..
60,0
00
TA
BL
E 3
OE
TH
EC
: E
mp
loym
ent a
nd
In
vest
men
t in
the
Tex
tile
Indu
stry
(1
99
0-1
99
1)
(**)
Tot
al
Tot
al
Tot
al
Tot
al
Em
ploy
men
t (%
) E
mpl
oym
ent
(%)
Inve
stm
ent
Inve
stm
ent
Cou
ntrie
s (m
lo E
CU
) (m
lo E
CU
) 19
90
1990
19
91
1991
19
90
1991
UE
BL
(*)
50,7
54
3.6
48,6
75
3.6
348
308
Den
mar
k 13
,836
1.
0 12
,976
1.
0 67
62
Ger
man
y (W
est)
(*)
22
2,85
3 16
.0
219,
442
16.4
1,
104
1024
Gre
ece
(*)
44,1
09
3.2
41,2
38
3.1
116
116
Spa
in
187,
873
13.5
18
0,06
2 13
.5
216
207
Fra
nce
188,
926
13.6
18
1,49
8 13
.6
749
681
Irel
and
11,7
06
0.8
11,3
75
0.9
39
39
Ita
ly(*
) 27
5,00
0 19
.8
268,
675
20.1
1,
332
1162
The
Net
her1
ands
(*)
20
,683
1.
5 20
,683
1.
6 1
19
11
5
Por
tuga
l 16
6,21
5 11
.9
155,
040
11.6
25
5 25
5
U.K
.(*)
20
9,66
7 15
.1
194,
468
14.6
47
0 39
6
EC
12
1,39
1,62
2 10
0.0
1,33
4,13
2 10
0.0
4,8
15
4,
365
SO
UR
CE
: D
ata
calc
ulat
ions
by
OE
TH
, ba
sed
on E
UR
OS
TA
T,
DE
BA
, C
OM
ITE
XT
IL a
nd n
atio
nal
Ass
ocia
tions
' so
urce
s.
(•):
Dat
a o
f fir
ms
with
20
empl
oyee
s o
r m
ore.
(•
•):N
AC
E 4
3+45
5 (K
nitw
ear
Incl
uded
)
.Inv
estm
ent
Inve
stm
ent
pe
r em
ploy
ee
pe
r em
ploy
ee
(EC
U)
(EC
U)
1990
19
91
6,85
7 6,
328
4,84
2 4,
778
4,95
4 4,
666
2,63
0 2,
813
1,15
0 1,
150
3,96
5 3,
752
3,33
2 3,
429
4,84
4 4,
325
5,75
4 5,
560
1,53
4 1,
645
2,24
2 2,
036
3,46
0 3,
272

MF
A T
ext
iles
Ton
nes
( exc
l. kn
itwea
r)
mlll
lon
EC
U
MF
A C
loth
ing
T
onne
s
(Inc
l. kn
itwea
r)
mill
ion
EC
U
To
tal
MF
A T
+C
T
onne
s
mlll
lon
EC
U
Sou
rce:
EU
RO
ST
AT
; D
B D
G I
ll: T
extil
es
(j:
Ext
ra-E
C o
nly
1990
1,81
2,62
3
10,2
82
1,04
4,29
4
17,8
36
2,85
6,91
7
28,1
18
EC:
MFA
Ext
erna
l T
rad
e {1
990~
1992
).
EC
Im
po
rts
(*)
EC
Exp
ort
s (*
)
1991
19
92
Cha
nge
1990
19
91
1992
C
ha
ng
e
1990
92/9
1 (%
) 92
/91
(%)
1,86
6,99
2 1,
888,
559
1.2
1,42
8,52
4 1,
427,
464
1,46
9,34
0 2.
9 -3
84,0
99
10,7
25
10,4
84
-2.2
12
,005
12
,204
12
,654
3.
7 1,
723
1,28
7,00
2 1,
352,
066
5.1
234,
251
235,
992
247,
694
5.0
-810
,043
22,1
27
23,1
07
4.4
8,02
8 8,
022
8,36
9 4.
3 -9
,808
3,15
3,99
4 3,
240,
625
2.7
1,66
2,77
5 1,
663,
456
1,71
7,03
4 3.
2 -1
,194
,142
32,8
52
33,5
91
2.2
20,0
33
20,2
26
21,0
23
3.9
-8,0
85
TA
BLE
4
OETH
Bal
ance
E
ll R
atio
1991
19
92
1990
19
91
1992
-439
,528
-4
19,2
19
78.8
76
.6
77.8
1,47
9 2,
170
116.
8 11
3.8
120.
7
-1,0
51,0
10
-1,1
04,3
72
22.4
18
.3
18.3
-14,
105
-14,
738
45.0
36
.3
36.2
-1,4
90,5
38
-1,5
23,5
91
58.2
52
.7
53.0
-12,
626
-12,
568
71.2
61
.6
62.6
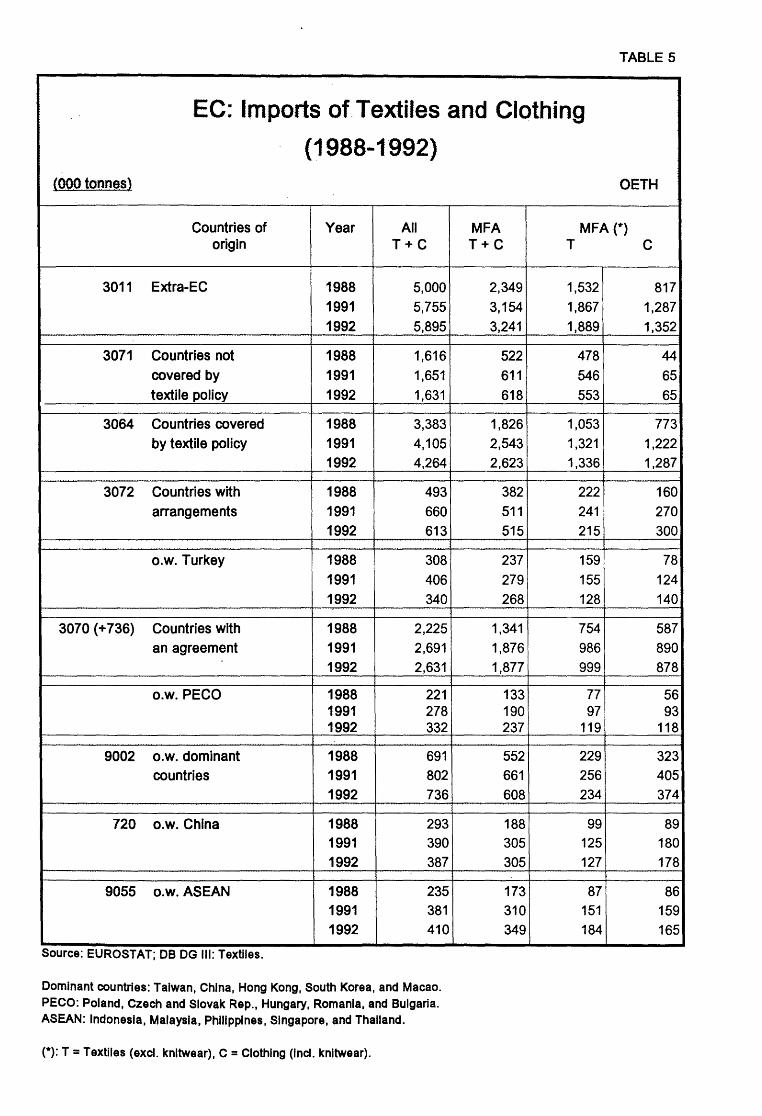
TABLE 5
EC: Imports of Textiles and Clothing
(1988-1992) (000 tonnes)
Countries of Year All origin T+C
3011 Extra-EC 1988 5,000
1991 5,755
1992 5,895
3071 Countries not 1988 1,616
covered by 1991 1,651
textile policy 1992 1,631
3064 Countries covered 1988 3,383
by textile policy 1991 4,105
1992 4,264
3072 Countries with 1988 493
arrangements 1991 660
1992 613
o.w. Turkey 1988 308
1991 406
1992 340
3070 (+736) Countries with 1988 2,225
an agreement 1991 2,691
1992 2,631
o.w. PECO 1988 221 1991 278 1992 332
9002 o.w. dominant 1988 691
countries 1991 802
1992 736
720 o.w. China 1988 293 1991 390
1992 387
9055 o.w.ASEAN 1988 235
1991 381
1992 410
Source: EUROSTAT; DB DG Ill: Textiles.
Dominant countries: Taiwan, China, Hong Kong, South Korea, and Macao. PECO: Poland, Czech and Slovak Rep., Hungary, Romania, and Bulgaria. ASEAN: Indonesia, Malaysia, Philippines, Singapore, and Thailand.
(*): T =Textiles (excl. knitwear), c =Clothing (Incl. knitwear).
OETH
MFA MFA(.,.) T+C T c
2,349 1,532 817
3,154 1,867 1,287
3,241 1,889 1,352
522 478 44 611 546 65
618 553 65
1,826 1,053 773
2,543 1,321 1,222
2,623 1,336 1,287
382 222 160
511 241 270
515 215 300
237 159 78
279 155 124
268 128 140
1,341 754 587
1,876 986 890
1,877 999 878
133 77 56 190 97 93 237 119 118
552 229 323
661 256 405
608 234 374
188 99 89 305 125 180
305 127 178
173 87 86 310 151 159
349 184 165
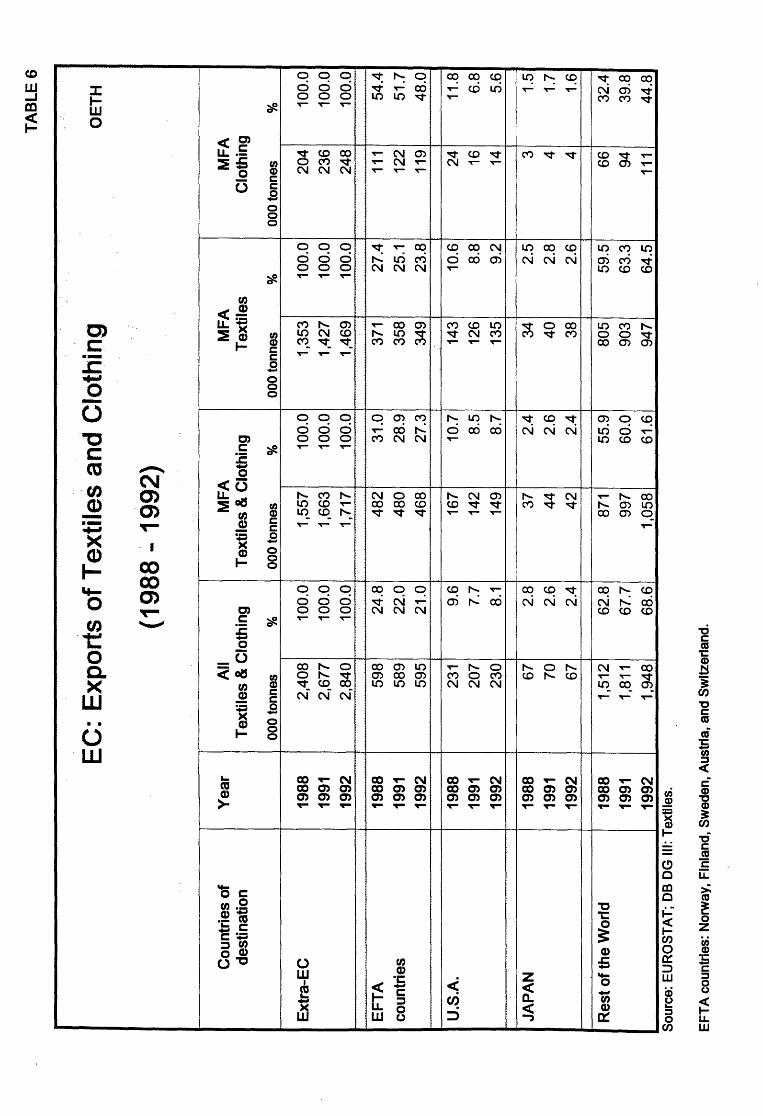
TA
BL
E 6
EC
: E
xpor
ts o
f Te
xtile
s an
d C
loth
ing
OE
TH
(19
88
-19
92)
Cou
ntri
es o
f Y
ea
r A
ll M
FA
M
FA
M
FA
de
stin
atio
n T
ext
iles
& C
loth
ing
Te
xtile
s &
Clo
thin
g T
ext
iles
Clo
thin
g
OO
Oto
nnes
%
O
OO
tonn
es
%
OO
Oto
nnes
%
O
OO
tonn
es
%
Ext
ra-E
C
1988
2,
408
100.
0 1,
557
100.
0 1,
353
100.
0 20
4 10
0.0
1991
2,
677
100.
0 1,
663
100.
0 1,
427
100.
0 23
6 10
0.0
1992
2,
840
100.
0 1,
717
100.
0 1,
469
100.
0 24
8 10
0.0
EF
TA
19
88
598
24.8
4
82
31
.0
371
27.4
11
1 54
.4
coun
trie
s 19
91
589
22.0
4
80
28
.9
358
25.1
12
2 51
.7
1992
59
5 21
.0
46
8
27.3
34
9 23
.8
119
48.0
U.S
.A.
1988
23
1 9.
6 16
7 10
.7
143
10.6
24
11
.8
1991
20
7 7.
7 14
2 8.
5 12
6 8.
8 16
6.
8
1992
23
0 8.
1 14
9 8.
7 13
5 9.
2 14
5.
6
JAP
AN
19
88
67
2.8
37
2.4
34
2.5
3 1.
5
1991
70
2.
6 44
2.
6 4
0
2.8
4 1.
7
1992
67
2.
4 4
2
2.4
38
2.6
4 1.
6
Res
t of t
he W
orld
19
88
1,51
2 62
.8
871
55.9
80
5 59
.5
66
32.4
1991
1,
811
67.7
99
7 60
.0
903
63.3
94
39
.8
1992
1,
948
68.6
1,
058
61.6
94
7 64
.5
111
44.8
S
ou
rce
: E
UR
OS
TA
T;
DB
DG
Ill:
Te
xtile
s.
EF
TA
co
un
trie
s: N
orw
ay,
Fin
lan
d,
Sw
ed
en
, A
ust
ria
, a
nd
Sw
itze
rla
nd
.

EC
: Te
xtile
s an
d C
loth
ing
Impo
rts
(Ext
ra,
Intr
a)
1985
=100
Co
un
try
Bel
gium
Oen
m-a
rk
Gar
man
y (W
ast)
Gre&~ (
*)
~pain·
j:ra
~rie
· lre
.land
(•)
·Italy:
··· ..
Net
herla
nds
U.K
.
NO
TE
S:(
*) E
stim
ate
Indi
ces
base
d on
vol
ume
TE
XT
ILE
S
MF
A
EX
TR
A
%o
f tot
al
1990
19
91
19
92
1
99
2
190
200
203
9.8
105
106
99
2.2
138
153
147
24.5
264
260
251
1.6
744
993
1182
5.
6
158
151
155
10.4
714
707
530
1.1
163
161
158
16.6
139
135
135
5.9
112
106
130
2.3
164
163
1 73
20.0
161
166
168
100.
0
SO
UR
CE
: E
UR
OS
TA
T,
DB
DG
III T
extil
es.
OE
TH
.
CLO
TH
ING
M
FA
(I
ncl.
knitw
ear)
Indi
ces
TE
XT
ILE
S
MF
A
INT
RA
% o
f tot
al
% o
f tot
al
1990
19
91
19
92
19
92
1990
19
91
19
92
1
99
2
380
429
468
3.9
119
120
117
9.9
273
419
401
4.1
96
93
98
2.3
184
235
229
38.6
13
8 14
8 14
9 23
.0
556
945
1309
0.
3 16
9 15
8 18
3 2.
6
1944
31
95
4633
3.
1 36
9 43
1 49
4 3.
6
306
356
369
15.4
13
0 13
1 13
6 18
.7
1673
14
94
1336
0.
4 98
95
11
6 2.
0
254
351
449
7.6
127
124
121
8.6
208
240
262
8.9
118
120
111
9.7
1516
18
29
2102
0.
2 41
2 44
2 46
9 3.
7
208
233
258
17.5
10
9 10
5 11
0 16
.0
221
273
286
100.
0 12
9 13
1 13
3 10
0.0
CLO
TH
ING
M
FA
(I
ncl.
knitw
ear)
TA
BLE
7
OET
H
%o
f tot
al
19
90
19
91
1992
19
92
139
152
157
9.9
134
144
145
2.4
160
193
186
33.9
264
288
308
1.2
1566
22
34
2947
5.
2
166
180
185
15.7
158
172
202
3.5
159
220
251
3.7
129
143
132
11 .1
939
1296
16
04
2.0
150
157
179
11.5
159
183
188
100.
0
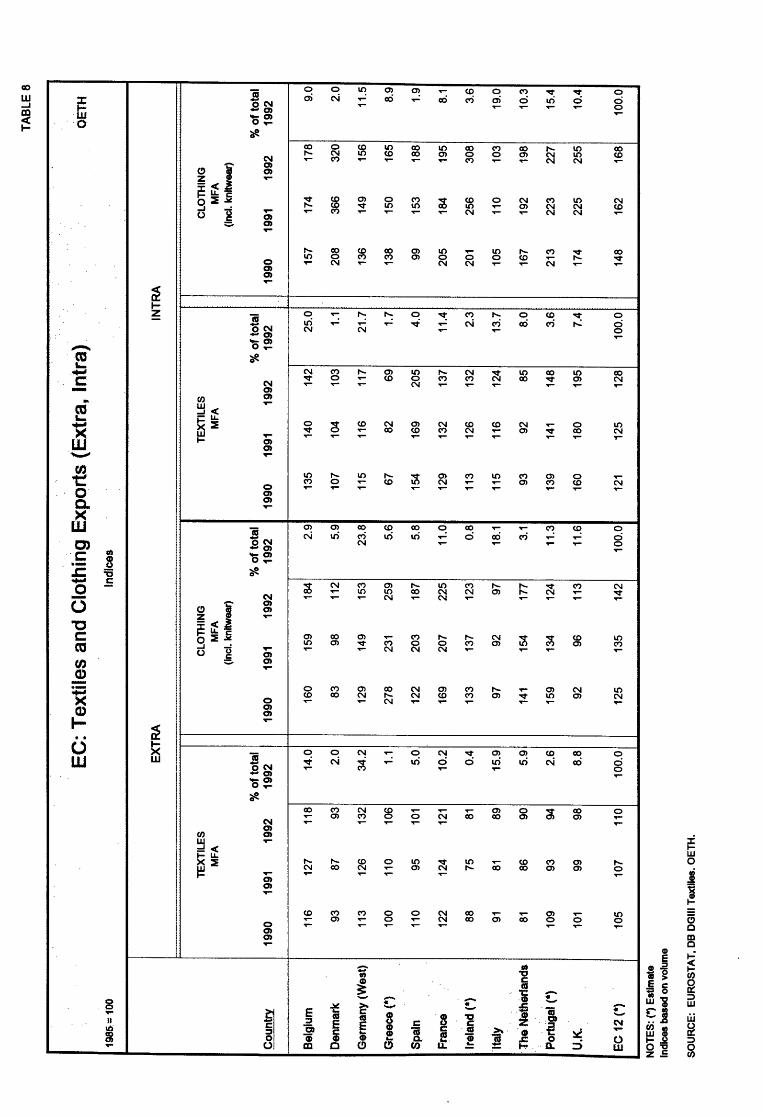
1985
:= 1
00
Cou
ntry
Bel
gium
Den
mar
k
Ger
man
y (W
est)
Gre
ece(
*)
Spai
n
Fran
ce
Irel
and(
*)
'Ital
y
The·
Net
h8rf
ands
Portu
gal
(*)
U~K.
EC 1
2 (*
)
NO
TE
S:
(*)
Est
ima
te
Indi
ces
bas
ed o
n v
olum
e
1990
116 93
113
100
110
122 88
91
81
109
101
105
TE
XT
ILE
S
MF
A
1991
19
92
127
118
87
93
126
132
110
106
95
101
124
121
75
81
81
89
86
90
93
94
99
98
107
110
SO
UR
CE
: E
UR
OS
TA
T,
DB
DG
III
Tex
tiles
. O
ET
H.
EC
: T
exti
les
and
Clo
thin
g E
xpo
rts
(Ext
ra,
Intr
a).
Indi
ces
EXTR
A
INTR
A
CLO
TH
ING
T
EX
TIL
ES
M
FA
M
FA
(I
ncl.
knitw
ear)
%of
tota
l %
of
tota
l %
of
tota
l 19
92
1990
19
91
1992
19
92
1990
19
91
1992
19
92
14.0
16
0 15
9 18
4 2.
9 13
5 14
0 14
2 25
.0
2.0
83
98
112
5.9
107
104
103
1.1
34.2
12
9 14
9 15
3 23
.8
115
116
117
21.7
1.1
278
231
259
5.6
67
82
69
1.7
5.0
122
203
187
5.8
154
169
205
4.0
10.2
16
9 20
7 22
5 11
.0
129
132
137
11.4
0.4
133
137
123
0.8
113
126
132
2.3
15.9
97
92
97
18
.1
115
116
124
13.7
5.9
141
154
177
3.1
93
92
85
8.0
2.6
159
134
124
11.3
13
9 14
1 14
8 3.
6
8.8
92
96
113
11.6
16
0 18
0 19
5 7.
4
100.
0 12
5 13
5 14
2 10
0.0
121
125
128
100.
0
TAB
LE 8
OET
H
CL
OT
HIN
G
MF
A
(Inc
l. kn
itwea
r)
%o
f to
tal
1990
19
91
1992
19
92
157
174
178
9.0
208
366
320
2.0
136
149
156
11.5
138
150
165
8.9
99
153
188
1.9
205
184
195
8.1
201
256
308
3.6
105
110
103
19.0
167
192
198
10.3
213
223
227
15.4
174
225
255
10.4
148
162
168
100.
0

OP
T K
EY
FIG
UR
ES
ON
IM
PO
RT
S
(198
9-19
92)
To
tal M
FA
clo
thin
g(,
CO
UN
TR
Y:
EC
C
OU
NT
RY
: G
ER
MA
NY
1989
S
ha
re
1990
S
ha
re
1991
S
ha
re
1992
S
ha
re
1989
(%
) (%
) (%
) (%
)
OP
T Im
port
s 80
,758
9.
2 96
,987
9.
3 11
8,07
4 9.
2 13
3,82
6 9.
9 O
PT
Im
port
s 50
,672
D
IRE
CT
Im
port
s 79
7,46
7 90
.8
947,
307
90.7
1,
168,
928
90.8
1,
218,
240
90.1
D
IRE
CT
Impo
rts
481,
328
TO
TA
L I
mpo
rts
878,
225
1,04
4,29
4 1,
287,
002
1,35
2,06
6 T
OT
AL
Impo
rts
532,
000
CO
UN
TR
Y:F
RA
NC
E
CO
UN
TR
Y:I
TA
L Y
1989
S
hare
19
90
Sh
are
19
91
Sh
are
19
92
Sh
are
19
89
(%)
(%)
(%)
(%)
OP
T Im
port
s 15
,845
6.
4 16
,406
5.
9 15
,083
4.
8 16
,742
5.
2 O
PT
Impo
rts
812
DIR
EC
T I
mpo
rts
230,
886
93.6
26
0,70
8 94
.1
298,
813
95.2
30
7,58
5 94
.8
DIR
EC
T Im
port
s 63
,878
TO
TA
L I
mpo
rts
246,
731
277,
114
313,
896
324,
327
TO
TA
L Im
port
s 64
,690
-
CO
UN
TR
Y:B
EN
ELU
X
CO
UN
TR
Y:D
EN
MA
RK
1989
S
hare
19
90
Sh
are
19
91
Sh
are
19
92
Sh
are
19
89
(%)
(%)
(%)
{%)
OP
T Im
port
s 10
,794
4.
5 13
,351
4.
7 15
,167
4.
8 17
,215
5.
3 O
PT
Imp
ort
s 1,
916
DIR
EC
T Im
port
s 22
9,67
1 95
.5
269,
704
95.3
30
2,10
7 95
.2
310,
603
94.7
D
IRE
CT
Impo
rts
42,3
94
TO
TA
L I
mpo
rts
240,
465
283,
055
317,
274
327,
818
TO
TA
L Im
port
s 44
,310
r>: To
tal E
C im
port
s ar
e fr
om E
xtra
-EC
cou
ntri
es o
nly;
Cou
ntrie
s' i
mpo
rts
are
from
In
tra
-an
d E
xtra
-EC
cou
ntri
es.
SO
UR
CE
: E
UR
OS
TA
T;
DB
DG
III:
Tex
tiles
; O
PT
impo
rts
are
base
d on
Reg
ime
31n
the
da
ta b
ank.
Uni
t: T
onne
s
TA
BLE
9
OE
TH
Sh
are
19
90
Sh
are
19
91
Sh
are
19
92
Sh
are
(%
) (%
) (%
) (%
)
9.5
61,4
59
9.7
77,7
25
9.8
82,5
27
10.7
90
.5
571,
297
90.3
71
5,86
0 90
.2
688,
600
89.3
632,
756
793,
585
771,
127
Sh
are
19
90
Sh
are
19
91
Sh
are
19
92
Sha
re
(%)
(%)
(%)
(%)
1.3
551
0.7
1,78
3 1.
7 4,
840
3.7
98.7
74
,801
99
.3
102,
483
98.3
12
5,00
7 96
.3
75,3
52
104,
266
129,
847
Sh
are
19
90
Sh
are
19
91
Sh
are
19
92
Sha
re
(%)
(%)
(%)
(%)
4.3
3,10
3 5.
7 5,
231
6.9
7,39
6 10
.0
95.7
51
,407
94
.3
70,8
43
93.1
66
,369
90
.0
54,5
10
76,0
74
73,7
65

1991
E
C:
OP
T I
MP
OR
TS
AS
% O
F T
OT
AL
IMP
OR
TS
S
ele
cte
d M
FA
ca
teg
ori
es
fro
m m
ain
OP
T c
ou
ntr
ies
EX
-C
ZE
CH
AN
D
MF
A C
at.
YU
GO
SLA
VIA
P
OLA
ND
~LOVAK R
EP
. H
UN
GA
RY
R
OM
AN
IA
BU
LGA
RIA
(1
) (2
) (3
) (4
) (5
) (6
)
4. S
hirt
s, T
-shi
rts
13
12
4 55
0
9 5.
Jer
seys
, pu
llove
rs
46
40
32
34
4 21
6.
Wov
en t
rous
ers,
sho
rts
79
87
53
88
57
64
7. W
IG b
lous
es
77
91
89
92
91
71
8. M
IB s
hirt
s 73
97
40
44
29
30
12
. Pan
ty-h
ose
& ti
ghts
28
8
3 73
0
1 13
. Und
erpa
nts,
brie
fs
44
74
45
88
39
36
14.
MIB
wov
en o
verc
oats
70
89
58
94
70
74
15
. WIG
wov
en o
verc
oats
73
65
43
94
79
0
16.
MIB
sui
ts
49
73
59
91
73
45
17. M
IB ja
cket
s, b
laze
rs
27
21
45
94
60
8 21
. P
arka
s, a
nora
ks
51
90
67
23
68
32
24.
MIB
nig
htsh
irts
49
24
6 68
0
2 26
. WIG
dre
sses
53
71
67
90
78
55
27
. WIG
ski
rts
53
85
82
93
56
82
29. W
IG s
uits
& e
nsem
bles
74
84
89
94
77
38
31
. Bra
ssie
res
77
97
64
91
99
100
70. T
ight
s, o
f syn
th.
fibre
s 11
9
30
65
10
0 76
. M
/B i
ndus
tria
l clo
thin
g 30
89
68
96
23
2
86.
Cor
sets
, co
rset
-bel
ts
81
100
60
61
0 10
0
Tot
al M
FA
Clo
thin
g 51
75
44
73
44
33
SO
UR
CE
: E
UR
OS
TA
T;
DB
DG
III:
Tex
tiles
; O
PT
Im
port
s ar
e ba
sed
on R
egim
e 3
in t
he d
ata
ban
k.
Not
e: b
ased
on
volu
me
(ton
nes)
M
/B:
Men
's o
r bo
ys';
WIG
: W
omen
's o
r gi
rls'.
TA
BLE
10
OE
TH
TO
TA
L M
OR
OC
CO
T
UN
ISIA
T
UR
KE
Y
EX
TR
AE
C
(7)
(8)
(9)
(1 0
)
1 42
0
1 2
14
1 2
17
14
15
13
14
15
7 14
18
27
1
8 2
19
0 6
16
11
40
17
11
20
5 32
7
7 25
19
11
15
41
38
44
46
15
9
11
7 12
10
0
27
0 4
13
13
1 10
22
23
7
24
12
2 2
12
11
9 0
18
0 0
0 9
43
10
1 24
23
7
0 15
14
16
4 9
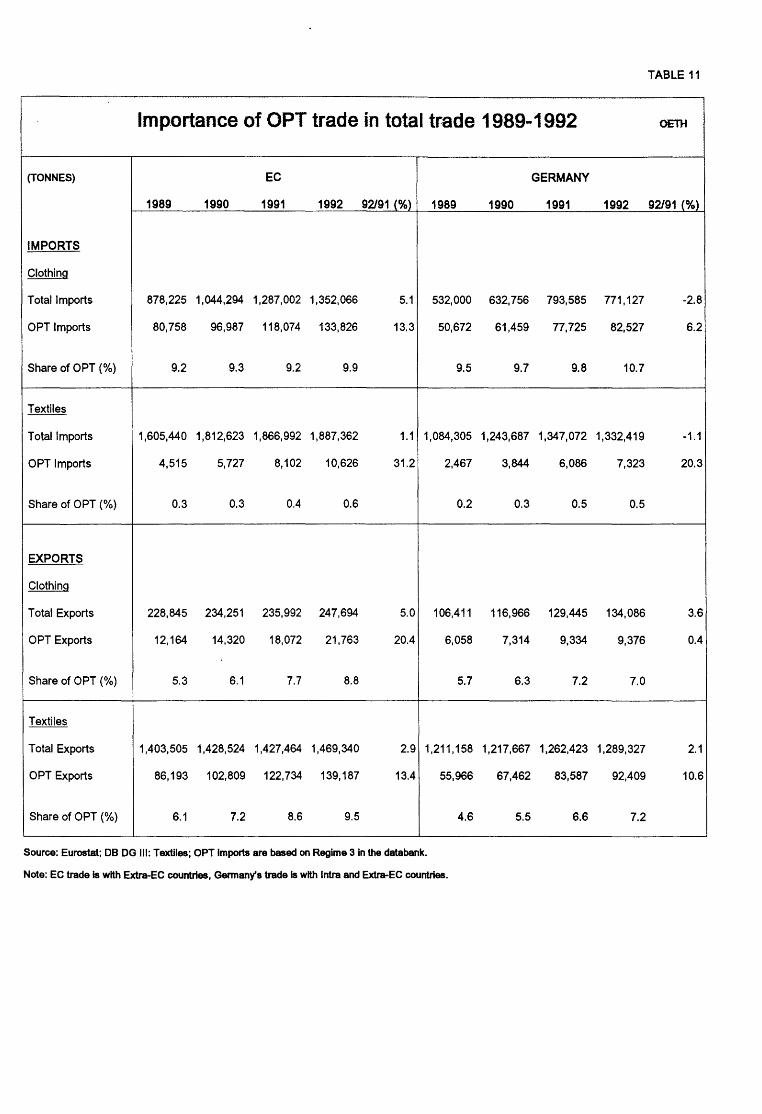
Importance of OPT trade in total trade 1989-1992.
(TONNES) EC
1989 1990 1991 1992 92/91 {%) 1989
IMPORTS
Clothing
Total Imports 878,225 1,044,294 1,287,002 1,352,066 5.1 532,000
OPT Imports 80,758 96,987 118,074 133,826 13.3 50,672
Share of OPT(%) 9.2 9.3 9.2 9.9 9.5
Textiles
Total Imports 1,605,440 1,812,623 1,866,992 1,887,362 1.1 1,084,305
OPT Imports 4,515 5,727 8,102 10,626 31.2 2,467
Share of OPT (%) 0.3 0.3 0.4 0.6 0.2
EXPORTS
Clothing
Total Exports 228,845 234,251 235,992 247,694 5.0 106,411
OPT Exports 12,164 14,320 18,072 21,763 20.4 6,058
Share of OPT (%) 5.3 6.1 7.7 8.8 5.7
Textiles
Total Exports 1,403,505 1,428,524 1,427,464 1,469,340 2.9 1,2111158
OPT Exports 86,193 102,809 122,734 139,187 13.4 55,966
Share of OPT(%) 6.1 7.2 8.6 9.5 4.6
Source: Eurostat; DB DG Ill: Textiles; OPT Imports are based on Regime 3 in the databank.
Note: EC trade Is with Extra-EC countries, Gennany's trade Is with Intra and Extra-EC countries.
GERMANY
1990 1991
632,756 793,585
61,459 77,725
9.7 9.8
1,243,687 1,347,072
3,844 6,086
0.3 0.5
116,966 129,445
7,314 9,334
6.3 7.2
1,217,667 1,262,423
67,462 83,587
5.5 6.6
TABLE 11
OETH
1992 92/91 (%)
771,127 -2.8
82,527 6.2
10.7
1,332,419 -1.1
7,323 20.3
0.5
134,086 3.6
9,376 0.4
7.0
1,289,327 2.1
92,409 10.6
7.2
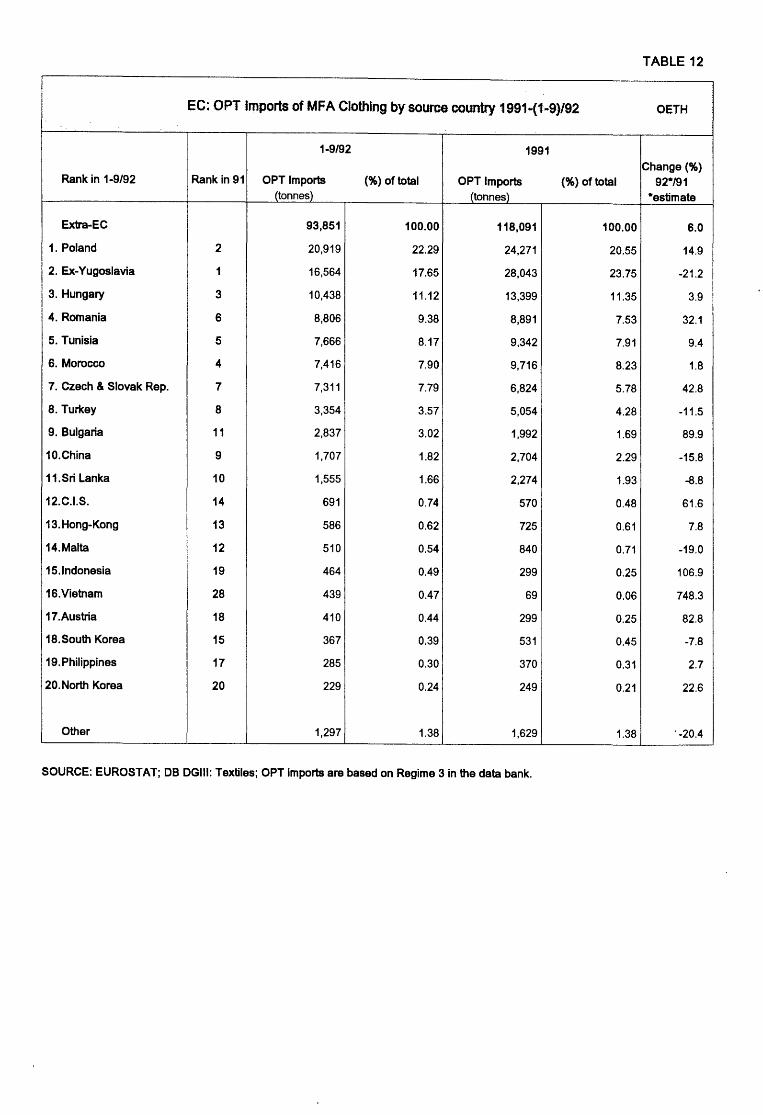
TABLE 12
EC: OPT Imports of MFA Clothing by source country 1991·(1 .. 9}/92 OETH
1-9/92 1991
Change(%) Rank in 1-9/92 Rank in 91 OPT Imports (%)of total OPT Imports {%)of total 92*/91
(tonnes} ltonnes) *estimate
Extra-EC 93,851 100.00 118,091 100.00 6.0
1. Poland 2 20,919 22.29 24,271 20.55 14.9
2. Ex-Yugoslavia 1 16,564 17.65 28,043 23.75 -21.2
3. Hungary 3 10,438 11.12 13,399 11.35 3.9
4. Romania 6 8,806 9.38 8,891 7.53 32.1
5. Tunisia 5 7,666 8.17 9,342 7.91 9.4
6. Morocco 4 7,416 7.90 9,716 8.23 1.8
7. Czech & Slovak Rep. 7 7,311 7.79 6,824 5.78 42.8
8. Turkey 8 3,354 3.57 5,054 4.28 -11.5
9. Bulgaria 11 2,837 3.02 1,992 1.69 89.9
10.China 9 1,707 1.82 2,704 2.29 -15.8
11.Sri Lanka 10 1,555 1.66 2,274 1.93 -8.8
12.C.I.S. 14 691 0.74 570 0.48 61.6
13.Hong-Kong 13 586 0.62 725 0.61 7.8
14.Malta 12 510 0.54 840 0.71 -19.0
15.1ndonesia 19 464 0.49 299 0.25 106.9
16.Vietnam 28 439 0.47 69 0.06 748.3
17.Austria 18 410 0.44 299 0.25 82.8
18.South Korea 15 367 0.39 531 0.45 -7.8
19.Philippines 17 285 0.30 370 0.31 2.7
20.North Korea 20 229 0.24 249 0.21 22.6
Other 1,297 1.38 1,629 1.38 . -20.4
SOURCE: EUROSTAT; DB DGIII: Textiles; OPT imports are based on Regime 3 in the data bank.

1991
E
C:
TO
TA
L IM
PO
RT
S ..
QU
OT
A U
TIL
ISA
TIO
N(%
) (1
) S
elec
ted
MF
A c
ate
go
rie
s fr
om m
ain
OP
T c
ount
ries
(2)
.
EX
-C
ZE
CH
AN
D
MF
A C
at.
YU
GO
SLA
VIA
P
OLA
ND
S
LOV
AK
RE
P.
HU
NG
AR
Y
RO
MA
NIA
(1
) (2
) (3
)
4. S
hirt
s, T
-shi
rts
41.2
49
.3
5. J
erse
ys,
pullo
vers
62
.9
63.9
75
.8
6. W
oven
tro
user
s, s
hort
s .
88.7
68
.4
77.2
7.
WIG
blo
uses
95
.2
35.5
8.
M/B
shi
rts
66.4
60
.4
85.5
12
. Pan
ty-h
ose
& ti
gh
ts
69.8
53
.4
13.
Und
erpa
nts,
bri
efs
57.3
32
.0
14.
M/B
wov
en o
verc
oats
25
.6
15.2
15
. W/G
wov
en o
verc
oats
66
.5
62.9
57
.5
16.
M/B
sui
ts
29.3
22
.2
30.1
17
. M
/B ja
cket
s, b
laze
rs
85.0
21
. P
arka
s, a
nora
ks
29.9
24
. M
/B n
ight
shirt
s 25
.6
72.4
26
. W
/G d
ress
es
24.4
34
.1
27. W
/G s
kirt
s
29. W
/G s
uits
& e
nsem
bles
31.
Bra
ssilt
res
67.6
70
. T
ight
s, o
f syn
th.
fibre
s
76.
M/B
ind
ustr
ial c
loth
ing
(*)
60.9
86
. C
orse
ts,
cors
et-b
elts
Dat
a un
derli
ned:
on
ly d
ire
ct q
uota
exi
sts,
th
ere
fore
(%)
on
ly b
ased
on
dir
ect
impo
rts .
. N
ote:
bas
ed o
n 00
0 pi
eces
(o
r pa
irs);
* o
n to
nnes
B
lank
s:
neith
er a
dir
ect
no
r an
OP
T q
uota
. (1
): (
Dir
ect
+ O
PT
) Im
port
s as
a %
of (
Dir
ect
+ O
PT
) Q
uota
s (2
): F
or M
oroc
co a
nd T
unis
ia,
OP
T E
C q
uota
s di
d n
ot
exis
t in
1·9
91,
exce
pt in
cat
. 6.
(4)
(5)
41.9
30
.4
41.9
34
.6
45.6
46
.4
32.2
38
.0
11.0
66
.9
65.3
35
.5
23.1
14
.3
24.9
48
.6
37.6
12
.0
57.8
39
.0
48.6
14
.2
15.8
42.1
BU
LG
AR
IA
(6)
63.1
92
.2
43.8
52
.4
46.3
10.1
10
.7
7.4
SO
UR
CE
: E
UR
OS
TA
T;
DB
DG
III:
Tex
tiles
(O
PT
impo
rts
are
base
d on
Reg
ime
3 In
the
dat
a ba
nk);
Offi
cial
Jou
rnal
of t
he E
.C.-
vari
ous
issu
es.
TA
BLE
13
OE
TH
TU
RK
EY
(7
)
101.
7 10
0.8
87.4
86
.5
72.3
96
.5
81.3
69.5

' .
'.' ..
· ..
: '
. ''
..
.. '
..
' '.
'"'
. .
' ..
' .
'
cons
tanf
pric
es (1
98
5=
10
0)
'
MA
NU
FA
CT
UR
ING
IN
DU
ST
RY
1991
19
92
36;,2
· '3
7.7
SO
UR
CE
: D
EB
A;
OE
TH
.
NO
TE
S:
92/9
1 (%
)
4.1
Pro
duct
ivity
· { 19
91 -
· 199
2) ·
(00
0 E
CU
pe
r e
mp
loye
e)
TE
XT
ILE
IN
DU
ST
RY
NA
CE
43
NA
CE
43+
455
1991
19
92
92/9
1 19
91
1992
(%
)
24.4
25
.5
4.5
2
1.5
'2
2.6
-Pro
du
ctiv
ity
is d
efin
ed a
s va
lue
ad
de
d a
t fa
cto
r co
sts
pe
r e
mp
loye
e
-D
ata
base
d on
firm
s w
ith m
ore
than
20
em
plo
yee
s o
nly
TA
BL
E 1
4
OET
H
CL
OT
HIN
G I
ND
US
TR
Y
NA
CE
453
92/9
1 19
91
1992
92
/91
(%)
(%)
5.1
'17
.2
19.1
1
1.0

TA
BL
E 1
5
EC
: A
pp
are
nt
Con
sum
ptio
n o
f the
Kni
ttin
g In
du
stry
& W
oven
· Clo
thin
g
(199
0 -1
992)
O
ETH
• (
mill
ion
EC
U,
curr
en
t pr
ices
)
Kni
ttin
g In
du
stry
(N
AC
E 4
36
) W
ove
n C
loth
ing
(N
AC
E 4
53
+4
54
)
1990
19
91
1992
92
/91
1990
19
91
1992
92
/91
Pro
du
ctio
n ·
21
,880
22
,898
22
,621
98
.8
65,7
98
68,3
79
70,6
54
103.
3
. .-rn
ports
6,
766
8,96
8 9,
896
110.
3 13
,781
16
,684
16
,474
98
.7
Exp
ort
s 4,
330
4,26
8 4,
487
105.
1 6,
727
6,68
2 6,
892
103.
1
Ap
pa
ren
t Con
sum
ptio
n 24
,316
27
,598
28
,030
72
,852
78
,381
80
,236
An
nu
al C
ha
ng
e (
%)
13.5
1.
6 7.
6 2.
4
An
nu
al C
ha
ng
e (
%)
{*}
8.9
-1.7
3.
2 -1
.0
Sou
rce:
DE
BA
; O
ET
H.
(*):
Bas
ed o
n ap
pare
nt c
onsu
mpt
ion
in c
on
sta
nt
pric
es,
usi
ng
co
nsu
me
r p
rice
s fo
r cl
othi
ng (
Tab
le 1
7)

TABLE 16
:Indices of Producer Prices OETH
National CUrrencies {1985 = 100)
TEXTILES CLOTHING MANUFACTURING (NACE 43) (CODE 459)
CountrY Dec. 1990 Dec. 1991 Dec. 1992 Dec. 1990 Dec. 1991 Dec. 1992 Dec. 1990 Dec. 1991 Dec. 1992
Belgium 92.4 92.0 90.5 113.5 116.8 119.3 95.1 93.7 93.2
Denmark 113.0 115.0 113.0 117.1 122.1 123.1 108.9 110.3 107.7
Germany (West) 102.7 104.1 105.3 111.0 113.3 116.1 104.5 106.4 107.5
Greece 179.1 187.4 203.9 219.8 254.4 285.8 204.0 230.0 262.4
Spain 106.2 107.7 108.4 134.3 141.6 148.6 111.9 112.4 113.8
France 104.0 104.2 103.4 118.2 121.9 123.5 110.5 110.1 109.7
Ireland 115.7 116.6 117.1 - - - 114.5 116.4 118.9
Italy 117.3 117.7 118.9 121.4 127.0 129.2 121.7 123.6 126.8
Luxembourg - - - - - - 96.4 94.6 94.1
The Netherlands 103.0 104.9 106.0 110.2 114.1 114.2 97.3 99.6 99.5
Portugal 225.7 - - - - - - - -U.K. 125.0 129.2 132.4 122.7 128.5 133.0 123.8 126.4 130.6
EC 114.4 115.9 117.4 122.6 127.8 131.6 114.0 115.6 117.7
SOURCE: EUROSTAT
Indices of Producer Prices - December 1992
Textiles, Clothing & Manufacturing (1985=1 00) 300
250
200
150
100
50
0 B DK D GR E F IRL NL UK
Textiles Dec. 92 Clothing Dec. 92 Manufacturing Dec. 92 - - ~
EC
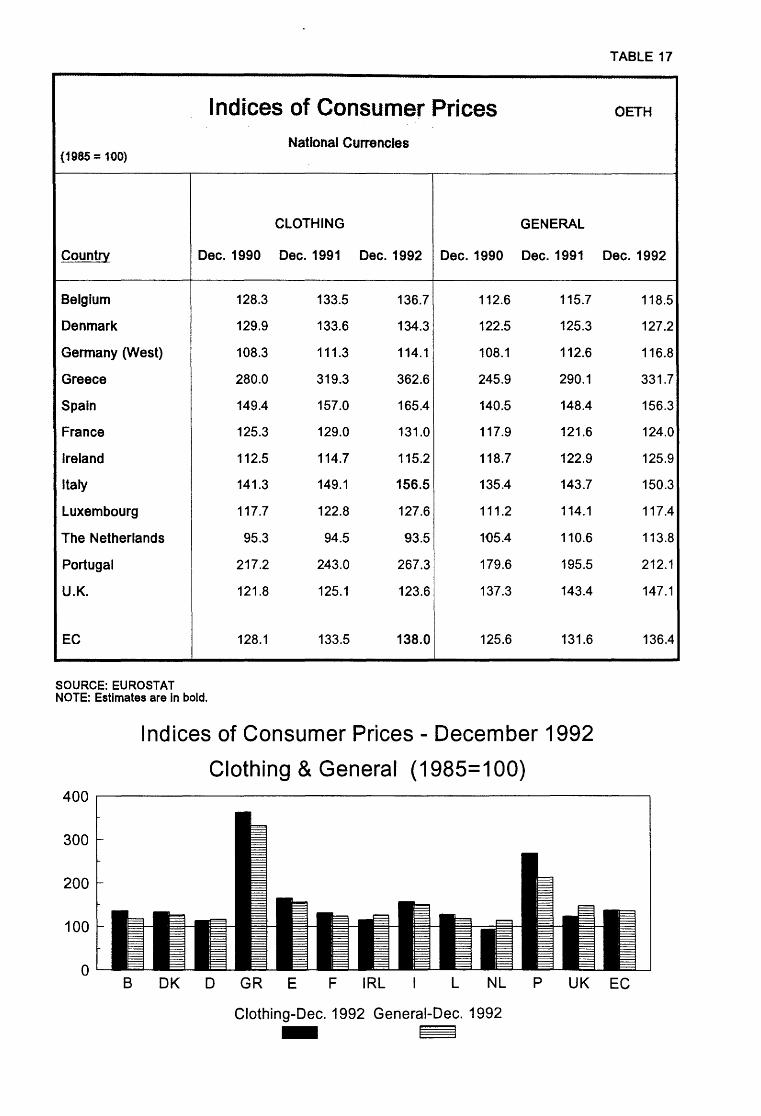
Indices of Consumer Prices
{1985 = 100)
Countrv Dec. 1990
Belgium
Denmark
Germany (West)
Greece
Spain
France
Ireland
Italy
Luxembourg
The Netherlands
Portugal
U.K.
EC
SOURCE: EUROSTAT NOTE: Estimates are in bold.
128.3
129.9
108.3
280.0
149.4
125.3
112.5
141.3
117.7
95.3
217.2
121.8
128.1
National Currencies
CLOTHING
Dec. 1991 Dec. 1992 Dec. 1990
133.5 136.7 112.6
133.6 134.3 122.5
111.3 114.1 108.1
319.3 362.6 245.9
157.0 165.4 140.5
129.0 131.0 117.9
114.7 115.2 118.7
149.1 156.5 135.4
122.8 127.6 111.2
94.5 93.5 105.4
243.0 267.3 179.6
125.1 123.6 137.3
133.5 138.0 125.6
GENERAL
Dec. 1991
115.7
125.3
112.6
290.1
148.4
121.6
122.9
143.7
114.1
110.6
195.5
143.4
131.6
Indices of Consumer Prices- December 1992
Clothing & General ( 1985= 1 00)
TABLE 17
OETH
Dec. 1992
118.5
127.2
116.8
331.7
156.3
124.0
125.9
150.3
117.4
113.8
212.1
147.1
136.4
B OK D GR E F IRL L NL P UK EC
Clothing-Dec. 1992 General-Dec. 1992 - ~

TABLE 18
1985 = 100 RetaU Sales Index~ Clothing, Footwear & Leather goods· (NACE 645/646} OETH
B DK D (*) GR F IRL I (**) L NL UK EC ANNUAL
1990 114.2 81.4 110.9 87.9 101.8 112.5 104.3 107.4 118.8 111.7
1991 108.8 84.0 117.7 86.2 101.6 114.3 105.6 104.7 125.9 116.2 111.6
1992 110.2 81.9 111.8 86.9 95.2 112.5 99.3 94.4 125.9 115.4 105.7
SEASON
Winter 89/90 112.2 83.5 110.2 96.4 107.7 115.8 ... 114.5 ... 126.1 . ..
Winter 90/91 116.4 85.7 121.6 91.3 106.8 120.6 113.8 110.5 ... 122.6 ...
Winter 91/92 114.4 87.4 124.2 92.9 106.0 121.3 118.8 107.4 130.7 120.2 116.9
Summer 90 108.8 78.3 103.2 83.5 96.8 106.2 ... 100.5 ... 113.8 ...
Summer 91 105.8 80.8 112.2 82.9 97.6 107.2 95.3 100.7 123.5 110.7 107.0
Summer 92 109.3 77.8 105.5 85.5 91.8 109.6 ... 90.6 122.0 111.2 103.3
SOU~GE: EURC. STAT NOTES: {**):Data only from enterprises with more than 9 wage and salary earners Volume of retail sales, not seasonally adjusted. Seasons: Summer= (March- August), of the same year (*):West Germany only Winter= (September- February), of the following year
GERMANY (West) FRANCE 130 .---------------------------------------,
120
110
UNITED KINGDOM EC 130~---------------------------------.
120
110
100r----------------------------------
Note: The Index of retail sales Illustrated In the graphs Is calculated as a 3 months moving average, based on seasonally adjusted data.
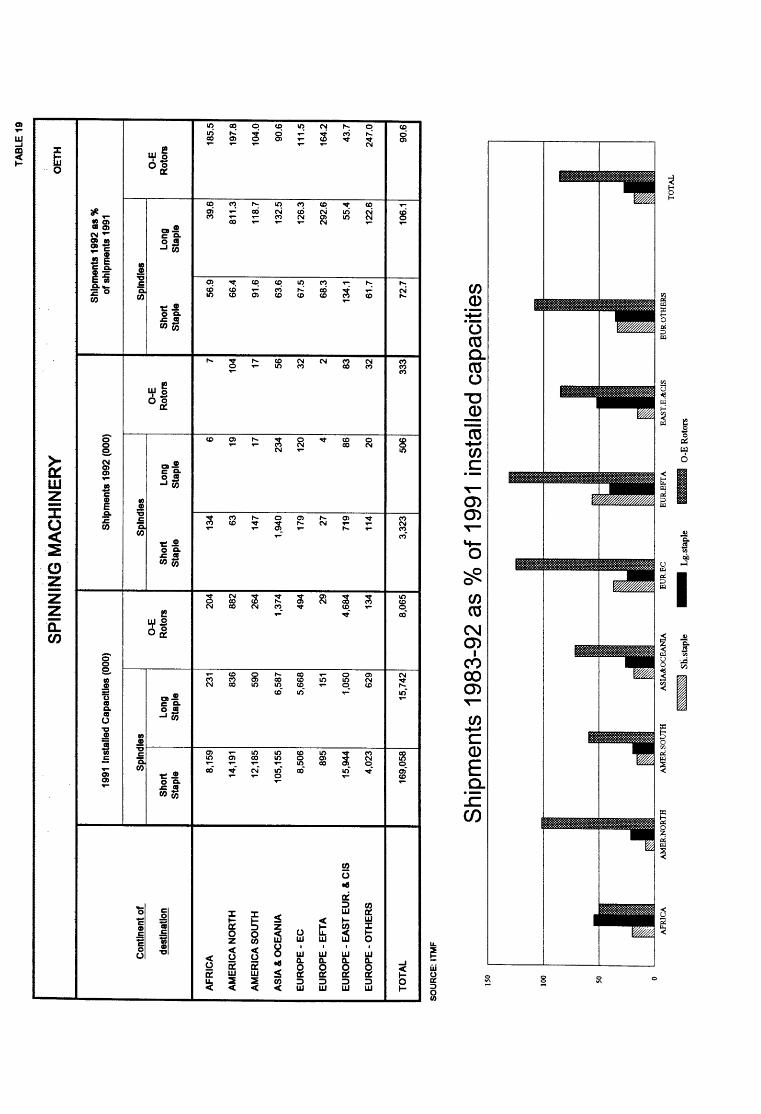
TA
BLE
19
SP
INN
ING
MA
CH
INE
RY
O
ETH
Shi
pmen
ts 1
992
as%
19
91 I
nsta
lled
Cap
aciti
es (
000)
S
hipm
ents
199
2 (0
00)
of s
hipm
ents
199
1
Con
tinen
t of
Spi
ndle
s S
pind
les
Spi
ndle
s 0
-E
0-E
0
-E
dest
inat
ion
Sh
ort
Lo
ng
Rot
ors
Sh
ort
Lo
ng
Rot
ors
Sho
rt
Long
R
otor
s S
tapl
e S
tapl
e S
tapl
e S
tapl
e S
tapl
e S
tapl
e
AF
RIC
A
8,15
9 23
1 20
4 13
4 6
7 56
.9
39.6
18
5.5
AM
ER
ICA
NO
RT
H
14,1
91
836
882
63
19
104
66.4
81
1.3
197.
8
AM
ER
ICA
SO
UT
H
12,1
85
590
264
147
17
17
91.6
11
8.7
104.
0
AS
IA &
OC
EA
NIA
10
5,15
5 6,
587
1,37
4 1,
940
234
56
63.6
13
2.5
90.6
EU
RO
PE
-EC
8,
506
5,66
8 49
4 17
9 12
0 3
2
67.5
12
6.3
111.
5
EU
RO
PE
-E
FT
A
895
151
29
27
4 2
68.3
29
2.6
164.
2
EU
RO
PE
-E
AS
T E
UR
. &
CIS
15
,944
1,
050
4,68
4 71
9 86
8
3
134.
1 55
.4
43.7
EU
RO
PE
-O
TH
ER
S
4,02
3 62
9 13
4 11
4 20
32
61
.7
122.
6 24
7.0
TO
TA
L 16
9,05
8 15
,742
8,
065
3,32
3 50
6 33
3 72
.7
106.
1 90
.6
SO
UR
CE
: IT
MF
150
Sh
ipm
ents
19
83
-92
as
% o
f 19
91 i
nst
alle
d c
apac
itie
s
100 so
AF
RIC
A
AM
ER
.NO
RT
H
AM
ER
.SO
UT
H
ASI
A&
OC
EA
NIA
E
UR
.EC
E
UR
.EF
fA
F.A
ST.E
.&C
IS
EU
R.O
TH
ER
S T
OT
AL
~ S
li.s
tapl
e -
Lg.
stap
le
l!llll!l
!ll!ll
0-E
Rot
ors
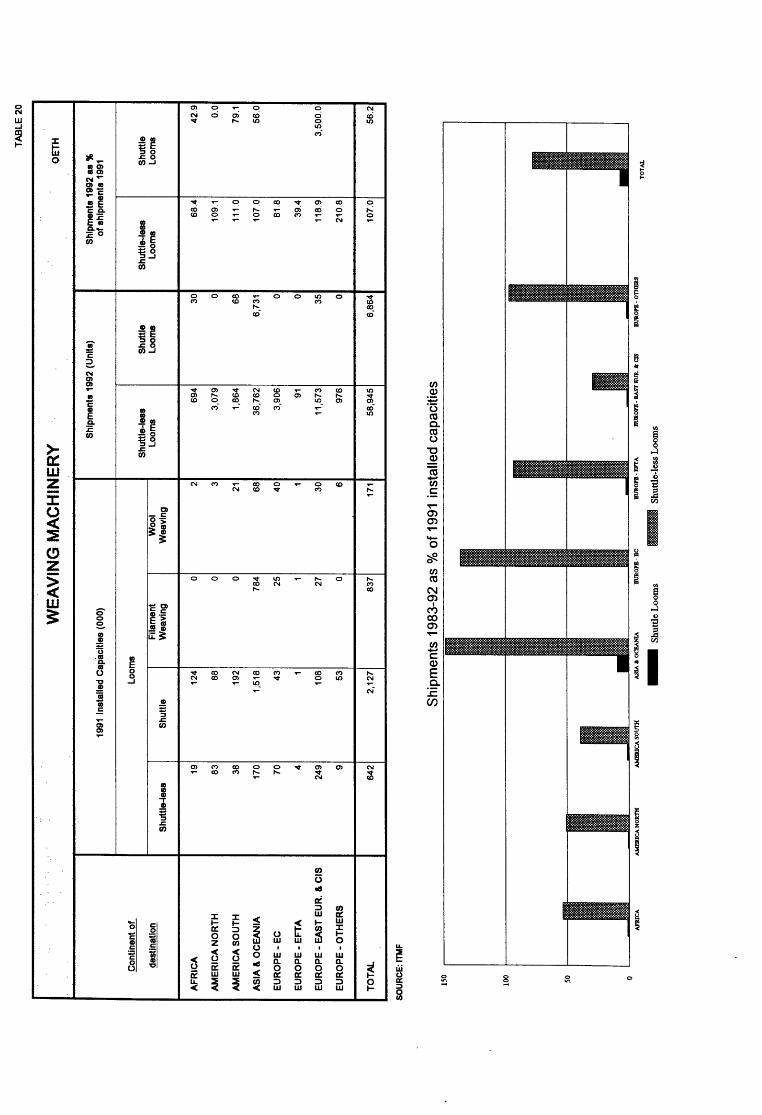
TA
BL
E 2
0
WE
AV
ING
MA
CH
INE
RY
Q
ET
H
Shi
pmen
ts 1
992
(Uni
ts)
Sh
lpm
en
ta1
99
2 a
s%
19
91 I
nsta
lled
Cap
aciti
es (
000)
o
f shi
pmen
ts 1
991
Con
tinen
t o
f Lo
oms
Shu
ttle
-lea
s S
hutt
le
Shu
ttle
-lea
s S
hutt
le
dest
inat
ion
Fila
men
t W
ool
Loom
s Lo
oms
Loom
s Lo
oms
Shu
ttle
-les
s S
hutt
le
We
avi
ng
W
eavi
ng
AF
RIC
A
19
124
0 2
694
30
68.4
42
.9
AM
ER
ICA
NO
RT
H
83
88
0 3
3,07
9 0
109.
1 0.
0
AM
ER
ICA
SO
UT
H
38
192
0 21
1,
864
68
111.
0 79
.1
AS
IA &
OC
EA
NIA
17
0 1,
518
784
68
36,7
62
6,73
1 10
7.0
56.0
EU
RO
PE
-EC
70
43
25
40
3,
906
0 81
.8
EU
RO
PE
-E
FT
A
4 1
1 1
91
0 39
.4
EU
RO
PE
-E
AS
T E
UR
. &
CIS
24
9 10
8 27
30
11
,573
35
11
8.9
3,50
0.0
EU
RO
PE
-O
TH
ER
S
9 53
0
6 97
6 0
210.
8
TO
TA
L 64
2 2,
127
837
171
58,9
45
6,86
4 10
7.0
56.2
SO
UR
CE
: ITM
F
Shi
pmen
ts 1
983-
92 a
s %
of 1
991
inst
alle
d ca
paci
ties
150 ~--------------------------------------------
100 so
Al'J
IIC
A
AN
IIR
ICA
NO
II.T
H
AN
IIR
ICA
S0
1.n
ll B
Ull0
1B
-BC
B
Ull0
1B
• B
FT
A
BU
ll01
B-
BA
ST
BIJ
lt. a
CIS
B
Ull0
1B
. 0
1li
JIU
T
OT
AL
-S
hutt
le L
oom
s ll
llll
!l S
hutt
le-l
ess
Loo
ms

TABLE 21
HUNGARY: Textiles & Clothing (1980-1992) OETH
1980 1985 1990 Jan.-June Change(%) 1992 1992/91
TEXTILE INDUSTRY
Number of enterprises 52 67 240 ... Employees (000) 119.3 106.5 75.8 ...
Production
Cotton yam (000 tonnes) 67.4 64.6 59.1 ... Woollen yam (000 tonnes) 26.3 24.7 16.5 ... Cotton fabrics (mil rrt2) 332.1 309.7 220.5 55.4 -37.9
Woollen fabrics (mil m2 ) 42.7 36.1 20.3 4.2 -41.1
Silk fabrics (& silk types) (mil m2 ) 57.0 59.4 27.8 10.1 -33.3
CLOTHING INDUSTRY
Number of enterprises 125 139 437 ... Employees (000) 77.7 66.1 57.3 ...
Production (000 ~leces}
Men's suits 1,850.0 1,236.0 726.0 423.0 11.7
Men's jackets 793.0 1,177.0 1,320.0 ...
Men's trousers 4,227.0 3,826.0 2,904.0 ...
Women's coats 2,126.0 1,529.0 752.0 539.0 93.1
Costumes & dresses 9,242.0 8,793.0 5,608.0 1500.0 -25.4
Boys' & girls' apparel 25,166.0 21,864.0 6,789.0 ...
Knitted outerwear (000 pieces) ... ... . .. 5,600.0 -6.3
Knitted underwear (000 pieces) ... ... .. . 12,500.0 -15.1
SOURCE: Hungarian Industry & Trade (1980-1990), Ministry of Industry & Trade, 1991; EIU, September 1992
TABLE 22
POLAND: Textiles & Clothing· (1985-1992) OETH . . .
Change(%) 1985 1990 1991 1992 1992/91
Cotton yam (000 t) 184 127.0 73.2 76.1 4.0 Woollen yam (000 t) 84.2 55.0 37.5 33.9 -9.5 Linen yam (000 t) 30.1 14.9 9.5 ... Chemical fibres (000 t) ... ... 105.7 111.0 5.0
Cotton cloth (m metres) 831 428.0 286.2 241.0 -15.8 Woollen cloth (m metres) 105 64.7 44.3 33.7 -24.0 Linen cloth (m metres) 82 35.5 26.6 ... Silk fabrics (m metres} 137 88.3 65.5 67.1 2.5
Carpets & rugs (m sq metres} 11.6 10.0 7.3 7.1 -3.1 Curtains (m sq metres} ... ... 62.5 69.4 11.1 Knitwear (Items-million) 335 153.4 114.3 80.5 -29.6
SOURCE: EIU, March 1993; Statistical Yearbook 1992, Warsaw.
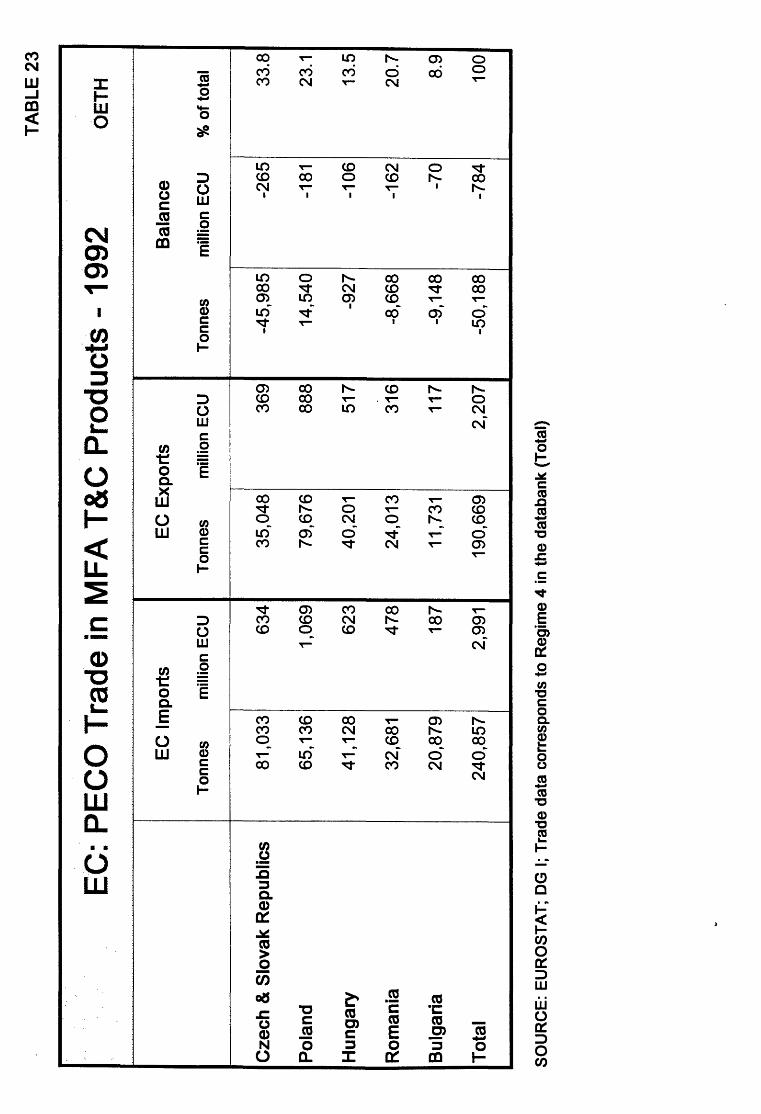
TA
BLE
23
EC
: P
EC
O T
rade
in M
FA
T&
C P
rod
uct
s-19
92
OE
TH
EC
Im
port
s E
C E
xpor
ts
Bal
ance
Ton
nes
mill
ion
EC
U
Ton
nes
mill
ion
EC
U
Ton
nes
mill
ion
EC
U
%o
f tot
al
Cze
ch &
Slo
vak
Rep
ublic
s 81
,033
63
4 35
,048
36
9 -4
5,98
5 -2
65
33
.8
Pol
and
65,1
36
1,06
9 79
,676
88
8 14
,540
-1
81
23.1
Hun
gary
41
'12
8
623
40,2
01
517
-927
-1
06
13.5
Rom
ania
32
,681
4
78
24
,013
31
6 -8
,668
-1
62
20.7
Bul
gari
a 20
,879
18
7 11
,731
11
7 -9
,148
-7
0 8.
9
Tot
al
240,
857
2,99
1 19
0,66
9 2,
207
-50,
188
-784
10
0
SO
UR
CE
: E
UR
OS
TA
T;
DG
I;
Tra
de d
ata
corr
espo
nds
to R
egim
e 4
in t
he
dat
aban
k (T
otal
)
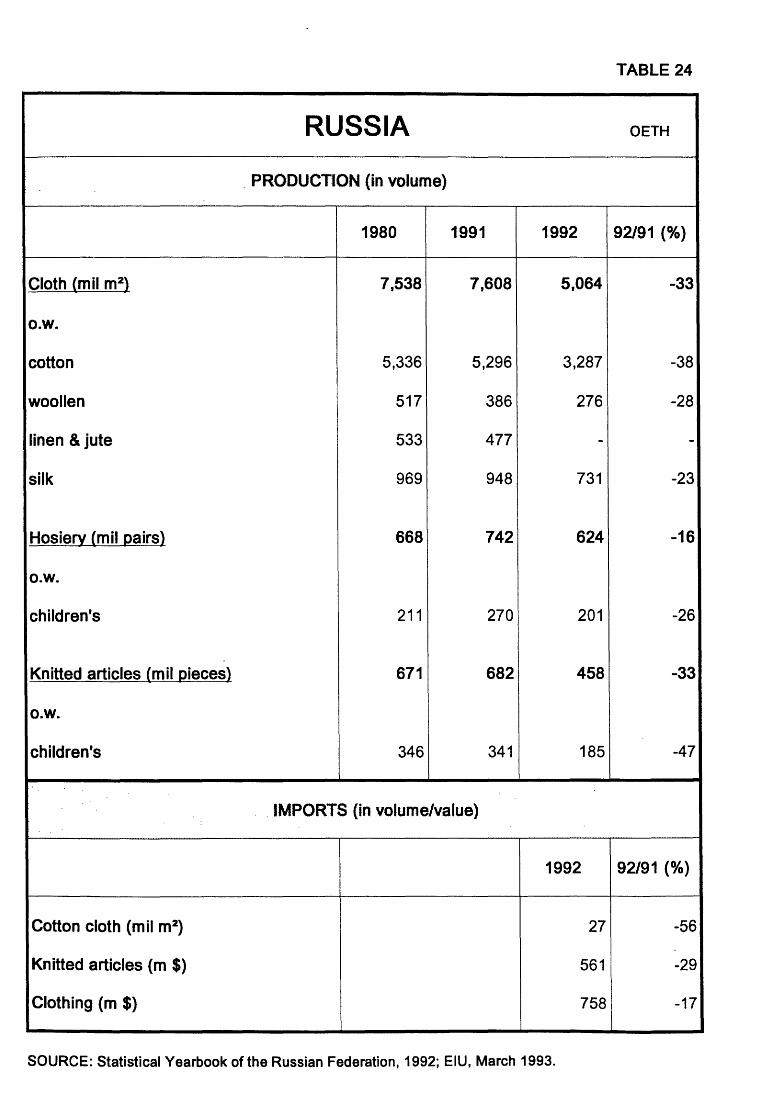
TABLE 24
RUSSIA OETH
. PRODUCTION (in volume)
1980 1991 1992 92/91 (%)
Cloth (mil m2) 7,538 7,608 5,064 -33
o.w.
cotton 5,336 5,296 3,287 -38
woollen 517 386 276 -28
linen & jute 533 477 - -
silk 969 948 731 -23
Hosiery (mil pairs) 668 742 624 -16
o.w.
children's 211 270 201 -26
Knitted articles (mil pieces) 671 682 458 -33
o.w.
children's 346 341 185 -47
.. IMPORTS (in volume/value)
1992 92/91 (%)
Cotton cloth {mil m2) 27 -56
Knitted articles (m $) 561 -29
Clothing (m $) 758 -17
SOURCE: Statistical Yearbook of the Russian Federation, 1992; EIU, March 1993.

TA
BlE
25
"
Rus
sia:
Pro
duct
ion
indi
ces
(198
6-19
91)
OE
TH
19
85::i
100
(vol
ume)
1986
19
87
1988
19
89
1990
19
91
91/9
0
lig
ht
Indu
stry
10
1.0
102.
0 10
6.0
108.
0 10
8.0
108.
0 99
.6
Tex
tiles
10
1.0
102.
0 10
6.0
108.
0 10
7.0
103.
0 96
.4
Clo
thin
g 10
0.8
100.
5 10
3.0
106.
0 10
9.0
122.
0 11
2.0
SO
UR
CE
: S
tatis
tical
Ye
arb
oo
k o
f the
Rus
sian
Fed
erat
ion,
199
2
Ru
ssia
: P
rod
ucti
on
o
f T
exti
les
& F
oo
twe
ar
-1
9 9
2
(In
dic
es:
19
90
=1
00
)
1 0
0
95
9
1 9
1 . 2
8 8
.9
8 9
.9
90
85
80
75
7
2 .9
70
1 2
.9 1
1
.9 2
2
.9 2
3
.9 2
4
.9 2
5
.9 2
6
.9 2
7
.9 2
8
.9 2
9
.9 2
S
OU
RC
E:
Ru
ssia
n
Eco
no
mic
T
ren
ds
19
.92
, vo
l.1
n
• 3
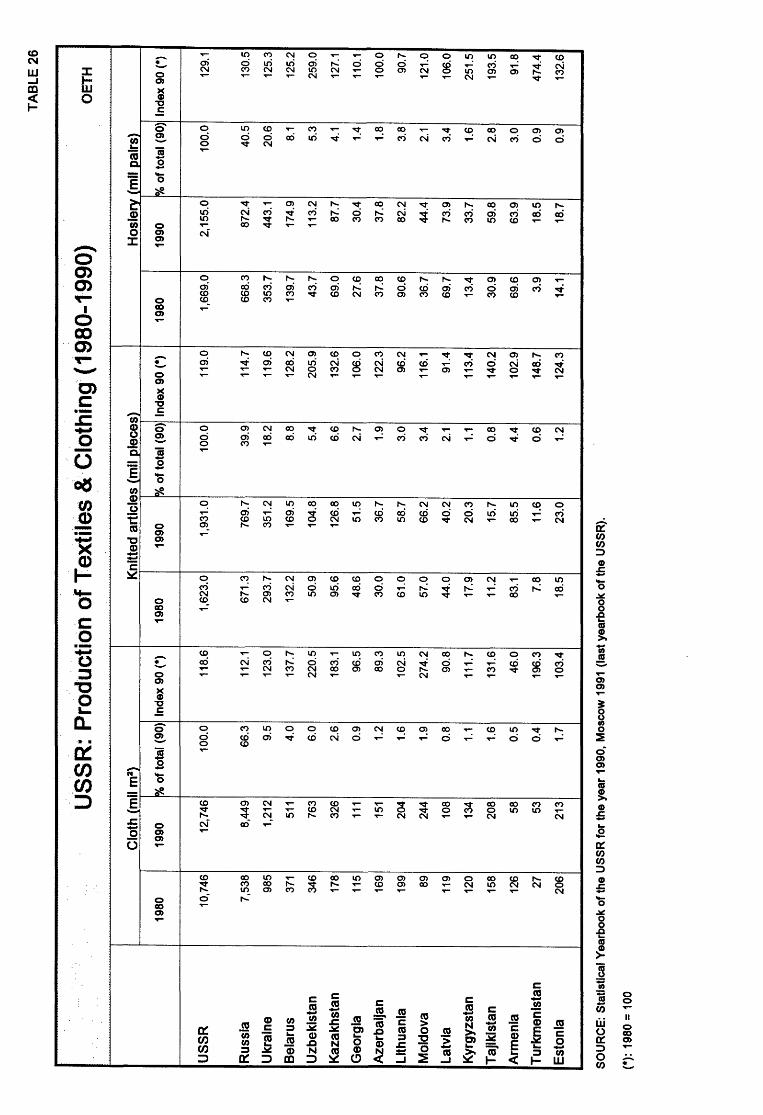
TA
BLE
26
US
SR
: P
rod
uct
ion
of
Tex
tile
s &·
·Clo
thin
g·=
(198
0-1'
990)
O
ETH
Clo
th (
mil
m2
) K
nitt
ed a
rtic
les
(mil
piec
es)
Ho
sie
ry (
mil
pairs
)
1980
19
90
~ o
f to
tal
(90)
In
dex
90 (
*)
1980
19
90
% o
f to
tal
(90)
Ind
ex 9
0 (*
) 19
80
1990
%
of
tota
l (9
0)
Inde
x 90
(*)
US
SR
10
,746
12
,746
10
0.0
118.
6 1,
623.
0 1,
931.
0 10
0.0
119.
0 1,
669.
0 2,
155.
0 10
0.0
129.
1
Rus
sia
7,53
8 8,
449
66.3
11
2.1
671.
3 76
9.7
39.9
11
4.7
668.
3 87
2.4
40.5
13
0.5
Ukr
aine
98
5 1,
212
9.5
123.
0 29
3.7
351.
2 18
.2
119.
6 35
3.7
443.
1 20
.6
125.
3
Bel
arus
37
1 51
1 4.
0 13
7.7
132.
2 16
9.5
8.8
128.
2 13
9.7
174.
9 8.
1 12
5.2
Uzb
ekis
tan
346
763
6.0
220.
5 50
.9
104.
8 5.
4 20
5.9
43.7
11
3.2
5.3
259.
0
Kaz
akhs
tan
178
326
2.6
183.
1 95
.6
126.
8 6.
6 13
2.6
69.0
87
.7
4.1
127.
1
Geo
rgia
11
5 11
1 0.
9 96
.5
48.6
51
.5
2.7
106.
0 27
.6
30.4
1.
4 11
0.1
Aze
rbai
jan
169
151
1.2
89.3
30
.0
36.7
1.
9 12
2.3
37.8
37
.8
1.8
100.
0
Lith
uani
a 19
9 20
4 1.
6 10
2.5
61.0
58
.7
3.0
96.2
90
.6
82.2
3.
8 90
.7
Mol
dova
89
24
4 1.
9 27
4.2
57.0
66
.2
3.4
116.
1 36
.7
44.4
2.
1 12
1.0
Latv
ia
119
108
0.8
90.8
44
.0
40.2
2.
1 91
.4
69.7
73
.9
3.4
106.
0
Kyr
gyzs
tan
120
134
1.1
111.
7 17
.9
20.3
1.
1 11
3.4
13.4
33
.7
1.6
251.
5
Taj
ikis
tan
158
208
1.6
131.
6 11
.2
15.7
0.
8 14
0.2
30.9
59
.8
2.8
193.
5
Arm
enia
12
6 58
0.
5 46
.0
83.1
85
.5
4.4
102.
9 69
.6
63.9
3.
0 91
.8
Tur
kmen
ista
n 27
53
0.
4 19
6.3
7.8
11.6
0.
6 14
8.7
3.9
18.5
0.
9 47
4.4
Est
onia
20
6 21
3 1.
7 10
3.4
18.5
23
.0
1.2
124.
3 14
.1
18.7
0.
9 13
2.6
SO
UR
CE
: S
tati
stic
al Y
earb
ook
of th
e U
SS
R fo
r th
e ye
ar 1
990,
Mos
cow
199
1 (l
ast
year
book
of
the
USS
R).
(*):
198
0 =
100

10. USERS' NOTES
1 . data not available
2. All references to NACE refer to NACE 1970.
3. BRANCH DEFINITIONS
NACE 1 NACE 2
NACE 3
NACE 4 NACE 26 NACE 43
NACE 431 NACE 432 NACE 433 NACE 434 NACE 435 NACE 436 NACE 437 NACE 438 NACE 439 NACE 453 NACE 454 NACE 455 NACE 456 CODE 459
Manufacturing industry = NACE 1,2,3 and 4 (except NACE (11 ),(120.1 ),(120.3),(13),(151 ),(16),(21) and (23))
Energy and water Extraction and processing of non-energy producing minerals and derived products; chemical industry Metal manufacture; mechanical, electrical and instrument engineering Other manufacturing industries Man-made fibres industry Textile industry = NACE 431, 432, 433,434, 435, 436, 437, 438, 439 Wool industry Cotton industry Silk industry Flax, hemp and ramie Jute industry Knitting industry Textile finishing Carpets, linoleum and flow coverings Miscellaneous textile industries Ready-made clothing Bespoke tailoring Household textiles Furs and fur goods Clothing industry = NACE 453 + 454 + 456
NACE 645 + 646 - Retail sales - Clothing, footwear and leather goods
4. METHODOLOGICAL NOTES
Where figures for individual countries are not available, the EC totals have been adjusted so as to be consistent from year to year
Value of exports and imports for EC total, is extra- EC trade only; for each member state both extra- and intra- EC trade are included.
Estimates have been prepared for the OETH by Eurostat, and are published on the responsibility of the OETH. ALL ESTIMATES ARE IN BOLD.
5. SOURCES
For the economic background, the following sources were used :
1. National Institute Economic Review (NIER), N °1/93, London, pp 27-54
2. Rapport Economique Annuel pour 1992, EC, DG II, March 1993, pp 1-43
3. Annual Economic Review 1992, EBRD, London, pp 31-38
60
The OETH (L'Observatoire Europ~en du Textile et de I'Habillement) was founded in 1991 . It is an independent non-profit making organisation, incorporated under Belgian law (ASBL). The OETH's aim is to increase objective knowledge of the economic conditions of the textile and clothing sectors, especially of EC countries. It conducts research by its own staff and in collaboration with DG Ill of the European Commission, Eurostat and its Working Groups.
The OETH is entirely financed by the European Commission.
Members of the Council of Administration :
President Vice-President Treasurer Secretary Commissioner
Mr Jean-Louis Juvet Mr Hans Erik Diekmann Mr Camille Blum Mr Jean-Franc;ois Limantour Professor L~o Sleuwaegen
The European Commission has the status of privileged observer at the Council, and is represented by DG Ill and Eurostat.
Director General
OETH PUBLICATIONS
OETH QUARTERLY BULLETIN
N ° 0, Volume I N° 1, Volume I N° 2, Volume I N° 1, Volume II
OETH MONTHLY REPORT
September 1 992 October 1992 November 1992 December 1992 January 1 993 February 1993 March 1993
OETH STUDIES
Ms Mich~le Ledic
March 1992 July 1992 October 1 9 9 2 January 1993
The EC Textile and Clothing Industry 1990/1991 - A Factual Report - . (English, French, German) - June 1992
The EC Textile and Clothing Industry 1991 /1992 - A Factual Report -(English, French, German) - April 1 993
