the earth observer. july - august 2014. volume 25, … the earth observer july - august 2014 volume...
TRANSCRIPT

the
eart
h o
bse
rver
National Aeronautics and Space Administration
The Earth Observer. July - August 2014. Volume 26, Issue 4.
On July 2, 2014 at 2:56 AM Pacific Time a Delta-II rocket lit up the night sky at Vandenberg Air Force Base in California, propelling the Orbiting Carbon Observatory-2 (OCO-2) into orbit—the second of five planned Earth Science launches during 2014. Approximately 56 minutes after the launch, the observatory separated from the rocket’s second stage into an initial 429-mi (690-km) orbit.
1
Once in orbit, the solar arrays successfully deployed, two-way communication with the satellite was established, and initial telemetry reports indicated that the spacecraft and its instrument were in excellent condition.
Since then, all of the observatory’s major subsystems and operating modes have been checked out and a series of orbit raising maneuvers initiated. The observatory plans to reach its final orbit, at the head of a constellation of satellites called the 438-mi (705-km) Afternoon Constellation, or A-Train, as soon as August 3. At that point, the instrument optical bench and focal plane array detectors will be cooled to their operating temperatures and a series of instrument calibration activities will be conducted, in preparation for “first light” and the beginning of science data collection as early as mid-August.
1 The first launch was the Global Precipitation Measurement (GPM) Core Observatory, which launched on February 27, 2014 from the Tanegashima Space Center in Tanegashima, Japan. To learn more about GPM read GPM Core Observatory: Advancing Precipitation Instruments and Expanding Coverage in the November-December 2013 issue of The Earth Observer [Volume 25, Issue 6, pp.4-11].
continued on page 2
Editor’s CornerSteve PlatnickEOS Senior Project Scientist
On the foggy morning of July 2, 2014, a Delta II rocket carrying NASA’s Orbiting Carbon Observatory-2 (OCO-2) roared off the launch pad at Vandenberg Air Force Base in California. Image credit: NASA www.nasa.gov
The Earth Observer July - August 2014 Volume 26, Issue 402ed
itor's
cor
ner
The OCO-2 mission is expected to produce the most detailed picture to date of atmospheric carbon dioxide (CO2). Data from OCO-2 will help scientists gain a bet-ter understanding of our planet’s regional carbon sources and sinks, how they are distributed around the globe, and how they change over time. To learn much more about the OCO-2 mission, please turn to page 4 of this issue.
On a related note, this year marks the tenth anniver-sary of the Total Carbon Column Observing Network (TCCON), a ground-based network of instruments providing measurements that complement those being obtained by OCO-2 (and other missions) to help bet-ter understand the sources and sinks of CO2 and meth-ane (CH4). From humble beginnings in a trailer in Wisconsin a decade ago, TCCON has grown into a net-work of about 20 stations scattered around the world. While originally developed in anticipation of the launch of the first OCO, which failed to reach orbit in 2009, the TCCON network has established its merit apart from any single mission. Its measurements have been used to improve the algorithms used to process satel-lite observations from ESA’s SCIAMACHY mission and JAXA’s GOSAT mission. TCCON data were also used to calibrate the OCO-2 flight instrument, and will now be used to validate measurements obtained by OCO-2. To learn more about TCCON and its many applica-tions, we invite you to turn to page 13 of this issue.
Meanwhile, two of NASA’s ongoing missions celebrated significant milestones. July 15, 2014 marked the tenth anniversary of the launch of Aura. Originally known as EOS-CHEM, Aura is the third of three flagship platforms for NASA’s Earth Observing System (Terra
In This IssueEditor’s Corner Front Cover 2014 CLARREO Science Definition
Team Meeting Summary 36Feature Articles
In the NewsOrbiting Carbon Observatory-2:
Observing CO2 from Space 4 NASA Launches Earth Science Challenges with OpenNEX Cloud Data 39
Integrating Carbon from the Ground Up: TCCON Turns Ten 13 New NASA Images Highlight U.S. Air
Quality Improvement 40In Memoriam
QuikSCAT’s Eye on Ocean Winds Lives Lola Olsen’s Legacy 12 on with ISS-RapidScat 42
Meeting Summaries Regular FeaturesASTER Science Team Meeting 18 NASA Earth Science in the News 44AIRS Science Team Meeting 22 NASA Science Mission Directorate – Science CERES Science Team Meeting 26 Education and Public Outreach Update 46
NASA LCLUC Spring 2014 Science Calendars 47Science Team Meeting 30 Reminder: To view newsletter images in color, visit
eospso.nasa.gov/earth-observer-archive.
and Aqua being the others). As its name implies, Aura focuses on monitoring the Earth’s atmosphere and, over the past decade, has provided invaluable data on sub-jects such as the ozone layer, air quality, and greenhouse gases associated with climate change.
A celebration was held on July 15 at NASA’s Goddard Space Flight Center (GSFC) to mark the occasion. The event featured three guest speakers: Rich Stolarski [Johns Hopkins University]; Daniel Jacob [Harvard University]; and Andrew Dessler [Texas A&M University]. It also included brief remarks from Anne Douglass [GSFC—Aura Project Scientist], Peg Luce [NASA HQ—Deputy Division Director for Earth Science], and Ernest Hilsenrath [Former Aura Deputy Project Scientist and former NASA HQ Program Scientist for Aura]. The three invited presentations each highlighted one of Aura’s science foci. Stolarski described changes in the stratospheric ozone layer as ozone-depleting sub-stances decrease; Jacob focused on the processes that control tropospheric air quality; and Dessler discussed connections between atmospheric composition and cli-mate. Following the presentations, a reception took place at the GSFC Visitor’s Center with opportunities for follow-up discussion with the speakers.
The NASA Scientific Visualization Studio has devel-oped a video called 10 Years of Aura Legacy, in which Aura Deputy Project Scientist, Bryan Duncan, and Paul Newman [both at GSFC] describe the remarkable changes that the Aura satellite has witnessed in its first ten years of Earth observations. It can be viewed and downloaded from svs.gsfc.nasa.gov/goto?11607.

The Earth Observer July - August 2014 Volume 26, Issue 4 03
edito
r's c
orne
rAdditional events are planned throughout the remain-der of 2014 to mark Aura’s tenth anniversary. The Aura Science Team meeting will be held September 15-18 in College Park, MD and will include a celebration ban-quet on September 17 from 5-8 PM at Adelphi Mill. To learn more and to register, please visit acdb-ext.gsfc.nasa.gov/People/Witte. The meeting agenda will be posted at this URL by early August. In addition, a Special Session focusing on Ten Years of Aura Observations has been approved to take place at the annual American Geophysical Union Fall Meeting. The Earth Observer will report more on these events in subsequent issues, including an in depth feature article reviewing the sci-ence accomplishments of Aura’s first decade.
On June 19, 2014, the QuikSCAT mission celebrated the fifteenth anniversary of its launch. The mission was so-named because it had to be developed quickly, in the aftermath of the unexpected failure of the Japanese ADEOS or “Midori” satellite in 1997, which had the NSCAT instrument onboard . Like NSCAT, the SeaWinds instrument onboard Q
2
uikSCAT was designed to measure ocean-surface wind speed and direction. NASA built two copies of the SeaWinds instrument in less than two years (very “quick” for satellite mis-sion development) and launched one of the instruments onboard QuikSCAT in 1999, with a three-year mission planned. Suffice to say, the mission well exceeded that expectation, as SeaWinds was fully operational until 2009. At that time, the lubricant that coats the anten-na’s bearings, and allowed the antenna to rotate, dried up. Since then, SeaWinds has only been able to observe Earth’s surface directly below the instrument. Even with this limitation, the QuikSCAT mission has continued and observations from SeaWinds have been used to help calibrate newer scatterometry missions—e.g., ASCAT (EUMETSAT/ESA) and O-SCAT (ISRO).
If all goes as planned, data from QuikSCAT will be used to calibrate one more instrument before it is decommissioned. In September 2014 the agency plans to launch the International Space Station Rapid Scatterometer (ISS-RapidScat)—the third of five planned Earth Science launches in 2014. Data from ISS-RapidScat will continue the data record of ocean-surface wind speed measurements. Like its predecessor, ISS-RapidScat was assembled quickly, using parts left-over from the development of QuikSCAT.
To learn more about the history and development of QuikSCAT and plans for ISS-RapidScat, turn to the news story on page 42 of this issue. The Earth Observer
2 QuikSCAT was developed during an era where NASA placed an emphasis on developing “faster, better, cheaper” missions. While that era has passed, QuikSCAT is one of the success sto-ries that emerged from that time and the lessons learned have been applied to development of other missions, such as ISS-RapidScat.
also plans a more in depth introduction to ISS-RapidScat in our September–October 2014 issue.
In previous issues of The Earth Observer, we have reported on the successful launch and commission-ing of the GPM mission. The GPM Core Observatory continues to operate well, and most of the GPM Data Products are expected to be available to the public by September 2, 2014. I am happy to report that George Huffman [GSFC] has been chosen to serve as GPM Deputy Project Scientist and Walt Petersen [NASA’s Wallops Flight Facility] has been chosen to serve as GPM Deputy Project Scientist for Ground Validation. They join Gail Skofronick-Jackson [GSFC—GPM Project Scientist] and Erich Stocker [GSFC—GPM Deputy Project Scientist for Data) on the GPM team.
Finally, the Earth science community is saddened by the loss of Lola Olsen, long-time Project Manager for the NASA Global Change Master Directory (GCMD), who passed away on April 19, 2014. Lola deserves credit for helping to improve the visibility of NASA’s Earth science data—and EOS data in particular—by making sure these data were promoted throughout U.S. federal agencies and the international community. Today, the GCMD—which has been operational for 20 years—is one of the largest public collection-level metadata inventories in the world, used by more than 500,000 unique users, amassing over 130 million hits yearly. To learn more about the legacy of Olsen’s life and career, turn to page 12.
Acronyms Not Defined in Editorial and Article Titles (in alphabetical order)
ADEOS Advanced Earth Observing SatelliteAIRS Atmospheric Infrared SounderASCAT Advanced ScatterometerASTER Advanced Spaceborne Thermal Emission and Reflection RadiometerCERES Clouds and the Earth’s Radiant Energy SystemCLARREO Climate Absolute Radiance and Refractivity ObservatoryEOS Earth Observing SystemESA European Space AgencyEUMETSAT European Organization for the Exploitation of Meteorological SatellitesGOSAT Greenhouse gases Observing SATellite GPM Global Precipitation MeasurementISRO Indian Space Research Organization Rapid ScatterometerJAXA Japan Aerospace Exploration Agency
LCLUC Land-Cover/Land-Use ChangeNSCAT NASA ScatterometerO-SCAT Scatterometer (SCAT) on Oceansat-2OpenNEX Open NASA Earth Exchange QuikSCAT Quick ScatterometerSCIAMACHY SCanning Imaging Absorption spectroMeter for Atmospheric CHartographY

The Earth Observer July - August 2014 Volume 26, Issue 404fe
atur
e ar
ticle
s Orbiting Carbon Observatory-2: Observing CO2 from Space Heather Hanson, NASA’s Goddard Space Flight Center/Global Science & Technology, Inc., [email protected] Yuen, NASA/Jet Propulsion Laboratory, [email protected] David Crisp, NASA/Jet Propulsion Laboratory, [email protected]
The Orbiting Carbon Observatory-2 Mission
On July 2, 2014, NASA successfully launched the second Orbiting Carbon Observatory (OCO-2) spacecraft from Vandenberg Air Force Base in California. With this launch, NASA now has an important new tool for studying and understanding the fundamental processes that control the accumulation of carbon dioxide (CO2) in the atmosphere, now and into the future. OCO-2 is not the first satellite designed to measure atmospheric CO2, but it is the first to provide the precision, resolution, and coverage necessary to observe regional carbon sources and sinks.
Data from OCO-2 will provide scientists insight into the location of natural and anthropogenic processes involved in CO2 absorption and emission. A better under-standing of these processes will allow decision makers to more effectively manage our planet’s natural resources and design and implement strategies that minimize human impact on the climbing atmospheric CO2 rate.
To place the OCO-2 mission in context, we will first provide some background on CO2 and its place in the Earth system. Then we will provide details of the mission, instrumentation, spacecraft, and planned data acquisition. Finally, we will discuss how the data may be used for the betterment of society.
Sources of Carbon Dioxide in the Earth System
Life as we know it would not exist without carbon. All living and once-living things (i.e., biomass) are based on carbon, the fourth most abundant element in our universe. Carbon, in many gaseous forms—e.g., CO2, carbon monoxide (CO), and methane (CH4)—can be released into the atmosphere or absorbed from the atmo-sphere by processes at the surface. The continual exchanges of carbon between the
atmosphere, oceans, and terrestrial ecosystems define Earth’s global carbon cycle. Carbon moves more quickly through some parts of the carbon cycle than others. For example, respiration (i.e., the conversion of carbon-containing molecules by biological systems into energy) is a rapid process compared to the longevity of trees, carbonate rocks, or fossil fuels.
Carbon dioxide is the most abundant carbon-bearing gas in Earth’s atmosphere, and plays a special role in the carbon cycle. From an atmospheric perspective, sources emit or release carbon—primarily as CO2—into the atmosphere, while sinks remove CO2 from the atmosphere. Natural processes are affected by CO2, such that—collectively—CO2 emission and absorption
are roughly balanced over time. Since the beginning of the industrial age, however, humans have disrupted this balance with increased use of carbon-containing com-pounds to provide energy for heat, light, and to meet our transportation needs and other industrial requirements.
For example, each time humans use coal or CH4 (also known as natural gas) to generate electricity, or drive a petroleum-powered car, or cut down a forest, or intentionally ignite a forest fire to clear land for agriculture, CO2 is released into the atmosphere. Unlike natural processes, these human activities absorb little or no CO2 in return and produce rapid increases in atmospheric CO2, currently adding approximately 36 billion tons of it
On July 2, 2014, NASA successfully launched the second Orbiting Carbon Observatory (OCO-2) spacecraft from Vandenberg Air Force Base in California.

The Earth Observer July - August 2014 Volume 26, Issue 4 05
feat
ure
artic
leseach year. Fossil fuel combustion is the largest and most rapidly growing source of CO2
emission into the atmosphere, with global growth rates of 2.2% per year.
Since the turn of the century, the largest increases have occurred in the developing world, which is now responsible for 57% of all CO2 emissions. Changes in land use (e.g., clearing forests, which while growing act as repositories or sinks for carbon) are the second largest source—although this contribution is decreasing. In many instances, forests and other vegetated land areas previously harvested for wood or to grow crops will experience natural (or intentional) regrowth, called reforestation. This allows an areacleared for wood or crops multiple decades ago to act as a carbon sink again, removing CO2 from the atmosphere. However, not all such carbon sinks are replenished, and large-scale fluctuations in these reservoirs affect the global carbon cycle, ultimately impacting Earth’s climate system in ways that will be summarized later.
Because CO2 reacts very slowly with other atmospheric gases and energy sources like solar ultraviolet radiation, most of the CO2 emitted today will remain in the atmosphere for several hundred years. As this long-lived gas mixes in Earth’s atmosphere and is transported around the globe and throughout the carbon cycle, it will continue to impact our planet. Scientists need to understand the processes that are controlling the buildup of CO2 in Earth’s atmosphere today so they can predict how fast CO2 will accumulate in the future.
Where is the Carbon Dioxide Going?
To monitor the impact of CO2 emissions on the atmosphere, scientists rely on more than 150 ground-based stations around the world. These measurements show that CO2 has increased by more than 40%, from approxi-mately 280 parts per million (ppm) to about 400 ppm, since the beginning of the industrial age. In other words, 400 out of every one million air molecules is now a CO2 molecule. Half of this growth has occurred since 1980, and a quarter has occurred since 2001. The current CO2 abundance is now increasing by more than 2 parts per million (0.5%) each year.
Interestingly, however, this rapid buildup of CO2 accounts for less than half of the 36 billion tons of CO2 emitted into the atmo-sphere each year from fossil fuel use and other human activities. Processes at the surfaceare apparently absorbing the remainder. Measurements of the increasing acidity of seawater indicate that at least one quarter of the CO2 emitted by human activities is being absorbed by the ocean. The remaining quarter is presumably being absorbed by the land biosphere, but the identity, location, and processes controlling this sink are currently unknown. Scientists refer to this mystery as the “missing-carbon sink.”
Despite decades of research that have steadily increased our understanding of the global carbon cycle, scientists still face tremendous challenges as they try to under-stand the processes controlling the increased rate of CO2 buildup in the atmosphere. For example, characterizing intense localized sources of CO2 associated with fossil fuel combustion is much easier than distinguishing and quantifying natural sources and sinks such as CO2 emitted from oceans, deforestation, and biomass burning. This is due in part to large gaps between ground-based instrument sites and thus limited availability of precise measurements over large portions of Earth’s surface.
Scientists need to understand the pro-cesses that are con-trolling the buildup of CO2 in Earth’s atmosphere today so they can predict how fast CO2 will accu-mulate in the future.
Although natural and anthro-pogenic (i.e., human-generated) sources and sinks can be found almost anywhere in the world, human activities are “tipping the scale,” causing the sources of carbon to “outweigh” the sinks. Such activities are con-tributing to a rise in atmo-spheric CO2, which impacts Earth’s climate system. Note that this diagram is simply indicative, and does not include all known carbon sources and sinks. Image credit: NASA

The Earth Observer July - August 2014 Volume 26, Issue 406fe
atur
e ar
ticle
s
Satellite-Based CO2 Observations
Unlike ground-based instruments, space-based sat-ellite observations can provide the continuous, high spatial resolution, global observations of CO2 that are needed to help answer the question of where the carbon is going.
It is to further refine our understanding of where CO2 in the Earth system is going that NASA decided to fly a second OCO mission—see The First Orbiting Carbon Observatory and a Long-Standing Partnership on page 8 for the fate of the first mission. The recently launched satellite will collect a million measurements over the sunlit hemisphere each day. While fewer than 20% of these measurements are expected to be sufficiently cloud-free to yield precise estimates of CO2, OCO-2 will still yield over a million useful measurements each week. These data will help scientists understand where CO2 is being emitted and removed from the atmosphere and how much of it is from natural processes and human activities, subsequently allowing them to make realistic projections of how Earth’s climate might respond to these changes.
Approximately half of the CO2 emissions from human activities stay in the atmosphere, while oceans and land sinks absorb the rest. Data from OCO-2 will help scientists better understand these sinks and their locations. Note that while there is substantial year-to-year variability, these per-centages reflect the long-term averages. Image credit: NASA
Carbon sinks found on land absorb approximately 25% of CO2 emissions from human activities. However, scientists do not know the location of most of the land sinks. If we imagine the carbon cycle is a 100-piece jigsaw puzzle, scientists know that the 25 puzzle pieces that rep-resent the location of land sinks exist, but they do not understand where they fit into the puzzle. Data from OCO-2 will help scien-tists better understand this so-called “missing-carbon sink,” allowing them to piece together the puzzle. Image credit: NASA

The Earth Observer July - August 2014 Volume 26, Issue 4 07
feat
ure
artic
les
As of this writing, OCO-2 is scheduled to join the Afternoon Constellation of Earth-observing satellites, or A-Train1, in early August. The A-Train is a group of satellites operated by NASA and its international partners that closely follow one after another along the same orbital “track.” The satellites are in a polar orbit, crossing the equator northbound at about 1:30 PM local time, within seconds-to-minutes of each other. This allows near-simultaneous observations of a wide variety of parameters to aid the scientific community in advancing our knowledge of Earth-system science and applying this knowledge for the benefit of society.
Measurements from OCO-2 will also be used in conjunction with measurements from ground-based stations, aircraft, and other satellites operated by NASA and its partners—see Observing the Global Carbon Cycle and Earth’s Changing Climate on page 11. For example, OCO-2 data will be combined with measurements of water vapor and CH4—other strong greenhouse gases—from NASA’s Aqua and Aura satel-lites and the Japanese Greenhouse Gases Observation Satellite (GOSAT, nicknamed, “Ibuki,” Japanese for breath or vitality) mission, to more fully understand the contri-bution of greenhouse gases to climate change. OCO-2 data will be supplemented with measurements of other atmospheric gases—such as tropospheric ozone and nitrogen dioxide—from NASA’s Aura mission to study the relationship between CO2 and other gases associated with air pollution. By combining Earth-observation data from multiple sources, scientists can view the Earth as one interconnected system, better understand how humans are contributing to climate change, and improve computer predictions of how climate will change in the future.
The OCO-2 Instrument: Searching for Carbon Dioxide’s “Fingerprints”
When CO2 is emitted into the atmosphere from a source or absorbed from the atmosphere by a sink, the resulting CO2-rich or CO2-poor air is rapidly mixed and transported by winds. This rapid mixing can dilute the CO2 signature quickly, par-tially obscuring the sources and sinks. To account for this, the OCO-2 instrument has been optimized to rapidly collect high-precision measurements of the average CO2 concentration between the sensor and Earth’s surface. Furthermore, the instrument 1 Five satellites currently fly in the A-Train: GCOM-W1, Aqua, CALIPSO, CloudSat, and Aura. PARASOL ceased operation on December 18, 2013. For more information, visit atrain.gsfc.nasa.gov.
OCO-2 will fly at the front of the A-Train configuration. NOTE: A detailed descrip-tion of this drawing can be found at atrain.gsfc.nasa.gov. Image credit: NASA
By combining Earth-observation data from multiple sources, scien-tists can view the Earth as one interconnected system, better under-stand how humans are contributing to climate change, and improve computer predictions of how climate will change in the future.

The Earth Observer July - August 2014 Volume 26, Issue 408fe
atur
e ar
ticle
s has been designed to be most sensitive to the CO2 concentration in the lower troposphere—the atmospheric layer closest to Earth’s surface, where we live and breathe, and where variations in CO2 are greatest. Data from OCO-2 will provide scientists with unprecedented amounts of new information about CO2 emissions on regional scales.
The largest known sources and sinks of CO2 produce differences no larger than a few percent on spatial scales of 1000 km (~621 mi), and typical variations are no larger than 0.25%—1 part per million (ppm) out of the ambient 400 ppm background. To measure such small quantities accurately, the OCO-2 spacecraft deploys a single instrument that consists of three, high-resolution spectrometers.
OCO-2’s spectrometers have been designed to detect the spectral fingerprints of CO2 as well as molecular oxygen (O2) in the near-infrared part of the electromagnetic spectrum. Specifically, each spectrometer is tuned to measure the absorption in three specific ranges of wavelengths where CO2 weakly absorbs sunlight (1.61 μm), another region where it strongly absorbs sunlight (2.06 μm), and within the so-called molecular oxygen (O2) “A-band” near 0.765 μm—see Figure 1. Each of these ranges includes dozens of dark absorption lines produced by either CO2 or O2. The amount of light absorbed to generate each spectral line increases with the number of molecules along the optical path. OCO-2’s spectrometers simultaneously measure the fraction of the light absorbed to generate each of these lines with very high precision.
A number of factors can change the amount of CO2 along the atmospheric path between the sun, Earth’s surface, and the instrument, and only a few of these are associated with sources and sinks. For example, there are typically more CO2 molecules above a deep valley than over an adjacent mountain range because there is a longer path and a larger atmospheric mass over the valley. Clouds and optically thick aerosols can also introduce uncertainties in the atmospheric path, as will instrument pointing errors. All these factors have to be removed to get to the actual signature of carbon sources and sinks.
Data from OCO-2 will provide scientists with unprecedented amounts of new information about CO2 emissions on regional scales.
The First Orbiting Carbon Observatory and a Long-Standing Partnership
Launched in February 2009, NASA’s original Orbiting Carbon Observatory (OCO) spacecraft was designed to provide the most accurate atmospheric measurements of CO2 ever made from space. Data from OCO were expected to show the location of carbon sources and sinks, and help improve scientists understanding of the global carbon cycle. Sadly, the mission was lost in a launch failure when the protective payload fairing of the Taurus launch vehicle failed to separate during ascent.
Prior to launch, however, the original OCO and GOSAT science teams formed a close partnership to cross calibrate instruments and validate CO2 retrievals. GOSAT was successfully launched on January 23, 2009, and has been returning routine measurements of CO2 and CH4 since mid-2009. After the OCO launch fail-ure, the GOSAT science team reached out to NASA and invited the OCO science team to participate in GOSAT data analysis, allowing them to use data from GOSAT to test the algorithms developed for OCO data. In 2010 NASA decided to support the second OCO mission, now known as OCO-2. Collaboration between the two science teams has continued for many years and is expected to enhance data retrievals from OCO-2 and GOSAT-2.
NASA’s OCO-2 satellite joins GOSAT to obtain the important scientific measurements “lost” as a result of the OCO failure. Image credit: NASA

The Earth Observer July - August 2014 Volume 26, Issue 4 09
feat
ure
artic
lesOne way to minimize the impact of these sources of uncertainty is to directly measure
the abundance of CO2 and that of the background atmosphere, and use these measure-ments to estimate the CO2 concentration along the path. If one such measurement shows a relatively high CO2 concentration and another shows a relatively low CO2 concentration, it is safe to assume that some process has enriched the first sample, indicating a source, while some process has depleted the other, indicating a sink. To estimate the CO2 concentration along the optical path, the OCO-2 spectrometers will collect coincident measurements of CO2 and O2. These data will be combined to estimate the column-averaged CO2 dry air mole fraction, XCO2
. O2 is an ideal gas for estimating the total atmospheric dry air mass along the optical path because its concentration is constant, well known, and uniform throughout the atmosphere. Scientists then analyze this information to determine the number of molecules along the path between the top of the atmosphere and the surface.
Measurement Details
The instrument records an image of the spectrum produced by each spectrometer three times every second as the satellite flies over the surface at more than four miles per second. Each image is divided into eight discrete “footprints” along a ~10-km (6-mi) wide field-of-view, and recorded for later transmission to the ground, yielding 24 “soundings” per second. At this rate, the instrument gathers between 67,000 and 71,000 individual measurements over a narrow ground track each orbit. The surface footprint of each measurement is just under 3 km2 (~1 mi2).
The satellite orbits the Earth about 14.5 times each day in a 705-km (~438-mi), sun-synchronous, 98.2° orbit with a 98.8-minute period and a 1:30 PM equator crossing time. Every 16 days, after 233 orbits, the spacecraft returns to the same ground track. Over each 233-orbit ground track repeat cycle, it collects about 16,000,000 measurements, with orbit tracks separated by just over 1.5° longitude (170 km or 105 mi) at the equator—see Figure 2. With measurement footprints of this size and density, the instrument can make an adequate number of high-quality soundings, even in regions with clouds, aerosols, and variations in topography.
Figure 2. The top map shows the locations of ground-based instrument sites [dots]. The bot-tom map shows the expected sampling for a single 16-day ground track repeat cycle, where OCO-2 is collecting glint observations. Scientists will use aircraft and ground-based measurements of CO2 to validate OCO-2’s data. For more details and to see the maps in color, please refer to the online version at eospso.gsfc.nasa.gov/earth-observer-archive. Image credit: NASA
Figure 1. OCO-2’s spectrome-ters are tuned to measure the O2 A-band [top], weak CO2 band [middle], and strong CO2 band [bottom]. Image credit: NASA

The Earth Observer July - August 2014 Volume 26, Issue 410fe
atur
e ar
ticle
s Scientists will infer the location of carbon sources and sinks by analyzing OCO-2’s data using computer models. The results from the models will allow them to piece together the missing-carbon puzzle and better understand the global carbon cycle.
Launch Vehicle and Spacecraft
On July 16, 2012, NASA selected the United Launch Alliance (ULA) Delta II 7320-10C launch vehicle to carry OCO-2 into space. The Delta II is part of a launch vehicle family that first entered service in 1989 and has recorded well over 140 suc-cessful launches to date2. The satellite is based on the LEOStar-2 multimission spacecraft bus—built by Orbital Sciences Corporation—which provides the on-orbit service platform for OCO-2’s three-channel grating spectrometer. The spacecraft bus is made primarily of aluminum honeycomb panels that are both lightweight and strong, assembled to form a hexagonal structure approximately 1 m (3.3 ft) in diameter and 2 m (6.6 ft) in height. The structure contains most of the spacecraft bus support components and much of the instrument itself. Powering the spacecraft and measuring approximately 3 m (10 ft) in length, solar array wings are attached to both sides of the spacecraft by movable motors. The solar array panels provide elec-trical power when the observatory is operating in sunlight and a rechargeable battery provides power when the observatory is operating in the umbra—i.e., the shadow of the Earth. The mass of the entire observatory, including the spacecraft bus and instru-ment, is approximately 450 kg (990 lbs).
A star tracker, inertial measurement unit, and global positioning system (GPS) provide attitude determination (i.e., to assist the observatory in determining its orientation with respect to inertial space) and a set of momentum wheels allows the instrument telescope to be pointed in the proper direction. For example, the momentum wheels allow the telescope to look “directly downwards” in Nadir Mode and near the sun’s reflection on the ocean in Glint Mode.
An onboard computer, which was designed to operate in the harsh space radiation environment, controls both the spacecraft bus and the instrument. Special flight software running on the computer allows the spacecraft to respond to commands stored in memory as well as those issued by ground controllers. The onboard tele-communications system provides a link to the ground through a set of electronics and antennas that operate in the S-band—a set of frequencies that include those typically used for wireless connections in our homes and businesses. Science data are transmitted from the observatory to the ground via the X-band antenna. The higher frequency X-band region allows the spacecraft to accommodate the quantity of data the instrument is expected to acquire.
Serving Society and Making a Difference
In May 2013 anthropogenic emissions pushed the monthly average CO2 concentra-tions above 400 ppm —a level that has not been reached during the past 800,000 years. After several months of reduced values, in March 2014 CO2 concentrations again reached 400 ppm, and remained there as the monthly average for April. These ever-increasing levels are raising concerns about greenhouse-gas-induced climate change. Data from OCO-2 will help scientists better identify how human activities, as well as the natural processes on Earth are influencing rising concentrations of atmo-spheric CO2 and the global carbon cycle.
With new information comes new possibilities. OCO-2’s measurements will improve scientists’ ability to track changes in fossil fuel emissions in both hemispheres, and compare how CO2 interacts with the land and ocean at different latitudes. Scientists also will discover new ways to study how plant and crop growth, deforestation, and wildfires influence the exchange of CO2 between the atmosphere and tropical 2 The Delta II has also been selected to place several other Earth-orbiting satellites into orbit, including the Soil Moisture Active Passive (SMAP) mission and second Ice, Clouds, and land Elevation Satellite (ICESat-2) mission, scheduled for launch in late 2014 and 2017, respectively.
With new information comes new possibilities. OCO-2’s measurements will improve scientists’ ability to track changes in fossil fuel emissions in both hemispheres, and compare how CO2 interacts with the land and ocean at different latitudes.
The Earth Observer July - August 2014 Volume 26, Issue 4 11
feat
ure
artic
lesObserving the Global Carbon Cycle and Earth’s Changing Climate
Since the 1970s NASA has played a continuous and critical role in studying the global carbon cycle and Earth’s climate. Over the years, NASA has paved the way for global Earth observation through the use of sat-ellite remote sensing technology, building a fleet of Earth-observing satellites that have helped the agency and the world meet specific scientific objectives for studying Earth’s land, oceans, and atmosphere, and interac-tions between them.
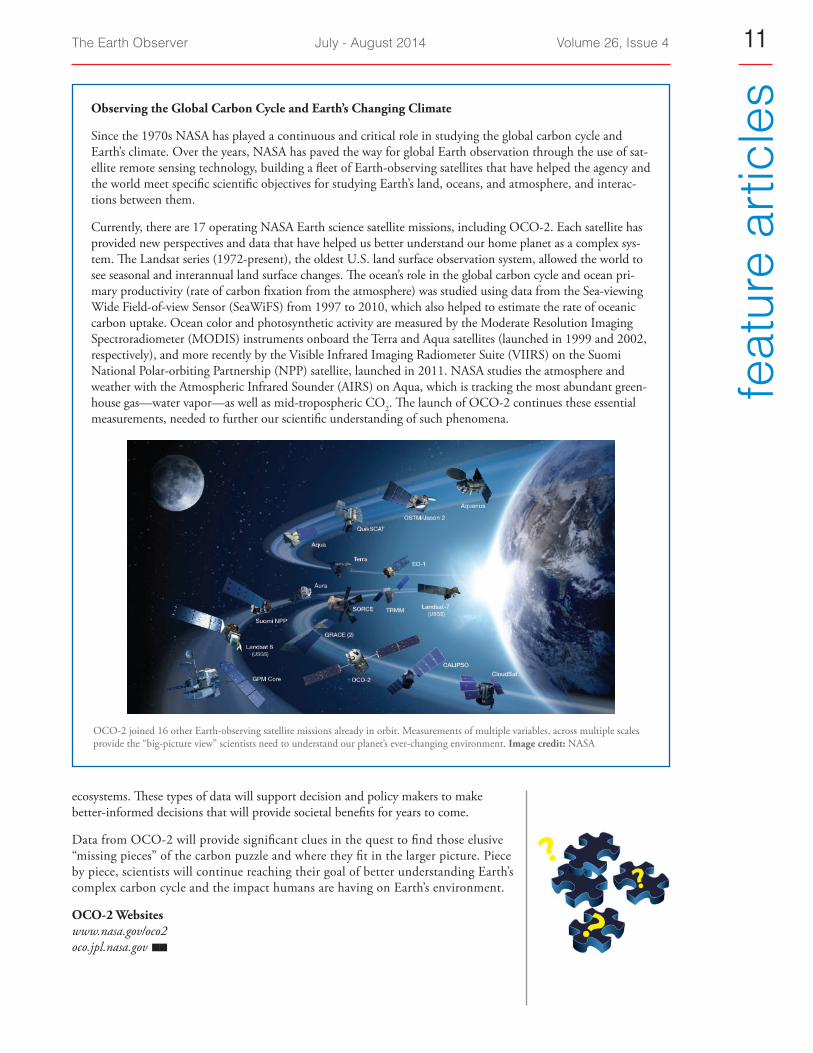
Currently, there are 17 operating NASA Earth science satellite missions, including OCO-2. Each satellite has provided new perspectives and data that have helped us better understand our home planet as a complex sys-tem. The Landsat series (1972-present), the oldest U.S. land surface observation system, allowed the world to see seasonal and interannual land surface changes. The ocean’s role in the global carbon cycle and ocean pri-mary productivity (rate of carbon fixation from the atmosphere) was studied using data from the Sea-viewing Wide Field-of-view Sensor (SeaWiFS) from 1997 to 2010, which also helped to estimate the rate of oceanic carbon uptake. Ocean color and photosynthetic activity are measured by the Moderate Resolution Imaging Spectroradiometer (MODIS) instruments onboard the Terra and Aqua satellites (launched in 1999 and 2002, respectively), and more recently by the Visible Infrared Imaging Radiometer Suite (VIIRS) on the Suomi National Polar-orbiting Partnership (NPP) satellite, launched in 2011. NASA studies the atmosphere and weather with the Atmospheric Infrared Sounder (AIRS) on Aqua, which is tracking the most abundant green-house gas—water vapor—as well as mid-tropospheric CO2. The launch of OCO-2 continues these essential measurements, needed to further our scientific understanding of such phenomena.
OCO-2 joined 16 other Earth-observing satellite missions already in orbit. Measurements of multiple variables, across multiple scales provide the “big-picture view” scientists need to understand our planet’s ever-changing environment. Image credit: NASA
ecosystems. These types of data will support decision and policy makers to make better-informed decisions that will provide societal benefits for years to come.
Data from OCO-2 will provide significant clues in the quest to find those elusive “missing pieces” of the carbon puzzle and where they fit in the larger picture. Piece by piece, scientists will continue reaching their goal of better understanding Earth’s complex carbon cycle and the impact humans are having on Earth’s environment.
OCO-2 Websites www.nasa.gov/oco2 oco.jpl.nasa.gov

The Earth Observer July - August 2014 Volume 26, Issue 412in
mem
oria
m Lola Olsen’s LegacyGene Major, NASA’s Goddard Space Flight Center, [email protected]
Tom Northcutt, NASA’s Global Change Master Directory, [email protected]
Lola Olsen, long-time Project Manager for the NASA Global Change Master Directory (GCMD1), passed away on April 19, 2014. For more than 25 years, Lola tirelessly led the drive to ensure that NASA’s Earth sci-ence data—and Earth-Observing System (EOS) data in particular—were promoted throughout U.S. federal agencies and the international community. Today, the GCMD—which has been operational for 20 years—is one of the largest public collection-level metadata inventories in the world, used by more than 500,000 unique users, amassing over 130 million hits yearly.
Before starting the GCMD, Lola was the manager of the NASA Climate Data System (NCDS) from the late 1980s to early 1990s. She then moved to the National Space Science Data Center’s NASA Master Directory (NMD). When global climate change became a top priority for the first Clinton Administration, Lola took the controls of the newly formed GCMD, which split off from the NMD but used the same soft-ware infrastructure. Always at the cutting edge of technology, she was one of the first to push for a presence on the nascent World Wide Web and transformed the GCMD from a client-based ser-vice to a web-based service, thereby reaching a far wider audi-ence than otherwise would have been the case.
With the GCMD, Lola was instrumental in leading the effort to ensure that there was one website anyone could go to find a cli-mate dataset—and in particular, a NASA EOS dataset. In those early days, Lola’s leadership laid the groundwork for GCMD to play a significant role in the global change area by highlighting NASA and EOS data to federal agencies, including the National Oceanic and Atmospheric Administration, U.S. Geological Survey, U.S. Department of Energy, U.S. Department of Defense, U.S. Department of Agriculture, and others, through participation in the Global Change Data and Information System (GCDIS), which she chaired in 1996-1997.
Lola was also responsible for the promotion of NASA and EOS data via the GCMD to international agencies through the Committee on Earth Observation Satellites (CEOS) International Directory Network (IDN). In addition, Lola was a leader in ensuring the representation of NASA and the GCMD in the early formation of the Federation of Earth Science Information Partners (ESIP), which has since grown from 24 NASA-funded partners to over 130 active members from the government, industry, and academia.
Lola was a pioneer. She recognized the importance of having a comprehensive set of multilevel Earth science keywords to search for datasets within the GCMD, allowing users to focus on finding specific datasets. She recognized that user participation in the GCMD was vital to its success, so she encouraged the development of sophisticated, yet intuitive, metadata entry tools, such as docBuilder, for users to add their own dataset infor-mation to the GCMD. Using the GCMD framework, she established data portals that highlight data and ser-vices provided by numerous federal agencies, universities, and scientists.
Lola’s legacy, however, extends well beyond the GCMD accomplishments mentioned here. Her legacy is in the lives of the many people she touched and nurtured throughout her career. From the high school and gradu-ate student interns to new graduates hired as GCMD staff, Lola worked to support and mentor the GCMD staff, and they rewarded her by staying on with the GCMD for years and growing the project. Over the years, Lola took on several international students, making them feel welcome as valued contributors to the project. A search of the literature won’t reveal a lot of scientific papers from Lola; instead, she had her staff take the lead on most papers and presentations.
On behalf of the GCMD staff, and all of those directly influenced by Lola’s leadership and indirectly by her efforts, we extend our condolences to Lola’s family, friends, and many coworkers. She truly will be missed.
1 The GCMD database holds more than 30,000 descriptions of Earth science datasets and services covering all aspects of Earth and environmental sciences. To learn more, visit gcmd.nasa.gov.
Lola Olsen

The Earth Observer July - August 2014 Volume 26, Issue 4 13
feat
ure
artic
lesIntegrating Carbon from the Ground Up:
TCCON Turns Ten Jessica Stoller-Conrad, California Institute of Technology, [email protected]
From a Trailer in Wisconsin to a Worldwide Carbon Observing Network
In May 2004 a new approach for studying greenhouse gases in our atmosphere came from an unlikely source: a lone trailer in Park Falls, WI.
That site became the first station of the Total Carbon Column Observing Network (TCCON), a ground-based network of instruments providing measurements and data to help better understand the sources and sinks of carbon dioxide (CO2) and methane (CH4) to and from Earth’s atmosphere. Now, a decade after the first site became oper-ational, TCCON has expanded and provides important information about regional and global atmospheric levels of carbon-containing gases from many stations, world-wide—see Figure 1.
How TCCON Works: A Network and a Partnership
Each of these stations accommodates a Fourier transform spectrometer (FTS) that pro-vides precise measurements of the amount of direct sunlight absorbed by atmospheric gases. At each site, the FTS produces a spectrum of sunlight; from that spectrum, researchers determine the abundance of CO2, CH4, carbon monoxide (CO), and other gases in the atmospheric column extending from the surface of the Earth to the top of the atmosphere. In the absence of clouds, one measurement is made approxi-mately every two minutes.
Data from the individual stations provide information about regional carbon sources and carbon sinks. Furthermore, by combining the data from all the stations, research-ers can monitor carbon as it is exchanged—“circulates”—between the atmosphere, the land, and the ocean, explains atmospheric chemist Paul Wennberg [California Institute of Technology (Caltech)], who is the elected chair of TCCON.
“The network is a partnership,” says Wennberg. Although the TCCON stations are scattered around the globe and are overseen by numerous investigators, “Everyone has agreed on what instruments are used and how they are operated, and we all use common analysis software so that the measurements are comparable across the whole network”—see Table on page 14. Geoffrey Toon [NASA/Jet Propulsion Laboratory (JPL)] and Debra Wunch [Caltech], and many others involved with the network developed the end-to-end pipeline processing software.
A decade after the first site became operational, TCCON has expanded and provides important information about regional and global atmospheric levels of carbon-containing gases from many stations, worldwide.
Figure 1. TCCON has expanded rapidly over the last decade and data have been obtained from 22 locations (red dots) spread around the globe. Blue squares indicate future stations. See Table on page 14 for details on each station.
The Earth Observer July - August 2014 Volume 26, Issue 414fe
atur
e ar
ticle
s Originally, data from each of these stations were intended to help validate measure-ments obtained from NASA’s Orbiting Carbon Observatory (OCO) satellite, which failed upon launch in 2009 due to a faulty fairing separation. “OCO and TCCON [were to] provide a new type of data—a type of CO2 measure that had never been used before, called the column average mixing ratio,” Wennberg says. Measurements from TCCON provide the precise column average mixing ratio of CO2 at discrete locations around the world, and OCO would have provided a similar measurement from space; comparing the two at coincident times and locations were to provide an important evaluation of the satellite data.
Despite the loss of OCO, TCCON continued to expand in recognition of its impor-tance in carbon cycle science and for validation of other remote sensing projects. “TCCON provided the very first key observations regarding column average data, long before there were space-based estimates,” Wennberg says. “Now, there have been many studies that have used our data to better understand the carbon cycle.”
“TCCON provided the very first key observations regarding column average data, long before there were space-based estimates. Now, there have been many studies that have used our data to better understand the carbon cycle.” —Paul Wennberg
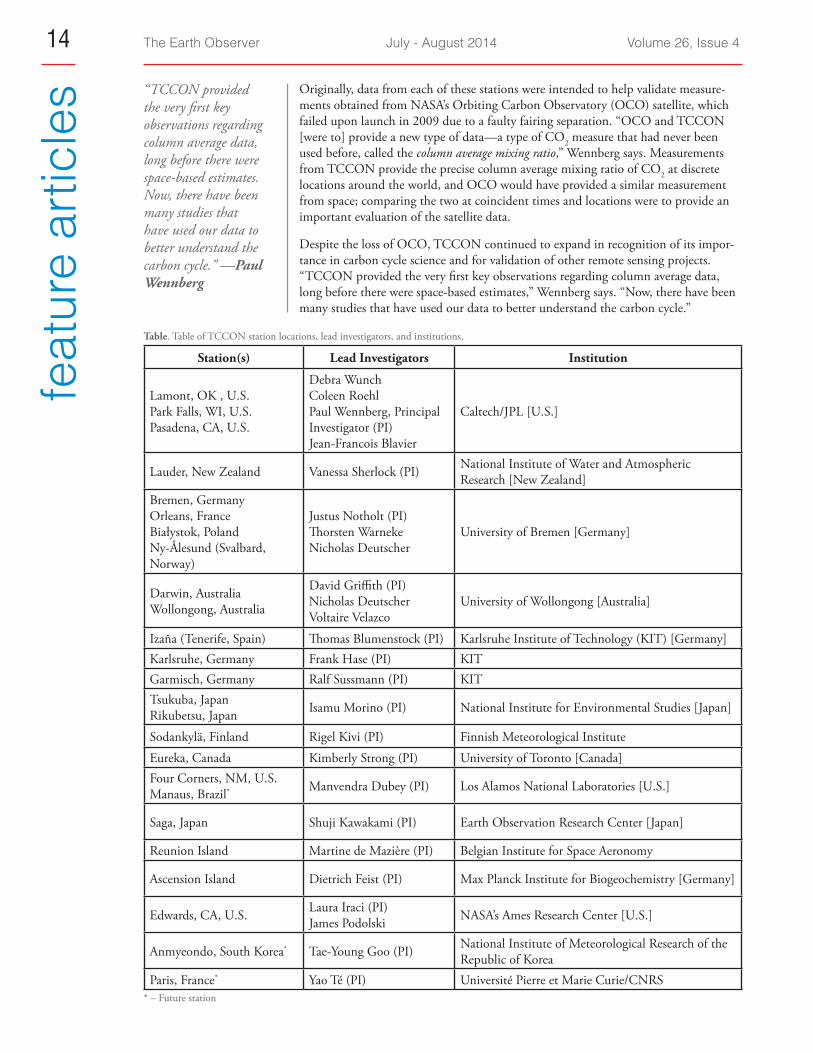
Table. Table of TCCON station locations, lead investigators, and institutions.
Station(s) Lead Investigators Institution
Lamont, OK , U.S. Park Falls, WI, U.S. Pasadena, CA, U.S.
Debra Wunch Coleen Roehl Paul Wennberg, Principal Investigator (PI) Jean-Francois Blavier
Caltech/JPL [U.S.]
Lauder, New Zealand Vanessa Sherlock (PI) National Institute of Water and Atmospheric Research [New Zealand]
Bremen, Germany Orleans, France Białystok, Poland Ny-Ålesund (Svalbard, Norway)
Justus Notholt (PI) Thorsten Warneke Nicholas Deutscher
University of Bremen [Germany]
Darwin, Australia Wollongong, Australia
David Griffith (PI) Nicholas Deutscher Voltaire Velazco
University of Wollongong [Australia]
Izaña (Tenerife, Spain) Thomas Blumenstock (PI) Karlsruhe Institute of Technology (KIT) [Germany]Karlsruhe, Germany Frank Hase (PI) KITGarmisch, Germany Ralf Sussmann (PI) KITTsukuba, Japan Rikubetsu, Japan Isamu Morino (PI) National Institute for Environmental Studies [Japan]
Sodankylä, Finland Rigel Kivi (PI) Finnish Meteorological Institute
Eureka, Canada Kimberly Strong (PI) University of Toronto [Canada]Four Corners, NM, U.S. Manaus, Brazil* Manvendra Dubey (PI) Los Alamos National Laboratories [U.S.]
Saga, Japan Shuji Kawakami (PI) Earth Observation Research Center [Japan]
Reunion Island Martine de Mazière (PI) Belgian Institute for Space Aeronomy
Ascension Island Dietrich Feist (PI) Max Planck Institute for Biogeochemistry [Germany]
Edwards, CA, U.S. Laura Iraci (PI) James Podolski NASA’s Ames Research Center [U.S.]
Anmyeondo, South Korea* Tae-Young Goo (PI) National Institute of Meteorological Research of the Republic of Korea
Paris, France* Yao Té (PI) Université Pierre et Marie Curie/CNRS * – Future station

The Earth Observer July - August 2014 Volume 26, Issue 4 15
feat
ure
artic
lesTen Years of Data: Discoveries and Contributions
Over the years, studies using data from TCCON stations have revealed new infor-mation about the sources and sinks of CO2 and CH4. These include the discovery of elevated CH4 emissions from Los Angeles, CA, and Four Corners, NM, as well as regional enhancements of CO2 from fossil fuel emissions. Furthermore, TCCON has provided key observations on how uptake of CO2 by the boreal forest—northern for-ests that span the range from Alaska to Siberia—depends on surface temperature. Morebroadly, data from TCCON are also being used to evaluate large-scale carbon models and improve global estimates of the sources and sinks of CO2 and CH4—see Figure 2. Understanding the interactions between climate and carbon dynamics is critical for predicting future levels of atmospheric CO2.
The network’s ability to collect very precise data has also proved to be very useful for validating the European Space Agency’s SCanning Imaging Absorption spectroMeter for Atmospheric CHartographY (SCIAMACHY)—which flew on Envisat, launched in 2002, and was the first instrument to yield global measurements of CO2 and CH4 from space. “The creation of TCCON filled a key missing element in the observa-tional system required to meet the challenge [of quantifying] greenhouse gases,” says John Burrows [University of Bremen—SCIAMACHY Principal Investigator].
Burrows says that the combination of the SCIAMACHY and TCCON datasets became a milestone in remote sensing, revealing important carbon sources and sinks in Europe, North America, and Siberia. The unprecedented combination of ground-based and space-based measurements helped to underscore the importance of wet-land sources of CH4 and the impact of increased CH4 from fracking and oil fields. “TCCON has pioneered a key element of the ground segment measurements required to provide the evidence base for policy making for the next 100 years,” Burrows noted.
More recently, TCCON data have been the core of the validation effort for CO2 and CH4 measurements from the Japanese Greenhouse Gases Observing Satellite (GOSAT) that was launched in January 2009. “TCCON has been and will [con-tinue to] be a key [player] in the GOSAT product validation, and together, both TCCON and GOSAT data are contributing significantly to carbon-cycle science,” says Osamu Uchino [Japanese Aerospace Exploration Agency (JAXA)—GOSAT Validation Manager].
Figure 2. [Top] Observations of CO2 from TCCON sta-tions have shown that over the past decade, the column mole fraction of CO2 (XCO2
) has increased by more than 20 parts per million (ppm). In fact, this past winter (2013-14) all sites in the Northern Hemisphere exceeded 400 ppm. [Bottom] TCCON observations indi-cate the CH4 concentrations have also increased substantially since 2006–07.
“TCCON has pioneered a key element of the ground segment measurements required to provide the evidence base for policy making for the next 100 years.” —John Burrows

The Earth Observer July - August 2014 Volume 26, Issue 416fe
atur
e ar
ticle
s
The second generation of the OCO—OCO-2—successfully launched on July 21. TCCON data will provide a con-tinuous reference to evaluate the newest NASA satellite. For more on this topic, see TCCON and OCO-2 Flight Instrument Testing on page 17 and Improving Space-Based Remote Sensing with TCCON Spectra (above).
David Crisp [JPL—OCO-2 Principal Investigator] stated that, “The observations from TCCON provided the pri-mary source of ground truth for GOSAT, allowing us to quickly identify errors, [in particular] discriminating errors contributed by the GOSAT instrument from those associated with our analysis methods. The tools developed to val-idate the GOSAT measurements are expected to play an even more important role for the OCO-2 mission.”
While orbiting Earth, OCO-2 will target a TCCON station as often as once each day. As the satellite passes over an individual TCCON station, the instrument continually changes the direction it points, which allows it to obtain thousands of observations over that site. These ongoing comparisons of data from OCO-2, GOSAT, and TCCON will result in even more reliable, higher-quality data for the scientific community, Crisp says.
Conclusion
With the launch of OCO-2, TCCON is now on-track to fulfill its initial purpose—but the network has already proven itself to be a success, and it is due in large part to the network’s inherent spirit of collaboration. “This net-work requires a level of cooperation that is unprecedented,” Wennberg says. “And getting everyone to work in such an environment has been the key to TCCON’s success.” To learn more, visit www.tccon.caltech.edu.
1 To learn much more about the OCO-2 mission, its payload, and science objectives, see the article on page 4 of this issue.
Improving Space-Based Remote Sensing with TCCON SpectraTCCON instruments use a FTS to measure the spectrum of sunlight transmitted through the atmosphere. These data, called atmospheric transmission spectra, have been invaluable for improving the remote sens-ing of trace gases. This is most commonly done using near-infrared reflectance spectra, obtained by orbit-ing spectrometers such as those found on GOSAT, SCIAMACHY, and now OCO-2. Accurately retrieving data about CO2 concentrations from these spectra requires knowledge of the absorption properties of trace gases—properties that are typically derived from laboratory measurements. The TCCON spectra provide a rigorous test of these properties (so-called spectroscopic parameters) due to their high signal-to-noise ratios and high spectral resolutions. One of the primary advantages of using TCCON spectra to validate the spectro-scopic parameters for orbiting instruments is that they reflect real atmospheric conditions that include simul-taneous absorption by all trace gases present in Earth’s atmosphere.
The OCO-2 Science Team has been developing a catalog of the spectroscopic parameters needed to accu-rately retrieve CO2 information. This effort begins with laboratory measurements of CO2 and oxygen (O2) by Mitchio Okumura [Caltech], Linda Brown [JPL], and David Long [National Institute of Standards and Technology]. The initial laboratory-derived catalog is then evaluated using TCCON spectra. Jean-Michel Hartmann [Laboratoire Interuniversitaire des Systèmes Atmosphériques (LISA), France] used TCCON spectra to improve the laboratory-based characterization of the absorption properties of CO2. Already, this study has resulted in substantial improvements in the retrievals of CO2 from GOSAT spectra. Iouli Gordon [Harvard-Smithsonian Center for Astrophysics] and coworkers used TCCON spectra to improve the char-acterization of O2 absorption in the visible and near infrared, and Charles Miller [JPL] and coworkers used TCCON spectra to discover very weak, previously unmeasured absorption features within the O2 “A-band” (0.765 μm) used by OCO-2 and GOSAT.
Spectra obtained from TCCON have also enabled substantial improvements for other remote sensing appli-cations. Christian Frankenberg [JPL] used TCCON spectra to investigate absorption by water vapor near 1.67 μm, and discovered numerous errors in the catalog of water absorption features. Using TCCON spec-tra, he improved the absorption parameters, and revisited earlier measurements of atmospheric CH4 from SCIAMACHY. This demonstrated that the earlier measurements were biased due to the poor description of the water absorption within the CH4 bands used in the retrieval. Similarly, absorption properties of HDO (an isotopologue of water) evaluated with TCCON spectra were used to retrieve HDO in the 1.56 μm region, enabling high-quality retrievals of water isotopes from GOSAT spectra.

The Earth Observer July - August 2014 Volume 26, Issue 4 17
feat
ure
artic
lesTCCON Sites Around the World
Lauder, New Zealand. Image credit: National Institute of Water and Ny Alesund, Spitsbergen (Svalbard, Norway). Image credit: Joann Schmid Atmospheric Research
Bremen, Germany. Image credit: Voltaire Velazco Pasadena, California (U.S.). Image credit: David Wakely
TCCON and OCO-2 Flight Instrument Testing During the alignment and testing of the OCO-2 flight spectrometers, a heliostat located on the roof of a build-ing at JPL (see annotated photograph below) directed sunlight into the thermal vacuum chamber and into the flight instrument located in the laboratory inside the building. Simultaneously, a TCCON instrument located in close proximity recorded high-resolution solar spectra through essentially the same atmospheric column. Randy Pollock [JPL—OCO-2 Instrument Systems Engineer] and members from the OCO-2 Calibration Team used the TCCON spectra to independently validate the calibration of the flight instrument. They compared measured OCO-2 spectra with the higher resolution TCCON spectra. These comparisons revealed errors and/or uncertainties in independent calibration of the OCO-2 spectrometers using tunable diode lasers. Iterations with test equipment, test procedures, and/or analysis techniques were then used to improve the laboratory cali-bration. Pollock commented that “…without the simultaneous collection of TCCON and OCO-2 spectra, sev-eral very small but still significant calibration errors would have gone unnoticed, leading to the XCO2
data col-lected in space being harder to calibrate and validate.”
During thermal vacuum testing, the OCO-2 flight instrument and a TCCON instrument (behind building in foreground of this photo) simultaneously recorded solar spectra. The resulting TCCON spectra were used to refine the instrument calibration as described in the text above. The heliostat directed sunlight to theinternal lab where the OCO-2 instrument was being tested. Image credit: David Crisp

The Earth Observer July - August 2014 Volume 26, Issue 418m
eetin
g su
mm
arie
s ASTER Science Team MeetingTetsushi Tachikawa, Japan Space Systems, [email protected]
The forty-forth meeting of the Advanced Spaceborne Thermal Emission and Reflection Radiometer (ASTER) Science Team Meeting (ASTM) was held at Kikai Shinko Kaikan in Tokyo, Japan, March 10-12, 20141. The meeting was well attended, with ASTER Science Team members and participants from the ASTER Instrument Team, ASTER Ground Data System (GDS) team, Earth Observing System Operations Center, and NASA Headquarters.
The meeting opened with a plenary session that included project and system updates on the status of ASTER and Terra. The proposed changes to ASTER operations in Japan after FY 2015 were presented to examine the effects on the ASTER project, especially the impact on users. Seven working group splinter ses-sions were subsequently held to deepen the discussions in each field. The meeting concluded with a closing ple-nary session, where reports and summaries from each working group were presented.
Opening Plenary Session
The session opened with remarks by H. Tsu [Japan Space Systems (J-spacesystems)—Japan ASTER Science Team Leader], M. Abrams [NASA/Jet Propulsion Lab (JPL)—U.S. ASTER Science Team Leader], and K. Muto [Director of Space Industry Office in Ministry of Economy, Trade, and Industry (METI), Japan].
In the opening remarks H. Tsu provided a brief outline of changes to ASTER operations in Japan after 2015. K. Muto assured the group that the ASTER project will continue even if operations in Japan are changed.
M. Abrams expressed expectations that the changes will bring an explosive increase in the usage of ASTER products by implementation of a free and open policy. He also suggested that Terra and ASTER operations are possible for five more years after 2017.
K. Thome [NASA’s Goddard Space Flight Center (GSFC)—Terra Project Scientist] reported on the cur-rent status of ASTER from the NASA point of view and outlined NASA’s Earth Science plan, indicating that the next NASA Senior Review for Terra will be held in early 2015. He also mentioned that a special session is planned for the 2014 American Geophysical Union (AGU) Fall
1 A summary of the forty-third meeting was provided in the September-October 2013 issue of The Earth Observer, [Volume 25, Issue 5, pp. 24-26].
Meeting (to be held December 15-19) to commemo-rate Terra’s fifteenth anniversary. Thome also announced that the ASTER calibration team will host a session on the theme of calibration and present their accomplish-ments at the 2015 International Society for Optical Engineering conference, planned for February in San Francisco, CA. In conclusion, Thome reported that the next Terra Science Working Group Meeting will be held in late summer.
M. Abrams provided updates on ASTER Science Team activities, describing the NASA Senior Review process previously mentioned by K. Thome. He then discussed a presentation planned for the 2014 International Union for Conservation of Nature and Natural Resources (ICUN) World Parks Congress to be held in Sydney, Australia, and provisions for emer-gency Earth observations.
A. Kelly [GSFC] presented the current status of Terra from the perspective of Earth Science Mission Operations. Based on the predicted rate of usage, Terra should be able to remain on-orbit until 2017 and should be able to continue to support science require-ments after it exits the Morning Constellation—until 2020 and possibly beyond.
M. Kikuchi [J-spacesystems] reported on the cur-rent status of the ASTER instrument. K. Mouri [J-spacesystems] and D. Meyer [U.S. Geological Survey (USGS) Land Processes Distributed Active Archive Center (LPDAAC)] provided updates on the distribution and processing at ASTER GDS and the Land Processes Distributed Active Archive Center (LPDAAC), respectively.
M. Fujita [J-spacesystems] discussed the Operation and Mission Planning (OMP) report, elaborating on the status of scene acquisition, achievement of data acquisi-tion requests, and urgent observations.
T. Tachikawa [J-spacesystems] concluded the ple-nary session with an overview of ASTER operations in Japan after the planned changes in 2015. He gave an overview of the issues to be discussed by the Science Team. Y. Yamaguchi [Nagoya University] sorted out the issues and assigned subjects of discussion to each working group. Summaries of these discussions follow.
The Earth Observer July - August 2014 Volume 26, Issue 4 19
mee
ting
sum
mar
iesWorking Group Sessions
Level-1/Geometric/Digital Elevation Model Working Group
The focal point in the first half of the Level-1/Geometric/Digital Elevation Model Working Group session was validation of results from application of ASTER Level-1 (L1) algorithm software, for which there are no major issues or concerns. An L1A repro-cessing tool has been developed, which contains a vis-ible and near infrared (VNIR) radiometric correction program, based on radiometric calibration working group studies. This tool has been implemented and operations have begun at the GDS. It was agreed that the tool should also be implemented at the LPDAAC.
H. Fujisada [Sensor Information Laboratory Corporation] reported on the status of Version 3 of the ASTER Global Digital Elevation Model (GDEM). The working group affirmed that the science team needs to decide if Version 3 should be released or not. Fujisada also proposed a solution independent of GDEM for the problem of determining elevation in large bod-ies of water where ASTER scenes contain no shore-line. B. Crippen [JPL] showed GDEM results for the highest peak in Burma, an error in the water mask of Shuttle Radar Topography Mission (SRTM) Water Body Data (SWBD), and the status of the NASA DEM. T. Tachikawa demonstrated that a one-pixel shift in Band 3B data can be attributed to an error in the code that processes Level 0 data to Level 1, and proposed to add the new function to the previously mentioned L1A reprocessing tool to help correct the problem. After Tachikawa’s presentation, the focus of the discussion shifted to ASTER operations after 2015, as mentioned during the opening plenary session. Considering the sta-ble results of geometric validation, it will not be a prob-lem to suspend further validation activities. Also, the software has been stable enough to essentially suspend maintenance activities, except for “fatal” issues—e.g., the failure of the spacecraft’s pointing, or the instrument’s scanning or cooler mechanisms.
Radiometric Calibration/Atmospheric Correction Working Group
B. Eng [JPL] opened the Radiometric Calibration/Atmospheric Correction Working Group discussion with a report on the status of an atmospheric correction software update. The Instrument Team explained the results of onboard calibration, performed by monitor-ing a standard, well-characterized light source onboard the spacecraft. F. Sakuma [J-spacesystems], T. Koyama [National Institute of Advanced Industrial Science and Technology (AIST)], and S. Kato [AIST] proposed lunar calibration, i.e., using the moon as an on-orbit standard. K. Arai [Saga University], H. Yamamoto [AIST], H. Tonooka [Ibaraki University], S. Hook [JPL], and S. Kato showed the results and plans for
vicarious calibration in the field, done by compar-ing simultaneous ASTER and ground-based observa-tions. K. Thome then introduced Committee on Earth Observation Satellites (CEOS) calibration/validation activities. T. Tachikawa provided an update by the L1A reprocessing tool that is being used to reprocess radio-metric corrections, in response to suggestions made by this Working Group at the last ASTM. The group agreed that discussions regarding the degradation coef-ficient must continue. A. Iwasaki [Tokyo University] reported on offset estimation as a result of the L1A reprocessing tool update, noting that the offset error in Band 1 has been improved. The session concluded with a discussion of future work.
Temperature-Emissivity Separation Working Group
Reports from this Working Group began with a dis-cussion of Temperature-Emissivity Separation (TES) validation. H. Tonooka reported on the evaluation of National Centers for Environmental Prediction (NCEP)/Global Data Assimilation System (GDAS)-based atmospheric correction, and infrared IR band-to-band registration error analysis. M. Ramsey [University of Pittsburgh] described correcting shadowing errors in thermal inertia data. D. Pieri [JPL] showed recon-ciliation of 10-100-cm (~4-40-in) resolution thermal infrared (TIR) data with ASTER data for in situ distri-bution of ground temperatures under a volcanic plume in Turrialba, Costa Rica. A. Gillespie [University of Washington] reported on validation of the TES algo-rithm and the AST05 surface emissivity data product.
The discussion then transitioned to maintenance of global-scale TES data. S. Hook described ongo-ing efforts to develop the ASTER Global Emissivity Dataset (GED)—a large-scale emissivity dataset main-tained at JPL. H. Tonooka elaborated on the global mapping of ASTER/TIR time-series orthorectified products. Tonooka also showed a global lake tempera-ture database developed using ASTER/TIR data. Lastly, M. Fujita and Tonooka discussed the status of night-time TIR global mapping (TGM). The group agreed to recommend continuing TGM processing for current target areas.
Operations and Mission Planning Working Group
A. Miura [J-spacesystems] reported that the flow of shortwave infrared (SWIR) data stopped in August 2013, and the number of full-mode observations in September 2013 have increased compared to those from September 2012. M. Fujita then reviewed the status of Global Mapping 5th Round (GM5) and TIR Global Mapping 6th Round (TGM6). GM5 will be replaced with GM6 in October 2014; TGM6 will continue until the next ASTM. Fujita also reported on the Underserved Area (UA) Science Team Acquisition Request (STAR). T. Tachikawa proposed updating the
The Earth Observer July - August 2014 Volume 26, Issue 420m
eetin
g su
mm
arie
s target area for the UA STAR based on GDEM pro-cessing. The group decided to start UA STAR with a new target area as soon as possible. Fujita reported on Global Land Ice Measurements from Space (GLIMS) and the Volcano STAR, both of which are doing well. Tachikawa showed that adding a scheduling parameter has improved the performance of the cloud avoidance algorithm. L. Maldonado [JPL] analyzed the world-wide distribution of Data Acquisition Request (DAR) users, and reported on the scheduling failures of urgent DARs due to GDS operations reductions. The remain-der of the session was devoted to discussion of ASTER operations after 2015. The group recommended con-tinuing cloud assessments and stated that as the One Day Schedule (ODS) generation frequency decreases, it is acceptable to decrease Normal ODS frequency, but automated Late Change ODS (LC-ODS) generation
should be considered. The prospect of free distribution of data to all users was acceptable.
Ecosystem/Oceanography Working Group
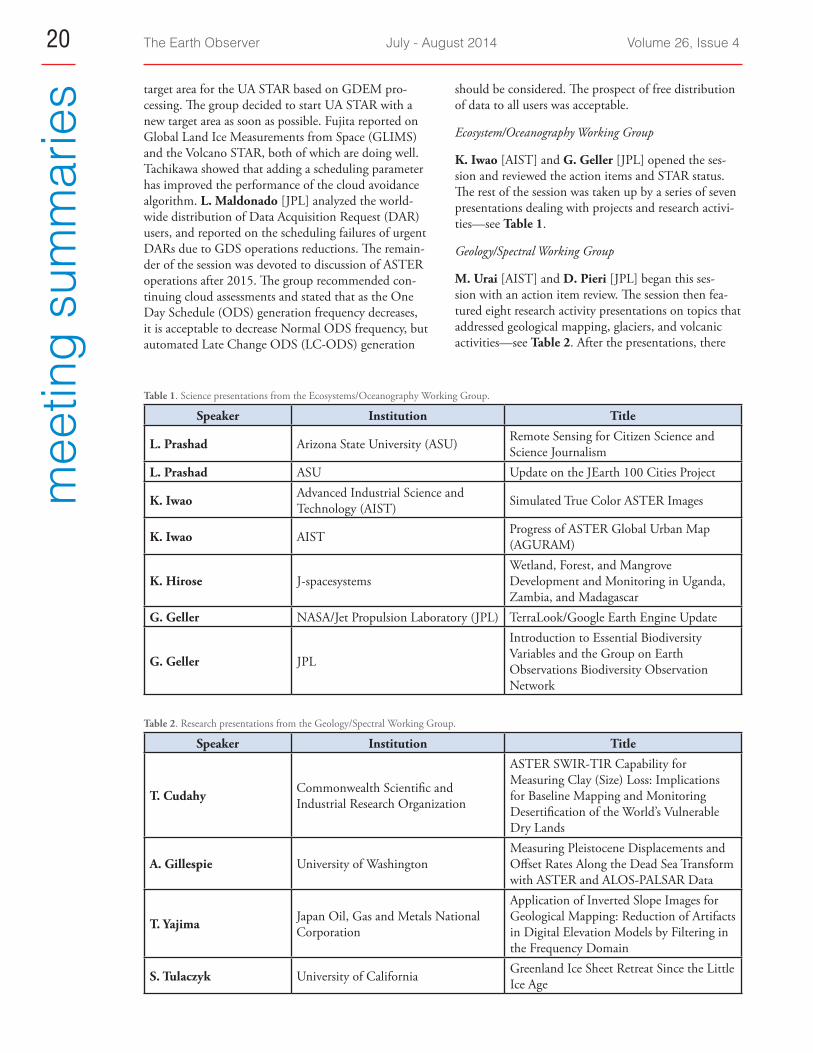
K. Iwao [AIST] and G. Geller [JPL] opened the ses-sion and reviewed the action items and STAR status. The rest of the session was taken up by a series of seven presentations dealing with projects and research activi-ties—see Table 1.
Geology/Spectral Working Group
M. Urai [AIST] and D. Pieri [JPL] began this ses-sion with an action item review. The session then fea-tured eight research activity presentations on topics that addressed geological mapping, glaciers, and volcanic activities—see Table 2. After the presentations, there
Table 1. Science presentations from the Ecosystems/Oceanography Working Group.
Speaker Institution Title
L. Prashad Arizona State University (ASU) Remote Sensing for Citizen Science and Science Journalism
L. Prashad ASU Update on the JEarth 100 Cities Project
K. Iwao Advanced Industrial Science and Technology (AIST) Simulated True Color ASTER Images
K. Iwao AIST Progress of ASTER Global Urban Map (AGURAM)Wetland, Forest, and Mangrove
K. Hirose J-spacesystems Development and Monitoring in Uganda, Zambia, and Madagascar
G. Geller NASA/Jet Propulsion Laboratory (JPL) TerraLook/Google Earth Engine Update
G. Geller JPL
Introduction to Essential Biodiversity Variables and the Group on Earth Observations Biodiversity Observation Network
Table 2. Research presentations from the Geology/Spectral Working Group.
Speaker Institution Title
T. Cudahy Commonwealth Scientific and Industrial Research Organization
ASTER SWIR-TIR Capability for Measuring Clay (Size) Loss: Implications for Baseline Mapping and Monitoring Desertification of the World’s Vulnerable Dry LandsMeasuring Pleistocene Displacements and
A. Gillespie University of Washington Offset Rates Along the Dead Sea Transform with ASTER and ALOS-PALSAR DataApplication of Inverted Slope Images for
T. Yajima Japan Oil, Gas and Metals National Corporation
Geological Mapping: Reduction of Artifacts in Digital Elevation Models by Filtering in the Frequency Domain
S. Tulaczyk University of California Greenland Ice Sheet Retreat Since the Little Ice Age

The Earth Observer July - August 2014 Volume 26, Issue 4 21
mee
ting
sum
mar
ies
was discussion about open action items, especially the Volcano STAR resource. Finally, the participants dis-cussed ASTER operations after 2015.
STAR Committee
New STAR proposals for “Calibration and Validation of Thermal Infrared Products” were reviewed and accepted by the STAR committee.
Closing Plenary Session
The closing plenary session started with summaries and outcomes of the sessions from each working group. Subsequently, consensus was reached on the issues pro-posed at the opening plenary as follows:
• L1 software freeze (no update): Agreed
• Geometric performance check termination: Agreed
• VNIR radiometric calibration coefficient freeze: Agreed (vicarious and onboard calibration may be continued)
• TIR cloud assessment termination: Continue
• ODS generation frequency decrease: Further discus-sion needed for LC-ODS
• Free data distribution to all users: Agreed (terminate charging for access)
The forty-fourth ASTM concluded with closing remarks as well as adjustment of the date and venue for the next meeting. The forty-fifth meeting is scheduled for December 8-10, 2014, in Tokyo, Japan.
Table 2. Research presentations from the Geology/Spectral Working Group (continued).
M. Ramsey University of Pittsburgh (Pitt)Update and Continuing Progress on the ASTER Urgent Request Protocol (URP) System
M. Ramsey Pitt Ash Cloud Compositional Mapping and Source Tracking
M. Urai AIST A New Submarine Volcanic Activity at Nishinoshima, Ogasawara, Japan
D. Pieri JPL Update on the ASTER Volcano Archive and In Situ Volcanic Plume Measurements
ErratumIn our May–June 2014 issue we ran a meeting summary titled “Celebrating Ten Years of OMI Observations” [Volume 26, Issue 3, pp. 23-30]. In the How OMI Became Part of Aura section, third paragraph, second sen-tence on page 24, we mistakenly reported that “The agreement stipulated that NIVR—which later became KNMI—would be the principal investigator (PI) institution and would work in conjunction with NASA’s Goddard Space Flight Center (GSFC) and the Finnish Meteorological Institute (FMI).” However, NIVR did not become KNMI. It should have said, “The agreement stipulated that KNMI would be the principal inves-tigator (PI) institution…” The Earth Observer regrets this error; the online PDF version of the newsletter has been corrected.
erra
tum

The Earth Observer July - August 2014 Volume 26, Issue 422m
eetin
g su
mm
arie
s AIRS Science Team MeetingEric Fetzer, NASA/Jet Propulsion Laboratory, California Institute of Technology, [email protected] Teixeira, NASA/Jet Propulsion Laboratory, California Institute of Technology, [email protected] Pagano, NASA/Jet Propulsion Laboratory, California Institute of Technology, [email protected]
The Atmospheric Infrared Sounder (AIRS) Science Team Meeting was held March 17-19, 2014, at the California Institute of Technology (Caltech) in Pasadena, CA. The meeting was hosted by the AIRS Project at NASA/Jet Propulsion Laboratory (JPL). The contents of most of the presentations are posted on the AIRS project website at airs.jpl.nasa.gov.
Overview
The general theme of the meeting was climate science, with most presentations describing results relevant to climate processes and longer-term atmospheric phe-nomena. Other presentations described atmospheric composition science or the status of the AIRS instru-ment and processing algorithms. Three invited speak-ers addressed some of the important challenges that arise in using satellite datasets in climate studies. Each described the importance of estimating components of the atmospheric energy cycle and the climate feed-back response to increasing greenhouse gas levels; these themes were repeated in a number of presentations. The science results that were shown reflected the maturity of the AIRS datasets, with detailed descriptions of weather and climate processes, including the long-term variabil-ity of directly observed radiances and of retrieved atmo-spheric properties. The presentations covered a variety of topics including boundary layer processes, middle atmospheric phenomena, and the relationship between observations by AIRS and those from other instru-ments. There was also discussion of data assimilation challenges, cloud climatologies from AIRS, atmospheric stability and its possible effect on low-level clouds, and model testing. All of the presentations from the meet-ing are listed in Tables 1–3, and highlights, includ-ing summaries of the invited presentations, are sum-marized in the narratives below. The meeting closed with a group discussion of exploiting the full, almost 12-year AIRS data record.
Opening Remarks and Invited Presentations
Joao Teixeira [JPL—AIRS Science Team Leader], Tom Pagano [JPL—AIRS Project Manager], and Ramesh Kakar [NASA Headquarters—AIRS Program Scientist] gave opening remarks about the climate themes of the meeting and discussed the status of the AIRS instru-ment and project.
Graeme Stephens [JPL] gave the first invited presenta-tion, titled Toward Understanding Earth’s Climate from
an Energy Balance Perspective. Stephens discussed the importance of understanding the controlling factors of energy fluxes that subsequently determine surface warming. These factors included water vapor and cloud feedbacks, which are modulated by the large-scale cir-culation. He also noted that precipitation processes pri-marily drive the atmospheric energy balance, and that energy and water cycles are coupled. These cycles are being significantly perturbed away from historic condi-tions by increasing greenhouse gas levels, but the behav-ior is driven by basic energetic considerations.
Norman Loeb [NASA’s Langley Research Center (LaRC)—Clouds and Earth’s Radiant Energy System (CERES) Principal Investigator] gave the second invited presentation, titled Observing Interannual Variations in Hadley Circulation Atmospheric Diabatic Heating and Circulation Strength. Loeb described large-scale atmospheric forcing from latent and radia-tive heating in the atmosphere and the resulting cir-culations. Supporting conclusions from the preceding presentation, he emphasized the importance of obser-vations in constraining top-of-atmosphere and surface energy fluxes.
Andrew Dessler [Texas A&M University (TAMU)] gave the third invited presentation, titled Investigating the Tropospheric and Stratospheric Water Vapor Feedbacks Using Satellite Data. He described cur-rent understanding of the dominant warming atmo-spheric feedback, which is the greenhouse effect due to increasing water vapor amounts. Dessler described the deep convective processes leading to tropo-spheric moistening (and hence warming), the history of understanding their importance, and how sim-ple models can depict these processes. Dessler then showed that current climate models correctly depict tropospheric water vapor feedbacks, while strato-spheric feedbacks are smaller, but more poorly con-strained in models.
All of these presentations, and the discussions that fol-lowed, emphasized the importance of reducing uncer-tainties on energy flux quantities—especially for deter-mining the surface energy balance. The uncertainties in surface fluxes are at least an order of magnitude greater than recent ocean warming observed by in situ instru-ments. Reducing these uncertainties should be a major priority of the climate research community.

The Earth Observer July - August 2014 Volume 26, Issue 4 23
mee
ting
sum
mar
iesClimate Science Presentations
This session included nearly twenty presentations that covered a variety of climate-related topics, only a few of which are described below.
Joan Alexander [Northwest Research Associates] dis-cussed how AIRS data provide a detailed climatol-ogy of atmospheric gravity waves. While detected at stratospheric levels and above, the AIRS gravity wave signals are collocated with surface topography in regions of strong surface winds, especially over the Southern Ocean. Alexander showed how these waves are an important mechanism for transporting surface momentum to upper levels, where they have a signifi-cant effect on the momentum budget. Similar results have been published in about 20 peer-reviewed papers, including several by Alexander. These and other AIRS papers are accessible at the AIRS website.
Brian Kahn [JPL] showed results of a collaboration with Catherine Naud [Columbia University] in a pre-sentation titled Cloud Processes in Midlatitude Cyclones. Kahn showed storm system composite cloud struc-tures observed by AIRS, and similar composites from two reanalysis datasets. The AIRS composites showed large differences between the Northern and Southern Hemispheres, in storm temperature and storm devel-opment stage. The reanalysis datasets showed some of these properties, but large local differences were evident in the presence of liquid clouds at low levels and ice clouds at all levels. Kahn speculated that these differ-ences were due to incomplete model parameterizations of boundary layer and cloud microphysical processes.
Hui Su [JPL] gave a presentation titled Convective Mixing, Lower Tropospheric Stability, and Low Cloud Feedback. She described the importance of atmo-spheric stability in determining cloud distribution, with higher stability associated with more low clouds in Afternoon Constellation (“A-Train”) observations and output from models. Both revealed a slight down-ward trend in AIRS lower tropospheric stability. In a comparison with 14 climate models, she found that the models whose lower tropospheric stability best matched AIRS observations also predicted greater warming in a doubled carbon dioxide (CO2) scenario.
Peter Kalmus [JPL/Caltech] discussed Observational Boundary Layer Energy and Moisture Budgets of the Stratocumulus-to-Cumulus Transition. He described the structure of the atmospheric boundary layer observed over the course of a year by AIRS and by instru-ments on a surface ship traveling between Southern California and Hawaii. Kalmus also examined similar structures using a model developed by the European Centre for Medium-Range Weather Forecasts
(ECMWF). Comparison with data from radiosondes showed slightly lower AIRS temperature and water vapor biases than ECMWF model results, but poorer vertical resolution. He used several available data sources to quantify the boundary-layer energy and moisture budgets in the transition toward warmer conditions, and found significant discrepancies in these budgets. Kalmus closed by highlighting the need for better constraints on heat and moisture fluxes.
Tim Liu [JPL], in a presentation titled Upper Atmosphere Signature of Mid-latitude Ocean Fronts, showed atmo-spheric temperature vertical structures in AIRS tropo-spheric retrievals over oceanic surface temperature fronts in the Kuroshio and Agulhas currents, west of Japan and southeast of the tip of Africa, respectively. He noted that these results are controversial because they are not replicated in weather or climate models. However, Liu showed collocated cloud signatures in other, indepen-dent satellite sources (e.g., from the Tropical Rainfall Measuring Mission and International Satellite Cloud Climatology Project), suggesting these structures are real features of the atmosphere.
Atmospheric Composition Presentations
Junjie Liu [JPL] presented Lessons Learned from AIRS Mid Tropospheric CO2 and the Future Opportunities. She described assimilation studies using retrieved AIRS CO2, and showed that the AIRS information led to more realistic distributions of atmospheric CO2 relative to in situ observations. Ultimately, AIRS CO2 data could help constrain the budget of “missing” CO2 (i.e., the roughly half of the atmospheric CO2 emitted by humans that is absorbed by “unknown” sinks over land or in the ocean).
Juying Warner [University of Maryland, College Park] gave a presentation titled Separating Recent Emissions from Background Carbon Monoxide, which showed significant decreasing carbon monoxide trends in the AIRS dataset that are correlated with decreases indicated by fossil fuel consumption inventories. She also showed how AIRS data can be used to estimate carbon monoxide sources, and to validate vertical dis-tribution with aircraft observations.
Edward Olsen [JPL] gave a talk titled AIRS CO2 Science Highlights and Project Status. This included an overview of some of the published research based on the AIRS CO2 product. These studies exam-ined the CO2 variability in relation to the El Niño/ Southern Oscillation, the interannual changes of monsoon strength, the Madden–Julian Oscillation, the Northern Annular Mode, the Atlantic Ocean branch of the Walker Cell, and the annual cycle of surface gross primary productivity. The AIRS CO2
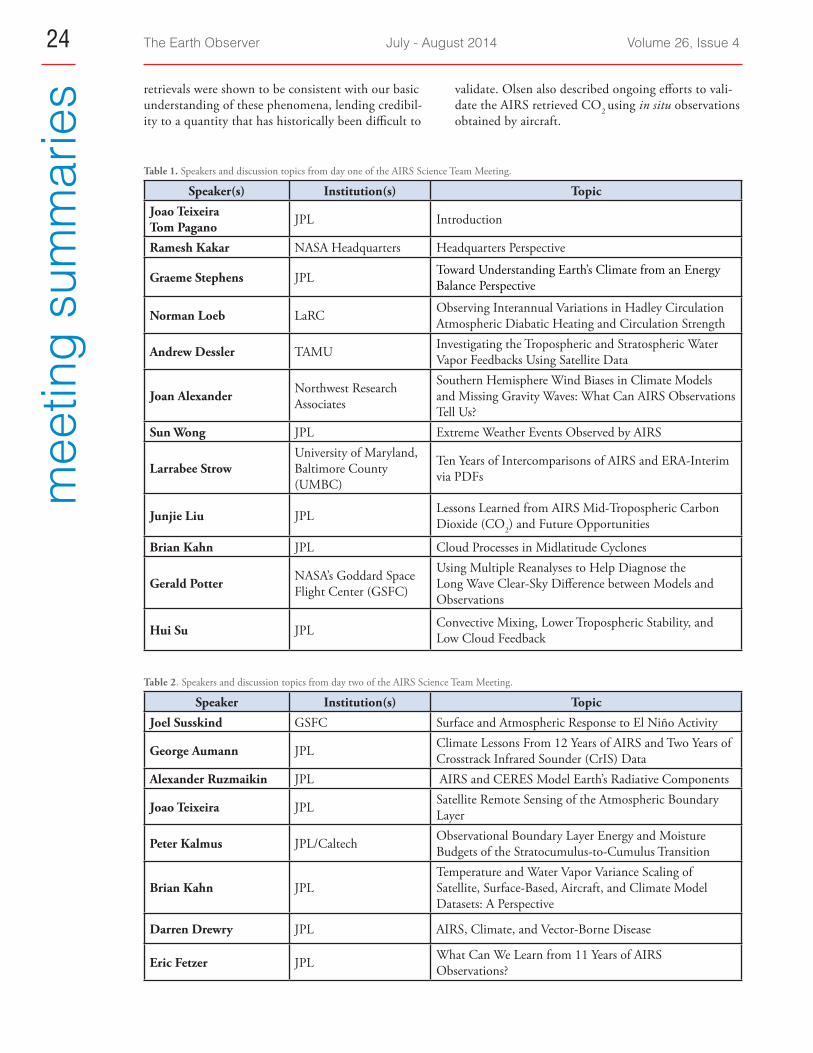
The Earth Observer July - August 2014 Volume 26, Issue 424m
eetin
g su
mm
arie
s retrievals were shown to be consistent with our basic understanding of these phenomena, lending credibil-ity to a quantity that has historically been difficult to
validate. Olsen also described ongoing efforts to vali-date the AIRS retrieved CO2 using in situ observations obtained by aircraft.
Table 1. Speakers and discussion topics from day one of the AIRS Science Team Meeting.
Speaker(s) Institution(s) Topic
Joao Teixeira Tom Pagano JPL Introduction
Ramesh Kakar NASA Headquarters Headquarters Perspective
Graeme Stephens JPL Toward Understanding Earth’s Climate from an Energy Balance Perspective
Norman Loeb LaRC Observing Interannual Variations in Hadley Circulation Atmospheric Diabatic Heating and Circulation Strength
Andrew Dessler TAMU Investigating the Tropospheric and Stratospheric Water Vapor Feedbacks Using Satellite Data
Joan Alexander Northwest Research Associates
Southern Hemisphere Wind Biases in Climate Models and Missing Gravity Waves: What Can AIRS Observations Tell Us?
Sun Wong JPL Extreme Weather Events Observed by AIRS
Larrabee StrowUniversity of Maryland, Baltimore County (UMBC)
Ten Years of Intercomparisons of AIRS and ERA-Interim via PDFs
Junjie Liu JPL Lessons Learned from AIRS Mid-Tropospheric Carbon Dioxide (CO ) and Future Opportunities2
Brian Kahn JPL Cloud Processes in Midlatitude Cyclones
Gerald Potter NASA’s Goddard Space Flight Center (GSFC)
Using Multiple Reanalyses to Help Diagnose the Long Wave Clear-Sky Difference between Models and Observations
Hui Su JPL Convective Mixing, Lower Tropospheric Stability, and Low Cloud Feedback
Table 2. Speakers and discussion topics from day two of the AIRS Science Team Meeting.
Speaker Institution(s) Topic
Joel Susskind GSFC Surface and Atmospheric Response to El Niño Activity
George Aumann JPL Climate Lessons From 12 Years of AIRS and Two Years of Crosstrack Infrared Sounder (CrIS) Data
Alexander Ruzmaikin JPL AIRS and CERES Model Earth’s Radiative Components
Joao Teixeira JPL Satellite Remote Sensing of the Atmospheric Boundary Layer
Peter Kalmus JPL/Caltech Observational Boundary Layer Energy and Moisture Budgets of the Stratocumulus-to-Cumulus TransitionTemperature and Water Vapor Variance Scaling of
Brian Kahn JPL Satellite, Surface-Based, Aircraft, and Climate Model Datasets: A Perspective
Darren Drewry JPL AIRS, Climate, and Vector-Borne Disease
Eric Fetzer JPL What Can We Learn from 11 Years of AIRS Observations?

The Earth Observer July - August 2014 Volume 26, Issue 4 25
mee
ting
sum
mar
iesTable 2. Speakers and discussion topics from day two of the AIRS Science Team Meeting (continued).
Speaker Institution(s) Topic
Mathias Schreier JPL Ten Years of Measurements from AIRS by Using Cloud State Classification as Derived from MODIS
Baijun Tian JPL The Application of AIRS Data in the Madden–Julian Oscillation Studies
Qing Yue JPL/University of California, Los Angeles
Investigation of Cloud-Topped Marine Boundary Layer Using AIRS/AMSU Data
Evan Fishbein JPL Ten Years of Variability in the Tropical Tropopause as Observed by AIRS
Ali Behrangi JPL On the Net Surface Water Exchange Rate Estimated from Remote Sensing Observation and Reanalysis
Timothy Liu JPL Upper Atmosphere Signature of Mid-Latitude Ocean Fronts
Table 3. Speakers and discussion topics from day three of the AIRS Science Team Meeting.
Speaker Institution(s) Topic
Shawn (Xiaozhen) Xiong
National Oceanic and Atmospheric Administration
Validation of AIRS Version 6 Methane Product and Recent Progress in AIRS Nitrous Oxide Product
Juying Warner University of Maryland, College Park
Separating Recent Emissions from Background Carbon Monoxide
Edward Olsen JPL AIRS CO2 Science Highlights and Project Status
European Organization Collocation of GRUAN* Radiosondes and Infrared Xavier Calbet for the Exploitation of Atmospheric Sounding Interferometer Infrared
Meteorological Satellites Hyperspectral Measurements
Larrabee Strow UMBC Full Spectrum Intercalibration of AIRS and CrIS
Joel Susskind GSFC Status and Plans for Version 7 from the Sounder Research TeamAIRS Version 6 at the Goddard Earth Sciences Data and
Thomas Hearty GSFC Information Services Center: Processing, New Related Products, and Giovanni
Bill BlackwellMassachusetts Institute of Technology’s Lincoln Laboratory
Assessment of Neural Network Retrieval Accuracy and Resolution
Van Dang JPL Validation of AIRS Version 6 Near Surface Air Temperature and Sea Surface Temperature
All Participants
(Several) Discussion: Using AIRS to Understand Decadal Variability and Trends
* — GRUAN stands for Global Climate Observing System (GCOS) Reference Upper-Air Network.
Closing Discussion and Summary
Several of the presentations at the meeting used a sig-nificant portion of the complete AIRS record, includ-ing those by Andrew Dessler, Sun Wong, Larrabee Strow, Junjie Liu, Hui Su, Joel Susskind, George Aumann, Eric Fetzer, Mathias Schreier, Baijun Tian,
Evan Fishbein, and Edward Olsen. The meeting closed with a discussion of the challenges of using all or most of the AIRS record spanning nearly 12 years.
Before adjourning, plans were announced for a fall meeting. The location will be announced at a later date.

The Earth Observer July - August 2014 Volume 26, Issue 426m
eetin
g su
mm
arie
s CERES Science Team MeetingEdward Kizer, NASA’s Langley Research Center/Science Systems and Applications, Inc., [email protected]
Overview
The spring 2014 Clouds and the Earth’s Radiant Energy System (CERES) Science Team meeting was held April 22-24, 2014, at NASA’s Langley Research Center (LaRC) in Hampton, VA. Norman Loeb [LaRC—CERES Principal Investigator] hosted and conducted the meeting. The major objectives of the meeting were to review the status of CERES instruments1 and data products, and to highlight the science applications for CERES data products.
Meeting presentations can be downloaded from the CERES website by clicking the CERES Meetings button on the left navigation bar at ceres.larc.nasa.gov.
Programmatic and Technical Presentations
The agenda for the first day of the meeting consisted of a series of programmatic and technical presentations.
Norman Loeb [LaRC] presented the State of CERES and discussed the consolidation of the budget for the CERES measurement science team. He reported that the number of published journal articles and citations using CERES data products shows a steady increase each year since 1993. Loeb then described the CERES schedule of software deliveries for Edition 3 and Edition 4 process-ing. He also announced a new field campaign that will involve CERES team participants—the Arctic Radiation-IceBridge Sea-Ice Experiment (ARISE)—scheduled to take place in August–September 2014.
Susan Thomas [Science Systems and Applications, Inc. (SSAI)] provided the CERES FM1-FM6 Instrument Update. She reported that the Suomi National Polar-orbiting Partnership (NPP)/CERES Flight Model 5 (FM5) instrument performance is within the expected range after completing two years of on-orbit operations. Thomas announced that the CERES FM6 instrument has successfully completed the System Acceptance and Pre-Ship Readiness Review and is scheduled to ship to Ball Aerospace in June 2014. She also reported on a new method that was used to correct for a spectral dependence in sensor response in the shortwave region of the total channel (which measures all wavelengths of radiation) on CERES FM1-FM4 instruments.
1 Operational CERES instruments currently fly onboard NASA’s Terra, Aqua, and the joint NASA/National Oceanic and Atmospheric Administration (NOAA) Suomi National Polar-orbiting Partnership (NPP) satellites.
Jack Xiong [SSAI] reported on the Status of the Visible Infrared Imaging Radiometer Suite (VIIRS) On-Orbit Calibration. VIIRS, onboard the Suomi NPP platform, has continued to perform within its design require-ments, and the VIIRS Sensor Data Record (SDR) has matured to validated status. However, calibration efforts remain critically important to assure ongoing SDR quality.
Patrick Minnis [LaRC] presented the CERES Clouds Working Group Report, and reported on Terra and Aqua Edition 4 comparisons with Suomi NPP Edition 1. He also reported on validation efforts to compare imager cloud retrievals from CERES with those from NASA’s Cloud-Aerosol Lidar and Infrared Pathfinder Satellite Observations (CALIPSO) spacecraft and SEAC4RS2 aircraft measurements. Minnis also dis-cussed the consistency of cloud retrievals between the Moderate Resolution Imaging Spectroradiometer (MODIS) onboard Terra and Aqua, VIIRS onboard Suomi NPP, and the Advanced Very High Resolution Radiometer (AVHRR) onboard NOAA’s Polar Orbiting Environmental Satellites (POES).
Wenying Su [LaRC] presented the Validation of the CERES Edition 4 Angular Distribution Models report. Testing and delivery of the Edition 4 Angular Distribution Models (ADMs) are complete, and pro-duction of the Edition 4 single scanner footprint (SSF) products will begin in May 2014. Su presented the shortwave and longwave flux uncertainties found in instantaneous measurements and at global scales.
Daid Kratz [LaRC] provided a report on the Status of the Shortwave Surface-Only Flux Algorithms. He focused on the status of shortwave (SW) model improvements, such as the inclusion of the daily aerosol data from the Model of Atmospheric Transport and Chemistry (MATCH), and the revision to the molecular scattering formulation. These upgrades have significantly improved the parameterized surface SW flux calculations for clear and partly cloudy sky conditions. Kratz also reported that upgrades to the longwave (LW) model are provid-ing improved results by constraining the CERES cal-culated skin temperature data. The availability of ocean buoy measurements should improve surface flux retriev-als by providing validation over ocean regions.
2 SEAC4RS stands for Studies of Emissions and Atmospheric Composition, Clouds, and Climate Coupling by Regional Surveys. To learn more, visit espo.nasa.gov/home/seac4rs.

The Earth Observer July - August 2014 Volume 26, Issue 4 27
mee
ting
sum
mar
iesRabindra Palikonda [SSAI] reported on the Five-
Channel Geostationary Cloud Retrievals, stating that the output product file format of the five-channel Geostationary (GEO) Cloud Retrievals product has been finalized, and several months of test data were pro-vided to the Surface and Atmosphere Radiation Budget (SARB) group. Progress continues to be made on cali-bration, with sensor-specific response function correc-tions provided by the Time Interpolation and Space Averaging (TISA) group.
Seiji Kato [LaRC] presented the Surface and Atmospheric Radiation Budget Working Group Update report. He discussed the advances in the Edition 4 Synoptic Radiative Fluxes and Clouds (SYN) product obtained by using the Edition 4 MODIS input data and switching to the five-channel GEO clouds prod-uct. Kato also described changes made to the Edition 4 Clouds and Radiative Swath (CRS) data product, including the addition of new ice cloud properties, a revised tuning algorithm, and the use of boundary layer temperature profiles consistent with those used by the CERES cloud group.
Dave Doelling [LaRC] presented the Time Interpolation and Space Averaging Working Group report. He summarized the TISA team’s approaches to process-ing and validating GEO LW narrow-band to broad-band fluxes. Doelling discussed the impacts of applying spectral band adjustment factors on GEO composite radiances and the GEO/MODIS infrared (IR) calibra-tion. Efforts continue to develop an automated tech-nique and a graphical user interface (GUI) to allow users to remove bad scan lines in GEO data. He also reported that surface radiation measurements in the CERES/Atmospheric Radiation Measurement (ARM) Validation Experiment (CAVE) will be added to the CERES visualization and ordering tool. The CERES order metrics are now uploaded daily to the Earth Science Data and Information System (ESDIS) Metrics System (EMS)—earthdata.nasa.gov/about-eosdis/system-description/esdis-metrics-system-ems.
Jonathan Gleason [LaRC] presented the CERES Data Management Team report. He announced that a major milestone was met when the CERES AuTomAted job Loading sYSTem (CATALYST) went live on April 16, 2014. Gleason reported that 30 software and data deliveries have been made since October 2013. He discussed the Edition 3 and Edition 4 processing strat-egies for Terra, Aqua, and Suomi NPP. The number of unique users for CERES products showed a steady increase for those ordering the Energy Balanced and Filled/Top-of-Atmosphere (EBAF-TOA) and EBAF-Surface products.
Chris Harris [LaRC] presented the Atmospheric Sciences Data Center Update report, showing user and process-ing metrics for each CERES product. He reported that more than one hundred CERES-related tickets had been resolved in the last year on the EOS.web inte-grated library system at www.eosintl.com/eos-web.
Sarah Crecelius [SSAI] provided the CERES Education and Outreach Overview, noting that there is a new design for the My NASA Data website (mynasadata.larc.nasa.gov). She also reported that the Students’ Cloud Observations On-line (S’COOL) project has been oper-ating for 17 years with over 4000 registered viewers. In that time, 125,000 observations have been recorded, with 1138 of them coincident with measurements from both Terra and Aqua.
Invited Science Presentations
The second day of the team meeting featured two, 45-minute presentations from special invited guests, each of whom described their CERES-related research.
Aaron Donohoe [Massachusetts Institute of Technology (MIT)] presented Global Scale Energy Fluxes: Comparison of Observational Estimates and Model Simulations. He spoke about the global mean energy balance and what determines the Earth’s plan-etary albedo. Donohoe also presented CERES-derived atmospheric and surface contributions to the plan-etary albedo, and compared them with Coupled Model Intercomparison Project Phase 3 (CMIP3) climate model data.
Michael Previdi [Columbia University] presented The Antarctic Atmospheric Energy Budget: Observation and Model Simulation. He spoke about Antarctic climatol-ogy and intraseasonal-to-interannual variability and multidecadal trends. Prevdi showed comparisons of the Antarctic energy budget between CERES EBAF and CMIP5 datasets, and reported that multidecadal trends are balanced by opposing trends in the horizontal energy transport into the polar region.
Contributed Science Presentations
A variety of topics were covered during the contributed science presentations, which took place on the second and third days of the meeting. These included climate model assessments, validation efforts, and discussions about algorithm improvements. A narrative summary of the significant science results presented over these two days is given below. The information is organized in terms of science content—as opposed to chronologi-cal list of talks. While quite a few of the presentations are mentioned, it is not a complete list. For a complete

The Earth Observer July - August 2014 Volume 26, Issue 428m
eetin
g su
mm
arie
s chronological list from day two and day three refer to Tables 13 and 2, respectively.
Several researchers compared climate models to obser-vations. Noel Baker [Oak Ridge Associated Universities (ORAU)] outlined her research in applying process-based metrics to weighting climate model output in an effort to improve ensemble averages. Depending 3 All acronyms used in Tables 1 and 2 in this article are defined in text and/or listed at ceres.larc.nasa.gov/acronyms_main.php.
on the weighting used, they differ significantly from the average. Patrick Taylor [LaRC] explored the diur-nal cycle’s impact on the climatological mean state and interannual variability. The largest diurnal cycle con-tribution to flux variability reached 50% in land con-vective regions. Takmeng Wong [LaRC] evaluated the Japanese 55-year Reanalysis (JRA55) data against 12 years of CERES EBAF, and found the global mean all-sky LW values from JRA55 are much higher than those observed by CERES. JRA55 also has higher interannual
Table 1: CERES contributed science presentations from day two (Wednesday, April 23).
Speaker Institution Topic
Noel Baker ORAU Creating “Intelligent” Climate Model Ensemble Averages Using a Process-Based Framework
Patrick Taylor LaRC Impact of Diurnal Cycle Simulation on the TOA Flux Mean State and Interannual Variability in CanAM4
Takmeng Wong LaRC Comparison of EBAF Ed2.8 TOA Fluxes with Reanalysis Data Products
Zachary Eitzen SSAI The CERES Flux-By-Cloud Type Simulator
Seung-Hee Ham ORAU Improvement of Shortwave Radiation Budget by Three-Dimensional Scene Construction
Hai-Tien Lee University of Maryland Daily OLR CD—Development and Evaluation
Istvan Laszlo
National Oceanic and Atmospheric Administration (NOAA)
Aerosol Retrieval from Suomi NPP/VIIRS: Analysis of Data Quality
Lusheng Liang SSAI Edition 4 Clear-Sky Shortwave Angular Distribution Models over Ocean
Peter Szewczyk SSAI Strategies and Preliminary Results of Comparing FM5 with FM3/FM1
Table 2: CERES contributed science presentations from day three (Thursday, April 24).
Speaker Institution Topic
Kris Bedka SSAI Updates on Extending the CERES Cloud Climate Record Using AVHRR, MODIS, and NASA A-Train Data
Baike Xi University of North Dakota
Impact of Drizzle to the MODIS MBL Cloud Microphysics Retrievals During MAGIC and AZORES IOPs
Fu-Lung Chang SSAI Comparisons of CERES Multilayer Cloud Properties with CALIPSO and CloudSat Data
William Smith, Jr. LaRC Empirical Methods to Improve Cloud Water Budget Estimates From Passive Satellite Measurements
Hailan Wang LaRC Assessing the CMIP5 Model Simulations of Tropical Clouds and TOA Cloud Radiative Effects
Paul Stackhouse LaRC FLASHFlux Update
Greg Schuster LaRC The Future of COVE: Operations and Instrumentation After DOE Renovations of the Chesapeake Lighthouse
Matthew Christensen Colorado State University
A-Train and Reanalysis Data: An Evaluation of the Arctic Energy Budget
Norm Loeb LaRC Observing Recent Cloud and Radiation Budget Changes over Arctic Sea Ice

The Earth Observer July - August 2014 Volume 26, Issue 4 29
mee
ting
sum
mar
iesvariability of all-sky LW and SW fluxes than CERES,
but slightly lower clear-sky flux variability. Hailan Wang [LaRC] identified lower total tropical cloud amounts due to fewer mid- and low-level clouds in CMIP5 than found in observations.
Hai-Tien Lee [University of Maryland] described a val-idation effort comparing a new version of the regional High Resolution Infrared Radiation Sounder (HIRS) Outgoing Longwave Radiation (OLR) product with CERES EBAF. Istvan Laszlo [NOAA] presented satel-lite and ground comparisons, concluding that there is little difference between VIIRS and MODIS aerosol optical thickness at 550 nm over ocean, but sizeable differences over land. Peter Szewczyk [SSAI] provided results from three different strategies for comparing Suomi NPP CERES radiances with those from CERES on Terra and Aqua. Without any calibration adjust-ments, the SW relative difference (FM5-FM3) is 3%, while for LW it is less than 1%. Baike Xi [University of North Dakota] used data gathered during the Azores and MAGIC4 campaigns to show that liquid water path, effective radius, and optical depth retrievals increase with increased drizzle beneath the cloud base.
Greg Schuster [LaRC] presented the future plans for transition of the Chesapeake Lighthouse into a Department of Energy (DOE) Reference Facility for Offshore Renewable Energy. The current deck will be replaced and a 120-m (~394-ft) tower will be added. The DOE will increase both passive and active wind monitoring capability. All CERES Ocean Validation Experiment (COVE) instrumentation will be accom-modated in the new design.
Kris Bedka [SSAI] presented an update on an effort to extend the CERES cloud climate record back in time using AVHRR data. William Smith, Jr. [LaRC] described ongoing efforts to exploit climatology from active sensing to improve the cloud vertical structure and aircraft icing forecasts. Zachary Eitzen [SSAI] reported on an effort to produce a CERES flux-by-cloud-type simulator that can be used to evaluate cli-mate model clouds and radiation output.
Paul Stackhouse [LaRC] presented an update on the CERES Fast Longwave and Shortwave Radiative Fluxes (FLASHFlux) product. In addition to being used by CloudSat and the Megha-Tropiques missions, it also input for Renewable Energy Project Analysis Software (RETSCreen), developed by the Canadian govern-ment and used to make clean energy decisions, and the Agricultural Production System sIMulator (APSIM), an Australian model used to simulate a variety of agricul-tural systems.
4 MAGIC stands for Marine Atmospheric Radiation (ARM) GCSS Pacific Cross-section Intercomparison (GPCI) Investigation of Clouds. GCSS is the GEWEX Cloud System Study; GEWEX is the Global Water and Energy Exchanges Experiment.
Lusheng Liang [SSAI] described an ocean aerosol retrieval method used in CERES flux inversion for clear-sky SW Angular Distribution Models (ADM). The new retrieval reduces the root mean square of the normalized radiance differences between ADM-prediction and observation.
Seung-Hee Ham [ORAU] presented results from a three-dimensional radiative transfer model ini-tialized with data from satellites in the Afternoon Constellation, or A-Train. Ham showed that incor-porating a recently developed Scene Construction Algorithm (SCA) that estimates cloud properties from the CALIPSO and CloudSat ground tracks reduces the computed instantaneous top-of-atmosphere (TOA) flux error by 40%.
Matthew Christensen [Colorado State University] described the COMPrehensive ARctic Energy (COMPARES) budget dataset that combines multiple datasets—including CERES EBAF 2.7—into one easy-to-use framework. He showed that despite increasing cloud cover between 2000 and 2012, the absorbed solar radiation also is increasing and the loss of sea ice domi-nates the change in reflected solar radiation.
Norm Loeb gave a summary of cloud and radiation changes over Arctic sea ice. During the summer, there is a positive trend in TOA net downward flux, dominated by increased absorption of solar radiation (i.e., one-quar-ter is cloud changes), but with a transition to a negative trend in the fall, dominated by outgoing LW radiation. The September sea ice minimum is preceded by a sum-mer maximum in surface downward SW radiation and followed by increased surface upward LW radiation.
Summary
The meeting was very productive, with Working Groups presenting advancements in Level 3 science algorithms that are being prepared for delivery and validation results for Level 2 products already imple-mented. The CERES instrument team developed a new method to calculate the spectral dependence in sensor response in the shortwave region of the total channel on CERES FM1-FM4 instruments. Validation of the new angular distribution models was also completed, the results of which are incorporated in Edition 4 data products. The CERES team is also taking advantage of CATALYST and Production Request tools that stream-line entering job requests and automates submittals. Surface radiation measurements with the ability to display matched satellite information will be available through the CERES Ordering Tool.
The next CERES Science Team meeting will be held October 6-10, 2014, in Toulouse, France.
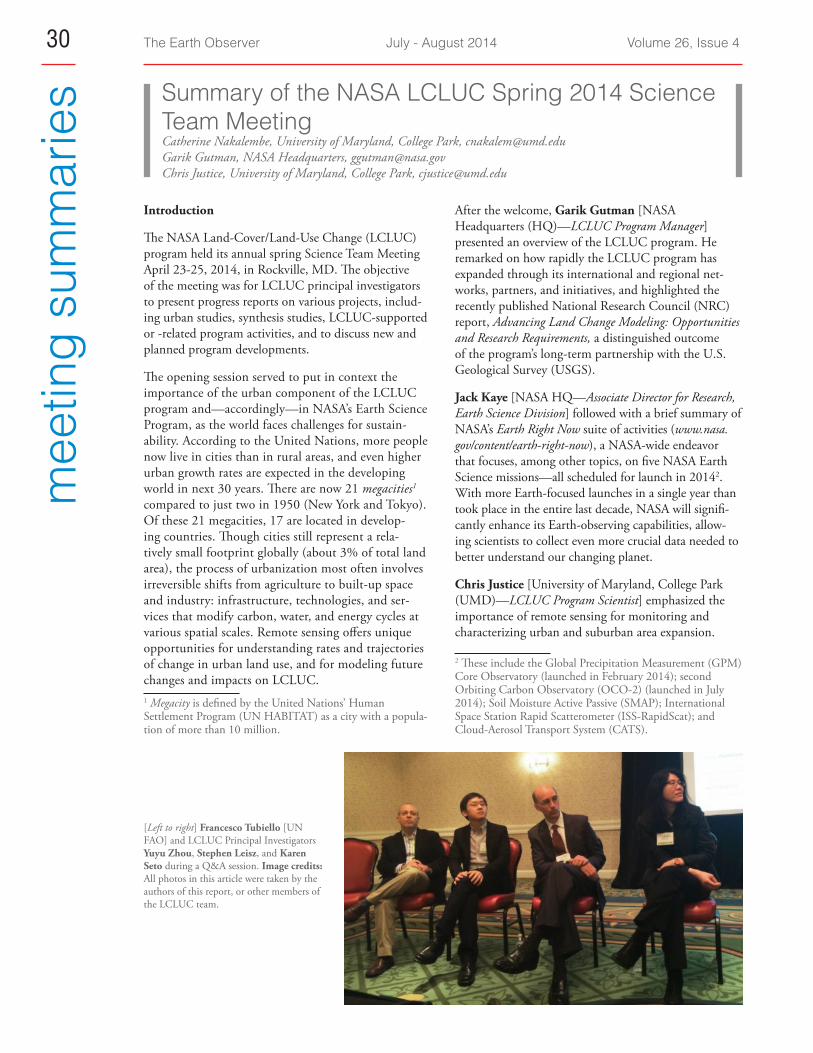
The Earth Observer July - August 2014 Volume 26, Issue 430m
eetin
g su
mm
arie
s Summary of the NASA LCLUC Spring 2014 Science Team MeetingCatherine Nakalembe, University of Maryland, College Park, [email protected] Garik Gutman, NASA Headquarters, [email protected] Chris Justice, University of Maryland, College Park, [email protected]
Introduction
The NASA Land-Cover/Land-Use Change (LCLUC) program held its annual spring Science Team Meeting April 23-25, 2014, in Rockville, MD. The objective of the meeting was for LCLUC principal investigators to present progress reports on various projects, includ-ing urban studies, synthesis studies, LCLUC-supported or -related program activities, and to discuss new and planned program developments.
The opening session served to put in context the importance of the urban component of the LCLUC program and—accordingly—in NASA’s Earth Science Program, as the world faces challenges for sustain-ability. According to the United Nations, more people now live in cities than in rural areas, and even higher urban growth rates are expected in the developing world in next 30 years. There are now 21 megacities1 compared to just two in 1950 (New York and Tokyo). Of these 21 megacities, 17 are located in develop-ing countries. Though cities still represent a rela-tively small footprint globally (about 3% of total land area), the process of urbanization most often involves irreversible shifts from agriculture to built-up space and industry: infrastructure, technologies, and ser-vices that modify carbon, water, and energy cycles at various spatial scales. Remote sensing offers unique opportunities for understanding rates and trajectories of change in urban land use, and for modeling future changes and impacts on LCLUC. 1 Megacity is defined by the United Nations’ Human Settlement Program (UN HABITAT) as a city with a popula-tion of more than 10 million.
After the welcome, Garik Gutman [NASA Headquarters (HQ)—LCLUC Program Manager] presented an overview of the LCLUC program. He remarked on how rapidly the LCLUC program has expanded through its international and regional net-works, partners, and initiatives, and highlighted the recently published National Research Council (NRC) report, Advancing Land Change Modeling: Opportunities and Research Requirements, a distinguished outcome of the program’s long-term partnership with the U.S. Geological Survey (USGS).
Jack Kaye [NASA HQ—Associate Director for Research, Earth Science Division] followed with a brief summary of NASA’s Earth Right Now suite of activities (www.nasa.gov/content/earth-right-now), a NASA-wide endeavor that focuses, among other topics, on five NASA Earth Science missions—all scheduled for launch in 20142. With more Earth-focused launches in a single year than took place in the entire last decade, NASA will signifi-cantly enhance its Earth-observing capabilities, allow-ing scientists to collect even more crucial data needed to better understand our changing planet.
Chris Justice [University of Maryland, College Park (UMD)—LCLUC Program Scientist] emphasized the importance of remote sensing for monitoring and characterizing urban and suburban area expansion.
2 These include the Global Precipitation Measurement (GPM) Core Observatory (launched in February 2014); second Orbiting Carbon Observatory (OCO-2) (launched in July 2014); Soil Moisture Active Passive (SMAP); International Space Station Rapid Scatterometer (ISS-RapidScat); and Cloud-Aerosol Transport System (CATS).
[Left to right] Francesco Tubiello [UN FAO] and LCLUC Principal Investigators Yuyu Zhou, Stephen Leisz, and Karen Seto during a Q&A session. Image credits: All photos in this article were taken by the authors of this report, or other members of the LCLUC team.

The Earth Observer July - August 2014 Volume 26, Issue 4 31
mee
ting
sum
mar
ies
In addition to LCLUC monitoring with moderate-resolution products today, fine-resolution and lidar data are used to characterize urban areas. New datasets from Landsat and the National Geospatial-Intelligence Agency (NGA) offer a unique perspective, critical to understanding the consequences of today’s changes in urban areas. The remainder of the meeting was orga-nized under the following sessions:
• Urban LCLUC Studies;
• Invited Presentations on International Programmatic Activities;
• Programmatic Perspectives and Initiatives;
• LCLUC Synthesis Presentations; and
• Urban Interdisciplinary Studies (IDS) on Environmental Impacts.
The remainder of this report consists of summaries of each session. A list of speakers and affiliation is pro-vided at the beginning of each section, followed by a narrative description of the most significant results. The individual presentations can be found at lcluc.umd.edu/meetings.php?mid=52.
Urban LCLUC Studies
This session included presentations from: Karen Seto [Yale University]; Peilei Fan [Michigan State University (MSU)]; Cristina Milesi [California State University, Monterey/NASA’s Ames Research Center (ARC)]; Eric Brown de Colstoun [NASA’s Goddard Space Flight Center (GSFC)]; Yuyu Zhou [Joint Global Change Research Institute]; Stephen Leisz [Colorado State University]; and Charles Vörösmarty [City College of New York].
Several reports in this session focused on urban develop-ment in specific regions. Just as natural land cover varies greatly over Earth’s surface, the contours of the “concrete jungle” are anything but homogeneous, and vary consid-erably depending on one’s location. Cities in India, for example, are primarily building out, with dense urban centers and little urban sprawl. Building regulations and land tenure issues are complex, and most buildings in urban centers do not rise above three or four stories. On the other hand, high-rise residences are common in peri-urban areas, where agricultural land use often conflicts with urban growth—see photo, above.
By comparison, Chinese cities are building both up and out, and urban expansion is associated with a decline in agricultural land use intensity. Development accelerated in coastal Chinese cities after government reforms, with high rates of expansion beginning in the late 1980s and early 1990s. Areas targeted for the earliest reforms, including the cities of Shenzhen and Ningbo, expanded rapidly before others. One of the presentations focused on the three major institutional forces underlying urban development in Hangzhou. These included administra-tive annexation and establishing development zones; increasing involvement of the market by facilitating relocation, satisfying housing demands of migrants, and investing foreign capital; and implementing the local entrepreneur state, which exploited land transactions to accumulate profit.
Other reports during this session highlighted the application of certain types of remotely sensed data and analytical techniques to study specific aspects of urban LCLUC. For example, by employing a cluster-based standardized approach, based on multisensor characterization of human settlements, it is possible to track urbanization consistently over large regions. A bonus of this approach is that it requires minimal
Farm laborers in Hyderabad, India, use the hard surface of a special economic zone (SEZ) entrance road to separate wheat from chaff.

The Earth Observer July - August 2014 Volume 26, Issue 432m
eetin
g su
mm
arie
s data training. Meanwhile, surface reflectance products from Landsat and the Moderate Resolution Imaging Spectroradiometer (MODIS) onboard NASA’s Terra and Aqua satellites are highly consistent and useful for mapping impervious cover to detect and map urbaniza-tion hot-spots at the global scale. Multiseason charac-terization of mean reflectance properties and low vari-ability distinguishes built environments from adjacent agricultural or undeveloped areas in most situations. However, longer time series of Landsat-scale data [i.e., 30-m (~98-ft) spatial resolution] are needed to resolve reflectance ambiguity over desert cities. Multitemporal analysis shows strong indication of urban growth and rural urbanization in Vietnam, Laos, and Thailand. Connectivity between these countries has increased significantly due to development of the East-West Economic Corridor.
A global-scale assessment of threatened urbanized river delta systems shows that delta hotspots of incident haz-ards versus environmental stress are predominately heav-ily urbanized Asian deltas, including the Han, Pearl, Yangtze, Yellow, Godavri, Ganges, and Indus river del-tas—see Figure below. Results from a study that used interferometric data collected between 2007 and 2011 show strong evidence of subsidence from groundwa-ter extraction due to the presence of fish farms in the Yellow River Delta3.
3 These data were obtained by the Advanced Synthetic Aperture Radar (ASAR), onboard the European Space Agency’s Environmental Satellite (Envisat), and the Phased Array type L-band Synthetic Aperture Radar (PALSAR), onboard the Japan Aerospace Exploration Agency’s Advanced Land Observation Satellite (ALOS).
Invited Presentations on International Programmatic Activities
This session included presentations from: Francesco N. Tubiello [Food and Agriculture Organization (FAO) of the United Nations]; Tony Janetos [Boston University (BU)]; and Karen Seto.
The Intergovernmental Panel on Climate Change’s (IPCC) Working Group III reported that greenhouse gas (GHG) emissions accelerated at an estimated +2.2% per year between 2000 and 2010, despite reduc-tion efforts. Emissions are rising with the growth in gross domestic product (GDP) and population. The report warns that without more mitigation, global mean surface temperature might increase from 3.7 °C to 4.8 °C (~6.7 °F to 8.6 °F) by the end of the twenty-first century.
While the rapid rate of urban expansion is not without concerns in terms of environmental and climate impacts, over the short term it may also offer the best hope for mitigating the impacts of climate change. The next 20 years are predicted to see a rapid increase in urbanization. In many cases, the urban form and infrastructure of these areas are not locked in and there is an opportunity to design “greener” cityscapes that minimize emissions and other harmful impacts on the environment. One of the presentations noted that cities in non-Annex I4 countries generally have higher levels of energy use compared to the national average, whereas cities in Annex I countries
4 This refers to parties to the Kyoto Protocol not listed in Annex 1. For the most part, this includes developing coun-tries and countries especially vulnerable to the adverse impacts of climate change.
Figure. This plot of delta hotspots shows incident hazards versus environmen-tal stress in urbanized river delta systems around the world. Most of the high-stress, high-hazard deltas are found in urbanized regions, particularly in Asia.

The Earth Observer July - August 2014 Volume 26, Issue 4 33
mee
ting
sum
mar
iesgenerally have lower energy use per capita than national
averages. However, such urban design opportunities will be challenged by limited governance, technical, finan-cial, and institutional capacities, all the while requiring closing some of the significant gaps in knowledge that still remain due to the lack of consistent and compa-rable emissions data at local scales. Also contributing to the problem is the lack of scientific understanding of the magnitude of the emissions reductions resulting from altering urban forms. There also remain large uncertain-ties as to how urban areas will develop in the future, as well as a general lack of scientific understanding of how cities can prioritize climate change mitigation strategies, local actions, investments, and policy responses that are locally relevant.
The presentations in this session highlighting two inter-national programs that are working to help close the gaps in our knowledge. The first program discussed was the FAO of the United Nations GHG Emission Estimates Database, which is a global GHG emissions database designed to help member countries identify and report GHG emissions and mitigation actions in agriculture, forestry, and other land uses. The database provides a complete and coherent time series of emission statistics at the country level over a reference period from 1961 to 2010, based on FAO Statistical Databases (FAOSTAT) activity data and IPCC Tier 1 methodology. The data-base site is found at faostat3.fao.org/faostat-gateway/go/to/download/G1/*/E.
The second program discussed was the Global Observations of Forest and Land Cover Dynamics (GOFC-GOLD), a nongovernmental international sci-entific program that plays an important ongoing role in enabling methods, validating data, and intercom-paring data sources. The program has been instrumen-tal in developing regional science networks addressing land-cover-related science questions and has focused on coordinating major space data sources from NASA, the USGS, and the European Space Agency (ESA), as well as coordination with data providers from Brazil, China, and the private sector. The site is accessible at www.fao.org/gtos/gofc-gold.
Programmatic Perspectives and Initiatives
Presenters during this session included: Dan Brown [University of Michigan]; Jeff Masek [GSFC]; Jiaguo Qi [MSU]; Pasha Groisman [National Oceanic and Atmospheric Administration (NOAA)/University Center for Atmospheric Research]; Brice Mora [GOFC-GOLD/ Wageningen University, Netherlands]; Krishna Vadrevu [UMD]; Jana Albrechtová [Charles University, Czech Republic]; Jiaguo Qi [MSU]; Rama Nemani, [ARC]; and Chris Justice [UMD].
Brown briefly summarized the NRC’s report on Land Change Modeling5. Most operational Land Change Models (LCMs) fall in between process identification challenged by equifinality (different processes produce similar patterns) and multifinality (same process pro-duces multiple patterns), while their projections are challenged by nonstationarity, complexity, and path dependence in processes. Remote sensing observational advances in temporal, spatial, and spectral details, as well as the extensive Landsat archive, create opportuni-ties in LCM research. These include advancement of process-based models, cross-scale integration of mod-els, cross-scale integration of LCMs with Earth system models, and bridging LCM optimization with design-based approaches.
Masek gave an update on Landsat-8 and collabora-tion with ESA’s Sentinel-2 Program. Landsat-8 cur-rently acquires approximately 550 of a possible ~850 land scenes per day, and continues to perform well. The Operational Land Imager (OLI) onboard Landsat-8 is meeting or exceeding all radiometric and geomet-ric performance requirements, while the Thermal Infrared Sensor (TIRS) is meeting most requirements. The planned MultiSpectral Instrument (MSI) onboard ESA’s Sentinel-2 spacecraft (scheduled for launch in 2015) will have a Level-1C (L1C) data product that is analogous to Landsat’s Level-1T (L1T) data. ESA will downlink and process between 800 and 900 GB of Sentinel-2 raw data per day. The USGS will pull L1C products from processing and archive centers for archive and distribution to ARC, Canada Center for Remote Sensing, and the general public. Sentinel data will be made available at no cost. NASA is investing in approaches to harness Sentinel-2 and Landsat data for land science to harmonize their surface reflectance products and develop products from the combined data. This will enable a frequency of moderate-resolu-tion satellite coverage of between two and three days, as opposed to the 16-day coverage available today.
A series a presentations then followed on the activi-ties of the LCLUC-related programmatic initia-tives of the Monsoon Asia Integrated Regional Study (MAIRS), Central Asian Regional Information Network (CARIN), Northern Eurasia Earth Science Partnership Initiative (NEESPI), GOFC–GOLD, the South/Central East European Regional Information Network (SCERIN), and the South Asia Research Initiative (SARI).
• MAIRS focuses on cross-cutting global change issues for monsoon Asia, developing links between research groups across the region and disciplines. The program is currently involved in promoting a Future Earth (FE) research initiative across Asia.
5 The full report can be accessed from the National Academies press at www.nap.edu/catalog.php?record_id=18385.

The Earth Observer July - August 2014 Volume 26, Issue 434m
eetin
g su
mm
arie
s • CARIN is pushing for Central Asian agricultural communities to codesign and coproduce knowl-edge for sustainable land and water management in a changing climate in FE Asia through research engagement, joint regional capacity building, and program coordination.
• NEESPI is an umbrella organization for over 165 individual research projects, with a combined annual budget close to 15 million U.S. dollars. In 2013–14, Russia, the U.S., and China funded a new set of NEESPI projects
• GOFC-GOLD (discussed previously in the Invited Presentations on International Programmatic Activities section) is a panel of the Global Terrestrial Observing System (GTOS). It recently published the GOFC-GOLD Reducing Emissions from Deforestation and Forest Degradation Plus (REDD+) sourcebook (www.un-redd.org/aboutredd/tabid/102614/default.aspx), which discusses meth-ods and procedures for monitoring and reporting anthropogenic GHG emissions and removals asso-ciated with deforestation, gains and losses of car-bon stocks in remaining forests, and forestation.
• SCERIN members work with regional forest and land management agencies to ensure continu-ous, high-quality observations and information products for operational and management appli-cation. This is done to facilitate feasible and sus-tainable natural resources management practices in Romania, Hungary, Bulgaria, Turkey, Poland, Slovakia, Czech Republic, and Ukraine.
• SARI is still in its development stage, but several researchers and regional organizations in India have already indicated interest, including the Indian Council of Agricultural Research (ICAR), Indian Institute of Tropical Meteorology (IITM), Indian Institute of Science (IISc), and National Remote Sensing Center (NRSC), and is planning to engage regional partners outside of India. The main goal of this activity is to develop an innova-tive research, education, and capacity-building program involving state-of-the-art remote sensing, natural sciences, engineering, and social sciences to enrich LCLUC science in South Asia.
Justice concluded this session with a report on the first joint workshop on “Frontiers in Earth Observation for Land System Science,” organized by the European Association of Remote Sensing Laboratories (EARSeL) Special Interest Group on Land Use and Land Cover and the NASA LCLUC program. Humboldt University in Berlin, Germany, hosted the meeting, at which 156 researchers from 32 countries discussed upcoming
opportunities and challenges in remote sensing. Keynote addresses highlighted the fact that land use and land cover monitoring is entering a new era, with Landsat-8 and the upcoming Sentinels flying at the same time as the opening of the Landsat archives. With new sen-sor constellations, new technologies of automated algorithms and faster processing, longer time series, and open image archives, this is truly exciting time to be involved in remote sensing for land change sci-ence. Good collaboration between NASA and ESA was emphasized as paramount in order to optimize scien-tific outcomes of these new opportunities, e.g., through common standards in preprocessing and data policies and exchange through joint scientific workshops.
LCLUC Synthesis Presentations
The two presentations in this session were made by Tatiana Laboda [UMD]; and Volker Radeloff [University of Wisconsin, Madison].
Laboda described results from a project on forested LCLUC in the Russian Far East and Central Siberia under the combined drivers of climate and socio-eco-nomic transformation. She noted that fire disturbance in the Russian Far East and Central Siberia is better quantified with coarser wide-swath, high-temporal-resolution sensors, such as the Advanced Very High Resolution Radiometer (AVHRR) and MODIS instru-ments. At the regional scale, fire disturbance is higher in mountainous regions and further east (i.e., Russian Far East and Irkutsk) but lowest in Central Siberia, where the most logging occurs. She closed her presen-tation by reporting that—while insufficient for map-ping selective logging at the landscape regional scale—Landsat data show that clear-cut logging has decreased over time in Central Siberia, with slight-to-large increases in deciduous forest regeneration. However, regeneration varies strongly, due to topology and cli-mate in the Russian Far East.
Radeloff presented some findings from synthesis of studies on institutional change and LCLUC effects on carbon, biodiversity, and agriculture after the collapse of the Soviet Union. Synthesis studies such as these enhance the conceptual underpinnings of LCLUC sci-ence and summarize state-of-the-art knowledge to advance our understanding of the processes, drivers, and impacts of changes in LCLUC. He noted that in post-Soviet times, hardwood (deciduous) forests came to constitute a major part of Russia’s exploitable forests because of over-harvesting of softwood and failure to renew forest resources under a centrally planned econ-omy. The resulting mismatch between available tech-nology suitable for softwood production and increasing availability of hardwood resources has become a hin-drance to effective timber harvesting.

The Earth Observer July - August 2014 Volume 26, Issue 4 35
mee
ting
sum
mar
iesUrban Inter-Disciplinary Studies (IDS) on
Environmental Impacts
Presenters during this session included: Son Nghiem [NASA/Jet Propulsion Laboratory]; Soe Myint [Arizona State University]; Douglas Stow [San Diego State University]; Geoff Henebry [South Dakota State University]; Lucy Hutyra [BU]; and Lahouari Bounoua [GSFC].
Soe described how spatial arrangements of paved sur-faces have various impacts on land surface temperature (LST). For example, clustered configurations of grass can significantly lower summer daytime LST, while clustered configurations of paved surfaces significantly elevate nighttime LST.
Henbry showed that seasonal snowfall may affect the satellite retrieval of nitrogen dioxide (NO2) column density in the winter over the midwestern U.S., as there were large discrepancies in winter NO2 columns as determined by the Ozone Monitoring Instrument (OMI) product and the Berkeley High Resolution (BEHR) project. The group is investigating causes of these discrepancies, as this feature had not been noted previously.
Stow focused on urban expansion, and described how pattern-based characterization of urban areas enables expanding the classic rural/urban definition of space. In Ghana, for example, detailed classification schemes of place enables identifying subtle differences in fertility levels of women within and between urban areas, such as spatial variability of fertility within cities.
Hutyra stated that although urban areas have ~50% less biomass compared to forested areas, observations from modeling LCLUC carbon dynamics show ~50% increase in per-tree productivity, i.e., trees in low-den-sity residential areas show higher biomass increment compared to preconversion from forest.
Bounoua showed that in the continental U.S., carbon lost to urbanization is estimated to be ~2%, whereas agriculture has increased carbon uptake by ~5%. While statistically distinct, these numbers are striking, consid-ering that agriculture represents about 32% [2.75 pet-agrams of Carbon (PgC)] of the total land area, whereas urbanization represents only 1% (0.003 PgC).
Summary and Conclusion
To recap, the meeting’s discussions raised concerns that the remote sensing community is not asking the right questions to mitigate climate change as there is still a gap in determining to what extent urban areas are contributing to emissions. Participants expressed high interest in participating and kick-starting LCLUC webinars as a means to expand the community and to increase program visibility. There was also strong sup-port of continuing and further expanding LCLUC international initiatives.
Garik Gutman closed the meeting, remarking that LCLUC will continue its international efforts under the Committee on Earth Observation Satellites (CEOS) on the land-surface imaging constellation, forming a Land Imaging Science Team, and developing preparatory studies using Sentinel-2 and Landsat-8 data in concert. Moving forward, the program will aim to continue bal-ancing LCLUC project calls thematically and geograph-ically in terms of the regional focus.
LCLUC spring Science Team Meeting participants.

The Earth Observer July - August 2014 Volume 26, Issue 436m
eetin
g su
mm
arie
s 2014 CLARREO Science Definition Team Meeting SummaryRosemary Baize, NASA’s Langley Research Center, [email protected] Wielicki, NASA’s Langley Research Center, [email protected] Richards, Science Systems and Applications, Inc., [email protected]
Introduction
The fifth meeting of the Climate Absolute Radiance and Refractivity Observatory (CLARREO) Science Definition Team (SDT) was held at NASA’s Goddard Space Flight Center (GSFC) in Greenbelt, MD, January 7-9, 20141. Over 40 investigators par-ticipated in the discussion, from institutions that included NASA Headquarters, NASA’s Langley Research Center (LaRC), GSFC, NASA/Jet Propulsion Laboratory (JPL), National Oceanic and Atmospheric Administration (NOAA), National Institute of Science and Technology (NIST), University of Wisconsin (UW), Harvard University (HU), University of Michigan, University of California-Berkeley (UC Berkeley), University of Maryland-Baltimore County (UMBC), University of Miami (UM), University of Colorado’s Laboratory for Atmospheric and Space Physics (LASP), Science Systems and Applications, Inc. (SSAI), McGill University (MU), and Imperial College (IC) in London. This article summarizes the highlights of the meeting; the full agenda and presentations can be found at clarreo.larc.nasa.gov/events-STM2014-01.html.
Advances in CLARREO’s High-Accuracy Instruments
As was reported at the last SDT meeting, held at LaRC in April 2013, NASA’s Earth Science 1 For a summary of the fourth CLARREO SDT, refer to the July-August 2013 issue of The Earth Observer [Volume 25, Issue 4, pp. 47-49].
Technology Office (ESTO2) has funded efforts to develop a prototype of CLARREO’s infrared instru-ment. Developed at UW, the Absolute Radiance Interferometer (ARI)—see Figure 1—has undergone vacuum testing with end-to-end verification tests, bringing the instrument to a Technology Readiness Level (TRL3) of 6. Results obtained in the range between the 700 to 900 cm-1 band and the 400 to 500 cm-1 band successfully demonstrated CLARREO’s ability to meet the specified 0.07 K sensitivity (95% confidence interval), which is needed to achieve cli-mate change absolute accuracy in orbit.
This past year, NIST completed peer reviews of both the infrared (IR) and reflected solar (RS) Calibration Demonstration Systems (CDS), documenting the progress made in reducing CLARREO’s International System of Units (SI)-traceable risk. The SOlar, Lunar for Absolute Reflectance Imaging Spectroradiometer (SOLARIS) RS CDS was deployed in the field for a once-in-a-lifetime opportunity (i.e., Landsat 8 had recently been positioned in orbit) to make coincident calibration measurements with Landsat 7 and 8. 2 To learn more, see “ESTO: Benefitting Earth Science Through Technology” in the May–June 2013 issue of The Earth Observer [Volume 25, Issue 3, pp. 22-29].3 There are 9 technology readiness levels. To learn about the requirements for each level, read esto.nasa.gov/files/trl_defini-tions.pdf.
Figure 1. Shown here is the UW Absolute Radiance Interferometer (ARI) Prototype with On-orbit Verification and Test System (OVTS) technolo-gies in thermal vacuum test-ing. The prototype features an On-orbit Absolute Radiance Standard (OARS) cavity black-body, On-orbit Cavity Emissivity Module (OCEM), On-orbit Spectral Response Module (OSRM), and calibrated black-bodies: the ambient blackbody (ABB) and the hot blackbody (HBB). Image credit: UW

The Earth Observer July - August 2014 Volume 26, Issue 4 37
mee
ting
sum
mar
ies
ESTO-funded efforts also enabled a high-altitude balloon flight of the LASP-built Hyperspectral Imager for Climate Science (HySICS), which took place September 29, 2013. The flight demonstrated HySICS’s experimental techniques and ability to acquire sample measurements.
Observing System Simulation Experiments—CLARREO-like Datasets Show Ability to Discriminate between Climate Models
Since the last SDT meeting, significant progress has been made on faster Principal Component-based Radiative Transfer Models (PCRTM), which enable the development of CLARREO Observation System
Simulation Experiments (OSSEs) using a diverse set of climate models found in the Coupled Model Intercomparison Project 5 (CMIP5) archive. Work conducted by UC Berkeley and LaRC show PCRTM achieved a 25-to-30-fold processing speed increase for longwave (LW) and shortwave (SW) radiation cal-culations over MODerate-resolution atmospheric TRANsmission (MODTRAN) processing. This foun-dational work has enabled a larger number of simula-tions, permitting more-comprehensive examination of the signatures of climate change and—most impor-tantly—differentiation between climate models.
Recent results from UC Berkeley’s work, comparing climate models with CLARREO-like datasets to deter-mine how long of an observational record is needed to detect changes in the climate system, suggest that a 10-year record of outgoing longwave radiation (OLR) can differentiate between high- and low-sensitivity climate models—see Figure 2. Additional work is planned to determine how long of an observational record is required to distinguish between low- and mid-sensitivity models.
This topic generated a great deal of discussion on how OSSEs can be used to inform the next NASA Earth Science Decadal Survey (planned for 2017), i.e., focusing on the advances in computational power and the ability of models to get to finer and finer spatial resolution.
Cross-Validation of Climate Products—Realizing Greater Value from Existing Sensors
Researchers at UW have matched Global Positioning System (GPS) Radio Occultation (RO) and IR geo-located datasets to enable a quantitative assessment of
The LASP-built HySICS collected radiance data for almost four hours while carried onboard a high-altitude balloon. Data will be used to improve the measurement, specifically the algorithms used to pro-cess the data. This beautiful image was taken in the early morning hours of September 29, 2013 as the sun rose over Fort Sumner, NM, and the balloon was being inflated with helium for its flight. Image credit: HySICS Team-LASP
Figure 2. All-sky OLR trends per decade as calculated by two climate models: the U.K. Meteorological Office’s Hadley Centre Global Environment Model version 2 (HadGEM ES2) [top left] and the Japanese Model for Interdisciplinary Research on Climate (MIROC5) [top right]. The bottom left image shows the differ-ence between the two models; the bottom right image depicts how long it takes in years to detect a dif-ference in trends for the two mod-els. The results show that OLR can be detected with less than 10 years of continuous data. Image credit: UC Berkeley

The Earth Observer July - August 2014 Volume 26, Issue 438m
eetin
g su
mm
arie
s
the consistency between these two independent and SI-traceable measurements. The approach shows prom-ise in estimating unbiased measurement uncertainty for combined GPS/IR datasets, with accuracies suitable for detecting temperature trends in the upper tropo-sphere–lower stratosphere (UTLS) region. A compari-son of 2011 Antarctic temperature profiles between GPS-RO data retrieved from the joint U.S.–Taiwanese Constellation Observing System for Meteorology, Ionosphere, and Climate (COSMIC) and IR data from the Atmospheric Infrared Sounder (AIRS) onboard Aqua, show excellent agreement.
A study comparing retrieved temperatures from the Atmospheric Infrared Sounder (AIRS) onboard Aqua, the Cross-track Infrared Sounder (CrIS) onboard the Suomi National Polar-orbiting Partnership, and the Infrared Atmospheric Sounding Interferometer (IASI) onboard the European Space Agency’s MetOp satel-lite showed deviations in the annual means of the three instruments. Five-year statistics show that AIRS dif-fers from IASI by -0.7 K at 300 hPa and +0.34 K at 850 hPa—see Figure 34. The results point to the need for a common, absolute, on-orbit reference—which CLARREO would provide.
Progress on a Multi-Instrument InterCalibration (MIIC) framework to support low-Earth-orbit–(LEO)–geostationary-Earth-orbit (GEO) and LEO-LEO inter calibration was discussed. The MIIC Framework
4 Note: Colocated Global Data Assimilation System (GDAS) profiles indicate that 50% of this difference is due to the time-of-day difference.
leverages the Open-source Project for a Network Data Access Protocol (OPeNDAP) network protocol and server-side functions to efficiently acquire matched event data from within large volumes housed at remote data centers.
Next Steps and Moving Forward
The meeting concluded with a discussion of the next steps that the CLARREO SDT needs to take, which include:
• Continuing to advance the science by publishing key journal papers on CLARREO orbit sampling, IR and RS intercalibration sampling, Instrument Incubator Program (IIP) and CDS calibration methods and accuracy levels, and the economic value of higher-accuracy climate observations, such as will be obtained with CLARREO;
• synthesizing a summary report of the progress made to-date on CLARREO, with inputs from the SDT;
• hosting a discussion with members from the obser-vation and climate modeling communities to dis-cuss strategic planning efforts for observations needed to improve climate models; and
• refining accuracy and cost requirements by carry-ing out an Instrument Design Lab (IDL) session at LaRC in August 2014, and a Mission Design Lab (MDL) in September 2014 at GSFC.
The next CLARREO SDT meeting will take place in Hampton, VA, in October 2014.
Figure 3: Comparison of the AIRS, CrIS, and IASI-Global Data Assimilation System show the deviation in annual tempera-ture means of the three instru-ments. Red shades represent higher than average tempera-tures, while blue shades represent lower than average temperatures. These results show the need to cross-calibrate satellites in orbit (which CLARREO will do) to eliminate biases in instrument-dependent climate variables. Image credit: UW

The Earth Observer July - August 2014 Volume 26, Issue 4 39
in th
e ne
wsNASA Launches Earth Science Challenges with
OpenNEX Cloud DataSarah Ramsey, NASA Headquarters, [email protected] Cole, NASA Headquarters, [email protected]
EDITOR’S NOTE: This article is taken from nasa.gov. While it has been modified slightly to match the style used in The Earth Observer, the intent is to reprint it with its original form largely intact.
NASA is launching two challenges to give the public an opportunity to create innovative ways to use data from the agency’s Earth science satellites.
Both challenges will use the Open NASA Earth Exchange (OpenNEX), a data, supercomputing, and knowledge platform where users can share modeling and analysis codes, scientific results, knowledge, and exper-tise to solve big data challenges in the Earth sciences. A component of the NASA Earth Exchange, OpenNEX provides users a large collection of climate and Earth science satellite datasets, including global land surface images, vegetation condi-tions, climate observations, and climate projections.
“OpenNEX provides the general public with easy access to an integrated Earth science compu-tational and data plat-form,” said Rama Nemani [NASA’s Ames Research Center—NEX Project Principal Scientist]. “These challenges allow citizen sci-entists to realize the value of NASA data assets and offers NASA new ideas on how to share and use that data.”
The first ideation stage of the challenge, which runs July 1 through August 1, 2014, offers as much as $10,000 in awards for ideas on novel uses of the datasets. The second builder stage, beginning in August, will offer between $30,000 and $50,000 in awards for the development of an applica-tion or algorithm that promotes climate resilience using the OpenNEX data, based on ideas from the first stage of the challenge. NASA will announce the overall chal-lenge winners in December.
NASA’s OpenNEX challenge addresses a number of White House initiatives, including Open Data, Big Data, and Climate Data. These initiatives advance national goals to address climate change impacts on economic growth, health, and livelihood, and include the use of competitions and challenges to foster regional innovation.
“NASA is an innovation leader in developing high-qual-ity data covering all parts of our planet that can be used to make a difference in people’s lives,” said Tsengdar Lee [NASA Headquarters—High End Computing Program Manager]. “NASA is committed to sharing that knowl-edge freely with the global community.”
NASA’s Center of Excellence for Collaborative Innovation (CoECI) manages these challenges. CoECI was established in coordination with the Office of Science and Technology Policy to advance NASA’s
open innovation efforts and extend that expertise to other federal agencies. The challenges are released on the NASA Innovation Pavilion, one of the CoECI plat-forms available to NASA team members, through its contract with InnoCentive, Inc.
To educate citizen scientists on how the data on OpenNEX can be used, NASA is releasing a series of online video lectures and hands-on lab modules. To view this material, and for information on registering for the challenges, visit nex.nasa.gov/OpenNEX.
OpenNEX is hosted on the Amazon Web Services (AWS) cloud and available to the public through a Space Act Agreement. .
NASA satellite data incorporated into OpenNEX include global views of drought conditions. This map shows conditions from July 2012; Green regions indicate areas that have more vegetation than “average”(looking at all Julys from 2000 to 2013); Red regions have less vegetation than average. Regions in black have no data due to clouds and snow; white regions are desert. Image credit: NASA Earth Exchange (NEX)

The Earth Observer July - August 2014 Volume 26, Issue 440in
the
new
s New NASA Images Highlight U.S. Air Quality ImprovementKathryn Hansen, NASA’s Goddard Space Flight Center/Wyle Information Systems, [email protected]
EDITOR’S NOTE: This article is taken from nasa.gov. While it has been modified slightly to match the style used in The Earth Observer, the intent is to reprint it with its original form largely intact.
Anyone living in a major U.S. city for the past decade may have noticed a change in the air. The change is apparent in new NASA satellite images unveiled recently that demonstrate the reduction of air pollution across the country—see Figure 1.
After ten years, researchers have collected enough data from the Ozone Monitoring Instrument (OMI) onboard Aura to conclusively show that people in major U.S. cities are breathing less nitrogen dioxide (NO2)—a yellow-brown gas that can cause respiratory problems.
NO2 is one of the six common pollutants regulated by the U.S. Environmental Protection Agency (EPA) to
protect human health. Alone it can impact the respira-tory system, but it also contributes to the formation of other pollutants including ground-level ozone and par-ticulates, which also carry adverse health effects. The gas is produced primarily during the combustion of gaso-line in vehicle engines and coal in power plants. NO2 is also a proxy for the presence of air pollution in general.
Air pollution has decreased even though population and the number of cars on the roads have increased. The shift is the result of regulations, technology improve-ments, and economic changes, scientists say.
In fact, about 142 million people still lived in areas in the U.S. with unhealthy levels of air pollution, accord-ing to the EPA. Also, high levels of air pollution remain
an issue in many other parts of the world, according to the global view from satellites.
“While our air quality has certainly improved over the last few decades, there is still work to do—ozone and particulate matter are still problems,” said Bryan Duncan [NASA’s Goddard Space Flight Center (GSFC)—Aura Deputy Project Scientist].
Decision makers and regulatory agencies like the EPA have long relied on data from ground sites to inform air quality science and forecasts. NASA, while not directly involved with regulation or making forecasts, provides a consistent, global, space-based view—not
possible from any other source—of when and where air pollution occurs.
Another ongoing effort by NASA to study air quality is DISCOVER-AQ1, a multi-year airborne mission flying this summer in Denver, CO, to learn more about how the wide range of air pollutants viewed from satellites relates to what’s happening close to the ground where people live and breathe. The mission flew previously in 2011 over Baltimore, MD and Washington, DC; in 2013 over the San Joaquin Valley, CA; and in 2013 over Houston, TX. 1 DISCOVER-AQ stands for Deriving Information on Surface Conditions from Column and Vertically Resolved Observations Relevant to Air Quality. For more information, visit discover-aq.larc.nasa.gov.
Low High
Figure 1. These images show averaged yearly tropospheric column concentrations of NO2 across the U.S. in 2005 [left] and 2011 [right] as detected by OMI. Image credit: NASA Goddard’s Scientific Visualization Studio/T. Schindler

The Earth Observer July - August 2014 Volume 26, Issue 4 41
in th
e ne
ws
“You can’t control what you don’t measure,” said Russ Dickerson [University of Maryland, College Park], member of the NASA Air Quality Applied Sciences Team that was created in 2011 by the NASA Applied Sciences Program to serve the needs of U.S. air quality management through the use of Earth Science satellite data, suborbital, and models. “NASA measurements of air quality have value to the people with the authority to control emissions and develop policy.”
The new NASA images take a close up look at the Ohio River Valley (see Figure 2), Northeast Corridor, and several populous U.S. cities like Los Angeles, CA and New York, NY—see Figures 3 and 4, respectively. They show how NO2 concentrations during spring and sum-mer months, averaged from 2005 to 2007, compare to
the average from 2009 to 2011. Measurements of NO2 from OMI depict the concentration of the gas through-out a column of air in the troposphere, Earth’s lowest atmospheric layer. The images are color-coded: light shades denote lower concentrations and dark shades denote higher concentrations, ranging from 1x10¹⁵ to 5x10¹⁵ mol/cm2, respectively. To view the full collection of images, visit svs.gsfc.nasa.gov/goto?11579.
Low High
Figure 2. These images compare averaged yearly NO2 concentrations over the Ohio River Valley region from 2005 [left] to 2011 [right]. Image credit: NASA Goddard’s Scientific Visualization Studio/T. Schindler
Figure 3. Satellite data from OMI show that the Los Angeles and San Diego, CA area has seen a 40% decrease in NO2 concentrations between the 2005-2007 [left] and 2009-2011 [right] periods. Image credit: NASA Goddard’s Scientific Visualization Studio/T. Schindler
Figure 4. Satellite data from OMI show that New York, NY has seen a 32% decrease in NO2 concentrations between the 2005-2007 [left] and 2009-2011 [right] periods. The city tops the charts in terms of U.S. population, which usually means more air pollution. Even here, however, the air is on the mend. Image credit: NASA Goddard’s Scientific Visualization Studio/T. Schindler
Acknowledgment: Atmospheric scientists Yasuko Yoshida, Lok Lamsal, and Bryan Duncan [all from GSFC] provided data used in the images that appear in this article.

The Earth Observer July - August 2014 Volume 26, Issue 442in
the
new
s QuikSCAT’s Eye on Ocean Winds Lives on with ISS-RapidScatRosalie Murphy, NASA/Jet Propulsion Laboratory, [email protected]
EDITOR’S NOTE: This article is taken from nasa.gov. While it has been modified slightly to match the style used in The Earth Observer, the intent is to reprint it with its original form largely intact.
June 19 marked the fifteenth anniversary of the launch of NASA’s Quick Scatterometer (QuikSCAT) mission, a satellite sent for a three-year mission in 1999 that continues collecting data. Built in less than 12 months, QuikSCAT has watched ocean wind patterns for 15 years and improved weather forecasting worldwide. Despite a partial instrument failure in 2009, it provides calibration data to international partners.
On this anniversary, the mission’s team is prepar-ing to calibrate the International Space Station Rapid Scatterometer (ISS-RapidScat), the successor that will maintain QuikSCAT’s unbroken data record. After its launch in a few months, ISS-RapidScat will observe ocean winds from the space station.
ISS-RapidScat was built in less than two years and at a fraction of its predecessor’s budget. Both missions
are testaments to ingenuity, craftsmanship, and speedy construction in the name of improving our understand-ing of Earth’s winds.
“Both ISS-RapidScat and QuikSCAT came about to react quickly to the failure of another spaceborne instru-ment,” said Ernesto Rodriguez [NASA/Jet Propulsion Laboratory (JPL)—ISS-RapidScat Project Scientist]. “What differentiates these missions is cost and risk: ISS-RapidScat had to be built with a fraction of the QuikSCAT budget, and the mission accepted a much riskier approach,” Rodriguez said. ISS-RapidScat was constructed primarily from QuikSCAT’s spare parts and will be the first scatterometer to berth on the ISS.
Scatterometers help scientists estimate the speed and direction of winds at the ocean’s surface by sending microwave pulses to Earth’s surface. Strong waves or ripples scatter the microwaves, sending some of them back toward the scatterometer. Based on the strength of this backscatter, scientists can estimate the strength and
direction of the wind at the ocean’s surface.
Scatterometer data are critical for observing global weather patterns. They also help ocean
fishermen decide where to fish, ship cap-tains choose shipping lanes, and research-
ers track hurricanes and cyclones, and monitor El Niño events.
This image created using data from SeaWinds onboard QuikSCAT shows ocean winds on
September 20, 1999. Orange areas show where winds are blowing the hardest and blue show rela-
tively light winds. Image credit: NASA

The Earth Observer July - August 2014 Volume 26, Issue 4 43
in th
e ne
ws“The usefulness of this wind measurement is enor-
mous,” said Jim Graf [JPL], who served as Project Manager for the QuikSCAT mission in the 1990s and is now the Deputy Director of JPL’s Earth Science and Technology Directorate. “One of the dominant factors in understanding the climate is to assess what is hap-pening in the ocean circulation. And one of the domi-nant factors in ocean circulation is the wind at the sur-face, which is what scatterometers measure.”
NASA launched its first scatterometer satellite in 1978 (onboard Seasat-A) and its second instrument, the NASA Scatterometer (NSCAT), on a Japanese satellite in 1996. Each lasted less than a year, but collected hundreds of times more data about ocean winds than ships or buoys and improved weather forecasts from the National Oceanic and Atmospheric Administration (NOAA).
Unfortunately, the spacecraft carrying NSCAT mal-functioned in 1997. Immediately, a team of JPL scien-tists and engineers raced to get a scatterometer satellite back into space.
“We had the idea that a partially developed space-craft bus could be mated with an advanced version of the instrument that was already under development, and we could get something up quickly. So we went to NASA, and they said, ‘Okay, let’s give it a shot, but we want you to be ready to go one year from the go-ahead,’” Graf said. “And so we took off running, and we didn’t stop for a whole year.”
In that year, Ball Aerospace & Technologies Corporation built the QuikSCAT satellite bus while JPL finished the new SeaWinds scatterometer instru-ment; the spacecraft launched in 1999. For the next decade, QuikSCAT made about 400,000 daily mea-surements of wind speed and direction. Over 15-mi (25-km) segments of ocean, its measurements were detailed enough to estimate average wind speed within 6 ft/s (2 m/s).
The SeaWinds instrument on QuikSCAT used a rotat-ing antenna to measure a swath of Earth’s surface 1118 mi (1800 km) wide—about the distance from Los Angeles, CA to Seattle, WA. As QuikSCAT flew, the rotations overlapped to cover more than 90% of Earth’s surface every day.
But by the end of 2009, long after the expected end of QuikSCAT’s mission, the lubricant coating the anten-na’s bearings dried up. Instead of tracing a round swath on Earth’s surface, it pointed straight down and only
watched the waves directly below it. Still, those data were sufficient to help calibrate newer satellites.
“Since 2009, we’ve been able to keep QuikSCAT oper-ating quite successfully,” said Rob Gaston [JPL—QuikSCAT Project Manager]. “We used QuikSCAT’s highly successful backscatter measurements, which were well understood and had demonstrated stability, as a calibration standard for many instruments, including other scatterometers.” The European Space Agency and Indian Space Research Organization have both used QuikSCAT data to calibrate scatterometers in the last five years.
QuikSCAT’s final task will be to calibrate its succes-sor, ISS-RapidScat. The satellite will continue collecting data until April 2015, when it will be decommissioned after nearly 16 years in orbit.
ISS-RapidScat, like QuikSCAT, was built in a fraction of the timeline for most missions. The two missions even share hardware: JPL engineers used SeaWinds test parts to build much of ISS-RapidScat, which also uses a rotating dish antenna.
ISS-RapidScat will launch onboard a SpaceX Dragon resupply mission scheduled for September 2014. Flying in the space station’s orbit means ISS-RapidScat will spend more time observing Earth’s tropics than previous scatterometer satellites, which orbited farther north and south.
“ISS-RapidScat will be able to, for the first time, map the evolution of winds as the day progresses, which is important for understanding how clouds and precipi-tation develop, especially in the tropics, which are key regions in Earth’s climate system,” Rodriguez said. “It will provide a common reference to tie all of these mea-surements together.”
Together with scatterometers managed by India and Europe, ISS-RapidScat will maintain the continuous climate record QuikSCAT began while adding its own unique perspective from orbit.
For more information about ISS-RapidScat and QuikSCAT, visit winds.jpl.nasa.gov/missions.

The Earth Observer July - August 2014 Volume 26, Issue 444N
ASA
ear
th s
cien
ce in
the
new
s
groups of scientists reported on May 12, 2014. If the findings hold up, they suggest that the melting could destabilize neighboring parts of the ice sheet and a rise in sea level of 10 ft (~3 m) or more may be unavoid-able in coming centuries. Global warming caused by the human-driven release of greenhouse gases has helped to destabilize the ice sheet, though other factors may also be involved, the scientists said. The rise of the sea is likely to continue to be relatively slow for the rest of the twenty-first century, the scientists added, but in the more distant future it may accelerate markedly. The West Antarctic ice sheet sits in a bowl-shaped depression, with the base of the ice below sea level. Warm ocean water is causing the ice sitting along the rim of the bowl to thin and retreat. As the front edge of the ice pulls away from the rim and enters deeper water, it can retreat much faster than before. In a new paper published in Geophysical Research Letters, a team led by glaciologist Eric Rignot [JPL/University of California, Irvine], used satellite and air-borne measurements to document an accelerating retreat over the past several decades of six glaciers draining into the Amundsen Sea region. With updated mapping of the terrain beneath the ice sheet, the team was able to rule out the presence of any mountains or hills significant enough to slow the retreat.
NASA Places Radar in North Carolina to Study Rain in Smokies, May 24; Washington Times. NASA placed two radars on land in Rutherford County, NC, for a science field campaign to study rainfall in the Great
Water Weight Used to Calculate the Amount of Snow in California with GPS, May 12; Scientific American. Water weighs about 8.3 pounds per gallon (1 kg/L). Now, scientists have developed a way to use water’s weight to measure just how much snow is covering mountains in the western U.S. In states like California, currently in the midst of a crippling drought, the more water managers know about how much snow is in the mountains, the better they can plan for the summer months ahead. More accurate information about such snowpack can help these managers and hydrologists plan for how to fill reservoirs, how much water they might have available during the dry season, and how dry the soils might be during fire season. They’ll also get a better fix on future levels of reservoirs for hydro-electric power generation. Donald Argus [NASA/Jet Propulsion Laboratory (JPL)], a research scientist and geophysicist, recently published a study outlining the new technique in the journal Geophysical Research Letters. If scientists know land height in summertime, and its height when snow covers it, they can use the difference to calculate how much snow is sitting on the mountains. The technique uses a dense network of global positioning system (GPS) sites scattered across the Western U.S.
Scientists Warn of Rising Oceans From Polar Melt, May 12; New York Times. A large section of the mighty West Antarctica ice sheet has begun falling apart and its continued melting now appears to be unstoppable, two
NASA Earth Science in the NewsPatrick Lynch, NASA’s Earth Science News Team, [email protected]
Thwaites Glacier in West Antarctic drains into the Amundsen Sea. Image credit: NASA

The Earth Observer July - August 2014 Volume 26, Issue 4 45
NA
SA e
arth
sci
ence
in th
e ne
wsSmoky Mountains. The campaign ran from May 1 until
June 15, 2014. “We have set up rain gauges and radars across the area to learn more about how weather and rain systems behave in the mountains,” said research scientist David Wolff [NASA’s Wallops Flight Facility]. The campaign was designed to validate data from the Global Precipitation Measurement (GPM) mission’s Core Observatory, which launched in February 2014. The science team expected to end the six-week cam-paign with detailed data to improve their understanding of both the fundamental sciences of mountain rainfall and how best to estimate rainfall using satellite obser-vations over remote and rugged regions. Scientists will use what they learn to improve weather predictions and flood warnings. Team members will take a break after the summer and are scheduled to travel to Seattle, WA, in 2015-16 to measure winter weather there.
NASA ‘Balloon Campaign’ Goes to Australia, May 26; International Business Times. NASA and the University of Wyoming teamed up with the Australian Bureau of Meteorology (BOM) in Darwin, Australia, for a balloon-based campaign designed to better understand the composition and behavior of volcanic plumes. The Kelud Ash (KlAsh) experiment involved launching a series of balloons to take measurements of volcanic emissions from Mt. Kelud in Indonesia. The volcano sent small droplets of sulfuric acid—as ash particles and sulfate aerosol—up to 15 mi (25 km) above Earth when it erupted in February this year. The campaign’s principal investiga-tor, Duncan Fairlie [NASA’s Langley Research Center], said, “The purpose is to better characterize particle sizes, composition, and optical properties from a rela-tively fresh volcanic plume in the stratosphere.” The two-week balloon campaign, which started on May 14, 2014, launched small balloon payloads over the Indian Ocean from the bushes of Darwin territory. Fairlie said the team sampled the volcanic plumes at an altitude of around 12 mi (20 km) in all flights.
*NASA Opens Earth Science Data, Cloud Computing to the Public as Part of New Contest, June 24; GigaOM.com. NASA has launched a new con-test for imagining and then building new uses for the space agency’s trove of Earth sciences data. The chal-lenge—actually two of them, broken down into the imagination and building stages—kicks off on July 1 and runs through November 15, 2014, and utilizes the Open NASA Earth Exchange (OpenNEX). The exchange’s datasets and informational material, as well as the computing resources for the challenge, are hosted on Amazon Web Services. This is not the first time NASA has opened its data to the public as part of a
challenge: It had previously partnered with TopCoder, a platform for crowd-sourced challenges, on a number of competitions. The OpenNEX challenge is being held in partnership with Innocentive. Although agencies such as NASA, other research institutions, and universities still maintain some of the smartest people and best tools in their respective fields, there is a growing acceptance of what is possible when the public can access certain types of data and the computing resources to analyze it. For example, teams or individuals with little subject-matter expertise but lots of general experience in build-ing predictive models routinely win competitions on Kaggle—an online platform for competitive data min-ing and modeling.
*See NASA’s Dazzling Proof that U.S. Air Quality Has Improved, June 27; Mashable.com. It is sum-mer in the U.S.—the time of year when the humid-ity skyrockets, air stagnates, and the air quality dete-riorates, especially downwind of the coal-fired power plants and manufacturing plants of the Ohio Valley. During hazy and hot summer days in the big cities along the I-95 corridor, the sky often looks like the visual equivalent of white noise—with the horizon indistinguishable from the milky sky. Yet air quality has actually been steadily improving over the past few years, largely thanks to the Clean Air Act, along with a drop in coal use and dramatic changes in vehicle fuel efficiency and emissions. NASA has released beautiful images demonstrating that people in major U.S. cities from Los Angeles, CA, to New York, NY, are breath-ing less nitrogen oxide. The data come from the Ozone Monitoring Instrument (OMI) aboard NASA’s Aura satellite. Nitrogen dioxide is one of the six common pollutants the EPA regulates to protect human health. It can harm the respiratory system and also combines with other pollutants to form smog. Nitrogen diox-ide is mostly produced by burning gasoline in vehicle engines and from burning coal. “While our air qual-ity has certainly improved over the last few decades, there is still work to do—ozone and particulate matter are still problems,” said atmospheric scientist Bryan Duncan [NASA’s Goddard Space Flight Center].
*See news story in this issue for more details.
Interested in getting your research out to the general pub-lic, educators, and the scientific community? Please contact Patrick Lynch on NASA’s Earth Science News Team at [email protected] and let him know of upcoming journal articles, new satellite images, or conference presen-tations that you think would be of interest to the readership of The Earth Observer.

The Earth Observer July - August 2014 Volume 26, Issue 446ed
ucat
ion
and
publ
ic o
utre
ach
upda
te NASA Science Mission Directorate – Science Education and Public Outreach UpdateTheresa Schwerin, Institute for Global Environmental Strategies, [email protected] Woroner, Institute for Global Environmental Strategies, [email protected]
SciJinks in a SNAP! Stormy Space Weather Video
Did you know that satellites keep track of space weather? Learn all about how and why in SciJinks’ video series: SciJinks in a Snap. These short animated videos and accompanying posters entertain viewers while providing an educational experience.
The first video in the series, titled “Stormy Space Weather,” describes why it’s important to monitor space weather and how the Geostationary Operational Environmental Satellite–R Series (GOES-R) satellite, scheduled for launch in 2015, will keep a close eye on Earth’s weather as well as space weather. To view the video and download the poster, visit scijinks.jpl.nasa.gov/space-weather-snap.
Ask NICE Is Going “On the Road”
Ask NASA Innovations in Climate Education (NICE) is going “On the Road” this summer to visit groups of teachers who connected with them for the online ses-sion that was offered during the 2013-2014 school year. Two onsite workshops will be offered during the first week of August to provide NASA Earth Systems Science training for middle and high school teachers. Many NASA resources will be explored and time will be spent learning how to collect and analyze data.
August 6—10:00 AM – 4:00 PM EDT; Institute for Advanced Learning and Research, Danville, VA
August 7—10:00 AM – 4:00 PM EDT; Lake Country Distance Education Center, Clarksville, VA
Links to recordings of the 2013-2014 online sessions can be found at the bottom of the page at nice.larc.nasa.gov/asknice.
For more information about the workshops and to reg-ister, please contact Bonnie Murray, at [email protected].
Explore Citizen Science with NASA Wavelength!
From helping to map the lunar surface to making ter-restrial cloud observations, citizen science is a great way for students to explore Earth and space science. NASA Wavelength, the online catalog of peer-reviewed Earth and space science resources, is covering some of their favorite citizen science projects in a new blog series.
Posts cover a range of projects that allow student par-ticipation at all levels. To read the entries in this series and more, please visit nasawavelength.org/blog/exploring-earth-citizen-science-observing-our-home-planet.
GEMS Curriculum Sequence Workshop for Elementary and Middle School Teachers
The Lawrence Hall of Science presents a workshop sequence for elementary and middle school teachers titled “A Medley of Summer 2014 GEMS Space and Ocean Sciences Curriculum Sequences Workshops, With a Special Emphasis on Argumentation.” Join edu-cators from across the country and learn about Great Explorations in Math and Science (GEMS). This work-shop offers flexible scheduling, with one-, two-, or three-day summer programming.
Registration Deadline—July 21 Date—August 6-8 Location—Lawrence Hall of Science, Berkeley, CA
To register and learn more about GEMS, please visit www.regonline.com/builder/site/Default.aspx?EventID=1381704.

The Earth Observer July - August 2014 Volume 26, Issue 4 47
scie
nce
cale
ndar
sEOS Science CalendarAugust 4–8, 2014 Precipitation Measurement Mission Science Team Meeting, Baltimore, MD. pmm.nasa.gov/meetings/all/2014-pmm-science-team-meeting
September 15–18, 2014 Aura Science Team Meeting, College Park, MD. acdb-ext.gsfc.nasa.gov/People/Witte
September 23–24 AMSR-E Science Team Meeting, Huntsville, AL. Contact: [email protected]
September 29–October 2, 2014 GRACE Science Team Meeting, Potsdam, Germany. www.csr.utexas.edu/grace/GSTM
October 28–31, 2014 Ocean Surface Topography Science Team Meeting, Lake Constance, Germany. www.ostst-altimetry-2014.com
November 3–7, 2014 CloudSat/CALIPSO Science Team Meeting, Greenbelt, MD. www.hou.usra.edu/meetings/cloudsat2014
Global Change CalendarAugust 2–10, 2014 40th COSPAR Scientific Assembly, Moscow, Russia. www.cospar-assembly.org
October 13–17, 2014 2014 Climate Symposium, Darmstadt, Germany. www.theclimatesymposium2014.com
October 19–22, 2014 Geological Society of American Annual Meeting,Vancouver, BC, Canada. community.geosociety.org/gsa2014/home
November 12–19, 2014 World Parks Congress, Sydney, Australia. worldparkscongress.org
November 13–14, 2014 GEO-XI Plenary, Libreville, Estuaire, Gabon. climate-l.iisd.org/events/geo-xi
December 1–12, 2014 20th Conference of Parties (COP-20), Lima, Peru. unfccc.int/meetings/rio_conventions_calendar/items/2659.php?year=2014
December 15–19, 2014 American Geophysical Union Fall Meeting, San Francisco, CA. meetings.agu.org
January 4–8, 2015 American Meteorological Society Annual Meeting, Phoenix, AZ. annual.ametsoc.org/2015

Code 610 National Aeronautics and Space Administration
Goddard Space Flight Center Greenbelt, MD 20771
Official Business Penalty for Private Use: $300
PRSRT STD Postage and Fees Paid National Aeronautics and Space Administration Permit 396
(affix mailing label here)
eos.nasa.govThe Earth Observer
The Earth Observer is published by the EOS Project Science Office, Code 610, NASA’s Goddard Space Flight Center, Greenbelt, Maryland 20771, telephone (301) 614-5561, FAX (301) 614-6530, and is available in color at eospso.nasa.gov/earth-observer-archive. Black and white hard copies can be obtained by writing to the above address.
Articles, contributions to the meeting calendar, and suggestions are welcomed. Contributions to the calendars should contain loca-tion, person to contact, telephone number, and e-mail address. Newsletter content is due on the weekday closest to the 15th of the month preceding the publication—e.g., December 15 for the January–February issue; February 15 for March–April, and so on.
To subscribe to The Earth Observer, or to change your mailing address, please call Cindy Trapp at (301) 614-5559, or send a message to [email protected], or write to the address above. If you would like to stop receiving a hard copy and be noti-fied via email when future issues of The Earth Observer are available for download as a PDF, please send an email with the sub-ject “Go Green” to [email protected]. Your name and email address will then be added to an electronic distribution list and you will receive a bi-monthly email indicating that the next issue is available for download. If you change your mind, the email notification will provide an option for returning to the printed version.
The Earth Observer Staff
Executive Editor: Alan B. Ward ([email protected])
Assistant/Technical Editors: Heather H. Hanson ([email protected]) Mitchell K. Hobish ([email protected])
Technical Editor: Ernest Hilsenrath ([email protected])
Design, Production: Deborah McLean ([email protected])
Printed on Recycled Paper NP-2014-1-116-GSFC