the dual nature of choice: when consumers prefer less to
TRANSCRIPT

The Dual Nature of Choice: When Consumers Prefer Less to More
Jayson Lusk
and
F. Bailey Norwood
Paper to be Presented at the Southern Association of Agricultural Economics Annual Meeting,
to be held in Mobile, Alabama, February 4-7, 2007

Abstract
Economists typically assume that more choice is better, and consumers are more
likely to purchase from a larger choice set. However, marketing and psychological
studies show this is not always the case. This paper reports results from experiments
designed to further investigate the so-called excessive-choice effect. First, we
investigate whether people would voluntarily reduce their choice set size. Second, we
investigate whether the excessive-choice effect, found in previous studies, is robust to
changes in experimental design. Third, we explore how personality influences
preferences for choice set size. Results show that the excessive-choice effect indeed
exists for some people, but on average people prefer greater choice.

1
I. INTRODUCTION
The standard economic model of the consumer assumes that utility is weakly increasing
in choice set size. If more choices are available, consumers can reconsider their
purchasing behavior, either discovering a consumption bundle yielding higher utility or
remaining at the old bundle and utility level. Despite the intuitive and logical appeal of
such a model of decision making, recent empirical evidence suggests it may be
unfounded.
In a widely publicized study, Iyengar and Lepper (2000) found that a larger
percentage of consumers purchased specialty jams and chocolates when presented with
a small number of varieties (i.e., 6) as opposed to a larger number (i.e., 24 or 30) and that
students were more likely to complete an extra credit essay assignment when given 6
essay topics as opposed to 30. Schwartz (2004a) also found that employees are more
likely to invest in 401(k) retirement plans when offered fewer funds to choose among.
Further, several studies have found that a lower assortment size either increases or does
not significantly change supermarket sales (e.g., Boatwright and Nunes, 2001;
Broniarczyk, Hoyer, and McAlister, 1998; Dreze, Hoch, and Purk, 1994). Not only are
consumers less likely to make a purchase from a larger choice set, they are often less
satisfied after consuming a good chosen from a larger choice set (e.g., Iyengar and
Lepper, 2000). The phenomenon uncovered by these studies is termed here as an

2
excessive choice effect, where greater choice either does not change or lowers the expected
utility of a choice opportunity.
The excessive choice effect has important implications for firm behavior,
economic theory and public policy. For example, psychologists have interpreted the
excessive choice effect as a motivation for public policy to reduce freedom of choice.
For example, Schwartz argues (2004b, p. 71), “As the gross domestic product more than
doubled in the past 30 years, the proportion of the population describing itself as “very
happy” declined by about 5 percent, or by some 14 million people...Of course, no one
believes that a single factor explains decreased well-being, but a number of findings
indicate that the explosion of choice plays an important role.” Elsewhere, Schwartz
concludes that “unduly influenced by the ideology of economics and rational-choice
theory, modern American society has created an excess of freedom, with resulting
increases in people's dissatisfaction with their lives and in clinical depression. One
significant task for a future psychology of optimal functioning is to deemphasize
individual freedom and to determine which cultural constraints are necessary for
people to live meaningful and satisfying lives” (Schwartz, 2000, abstract).
Although economics is often described as the study of constrained choice,
economists have been surprisingly silent on the excessive-choice effect. The excessive-
choice effect need not contradict standard economic models if search costs are non-
negative (Norwood, 2006); however, a better understanding of individuals’ preferences

3
for freedom of choice is needed, especially in light of the broad reaching implications
being drawn by some regarding the relationship between societal welfare and the
excessive-choice effect.
Although the aforementioned evidence suggests that the optimal choice set size
is finite, it is unclear whether subjects are aware of the excessive-choice effect. While
consumers are apparently less likely to make a purchase from a larger choice set, it is an
entirely different question as to whether an individual would voluntarily reduce the
size of a choice set with no compensation. If individuals believe more choice is always
better, but simultaneously shy away from large choice sets, public policies aimed at
reducing choice as a means to increase well-being are unlikely to be successful.
Economists frequently appeal to the notion of revealed preference in that an individual
makes a choice of one good over another if it improves their utility. If subjects
voluntarily prefer less choice to more, this provides a clear indication that the excessive-
choice effect exists.
In addition to the issue of whether the excessive-choice effect is a result of overt
cognitive processes, it is unlikely that the effect is omnipresent for all consumers. It has
been suggested that preferences for choice set size interacts with personality (e.g.,
Schwartz et al., 2004a and Schwartz, 2004b). No study to the authors’ knowledge has
tested how personality interacts with individual behavior when presented with a
different number of choices. Clearly, such a finding would have important
4
ramifications for how economists should incorporate the excessive choice effect into
micro-economic models of individual decision making.
In this paper, we conduct several experiments delving further into the excessive
choice effect by investigating individuals’ willingness to voluntarily reduce choice set
size and to determine the degree of heterogeneity in the excessive-choice effect. In our
first experiment, individuals were simply asked to make a choice between two choice
sets that differed in the number of varieties of a specialty soda. In the second
experiment individuals chose between choosing one specialty soda out of a choice set
and two dollars in cash, where the soda choice set size was varied from 6 to 24. In our
final experiment, individual were given the right to choose a soda from a set of
specialty sodas, and we elicited individuals’ selling prices for the choice, again varying
the choice set size from 6 to 24. Results suggest that the psychological and economic
literatures are not in conflict. As the psychological evidence suggests, some individuals
do indeed prefer less choice to more. However, consistent with the assumption of most
economic models, on average subjects preferred more choice to less. Descriptions of the
experiments and associated results follow; the last section provides a summary and
further comments.
II. A SIMPLE QUESTION OF CHOICE
Previous studies have documented cases where consumers are more likely to purchase
an item from a small choice set than from a large choice set, suggesting the optimal
5
choice set may not be the largest. Individuals may be able to directly indicate how
many choice options they prefer. However, it may be that people say they prefer large
choice sets, but are less likely to purchase from large choice sets, suggesting that the
excessive-choice effect is a subconscious phenomenon. Some evidence for this
hypothesis exists. For example, Iyengar and Lepper (2000) found that grocery shoppers
were more attracted to tasting booths for exotic jams when 24 varieties were present
instead of 6. Despite this, a larger percentage of consumers purchased from a choice of
6 varieties compared to 24.
To investigate this issue, a simple experiment was conducted with 48 students
enrolled in an undergraduate economics class. Students were informed they would be
given a free drink upon exiting class and turning in an exam. The drink was a variety
of Jones Soda, a specialty soda made in Seattle, Washington that sells for about $1.70 in
stores like Panera Bread. This particular soda was chosen because students, in this
college town, could not easily purchase this brand of soda outside the experiment and
because there are about 28 varieties, all with distinct flavors.
Students were told that the drinks would be outside the classroom displayed on
a table. On one side of the table were 24 Jones Soda varieties, and on the other side
were 6 varieties. Before leaving the classroom, the students were asked to indicate
whether they would like to choose their soda from the set of 24 or the set of 6 (or they
could choose not to accept a drink at all). Subjects had to make their decision prior to
6
observing the sets and students were not allowed to change their answer once they left
the classroom. Furthermore, they were informed that the particular items included in
the smaller choice set were randomly selected from the larger set. Since the students
took an exam this day, their exit from the classroom was staggered, eliminating the
possibility that some might choose the smaller choice set to avoid long lines.
Of the 48 students present, 3 opted not to accept a drink, and 19 elected to choose
from the limited choice set of 6 varieties, instead of the larger choice set of 24 varieties.
Thus, of those who accepted the free drink, 42% preferred the smaller choice set. While
more choice was preferred to less on average, a significant portion preferred less choice.
This simple experiment is quite revealing. Previous studies have relied on
observed purchase rates between large and small choice sets to make inferences about
the excessive choice effect. To our knowledge, this study provides the first
demonstration that a non-negligible fraction of the population might voluntarily reduce
freedom of choice. Apparently, the excessive-choice effect is not just a subconscious
phenomenon, less choice can be better for some people and these people willingly
reduce the size of their choice set, knowing full well that such a reduction would result
in a lower probability of them finding a most preferred variety.
III. CHOICE SET SIZE AND PURCHASING BEHAVIOR
As mentioned, several previous studies have documented cases where subjects were
more likely to make a purchase from a small choice set than a large choice set. This
7
implies that expanding the choice set size may decrease the expected utility of a choice
opportunity. Since this would contradict the standard economic model of the
consumer, it is important that similar experiments be conducted to determine the
robustness of the excessive-choice effect.
Our second experiment is based loosely on the three experiments reported in
Iyengar and Lepper (2000) where subjects were allowed to choose an item at a cost.
Their choice set sizes varied across subjects from 6 to 24-30. In all three experiments a
higher percentage of subjects purchased from the small choice set. Our experimental
design is purposefully different in many respects from that in Iyengar and Lepper
(2002). If the excessive choice effect is a pervasive phenomenon that should be
incorporated in economic models, the effect should be robust to a variety of settings.
In this experiment, we again use specialty soda as the good of interest. A booth
was set up in the lobby of a campus building and students passing by were offered $5
and a free gift to participate in an economic experiment. On a table were varieties of the
Jones Sodas, described in the previous section. Subjects were given the choice of one
free soda from the varieties shown or $2 in cash. Students were randomly assigned to
one of two treatments. In one treatment, subjects were given a choice of 6 varieties and
in the other treatment 24 varieties were available. The particular items in the small and
large choice set were randomly interchanged to prevent the influence of one potential
vareity.1

8
A total of 155 individuals participated; 65 presented with 6 varieties and 90 with
24 varieties. When faced with 24 soda varieties, 30% chose the soda, compared to 12%
of those presented with 6 varieties (see table I). T-tests indicate these differences are
statistically significant at the 1% level.
In our experiment, more choice was better. These results contrast with the
findings of Iyengar and Lepper (2000). In their study of specialty jams, Iyengar and
Lepper (2000) found that only 3% of consumers purchased when 24 jam varieties were
available whereas 30% purchased from the limited offering of 6 jam varieties. These
findings suggest the excessive choice effect may not be as robust as argued by some.
IV. CHOICE AND PERSONALITY
The two previous experiments documented that while some individual might prefer
smaller to larger choice sets, on average, subjects in our study preferred more choice to
less. Psychological research has documented how personality differences can lead to
different preferences for choice set size. In particular, Schwartz et al. (2002) argued that
people tend to exhibit either “maximizer” or “satisficer” character traits.
At one end of the personality spectrum are maximizers, who seriously consider
all the alternatives, strive to make the optimal choice, and frequently revisit their choice
to determine whether it was indeed optimal. At the other end are satisficers, who set
standards for what they want and make their selection when those standards are met,
regardless of whether all options have been considered. Satisficers also seek goods that
9
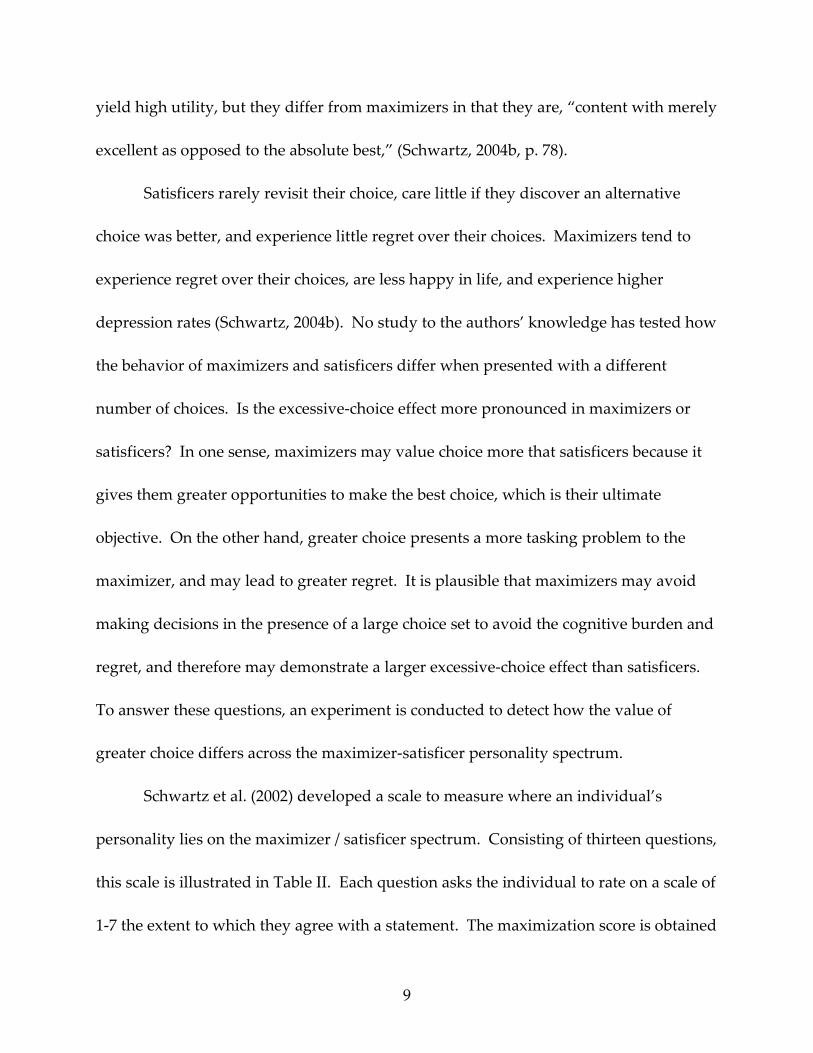
yield high utility, but they differ from maximizers in that they are, “content with merely
excellent as opposed to the absolute best,” (Schwartz, 2004b, p. 78).
Satisficers rarely revisit their choice, care little if they discover an alternative
choice was better, and experience little regret over their choices. Maximizers tend to
experience regret over their choices, are less happy in life, and experience higher
depression rates (Schwartz, 2004b). No study to the authors’ knowledge has tested how
the behavior of maximizers and satisficers differ when presented with a different
number of choices. Is the excessive-choice effect more pronounced in maximizers or
satisficers? In one sense, maximizers may value choice more that satisficers because it
gives them greater opportunities to make the best choice, which is their ultimate
objective. On the other hand, greater choice presents a more tasking problem to the
maximizer, and may lead to greater regret. It is plausible that maximizers may avoid
making decisions in the presence of a large choice set to avoid the cognitive burden and
regret, and therefore may demonstrate a larger excessive-choice effect than satisficers.
To answer these questions, an experiment is conducted to detect how the value of
greater choice differs across the maximizer-satisficer personality spectrum.
Schwartz et al. (2002) developed a scale to measure where an individual’s
personality lies on the maximizer / satisficer spectrum. Consisting of thirteen questions,
this scale is illustrated in Table II. Each question asks the individual to rate on a scale of
1-7 the extent to which they agree with a statement. The maximization score is obtained

10
by summing the ratings across all thirteen questions. The minimum possible score is 13
and the maximum is 91. The higher the score, the more one resembles a maximizer and
the less one resembles a satisficer. As a rule of thumb, a score of 65 or higher indicates a
maximizer and a score of 40 or lower identifies satisficers (Schwartz, 2004b).
To investigate whether these personality traits interact with the excessive choice
effect, we conducted another experiment similar that that described in the previous two
sections. In particular, a booth was set up in the lobby of a campus building and
students passing by were offered $5 and a free gift to take a survey and participate in an
economic experiment. On a table were varieties of the Jones Sodas.
Participants were asked to complete a short survey that contained the thirteen
questions to measure where each individual lies on the maximizer / satisficer spectrum,
plus a question regarding gender. After completing the survey, students were given a
choice of one Jones’ Sodas from a choice set, where the choice set size varied randomly
across individuals from 6 to 24. Subjects were given the opportunity to sell their choice
using the Becker-DeGroot-Marschak (BDM) mechanism.
Subjects were asked to indicate the minimum price at which they would forego
their soda choice. After this price was stated, individuals drew a random number from
a hat. The random numbers ranged $0.10 to $4.00 in increments of $0.10. If the selected
random number was greater than or equal to the individual’s stated selling price, they
sold their choice at a price equal to the random number, otherwise, they chose a soda

11
from the varieties (either 6 or 24) on the table. The survey instrument explained that the
best strategy was to submit a selling price equal to the minimum price subjects were
willing to accept to give up their soda choice.
The BDM Mechanism is incentive compatible, meaning individuals have a
dominant strategy to submit a selling price equal to their value of the soda choice.
Some individuals were given a choice of 24 varieties, and others only 6 varieties.2 If the
average bid is higher or not statistically different under the 24 variety scenario, the
average individual prefers more choice to less, and the excessive choice effect
hypothesis is rejected. In this experiment, subjects revealed both their maximization
score and the exact value of their soda choice, allowing one to calculate the excessive
choice effect as a function of the maximization score.
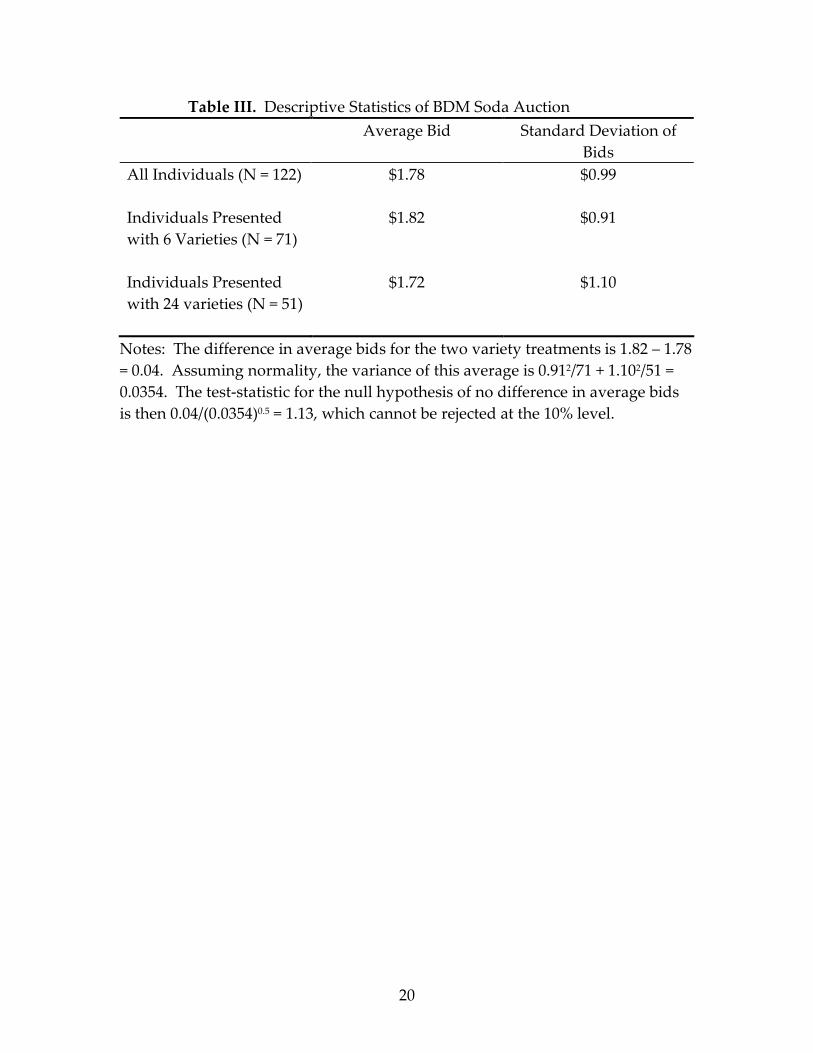
A total of 122 individuals participated in the experiment; 71 facing 6 varieties
and 51 facing 24 varieties. As table III shows, the average bid of $1.82 for those facing 6
varieties is greater than the average bid of $1.72 for those presented with 24 varieties.
However, t-tests reveal this difference is not statistically different from zero at the 5% or
10% level. More choice neither increased nor decreased the value of the choice
opportunity.
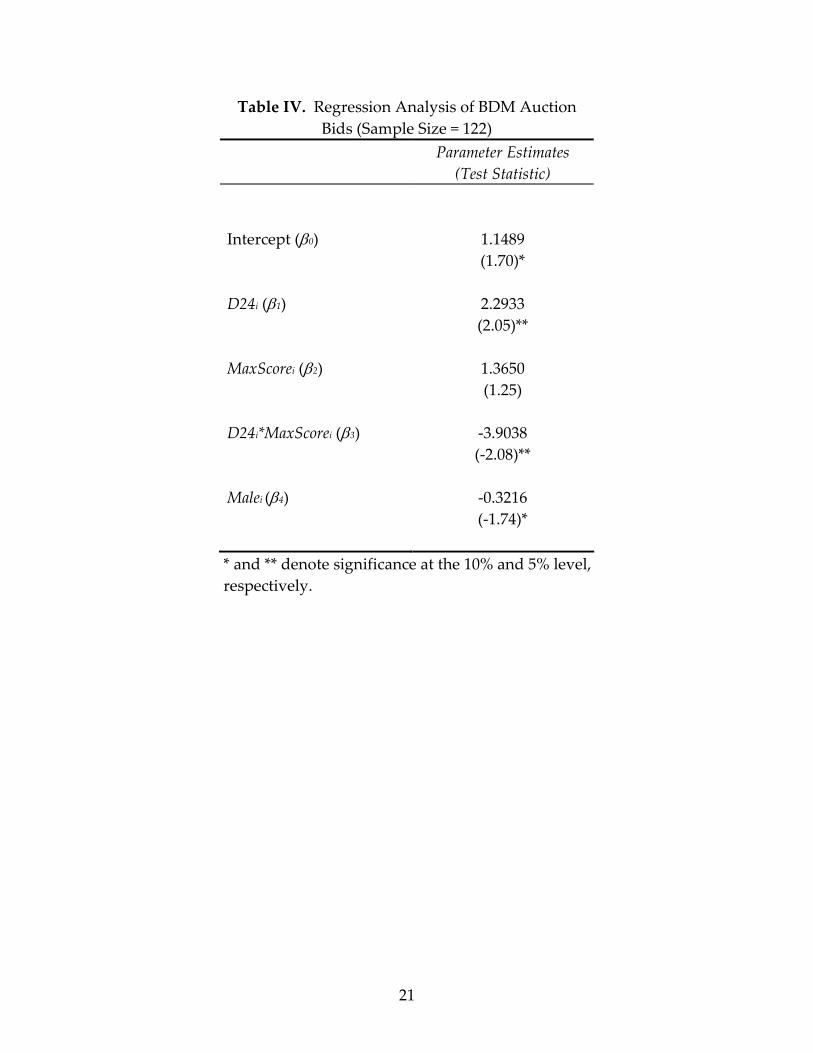
To estimate the relationship between personality and the excessive choice effect,
the following ordinary least squares regression was estimated
(1) ( ) ( ) ( )( ) ( )iiiiiiieMaleMaxScoreD24MaxScoreD24Bid +++++= 43210 αββββ
12
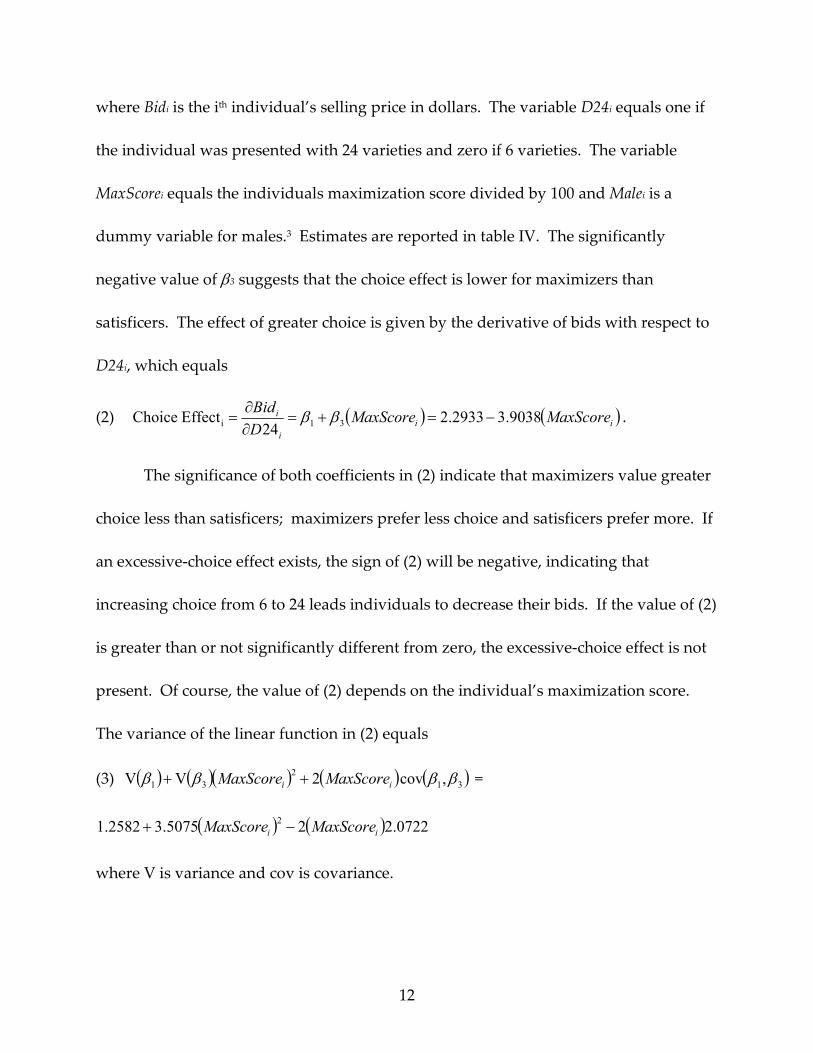
where Bidi is the ith individual’s selling price in dollars. The variable D24i equals one if
the individual was presented with 24 varieties and zero if 6 varieties. The variable
MaxScorei equals the individuals maximization score divided by 100 and Malei is a
dummy variable for males.3 Estimates are reported in table IV. The significantly
negative value of β3 suggests that the choice effect is lower for maximizers than
satisficers. The effect of greater choice is given by the derivative of bids with respect to
D24i, which equals
(2) ( ) ( )ii
i
iMaxScoreMaxScore
D
Bid9038.32933.2
24EffectChoice 31i −=+=
∂
∂= ββ .
The significance of both coefficients in (2) indicate that maximizers value greater
choice less than satisficers; maximizers prefer less choice and satisficers prefer more. If
an excessive-choice effect exists, the sign of (2) will be negative, indicating that
increasing choice from 6 to 24 leads individuals to decrease their bids. If the value of (2)
is greater than or not significantly different from zero, the excessive-choice effect is not
present. Of course, the value of (2) depends on the individual’s maximization score.
The variance of the linear function in (2) equals
(3) ( ) ( )( ) ( ) ( )31
2
31 ,cov2VV ββββii
MaxScoreMaxScore ++ =
( ) ( ) 0722.225075.32582.12
iiMaxScoreMaxScore −+
where V is variance and cov is covariance.
13
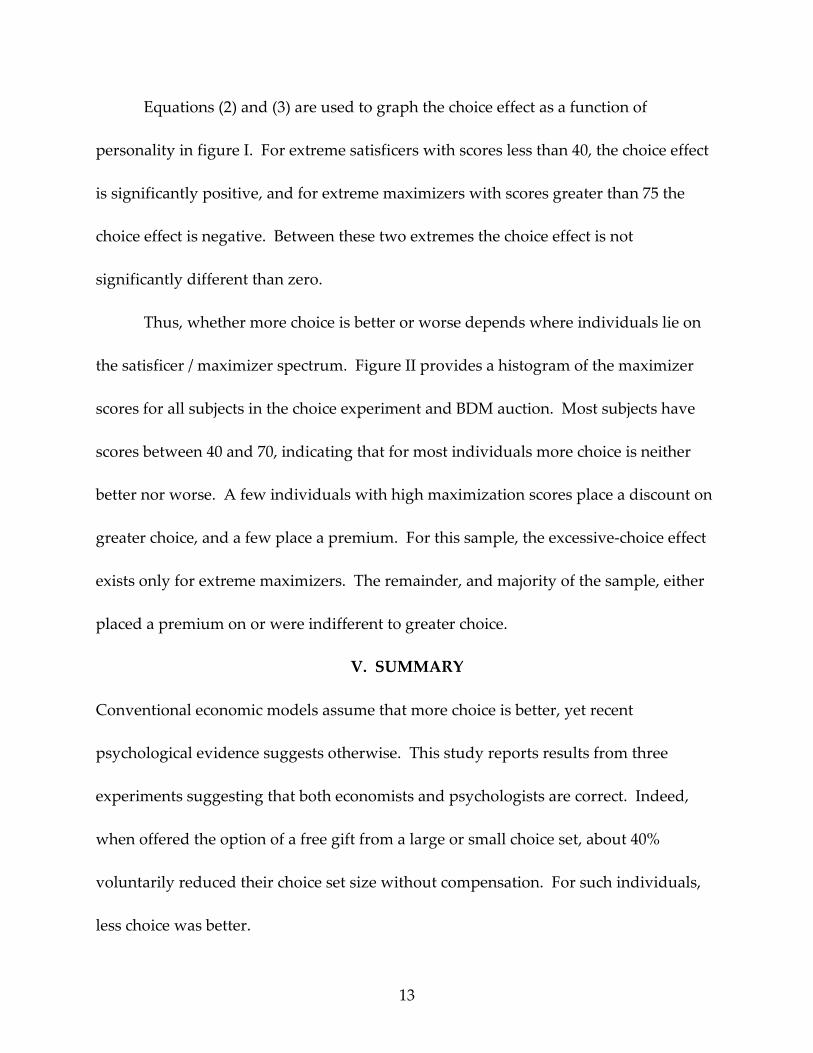
Equations (2) and (3) are used to graph the choice effect as a function of
personality in figure I. For extreme satisficers with scores less than 40, the choice effect
is significantly positive, and for extreme maximizers with scores greater than 75 the
choice effect is negative. Between these two extremes the choice effect is not
significantly different than zero.
Thus, whether more choice is better or worse depends where individuals lie on
the satisficer / maximizer spectrum. Figure II provides a histogram of the maximizer
scores for all subjects in the choice experiment and BDM auction. Most subjects have
scores between 40 and 70, indicating that for most individuals more choice is neither
better nor worse. A few individuals with high maximization scores place a discount on
greater choice, and a few place a premium. For this sample, the excessive-choice effect
exists only for extreme maximizers. The remainder, and majority of the sample, either
placed a premium on or were indifferent to greater choice.
V. SUMMARY
Conventional economic models assume that more choice is better, yet recent
psychological evidence suggests otherwise. This study reports results from three
experiments suggesting that both economists and psychologists are correct. Indeed,
when offered the option of a free gift from a large or small choice set, about 40%
voluntarily reduced their choice set size without compensation. For such individuals,
less choice was better.

14
However, a majority of people prefer larger choice sets. Contrary to experiments
by Iyengar and Lepper (2000), we find that a larger percentage of subjects purchased a
specialty item from a large choice set than a small choice set. Thus, while some
individuals preferred less choice, the average individual preferred large choice sets.
A third experiment confirms the hypothesis offered by Schwartz that preferences
for choice set size depends on whether individuals exhibit maximizer or satisficer traits.
As the choice set size grows, maximizers require less compensation to forego a choice
opportunity. The psychologists are correct. In some instances more choice does not
improve welfare, and the effect of a larger choice set size does depend on the
individual’s personality. The experimental results suggest that economists are also
correct. On average, consumer utility is weakly increasing in the number of options
available. While the standard economic model of the consumer is not applicable to
every single individual--and was probably never meant to be--it can be used to describe
the behavior of the average person and to assess the overall societal welfare
implications of public policies.
15
References
Boatwright, P. and J. C. Nunes. “Reducing Assortment: An Attribute Based
Approach.” Journal of Marketing. 65(3) (July 2001): 50-63.
Broniarczyk, S. M., W. D. Hoyer, and L. McAlister. “Consumers’ Perceptions of the
Assortment Offered in a Grocery Category: The Impact of Item Reduction.”
Journal of Marketing Research. 35 (May 1998): 166-176.
Dreze, X., S. J. Hoch, and M. E. Purk. “Shelf Management and Space Elasticity.” Journal
of Retailing. 70(4) (1994): 301-326.
Iyengar, S. S. and M. R. Lepper. “When Choice is Demotivating: Can One Desire Too
Much of a Good Thing?” Journal of Personality and Social Psychology. 70(6) (2000):
996-1006.
Norwood, F. “Less Choice is Better, Sometimes.” Journal of Agricultural and Food
Industrial Organization. 4(1) (2006). Article 3.
Schwartz, B. “Self-Determination: The Tyranny of Freedom.” American Psychologist.
55(1) (January 2000): 79-88.
Schwartz, B., A. Ward, J. Monteroso, S. Lyubomirsky, K. White, and D. R. Lehman.
“Maximizing Versus Satisficing: Happiness is a Matter of Choice.” Journal of
Personality and Social Psychology. 83(5) (2002): 1178-1197.
Schwartz, Barry. “The Tyranny of Choice.” Scientific American. 290(4) (April 2004a): 70-
75.

16
Schwartz, Barry. The Paradox of Choice: Why More is Less. HarperCollins Publishers,
Inc. New York, NY. First Edition. 2004b.
17
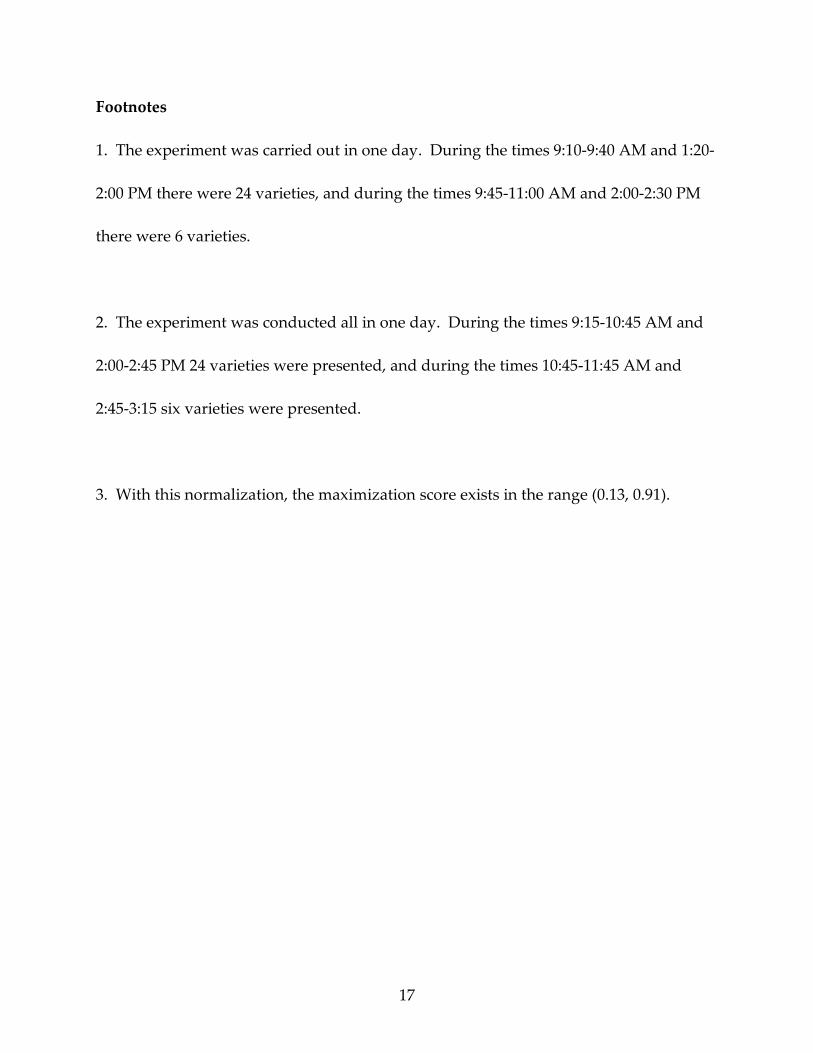
Footnotes
1. The experiment was carried out in one day. During the times 9:10-9:40 AM and 1:20-
2:00 PM there were 24 varieties, and during the times 9:45-11:00 AM and 2:00-2:30 PM
there were 6 varieties.
2. The experiment was conducted all in one day. During the times 9:15-10:45 AM and
2:00-2:45 PM 24 varieties were presented, and during the times 10:45-11:45 AM and
2:45-3:15 six varieties were presented.
3. With this normalization, the maximization score exists in the range (0.13, 0.91).

18
Table I. Descriptive Statistics of Choice Experiment
Percent of People
Choosing Drink Over $2
in Cash
Individuals Presented
with 6 Varieties (N = 65)
12%
Individuals Presented
with 24 varieties (N = 90)
30%
Notes: The t-test for the null hypothesis of no
difference between the percentages in the six and 24
variety set is ( ) ( )
80.2
65
12.0112.0
90
3.013.0
12.030.0=
−+
−
−, and is
asymptotically normally distributed with a mean zero
and unit variance. The p-value for the test is less than
1%.

19
Table II. Maximization Scale Developed by Schwartz et al. (2002)
On a scale of 1-7, with 1 being completely disagree and 7 being completely agree,
indicate the extent to which you agree with each of the following statements.
1. Whenever I’m faced with a choice, I try to imagine what all the other possibilities are,
even ones that aren’t present at the moment.
2. No matter how satisfied I am with my job, it’s only right for me to be on the lookout
for better opportunities.
3. When I am in the car listening to the radio, I often check other stations to see if
something better is playing, even if I’m relatively satisfied with what I’m listening to.
4. When I watch TV, I channel surf, often scanning through the available options even
while attempting to watch one program.
5. I treat relationships like clothing: I expect to try a lot on before I get the perfect fit.
6. I often find it difficult to shop for a gift for a friend.
7. Renting videos is really difficult. I’m always struggling to pick the best one.
8. When shopping, I have a hard time finding clothing that I really love.
9. I’m a big fan of lists that attempt to rank things (the best movies, the best singers, the
best athletes, the best novels, etc.).
10. I find that writing is very difficult, even if it’s just writing a letter to a friend,
because it’s so hard to word things just right. I often do several drafts of even simple
things.
11. No matter what I do, I have the highest standards for myself.
12. I never settle for second best.
13. I often fantasize about living in ways that are quite different from my actual life.
20
Table III. Descriptive Statistics of BDM Soda Auction
Average Bid Standard Deviation of
Bids
All Individuals (N = 122)
$1.78 $0.99
Individuals Presented
with 6 Varieties (N = 71)
$1.82 $0.91
Individuals Presented
with 24 varieties (N = 51)
$1.72 $1.10
Notes: The difference in average bids for the two variety treatments is 1.82 – 1.78
= 0.04. Assuming normality, the variance of this average is 0.912/71 + 1.102/51 =
0.0354. The test-statistic for the null hypothesis of no difference in average bids
is then 0.04/(0.0354)0.5 = 1.13, which cannot be rejected at the 10% level.
21
Table IV. Regression Analysis of BDM Auction
Bids (Sample Size = 122)
Parameter Estimates
(Test Statistic)
Intercept (β0)
1.1489
(1.70)*
D24i (β1)
2.2933
(2.05)**
MaxScorei (β2)
1.3650
(1.25)
D24i*MaxScorei (β3)
-3.9038
(-2.08)**
Malei (β4) -0.3216
(-1.74)*
* and ** denote significance at the 10% and 5% level,
respectively.

22
-3
-2
-1
0
1
2
3
0.2 0.3 0.4 0.5 0.6 0.7 0.8 0.9
Maximization Score / 100
Choice Premium ($)
Figure I. Choice Premium in BDM Auction as a Function of Maximization Score
Notes: Graph shows the change in value of soda choice when the number of choices
increases from 6 to 24. The solid line is the point estimate and the dotted lines denote
a 95% confidence interval.

23
0%
5%
10%
15%
20%
25%
30%
35%
40%
13-20 21-30 31-40 41-50 51-60 61-70 71-80 81-91
Maximization Score
Percent of Subjects
Figure II. Distribution of Maximization Scores In Choice Experiment and BDM
Auction (Sample Size = 277)