the distribution, mineralogy and …_r.,_hons_thesis...4.4.1 whole rock geochemistry of barite...
TRANSCRIPT

THE DISTRIBUTION, MINERALOGY AND PARAGENESIS
OF THE HELLYER BARITIC AND SILICEOUS CAPS
Robina Sharpe B.Sc.
A thesis submitted in partial fulfilment
of the requirements for the degree of
Bachelor of Science with Honours
Geology Department
University of Tasmania
November, 1991

life is earnest, life is real,
life is but an empty dream,
for the soul is dead that slumbers,
and things are not what they seem.
W. Shakespeare (A Midsummer Nights Dream)
(

Abstract
Baritic and siliceous caps are a feature of many volcanic-hosted massive sulphide deposits.
Their distribution, mineralogy and geochemis~ are important to the understanding of the
genesis of these deposits.
The baritic and siliceous caps overlying the Hellyer volcanic-hosted massive sulphide deposit,
western Tasmania, show a spatial affinity to the centres of hydrothermal activity, identified
previously from copper contents of the ore. Mineralogical and textural investigations
identified barite as a precursor to formation of the siliceous cap. In both caps intricate
sulphide textures, including pristine collofom pyrites, are present Mineralogical and spatial
relationships suggest an interdigitation of the baritic and siliceous caps.
Sulphur isotope studies of barite (with 034S values between +38 and +50 per mil) and pyrite
(with 034-S values between +6 and+ 18 per mil) revealed a duality in the source of sulphur
during formation of the caps; incompletely reduced seawater sulphur, and magmatic sulphur.
The wide range of o34S values are thought to be the result of fluctuating contributions from
these two sulphur sources.
Metal zonation and mineral geochemical studies show that base and precious metal contents of
both caps are enriched proximal to underlying massive sulphides. In such zones, textural
evidence supports hydrothermal overprinting and porosity infill by paragenetically late
sulphides.
Formation of the barite cap at or above the seawater interface is interpreted to be the result of
oxygenated seawater mixing with spent hydrothermal fluids enriched in barium, during
periods of low hydrothermal flux, at temperatures between 230 and 250°C. By contrast,
silica cap precipitation requires the local dominance ofH2S and a combination of conductive
cooling and mixing. This is evidenced by the presence of arsenopyrite, and the absence of
hematite.
The interdigitating spatial affmity combined with mineralogical and textural evidence suggests
that formation of the baritic and siliceous caps at Hellyer was an integral part of orebody
formation. Thus these facies evolved with the growing sulphide mound, in a manner
consistent with the rone refming model proposed by Eldridge et al. (1983), for the growth of
seafloor sulphide deposits.
I

Acknowledgements
I would like to thank Aberfoyle Resources Limited for providing logistic support. Particular
thanks are extended to; Gary McArthur who organised the project, Richard Downs for helpful
advice and preliminary reading of the manuscript, Steve Richardson, Henry Kurth, Graham
Howard, Dave Adams, Bevan McWilliams and Andrew Wilson for their help and friendship.
I thank my supervisors Bruce Gemmell and Ross Large for advice and preliminary reading of
the manuscript .
For her suppon and indeterminable patience, I am indebted to Kim Hein. In addition, for
constructive discussions and preliminary reading of various pans of the manuscript, I am
grateful to Gary Davidson, Anthea Hill, Dave Huston and Khin Zaw.
For advice and guidance during analytical work thanks are extended to; Mike Power Sen. and
Christine, Wis Jabolinski and Phil Robinson.
I thank all of my fellow Honours students for making the year an enjoyable one. A special
thanks must also go to Micheal Blake.
In conclusion, the loving suppon provided by my father, Stan, who provides his daughter
with a place to call home no matter how far she may stray; the endless words of wisdom of
my brother, Ian, and the patience and guidance of Annie McEntee; I cannot thank them
enough.
l
Il

Ill
Contents
Chapter 1: Introduction ........................................................................ 1 1.1 Aims. . ................................................................................ 1 1.2 Previous Research ....................................................................... 2 1.3 Terminology and Definitions ........................................................... 3 1.4 The Hellyer Deposit ..................................................................... 4 1.5 Study Outline .................................. : .......................................... 6.5
Chapter 2: Spatial Distribution of the Baritic and Siliceous Caps ........................ 7 2.1 Stratigraphic Position .................................................................... 7 2.2 Lateral Distribution of the Caps ...................................................... 13
2.2.1 The Barite Cap . . . . . . . . . . . . . . . . . . . . . . . . . . . . . . . . . . . . . . . . . . . . . . . . . . . . . . . . . . . . . . . . . . . . . 13 2.2.2 The GSP ............................................................................ 13 2.2.3 The Hellyer Stringer System ..................................................... 13
2.3 Thickness ................................................................................. . 17 2.4 Faulting ............................................................................... 17 2.5 Conclusions ............................................................................ 17
Chapter 3: Mineral and Textural Paragenesis ............................................. 21 3.1 Introduction ............................................................................. 21 3.2 Barite ............................................................................... 21 3.3 Quartz ............................................................................... 23
3.3.1 Microcrystalline Quartz ............................................................ 25 3.3.2 Megaquartz ......................................................................... 25 3.3.3 Silica Pseudomorphs .............................................................. 27
3.4 Pyrite ............................................................................... 27 3 .4.1 Pyritic Textures in the GSP ....................................................... 27 3.4.2 Pyrite Textures of Barite .......................................................... 35
3.5 Sphalerite................................................................................ 35 3.6 Arsenopyrite ............................................................................ 36 3.7 Galena ................................................................................ 36 3.8 Tetrahedrite-Tennantite ................................................................ 36 3.8 Chalcopyrite ............................................................................ 36 3.9 Electrum ............................................................................... 38 3.10 Carbonate .............................................................................. 38 3.11 Sericite and Chlorite .................................................................. 38 3.12 Paragenesis .... -........................................................................ 38 3.12.1 Stage 1: Primary Textures ...................................................... 38 3.12.2 Stage 2: Main Sulphide Deposition Phase .................................... 40 3.12.3 Hydrothermal Alteration and fill of Open Space ............................. 40
3.13 Conclusion ............................................................................ 41
Chapter Four: Mineral and Whole Rock Geochemistry ................................ 43 4.1 Introduction ............................................................................ 43 4.2 XRF Sample Preparation ............................................................. 43 4.3 Analytical Techniques ................................................................. 43 4.4 The Composition of the Barite Cap .................................................. 44
4.4.1 Whole Rock Geochemistry of Barite Samples ................................. 44 4.4.2 Barium and~ntium Concentrations in Barite ............................... 45 4.4.3 Hangingwal!(Ddrium Alteration .................................................. 47
4.5 GSP - A Classffi&tion ................................................................ 47 4.5.1 Whole Rock Analyses of GSP ................................................... 47
4.6 Carbonates .............................................................................. 49 4.7 Iron Content of Sphalerite ............................................................ 49 4.8 Mineralogic Residence of Arsenic ................................................... 49

4.9 Mineralogic Residence of Silver ..................................................... 50 4.10 Mineralogic Residence ofGold ..................................................... 50
4.10.1 Electrum ........................................................................... 50 4.10.2 Gold Content of Pyrite ........................................................... 52 4.10.3 Gold Content of Arsenopyrite .................................................. 56
4.11 Discussion ............................................................................. 56 4.11.1 Barite Solubility and Precipitation .............................................. 56 4.11.2 Silica Solubility ................................................................... 56 4.11.3 Gold Depositional and Transport Mechanisms ............................... 57
4.11 Conclusions ................................. : ......................................... 57
Chapter 5: Metal Zonation .................................................................. 59 5.1 Introduction .............................................................................. 59
5.1.1 Aims .............................................................................. 59 5.1.2 Metal Zonation in VHMS Deposits .............................................. 59
5.2 Lateral Zonation ............ ~ ........................................................... 60 5.2.1 Interpretation ....................................................................... 63
5.3 Vertical Zonation ....................................................................... 66 5.3.1 Section 10630 N ................................................................... 66 5.3.2 Section 10790 N ................................................................... 69 5.3.3 Barium Zonation in the Massive Sulphide ...................................... 69 5.3.4 Interpretation ....................................................................... 69
5.4 Hangingwall Barium Zonation ....................................................... 75 5.5 Discussion .............................................................................. 75 5.6 Conclusion .............................................................................. 76
Chapter 6: Sulphur Isotope Geochemistry ................................................ 77 6.1 Introduction ............................................................................. 77 6.2 Analytical Procedure ................................................................... 77 6.3 Results ............................................................................... 78
6.3.1 Isotopic distributions .............................................................. 78 6.3.2 Isotopic Variation .................................................................. 78
6.4 Sulphur Sources ....................................................................... 82 6.5 Textural Variations ..................................................................... 84 6.6 Sulphur Isotope Compositions of Other Deposits ................................. 86 6.7 Conclusions ............................................................................ 86
Chapter 7: Fluid Inclusions ................................................................. 87 7.1 Introduction ............................................................................. 87 7.2 Methodology ........................................................................... 87 7.3 Fluid Inclusion Petrography .......................................................... 87 7.4 Discussion .............................................................................. 91 7.5 Conclusion .............................................................................. 93
Chapter 8: Formation of the Baritic and Siliceous Caps: Conclusions ................. 94 8.1 Kuroko Model ................................................................................................. 94 8.2 Recent Hydrothermal Activity ........................................................ 97 8.3 The Deposition of the Barite Cap .................................................... 97 8.4 The Deposition ofGSP .............................................................. 100 8.5 Controls on Depositional Sites ...................................................... 102 8.6 A Model of Formation ................................................................ 103
8.6.1 Stage 1: Primary Deposition ..................................................... 103 8.6.2 Stage 2: Main Sulphide Deposition ............................................. 103 8.6.3 Stage 3: Waning ................................................................... 105
8. 7 Discussion ............................................................................. 105 8.8 Summary and Conclusions ............................................ : ............. 106
' f
IV

References .............................................................................. 107
Appendices: 1.1 Logging Codes Employed at Hellyer 2.1 Catalogue 2.2b Coordinates used in the construction of the plan projection of the Hellyer Barite
Cap 2.2b Coordinates used in the construction of the plan projection of the Hellyer GSP 3.1 Whole Rock XRF Results 3.2 Microprobe Barite analyses 3.3 Microprobe Carbonate Analysis 3.4 Microprobe Sphalerite Analysis 3.5 Microprobe Pyrite Analysis 3.6 Microprobe Arsenopyrite Analysis 3.7 Microprobe Galena Analysis 3.8 Microprobe Tetrahedrite Analysis 3.9 Microprobe Electrum Analysis 4.1 Barite Cap - Sulphur Isotope sample descriptions, sample locations and d34S
values 4.2 Siliceous Cap - Sulphur Isotope sample descriptions, sample locations and d34S
values
List of Figures
1.1 Location of the Hellyer deposit. ............................................... 2 1.2 Surface geology and stratigraphy of the Hellyer deposit ................... 5
2.1a Stratigraphy of HL414, HL413 and HL417 ............................... 10 2.1b Stratigraphy ofHL326, HL329 and HL313 .............................. 11 2.2a Section 10630N ............................................................... 12 2.2b Section 10790N ............................................................... 12 2.3 Plan Projection of a) the barite cap, and b) the siliceous cap .............. 14 2.4 Plan Projection of the barite and siliceous caps ............................. 15 2.5 Pre-Jack Fault reconstruction of the stringer zone ......................... 16 2.6 Contour plan projection of thickness ........................................ 18 2. 7 Main faults intersecting the cap zones ....................................... 19
3.1 The relative paragenetic sequence in the cap zones ........................ .42
4.1 The abundances of major oxides and trace elements; Barite cap .......... 44 4.2 Relation of Ba and Sr in barite ............................................... .45 4.3 Ba/Sr results for a traverse along a barite grain ............................ .46 4.4a Spidergram of the major oxides in GSP .................................. .48 4.4b Spidergram of the tetsusekiei and Nova nda cherts ...................... .48 4.5 AI - Fe - Mn plot of GSP samples .......................................... .48 4.6 Electrum grain size distribution ............................................... 53 4. 7 Electrum fineness distribution ................................................ 53 4.8 Core-Rim Analytical traverse across electrum grain 1 .................... .54 4.9 Core-Rim Analytical traverse across electrum grains 11 and 13 .......... 55
5.1 Barium zonation within the barite cap and GSP ............................ 61 5.2 Iron zonation within the barite cap and GSP ................................ 61 5.3 Lead zonation within the barite cap and GSP ............................... 62 5.4 Zinc zonation within the barite cap and GSP ............................... 62
v

5.5 Gold zonation within the barite cap and GSP ............................... 64 5.6 Silver zonation within the barite cap and GSP .............................. 64 5.7 Copper zonation within the barite cap and GSP ............................ 65 5.8 Arsenic zonation within the barite cap and GSP ............................ 65 5. 9 Metal zonation contours within the barite cap and GSP: 10630 N ....... 69 5.10 Metal zonation contours within the barite cap and GSP: 10790 N ...... 70 5.11 Section 10630: Ba zonation .................................................. 72 5.12 Section 10790: Ba zonation .................................................. 73
6.1 Barite Cap - Sulphur Isotope Distribution ................................... 79 6.2 Siliceous Cap- Sulphur Isotope Distribution ............................... 79 6.3 Hangingwall Volcaniclastic Sequence- Sulphur Isotope Distribution ... 79 6.4 Sulphur Isotope data for Hellyer and nearby mineralisation .............. 81 6.5 Progressive reduction of seawater ........................................... 83
7.1 Fluid inclusion diagram ...................................................... 88 7.2 Type I Inclusions- Wt.% NaCl equivalent Distribution .................. 90 7.3 Type II Inclusions - Wt % NaCl equivalent Distribution ................. 90 7.4 Type II Inclusions- Oathrate Wt.% NaCl equivalent Distribution ...... 90 7.5 Type I Inclusions - Th Distribution .......................................... 92 7.6 Type II Inclusions- Th Distribution ......................................... 92
8.1 Kuroko model of formation ................................................... 95 8.2 Developement of tetsusekiei .................................................. 96 8.3 Thermal distribution of oretypes ............................................. 96 8.4 Growth of modem mound chimney ......................................... 98 8.5 Effects of conductive cooling ................................................. 98 8.6 Thermodynamic modelling .................................................. 101 8.7a ~1 solution mixing with seawater ...................................... 101 8.7b B ancy behaviour of hydrothermal solution ......................... 101 8.8 Mod 1 for the formation of the barite and silica caps ..................... 104
List of Plates
Plate 2.1 Fragmental barite and GSP ............................................ 8 Plate 2.2 Massive sulphide-GSP contact ........................................ 8 Plate 2.3 Massive sulphide-barite cap contact ................................... 8 Plate 2.4 Massive sulphide-barite contact ....................................... 8 Plate 2.5 Ma~~ive .s~lphide-barite cap contact ................................... 8 Plate 2.6 Bannc vemmg ........................................................... 8 Plate 2. 7 HVS-barite cap contact ................................................. 8 Plate 2. 8 Fragmental barite in HVS .............................................. 8 Plate 3.1 Massive barite .......................................................... 22 Plate 3.2 Massive barite .......................................................... 22 Plate 3. 3 Acicular barite .......................................................... 22 Plate 3.4 Barite rosette ............................................................ 22 Plate 3.5 Network barite .......................................................... 22 Plate 3.6 Banii'te · massive sulphides ........................................... 22 Plate 3. 7 Gran lar barite ........................................................ 22 Plate 3.8 N e ffik barite .......................................................... 22 Plate 3.9 Crusd'fbrm barite veining .............................................. 24 Plate 3.10 Barite veining .......................................................... 24 Plate 3.11 Barite cap and GSP contact .......................................... 24 Plate 3.12 GSP with barite ........................................................ 24
vn
Plate 3.13 GSP .................................................................... 24 Plate 3.14 Cavity in the GSP ..................................................... 24 Plate 3.15 SEM Micrographs of barite and silica ............................... 26 Plate 3.16 Silica pseudomorphs .................................................. 28 Plate 3.17 Silica pseudomorphs .................................................. 28 Plate 3.18 Silica pseudomorphs .................................................. 28 Plate 3.19 Silica pseudomorphs .................................................. 28 Plate 3.20 Silica pseudomorphs .................................................. 28 Plate 3.21 Concentric pyrite ...................................................... 29 Plate 3.22 Colloform pyrite ....................................................... 29 Plate 3.23 Colloform pyrite ....................................................... 29 Plate 3.24 Colloform pyrite ....................................................... 29 Plate 3.25 Colloform pyrite ....................................................... 29 Plate 3.26 Colloform pyrite ....................................................... 29 Plate 3.27 Euhedral pyrite ......................................................... 31 Plate 3.28 Framboidal pyrite ..................................................... .31 Plate 3.29 Framboidal pyrite aggregates ....................................... .31 Plate 3.30 Framboidal pyrite aggregates ....................................... .31 Plate 3.31 Recrystallised pyrite .................................................. .31 Plate 3.32 Crystalline pyrite overgrowths ...................................... .31 Plate 3.33 SEM micrographs of pyrite ......................................... .32 Plate 3.34 Acicular pyrite pseudomorphs ...................................... .33 Plate 3.35 Acicular pyrite pseudomorphs ...................................... .33 Plate 3.36 Acicular pyrite pseudomorphs ...................................... .33 Plate 3.37 Acicular pyrite pseudomorphs ...................................... .33 Plate 3.38 Frondescent pyrite .................................................... .33 Plate 3.39 Colloform pyrite and arsenopyrite .................................. .33 Plate 3.40 SEM micrographs of acicular pyrite textures ...................... .34 Plate 3.41 Hexagonal sphalerite ................................................. .37 Plate 3.42 Chalcopyrite in sphalerite ............................................ .37 Plate 3.43 Exsolution textures ................................................... .37 Plate 3.44 Arsenopyrite in sphalerite ................................ ~ .......... .37 Plate 3.45 Electrum in crystalline pyrite ........................................ .37 Plate 3.46 Electrum in crystalline pyrite ......................................... 37 Plate 3.47 Electrum in the barite cap ............................................. 55 Plate 3.43 Electrum in massive sulphides ....................................... 56
List of Tables
Chapter One 1.1 Ore reserve grades, Hellyer .................................................... 6 Chapter Two 2.1 Location of three feeder systems in the stringer zone ...................... 16 Chapter Four 4.1 Electrum grain descriptions ................................................... 51 Chapter Seven 7.1 Fluid inclusion results ................................................. 89
f

Chapter One Introduction
Barite and hydrothermal cherts form principal accessory components in many volcanic
hosted massive sulphide (VHMS) deposits. They often occur as distinct horizons or as
gangue constituents in the upper regions of VHMS accumulations. Their concomitant
association with massive sulphide mineralisation is an indication that they are products of the
same hydrothermal activity which formed the mineralisation. The geological environment
and geochemical signature of stratiform baritic and siliceous zones associated with massive
sulphide mineralisation are significant for the following reasons:-
i) They serve as hydrothermal tracers or indicators of nearby mineralisation in the
exploration for VHMS deposits.
ii) They provide a means to evaluate the genesis and evolution of mineralising fluids.
iii) The barite is often a mineable resource, frequently enriched in precious metals.
The following investigation documents the distribution, mineralogy, paragenesis and
geochemical characteristics of the baritic and siliceous caps which overlie the Hellyer VHMS
deposit.
The Hellyer deposit is located in the Cambrian Mount Read Volcanic Belt in Western
Tasmania (Figure 1.1) and represents a resource of 16 million tonnes which is currently
being mined by Aberfoyle Resources Limited. It is a well preserved example of a volcanic
hosted sea floor vent deposit (McArthur and Dronseika, 1990).
1.1 Aims
This study will:
1) Defme the spatial distribution of the baritic and siliceous caps overlying the Hellyer
deposit.
2) Describe mineralogical and textural variations within the baritic and siliceous caps.
3) Deduce the geological association of the baritic and siliceous caps to underlying
mineralisation.
4) Investigate the geochemical characteristics of the baritic and siliceous caps by means
of; sulphur isotope geochemistry, mineral and whole rock geochemistry, fluid
inclusion studies and metal zonation studies.
5) Propose a genetic model for formation of the baritic and siliceous caps at Hellyer.
1

10 km '-----'
Precambrian Tyennan Block
Figure 1.1: The location of the Hellyer deposit and other major volcanic-hosted massive sulphide deposits within the Cambrian Mt Read Volcanic Belt in western Tasmania (from Gemmell and Large, in press)
1.2 Previous Research
The Kuroko deposits in Japan, are unmetamorphosed examples of volcanic-hosted massive
sulphide deposits (Eldridge et al., 1983). In these deposits barite occurs as distinct horizons,
lateral to or overlying mineralisation,· and/or as an interstitial gangue mineral within the
massive sulphides. In the former, barite is often a mineable resource. Geochemical studies
on baritic and siliceous/ferruginous chert (tetsusekiei) horizons of these deposits are recorded
by; Igarashi et al. (1981), Kusakabe and Chiba (1983), Kalogeropoulous and Scott (1983)
and Eldridge et al. (1983). A paucity of information however, exists on the nature of
equivalent zones in Phanerozoic polymetallic VHMS deposits.
Several recent studies have focussed on the venting of hydrothermal solutions to the sea floor
(for example: Bluth and Ohmoto, 1988; Herzig et al., 1988; Fouquet et al., 1991). The
2

venting of hydrothermal fluids is often associated with active deposition of sulphides,
sulphates and hydrothermal cherts. Processes operating within modem hydrothermal
environments are thought to be analogous to those processes which formed ancient volcanic
hosted massive sulphide accumulations. Investigation of these modem centres of
hydrothermal activity have made possible the documentation of hydrothermal fluid
compositions, pristine mineralogies, textures and geochemical signatures with which existing
massive sulphide deposits can be compared. In addition, these studies have shown that
barite and hydrothermal cherts are often an integral part of the ore forming processes.
This study is the first to document the mineralogical and geochemical characteristics of the
baritic and siliceous horizons overlying the Hellyer massive sulphide deposit Previous
studies on the Hellyer deposit have described the geophysical discovery (Eadie, Silic and
Jack, 1985; Sise and Jack, 1984), the regional geology and orebody setting (McArthur,
1986; McArthur and Dronseika, 1990; Staff, Aberfoyle Resources, 1990), the metal zonation
(McArthur, 1990), mineralogical variations (Ramsden et al., 1990) and the geochemical
characteristics of host rock alteration (Jack, 1989). A number of reports also exist on the
deformational style of the Hellyer deposit (Drown and Downs, 1990) and isotopic
geochemistry (Whitford et al., 1984; 1985). Other investigations include the alteration
geochemistry and metal zonation in the underlying stringer system (Gemmell, 1988; 1989;
1990; Gemmell and Large, in press), as well as ongoing documentation by Hellyer
geologists.
1.3 Terminology and Definitions
Baritic and siliceous occurrences are often referred to as exhalative products. Strictly an
"exhalation" is defined as a gaseous emanation (A.G.I. Glossary, 2nd ed., 1980), however
the term is often used broadly to incorporate all localised expulsion of fluids and gases
accompanying volcanism (Ridler and Shilts, 1974). Due to its genetic connotation, the term
exhalative will not be used further.
A series of logging and mapping codes (Appendix 1.1) are employed by the geologists at the
Hellyer deposit. The logging and mapping codes have been adopted throughout the course
of this study, as they are an effective and coherent means to describe mineralogy, texture and
alteration.
The barite cap at the Hellyer deposit is defmed as that unit which stratigraphically overlies
massive sulphide mineralisation and is predominantly composed of barite. The siliceous cap
3

at Hellyer is a hydrothermal chert horizon, which may overlie massive sulphide
mineralisation and/or the barite horizon. This siliceous unit is defined by distinctive pyritic
textures in a grey, glassy siliceous matrix. It is consequently termed glassy silica pyrite
(GSP).
1.4 The Hellyer Deposit
~The Hellyer orebody is an elongate, faulted massive sulphide lens hosted in the Que-Hellyer
volcanics of the Dundas Group, Mount Read Volcanics (Corbett, 1989). For the purpose of
this study the regional geology of the Hellyer area will not be detailed. Instead, the reader is
referred to Corbett and Solomon (1989) and references cited therein.
The location of the Hellyer orebody and immediate stratigraphy is shown in Figure 1.2a and
1.2b. The footwall Feldspar Phyric Sequence, of massive lavas and volcaniclastics, is
dominantly andestic in composition and forms the basal unit at Hellyer (McArthur, 1986).
The top of this unit represents the time equivalent horizon, to hydrothermal mineralisation
(McArthur and Dronseika, 1990). Overlying the Feldspar Phyric Sequence is the
Hangingwall Volcaniclastic Sequence (HVS). Two interbedded lithologies constitute the
HVS; a poorly sorted volcanic breccia and a well sorted, fmely laminated ash unit (Staff,
Aberfoyle Resources Limited, 1990). The former onlaps the sulphide deposit (McArthur,
1989). In the central part of the orebody, where massive sulphides attain their greatest
thickness, the HVS is absent. In these areas, the massive sulphide mineralisation, including
the barite and siliceous caps, is in direct contact with overlying basalts of the Pillow Lava
Sequence (PLS). The PLS consists predominantly of pillowed and amygdaloidal basalt with
pyritic chert, cherty shale or hyaloclastic interpillow margins (McArthur, 1989).
Conformably overlying the PLS is the Que River Shale, which is in turn overlain by the
Upper Rhyolitic Sequence (Staff, Aberfoyle Resources Limited, 1990).
The Hellyer massive sulphide deposit displays metal, mineral and textural zonation typical of
many Kuroko style deposits (McArthur, 1990). Grades for the massive sulphide, baritic and
siliceous caps are given in Table 1.1. The deposit averages 45 metres true thickness, with
variable dip and strike and sharp geological contacts (McArthur, 1990).
p !
4

5
DOL
HVS ltadgingwall Sequence .~;,.~~.~.~',/~.;~""~' ~'~6 ~ ~'t~:~::,:,:::,:::-r"'-::-·~.'f'".',j\";~:""",#~"_,,,,, .:.'~.;., ..Volcanic laSi le _ -.,Jo ..
STZ Siting.' lone "J'JVVVV~ .0. .0. .0. ~ 6 6i~-...r-....,.........r,- \ ~ J. ~ ... ':._.- "•. ; ..... ,- .......... , •.• - , ..... - '0 .•
~: ~~gc~~~ Altere(J ,:.~.- pA "~:.o.~~':",.::".~."',->~;:'::~~~~~.o..o..o..o..o.~.o..o.A.o.~.o..o..o.~-:'::';"~r:f;::- ~:.~>~.~,:~~.~
Rhyollle "JVV'~ ~ .0. .0. ALa. A u ~. 6.l,... _ ...A... '"; ;.'.- .. ;.': , 0 "00 '00 '00RII Y .0. a .0. Q.' ..l.o. 6£ ..•. ~ .0. '''' ....... ..l .'.- . '. " " . I ". .. .. 0 m
AL AnaeSlle ilnd EplclaSllc Deblls Flows 'l~.o..o..o..o..o..o..o. .0./..-:. :.:/'/0.. t:J..... .. 1.0. .0. U:':'::"-"~r::'''''''';'';~''':''-':'l
ACG Aunnal Creek Greywacke 'r .0. ..l 6. .0. 6. .0. .0..0. • , r"/\ - .... -J-I .... /6 6. a :":". "... -. '.-. -, .. : ", "'..... '
b WEST EAST
'I V V STRAT1GRAPHIC UNITS
~ Upper rhyolitic sequence Y V
~ Que Ri.er Shale • t I:X'
~ Pillow 10'10 sequence
~ Hanging wall volconiclastic sequenceFy F\Jchsite
Si Silica lliJ 8ari.e JHellyerMineralised
Ab Albi •• • 80S. metal sulphides Sequttnce
Cl Chlari'e D Feldspar phyric seqyence CO Carbonate
~ Stringer zone S.
Q ~ Stringer envelope zone
? I?O M.
Figure 1.2: a) Plan view of the surface geology surrounding the Hellyer deposit (after Gernmell and Large, in press). b) Schematic cross section of the Hellyer deposit stratigraphy (after McArthur, 1989).

6
Cu (%) Pb (%) Zn (%) Ag (ppm) Au (ppm) Ba (%) As(%) Fe(%) S (%) S.G
OreBody* 0.3 6.8 13.0 160 2.3 3.0 1.0 4.6
Barite Cap** 0.2 3.2 4.9 116 1.9 26.4 0.2 13.0 16.3 4.2
Siliceous Cap** 0.2 4.4 7.3 140 3.0 3.7 0.5 19.1 22.9 3.8
* Gemmell and Large, in press.
** G.J. McArthur. pers. corn., 1991
Table 1.1: Ore reserve grades for the massive sulphide mineralisation, barite cap and GSP at the Hellyer deposit.
The footwall rocks host a well preserved stringer vein system and encompassing
hydrothermal alteration zones (Gemmell et al., 1990). The alteration zones show a
mineralogical zonation from an outer shell of sericite-quartz through chlorite-sericite to a
highly siliceous core (Gemmell and Large, in press). Syn-mineralising veins, representing
conduits for the passage of hydrothermal solutions through the alteration zones to the sea
floor, are a feature of the stringer zone. The alteration associated with the siliceous core
hosts the strongest development of stringer vein mineralisation and represents the central
feeder system. Footwall alteration textures and mineralogies at Hellyer are similar to those
present at several Kuroko style deposits (Gemmell and Large, in press).
The PLS exhibit calcite-fuchsite alteration, indicating the continuation of the hydrothermal
system after the extrusion of the basalts (Jack, 1990). The result is a plume shaped alteration
zone directly over the central feeder of the stringer zone (Jack, 1989).
The well preserved stratigraphic sequence at Hellyer is the result of low metamorphic grade
with minimal deformation (McArthur, 1990). The regional metamorphic facies is prehnite
pumpellyite and the regional metamorphism is the result of the Tabberabberan (Middle
Devonian) Orogeny (Whitford et al., 1982). Deformation of the Hellyer orebody
encompasses open folding and wrench faulting. The Hellyer deposit, which lies proximal to
the axial plane of a broad anticline, is transected by a major north-south structure; the Jack
Fault. The Jack Fault divides the deposit into an eastern and western ore block. Post
mineralisation movement on the Jack Fault has resulted in a sinistral displacement of 130
metres east block north and 30 metres up (McArthur, 1986). Sub-vertical faults with minor
movements strike east-west and are commonly developed as dextral conjugates to the Jack
Fault (Drown and Downs, 1990; McArthur and Dronseika, 1990).
£ f

6.5
1.5 Study Outline
The first consideration in this study has been to record the spatial distribution of the baritic
and siliceous caps (Chapter Two). It has been necessary to define the association of the cap
zones to underlying mineralisation, to each other and to the hangingwall stratigraphy. This
was achieved by examining a range of existing diamond drill core from the cap zones. Two
Sections, namely 10790 Nand 10630 N on the eastern and western ore blocks respectively,
were investigated in detail. These two Sections were chosen in order to remove the effect of
the sinistral offset along the Jack Fault. During drill core logging, particular attention was
paid to mineralogy, texture and the nature of the contacts. Where possible, underground
exposures of the baritic and siliceous horizons were studied. In association with core
logging and underground mapping, samples were collected for later petrological and
geochemical investigations.
Polished thin sections for microscopic mineralogical and textural investigations were
prepared at the University of Tasmania. Further textural evaluation was completed on the
Scanning Electron Microscope (SEM) at the Central Science Laboratory (CSL) of the
University of Tasmania. The results are presented in Chapter Three. Mineral and whole
rock geochemistry (Chapter Four) were determined using microprobe facilities at the CSL
and X-ray fluoresence analyses available in the Geology Department, University of Tasmania
. The former included the chemical and submicroscopic constituents as well as chemical
variation of the mineralogy within the siliceous and baritic horizons. In total eleven samples
were analysed for whole rock geochemistry using X-ray fluoresence.
Metal zonation studies (Chapter Five) determined the lateral and vertical associations of
metals in the cap zones. This study is based on Aberfoyles' routine 1 to 2 metre drill core
assays for grade control and ore reserve calculations. Assay data, stored on a DATAMINE
database was used in this study to prepare plan projections of metal distributions for zonation
studies. The DATAMINE database was also used in the generation of orebody sections and
hangingwall structure contours.
Sulphur isotope analyses (Chapter Six) were performed at the CSL stable isotope facilities..
Sulphide and sulphate species were either hand picked or drilled and analysed using standard
techniques. Fluid inclusions (Chapter Seven) were investigated from a limited number of
barite samples, using the Fluid Inc heating/freezing stage in the geology department.
Difficulty was experienced in the identification of primary fluid inclusions and consequently
this portion of the study formed a minor component of the geochemical investigation.
/'

7
Chapter Two Spatial Distribution of the Baritic and Siliceous Caps
Introduction
Over six hundred diamond drill holes intersect the Hellyer massive sulphide deposit. A large
number of these drill holes were scrutinised to define the spatial associations between:
1) the barite cap and asp
2) the cap zones and underlying massive sulphides
3) the cap zones and overlying HVS and/or PLS
In total, forty relevant portions of existing diamond drill core, intersecting the barite and/or
asp mineralisation, were examined during field work at the Hellyer mine site. In addition,
six underground exposures of the barite cap, asp and/or baritic veining through the massive
sulphides were mapped. Barite veins within the overlying PLS were also examined, however
this outcrop is obscured by the mine infrastructure. Defining the spatial distribution of the
barite cap and asp relied heavily on previous work by geologists at the Hellyer deposit.
Two Sections, namely 10630 N and 10790 N, were chosen for detailed investigation,
because they correspond to the sinstral movement on the Jack Fault. Thus if the movement
on the Jack Fault is restored, the two Sections approximately become one. Simultaneously,
these two Sections correspond to regions where the baritic and siliceous caps attain their
greatest thickness and overly the central feeder of the stringer system as defmed by aemmell
(1989; 1990). The remainder of drill core examined, formed a range over the lateral
extension of the cap zones. This also provided the means by which a relatively even
distribution of samples for geochemical work were collected. All samples and locations are
listed in Appendix 2.1.
2.1 Stratigraphic Position
The contacts between the barite cap, asp and massive sulphides were often difficult to
identify and extremely variable. The barite cap, predominantly composed of barite, often
contains a significant proportion of glassy silica pyrite or massive sulphide mineralisation.
Similarly, the asp may contain significant proportions of barite or massive sulphides. In
such occurrences, the barite cap and asp are occasionally fragmental.(Plate 2.1), however
more often they are pristine.

Plate 2.1: Fragmental barite and GSP:- a) RSOO5:- The GSP is a milky grey chert that shows minor pyrite and barite veins. Barite laths are themselves fractured and form nodules of fragmental barite. b) RS75:- Fragmental GSP which contains minor pyrite and barhe filled cavities and veins. The apparent banding of siliceous fragments is due to fine grained disseminations of pyrite.
Plate 2.2: Underground development exposure (89-77WXC, 450 Level) of a sharp contact between the massive sulphide and GSP. The GSP contains a significant proportion of barite as veins, but is dominated by the presence of silica and pyrite (photo courtesy of B. Gemmell).
Plate 2.3: Underground development (450 Level) exposure of a sharp contact between the massive sulphide and barite cap. The barite cap contains a significant proportion of GSP, but is dominated by the presence of barite (photo courtesy of B. Gemmell).
Plate 2.4: RS70:- A sharp contact between high grade massive sulphides and the barite cap. The barite cap contains 1 to 2 cm barite laths in a fine grained pyritic and baritic matrix. Cross cutting the massive sulphides, is a pyrite and barite vein that contains small (3 to 4 mm) laths of barite.
Plate 2.5: Contacts between the massive sulphides and barite cap. a) RS83:- A sharp contact between high grade ore, predominantly sphalerite and galena, and the barite cap. At the contact, fme grained colloform pyrites are well developed. The massive barite consists of fragmented and rounded laths in a fine grained baritic matric, with colloform and disseminated pyrite. b) RS89:- A gradational contact between massive sulphides and the barite cap. The barite is dominantly fine grained and contains colloform to recrystallised pyrite.
Plate 2.6: Baritic veining of underlying massive sulphides. a) RS56:- Intense barite veining within massive sulphide. Barite is predominantly fmed grained. b) RS 17:- Fine grained banded sulphides; including pyrite, galena and sphalerite, with coarse to fine grained barite and pyrite veins.
Plate 2.7: Underground development exposure of a sharp contact between the barite cap and HVS (450 Level; Photo courtesy of B. Gemmell).
Plate 2.8: Contact between the HVS and barite cap. a) RS92:- Rounded barite fragments hosted in a sericite altered fine grained volcaniclastic. The rounded barite clasts show large tabular barite laths in a fine grained baritic groundmass, and minor disseminated pyrite. b) RS129:- Fragmental HVS and barite. The barite is dominantly fine grained, with occasional tabular laths.

111
1111
1111
1111
1111
1111
1111
1111
1111
1111
1111
1111
1111
1 11
\1\\1
=
~:
w
E
~:
(n~
~:
~~
~:
.o
§
~~
---
==
=
CIC
:) _
E
-N"S
er
.>
-=
C)
:::::;
;;
--'
.:;::.
.::=
....
=
=-:;;;
=-=
:A
§
=
;:;;;;;
00

9
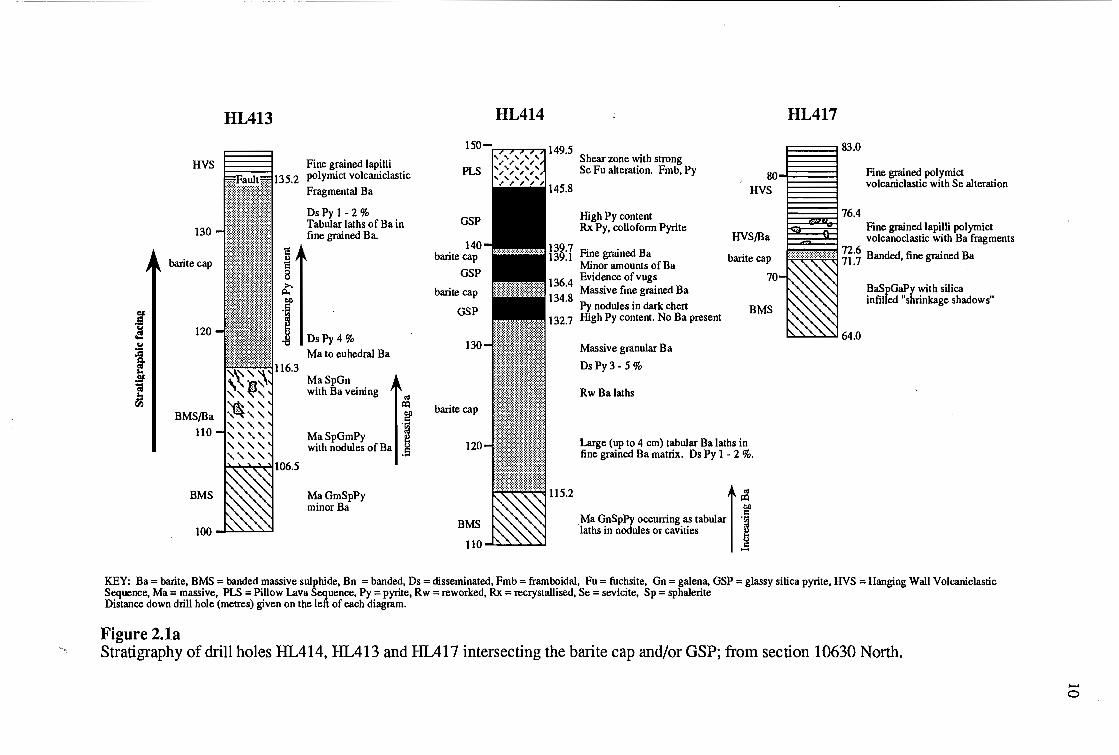
HL414 (Figure 2. la) shows an interdigitating relationship between the barite cap and GSP.
The contact between the GSP and barite is commonly sharp, but irregular. Frequently, the
barite cap, which overlies massive sulphide mineralisation, is itself overlain by the GSP.
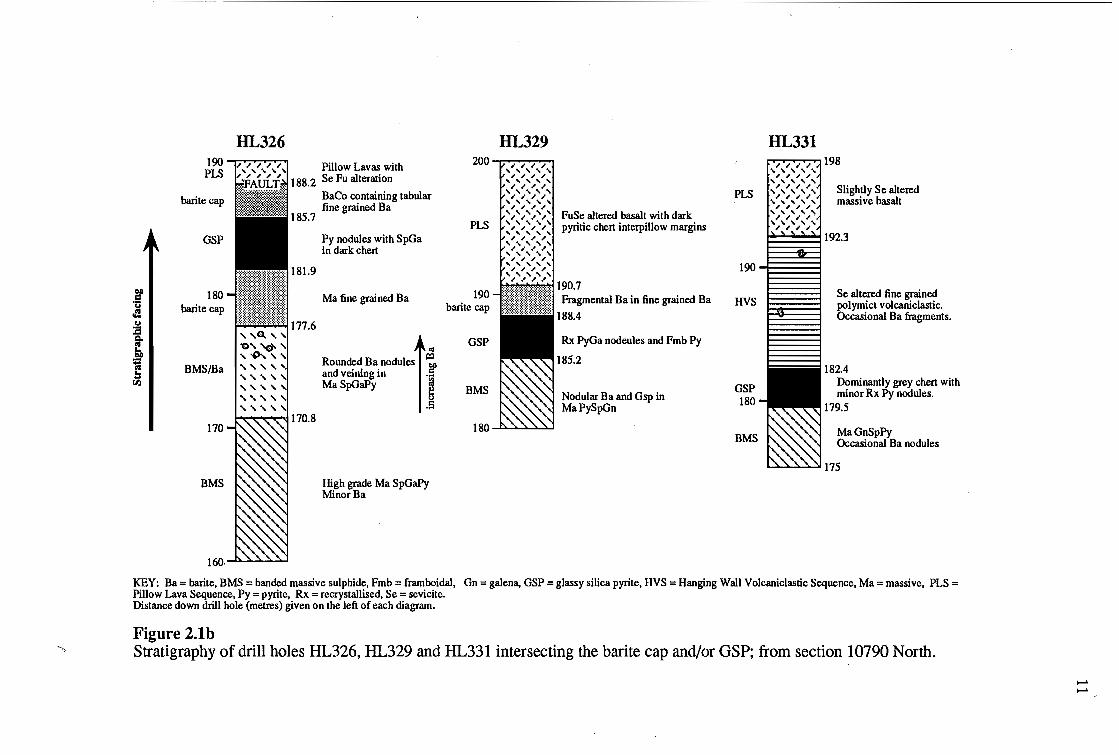
This is however, not always observed. Section 10790 N (Figure 2.1b and 2.2b) shows the
GSP to occur within the barite cap (HL326), underlie the barite cap (HL329) or occur in
regions where the barite cap is absent; such that the GSP is in direct contact with underlying
massive sulphides (HL331 and Plate 2.2). The GSP frequently contains nodules of
fragmental barite. These are thought to represent early barite formation, followed by
fragmentation, which was subsequently followed by GSP formation (Figure 2.1 b and 2.2a).
The contacts between the barite cap and massive sulphides vary from sharp and irregular, to
diffuse (Plates 2.3, 2.4 and 2.5). In the former instance, barite occurs as tabular laths in a
fme grained granular baritic matrix (plate 2.4) or as massive barite of highly variable grain
size. In barite peripheral to massive sulphides, occasional bedding has been observed.
Diffuse contacts between the barite cap and massive sulphide may be gradational from
centimetres to meters (HL326, HL413 and Plate 2.1), where the proportion of barite in the
massive sulphides increases toward the hangingwall or contact with the barite cap. Barite in
the massive sulphides also occurs as veining (plate 2.6) or as nodules ftlled by tabular barite
and carbonate. The width of the barite veins is variable from between 1 to 2 mm to 10 to 30
cm zones of banded massive sulphidelbarite or crustiform barite veins.
Where the HVS is present, its contact with either the GSP or barite cap is sharp (HL331,
HL413, HL417 and Plate 2.7). The HVS, a fine grained, polymict volcaniclastic, is strongly
altered by sericite proximal to the contact with either the barite cap or GSP. Commonly,
subrounded to angular fragments of barite are incorporated within the HVS (Plate 2.8). No
fragments ofGSP were observed in the HVS.
Predominantly, the contact of the barite cap or GSP with the PLS is faulted. Drown and
Downs (1990) conclude that faulting and shearing at the orebody-hangingwall conta?t is the
result of strain partitioning between ductile and brittle lithologies. The PLS shows variable
intensities of sericite and fuchsite alteration, commonly associated with cleavage
development. Interpillow margins, consisting of a dark chert, in places display carbonate
and/or minor baritic veining.
1-:. l
HL414� HL417HL413
.,....,...-r-T""7""'>I 149.5 Shear zone with strong
HVS� Fine grained lapilli PLS� Se Fu alteration. Fmb, Py Fine grained polymiet polymict volcaniclastic� 80
volcaniclastic with Se alteration Fragmental Ba� HVS
Os Py I - 2 %� 76.4High Py contentGSPTabular laths of Ba in Rx Py, colloform Pyrite Fine grained lapilli polymict 130 fine grained Ba. HVS/Ba volcanoclastic with Ba fragments 140
barite cap Fine grained Ba barite cap R"~"¥'d ~i:~ Banded, fine grained Ba barite cap� ~ Minor amounts of Ba�
8 GSP Evidence ofvugs 70�
I t: barite cap Massive fine grained Ba BaSpGaPy with silica
infilled "shrinkage shadows" Py nodules in dark chert BMSGSP High Py content. No Ba present�
120� OsPy 4 %
130� Massive granular BaMa to euhedral Ba� OsPy3-5%�
'~'~ . MaSpGn� with Ba veining Rw Ba laths�oS~,',
~" ~ barite cap BMS/Ba ,~" ~
110� "" Ma SpGmPy '.~.. Large (up to 4 cm) tabular Ba laths in "" with nodules of Ba ::: 120 fine grained Ba matrix. Os Py 1 - 2 %. "" ""
................................... 115.2�
loS�BMS Ma GmSpPy ~
minor Ba OIl�
.Ma GnSpPy occurring as tabular .c::�BMS laths in nodules or cavities J
110 ...........>0....;........."'-'�
KEY: Ba =barite, BMS =banded massive sulphide, Bn =banded, Os =disseminated, Fmb =framboidal, Fu =fuchsite, Gn =galena, GSP =glassy silica pyrite, HVS =Hanging Wall Volcaniclastic� Sequence, Ma =massive, PLS =Pillow Lava Sequence, Py =pyrite, Rw =reworked, Rx =recrystallised, Se =sevicite, Sp =sphalerite� Distance down drill hole (metres) given on the left of each diagram.�
Figure 2.1a Stratigraphy of drill holes HL414, HL413 and HL417 intersecting the barite cap and/or asp; from section 10630 North.
..... o
HL326 HL329 HL331 190 ..,...,.,...,......,.....,....,,...., PLS
barite cap
200 --r.~~.,......,~~~.,......,~..,, , , , , ~ ~ ~ ~, , , , , ~ ~ ~ ~, , , , , ~ ~ ~ ~, , , , , ~ ~ ~ ~
PLS Slightly Se altered massive basalt
PLS '~'~'~'~' >>>>~
FuSe altered basalt with dark pyritic chert interpillow margins
~ ~ ~ ~GSP� Py nodules with SpGa , , , , , ~ ~ ~ ~in dark chert� , , , , , ~ ~ ~ ~, , , , , ~ ~ ~ ~ 190, , , , , ~ ~ ~ ~
180 190� Se altered fine grained Ma fine grained Ba HVSbarite cap� barite cap lillllllllllllllllllllllllllllllllll : E~:mental Ba in fine grained Ba polymict volcaniclastic.
Occasional Ba fragments. 11::::"Q, ''I. GSP Rx PyGa nodeules and Fmb Py '0' 'd" ,~" 185.2Rounded Ba nOdUlesf~BMS/Ba ""'I.� 182.4and veining in .S""'I. MaSpGaPy g� Dominantly grey chert with
GSP""'I.� BMS Nodular Ba and Gsp in minor Rx Py nodules. ""'I.� 180MaPySpGn� 179.5""'I.� .S
~~.........J170.8 170 Ma GnSpPy
BMS Occasional Ba nodules
BMS� High grade Ma SpGaPy� Minor Ba�
KEY: Ba = barite, BMS = banded massive sulphide. Fmb = framooidal, Gn = galena, GSP = glassy silica pyrite, HVS = Hanging Wall Volcaniclastic Sequence, Ma = massive, PLS = Pillow Lava Sequence, Py = pyrite, Rx = recrystallised, Se = sevicite. Distance down drill hole (metres) given on the left of each diagram.
Figure 2.1b� Stratigraphy of drill holes HL326, HL329 and HL331 intersecting the barite cap and/or GSP; from section 10790 North.�
..... .....

a
1!.0
I: uo
'"
~ HVS ''1:1'
• GSP
~ Barite Cap
Cl Massive Sulphide .' .
l~
'" '"
HL-l14/\\
'....\.t:-I...
j~
uo
'"
PLS
/fl_J._ 550
.1_
00 PLS 500
450 -150
'" I~
'"
I~
uo
'" [d·'O·1 HVS
~ bo
• GSP
550 ~ BariteCap
0 Massive Sulphide . .
\ -("3
,:~
I;;
/\ "f
"('.12_
" .
'" I~
la.'.
PLS
~.t:...), 5.ll
500 PLS
450 4i.!!l
'" '" I~
Figure 2.2: Cross sections a) 10630 North and b) 10790 North, wbich show the stratigraphic position of the cap zones and immediate stratigraphy

13
2.1.2 The Observed Relation Between the Barite Cap and GSP
The interdigitating contacts between the GSP suggest that the fonnation of the caps were near
contemporaneous. Siliceous veins transecting the barite cap would indicate barite to the an
earlier phase. The common occurrence of nodules of fragmental barite, encompassed in
pristine GSP, would support this.
2.2 Lateral distribution of the Caps
As it was not feasible to consider each hole intersecting barite and/or GSP mineralisation, the
lateral distribution of the cap zones were largely derived from existing mine section
interpretations. The coordinates used in the construction of the plan projection for barite cap
and GSP were derived from mine section interpretations (Appendix 2.2). Where applicable
core logging from this study was integrated.
2.2.1 The Barite Cap
The baritic cap, bounded by the orebody extremities, forms an elongate lens with a north
northeast to south-southwest trend (Figure 2.3a). The barite cap does not form a continuous
sheet over the orebody, but is rather an irregular cap that shows continuity. The barite cap
extends from 10950 N to 10330 N, with a small lens located at 11030 N.
2.2.2 The GSP
The GSP forms a discontinuous and irregular cap (Figure 2.3b). The main occurrence is
from 10670 N to 10850 N. Small irregular lenses of GSP occur on the western ore block at
10750 N north, 10800 N and 10700 N. These lenses of GSP are in direct contact with
underlying mineralisation, in the absence of the barite cap. With these exceptions, the
occurrences of the GSP correlate to the that of the barite cap, shown in Figure 2.4.
2.2.3 The Hellyer Stringer System
Gemmell (1988; 1989) and Gemmell and Large (in press) have defmed three main feeder
systems within the stringer system underlying the Hellyer massive sulphide deposit. The
three feeder systems are outlined by centres of pyrite concentration in the stringer system and
indicate the hottest parts of the mineralising system. The central feeder is best developed,
while the northern and southern feeders are thought to represent secondary systems. The
locations of each of the three feeders is shown Table 2.1.
;'

- ..------ ----------------------------------------------;-----
:Na TN
~ J ~-Q-~Q------.... ---
1~~_0_0__1---
WF.STlmN ORE 1I1.0CK
10600
10400
-1~--.....:..~,.---__1
EASTlmN ORF. RLOCK
BarileCapc::=J ~ Massive Sulphide l...:...-:-:..I
EASTERN ORE BI.OCK
10800
W~:STF.RN
ORE 1I1.0CK
10600
...... . . .
i0400
c=J asp
..---;-:1 ~
Massive Sulphide
o o 00 II'l
Figure 2.3: Plan projection of a) the barite cap and b) the asp, relative to massive sulphide mineralisation. The barite cap is an irregular, but continuous sheet from 10330 N to 10950 N. The asp fonns an irregular, thin discontinuous cap, which is most developed between 10670 Nand 10850 N.

15�
I I i 11100'---I'-----;----1'-------,---...-------.
11000 I 1 --.--, -.-.._._._
109001 1 1
10800 1 1------
Cl 10700 1 1 I ----- -... ,.------
Z-::r: Eo::: o z 10600, , \~J
10500, ,
- - - - GSP
- BariteCap
10400 1 I \~f1 ----,.
I: :':. I Massive Sulphide
103001 I
102001 1 1 I I 1
5500 5600 5700 5800 5900 6000 EASTING
Figure 2.4:. -Plan projection of the barite cap and GSP superimposed over massive sulphide mineralisation. The main occurrence of the GSP correlates with that of the barite, circumferential to the Jack Fault.

16
Feeder eastern ore block western ore block
northern feeder 10950 N central feeder 10850 N 10700 N southern feeder 10500 N
Table 2.1: The location of the three feeder systems in the stringer zone as defined by Gemmell (1988; 1989) and Gemmell and Large (in press).
The occurrence of the barite cap correlates well to the location of the central and southern
feeders. The small lens of barite at 11030 N overlies the northern feeder. Similarly the GSP
is best developed over the position of the central feeder, but is absent from the vicinity of the
southern and northern feeders.
Gemmell and Large (in press) showed the three feeders, after reconstruction of the movement
on the Jack Fault, align in a northeast-southwest trend that is oblique to the Jack Fault. The
intersection between the feeder system trend and the Jack Fault, is the location of the central
feeder (Figure 2.5). The authors suggest that intersection of the feeder system trend and the
Jack Fault provided a structural control on hydrothermal discharge sites. The trend of the
barite cap (Figure 2.3a) is observed to be subparallel to the feeder trend, which would
support this.
Ttl GfJ
\~ FEEDER SYSTEMS
L?:::J STnUJGER zoue
__ OUTUIJE OF oVenlYIf·IG ORE90DY
"R/E-;ACf( FAUl r
lOOm
;>\. ....1 \/lEW
Figure 2.5: Location and distribution of the feeders in a pre-Jack Fault reconstruction of the stringer zone (at approximately 400 metres R.L.). The three feeders are aligne~lon a trend that is acute to the trend of the Jack Fault, however the central feeder is located where the two structural trends cross (from Gemmell and Large, in press).

17
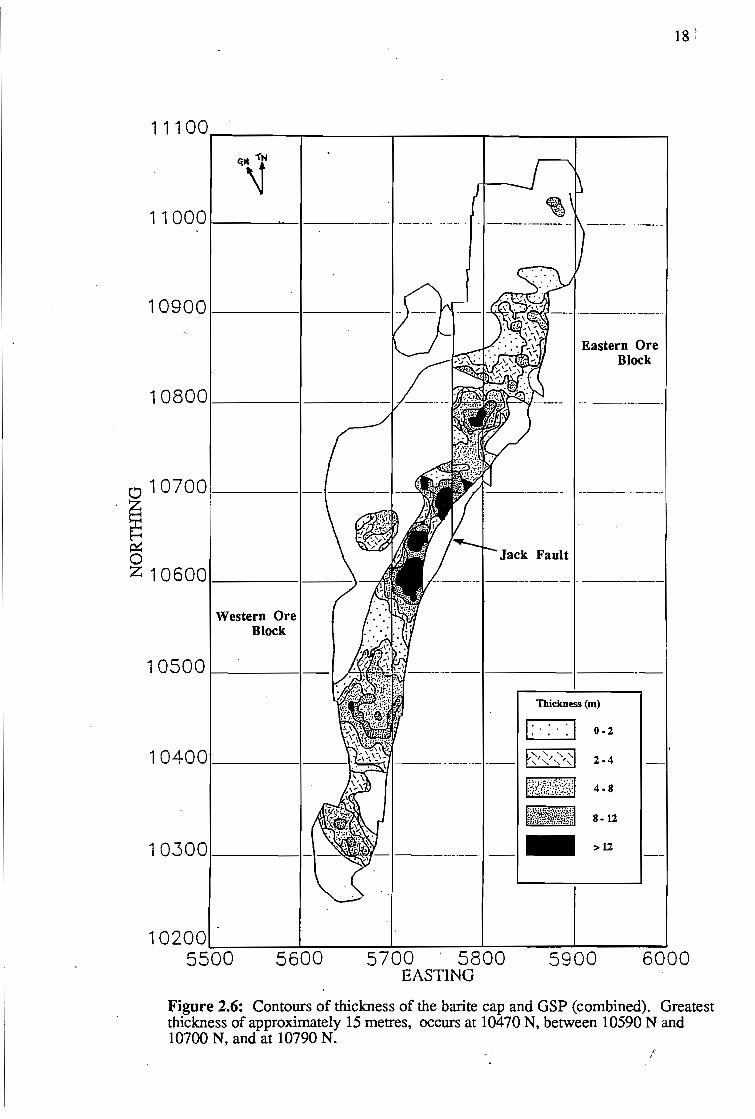
2.3 Thickness
Contours of the thickness of the barite cap and asp are shown in Figure 2.6. The contoured
plan projection of cap thickness is derived from the Hellyer DATAMINE database using
linear block kriging (refer McArthur and Kuipers, 1990). Due to the irregular and
infrequent occurrence of the asp, the two cap'zones were combined. The contoured plan
(Figure 2.6) is based on the 1990 ore reserves and, as a consequence, the cap distribution is
slightly different from that previously derived by mapping and logging (Figure 2.4).
The cap zones show highly variable thickness and consequently a longitudinal projection of
the cap zones was not attempted. Maximum cap thickness, of 15 metres, is attained at 10790
N, between 10590 N and 10700 N and at 10470 N. North of 10800 N, the cap thickness is
less than 8 metres. The thickness of the caps is therefore greatest over the hydrothermal
feeders, which also correspond to regions where both the barite cap and asp are present.
2.4 Faulting
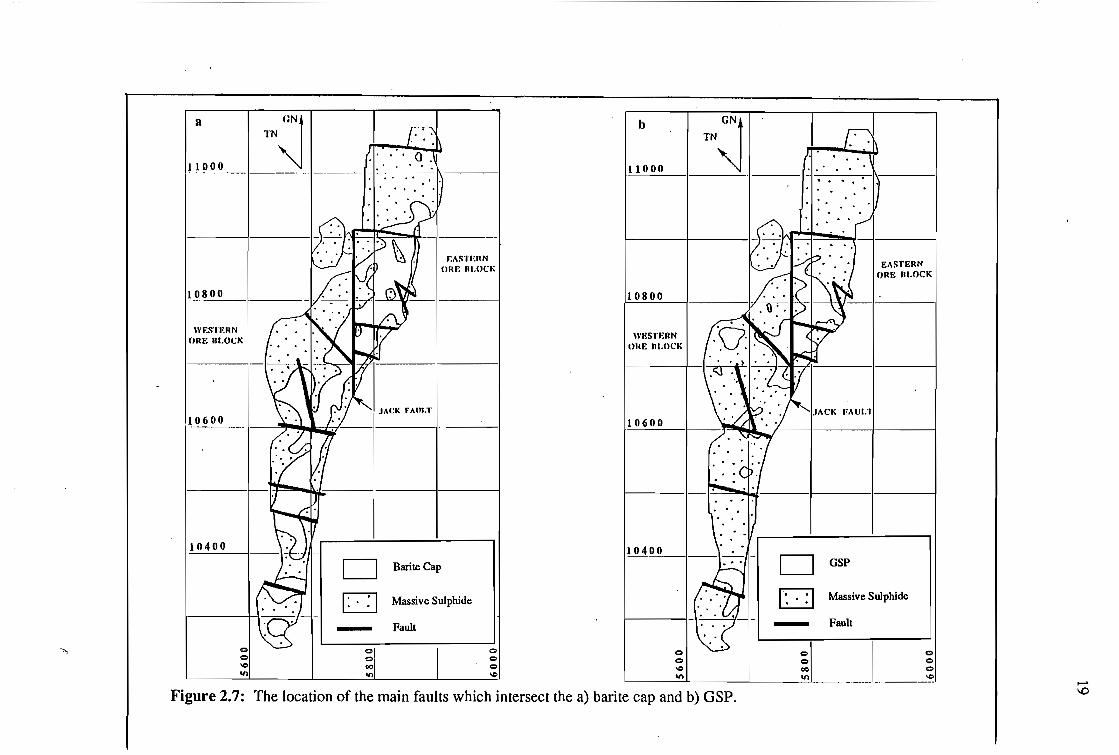
Figures 2.7a and 2.7b show the position of the main faults intersecting the barite cap and
asp respectively. The location of faults were derived from the orebody model, as proposed
by the geologists at the Hellyer deposit.
The orebody, and consequently the barite cap and the asp, are offset by a number of ~
faults. The barite cap and asp are well developed circumferential to the Jack Fault. The
lateral distribution of the barite cap would indicate a close spatial affinity to the faults (Figure
2.7a), whilst the asp shows no obvious correlation, except in regions proximal to the Jack
Fault (Figure 2.7b). The faults presently transecting the orebody are thought to be the result
of strain partitioning during deformation (Drown and Downs, 1990). McArthur (1989)
suggested there to be no structural control on the depositional sites of the barite cap and asp. There would however, appear to be a spatial association between the barite cap and the
location of the orebody faults, in particular that of the Jack Fault.
2.5 Conclusions
The barite cap and asp are most developed between 10670 N and 10790 N. In these
regions, the cap zones attain maximum thickness and overly position of the central feeder,
proximal to the present Jack Fault. A Cambrian structure (pre-Jack Fault) is believed to have
existed at the time of mineralisation (R.C. Downs, pers. comm.). The distribution of the
barite cap is an irregular, but continuous lens, which is subparallel to the trend of the feeder.
r I
18 :�
11100 I i i i i i
"\f� 11000, 1__'
10900 1 1----·
Eastern Ore Block
108001 1-
0107001 1
~
~ o Jack Fault
z 10600 1 I}---t,'\,'i, /----·--1--·_·--_·- ,. -------
Western Ore Block
10500 1 1
Thickness (m)
1:-:-:1 0·2
104001 I \,I=S\::?11 ._.J __1 ~>~/,",-:I 2.4
4·8
8· U
>U103001 1 I ~"!f- ,-----------.-- -10200, I ! I ! !
5500 5600 5700 5800 5900 6000 EASTING
Figure 2.6: Contours of thickness of the barite cap and GSP (combined). Greatest thickness of approximately 15 metres, occurs at 10470 N, between 10590 Nand 10700 N, and at 10790 N.
/
a
~ TN
11000 . --_ ...... _ ---_.
b
11000 ~ TN
WESTERN ORE III.OCK
I_~~_~I----
F.'"STEll N OItE RLOCK
Wt:STERN OIlE IILOCK
10800
E"'STERN ORE R1.0CK
1l!!-OO--j---~W'fi;;/.:'iI--_i·----I---_j 10600
10400
D o - Fault
BariteCap
Massive Sulphide
10400 D o - Fault
GSP
Massive Sulphide
Figure 2.7: The location of the main faults which intersect the a) barite cap and b) asp.

20
The asp, however is thin, irregular and discontinuous. The barite cap and asp show
gradational to sharp contacts with massive sulphide mineralisation. Barite veining in the
massive sulphides is a common feature of the gradational contacts. An interdigitating
relationship exists between the barite cap and asp, however the genetic relation of the caps to
one another remains obscure and is addressed in mineralogical and textural studies (Chapter
Three).
!

21
Chapter Three Mineral and Textural Paragenesis
3.1 Introduction
Barite and quartz are the predominant minerals in the barhe and silica caps of the Hellyer
deposit. Sulphides present in both of the cap zones include; pyrite, sphalerite, galena,
tetrahedrite-tennantite and chalcopyrite, in the stated order of abundance. Arsenopyrite is
abundant in the GSP, however it is totally absent from the barhe. Other minerals observed
include calcite, sericite and chlorite. The sulphides form texturally intricate, fine grained
intergrowths and overgrowths. As a result, is is useful to describe the characteristics of each
mineral phase below, in order to broadly define textural and mineral paragenesis. This
necessitates a range of samples to be considered, in order to assess the environment of
formation.
In addition to routine microscopy, twelve samples from the the barite cap and GSP were
investigated under a Phillips Model 505 SEM. The samples, in the form of small chips,
were initially etched in hydrofluoric acid for 10 minutes (refer Duhig, 1991), and then
washed thoroughly in distilled water. They were dried at I()()OC for 24 hours prior to
mounting on to a suitable holder. Prepared samples were submitted to the CSL for gold
coating prior to examination.
3.2 Barite
Barite (BaS04) has a hardness of3 to 3.5 and a specific gravity of 4.5 (Dana 1944). Its high
specific gravity and soft brittle nature are distinguishing features. Barite is the predominant
mineral in baritic mineralisation and present, to a lesser extent, in the GSP.
Barite from the barite cap ranges in occurrence from massive interlocking subhedral to
euhedral grains, (measuring up to lcm in size, Plate 3.1 and 3.2), to well formed crystalline
tabular laths (Plate 3.3) measuring up to 10 cm in size. In these zones, sulphides occur as
minor component. In hand specimen well crystalised barite had a pink colouration, which
may be the result of very fine grained disseminations of hematite. Since the barite often
displayed a yellow fluorescence, it is likely that iron or other impurities ~xist in the crystal
structure. Tabular barite laths occasionally exhibit zonation and in general contain numerous
/'
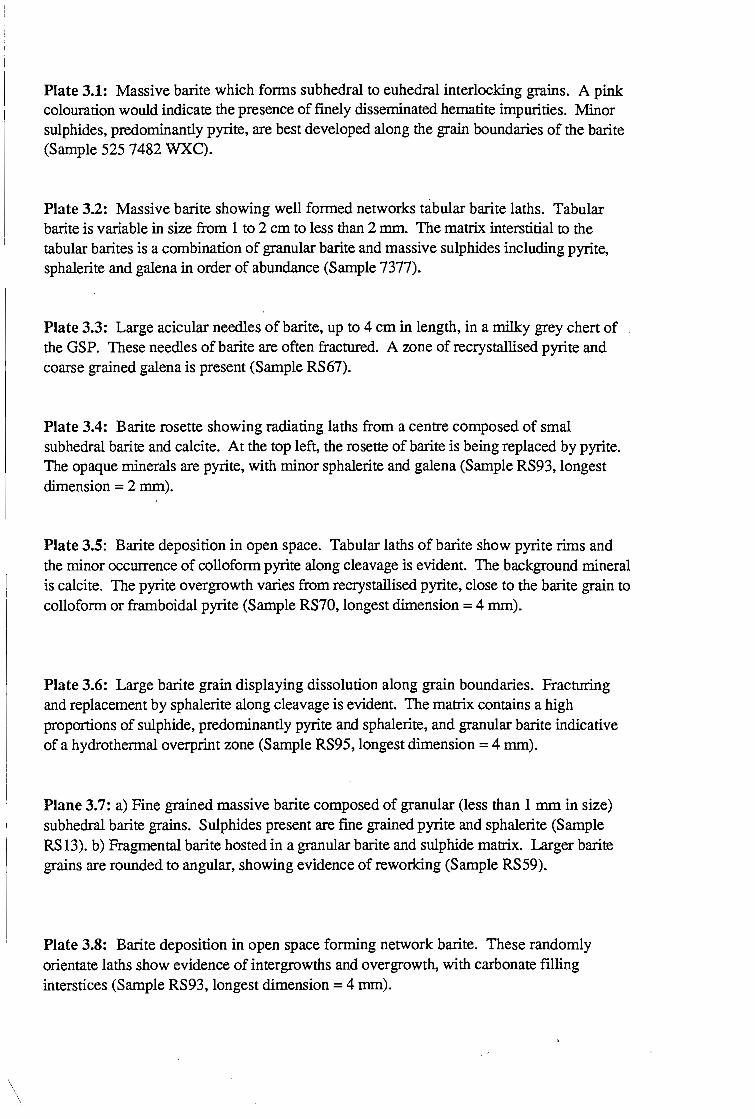
Plate 3.1: Massive barite which forms subhedral to euhedral interlocking grains. A pink colouration would indicate the presence of finely disseminated hematite impurities. Minor sulphides, predominantly pyrite, are best developed along the grain boundaries of the barite (Sample 525 7482 wx.C).
Plate 3.2: Massive barite showing well formed networks tabular barite laths. Tabular barite is variable in size from 1 to 2 cm to less than 2 mm. The matrix interstitial to the tabular barites is a combination of granular barite and massive sulphides including pyrite, sphalerite and galena in order of abundance (Sample 7377).
Plate 3.3: Large acicular needles of barite, up to 4 cm in length, in a milky grey chert of the GSP. These needles of barite are often fractured. A zone of recrystallised pyrite and coarse grained galena is present (Sample RS67).
Plate 3.4: Barite rosette showing radiating laths from a centre composed of smal subhedral barite and calcite. At the top left, the rosette of barite is being replaced by pyrite. The opaque minerals are pyrite, with minor sphalerite and galena (Sample RS93, longest dimension = 2 mm).
Plate 3.5: Barite deposition in open space. Tabular laths of barite show pyrite rims and the minor occurrence of colloform pyrite along cleavage is evident. The background mineral is calcite. The pyrite overgrowth varies from recrystallised pyrite, close to the barite grain to colloform or framboidal pyrite (Sample RS70, longest dimension =4 mm).
Plate 3.6: Large barite grain displaying dissolution along grain boundaries. Fracturing and replacement by sphalerite along cleavage is evident. The matrix contains a high proportions of sulphide, predominantly pyrite and sphalerite, and granular barite indicative of a hydrothermal overprint zone (Sample RS95, longest dimension =4 mm).
Plane 3.7: a) Fine grained massive barite composed of granular (less than 1 mm in size) subhedral barite grains. Sulphides present are fine grained pyrite and sphalerite (Sample RS13). b) Fragmental barite hosted in a granular barite and sulphide matrix. Larger barite grains are rounded to angular, showing evidence of reworking (Sample RS59).
Plate 3.8: Barite deposition in open space forming network barite. These randomly orientate laths show evidence of intergrowths and overgrowth, with carbonate filling interstices (Sample RS93, longest dimension = 4 mm).

J=
\\111\
\111\
\lilibI
IIIIII
1111
111 ~111
11111111
~IIIIII
n=
1'_
.J=
0_
:>=
-=-=
,J =
N
N

23
fluid inclusions. Intergrowths of barite are common and radiating "rosette" barite aggregates
have been observed (Plate 3.4).
Barite grains, in zones with a high sulphide content, were often rounded and fractured. This
would suggest that the barite has been reworked and suffered dissolution. Sulphide
deposition along barite grain boundaries is a common feature (Plate 3.5). As barite has three
cleavage planes, later sulphides deposit in and/or replace barite along cleavage planes or
fractures (Plate 3.6). Fine grained or granular (Plate 3.7a) consists of 0.5 to 1 mm rounded
subhedral barite grains which often fonn a groundmass. The nature of fragmented barite
(Plate 3.7b) has been interpreted to be the result of reworking of the barite. The reworked
areas are often associated with a large proportion of sulphides. Large tabular barite laths are
frequently hosted granular barite. Barite deposition in open space (plate 3.8) can be
concluded from the random deposition of tabular barite laths (or network barite) with
subsequent late infilling by carbonate and/or silica and/or granular barite.
In the GSP, barite may occur as either barite cap fragments or zones of network laths, which
have been encompassed by silica. The latter is interpreted to indicate influx of silica (GSP
deposition) after precipitation of the tabular barite. Barite cap fragments in the GSP are
indicative of reworking processes, which see clasts of massive barite incorporated into the
GSP, during GSP deposition. Minor occurrences of late barite have been identified from vug
linings and cross cutting veinlets. Late barite veins in underlying massive sulphides are either
crustiform (Plates 3.9 and 3.10) or granular in nature (refer Chapter 2, Plate 2.6). Crustifonn
veins are composed of acicular barite laths, of variable size.
Paragenetically, broad stages ofbarite precipitation can be detennined. Numerous
overgrowths of small barite grains by larger barite grains indicates differential stages of barite
growth. The earliest identifiable phase is that exhibited by the well formed acicular and
tabular laths and the crystalline massive barite. Granular barite appears to be paragenetically
late, as are the crosscutting barite (and/or carbonate) veinlets and vug linings, and crustiform
veins within massive sulphides.
3.3 Quartz
The GSP is predominantly a quartz-iron horizon. The textural classification used to classify
the GSP is derived from Kneller et al. (1986) and Duhig (1991).
fl,

Plate 3.9: Crustiform barite veining from within the massive sulphides. The vein contains large tabular barite laths with a pyrite/chlorite centre (Sample 7377 SD).
Plate 3.10: Barite veining through massive sulphides. The sulphides, predominantly pyrite, are fractured and healed by granularbarite. The crustiform vein (bottom right) is composed of small barite laths (less than 1 mm) to small subhedral barite grains (Sample 5976 WXC).
Plate 3.11: Contact between the barite cap and the GSP. The apparent banding in the milky grey chert is the result of fmely disseminated pyrite. The fine grained granular barite of the barite cap shows a transecting siliceous vein, that is rimmed by crystalline pyrite in the GSP (Sample 450E).
Plate 3.12: GSP with barite. The GSP is a milky grey chert exhibiting banding due to fmely disseminated pyrite. The barite at the edge of the GSP is of a different stage (either later or earlier?) than the GSP. The large barite lath (centre) is encompassed by the GSP and shows a rim of calcite (Sample 7377).
Plate 3.13: Typical GSP a) Top - The GSP has a high sulphide content which is predominantly pyrite. These sulphides are colloform in nature and encompassed by microcrystalline quartz. The microcrystalline quartz has a high content of disseminated pyrite, which causes the chert to exhibit a dark grey colouration (Sample RS106). b) Bottom - Grey chert with nodules of recrystallised pyrite. The chert, composed of microcrystalline quartz, has a high content of disseminated pyrite. Sphalerite and galena are present in minor amounts in the chert (Sample RS42).
Plate 3.14: An infilling of open space by large equant megaquartz grains. The background matrix is microcrystalline quartz that contains a significant proportion of pyrite. The cavity shows a rim of microcrystalline quartz and a terminal filling of calcite in the centre (Sample RS32, longest dimension =2 mm).

1011I1
111111
111111
111111
1\1111
111111
111111
111111
111111
111111
111111
1IIIII
IIIIII
IIIIII
IIjlll
l'~'
1 \Q
8 \L
\ \S
\17
1£ le
I~
:11 1
1111
1i11\1
111 IlI
Idl1l1
1111
1lillllll
llll 111
111111
1111
11111
11fil
l
Ii~jll;1
111111
~11111
111~11
11111~
1\1111
11~111
11111~
\1111\
11~lll
lllll~
llIll

25
Broadly the GSP can be classified into two different silica polymorphs. These silica
polymorphs are:
Microcrystalline Quartz: Equidimensional grains from 0.01 to 0.001 mm size,
with undulatory extinction and pinpoint birefringence.
Megaquartz: Distinguished by eqmint to elongate grains larger than 0.02mm.
3.3.1 Microcrystalline Quartz
Microcrystalline quartz is the main silica polymorph component of the GSP. In undefonned
samples (Plates 3.11 and 3.12 respectively) the GSP is a light milky grey, with finely
laminated bands. In thin section, banding appears to be the result of widely disseminated
euhedral and framboidal pyrite. The differences in pyrite contents delineate an apparent
primary banding. No delineation of banding by differential quartz sizes is evident.
In more typical GSP samples (plates 3.13) the chert of the GSP is a dark grey. The dark
grey colouration of the chert is probably due to the large proportion of pyrite observed in
microcrystalline quartz. The variation in the colour of the GSP, from milky grey to dark
grey, is likely the result of an increase in pyrite within microcrystalline quartz aggregates.
The GSP contains numerous cavities and is thus highly porous. Cavities are typically round
to elongate in nature, some being as large as 20 cm in size. These open spaces are infilled
by, firstly a microcrystalline chert'lining and secondly by subhedral equant megaquartz ±
barite and/or carbonate (Plate 3.14).
SEM examination of chert from the GSP at Hellyer showed that the microcrystalline chert
was composed of subhedral silica grains, with no evidence to suggest that bacterial fIlaments
were present (Figure 3.15). Submarine thennal vent sites are typically colonized by sulphur
oxidising bacteria, as noted by other workers (Zirenber and Schiffrnan, 1990; Duhig, 1991).
It is therefore possible that bacterial fIlaments at Hellyer, have been masked or completely
replaced by the sulphide phases if they were present.
3.3.2 Megaquartz
The deposition of megaquartz is paragenetically late within the cap systems. Its occurs as
equant grains which fill cavities in both baritic and GSP mineralisation (Plate 3.14).
!'

Plate 3.15: SEM micrographs
a) Barhe being replaced by megaquartz in the asp (Sample RS202, scale bar = 10 microns).
b) Close up of the nature of the contact between the barhe and megaquartz in a). (Sample RS202, scale bar = 10 microns).
c) Isolated barite lath in microcrystalline quartz (Sample RS32, scale bar = 10 microns).
d) Texture of elongate megaquartz within the asp (Sample RS32, scale bar = 10 microns).
e) Texture of me.uartz of the asp (Sample RS32, scale bar =10 microns).
t) Texture of microcrystalline quartz with pyrite framboid. Shows a distinctinve grannular nature (Sample RS32, scale bar = 10 microns).
g) Microcrystalline quartz aggregates in the asp (Sample RS67, scale bar = 10 microns).
h) Microcrystalline quartz aggregates in the asp (Sample RS67, scale bar = 10 microns).


27
Megaquartz is also present within late stage carbonate ± barite crosscutting veinlets. An
elongate megaquartz fonn, is commonly observed in pressure solution shadows around
pyritic aggregates (associated with sericite and chlorite development). Essentially, the
megaquartz appears to fill interstices between sulphides, barite accretions and open spaces in
the microcrystalline chert.
3.3.3 Silica Pseudomorphs
The genetic association of the barite cap to the asp is enhanced by the presence of silica
pseudomorphs. Sample RS32 highlights this relationship in particular. Here, well formed
laths of barite occur in fine grained microcrystalline chert. The tabular barite grains are
pseudomorphed, either completely or partially by quartz (Plates 3.16 to 3.20). The
occurrence of tabular barite laths in asp appears to be the result of either, fragmental barite
incorporated into the asp from reworked or collapsed structures; or low temperature silica
polymorph deposition in a network of open space network barite laths. Quartz
pseudomorphs are composed of 0.04 to 0.08 mm megaquartz grains, which are smaller in
grain size than that megaquartz contained in cavities. Where barite replacement has been
complete, quartz pseudomorphs fonn tabular ghosts. These ghosts may have either an
isolated occurrence (Plates 3.16 and 3.17) or constitute an array or network of interlocking
pseudomorphs (Plates 3.19,3.29 and 3.20). This pseudomorph style is frequently observed
throughout the asp and represents the dissolution of barite and its movement out of the
asp.
3.4 Pyrite
Pyrite is the most abundant sulphide mineral in the barite and asp caps and occurs as
framboids, framboidal aggregates, spongy aggregates, concentric growths, collofonn
intergrowths, crystalline pyrite and recrystalised pyrite. Pyrite shows a wider textural
variation in the asp than observed ill the barite cap.
3.4.1 Pyritic Textures in the asp Concentric pyrites are intergrown by galena and/or sphalerite (Plate 3.21). These textures
may either represent contemporaneous intergrowths of pyrite, sphalerite and galena or the
deposition of sphalerite and galena into porous collofonn pyritic bands (Craig and Vaughn,
1981). If the latter is true, then sphalerite and galena are paragenetically later than the
colloform pyrite bands.
/'

Plate 3.16: A single barite lath in microcrystalline quartz of the GSP, being pseudomorphed by megaquartz (of dimensions 0.04 mm to 0.08 mm). The microcrystalline quartz contains framboidal pyrite. Plane polarised light (Sample RS32, longest dimension =2 mm).
Plate 3.17: As for plate 3.16 under crossed nicols (Sample RS32, longest dimension = 2 mm).
Plate 3.18: Network silica pseudomorphs in a pyritic microcrystalline matrix. The pseudomorphs show occasional relict barite cores. The silica pseudomorphs or ghosts retain a tabular outline and are a frequent occurrence in the GSP. Plane polarised light (Sample RS32, longest dimension = 2 mm).
Plate 3.19: As for Plate 3.18 under crossed nicols (sample RS32, longest dimension = 2 mm).
Plate 3.20: Incompletely replaced barite forming network silica pseudomorphs. The barite laths retains much of their tabular habit, showing megaquartz rims. These incompletely replace barite laths are a likely precursor to Plates 3.18 and 3.19. Crossed nicols (Sample RS202, longest dimension = 4 mm).
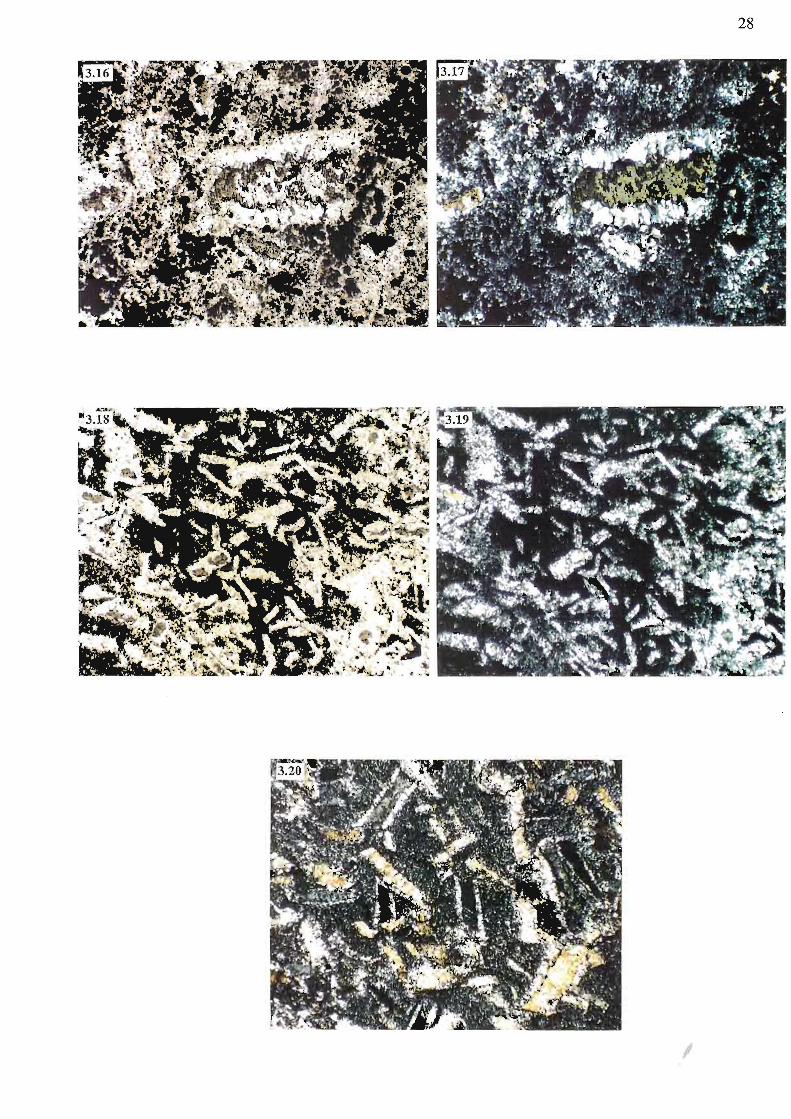
N
00

Plate 3.21: Concentric pyrites in microscrystalline quartz. The pyrite appears to be intergrown with sphalerite (light grey) and galena (pale grey). The core of each of the concentric pyrites/sphalerite/galena intergrowths is pyrite (Sample RS42, largest dimension = 250 microns).
Plate 3.22: Concentric overgrowths of framboids in megaquartz. The framboids are overgrown by two stages of galena deposition, intermittent to spongy pyrite formation. These galena rims are host to well formed arsenopyrite grains. (Sample RS27, longest dimension = 4 mm).
Plate 3.23: Colloform pyrites rythmically deposited in open space, possibly relict of a fluid conduit, now filled by megaquartz. Chalcopyrite is evident to fill fractures in the colloform pyrite (Sample RS 106, longest dimension = 1 mm).
Plate 3.24: Colloform pyrite encompassing a tabular barite lath in late stage galena and sphalerite (RS27, longest dimension =4 mm).
Plate 3.25: Rhythmically deposited spongy pyrite in sphalerite. The spongy pyrite is fractured, infilled by galena and sphalerite. The spahlerite shows chalcopyrite disease (Sample RS70, longest dimension = 2 mm).
Plate 3.26: Colloform pyrite with fine intermittent galena banding. The colloform pyrite shows later chalcopyrite, which infilled fractures in the pyrite. The dark grey back ground (top right) is microcrystalline quartz of the GSP (Sample RS32, longest dimension = 2 mm).

f' f;
.
-.~
U.l
!,!:
f ..
,N
,,,.
-< ''l
''.
U.l
·r
f '..
~I
:, . '.,
: -
-..
, 1
Jo-.:
...
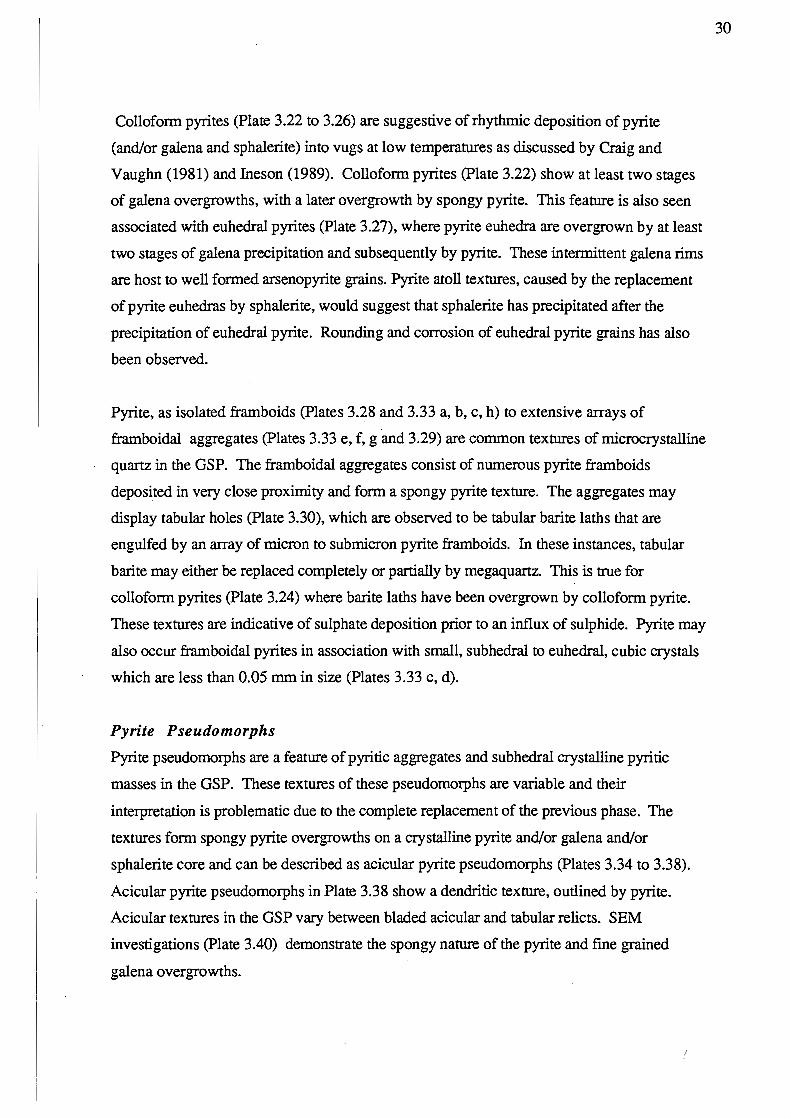
30
Collofonn pyrites (Plate 3.22 to 3.26) are suggestive of rhythmic deposition of pyrite
(and/or galena and sphalerite) into vugs at low temperatures as discussed by Craig and
Vaughn (1981) and Ineson (1989). Collofonn pyrites (plate 3.22) show at least two stages
of galena overgrowths, with a later overgrowth by spongy pyrite. This feature is also seen
associated with euhedral pyrites (Plate 3.27), where pyrite euhedra are overgrown by at least
two stages of galena precipitation and subsequently by pyrite. These intermittent galena rims
are host to well fonned arsenopyrite grains. Pyrite atoll textures, caused by the replacement
of pyrite euhedras by sphalerite, would suggest that sphalerite has precipitated after the
precipitation of euhedral pyrite. Rounding and corrosion of euhedral pyrite grains has also
been observed.
Pyrite, as isolated framboids (Plates 3.28 and 3.33 a, b, c, h) to extensive arrays of
framboidal aggregates (plates 3.33 e, f, gand 3.29) are common textures of microcrystalline
quartz in the asp. The framboidal aggregates consist of nwnerous pyrite framboids
deposited in very close proximity and fonn a spongy pyrite texture. The aggregates may
display tabular holes (Plate 3.30), which are observed to be tabular barite laths that are
engulfed by an array of micron to submicron pyrite framboids. In these instances, tabular
barite may either be replaced completely or partially by megaquartz. This is true for
collofonn pyrites (Plate 3.24) where barite laths have been overgrown by collofonn pyrite.
These textures are indicative of sulphate deposition prior to an influx of sulphide. Pyrite may
also occur framboidal pyrites in association with small, subhedral to euhedral, cubic crystals
which are less than 0.05 mm in size (Plates 3.33 c, d).
Pyrite Pseudomorphs
Pyrite pseudomorphs are a feature of pyritic aggregates and subhedral crystalline pyritic
masses in the asp. These textures of these pseudomorphs are variable and their
interpretation is problematic due to the complete replacement of the previous phase. The
textures fonn spongy pyrite overgrowths on a crystalline pyrite and/or galena and/or
sphalerite core and can be described as acicular pyrite pseudomorphs (Plates 3.34 to 3.38).
Acicular pyrite pseudomorphs in Plate 3.38 show a dendritic texture, outlined by pyrite.
Acicular textures in the asp vary between bladed acicular and tabular relicts. SEM
investigations (Plate 3.40) demonstrate the spongy nature of the pyrite and fine grained
galena overgrowths.

Plate 3.27: Euhedral pyrite overgrown by galena, followed by crystalline pyrite. The galena overgrowths are host to well fonned arsenopyrite grains. The sample is from the GSP (Sample 106, longest dimension = 1 mm).
Plate 3.28: Isolated pyrite framboids and euhedras in the microcrystalline quartz of the GSP. The presence of pyrite in the GSP causes the dark colouration of the chert (Sample RS57; longest dimension = 0.5 mm).
Plate 3.29: Pyrite framboids and occasional pyrite euhedras deposited in close proximity within microcrystalline quartz (Sample 57, longest dimension = 0.5 mm).
Plate 3.30: Spongy pyrite in the microcrystalline chert of the GSP. The tabular 'holes' are relict ofbarite, which in most cases is replaced by megaquartz (Sample RS32, longest dimension =2 mm).
Plate 3.31: Recrystallised pyrite containing fragments of collofonn pyrite and inclusions of framboids (Sample RS42, longest dimension = 0.5 mm).
Plate 3.32: Tabular outline by recrystallised pyrite, infilled by galena, chalcopyrite and minor tetrahedrite in the GSP (Sample RS 12, longest dimension = 1 mm).

,. '...
\Al1
. .
...
~
.\.
. ~
..:.~"~
..
___.1:
(:.;~
,.
r -
. ,...
-,'
-','
...
. ...
. "
...... ,
",
,• :_
• ....
.•
. # ..
,.
't
, .. .. ..
"

Plate 3.33: SEM Micrographs
a) Framboidal pyrite in microcrystalline chert (Sample RS32, scale bar = 10 microns).
b) Close up of large pyrite framboid in a), showing a pyrite framboid and euhedra to be deposited at the surface of large pyrite framboid observedin a). (Sample RS32, scale bar = 10 microns).
c) Pyrite framboids and eUhedr#lin microcrystalline chert (Sample RS26, scale bar = 10 microns).
d) Cluster of euhedral pyrite in microcrystalline chert (Sample RS26, scale bar = 10 microns).
e) Pyrite framboids in megaquartz. The cubes which constitute the framboids are evident (Sample RS202, scale bar = 10 microns).
f) Close up of e)
g) Close up of e)
h) Framboidal pyrite in microcrystalline chert (Sample RS32, scale bar = 10 microns).


Plate 3.34: Acicular pyrite pseudomorphs with spongy pyrite outlines, contained in crystalline pyrite (Sample RS 106, longest dimension = 2 mm).
Plate 3.35: Radiating acicular pyrite pseudomorph in sphalerite (Sample RS70, longest dimension = 0.5 mm).
Plate 3.36: Network type acicular pyrite with spongy pyrite overgrowths in association to galena, sphalerite, tetrahedrite and chalcopyrite (Sample RS 12, longest dimension = 1 mm).
Plate 3.37: Framboidal and acicular spongy pryites in sphalerite (Sample RS70, longest dimension =0.5 mm).
Plate 3.38: Dendritic or frondescent pyrite in a spongy to crystalline pyrite (Sample RS32, longest dimension = 1 mm).
Plate 3.39: Boundary between colloform pyrite and microcrystalline quartz of the GSP. Arsenopyrite grains are well formed but show evidence of replacement by sphalerite. The edge of the colloform pyrite is composed of framboidal pyrite (Sample RS 106, longest dimension =0.5 mm).
I


Plate 3.40: SEM micrographs from sample RS106
a) Pyritic pseudomorphs with galena Qight grey) overgrowths (scale bar = 10 microns).
b) Tabular pyrite pseudomorphs with galena overgrowths (Scale bar = 10 microns).
c) Shows a spongy pyrite (dark grey) with two overgrowths of galena (light grey). Scale bar = 10 microns.
d) Close up of c).
e) Close up of a single pseudomorph which show two distinct overgrowths of galena followed by pyrite (Scale bar =10 microns).
f) Close up of the pseudomorph in e).


35 1
Similar occurrences ofpyrite pseudomorphs are observed in the Escanaba Trough, southern
Gorda Ridge where barite tablets, measuring up to 2.5 mm in length, occur as radiating
clusters or dendrites that extend outward from a sulphide substrate (Koski et al., 1988).
Acicular pyrite textures have also been documented by Grenne and Vokes (1989), in massive
sulphides of the Hoydal volcanogenic deposit in the New Caledonies. The authors I
I
I ~ observations would support a sulphate precursor for the observed acicular and tabular pyrite
pseudomorphs (for example compare Plates 3.40 and 3.32). As pseudomorphism is
complete, the previous composition can only be postulated. Pyrite pseudomorphs would
I" however appear to represent some phase which existed prior to the deposition of the GSP and
influx of sulphides.
Crystalline pyrite appears to have formed late and often encompasses fragments of relict
colloform or framboidal pyrites (plate 3.31). Crystalline pyrite is the dominant form of pyrite
present in the GSP, and occurs in rounded nodular masses. It may represent recrystalisation
of framboidal aggregates as annealing is occasionally observed. Microfolding of
recrystalised pyrite bands has been observed in the GSP.
3.4.2 Pyrite Textures of Barite
Pyrite textures observed in massive barite are similar to some textures observed in the GSP.
Pyrite as framboids or colloform structures, may be found in granular barite~ and is observed
around barite lath boundaries (Plate 3.6) and along cleavage planes and fractures within
tabular barites (Plate 3.5). Pyrite may form a dominant phase associated with granular barite.
The crystalline nature of pyrite in these zones, indicate that the pyrite is late stage.
3.5 Sphalerite
Two distinct sphalerite phases have been identified. Early low iron sphalerite in the GSP ~
forms irregular to hexagonal grains which are interpreted as a syn-precipitate to
microcrystalline quartz (Plate 3.39). This early phase of sphalerite often exhibits hexagonal
outlines (Plate 3.41) which are delineated by zones of fme grained chalcopyrite as
chalcopyrite disease. The hexagonal nature of the grains would suggest wurtzite to be the
sphalerite form indicating primary deposition of sphalerite (Hekinian et al., 1980).
Late stage sphalerite occurs as irregular masses in both the barite cap and GSP. In barite
grains it may form along cleavage planes (Plate 3.5). In the GSP, late sphalerite is
/

36
commonly found in association with pressure solution shadows that surround crystalline
pyrite or which replace euhedral pyrite. Chalcopyrite disease in this sphalerite is variable in
intensity (for example Plate 3.42) and often absent. Exsolution of chalcopyrite with in
sphalerite has also been observed (Plate 3.43).
3.6 Arsenopyrite
Arsenopyrite has only been observed in the GSP. In general, it forms euhedral grains as
isolated islands in a microcrystalline quartz matrix, although it has been observed at the
perimeters of colloform pyrites (plate 3.39). Arsenopyrite is often well developed in
sphalerite masses (Plate 3.44), and has been observed to form atoll structure from its
replacement by sphalerite. Ramsden et al. (1990) found arsenopyrite grains to exhibit
zoning in the Hellyer massive sulphide mineralisation. No apparent zoning in arsenopyrite
euhedras from the silica cap is seen.
3.7 Galena
Galena is present in the barite cap and GSP as intergrowths with concentric and colloform
pyrites (plates 3.21, 3.22 and 3.26) and is considered to be paragenetically early. Galena
also occurs as overgrowths on euhedral pyrite and framboids (Plates 3.27 and 3.30
respectively). Most commonly, in the barite cap and GSP, galena is a late stage mineral
observed in association with tetrahedrite-tennantite, infilling cavities and in the fractures of
large crystalline pyrites or colloform pyrites (Plates 3.24, 3.25, 3.26, 3.29 and 3.36).
Galena in the barite cap may replace barite along fractures or cleavage.
3.8 Tetrahedrite-Tennantite
Tetrahedrite-tennantite is predominantly found in association with late stage galena and
chalcopyrite (Plates 3.32 and 3.36). Grains are observed to be irregular irregular and
variable in size.
3.8 Chalcopyrite
Chalcopyrite is considered to be a late stage mineral and occurs as irregular grains which are
variable in size. Commonly it fills cracks in colloform or crystalline pyrite (Plates 3.23 and
3.26). Chalcopyrite disease in sphalerite is variable and may show exsolution textures in
sphalerite (Plate 3.44). Chalcopyrite disease is most frequently observed in early hexagonal
/

Plate 3.41: Hexagonal sphalerite showing low iron concentrations. The hexagonal outlines are the result of chalcopyrite disease. This type of sphalerite indicates wurtzite (Sample RS25 ,longest dimension =1 mm).
• Plate 3.42: Chalcopyrite replacing sphalerite in the asp. Zones showing such intensity of chalcopyrite in sphalerite are uncommon (Sample RSOO6, longest dimension = 1 mm).
Plate 3.43: Chalcopyrite replacing sphalerite in an exsolution texture. The euhedral pyrite is being replaced by the sphalerite (Sample RS35, longest dimension =0.5 mm).
Plate 3.44: Arsenopyrite and spongy pyrite with chalcopyrite in a large sphalerite grain of the asp (Sample RS 12, longest dimension =0.5 mm).
Plate 3.45: Isolated occurrence of electrum in a crystalline pyrite (Sample RSOOl, longest dimension = 250 microns).
Plate 3.46: Electrum grain hosted in a fracture in crystalline pyrite (Sample RS001, longest dimension = 250 microns).

38
sphalerite. Chalcopyrite is dominant in those regions which show a large proportion of
sulphide minerals.
3.9 Electrum
Electrum has been observed for two samples from the barite cap (RSOO1 and RS35). The
occurrence of electrum is as isolated grains nested in recrystalised or euhedral pyrite (plates
3.45 and 3.46) or as grains which are hosted in fractures of the aforesaid pyrites (refer
Chapter Four). In the former, electrum grains are relatively small (largest dimension of 10
microns), whilst electrum hosted in fractures form relatively larger grains, up to 25 in size.
Electrum was not observed in asp mineralisation.
3.10 Carbonate
In the asp, calcite occurs as subhedral grains which are interstitial to, or replace, tabular
barite laths (Plate 3.8). Calcite also occurs as veinlets and vug linings and has a frequent
occurrence in barite. In the barite former carbonate has been observed to replace barite along
cleavage planes or fractures.
3.11 Sericite and Chlorite
Sericite alteration is concomitant to chloritic alteration. These minerals are associated with
megaquartz and crystalline pyritic aggregates, but may also occur as disseminations
throughout the microcrystalline quartz groundmass. Chlorite is frequently associated with
megaquartz, being found in pressure solution shadows surrounding crystalline pyrite masses.
The sericite and chlorite minerals correspond to zones of high hydrothermal alteration,
concomitant to zones containing a large proportion of paragenetically late sulphides. Sericite
commonly occurs as fine grained platy needles measuring less than 0.2 mm in size. Chlorite
occurs as fine dustings in barite or microcrystalline quartz and occasionally as radiating fans
of platy needles.
3.12 Paragenesis
3.12.1 Stage 1 : Primary Textures
Textures which indicate open space deposition as described by Schwartz (1951), Freund
(1966) and Craig and Vaughn (1981), are the first recognisable event in precipitation of the
barite cap and asp. In the barite cap, these textures show network barite laths and colloform
and concentric pyrites to be the earliest precipitates. Concentric intergrowths and colloform
/'

39
textures observed in both the barite cap and GSP, are the result of the unobstructed growth of
minerals into fluid filled voids (Craig and Yaughn, 1981). The development of the barite cap
is therefore suggested to be largely derived from networks barite laths and colloform or
concentric pyrite.
The relative timing of the network barite to the colloform or concentric pyrite/sphalerite/galena
intergrowths is suggested to be barite followed by pyrite. Evidence to suggest that barite was
the first precipitant is indicated by barite laths encompassed by colloform pyrites (Plates 3.24
to 3.30).
Textural interpretations are made difficult by the recognition of replacement phases when no
vestige of the replaced phase remains. Pyrite pseudomorphs hosted in colloform to
recrystalised pyrite (plates 3.34 to 3.39) are suggested by Grenne and Yokes (1989) to have
provided a substrate upon which ore deposition took place. In the cap zones at Hellyer, the
observed acicular pyrite pseudomorphs may indicate a precursor of sulphate origin. Studies
of recent hydrothermal activity from the Juan de Fuca Ridge (Davis et al., 1987) and 13°N
East Pacific Rise (Hekinian and Fouquet, 1985) have found similar textures. These authors
postulate the origin of acicular pyrite textures to be a sulphate, likely anhydrite or gypsum.
No anhydrite or gypsum from the Hellyer baritic or siliceous caps was observed.
The cleavages of barite provides a prime site for the initiation of replacement processes. A
chemical control of replacement is demonstrated between pyrite and barite as pyrite forms
rims around tabular barite (Plate 3.6). Replacement of barite may therefore occur selectively.
The deposition of microcrystalline quartz appears to postdate that of barite formation.
Observations of microcrystalline quartz engulfmg network barite, causing dissolution and
pseudomorphism of barite, would support this. In· addition to silica psedomorphs (Plates
3.16 to 3.20) are silica veins (Plate 3.11) observed to transect the barite cap. The relative
timing of colloform pyrite to microcrystalline quartz is unclear. Pyritic nodules ofcolloform
pyrite in GSP may indicate formation prior the microcrystalline deposition or alternatively the
growth of colloform pyrites in cavities within the GSP. The open framework of the GSP
may also induce the precipitation of barite laths in cavities, during times of minor sulphide
deposition.
/
40
The deposition of microcrystalline chert is closely associated with the precipitation of pyrite
framboids and euhedras, sphalerite and arsenopyrite. These sulphides are encompassed
within the microcrystalline quartz matrix and are thought to be contemporaneous to
microcrystalline quartz formation. Early formed sphalerite occurring as colloform bands is
sometimes affected by chalcopyrite disease. Copper bearing solutions may have gained
access to sphalerite along cracks or grain boundaries, initiating chalcopyrite disease along
crystallographic planes or growth zones ofsphalerite (Craig and Vaughn, 1981). Hekinian et
al. (1980) suggested wurtzite to occur as hexagonal crystals which may have precipitated out
of a gel-like material.
3.12.2 Stage 2: Main Sulphide Deposition Phase
Following the formation of early precipitates is a period of predominantly sulphide
deposition. The porous substrate, provided by the existing barite and silica precipitants, is
fIlled and overprinted by sulphides. Increased sulphide precipitation is a likely response of
increasing hydrothermal activity associated with increasing temperatures (Eldridge et al.,
1983; Ohmoto et al., 1983). The paragenetic sequence of these sulphide phases is not
definitive. Crystalline pyrites may be either directly precipitated or the recrystalisation of
framboidal aggregates precipitated during Stage 1. Euhedral pyrite may indicate
recrystalisation of colloform or framboidal pyrite in response to higher temperatures
(Heinikan et al., 1980). Recrystalised pyrite however lacks any evidence of the galena
intergrowths, associated with framboidal pyrite deposition during Stage 1 and are thus
thought to be deposited during Stage 2. Recrystalised pyrite often contain fragments of
collofonn pyrite, framboidal pyrite (Plate 3.32) and/or euhedral pyrite. It is therefore
suggested that during Stage 2 the order of pyrite precipitation was euhedral pyrite followed
by well crystalised pyrite masses.
The order of deposition of late stage sphalerite, galena, tetrahedrite-tennantite and
chalcopyrite in the barite and asp is unclear. In some samples, these sulphide phases are
dominant, and replacement or infilling of open space has been pervasive. These later
sulphide phases occur in fractures and along grain boundaries of pre-existing phases.
3.12.3 Hydrothermal Alteration and fIll of Open Space
The presence of sericite and chlorite in the asp and barite cap are most likely the products of
hydrothermal alteration associated with the passage of hydrothermal solutions. These
!'

41
alteration products are associated with megaquartz and are often pervasive in the barite cap.
Megaquartz deposition, as observed in cavities (plate 3.14) are late stage fill of open space.
Crustiform barite veining, as observed in the underlying massive sulphides, may indicate a
sealing of fissures (Craig and Vaughn, 1981). Crustiform barite veins, sealed during the
waning of hydrothermal activity, may represent conduits through which mineralising
hydrothermal solutions passed to the sea floor.
3.13 Conclusion
It is difficult to detail a growth history for the barite cap and GSP. The diverse mineralogical
and textural affinities of the samples examined reflect the growth history for that particular
site in the cap zone from which the sample was collected. Variable conditions under which
mineral phases precipitated are observed as hydrothermal overprinting processes. The effects
hydrothermal overprinting, dominated by sulphide phases, masks a definitive paragenetic
sequence. The broad paragenetic sequence derived for the formation of the baritic and
siliceous caps is schematically presented in Figure 3.1. Indicated, is a chaotic and
fluctuating system where the paragenetic order of mineral precipitation is controlled by
proximal temperature and chemical conditions of formation. It is likely that Stages 1 and 2
have been recurrent during the growth of the barite cap and GSP, with the underlying
sulphide mound.
/

42
stage 1 Stage 2 Stage 3
Early Late
skeletal framework of unknown phase
tabular barite laths
colloform and concentric pyrite ±Sphalerite and galena
framboidal pyrite
mincrocrystalline quartz
arsenopyrite
euhedral pyrite
I -
I _
r
crystalline pyrite
sphalerite
galena
tetrahedrite-tennantite
megaquartz
sericite
chlorite
Primary Textures
Peak sulphide deposition
Hydrothermal Alteration and infJ1ling of open space
Figure 3.1: The relative paragenetic order of mineral deposition within the barhe cap and GSP. Stage 1 and 2 may be recurrent stages indicating a fluctuating and chaotic system of precipitation.
/

43
Chapter Four Mineral and Whole Rock Geochemistry
4.1 Introduction
Mineral and whole rock geochemistry are complementary geochemical techniques. Whole
rock analyses broadly defme chemical compositions, whereas mineral geochemistry
characterises the chemical constituents of mineral phases. As a result, chemical constituents
may be ascribed to particular mineral phases.
The geochemical methods of investigation were XRF and microprobe analysis. Analyses by
XRF were undertaken with the following aims:
1) To determine if the GSP is of hydrothermal origin.
2) To identify barium alteration of immediate hangingwall basalts and volcaniclastics.
3) To compare signatures of the barite cap and GSP to similar horizons in other
deposits.
,As the cap zones at Hellyer are enriched in precious metals, it is of metallurgical interest to
determine the residence of precious metals. Microprobe analyses were therefore undertaken J, with the following aim:
1) To determine the mineralogic residence and elemental associations of base and
precious metals to explain the distribution of metals from whole rock
analyses (this chapter) and metal zonation (Chapter Five). All sample locations are given in
Appendix 2.1.
4.2 XRF Sample Preparation
Samples analysed were core splits from the baritic cap, the GSP, and the overlying basalt and
HVS. The samples were initially crushed to 1-3 mm pieces using a jaw crusher, and then 50
grams were ground in a tungsten-carbide ring mill. The ignition loss was determined by
heating 1-2 grams of each sample at l000°C overnight. Owing to the high sulphide content in
many samples, the ignition loss was high. The ignited materials were made into fused glass
discs for major element analyses (Si02, Ti02, A120 3, Fe203' MnO, CaO, Na20 and K20).
Analysis of internal standards and replicate samples were made to assure quality of the
analyses. Barium-rich samples were diluted with acid washed silica owing to barium
interference. Pressed powder pills for trace element determinations were prepared from 5-6
grams of non-ignited sample powder. Silica-rich samples were bound using 0.3-0.5 grams
of PVA solution. In total 11 samples were analysed.
4.3 Analytical Techniques
Major element oxides and trace elements (Ba, Cu, Pb, Zn, Bi, As, Cd, Ni, Nb, Zr, Y, Sr,
Rb, V) were analysed for using a Phillips 1410 automated XRF under the guidance of
~/'

·44
P.Robinson. Several elements were corrected due to interference of high barium levels, and
tungsten was analysed to correct for As interference. Complete analytical results are listed in
Appendix 3.1
Microprobe analyses, from carbon coated polished thin sections, were determined using the
Cameca SX50 at the CSL under the guidance of operator W. Ja~ski. The minerals
examined for major and trace elements included barite, calcite, pyrite, sphalerite, galena,
arsenopyrite and tetrahedrite.
4.4 The Composition of the Barite Cap
!4.4.1 Whole Rock Geochemistry of Barite Samples
Three samples from the northern, central and southern parts of the barite cap (RS95, RS 18
and RS228 respectively) were analysed by XRF. In all samples ~~J~~ BaS04) was high
.. (e:~~-=~:! ..~~_~~Vly~n40~77% and.sl.98% Ba. ~r contents\Vet:Y_~miJ~ly.~~~ging
. from OA9-o/uo...LQ6...% The majority of major oxides were low to non-detectable, as were ~ .
most trace elements. High Cu, Pb, Zn values however, reflect differential proportions of
sulphides within the barite cap samples.
Figure 4.1 shows the abundances of major oxides and the trace elements Pb, Zn, Cu, Sr and
As: All other trace elements were below detection. The fluctuations of Si02, Fe203 and CaO
are the result of differential quartz, pyrite and carbonate contents. Similarly, variations in Cu,
Pb, Zn, Cu and As correspond to variable sulphide concentrations in massive barite. Ti02 is
constant throughout at approximately 0.3% and Al20) at approximately 2%. Na20, P205
and MnO are less than 0.2%.
100 ~ 11 I I
~ RS95
~18 a RS228], ~ 1\ 11:II 1\ A
i: ~
~
8OJ) .1..9
~001 I i i i i ~ , , i i i i i i i i I
o 0 'I"l ol .. ~ ,I; '" 88~8~<a~ <;;l N 0 l:l:l c.. N «!Zl tii E= !::! ~ ~ ~ u z ~ ~ « u.
Figure 4.1: Comparison of whole rock analyses from massive barite of the barite cap at Hellyer. The three samples are distributed over the length of the barite cap, with RS95 from the northern portion of the cap, RS 18 from the central area and RS228 fro~.
the southern portion of the barite cap.
.01

---- -
---
45
4.4.2 Barium and Strontium Concentrations in Barite
Samples which contained barite that were analysed by microprobe included RS18 and RS70
from the barite cap and RS32, RS57 and RS63 from the asp (Appendix 3.2). .!!! alt
analysesMg,Ca, Fe aIld Pb w~~ below detection li~_t~_Si occurred as impurities of , - ..- .. ~ ---- .._-------~-~~------ ---_.-- _.'- -
nncrocrystalline quartz. Significant levels of Sr were present in nearly al1-barites analysed.
Sr levels ranged from-bel~\V$~ d~t~~ti~~ linrit (0.1%) to a maximum of 2%,-wiili an average . - . -'--'-"~--- - .
of0.7%. The barium content of barite ranged from 53.6% to 59.8 %, with an average of
58.1%.
fA tightly constrained inverse relationship between Ba and Sr exists for barites in both the
jasp and barite cap (Figure 4.2). High Ba levels correspond to low Sr levels and vice versa.
iIn a traverse across and along a tabular barite lath (RS70) the relationship of Sr and Ba in
Ibarite is shown (Figure 4.3a and 4.3b). The central cores of the barite laths are enriched in Sr
f and relatively depleted in Ba, whilst the margins of the lath are depleted in Sr and enriched in
Ba. This zonation was observed in a number of analysed grains (Appendix 3.2).
Consequently the variations between Sr and Ba within barite appear systematic. Barite laths
undergoing pseudomorphism by microcrystalline chert however, have below detection limit . .
f levels of Sr, which accounts for the outliers from the main Ba-Sr trend in Figure 4.2. A lack
Iof metamorphic textures would indicate that the zonation of barite grains is a primary feature
I, rather than a metamorphic induced feature.
Figure 4.2: The relationship of barium and strontium derived from microprobe analysis of barite. The tightly constrained inverse relationship is present in both barite from the barite cap and asp. The outliers represent barite grains undergoing pseudomorphism by microcrystalline quartz.
/
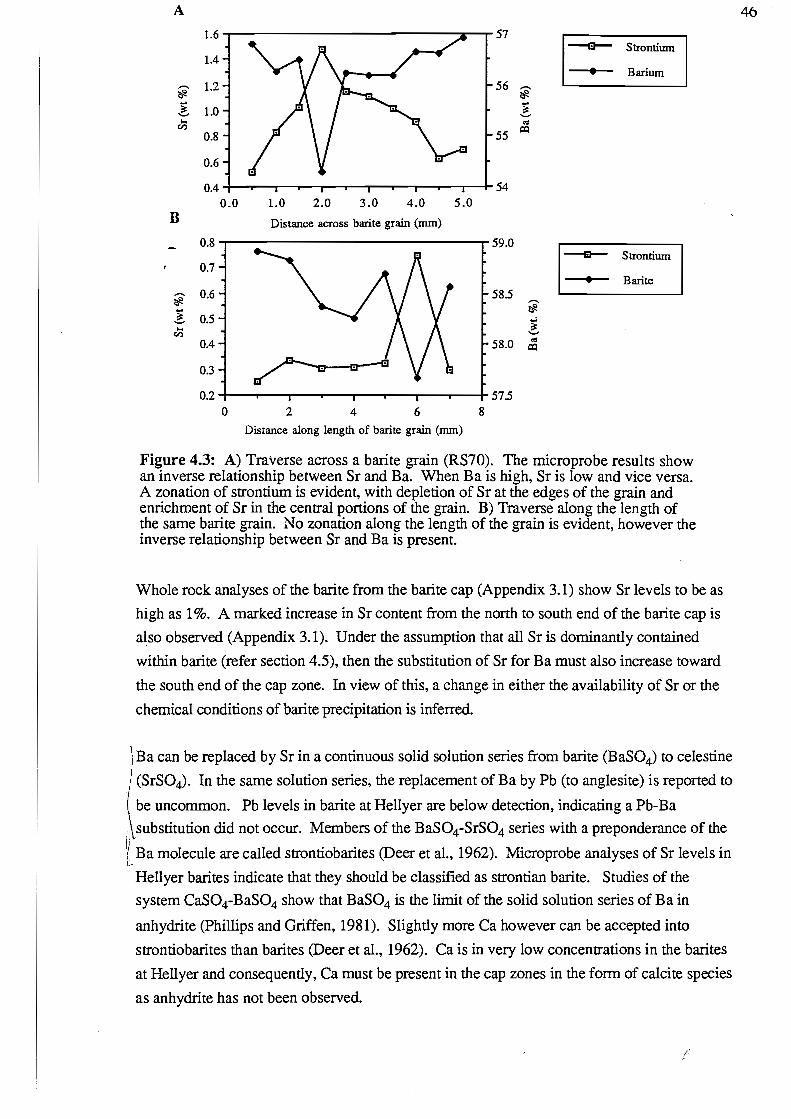
A 46
1.6 ~ ~ StrontiumA/\ ;-? r57
1.4 BariumI •
~ L2j " [56 ~
I 1.0 I ... osen J:QJ\ ~0.8 55
0.6
0.4 ~
III , i , •
I i i , I , i L54 0.0 1.0 2.0 3.0 4.0 5.0
B Distance across barite grain (mm)
0.8 I i 59.0
0.7 I ~
• Strontium
Barite
~
0.6 58.5
I ... en 0.5
~
I 0.4 58.0 os
J:Q
0.3
0.2 57.5 0 2 4 6 8
Distance along length of barite grain (nun)
Figure 4.3: A) Traverse across a barite grain (RS70). The microprobe results show an inverse relationship between Sr and Ba. When Ba is high, Sr is low and vice versa. A zonation of strontium is evident, with depletion of Sr at the edges of the grain and enrichment of Sr in the central portions of the grain. B) Traverse along the length of the same barite grain. No zonation along the length of the grain is evident, however the inverse relationship between Sr and Ba is present.
Whole rock analyses of the barite from the barite cap (Appendix 3.1) show Sr levels to be as
high as 1%. A marked increase in Sr content from the north to south end of the barite cap is
also observed (Appendix 3.1). Under the assumption that all Sr is dominantly contained
within barite (refer section 4.5), then the substitution of Sr for Ba must also increase toward
the south end of the cap zone. In view of this, a change in either the availability of Sr or the
chemical conditions of barite precipitation is inferred.
Ba can be replaced by Sr in a continuous solid solution series from barite (BaS04) to celestine
(SrS04)' In the same solution series, the replacement of Ba by Pb (to anglesite) is reported to
be uncommon. Pb levels in barite at Hellyer are below detection, indicating a Pb-Ba
!\substitution did not occur. Members of the BaS04-SrS04 series with a preponderance of the
LBa molecule are called strontiobarites (Deer et al., 1962). Microprobe analyses of Sr levels in
Hellyer barites indicate that they should be classified as strontian barite. Studies of the
system CaS04-BaS04 show that BaS04 is the limit of the solid solution series of Ba in
anhydrite (Phillips and Griffen, 1981). Slightly more Ca however can be accepted into
strontiobarites than barites (Deer et al., 1962). Ca is in very low concentrations in the barites
at Hellyer and consequently, Ca must be present in the cap zones in the form of calcite species
as anhydrite has not been observed.
!

47
One possible source of Sr is Cambrian seawater (refer Burke et al, 198?). Sr isotope studies
at Que River and Hellyer however (Whitford and Craven, 1986), show barites to fall outside
the range defined by Cambrian host rocks and coeval seawater. Whitford and Craven (1986)
suggest the mineralising fluids derived Sr from an additional radiogenic source. Sr contents
may therefore be the result of partitioning of Sr between the hydrothermal fluid and barite
however, Sr isotopes on barite of the barite cap would be required to confirm this. At
present, a total of twenty samples from the barite cap and barite veins in the stringer zone
have been submitted to D. Whitford at the CSIRO, Sydney, for 87Srf86Sr isotopic analysis.
The results of this investigation are not presently available.
4.4.3 Hangingwal1 Barium Alteration
Jack (1989; 1990) showed a major alteration zone in the hanging wall basalt to be the
hangingwall plume. This zone overlies the siliceous core of the stringer zone and is defined
by enrichments in CaO, KzO, Alz03 and Ba, and depleted with respect to Fez0),MgO and
SiOz (Jack, 1989). Samples RS112 and RS117 from the PLS directly overlying the barite
cap show enriched levels of Ca (mean of 18%), KzO (mean of 4%) and Alz0) (mean of
16%). Barium levels reach a maximum of 0.3%, whilst depletions in FeZ03, MgO and SiOz
are observed (refer Appendix 3.1). The hangingwall basaltic samples analysed therefore,
correlate to those analysed by Jack (1989) and are part of the hangingwall alteration plume.
4.5 GSP - A Classification
Two representative samples from the asp (RS20 and RS64, from cross Sections 10630 N
and 10790 N respectively) were analysed using whole rock geochemistry (Appendix 3.1).
RS20 is a dark siliceous chert with minor pyrite and RS64 is contains a significant proportion
of pyrite.
4.5.1 Whole Rock Analyses of asp Whole rock analyses are dominated by concentrations of SiOz and/or Fez0). RS20 contains
high SiOz and low FeZ03. By comparison the SiOz content of RS64 was significantly lower
and, as expected, the FeZ03 content very high. RS64 also showed enrichment of Pb, Zn,
Cu, Sb, Cu, Ag, whereas these elements are significantly lower in RS20. Enrichment of base
and precious metal therefore relates to high sulphide content. The oxide distribution of both
samples is shown in Figure 4.4a. Low Zr, Y, Nb, Rb and Sr values indicate that the asp does not contain a significant detrital component (Duhig, 1991).
Adachi et al. (1986) used an Fe-Al-Mn plot to discriminate between hydrothermal and non
hydrothermal cherts. Samples analysed from the asp lie within the hydrothermal chert field
(Figure 4.5). For comparison, the tetsusekiei and Noranda chemical and clastic cherts have
also been plotted (Figure 4.5), as has an interpillow chert from the PLS at Hellyer (RS 118).
The. interpillow chert shows an identical signature to the clastic cherts at Noranda and is also
l

48
A 100 ~ '"
------e-I I
RS20 i
RS64
10
ci 1
.9
.1
.01 5i02 Ti02 AI203 Fe203 MoO MgO CaO Na20 K20 P205
100 C i
B Tetsusekiei Chemical Layer
Tetsusekiei Clastic Layer 10 Noranda Chemical Layer
Noranda Clastic Layer
c...R 1 OJ)
.Q
.1
.01 I I , I , I , I ! , , , I , • ' I , I I•
5i02 Ti02 AI203 Fe203 MoO MgO CaD Na20 K20 P205
Figure 4.4: Comparison of iron fonnations. a) A spiderdiagram distribution of the major oxides in the asp at Hellyer b) Distribution of the major oxides for the tetsusekiei and Noranda (Main contact tuft) chemical and clastic layers (from Kalogeropoulos and Scott, 1983).
AI + Hellyer asp Cl PLS interpillow margin o Noranda and tetsusekiei clastic cherts X Noranda and tetsusekiei chemical cherts
hydrothermal cherts
J
MnFe
Figure 4.5: Chert Classification
Figure 4.5: A-F-M chert classification of Adachai et al. (1989). The asp lies well within the hydorthennal chert field. Plotted also is a chert ofitinterpillow margin from the PLS at Hellyer. This chert is classified as a non-hy ennal chert and is comparable to the clastic components of the Noranda and Tetsu ekiei cherts (data fromOhmoto et al., 1983). . l
c
49
similar to the clastic component of the Tetsusekiei. Interpillow chert from basalts overlying
Hellyer are thus not hydrothermal cherts.
Sample RS64 shows distinct similarity to the Tetsusekiei chemical component. Both samples
analysed fall in the hydrothermal chert group. Spiderdiagrams from the GSP are similar to
those of the tetsusekiei and Noranda cherts (shown in Figure 4.4b).
The hydrothermal chert signature and enriched levels of precious and base metals are a feature
of siliceous horizons associated with VHMS deposits (Kalogeropoulos and Scott, 1983;
Duhig, 1991). The issue of varying metal contents with stratigraphic position within the GSP
is discussed in Chapter Five.
4.6 Carbonates Carbonate analyses from this study and from other studies by Aberfoyle geologists reveal that
the carbonates are nearly pure calcite with only minor Mg (0.1 %), Mn (0.1 %) and Fe
(0.6%). The calcites average 38.6% Ca (Appendix 3.3). Ba levels in most carbonates were
low, as was the Sr content. Microprobe analysis of carbonate confIrms that the Ca present in
the cap zones resides in calcite and that Ba and Sr reside in barite.
4.7 Iron content of sphalerite
The Fe content of sphalerite from the barite cap (samples RS83 and RS75) and GSP (samples
RS42 and RS 106) is similar (mean of approximately 2.3%; Appendix 3.4). This result is
close to the average of 2.7% for the Hellyer deposit obtained by Ramsden et al. (1990). No
broad differences in the Fe content of sphalerite was observed in the baritic cap or the GSP.
Minor zones of high Fe sphalerite (orange in plane polarised light) appear to be the result of
microscopic to submicroscopic chalcopyrite disease. In these cases an enhancement of
hexagonal growth is present. Iron poor sphalerite suggests that oxygen fugacity was elevated
in this locality (Jack, 1989) which is consistent with oxygenated seawater mixing with
hydrothermal solutions.
4.8 Mineralogic Residence of Arsenic
As previously indicated (Chapter Three), arsenopyrite was not observed in massive barite of
the barite cap_ At Rosebery the absence of arsenopyrite in barite is a feature of the baritic ore
lens (Braithwaite, 1969). The As content of the Hellyer barites is low, ranging between 21
ppm and 49 ppm (refer section 4.4.1). The absence of arsenopyrite in massive barite can be
ascribed to the differing redox conditions under which the two minerals are stable (Huston,
1988). Arsenopyrite is not stable under the oxidising conditions required to precipitate barite
but is, however, stable where reducing conditions prevail (Henrich and Eadington, 1986).
Therefore due to the stability of barite and arsenopyrite, barite mineralisation cannot contain
/.
50
significant arsenopyrite and consequently As must be present in either tetrahedrite-tennantite
or in As bearing pyrite (Huston, 1988).
In the GSP, arsenic impurities in framboidal pyrite were as high as 2.8%. Pyrite euhedras
contained low levels of As. Framboids appear to be relatively depleted with respect to As in
the cores and enriched in As in the rims (Appendix 3.5). The barite cap shows framboidal
pyrite to contain up to 4.4% As at the cores. Pyrite euhedras in the barite cap also display
elevated levels of As. The average content of As in pyrite for the barite cap is 1.5%, whilst
the average for the GSP is 0.8%. Arsenic in the GSP occurs mostly in arsenopyrite
(Appendix 3.6), whereas in the barite cap it is present in pyrite. Arsenopyrite from the GSP
averages 43.3% As.
4.9 Mineralogic residence of silver
Microprobe analyses of galena (samples RS42, RS106, RS83 and RS75; Appendix 3.7)
show galena to be devoid of Ag in both the barite cap and GSP. Tetrabedrite were found to
contain 2 to 3% Ag with approximately 20% Sb and 30% eu (Appendix 3.8). The limited
number of analyses would confmn the majority of Ag resides in tetrahedrite, as suggested by
Ramsden et al. (1990).
The silver content of pyrite in the GSP reaches a maximum of 0.25% and is correlated with
high As and Au levels. In most cases the Ag content of pyrite in the GSP was low. Unlike
the As and Au, high Ag values were measured in both framboidal and euhedral pyrite. High
Ag values commonly, but not always, corresponded to elevated As levels. In the barite cap,
the content of Ag in pyrite is commonly low.
Sphalerite from the GSP shows low levels of Ag. Sphalerite in the barite cap however,
displayed high Ag contents (up to 2390 ppm, averaging 320 ppm). In the latter where Ag
was present, Hg was also present in sphalerite.
4.10 Mineralogic Residence of Gold
The baritic and siliceous caps are enriched in Au (McArthur 1986). Previously reported
occurrences of gold at Hellyer suggest the gold in the GSP resides in pyrite and arsenopyrite
(Gernmell, 1990; Ramsden et al., 1990). No free grains of electrum have been observed in
the GSP. In the barite cap, gold may occur either as free electrum grains or as low levels of
Au in pyrite (McArthur, 1986).
4.10.1 Electrum
Electrum is relatively rare at Hellyer, with only six grains previously identified (Gernmell,
1990). This study has further identified another 19 grains of electrum (Table 4.1).
I'

51
Grain No. Sample "Size (Il) Fineness Description
1 RS001 12.5 558* Electrum grain at the edge of recrystallised pyrite, in the massive
barite zone. The grain is an irregular shape, with high reflectivity.
2 RSOOI 9.5 808 Electrum hosted at the contact between two euhedral pyrite grains,
in a fracture. Occurs with chalcopyrite as an infilling of the fracture.
3 RSOO1 5.5 796 Electrum grain hosted in chalcopyrite inbetween two pyrite euhedras,
at the grain boundaries. Occurs near the contact between
massive sulphide mineralisationlbaritic zone.
4 RSOO1 4.5 796 Electrum hosted in euhedral pyrite, not associated with fractures
or chalcopyrite. Occurs near the contact between massive sUlphide
and the baritic zone.
5 RS001 4.5 901 Electrum hosted in chalcopyrite against a euhedral pyrite grain. The
chalcopyrite has infilled a fracture in the pyrite grain. Massive
sulphide zone, close ID the baritic contact.
6 RS001 10.5 785 Elongate electrum in a fracture through a euhedral pyrite grain.
Proximal ID the massive sulphide/baritic contact.
7 RS001 2 NA Continuation of the same fracture as in (6). A small electrum bleb
isolated in a fracture cross cutting pyrite. Massive sulphide zone.
8 RS001 3 902 Small bleb of electrum occurring with chalcopyrite in a large
recrystallised pyrite grain. Massive sulphide zone
9 RS001 2 791 Small electrum grain occurring in pyrite in association with
chalcopyrite. Not associated with fractures. Massive sulphide zone.
10 RS001 6 785* Rounded electrum grain, occuring in a cavity in chalcopyrite,
hosted in a large irregular recrystallised pyrite grain.
11 RS001 25 808* Large rounded electrum grain, hosted in chalcopyrite, amongst
fractured recrystallised pyrite. Note that the Au is not in contact
with the pyrite. Massive sulphide zone, close ID barite contact.
12 RS001 7 902 Rounded electrum grain hosted in pyrite, not associated with fractures
or chalcopyrite, occuring at the margin of the pyrite grain. Massive
sulphide zone.
13 RS001 20 809 Large rounded electrum grain located on the edge of a recrystallised
euhedral pyrite grain, with chalcopyrite. Massive sulphide zone.
14 RS001 2 NA Rounded electrum bleb, hosted in barite interstitual between two
large pyrite grains. Massive sulphide zone/baritic zone.
15 RS001 6.5 422 Elongate gold grain occurring interstitual between two larger pyrites,
with barite, having a high reflectivity. Contact zone.
16 RS001 5 787 Isolated, rounded electrum grain hosted in pyrite, proximal ID gold
grain (IS). Exhibits high reflectivity. Sulphide/baritic contact
17 RS001 6 894 Electrum with chalcopyrite, as an inclusion in euhedral pyrite.
Massive sulphide zone.
18 RS001 4 NA Electrum in a fracture in pyrite, not in contact with chalcopyrite.
Massive sulphide zone.
19 RS35 6 NA Electrun grain hosted in chalcopyrite associated with galena and
pyrite
* average fineness: [1000*Au (wt%)]/[Au(wt%)+Ag(wt%)]
NA =not analysed
**size = average grainsize: (longest dimension+shortest dimension)12
Table 4.1: Electrum grain descriptions
I'
52
Occurrence ofElectrwn
Eighteen of the nineteen grains observed occur on the sharp contact between the barite and
massive sulphide mineralisation at 10670 north (RSOO1). Electrum is observed to have three
broad occurrences; in the barite horizon associated with pyrite and galena; at the massive
sulphide contact, either nested in fractures in pyrite with or without chalcopyrite; or as
isolated inclusions in pyrite. The grain size of electrum ranges between 2 and 25 microns,
averaging 7.5 microns, however the electrum grains are often irregular in shape (Figure 4.6).
Electrum Composition
Microprobe analyses of electrum grains reveal that they are composed of Au, Ag, and Hg.
Analytical data is given Appendix 3.9. The total gold fmeness (lOOOAu/Au+Ag) ranges
between 422 to 902, with an average of758 (Figure 4.7). Mercury content varied between
the detection limit and 9.8%. The results are divided into two groups, corresponding to
grains hosted within baritic mineralisation and those associated with massive sulphide
mineralisation.
Baritic~socwredekctrwn
Gold occurring in the baritic horizon has a low fineness, with significantly elevated Hg
contents (Appendix 3.9). A traverse across a grain of electrum (Figure 4.8 a, b, c) shows
the core of the electrum grain to be high in Au (corresponding to higher fineness), with
depleted Au rims (lower fmeness) and enrichment in Hg. Silver-rich rims have been
observed in a number of other VHMS deposits (Huston, 1988; Huston et al., in press).
Massive sulphide associated electrum
Most electrum grains occur in the massive sulphide proximal to the contact with the baritic
horizon. Characteristically, these electrum grains display high Au and low Ag and Hg
contents. The grainsize distribution is irregular. Two traverses across different grains (11
and 13; Table 4.1) indicate relatively constant high fineness and low Hg content (Figures, 4.9
a, b, c, d).
4.10.2 Gold content of Pyrite
Pyrites from three GSP samples (RS57, RS42, RS106) and two barite cap samples (RS83,
RS75) were analysed (Appendix 3.5). In the GSP, framboids and spongy pyrite contain the
highest levels of gold, up to 0.46%. No zonation of Au from rim to core of the framboids
was apparent. Similarly, framboidal pyrites in the barite cap contain the only detectable
levels of Au, which are generally low. Framboidal pyrites of the GSP show higher levels of
Au than pyrite the barite cap. Euhedral pyrite was found to contain no significant Au in either
the barite cap or the GSP. Colloform pyrites were not extensively examined and may contain
significant levels of Au (D. Huston pers. comm.). Recent work by Huston (pers. comm.)
has correlated high gold in colloform pyrite with elevated As levels at other VHMS deposits.
l

53
Figure 4.6: Electrum Grain Size Distribution
28-30
26-28
:M-26
22-24
20-22 III Ba-grainsize
:t. IS-2O • BMS-grainsize '-' 16-1S ll)
.~ 14-16 en C 12-14 .~ .... Cl
1().12
8-10
6-S
4-6
2..4
()'2 , , ,
0 1 2 3 4 5 6 7 8
Number of grains
Figure 4.7: Electrum Fineness Distribution
95().1000
900-950
S5().9QO
800-S50
75().Soo
7Q().750
65().7oo
600-650 <Il
~
55().600 I
5 c 50().550
45().SOO I-ti: 4Q().450
)5().400
300-350
I~ Fa Baritezone
25()'300
2Q().250 15()'200
- • Massive sulphide zone
lQ().150 -50-100
().50 ~ I I I
o 1 2 3 4 5 6 7 8
Number of analyses
/'

54
A�
Fineness Traverse: Gold Grain 1 700 r-.-----------------,
B
Cl)� Cl)�.. ..cc 600 ~
500 ccre rim core
Locatioo 00 Graio
Mercury Traverse: Gold Grain 1
10
C 9
~
~
8 -~
>, loo
.. <.J= 7 loo
:t� 6�
5 cere rim cere
Locatioo 00 Graio
Figure 4.8: Core-rim-core analytical traverse across electrum grain 1 (Sample RSOOl). A) Location of traverse and sample points on the electrum grain. The grain shows high reflectivity and is located along the boundary between pyrite and barite (dark grey). B) Distribution of the fineness values. C) Distribution of Hg (wt %) concentrations. The fineness values are higher and Hg values higher near the cores compared ro the rims. \
I . .~

I "_.__. __. ----- I
c Fineness traverse: Gold grains 11 & 13 D Mercury traverse: Gold grains 11 & 13
830 I I •.0
--g--- Gold gnin 13 1.5 .-e (jold grain 11
,. <+
~
~ .
820
810
800
----+- Gold gn in 11
~
i !.
i ::0
1.0
2.5
2.0
I.S
----+-- UQld grain 11
790
\.0
780
0.5
0.0 .--------::=:= ~
rim COfe rim rim cOfe "m
I.oc.llon on Cnln! Localion on Gr_!n!'!
Figure 4.9: Core-rim-core analytical traverse across electrum grains 1land 13 (Sample RSOOJ). A) Sample points on the electrum grains. Grain II is hosted in chalcopyrite and grain 13 is at the boundary between crystall ine pyrite and quartz (dark grey). B) Distribution of the fineness values. C) Distribution of Hg (wt %) concentrations. The fineness values and Hg values do not show any significant difference between rim and core.
56
4.10.3. Gold content of arsenopyrite�
Arsenopyrite from 2 samples of GSP (RS42, RS 106) were analysed (Appendix 3.6).�
Significant levels of Au, up to 0.1%, were found in a number of analyses. No zonation was�
noted.�
4.11 Discussion
f: 4.11.1 Barite Solubility and Precipitation
The solubility of pure barite is low (Deer et al., 1962) and barites containing Sr show
incongurent solubility (Blount, 1977). Trace contents of elements can modify the
crystallisation of barite from solution, inducing changes in either crystal nucleation, growth
and crystal morphology (Femandez-Diaz et al., 1990). As barite is a sulphate mineral, it is
only stable near or above the boundary between oxidised and reduced sulphur species
(Ohmoto et al., 1983). Consequently, barite may be a dominant phase in the upper regions
of VHMS systems where oxidising conditions prevail (Large, 1977). The low solubility of
barite precludes effective transport of barium in large quantities in oxidised fluids. Therefore
the deposition of barite results from the mixing of two different solutions. At Hellyer these
are interpreted to be upwelling relatively reduced hydrothermal fluids which carry Ba2+ and
Cambrian seawater, which contains S042-. Oxygenated seawater may either supply S042
directly, or oxidise H2S in the hydrothermal fluid to S042-. Estimated temperatures ofbarite
precipitation is between 100°C to 250°C, where barite is stable at high oxygen fugacity (j02)
(Green et al., 1981).
4.11.2 Silica Solubility
Williams and Crear (1985) and Williams et al. (1985) review controls and mechanisms of
silica solubility and precipitation. The interpretation of different forms of silica can establish
the physiochemical environment of precipitation (Duhig, 1991).
Silica solubility depends on temperature, surface area, pH, pressure and dissolved ionic
species. The predominant controls are however, temperature and surface area. Silica will
only precipitate from a solution containing pure dissolved silica if the solution is
supersaturated with respect to silica. The kinetics of different silica polymorph mechanisms,
favour amorphous silica (opal-A) precipitation at temperatures less than 300°C. Duhig
(1991) concluded microcrystalline chert was the result of the inversion of amorphous silica
(opal-A) to more stable polymorphs. Co-exisitng megaquartz and microcrystalline quartz
may be explained in terms of surface area and timing. Amorphous silica has much greater
surface area and it transforms more easily to stable polymorphs (Williams and Crear, 1985;
Williams et al., 1985). In the GSP there is no indication of pre-exisitng amorphous silica in
f'"

57
the form of chalcedonic spherules, however observed microcrystalline chert may represent an
inverted phase of amorphous silica.
4.11.3 Gold depositional and transport mechanisms
In the upper regions of VHMS deposits, the transportation of gold is as thiocomplex
(Au(HSh), due to low temperatures «30<tC), high aH2S, neutral to alkaline pH (Huston
and Large, 1989). In these areas oxygenated seawater, mixing with upwelling hydrothermal
fluids causes gold deposition (Huston et al., in press). This is confinned by the presence of
the majority of electrum grains, observed in this study, in close proximity (±3cm) to a sharp
contact between the massive sulphide and barite cap (RSOOl). The boundary between the
massive sulphide and baritic zone represents a change from reduced to oxidised conditions,
which resulted in Au precipitation. Overall the fmeness distribution is much wider than
previously reported for the Hellyer deposit (Gemmell, 1990). This is consistent with work
by Huston and Zaw (1988) who report a large variation in fineness from massive sulphide
deposits. Larger electrum grain sizes, their rounded nature and occurrence with chalcopyrite
(for example grain 11) would indicate the occurrence of electrum to be the result of
remobilised Au.
Huston et al. (in press) proposes that higher oxygen fugacity (j02) conditions, due to
oxygenated seawater mixing with upwelling hydrothermal solutions, result in electrum and
pyrite being the major gold repositories. Gold and silver precipitate as electrum due to
dilution and/or oxidation of H2S, caused by the mixing of seawater with hydrothermal fluids.
Silver also precipitates in electrum owing to the rapid decrease in temperature and increase in
pH, associated with mixing of seawater.
Previous low level gold analyses of the GSP found arsenopyrite to contain significantly more
gold than pyrite (Gemmell, 1990). In the present study, a major limitation was the high
detection limits (of approximately 600 ppm) of Au. As a consequence, low levels of gold
were not determined, with only anomalously high gold contents documented. The somewhat
anomalous values however, confmn Au to reside in pyrite and arsenopyrite in the silica cap.
The precipitation of gold in pyrite as evidenced in the GSP, may occur by co-precipitation of
submicroscopic gold grains caused by decreasing aH2S in the micro-environment
surrounding a growing pyrite grain. Graham et al. (1989) suggests arsenopyrite concentrates
Au from the hydrothermal fluid in preference to pyrite.
4.11 Conclusions Barite precipitation, which occurred when oxidised seawater mixed with upwelling
hydrothermal fluids, shows Ba-Sr substitution which is the result of partitioning of Sr from
the hydrothermal fluid into barite during deposition. The GSP is a ferruginous chert of
hydrothermal origin, which precipitated as amorphous silica and reverted to microcrystalline
/'

58
quartz. As indicated by the presence of arsenopyrite and pyrite, and the absence of hematite,
GSP precipitation occurs under more reducing conditions than that of barite. Low iron
content of sphalerite, in both the barite cap and GSP would however indicate a relatively
oxygenated hydrothermal fluid-seawater mixing environment. The major repositories of
precious metals varies between the two caps, ~eflectingthe differing physiochemical
conditions under which each cap formed.
/"

59
Chapter Five� Metal Zonation�
5.1 Introduction
Textural and mineralogical associations reflect physiochemical conditions under which
mineral phases fOmled (Leblanc and Billaud, 1990). Metal zonation is an analogue of
mineralogic zonation, which can be used to study spatial element affmities on a broader scale.
In a hydrothermal system, the zonation of metals are indicative of changes in temperature,
solubility and/or chemistry of the ore fluids in space and time (Large, 1977). If metal and
mineral associations are recognised, for example the concentration of barium is dominantly
controlled by the presence or absence of barite, then metal zonation can be used to
simultaneously infer a mineralogical zonation.
5.1.1 Aims \
This chapter investigates metal zonation within the barite cap and GSP. The objectives are to
correlate metal zonation in the cap zones with zonation in the underlying massive sulphide
and stringer system. In addition, the depositional sites of the cap zones and their spatial
affmity to the hottest parts of the hydrothemlal system will be considered. Metal zonation in
the cap zones extends previously developed mineralogical associations (refer Chapter 4) and
is based on Aberfoyles' 1 to 2 metre diamond drill core assay results.
5.1.2 Metal Zonation in VHMS Deposits
There have been many contributions to zonational models of VHMS systems (for example:
Large, 1977; Franklin et al., 1981; Eldridge, 1983; Pisutha-Arnond and Ohmoto, 1983;
Huston and Large, 1988). Polymetallic mineralisation at Hellyer shows characteristic VHMS
style metal zonation (McArthur, 1990). The Hellyer deposit exhibits a central Fe, Cu rich
core, overlying the footwall stringer system (Gemmell and Large, in press). Within the
central core chalcopyrite and pyrite dominate the mineralogy (Gemmell, 1988; McArthur,
1989). The upper and outer regions of the massive sulphide body are enriched in Pb, Zn,
Ag, Au ,As and Ba (McArthur, 1990). These regions of the Hellyer deposit correspond to
hangingwall enriched zones, where metals leached from the footwall, were deposited. The
process of continual leaching and re-deposition during the life of the hydrothermal system is
termed a zone refming process (Pisutha-Arnond and Ohmoto, 1983; Large, 1991). The
following conceptual mineral zonation from footwall to hangingwall in VHMS deposits has
been postulated (Eldridge et al., 1983):
f':

60
footwall hangingwall�
Fe --> Cu (Au) --> Cu --> Pb, Zn --> Au, Ag -->Ba�
--------------->>------------->> decreasing temperature�
As a consequence, the upper regions of VHMS deposits often display enrichment in barium
and precious metals.
5.2 Lateral Zonation
Plan projections of the cap zones were derived from the HellyerDATAMINE database using
linear block kriging (refer McArthur and Kuipers, 1990). Due to the discontinuity and
variable thickness of the asp (less than 6 metres), the asp was combined with the results
for the barite cap. Plan projections therefore represent metal zonation in both the barite cap
and asp. The results of the lateral zonation studies are presented as five percentile levels and
each percentile level records twenty percent of the total range of assay values. Plan
projections of lateral zonation, based upon 1990 ore reserve data, vary slightly from the cap
outline as defined in Chapter Two. The plan projections of lateral metal zonation for Ba, Fe,
Pb, Zn, Au, Ag, As, Cu in the cap zones are schematically presented in Figures 5.1 to 5.8.
Bariwn (Figure 5.1) is concentrated on 10750 N on the eastern ore block and 10710 N on the
western ore block. This concentration corresponds to the area above the central feeder
system. A second zone of Ba enrichment occurs at 10890 N on the eastern ore block. This
Ba enrichment overlays the northern portion of the central feeder. The southern and northern
feeders are not defined by Ba zonation.
Pyrite (Figure 5.2) or calculated Fe concentrations show broad highs that correlate well with
the location of the central feeder system, and occur on 10800 N on the eastern ore block.
Elsewhere, Fe contents are relatively depleted.
Lead and zinc (Figures 5.3 and 5.4 respectively) show distinct zonal similarities on the east
and west ore blocks. High Pb and Zn concentrations occur at 10800 Nand 11010 N. The
highest concentrations ofPb and Zn are best developed on the eastern ore block, concurrent
with the northern portion of the central feeder and the northern feeder. Zinc, however,
differs from lead at 10470 N where a small high, coinciding with the location of the southern
feeder, is present.
/'

- -
----,---- .- ._- ._----,._---,-------,
TN GNt
!.!.Q.!_O_.I~--~-_I----I HQ QO__ TN]I IIT"I~~_-~_,_.I\-----I
.:AS....,RN EASTERN IllU: III.lICKOIn: BI.OCK
LQ.!!Q.O__ I II IQ~Q~·-I----
WJo:STJo:IINWJo:STF.RN mm III.CICKOIlJo: Ill.llCK
FAil....
10600
Illl zunllliun (\\'1%) Culcnhlletl Fe (\\'1%)
I',. . . ·1 < 2-1.0 1'·....>1 < 19.8
2-1.0·25.5 ~~< ~~{I 19.8·22.5
r'~"\""~25.5·26.0 ~~:':;;:~"~:\~. 22.5·25.6
1:;1r;'::':~':')'] 26.0·27.3 r~!,,":irX'm 25.6·30.8i~·:}::·~:·H.:):::. :ti~?~~~\!f:;fE·}:·;
> 27.3 > 30.8
Q Q Q Q Q
Q 0 0 o 0 ~ ~ Q ~ ~
------~ --------- ._-----~ ----- ------~ .._-----~ ------ ._--- "!,---
Figure 5.1: Ba11um zonation within the barite cap and asp. Figure 5.2: Iron zonation within the barite cap and asp.

----- -_._-. _. -----~----~~---~
~NGNt� TN
TN'J !.~!!O ~ .. I11000
t:ASTmINEASTERN
cm.,; III.CIl:K ORt: 1I1.0CK
!.!~!!.O__ I L, , ~ ~.~ ~--I-----I./
WI·;sn:IlNWICsn:RN mm IIUICK
Ollt: III.oeK
10600_._--_._- --_.
I'll :wualinu (wloA.) Zn zonllliuu (wl%)
I' . ...... ...'1 <3.11< 2.48
3.71- 4.78
3.13· HI} 4.78·5.23 111400
2..18·3.13
.. --- --Ir.'T-20'II----13..19·4.15� ~f!W~im~~ 5.23·6.41
_ >6.41> 4.15
<:> <:> 0> <:> 0> 0> <:> <:>� <:>
0> 0> <:> \0 ~ 0> 'D ~ 0>
I/l, , 'D ____ ~, I. ~,, .'_ 'D ._._---~,----_.,._--
Figure 5.3: Lead zonation within the barite cap and asp. Figure 5.4: Zinc zonation within the barite cap and asp.

63
Gold enrichment (Figure 5.5) occurs at 10850 N on the eastern ore block with relatively high
levels of Au overlying the central feeder. Low levels of Au exist over the northern and
southern feeder regions.
Silver zonation (Figure 5.6) is similar to tharof Pb and Zn, in that zones with high Ag
concentrations outline the central feeder on the eastern ore block. In addition, high Ag values
also outline the location of the northern feeder and to a lesser extent the southern feeder.
Copper zonation (Figure 5.7) distinctly outlines the southern feeder. High Cu values occur
over the northern and northern part of the central feeder systems. The southern part of the
central feeder is depleted however, as is the southern end of the cap zone.
Arsenic distribution (Figure 5.8) shows a high over the central feeder on the eastern ore
block. Arsenic is significantly less developed on the eastern ore block. An As high is
centred on 10630 N, and corresponds to an isolated occurrence of the GSP.
5.2.1 Interpretation
The contribution of either the barite cap or GSP to the observed metal zonation patterns only
is inferred from qualitative and quantitative work on mineral associations (refer Chapter Three
and Four). The dominant As distribution is derived largely from the GSP, and in particular,
the As high on the eastern ore block (Figure 5.8) corresponds defmitively to the GSP. Gold
in the GSP is contained either in pyrite or arsenopyrite (refer Chapter Four) and a positive
correlation between As, Au and Fe is evident, particularly on the eastern ore block in the
vicinity of the central feeder. Since As occurs within pyrite in the barite cap, this trend is
enhanced. Ag as tetrahedrite-tennantite series of minerals, displays a distinct zonal
distribution around the central feeder. A similarity in solubility and temperature for Pb and
Zn (Huston and Large, 1987) is indicated by their close zonal affinities, and may be attributed
to similarities is transport and deposition systematics.
The enrichment of metals in the cap zones is best developed over the central feeder on the
eastern ore block. The northern feeder is outlined by Pb, Zn, Cu, Ag, whilst the southern
feeder is only outlined by Zn and Cu, and to a lesser extent Ag. Zones of Ba enrichment
correlate with regions where the barite cap attains its greatest thickness (Figure 2.6), and with
zones of Pb, Zn, Fe, As, Ag, Au enrichment.
/,

TN GNt
U!-!!._O_I 'J_....: _1 _
!!~QO__I _
w.:sn:RN IIU.: 1I1.IICK
EASTERN ORF. /l1.OCK
.·A"....
All :wnlllion (ppm)
<1..16
1..16· 1.61
1.61- 2.03
2.03·2.45
> 2.45
,------,-----
1;N
TN
!! !!!!!!- ------1----1 1----= 1\----1
.:AsnmN I 11111; III.(ICK
! !!~~~--I-----II"
WI·:sn:IlN mm III.(ICK
Ag zonal ion (11/111I)
<90
90· III
11I·136
lliN~*M~W1~~1 136· 164 - > 164
C c c Q Q C Q Q C C
Q Q ~ ~ Q~
----"-_'"... '1) ._----~ ------' ~I-_--_I--_--'~=I- --_._----- ~~ ~
Figure 5.5: Gold zonation within the barite cap and GSP. Figure 5.6: Silver zonation within the barite cap and GSP.
c

__ _
._- -_._-,----,-----,r-----,--- ----- --------,-----,--ON
l'N
~ TNTN
l.!.Q.Q.°__ I 1 1 ~ !~~~-- --_._-_.
t:i\Sn:RNEASTERN 11I11'; IIUICKORt: III.lICK
! ~~~O I 1Ql!~~__ I _
WES...lmNWES...lmN mm 11I.IICK
onE 1I1.(I(:K
As ZIIIIIII;IIII (wl%)
I: .:- "'1 1:-:- '. -:1 < 0.16<IUS
0.15 ·(1.23 0.16·0.22
0.22·0.270.23 - 0.27
0.27·0.330.27 - 0.32
> 0.33> 0.32
c:> c:> c:> c:> c:> c:> c:> c:> o c:> c:>o
""� 00 0�00 0 lI) _. ~, _ ____ "!!I I '"
-~ -_.'_. '" ------- ----_.~ -----, ._---'" Figure 5.7: Copper zonation within the barite cap and asp. Figure 5.8: Arsenic zonation within the barite cap and asp.

66
As stated previously (Chapter Two) the trend of the barite cap and GSP parallels with the
alignment of the feeder systems (Figure 2.5). The oblique intersection of this northeast
southwest structure with the Jack Fault, corresponds to the central feeder and is the location
where the caps show maximum thickness and enrichment in base and precious metals. As a
result, enrichment of the cap zones would appear structurally controlled, and correspond to
the hottest regions of the hydrothermal system. Thus they indicate the sites of maximum
fluid discharge.
5.3 Vertical Zonation
In order to enhance zonation studies and to present a three dimensional perspective, zonation
studies on Sections 10630 N and 10790 N were completed (Figures 5.9 and 5.10
respectively). The contoured sections record vertical metal associations within and between c·
the barite cap and GSP. Metal zonation contours through the cap zones for Sections 10630
N and 10790 N were hand contoured from assay data.
The distribution of barium throughout the underlying massive sulphide was also examined.
The percentile levels used in the construction of Ba contours were derived from the spectrum
of assay results of 10630 Nand 10790 N.
5.3.1 Section 10630 N
From Section 10630 N (Figure 5.9 a, b, c, d, e, f, g) it can be seen that the GSP contains
enriched levels of Au and As. A central core within the GSP is enriched in Ag, Zn, Pb and to
a lesser extent Cu. Barium levels are low in the GSP.
As expected the barite cap is enriched with respect to Ba, to levels greater than 27.3 weight %
Ba). Au values are elevated along the barite/massive sulphide contact and decrease with
increasing distance distance from the contact. In stratigraphically higher regions of the barite
cap, Au is depleted. A similar pattern exists for Cu, Pb and Zn, which exhibit lower
concentrations further from the massive sulphide contact. Zn values are elevated directly
over the massive sulphide, proximal to the Jack fault. Ag levels are low throughout the entire
barite horizon. As contours for the barite cap record intermediate to low As levels. An
elevated As zone in the massive barite corresponds to a zone of massive barite, that contains
a significant proportion of GSP (for example sample RS12).
/'

67
Pb zon:llio~ (wl% )
...... a) Pb
HL.I. 17 J.S
T\ ~lll:- :- :-1 °1 I>>>~1
dA8
2:48.3.13
,3.13 - 3.49
I Fb) Zn'
I J
IIL4t4 17 J.s
T\ I 'I \
...
...,
°1
b·".;···,··_··..·,.., 3.49 -4.15
_ >4.15
Lso \1:): ..\~ I ,JI I 1!.50 '11IIIII./ 'o,! I 55..!!
Zn zonalion (wl%)
I> :- :-1 d.77
"'" _.............. J 3.77.4.78
I. 4.78 - 5.23
5.23 - 6.41 ...... '"...° ~p;w~ ~! I[~~~ "" co >6.41 ",j
Ca zonalion (wl%)
'"... ...,.. HL4t4 ;;:: : •• ' .' < 0.15 ltL414.. 17 J.s --1 1 ~~"1 l 7 J.SC) CU '"T \ "'1. I~I >~/~I 0.15·0.23
I fd) As
0.23 - 0.27
0.27 - 0.32 e";·'':':::'·'::iri
_ >0.32
\~J.\~ I I550 55..!!11 1~50 =-... ;,\-~ I 5-t!!
As zonalion (wl%)
I: .: .>1 <0.16
t/:: I ::: j 0.16. 0.22
I' ", ". 'I'~',,<,: ':,:~ 0.22·0.27
~~;":i.::\\;i~~~] 0.27· 0.33::"h:;::,,',. \:~.
'"... ..... ..... p/~&~ "'I~: I _ >0.33 ....Il~ ~~~ e'
Figure 5.9: Metal zonation contours within the barite cap and asp for Section 10630 N
;:

68
Au zonalion (ppm)
.... HL414 ~II:- .0 00' <1.46 IIL414 '"..... J 7 J.$ 17J.$l I"""/~ 0\e) Au T\ :- ." ;-.. 1.46· 1.67 Ff) Ag r\ "'I
I I I"'1.67.2.03 I
2.03·2.45
_.>2.45
\.:~~ I JJI IL50 t~5o ~J">j. J H~
Ag zonalion (ppm)
1:-:.:1 <90
\- ........... )� 90·111
111·136
136. 164
...... '" '"... .. %{0W~ ~! 1_ >164 Ilg W~~ """"
'"... "" co ~t.. ..
g) Ba
LSD
lla zunalion (wt%)
<24.0
t'~~:'i 24.0·25.s
[/'''''~"J 25.3·26.0
1:- : -: I
.-\~. :.~::~.~
26.0· 27.3
_ >27.3 '"co... co
Figure 5.9: (cont.)
l

69
5.3.2 Section 10790 North
The GSP has a low concentration of Ba and Cu, and is elevated in As, Au, Ag, Zn and Pb
(Figure 5.10 a, b, c, d, e, f, g). The barite cap exhibits a variation in Ba levels and an
enrichment of Au, Ag, and to a lesser extent As. The zonation of Pb and Zn are similar,
being anomalously high near the barite cap/massive sulphide contact, and grade to relatively
lower values near the HVS/barite cap contact Cu is enriched proximal to the massive barite
cap/sulphide contact and relatively depleted in the upper portions of the barite cap. The GSP
and barite caps are not nearly so identifiable by their metal zonation patterns as previously
observed in Section 10630 N.
5.3.3 Barium Zonation In The Massive Sulphide
The genetic association of the cap zones to underlying massive sulphide mineralisation is
considered in the schematic diagrams (Figure 5.11 and 5.12) of Ba distribution through the
massive sulphides, barite cap and GSP.
Section 10630 N
Section 10630 N through the western ore block, displays a distinct Ba zonation proximal to
the Jack Fault (Figure 5.11). Ba shows a plume style enrichment, broadening upwards and
outwards toward the top of the mound. Zones of Ba enrichment at the base of the sulphide
mound do not appear to be associated with elevated Ba levels proximal to the Jack Fault.
Intermediate Ba levels are associated with the Gillian Fault, but broaden to a thin barite cap on
the western flank of the massive sulphide. Remainder massive sulphides show anomalously
low levels of Ba.
Section 10790 N
Section 10790 N (Figure 5.12) shows similar metal zonation patterns to that of Section
10630 N. A similar plume of Ba enrichment is localised against the Jack Fault. In the lower
eastern portions of the sulphide mound, anomalous barium highs occur. These zones appear
quite separate to the observed zonation proximal to the Jack Fault and are thought to be the
result of barite veining in the massive sulphide. The central portions of the massive sulphides
are anomalously low in Ba.
5.3.4 Interpretation
The metal zonation patterns in the cap zones of Section 10630 N are quite different from
those in Section 10790 N. The lateral distributions of metals (section 5.1) showed the central
feeder on the eastern ore block to be a locus of hydrothermal activity, due to high baseand
/

701I
a) Pb Pb zonotion (wt~)
r:--:---:l ~ <~•..J8
~
~ 1.48-3.13
t7.'I..,:,":~,,:;.s.:'(J'.':,;:',:",:,-: 3.13 - 3.49
3.49·-1.15
_ >4.15
b) Zn Zn zonolion (..t~)
~~'~!J ~
~ <3.77
[Z], , , , , / , , " 3.7i ·-1.78
k}~~·;~:.(:~::f 4.78· S.2J
S.=:J ·05.-11 550\
_>05.-11
c) Cu I~
Ca zon:ujon (W(~;
~
L....:..:....:. < O.lS
~
~ O.lS - 0.23
5~~;;!>:j o.n -0.:7
t~(i~fi~;&~- 0.27.0.J%
>0..32
d) As As zon:uion (wt ~)
~
< 0.16~
~ 0.16·0.22~
I~f~::~~}~;f 0.2:·0.27
0.27·0.JJ
_ >0.J3
Figure 5.10: Metal zonation contours within the barite cap and GSP on Sectior 10790N.
/'

71
e) Au An zonalion (ppm I
..,~ ~ <1.46• ""<.JI L:......:....:.
I~~>'~'~J 1.46- 1.67
W~~r.:rl~~:J 1.67·2.0J
f)rlt"'·:~ 2.0J • 2.45,;i!"i~i't...:
550
._ >2.45
f) Ag Ag zonation (ppml
c=J <90
90· III
111·136
136· 160l
> 160l -g) Ba
B.a mnacion (wt~)
r-:---:-l <24.0~
:4.0· ZS...s
~ 2!..5. :~.O~
26.0· .7..:Jmf:~;'~~(*~~l
_ >27..:J
Figure 5.10: (cont.)
l

72
UI VI UI c ~ ~
UI e VI e e e
HL414
Ba zonation (wt%)
<0.05550 I I:'" -: -:1 550
0.05·0.15~ ,',',','I. h'~'''''. . ·...·.·1
0.15·1.15
1.15·5.9 P'~t'-"'fljYIjI~n« - > 5.9
I \�,�._.
500 500
\� \�
\
450 450
In VI
= ....;j
VI UI e e
Figure 5.11: Section 10630 N showing barium zonation through massive sulphides and cap zones. When movement of the Jack Fault is restored the section approximates that of Section 10790 N. Assay data from Abe:-fcj'le Resources Limited.
!

73
VI ~
VI Q
go
Ba zonation (wt%)
1:- :<I <0.05
I, ...... "'" ,I 0.05·0.15
0.15· 1.15
1.15·5.9 t:}~.1:;.r.J.~iilli!fil - >5.9
I / -.... ~:f.
. . .....~~ .""'.? 550
500 500
'450
HL340 450
\ VI VI QQ~
QVI QQ
Figure 5.12: Section 10790 N showing barium zonation through massive sulphides and cap zones. When movement of the Jack Fault is restored the section Gpproximates that of Section 10630 N. Assay data from Aberfoyle Resources Limited.
/�

74
precious metal concentrations in the cap zones. It is postulated that the distribution of metals
in the cap zones, particularly on Section 10790 N is the result of hydrothermal redistribution
of metals from the underlying sulphides to the cap zones. Petrological evidence (Chapter
Three) suggests that many sulphide phases in the barite cap and asp are later, and
consequently the products of later hydrothermal activity during the same mineralising phase.
The complex metal zonation patterns and the interfingering nature of the barite cap and asp
on Section 10790 would support this. Section 10630 N also occurs within the central feeder
region. The location of this Section on the western ore block, indicates it to that it is spatially
removed from regions of intense hydrothermal activity.
In general the metal distributions show the asp to be enriched in Au, Ag, Pb, As, Zn and to
a lesser extent Cu. The barite cap is locally enriched in Au, Ag, Pb and Zn proximal to the
massive sulphide contact and the Jack Fault. The metal distributions may be interpreted as
either the result of the passage of hydrothermal fluids through the barite cap, or as a
consequence of dynamic chemical transition from the massive sulphide regime (reducing) to
the barite cap regime (oxidising). Alternatively, the zonation patterns may be an expression
of both. A low Ba content of the asp would suggest a similar transition of Ba from the
barite cap (oxidising) to the asp (reducing). In the upper portions of the barite cap, the
development of metals other than Ba is poor.
When Devonian movement on the Jack Fault is restored Sections 10630 N and 10790 N
approximately align. Ba contours for the massive sulphide and cap zones indicate a plume of
Ba developed around the Jack Fault. The plume appears to broaden toward the upper
portions of the massive sulphides, attaining maximum development in the cap zones. The
distribution of Ba as indicated from Ba zonation may be the result of an increased component
of seawater and hydrothermal fluid interaction toward the upper regions of the sulphide
mound. The distinctive zonation around the Jack fault on Sections 10630 Nand 10790 N are
suggestive of fluid pathways for the precipitation of barium due to the cooling of upwelling
hydrothermal solutions. Cooling hydrothermal solutions, appear to have moved upwards and
outwards from what is now the Jack fault. To a lesser extent this is true for smaller faults
such as the aillian fault. Evidence of similar Ba zonation has been observed in underground
exposures (R.C. Downs pers. comm.). Barium highs in the lower eastern portions of
Sections 10630 N and 10790 N appear to be isolated. These anomalous Ba highs may be
related to baritic veining in the massive sulphides, and could be the result of late stage open.
space fIll.
/
75
Barium zonation through the massive sulphide is therefore centred on the hottest parts of the
feeder system. The observed plume of Ba within the massive sulphide may be either the
result of the central feeder, which was later transected by the Devonian Jack Fault, or the
result of a pre-existing structure which acted as a conduit for hydrothermal solutions passing
to the sea floor.
5.4 Hangingwall Barium Zonation
Hangingwall basalt shows a plume enriched in Ba (Jack, 1989),. The alteration zone is
localised along the plane of the Jack Fault in the central area above the Hellyer deposit This
zone correlates with those areas of maximum thickness of the orebody and cap zones, as well
as to zones of Ba enrichment in the barite cap. Jack (1990) concluded that the deposition of
the overlying basalts occurred during the Cambrian, prior to the termination of the
hydrothermal system (Jack, 1990). Jack (1989;1990) and McArthur (1990) concluded that
the baritic alteration of overlying basalts is the result of the waning hydrothermal system.
5.5 Discussion
An important assumption, which has previously been addressed, is the later remobilisation
and recrystallisation of minerals due to metamorphism. Gemmell (1989) suggested that low
grade metamorphism and structural deformation has preserved the hydrothermal effect
associated with the mineralising system. From this, it has been assumed that the distribution
of metals is the direct result of the hydrothermal system.
Hydrothermal overprinting of the barite cap and GSP causes difficulty in the interpreting of
metal zonation patterns. Textural evidence (refer Chapter Three) suggests that many of the
sulphide phases are the result of hydrothermal activity, which post dates the deposition of
both the barite cap and GSP. In particular much of the sphalerite, galena, pyrite, tetrahedrite
tennantite and chalcopyrite are thought to be the products of late stage hydrothermal activity.
Assuming this to be the case, then zonal distribution of Zn, Pb, Fe, Ag, Au and Cu will
largely represent those sites where hydrothermal overprinting of the cap zones has occurred.
From lateral zonation studies the effects of hydrothermal overprinting were best developed
over the central feeder system, proximal to the intersection of the feeder trend and Jack Fault.
The somewhat irregular distribution of metals through the interfingering cap zones on Section
10790 N would support this. The zone refining model ofEldridge.et al (1983) would
suggest that metals from underlying massive sulphides have redistributed into the upper
portions of the mound, including the barite cap and GSP. Evidence of Au, Ag, Pb, Zn
sulphide deposition proximal to the massive sulphidelbarite cap contact, indicates this contact
!

76
to be the most affected. The zone refining process is closely linked to growth of the mound
(Lyddon, 1988). It is envisaged that as the lower portions of the cap zones become
overprinted by sulphide phases, the caps zones effectively become part of the underlying
massive sulphide. In a similar style, the barite cap and GSP are thought to be replaced. The
GSP and barite caps are dominated by a porous open framework array, indicating that open
space precipitation is likely to occur in the upper regions of the cap zones. This feature is
present on Section 10630 N, where the upper portions of the barite cap are less affected by
hydrothermal overprinting. The sites of deposition of the barite cap and GSP may therefore
be predominantly where hydrothermal fluids were in direct contact with the seawater. The
deposition of barite or silica on the outer surface of the mound may have assisted growth
(Ohmoto et al, 1983), with barite and silica continually being replaced by sulphides lower in
the cap zones during mound growth. The growth of the sulphide mound and caps zones is
envisaged to have occurred in a similar fashion.
The waning period of the hydrothermal system is in.dicated by the presence of late barite veins
in the massive sulphide and as the hangingwall alteration zone. The plume of barium
enrichment, observed in the massive sulphide and localised against the Jack Fault and central
feeder system, would indicate the sites of the likely passage of mineralising hydrothermal
fluids up to the sea floor.
5.6 Conclusion
Previous studies of metal zonation in the Hellyer orebody have revealed a distinct spatial
relation between the core of the feeder system and metal distribution within the ore (McArthur
and Dronseika, 1990). Metal zonation studies for the barite cap and GSP would confirm
this. These studies also suggest that the barite cap and GSP are due to progressive
replacement associated with mound growth.
l

771
Chapter Six Sulphur Isotope G eochemistry
6.1 Introduction
A sulphur isotope study was earned out to examine the sulphur isotopic compositions of
sulphate and sulphide species of the barite cap and asp. Sulphur isotopes can be used to
constrain the physiochemical conditions and/or mechanisms of mineral precipitation,
providing information on the sources of sulphur and temperatures of formation (Ohmoto and
Rye, 1979). ~xamination of the spatial distribution of sulphur isotopes values may provide
valuable information on the evolution of mineralising fluids (Ohmoto, 1986).. '
Variations in sulphur isotopic compositions of sulphide and sulphate species is an indication
of variations in the source of sulphur. In hydrothermal systems there exist three main
contributors to the isotopic signature; seawater, magmatic and biogenic sulphur (Ohmoto,
1986). Magmatic sulphur may result from direct contribution by the hydrothermal fluid or the
leaching of sulphur from rocks.
Sulphur isotopic analyses of 100 mineral separates from the barite cap and asp are
presented. Samples were predominantly barite and pyrite. Barite separates numbered forty
six and sulphide species, including pyrite, sphalerite and galena formed the remainder.
The equilibrium fractionation of sulphur, between co-existing sulphide minerals, can be used
as a geothermometer. Difficulties however, in proving co-precipitation under equilibrium
conditions, and in obtaining pure mineral separates, limit the application of sulphur isotopes
as indicators of temperatures of formation. Isotopic fractionation factors of sulphate species
are sensitive to temperature (Ohmbto, 1986). The observed fractionation between sulphates
and sulphides would not be equivalent to the equilibration values at the time of deposition due
to temperature induced modification. Consequently sulphate-sulphide pairs are not suitable
geothermometers (Ohmoto, 1986). For this reason, no attempt was made to derive
temperatures from the observed fractionation of co-existing mineral pairs.
6.2 Analytical Procedure
The sulphur isotopic compositions (834S) were determined using standard analytical
techniques (refer to Ohmoto and Rye, 1979) at the Central Science Laboratory of the
l

78
University of Tasmania. A number of duplicate samples were analysed, with the result that
the 034s values are accurate to ±O.l per mil and ±1.0 per mil for sulphide and sulphate
species respectively. All 834S values are quoted relative to the CDT standard.
Separates for isotopic analyses were either drilied or hand picked. Drilled samples were
accompanied by polished thin sections for purity checks. Minor impurities were caused by
the fine grained nature and often complex intergrowths of sulphide and/or sulphate phases.
6.3 Results
6.3.1 Isotope Distributions�
The sulphur isotope distributions for the barite cap, GSP and HVS are shown in Figure 6.1,�
6.2 and 6.3 respectively. Isotopic values and sample locations are tabulated in Appendix 4.1,�
4.2 and 4.3 respectively.�
Analysis of sulphate samples (barite) from the barite cap show isotopic compositions which
range from +26.0 to +44.9 per mil (mean of 39.6 per mil). Sulphide separates range
between +6.4 to +16.1 per mil for pyrite (mean of +9.7 per mil), +6.1 to +8.2 per mil for
sphalerite (mean of +7.5 per mil) and 6.4 to 7.1per mil for galena (mean of +6.8 per mil).
The 034S values for barite in the GSP are between +38.2 and +49.6 per mil (mean of 43.7
per mil). Pyrite 034S values show a wide range from +8.3 per mil to +36.9 per mil (mean of
+14.5 per mil). Sphalerite 034S values show a narrow range of +6.0 to +10.4 per mil (mean
of +7.7 per mil). A single determination for galena shows a 034S value of +5.5 per mil.
Six 034S values were determined for barite in the HVS (Figure 6.3). The range of 834S was
from +36.5 to +41.8 per mil, with a mean of +40.3 per mil.
Two isotopic analyses from barite veining in outcropping Pillow Lava Sequence (PLS) were
determined. The 834S values were +29.6 and +28.3 per mil.
6.3.2 Isotopic Variation�
The expected order of 034S fractionation under equilibrium conditions between co�
precipitating sulphide phases is :�
;-:�

Num
ber
of
Ana
lyse
s N
umbe
r o
f A
naly
ses
Num
ber
of
Ana
lyse
s t-
-)
.j>.
0 t-
-)
.j>.
0 t-
-)0
C1\
0
0
- ::1
0 C
1\
00
-
0
t--)
w
.j>
. U
l C
1\
lJQ
::10-
2 l::
0-
2 lJQ
0-2
.,::1
l::
lJ
Q
2-4
I'll
2-4
.,2-
4 I'l
l.,l::
4-6
4-6
4-6
I'll
6-8
N'" 6-
8 .
6-8
'"8-
10
8-10
8-
10
~
'" _.
W
10-1
2 C
l)
10-1
2 3
10-1
2 _.
t:r:l
12-1
4 12
-14
12-1
4 3
n -~
~
14-1
6 0
I'll
14-1
6 ::!.
14-1
6 §
0 11
.....
~ =
16-1
8 16
-18
'D
I'll
16-1
8 C
I)::S
11
=
~
rn18
-20
.... 18
-20
18-2
0 =a
.s. ~
~
Ci
-::s
20
-22
Ci
20-2
2 ~
20-2
2 "O
lJQ
U
. "0
Q
.J
22-2
4 ~
Q
.J
22-2
4 ~
22
-24
[~
~
"0
~
24
-26
~
24-2
6 ...
24
-26
.,~ -
Cl)
~-
~
26-2
8 ~
26
-28
~
26-2
8 3
Cl!
Cl)
=
0
0<
0
_
::r'
t 2
8-3
0
§ ...
.. 0
~
28-3
0 =
t
28
-30
"0
'-'
30-3
2 "0-
'-'
30-3
2'-
' 30
-32
11 "O
n
::r'
.,£: ~
I'l
l ~
32
-34
32-3
432
-34
0 ., =
W
~=.
34
-36
34-3
6 ~
34-3
6 C
l! -·n
_ C
l!
~
36-3
8 36
-38
036
-38
q~
C
l! .....
_.CI
! 0 ~
038
-40
38-4
038
-40
.....0
" :to
"0
03
40-4
2 3
40-4
2 I'l
l40
-42
=n
"0_
.C
l)
0.....
42
-44
§ I'l
l 42
-44
§42
-44
~
o I'l
l 44
-46
_. 44
-46
1144
-46
::S,.Q
11
~
fii'
w
.....
~46
-48
w
Cl!
46-4
8 'D
46-4
8 =
.....
:::!.
I'll
.,_. 0.
.48
-50
~
48-5
0 0
"48
-50
::s n ~
=_.
50-5
2 ~
0
" 50
-52
.....50
-52
I'll
_. .....52
-54
=
52-5
4 0
52-5
4 ::s
0 ::s
ill,."
:-.
• 11
ID
•11
ID ~
t/
)t/
)
to
Q
rn to
Q
'"0
'go
e. ~.
~
::r
' e.
~. ~
n
fi
fi
e. ::t
fi
fi
e. 9
n P>
P>
-..
..l9.
:1.
1.0
fin

80
834Spyrite> 034s sphalerite> 834Schalcopyrite> 834Sgalena (Bachinski, 1969)
This order of fractionation is shown by the sulphide phases of the Hellyer baritic and
siliceous caps. Sulphates displays heavy 034s values, consistent with a seawater derived
S042- component (Ohmoto, 1988), on the assumption that sulphate minerals inherit the
034SS04 of the fluid from which they precipitate.
Seawater at the time of formation of Hellyer (Middle Cambrian) is assumed to have a 034s
value approximating +30 per mil (Claypool et al., 1980). Sulphates in the barite cap have
034S values (mean 39.6 per mil) that are higher than contemporaneous seawater. This would
il1dicate that either the Middle Cambrian 034sS04 value was heavier than estimated by
Claypool et al. (1980) or that some mechanism of isotopic enrichment operated during
deposition. The 034SS04 values determined for the barite cap are in agreement with those
834S ratios determined by Jack (1989) for the barite cap. Similarly, the GSP displays heavy
034SS04 values of +43.7 per mil. Sulphate isotope variation in the GSP is however narrower
and isotopically heavier than that observed in the barite cap. The HVS shows similar
834SS04 values to those of the barite cap.
Massive sulphides at Hellyer have a mean sulphur isotopic signature of +7.2 per mil (Jack,
1989), refer Figure 6.4. Pyrite in the barite cap is therefore significantly heavier at +9.7 per
mil, whilst the GSP contains even heavier pyrite values of +14.5 per mil. The increase in
034SH2s values from the barite cap to the GSP, parallel the isotopic increase of 034SS04
values from the barite cap to GSP. Sphalerite and galena, in both the barite cap and GSP,
have 034s values which approximate those values obtained for the Hellyer massive sulphides,
as reported by Jack (1989).
Similarities exist between the 834S ratios of the cap zones, the underlying stringer system,
and the massive sulphides (Figure 6.4). Barite, from the barite cap and GSP, show 834S
ratios comparable to those of the barite-carbonate veins in the stringer system (with a range of
+42.1 to +49.5 per mil). Pyrite 834S values in the barite cap have a comparable isotopic
composition to the 834S values values obtained for the quartz-pyrite-carbonate stringer veins
~ith mean +9.9 per mil). Sphalerite and galena from within the barite cap and GSP show
comparable 834S values to the base metal stringer veins (with mean of +6.9 per mil)
(Gemmell, 1988; 1989). Syn-mineralising stringer veins at Hellyer are thought to represent
channelways for hydrothermal soiutions venting to the sea floor (Gemmell and Large, in
press). Gemmell and Large (in press) suggested variations in 834S values to be the result of .
Cambrian seawater sulphate mixing with a hydrothermal fluid which contains a significant
l

81 .A..L_.LI.1_.... ~-.&. .... ..- _Ut'
12 I , I
8
4
o I VlrJltl [.11/1 • I ••••••
Hellyer Siliceous cap12 , , ,
8
4
0' J'II/Jr Jl4VII d VI I 1/1 IA __
Hellyer alteration zones (Jack. 1989) LEGEND 12 , , ,
• Barite
8 • Sericite Zone
IBI Stage2A4
11 Stage 2B & 2C Barite 0 ....' '----.....
Hellyer stringer zone (Gemmell & Large. 1991) ~ Stringer Zone 30 I i ,
llIlI Galena
20 IIIlIII Stage2B
10 • Sphalerite
r.- ~-') ~ Chlorite Zone o
Que River (McGoldrick. 1988) § Stage2C 30 , i ,
~ Stage 2B (in orebody)
20 E'.J Pyrite
1O.J ~,~, tlliI Stage 2A (in SEZ)
o Massive Sulfide o I I 11 !Iv t"',.., I.• • •• I
Rosebery (Green et al.• 1981) 10 , Ii
8
6
4
2
0' '11,,11"'" ,..... !
Mt. Charter (Rand. 1988)10 , , I
8
6
4
2 -0oJ f'J ~ I21PJ!A I ·1 d~~~~~;~~~~~~~~~~~~~~~~~~~~
~~~~~~~~~~~~~~~~~~~~~~~
d34S (%0)
Figure 6.4: Sulphur isotope data for the Hellyer barite and siliceous caps (this study) and nearby mineralisation. The line shows the Cambrian 034S value of +30 per mill (Clayton et al.. 1980).
f

82
proportion of igneous sulphur. The c?ITelation of sulphate and sulphide isotopic ratios
throughout the massive sulphides, stringer system and barite cap at Hellyer, is an indication
that the GSP and barite caps were deposited from the evolution of the same mineralising fluid
which formed the massive sulphides.
6.4 Sulphur Sources
Barite horizons of the Miocene Kuroko deposits show 034S values close to that of Miocene
seawater (Kusakabe and Chiba, 1983). As the 034S values of the Hellyer cap zones are
significantly heavier than the 034S of Cambrian seawater, other sources of sulphur must have
contributed to the 834SS04 signature.
Metals in VHMS deposits are thought have been derived by leaching from underlying rocks
by the convecting hydrothermal fluid system (Franklin et al., 1981). At Hellyer, massive
sulphides show isotopically light 834S values at +7.2 per mil, (Figure 6.4) which would
indicate a large proportion of sulphur was derived from underlying igneous rocks (Gemmell,
1989; Jack, 1989).
Sulphides and sulphates precipitating a reduced Cambrian seawater are expected to have 034S
values between +10 and +30 per mil respectively. The 034S values however, depend on
temperature and the amount of reduced sulphur in the fluid (Solomon et al., 1988). Shank et
al. (1981) reports that due to the chemical conditions associated with VHMS deposits,
isotopic equilibrium between reduced and oxidised species of sulphur in the hydrothermal
fluid is likely to be achieved. Assuming isotopic equilibrium, Solomon et al. (1988)
suggested sulphate reduction may occur as a Rayleigh fractionation process. A progressive
increase in the 834SS04 values would therefore be accompanied by an increase in the 834SH2S
values. The progressive reduction of seawater, as derived by Rayleigh fractionation is shown
Figure 6.5. Heavy 834S values of sulphide and sulphate species in the Hellyer cap zones
may therefore be explained by the incomplete reduction of seawater.
At the Rosebery deposit, Solomon et al. (1988) envisaged the formation of barite to be the
result of incompletely reduced seawater sulphate becoming more abundant in the
hydrothermal fluid and eventually dominant. An increased sulphate content of the hot ore
forming solutions mixing with cold seawater results in the precipitation of heavy 034S
sulphates (Solomon et al., 1988; Gemmell and Large, in press). If the Rayleigh fractionation
/

83
model of Solomon et al. (1988) is applied, then barite from the barite and GSP caps was
deriVed from fluids containing between 35 and 40 percent reduced aqueous sulphate (Figure
6.5). If sulphide species were deposited from the same incompletely reduced systems as the
sulphates, then the expected 834SH2S values for the GSP and barite horizons would be 20 to
15 per mil (Figure 6.5). The 834Spyrite ratios of the barite cap (mean of +9.9 per mil) is
significantly less than the aforesaid range, and this may corresponds to an increased
proportion of reduced sulphur in the hydrothermal solution.
Aasea...y m_UN. ] 3 s....04•• ",lIid.~.
bC',uoj pp
..
.. J / I barile cap and siliceous cap at Hellycr1 I
py..
"
20 la .. 51 •" " ~
Figure 6.5: Diagram to show the progressive reduction of seawater of 834S = +30 per mil at 300·C. The curves are derived by Rayleigh fractionation using +20 per mil for sulphatesulphide fractionation at 300·C (from Shank et al., 1981). The trend of the Rosebery massive sulphide lode is generated by mixing totally reduced seawater sulphate with rock sulphur. The Rosebery barite lode reflects late-stage circulation when only partial reduction of seawater sulphate takes place (data from Green et al., 1981). The Hellyer barite cap and GSP show precipitation under similar conditions. The variation of 834s values is the result of a fluctuating system and consequently fluctuating proportions of partially reduced seawater and reduced rock sulphur, from the upwelling hydrothermal solutions mixing with seawater (after Solomon et al., 1988): ba =barite, py = pyrite, sI =sphalerite).
The observed differences in 834S values for sulphides and sulphates of the barite and GSP
caps is therefore attributed to fluctuations in the amount of reduced sulphate present in the
hydrothermal solution at the time ofdeposition. Sulphur source variations may have been
induced by temperature fluctuations and/or a change in oxidation state. Janecky and Shanks
(1988) suggest chemically similar solutions can have significantly different 034S values. The
/'

84
baritic cap and GSP each represent a marked change in the oxidation state of the immediate
ore-forming environment. This change is reflected by their sulphur isotopic compositions,
which are significantly different to those of the underlying massive sulphide accumulation.
Reducing conditions associated with GSP deposition correlate to a higher proportion of
reduced sulphur in the hydrothermal fluid.
The barite veining in the overlying basaltic pillow lavas exposed at the surface have a 834S
values of +29.6 and +28.3 per mil, which is very close to Cambrian seawater (+30 per mil).
The origin of the sulphur may be considered to have been reduced sulphate derived from
Cambrian seawater. As the veining in the pillow lavas occurred during the waning phase of
the hydrothermal system (McArthur, 1986; Jack, 1989), then the contribution of reduced
sulphur from hydrothermal fluids decreased and barite precipitated directly from seawater
sulphate. These values are therefore, the best available estimate of the contemporaneous
seawater sulphate value at the time of formation of the Hellyer deposit.
6.5 Textural Variations
In the barite cap at Hellyer, the isotopically heaviest pyrites, with 834S of +16.1 and +14.6
per mil are related to banded barite-pyrite (samples RS73 and 450E) veins cross cutting
massive barite. The textural affinities of the two minerals suggest barite and pyrite to be
contemporaneous. The 834Spyrite values support deposition from a fluid containing a large
proportion of incompletely reduced sulphur.
Each generation of barite within the crustiform barite veins has an identical 834SS04 value
(sample RS 7377SD5A). These veins transect underlying massive sulphides and show no
contrast in 834SS04 values from values obtained for barite in the barite cap. The source of
sulphur for crustiform barite veining in massive sulphides, is therefore the same for the barite
cap. Similarly, no isotopic variation was observed between tabular barite laths and the
granular barite matrix which surrounds them (RS 18). For all, the source of sulphur appears
to be incompletely reduced Cambrian seawater sulphate.
A single sample from the barite cap (RS008) however, exhibits a low 834S value of +26.0
per mil. This sample contains fragmented tabular laths of barite in a sulphide matrix.
Gemmell (1988) determined a similar result of +19.1 per mil for a barite sample from barite
carbonate stringer veins (Gemmell and Large, in press). Formation of the barite from
!'
85
reduced seawater sulphate is concurrent with these Q34Ss04 values.
The HVS immediately overlying the barite cap contains fragmental barite laths incorporated in
a fine grained polymict matrix and barite that is a later replacement feature. The Q34S values
for barite in the HVS are similar to Q34S values of the barite cap. The source of sulphur is
therefore assumed to be the same. The sulphur isotope ratios of fragmental barite in the HVS
supports the interpretation of McArthur and Dronseika (1990), that barite fragments in the
HVS were derived from the underlying barite cap. Replacement style barites are also derived
from similar sulphur sources.
The range of Q34Ss04 values for barite in the GSP is narrow. It would therefore appear that
Q34Ss04 ratios are independent of textural variation in the GSP.
Sphalerite and galena in the barite cap and GSP are dominantly paragenetically late minerals
(refer Chapter Three) and show isotopic compositions comparable to that of the underlying
massive sulphides and base metal stringer veins. As a consequence the hydrothermal fluid
which deposited these phases is postulated to have been similar to that which deposited the
massive sulphides; containing a significant amount of rock sulphur. Sphalerite and galena in
the cap zones may therefore be the result of later hydrothermal alteration of the barite and
GSP caps.
Two pyrite samples showed elevated Q34S values of +32.2 and +39.6 per mil (samples RS21
and RS42 respectively). These pyrites were colloform in nature and indicative of pyrite
deposition in open space. The highly porous nature of the GSP and barite cap have been
previously identified (refer Chapter Three). The resulting Q34S values are derived from a
reduced seawater sulphur source. Solomon et al. (1988) suggested that in a closed system,
for example a pore space, a higher the water to rock ratio, results in a greater seawater
contribution. The results is higher Q34S values for precipitating sulphides.
Kusakabe and Chiba (1983) examined sulphur isotope variations and modes of occurrence
within the barite horizons of the Fukazawa deposit, Japan. The authors concluded there to be
no systematic variation in the Q34s barite values with different modes of occurrence. At
Hellyer however, a broad systematic variation of isotope ratios is identified. Textural
variations represent changes in the sources of sulphur as a consequence of differences in the
l

86
chemical conditions under which the mineral phases precipitated.
6.6 Sulphur Isotope Compositions of Other Deposits
At the Rosebery deposit, Green et al. (1981) and Solomon et al. (1988) propose the barite
ore lens to have formed from the partial reduction of Cambrian seawater sulphate under
equilibrium conditions. The authors suggest the process of sulphate removal or reduction
during circulation, is decreased in efficiency owing to the destruction of reductants. The
distribution of 834S values within the Rosebery barite lens is very similar to the Hellyer barite
cap 834S ratio distribution (Figure 6.4). Que River 834S values similarly correlate to both
sulphate and sulphide 834S values of the Hellyer cap zones (Figure 6.4). Mineralisation at Mt
Charter however, shows 834SS04 values to be generally high (between +40 and +48 per
mil), corresponding to either, the high 834S ratios of the barite cap or the distribution of 834S
in the GSP (Figure 6.4). 834SH2S values are in good agreement with those ratios obtained for
Mt Charter, Rosebery and Que River (Figure 6.4).
6.7 Conclusions
The 834S values obtained for barite within the barite cap and GSP are indicative of formation
of barite from partially reduced seawater sulphur. Fluctuations of the 834S ratios for barite
are attributed to variations in the amount of reduced sulphur in the hydrothermal solutions;
where sulphur in the hydrothermal solution is a combination of rock sulphur and seawater
sulphur (Janecky and Shanks, 1988). Such variations suggest the majority of pyrite has
precipitated from the same incompletely reduced, seawater sulphur solutions. The wide
variation of 834S values for pyrite are similarly thought to be the result of a fluctuating
sulphur source. Sphalerite and galena, with 834S ratios approximating the underlying
massive sulphides, are the result of a hydrothermal overprinting process. The 834S values
for sulphide and sulphate species within the barite cap and GSP are similar to those reported
the Rosebery deposit (Green et al, 1981), Que River deposit (McGoldrick, 1988) and Mt
Charter (Rand, 1988).
!'
87
Chapter Seven
Fluid Inclusions
7.1 Introduction
A fluid inclusion study was undertaken in order to obtain temperature and salinity data from
fluid inclusions for the Hellyer baritic cap. The microcrystalline nature of quartz within the
GSP, made it an unsuitable medium for fluid inclusion investigations.
Salinity data was obtained through a procedure in which fluid inclusion were initially frozen.
During subsequent heating, the temperature at which the fIrst melting of ice occurred was
recorded (Tm), and from these temperatures the salinity of the fluid phase was calculated
(Roedder, 1981; 1984). The components of the fluid phase, were identifIed from
salinity/temperature phase diagrams (reference). The minimum fIlling temperature or
homogenisation temperature (TIJ, was determined by heating inclusions until all the phases
present homogenised.
7.2 Methodology
Four samples (RS67, RS86, 450E and 7773SD) of transparent to translucent, coarsely
crystalline barite from the barite cap were selected for fluid inclusions studies. Two samples
were prepared as doubly polished thin sections and two as cleavage chips.
Microthermometry analysis was performed on a Fluid-Inc.-modifIed U.S.G.S. gas flow
heating/freezing stage in the Geology Department at the University of Tasmania. Calibration
tests used synthetic fluid inclusion standards of know composition, to determine the accuracy
of melt temperatures (Tm) and temperatures of homogenisation (Th). An accuracy of to
±O.3°C for Tm and ±O.5°C for Th was estimated. All liquid to vapour ratios were estimated
by assuming that fluid inclusions was a spherical body (after Roedder, 1981).
7.3 Fluid Inclusion Petrography
A critical issue in any fluid inclusion study is the selection criteria used for identifying
primary fluid inclusions. Although growth zoning within the barite samples examined was
absent, the criteria used to identify primary fluid inclusions was adapted from Hollister and
Crawford (1981), and Roedder (1981; 1984), that is, that fluid inclusions displayed:
1) No evidence of necking or leaking.
2) Dissociation from obvious secondary fluid inclusion trails.
3) An isolated occurrence.
!'

88
4) The presence of a semifaceted tabular shape or a crystal negative shape.
In this study inclusions, tenned "primary", displayed all of the above characteristics. In total
four fluid inclusion types were identified.
-0'
Type I
Type I were primary fluid inclusions, with dimensions which ranged from 8 to 12 microns
and 3 to 5 microns. These inclusions were tabular in shape (see Figure 7.1a) and, at room
temperature contained small percentages of vapour (liquid: vapour ~1 %). Evidence of C02
within the gas phase of the fluid inclusions was evident, as a dark vapour bubble.
Type IT
Type IT fluid inclusions were predominant in the barite samples examined and were secondary
in nature. They ranged in size from 8 to 10 microns and 3 to 6 microns, with an observed
liquid:vapourratio of 2% to 4% (Figure 7.1b).
Type ill
Secondary fluid inclusions which commonly fonned wide trails of inclusions which were less
than 3 microns in size.
Type IV
Secondary fluid inclusions with large (~20 microns in size), irregular, often angular shapes.
They are commonly C02 rich inclusions and have large liquid:vapour ratios (~ 8%).
Microthennometric data was not collected from Type III and Type IV secondary inclusions as
they clearly represent entrapment of some later fluid. The origin of Type Il inclusions was
unclear, as these inclusions displayed many features of primary inclusions. As a result, a
number of Type 2 secondary inclusions were also examined. The results of the study are
shown in Table 7.1.
~\G\)RE 1. \: fl\J\~ 1 t\tC.LUS\O~ 'fY?E~
~\.----:J....... ftpt. r. ~NCWS\DNS
Bi ~~-:> it?£. IL \~C.UJ~\Gf\l~
j;.

89
Telath WI. % N. Tmclath Naa d.e. temp Type Tm Th
1 ·1.4 222.8 2.4
1 ·1.9 245.6 3.2
1 ·1.4 240.6 2.4
1 -1.6 242.1 2.7
1 -0.9 138.2 -Iled? 1.6
1 -1.3 198.0 2.2
1 -3.2 214.8 5.2
1 -0.9 184.9 1.6
1 -1.8 186.7 2.8
1 -2.3 242.3 3.9
1 -6.3 n.d 9.5
1 -0.6 n.d. 1.0
1 -1.5 136 -Iled? 2.6
1 -2.3 238.7 3.9
1 -2.1 235.1 3.5
1 -1.6 238.1 2.7
165.7
2 -0.3 2 -0.1 d.e n.d.
d.e n.d. 148.6
2 -0.2 n.d. n.d.
2 -0.3 116.2 n.d
2 0.1 120.5 0.0
2 n.d. 124.9 n.d.
2 0.3 155.3 0.0
2 -0.5 145.9 0.0
2 -0.4 163.7 0.7
2 -0.1 123.5 0.0
2 n.d. d.e 0.9 n.d. 14.7 188.9
2 n.d. 163.5 2.4 n.d. 12.8
2 n.d. 119.3 0.7 n.d. 14.9
• n.d. =nOI delemlined
"d.e lemp = decrepitation u:mperarure�
.ulled? =leaked�
Table 7.1: Fluid inclusion results
7.3.3 Final Melt Temperatures (Tm)�
The temperatures of final melt (Tm) for Type I inclusions ranged from -0.6 to -6.3 °C with a�
mean of value of -2°C. The temperature range and the mean correspond to 1.0 to 9.5 and 3.2�
weight % NaCI equivalent (Figure 7.2).�
Tm for Type IT fluid inclusions range from -0.5 to +0.1 °C (mean of -0.25°C) with a
corresponding salinity value of 0 weight % NaCI equivalent (Figure 7.3). Three inclusions
contained clathrates with a final melt Tmclath temperature range of +0.7 to +2.4°C. Tmclath
values correspond to salinities of 12.8 and 14.9 weight % NaCI equivalent respectively
(Figure 7.4). In the fluid inclusions with clathrates, only the temperatures of clathrate
dissociation (Tmclath) were recorded as the Tm temperatures were obscured by the clathrate.
l
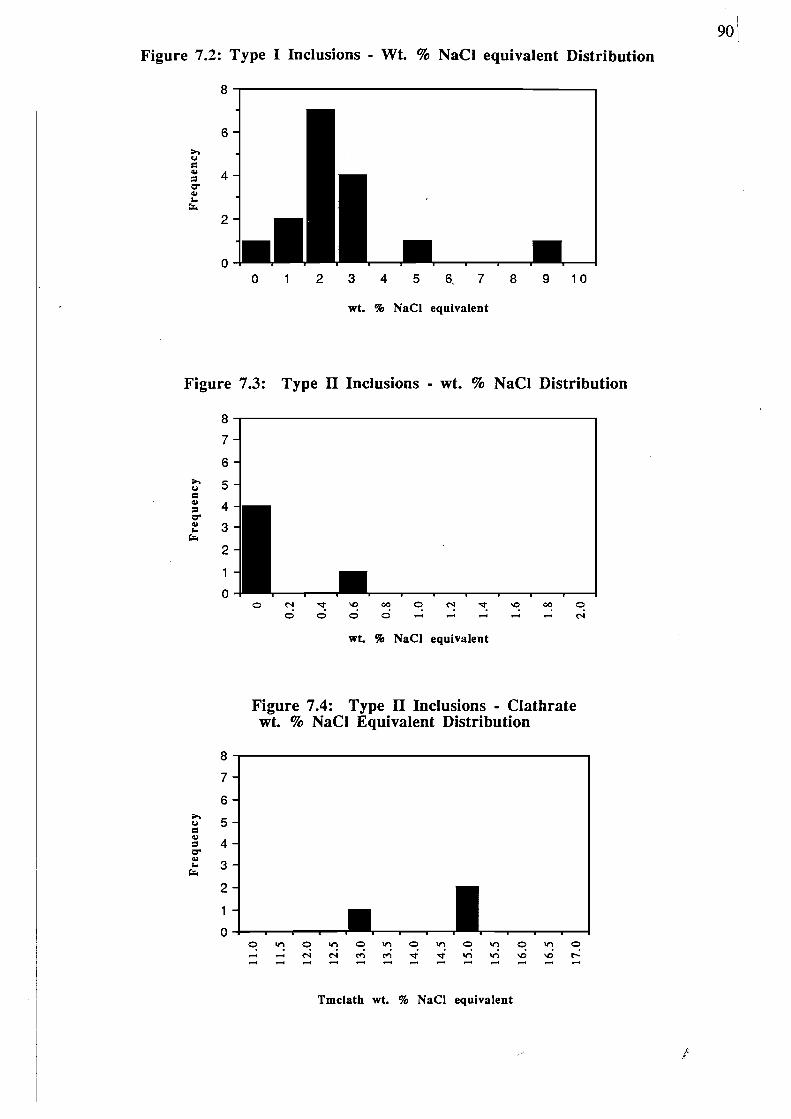
i 90\
Figure 7.2: Type I Inclusions· Wt. % NaCI equivalent Distribution
8
6 ;.., Col
=~
= 4 ~ ~
I-l:l:.
2
0 0 1 2 3 4 5 6, 7 8 9 10
wt. % NaCI equivalent
Figure 7.3: Type 11 Inclusions· wt. % NaCI Distribution
8
7
6 ;.., Col 5 =~
= 4 ~
~
I 3 l:l:.
2
1
0 0 ~ ~ ~ ~ ~ ~ ~ ~ ~ ~ o 0 0 0 ~ ~ ~ ~ ~ N
wt. % NaCI equivalent
Figure 7.4: Type 11 Inclusions· Clathrate wt. % NaCI Equivalent Distribution
8
7
6 ;..,
5Col
=~
= 4 ~
~
I 3l:l:.
2
1
0 0 lI"l 0 lI"l 0 lI"l 0 lI"l 0 lI"l 0~ "'!- - ('l ('l .... .... lI"l lI"l \0 \0 r-- - - - - - """- """- - - - - -
Tmclath wt. % NaCI equivalent
j:. :;
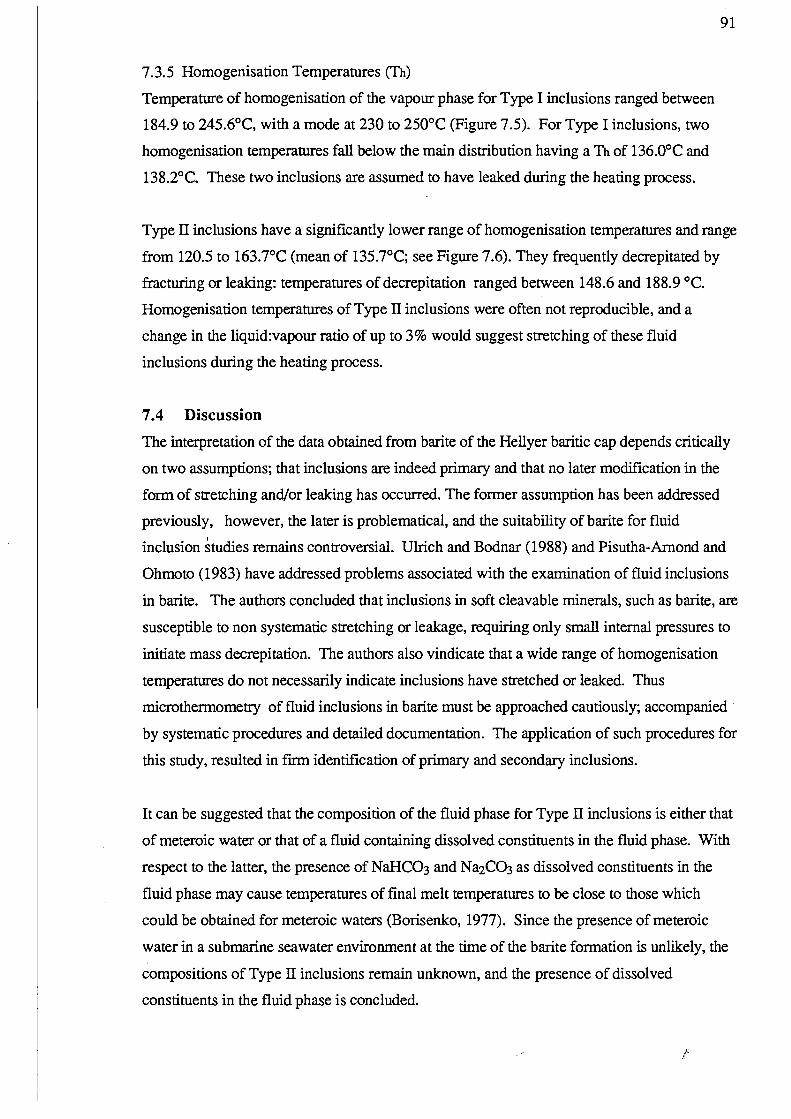
91
7.3.5 Homogenisation Temperatures (Th)
Temperature of homogenisation of the vapour phase for Type I inclusions ranged between
184.9 to 245.6°C, with a mode at 230 to 250°C (Figure 7.5). For Type I inclusions, two
homogenisation temperatures fall below the main distribution having a Th of 136.0°C and
138.2°C. These two inclusions are assumed to have leaked during the heating process.
Type 11 inclusions have a significantly lower range of homogenisation temperatures and range
from 120.5 to 163.7°C (mean of 135.7°C; see Figure 7.6). They frequently decrepitated by
fracturing or leaking: temperatures of decrepitation ranged between 148.6 and 188.9 cC.
Homogenisation temperatures of Type IT inclusions were often not reproducible, and a
change in the liquid:vapour ratio of up to 3% would suggest stretching of these fluid
inclusions during the heating process.
7.4 Discussion
The interpretation of the data obtained from barite of the Hellyer baritic cap depends critically
on two assumptions; that inclusions are indeed primary and that no later modification in the
fonn of stretching and/or leaking has occurred. The fonner assumption has been addressed
previously, however, the later is problematical, and the suitability of barite for fluid
inclusion studies remains controversial. Ulrich and Bodnar (1988) and Pisutha-Arnond and
Ohmoto (1983) have addressed problems associated with the examination of fluid inclusions
in barite. The authors concluded that inclusions in soft cleavable minerals, such as barite, are
susceptible to non systematic stretching or leakage, requiring only small internal pressures to
initiate mass decrepitation. The authors also vindicate that a wide range of homogenisation
temperatures do not necessarily indicate inclusions have stretched or leaked. Thus
microthennometry of fluid inclusions in barite must be approached cautiously; accompanied
by systematic procedures and detailed documentation. The application of such procedures for
this study, resulted in finn identification of primary and secondary inclusions.
It can be suggested that the composition of the fluid phase for Type IT inclusions is either that
of meteroic water or that of a fluid containing dissolved constituents in the fluid phase. With
respect to the latter, the presence of NaHC03 and Na2C~ as dissolved constituents in the
fluid phase may cause temperatures of final melt temperatures to be close to those which
could be obtained for meteroic waters (Borisenko, 1977). Since the presence of meteroic
water in a submarine seawater environment at the time of the barite fonnation is unlikely, the
compositions of Type IT inclusions remain unknown, and the presence of dissolved
constituents in the fluid phase is concluded.
F
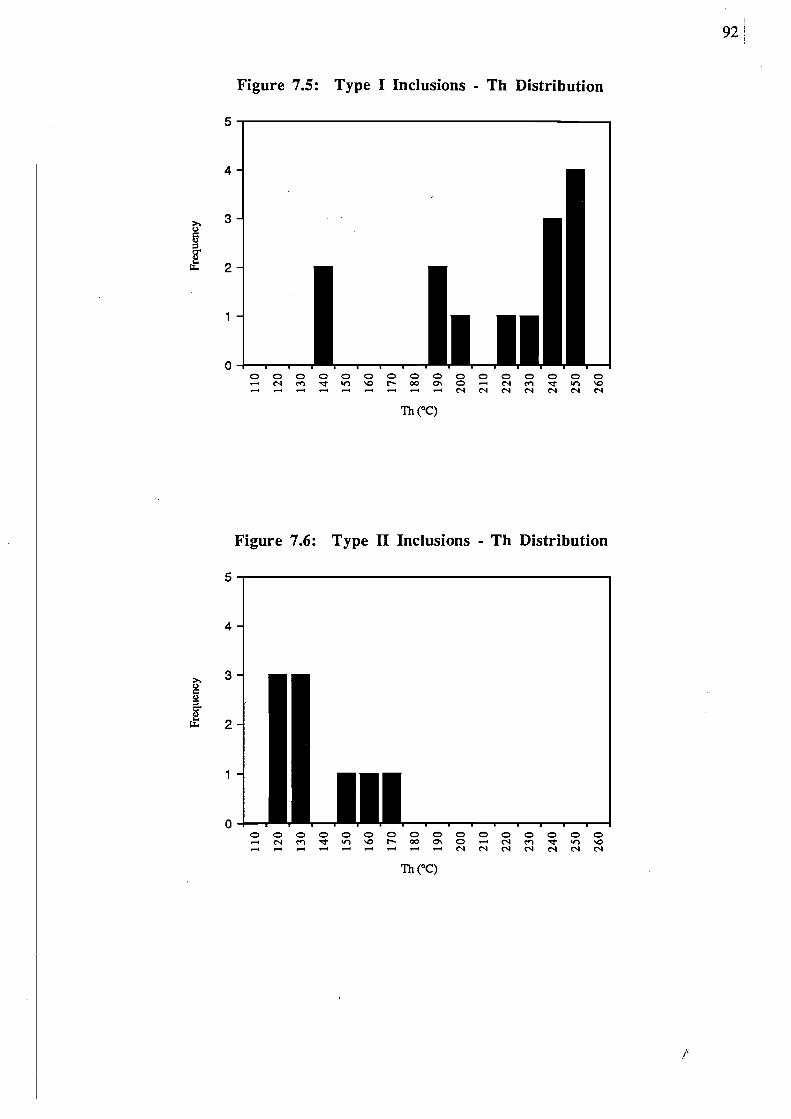
Freq
uenc
y Fr
eque
ncy
01
0 I\
) (,
) 01
~
110
120
.... (JQ
C ., ~
110
120
~ .... (J
Q
C ., ~ 13
0 -..
.l ~
13
0 -..
.l U.
140
140
~
150
'<
"0
150
~
'<
"0
160
~
160
~
~
,-...
0 n ......
170
180
190
200
:::l
Iooooi
=
!l
c tIl .... 0 =
tIl
~
,-...
0 n ......
170
180
190
200
Iooooi
Iooooi
=
!l
c tIl .... 0 =
tIl
210
210
~
~
220
=22
0 =
230
240
250
260
t::' .... tI
l .... ., .... 0"
C .... .... 0 =
230
240
250
260
t::' .... tI
l .... ., .... 0"
C .... ....
0 =

93
The presence of low salinity and temperature fluid inclusions in barite has previously been
observed at Mt. Charter by Rand (1988). The author recognised a bimodal distribution of
fluid types, the first with salinities of 0 wt % NaCI equivalent (corresponding to Type IT
fluid inclusions) and the second with 2.6 wt % NaCI equivalent (corresponding to Type I).
Rand (1988) concluded that the former type of fluid inclusions were primary in nature and,
either represented a fluid distinct from seawater or that of a fluid modified after entrapment
In view of these issues, the Type IT fluid inclusions which show; low temperatures of
formation, decrepitation, observed changes in liquid volume ratios and non reproducible
results, do not represent true fluids of formation
Type I inclusions formed from fluids with an average temperature of between 230 to 250°C
and salinity of 2 wt % NaCl equivalent. Variations in salinity and temperature for Type I
inclusions may result from variations in fluid compositions in space and time. The
systematics of these compositional variations were not investigated. With respect to depth
and pressure, conditions under which the Hellyer deposit formed are not known accurately
(Gemmell, 1989), and as a result, observed homogenisation temperatures have not been
corrected for pressure. Consequently Th values represent minimum temperatures of
formation.
7.5 Conclusion
In conclusion, data obtained from primary fluid inclusions is consistent with previous work
of Rand (1988). The temperature and salinity values obtained from barite at the Hellyer
deposit are comparable to the temperatures and salinities of formation for barite horizons
associated with other VHMS deposits (Large, 1977; Eldridge et al., 1983; Solomon et al.,
1988) and a minimum temperature of formation of 230 to 250°C for the barite cap is
suggested.
I~'
"

94
Chapter Eight Formation of the Baritic and Siliceous Caps: Conclusions
8.1 Kuroko Model
The formation the the Hellyer deposit has been likened to that of the Kuroko deposits, Japan
(McArthur, 1989; 1990). The following summary of the formation of the Kuroko deposits
is derived from Eldridge et aL (1983), Ohmoto et al (1983), Kalogeropoulos and Scott
(1983) and Kusakabe and Chiba (1983).
Eldridge et al. (1983) proposed a model of precipitating ore minerals on or above the sea
floor from plumes of hydrothermal ore minerals. The author proposed that the observed
stratification of the Kuroko deposits was the result of the superposition of ore minerals.
Textural studies by Eldridge et al. (1983) suggested sulphides, sulphate and quartz to have
formed in open ocean water, which were recrystallised during insulation in the middle and
lower parts of the ore accumulation (Figure 8.1).
Kalogeropoulos and Scott (1983) proposed two stages oftetsusekiei formation (Figure 8.2):
Stage I formation, corresponding to an intensifying hydrothermal system, where tetsusekiei
formation is distal to the locus of hydrothermal activity, and Stage IT formation during the
waning of hydrothermal activity. Ohmoto et al. (1983) however, proposed a slightly
different modeL The authors postulated that if a major localised heat source was a necessary
part of the genesis of the Kuroko deposits, then the type of deposit which formed was
dependent on their thermal history of the hydrothermal systems and the distance from a heat
source (Figure 8.3). Form~tion of the tetsusekiei could therefore have occurred either early
or late, or both early and late in the thermal history of the hydrothermal system.
Kusakabe and Chiba (1983) report sulphates to have precipitated from the mixing of cold
seawater with upwelling hydrothermal fluids. Eldridge et al. (1983) proposed that an
orebody becomes mature when the pyrite ore (massive and siliceous) begins forming. The
orebody, which has acquired all of its features, continues to grow in size thereafter (refer
Figure 8.1). As a result the barite horizons of the Kuroko deposits, which result from late
stage hydrothermal fluids, develop with the mound (Eldridge et al., 1983).
!'

I /.J
II
co
~,_.,-
:.. i"':. ....;.'0 ':)._;~I_I'
III
IV
Figure 8.1: Diagrams showing the steps in the development of an ideal orebody presented inthe Kuroko model of formation. I = tetsusekiei or chert-hematite layer, 2 = barite ore; 3 =massive black ore (sphalerite + pyrite + galena + barite) where the fine dotted line separates theoverlying fme-grained ore from the coarser grained ore below; 4 = massive semiblack ore(sphalerite + pyrite + chalcopyrite); 5 = massive yellow ore (chalcopyrite + pyrite); 6 = massivepyrite ore (pyrite + quartz); 7 =siliceous black ore (sphalerite + pyrite + galena + quartz); 8 =siliceous yellow ore (chalcopyrite + pyrite + chalcopyrite); 9 = siliceous pyrite ore (pyrite +quartz); 10 = transported, fragmental massive ore (mostly black); 11 = late-stage sulfide veinswhich can be either black or yellow ore. In this sequence the fragmental massive ore is mostlyblack ore which, by its movement, is effectively removed from further alterations by thehydrothennal fluids (from Eldridge et al., 1983). _e·- !'

96 1""1
r:-::-:~----....;S~T~AGrE~I--------, , u' I Jt t...-J k~1NW! .Q e~o, ~~
QOI! ~1,
• UTSUSEKIEI
mg~ ~~~~E~~~~RE STAGE Il o I k~NW i SE~IMENTAYON i SE II=-~-.~--------I
~~e.,. .. 9 It, ~
fo
'~ n OIE \ 1" • TETSUSEICIEI
LOW fLUID flOW
Figure 8.2: Stages of development of tetsusekiei with fluctuations in the thennal and fluid flow regime of the hydrothennal system. Sections (left) are schematic. Plans (right) are actual distributions of tetsusekiei and ore at Fukazawa, Japan. During stage In (not shown) tetsusekiei was modified by high-temperature fluids and assumed its [mal fonn (from Kalogeropoulos and Scott, 1983).
(a) 400
300
T(·C) 200
TIME ----+
(b) Y-Iype C-Iype B-type H-type
~.. ~~. ~H lI..___ Seofloor...,..n. Qc. ....~ .... ~t.1· ....~.~~:.~·I • .,....,. ~;· ......I
( -1.5 Km )" (Toward heat source) (Away from heat saurte)
(c)
Figure 8.3: A model relating the distribution of ore types to the thennal history and to the relative distance from heat source (a and b). Y =yellow ore; C = composite ore; B = black ore; H = hematite ore; A = anhydrite ore. The central pan of fluid discharge (i.e. ore zone == sericite-chlorite alteration zone) in (b) and (c) is typically -1.5 x -3 km in area (-1.5km in the direction perpendicular to the heat source and -3km parallel to the heat source) and is lilsely to have been the marginal zone of a resurgent caldera (after Ohmoto and Takahashi, 19831n Ohmotot et al., 1983). I

97
8.2 Recent Hydrothermal Activity
The presence of actively venting hydrothennal solutions to the sea floor provides additional
evidence of the processes associated with active sulphide deposition. Mineral zoning in
hydrothermal chimneys is controlled by the p!ecipitation and replacement of minerals, which
occur in response to changes in temperature and composition of the hydrothermal fluid
(Woodruff and Shanks, 1985). Induced changes include the degree of seawater interaction,
activity of sulphur species, oxygen fugacity and pH (Fouquet et al., 1990). Zoning within
chimneys reflect the growth history of the chimney (Woodruff and Shanks, 1985).
Chimney growth, in association with mound growth, is illustrated in Figure 8.4.
Examination of modem hydrothermal chimneys reveal fluids which contain significant
quantities of amorphous silica, pyrite and barite (Speiss et al., 1980; Haymon, 1983;
Fouquet et al, 1990). Black and white smokers are classified according to particulates
which are suspended in venting solutions. High temperature black smoker vents are
characterised by vigorous deposition of predominantly sulphide mineral phases (Haymon,
1983). Studies on the East Pacific Rise, 21°N, show black smokers to be associated with
minor anhydrite, barite and silica (Janecky and Seyfried, 1984). By comparison, white
smokers are generally of lower temperatures and composed predominantly of anhydrite,
pyrite, barite and amorphous silica (Haymon, 1983).
Lydon (1988) showed that as a sulphide mound matured, its permeability decreased. In
such regions, the author suggests that high temperature replacement within the mound is
accompanied by low temperature, diffuse fluid flow, resulting in white smoker chimneys.
In many modem hydrothermal systems, the deposition of barite and silica is interpreted to be
contemporaneous or late stage where the site of precipitation is controlled by seawater
mixing (Fouquet et al, 1991; Herzig et al. 1988; Alt et al., 1988).
8.3 The Deposition of the Barite Cap
Due to the low solubility of barite, barite precipitation occurs on mixing of barium enriched
hydrothermal fluids with oxidised ambient seawater (Blount, 1977; Ohmoto et al., 1983).
Shanks and Seyfried (1987) observed barite to be associated with regions of slow discharge
of fluids into the mound on the seafloor. The authors suggest that a low flux rate of venting
fluids allows diffuse mixing with seawater and consequently the deposition of barite.
Shimazaki and Horlkoshi (1990) concurringly conclude that the crystallisation of minerals
from the cooling of upwelling solutions occurs rapidly, but depends critically on the rate of
/'
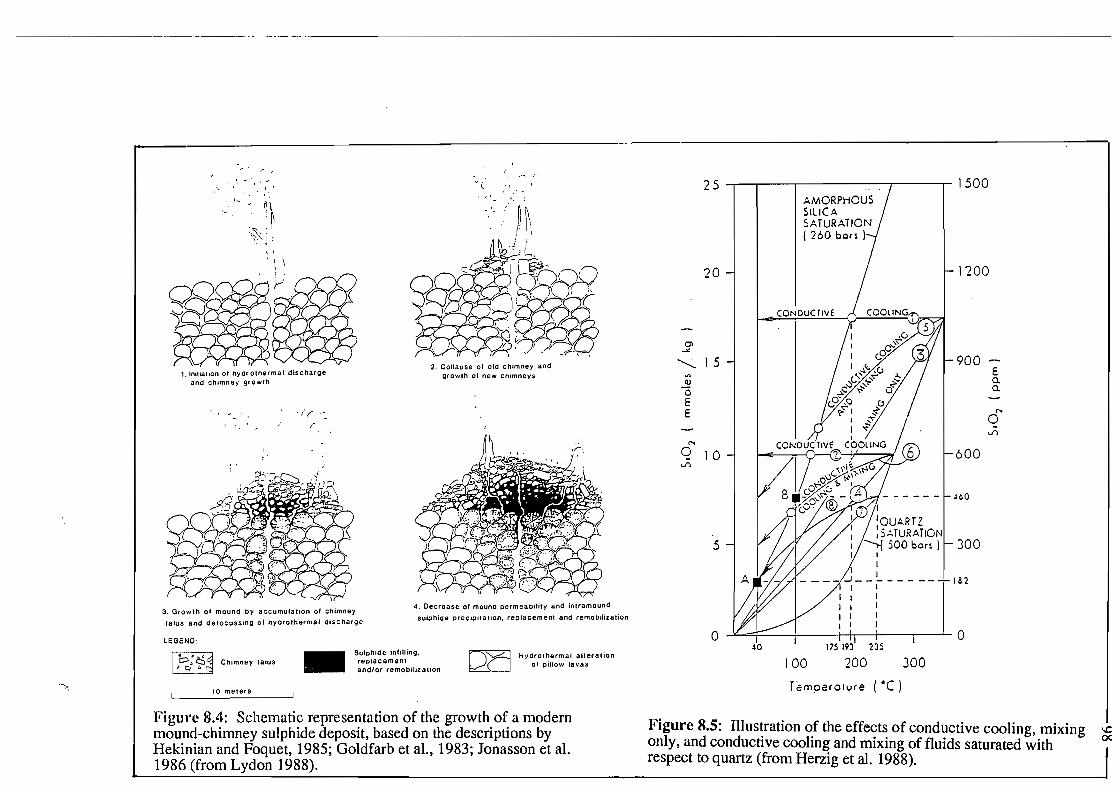
V l
1- , }
, ", '
, "',..-: n <~ I I'': ,'J " .
'.-; J i~'
Qv. ~ -/It' j' ,,A ,.-;d-,
2. Collapse 01 old chimney and 1. Initiation of hyarolhermal discharge growth of new chimneys
and chimney growth
,( / ': , ,"
4. Decrease of mouna permeability and intra mound 3. Growth of mound by accumulation of chimney
sulphide preClpltallon. replacement and remobilization lalus and defocusslOg 01 hyarothermal discharge
LEGEND: _ Sulphide infilling,.,
~ Hydrothermal alleration
01 pillow lavas. Dd es ~ Chimney talus repla Cemenl ~ 0 .:. . and/or remobilizalion
10 meters
Figure 8.4: Schemati~ represe~tation of the growth. o~ a modern mound-chimney sulphIde deposIt, based on the descnptIons by Hekinian and Foquet, 1985; Goldfarb et aI., 1983; Jonasson et aI. 1986 (from Lydon 1988).
25 1500
20 1200
CONDUCTiVE
01 ~
900"-- 15 E
'" a.<lJ
0 a. E E "" 0
.;; "" 0 10 600.;;
~60
5 300
o .JL.=i::====---i--t-h---+--r-----'-O 175 193 235
100 200 300
Temperolure (·C)
Figure 8.5: Illustration of the effects of conductive cooling, mixing only, and conductive cooling and mixing of fluids saturated with respect to quartz (from Herzig et al. 1988).

99
the out flow. Fouquet et al. (1981), in studies within the Lau back-arc basin, found barite to
be both concentrated on the outer portions of the chimneys and the youngest veins of the
stockwork. Actively venting chimneys of the East Pacific Rise (11" and 13" N), show
continuous dissolution of sulphides and sulphates to occur on the inner walls of active
structures (Bluth and Ohmoto, 1988). In non-active chimneys of the Franklin Seamount,
Woodlark Basin, fluid conduits were lined with barite crystals (Binns et al., in prep). Barite
precipitation can therefore be associated with periods of low flux or discharge, such as
during the incipient growth stages, intermittent periods of non-active sulphide deposition, or
the waning of the hydrothennal system (Ohmoto et al., 1983).
The Q34S values of barite from the Hellyer caps vary between 26 per mil to 52 per mil,
whilst coeval pyrites show a wide Q34S ratio variation between 6 per mil to 26 per mil. The
source of sulphur for barite precipitation is suggested to be a hydrothennal fluid which
contained a significant proportion of partially reduced seawater sulphur and rock sulphur.
The precipitation of barite from a partially reduced fluid is suggested by Solomon et al.
(1988) to be the result of a lack of reductants in the system. As hydrothennal fluids
encroaching the sea floor have precipitated most of their sulphides, Solomon et al. (1988)
suggests that the reductants have been previously spent. Barite precipitation under oxidising
conditions during periods of low solution flux, would cause an increase in the water to rock
ratio, due to the open framework and high porosity in the upper regions of the mound. As a
result Green et al. (1981) suggested conditions at the Rosebery deposit favoured the
reduction of sea water sulphate to H2S. Variations in both coeval barite and pyrite isotopic
ratios may therefore correspond to variation in concentration of reduced sulphate in the
solutions precipitating barite. Such variation may relate to fluctuations between the
proportions of seawater sulphate and magmatic sulphur in the hydrothennal solutions. A
varying contribution of sulphur from at least two sources may be integrated with other
factors such as modulating fluid, temperature changes, and seawater supply to understand
the controls on barite deposition.
The deposition of barite is estimated to occur between temperatures of 230°C and 250°C in
other massive sulphide deposits(Green et al. 1981; Fouqet et al., 1991). Fluid inclusion
studies of barite from the Hellyer barite cap are not corrected for pressure effects and yield an
average of 185°C, with a mode between 230 to 250°C.
/

100
8.4 The Deposition of GSP
Edmond et al. (1979) suggested that iron-quartz rocks forming in massive sulphide
environments, are contemporaneous or late stage low temperature products of hydrothermal
fluids. The formation of most quartz associated with hydrothermal activity, is the result of
reheating and recrystallisation of opal rich material, although some quartz may precipitate
directly from the hydrothermal solution (Herzig, 1988). Kinetic effects are important in
controlling the formation SiOz precipitates (Hannington and Scon, 1988). Rimstidt and
Barnes (1979) explain the predominance of amorphous silica to be the result of the
nucleation kinetics of quartz. Alt et al. (1987) and Alt (1988) demonstrated that amorphous
silica can be reprecipitated at low temperature (15°C to 100°C) from solutions which are
evolved from relatively high temperature (175°C to 350°C) hydrothermal fluids saturated
with respect to quartz and seawater. At the East Pacific Rise, 21oN, high temperature
solutions (greater than 300°C) do not precipitate silica, due to the low solubility of silica
associated with decreasing temperatures (Rimstidt and Barnes, 1988). The formation of
amorphous silica is best achieved by mixing the hydrothermal solution with seawater and
conductively cooling the mixed seawater because the cooling of solutions by seawater
mixing alone will not reach amorphous silica saturation (Herzig et al., 1988). Janecky and
Seyfried (1984) therefore invoke additional conductive cooling, to cause the precipitation of
silica at temperatures between 15°C to 100°C (Figure 8.5). While conductive cooling may
cause silica precipitation, the necessity of a seawater sulphate source requires that mixing
also occur to precipitate barite (Hannington and Scott, 1988).
Hydrothermal cherts often contain of Fe oxides (for example tetsusekiei as described by
Kalogeropoulous and Scon, 1983 and ironstones at Thalanga described by Duhig, 1991).
The oxidation of Fez+ species to Fe3+, required to form hematite, is unlikely in venting
hydrothermal fluids due to their low residence time on mixing with seawater (Kester, 1975;
Stumm and Morgan, 1981). Duhig (1991) concluded that the presence of iron oxidising
bacteria were significant in the formation ofFe oxides at Thalanga. SEM investigations
showed no evidence at Hellyer to suggest the presence of baterial filaments and as a result,
pyrite is the main Fe repository.
Arsenopyrite is formed in equilibrium with silica in the GSP. Arsenopyrite deposition
cannot occur in equilibrium with barite precipitation (Huston et al., 1991), as exemplified by
thermodynamic modelling of the Rosebery deposit by Green et al. (1981). The model
(Figure 8.6) shows that in order to precipitate arsenopyrite, a change in the total S041HzS
!�

I . lOl_
':~;~;;~~~~;:~~~:~~:i~~~~;;::~~~~~~jJ
,.. ,.. ", I , , "1" ,," ",/
£ :::=:::.-=~;~s~..::.~ ;Z::.::.=::.·.=:::.:.~ ?;~~ >:':'.=:~=.:::.=:::;;.z-::: .., r4 // ",/ ",'"
'; / .,." ",'"o ,.. " ",." I"l / / ,
-5 / "," ,,'� ~ / " "� o '/ " " -'" ~ , ,,', ;~~jl"IIII·'~' ~I
,../ ,," //" I
/ ,.0"" 0 ,,"" - 1 // ,," ~~ I
J! .<,,/"
r/ft ""
/( j! ! r
180 200 'cO 280...... J20 J60
TemOeraIUr.e. °c
Figure 8.6: Thennodynamic modelling by Green et al. (1981). Log l:S04iLH2S versus T diagram displaying the possible fields of fonnation of the massive sulfide and barite orebodies
at Rosebery, Western Tasmania. Key: dotted line = 834S1125 values assuming 834S:ES = 30 %0; dashed line = mole percent FeS in sphalerite. Solution contitions: M:ES = 0.002; pH = 1 unit acid; mC1- = 1.0; mNa+ = 0.9; mK+ = 0.1; mCa+2 = mMg+2 = mBa+2 = 0.001. Data from Helgeson (1969) and Ripley and Ohmotot (1977) and Table 9, using a program based on Ripley and Ohmoto (1980). Mole percent FeS contours from Craig and Scott (1974) and Czamanske (1974) and arsenopyrite field from Kretschmar and Scott (1976),
0 ,I ~.',T.I,,"',Inlllallemperature/densl1y/sallnlly• ", ,.
3m 01 ore solullons " t , '.� tit '.�
Type ID Ofe solullon , r J '.�
Type n ore solullon ,\r I' : Type III
, ,1
" I100 ...... Type lore solullon�
0� f
,1;.~0 " , , f , , 'f.. , r• ('. r.:/.:
.,..l\\CD , 3m , ..... /:"' .. : ...:2 , , ::t . ':~.. 1.....'" I
f
,' "IIfV
I I , , I , ~;'2-">317j,E 0.
, I , Ih ~
•, ,
fCD l-
fI I , Type "d200 I
I . II
I, 2.5 m'
, I I , , • ,
t
I
I II
3.5 m , , , ,, Oenslly 01 ,
, 79 .. :/1% , seaweter Type I lTt(7 ,• at 10°C
I2m 5m YJ ftydrolhermal & HydrOlhermal
I I{ vent plume
1
1.050.85 0.90 0.95 1.00 lA.. Sea IIoor ~ Brine
Density g/cm 3 'Il}.. ~ pool
.:,:.:. Sulphide nuelesllon zone
a) b)
Figure 8.7: (a) Density temperature relationships of hot NaCl solutions mixed with seawater at 10°C (after Sato, 1972) illustrating the definition of Sate's (1972) three types of hydrothennal solutions. (b) Schematic representation of the buoyancy behaviour of anc;l sulphide precipitation from Sato's (1972) three types of hydrothennal solutions.

102
ratio is required. Arsenopyrite therefore deposits at a lower oxygen fugacity to that of barite,
but similar temperature.
Formation of the GSP must therefore have occurred at lower oxygen fugacities than barite,
due to fluctuations in the proportions of H2S and S04 in the hydrothermal fluid Eldridge et
al. (1983) proposes that hematite formation in the tetsusekiei horizons was caused by the
fluctuations in the amount of reduced sulphur in th~ hydrothermal fluid discharge. The
authors concluded that the amount of reduced sulphur discharge was not sufficient to
dominate the local environment, and consequently oxygen in the seawater forced hematite
formation after the exhaustion of hydrothermal H2S, An increased expulsion from venting
solutions would therefore cause a localised dominance ofH2S, which reduces the S04I'H2S
ratio and initiates pyrite and arsenopyrite formation.
8.5 Controls on Depositional Sites
Sato (1972) postulated that the discharge of fluids behaves according to the temperature,
density and degree of mixing with seawater (Figure 8.7). The type of solutions characterise
the morphology of the deposit. Type I solutions, a highly saline solution with a density
greater than seawater, give rise to a tabular sheet like morphology (Lydon, 1988). Type IT
solutions, which although are less than seawater at some stage in the mixing pass through a
maximum greater than seawater, give rise to a mound-type morphology. Type ITI solutions,
less dense than seawater, remain buoyant and give rise to extensive fallout (Lydon, 1988).
The cap zones at Hellyer, localised within the margins of the massive sulphides, form a
semi-continuous irregular layer, which closely follows the trend of the underlying stringer
system. The barite cap, which is more extensive than the GSP, shows a close spatial affinity
to the central feeder. Zones of bedded barite at the peripheries of the sulphide mound form
narrow lenticular layers (for example HL417 on Section 10630 N), with sharp contacts to
underlying massive sulphides. Based on the observations of Sato (1972), barite may have
formed by particulates settling out of the expulsed hydrothermal fluids. Such a model would
account for the observed bedding in some of periphery barite, as well as sharp contacts with
the massive sulphides, which indicates they were not directly sourced. Alternatively,
deposition of such barite may have been the result of satellite hydrothermal vents. The
proximity of the GSP to the main feeder, indicates that proximal depositional mechanisms
were involved. The observed salinity of hot solutions venting from black and white smokers
j"
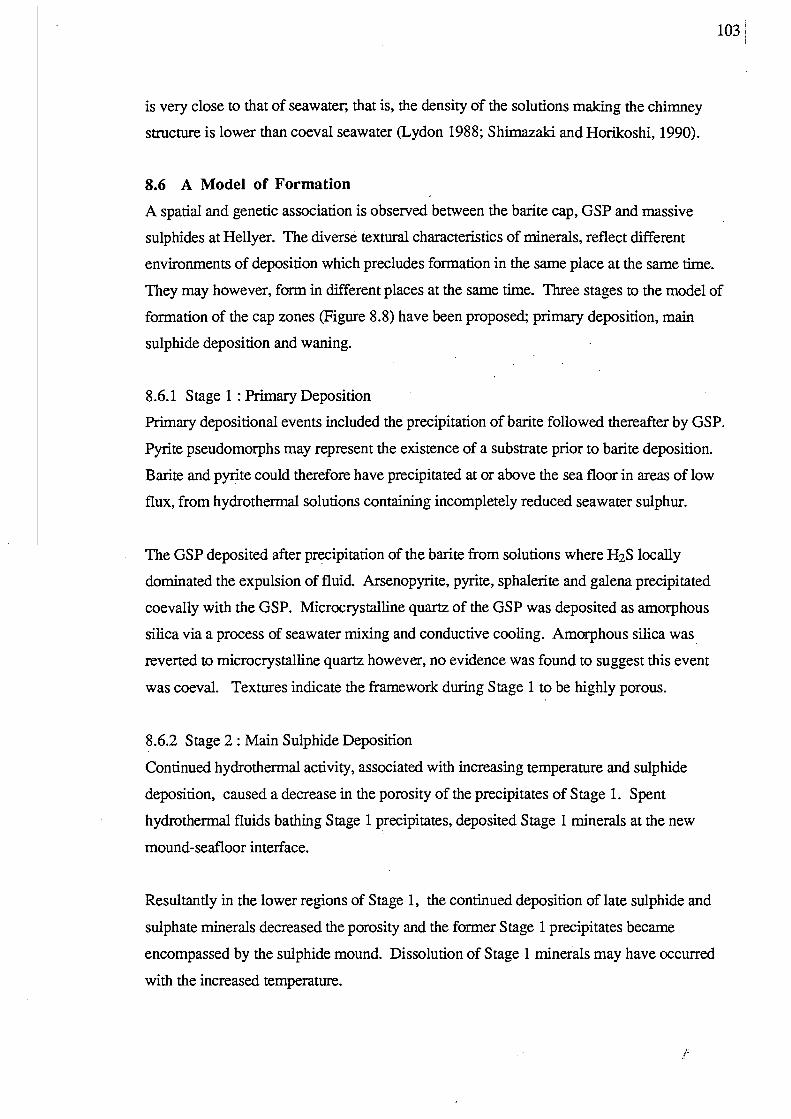
103
is very close to that of seawater, that is, the density of the solutions making the chimney
structure is lower than coeval seawater (Lydon 1988; Shimazaki and Horikoshi, 1990).
8.6 A Model of Formation
A spatial and genetic association is observed between the barite cap, asp and massive
sulphides at Hellyer. The diverse textural characteristics of minerals, reflect different
environments of deposition which precludes formation in the same place at the same time.
They may however, form in different places at the same time. Three stages to the model of
formation of the cap zones (Figure 8.8) have been proposed; primary deposition, main
sulphide deposition and waning.
8.6.1 Stage 1 : Primary Deposition�
Primary depositional events included the precipitation ofbarite followed thereafter by asp.� Pyrite pseudomorphs may represent the existence of a substrate prior to barite deposition.�
Barite and pyrite could therefore have precipitated at or above the sea floor in areas of low�
flux, from hydrothermal solutions containing incompletely reduced seawater sulphur.�
The asp deposited after precipitation of the barite from solutions where H2S locally
dominated the expulsion of fluid. Arsenopyrite, pyrite, sphalerite and galena precipitated
coevally with the asp. Microcrystalline quartz of the asp was deposited as amorphous
silica via a process of seawater mixing and conductive cooling. Amorphous silica was_
reverted to microcrystalline quartz however, no evidence was found to suggest this event
was coeval. Textures indicate the framework during Stage 1 to be highly porous.
8.6.2 Stage 2 : Main Sulphide Deposition
Continued hydrothermal activity, associated with increasing temperature and sulphide
deposition, caused a decrease in the porosity of the precipitates of Stage 1. Spent
hydrothermal fluids bathing Stage 1 precipitates, deposited Stage 1 minerals at the new
mound-seafloor interface.
Resultantly in the lower regions of Stage 1, the continued deposition of late sulphide and
sulphate minerals decreased the porosity and the former Stage 1 precipitates became
encompassed by the sulphide mound. Dissolution of Stage 1 minerals may have occurred
with the increased temperature.
I'�

104�
SE:Aw~1'E.R
SEA\'JP\,.ER. ./C:\\IA\neJ be.coln!S choke cl
C.hIMM.'J • ~ou'L- ~ deCY~Q11,,(i cloMII\~ne.t. at "1.S br.co1l'lf.s QGhu~ ~lb.S "I 1'?'7r '.', ~ hat\\(. ch.j1Q!.\'hoN
C!fI: upb!lloYl or lioft\'l\fI <:' G' ('J.~ ~~r;;.D. _____ ptnpkro.\ bll;,h.
Fro&Me1\111\ "~ ~r ~re.l\I~~ vtnt
(iC;p cldc:l\,tion MASSn S(JLP\\'o~
Grow~ dr ~ (M,intiUPviCWtJG it~DR.01\1e-R~L
COrl!SPoNiIt'\(% ~o «itetfi.UH~
POf'OSlt'f
~ . di!l~6\~0II at kQn\~ .
HQOf.E ~.~: Moo\!J\ o~ ~octt\~+,~ a~ \-\u ~Qt\\"t ~ SI\\C.~OU5 Cllh
~ ~af\\t.
• C%':.p
l

8.6.3 Stage 3: Waning
The cooling of the system, due to waning, resulted in the sealing of hydrothermal conduits
where barite was the predominant precipitate. The sealing of hydrothermal passages formed
barite veinlets and crustiform veins within the massive sulphide. The extrusion overlying
lavas during waning, resulted in the formation of a hangingwall barium alteration zone.
8.7 Discussion
The model proposed for the formation of the cap zones at Hellyer, is consistent with that
model set forward by Eldridge et al (1983). Textural similarities exist between cap zones of
the Hoydal deposit (Norwegian Caledonies), Kuroko deposits of Japan, as well recent
actively forming sulphide deposits of seamounts of the Eastern Pacific (Hekinian and
Fouquet, 1985).
Ohmoto et al. (1983) suggested that the amounts and proportions of minerals in the Kuroko
ores depend on the oxygen content of cold water, rates of reactions among various oxidised
and reduced aqueous species, rates of chemical reactions, rates of fluid mixing as well as the
concentration of reduced sulphur, oxidised sulphur and metals in the ore forming fluids.
Stage 1 and Stage 2 of the cap precipitation may therefore occur at any time during mound
growth. These two stages most likely represent fluctuations caused by the growth of the
mound. For example the conditions of formation required to precipitate the asp might
occur simultaneously to those required to precipitate barite, at different vent sites. Sealing of
chimneys is often observed in modern hydrothermal fields, where vents become choked.
The choking of fluid flux, may cause precipitation of barite on the outer margins of
chimneys and the precipitation of asp in the inner parts. The observed interdigitating
relationship between the barite and the asp could therefore be explained by the fluctuation
between the Stage 1 and Stage 2 systems proposed, which is controlled by the local
environment, which is in turn controlled by the underlying feeder system.
The above model proposes that barite and silica precipitation were an integral part of the ore
forming processes, and furthermore, that they were present during active sulphide
precipitation. The conceptual model of mound growth as proposed by Eldridge et al. (1983)
incorporates a zone refining process, which is applicable to the Hellyer deposit including the
baritic and siliceous caps. Lower portions of the caps become increasingly insulated from
oxygenated seawater and consequently, as evidenced from zonal studies, experienced
increased deposition of sulphide phases (Stage 2) replacing or exsolving barite and asp. In
l'

106
such cases many of the sulphide phases which originated from early open space precipitation
were overgrown and preserved in the H2S dominated environment.
8.8 Summary and Conclusions
The deposition of the Hellyer baritic and siliceous caps were contemporaneous with ore
formation and growth of the sulphide mound. The caps precipitated from spent upwelling
hydrothermal solutions due to mixing with coeval seawater. The preferential deposition of
the barite or silica regime is thought to be a combination of the chemical conditions which
prevailed local to the site of deposition and the physical conditions at the site of deposition.
Barite and asp precipitation occurred from hydrothermal fluids which contained significant
proportions of incompletely reduced sulphur. Fluctuating or pulsating conditions of
formation are indicated in the immediate ore forming environment. The sites of cap
deposition was controlled by the underlying centres of hydrothermal activity.
;:�

107
REFERENCES
Adachi, M., Yamamoto, K. and Sugisaki, R., 1986. Hydrothermal chert and� associated siliceous rocks from the northern Pacific: Their geological significance as� indication of ocean ridge activity. Sed. Geol;, 47: 125-148.�
A.G.l Glossary, 1957. Glossary of geological and related sciences, Washington, p. 102.
AIt, J.C., 1988. The chemistry and sulfur isotope composition of massive sulphide and associated deposits on Green Seamount, eastern Pacific. Econ. Geol., 83: 1026-1033.
AIt, J.C., Lonsdale, P., Haymon, R. and Muehlenbachs, K., 1987. Hydrothermal sulphide and oxide deposits on seamounts near 21°N, East Pacific Rise. Geological Soc. Amer., 98:157-168
13 Barnes, H.L., 1979. Solubilities of ore minerals, In: Barnes HL., (Ed.) Geochemistry ofhydrothermal ore deposits, 2nd Edition, WHey, New York, p. 404-460.
Binns, R.A., Scott, S.D., Bogdanov, Y.A., Lisitsin, A.P., Gordeev, V.V., Gurvich, E.G., Finlayson, E.J., Boyd, T., Dotter, L.E., WheIIer, G.E. and Muravyev, K.G., in prep. Hydrothermal oxide and gold-rich sulphate deposits of Franklin Seamount, western Woodlark Basin, Papua New Guinea.
Blount, C.W., 1974. Synthesis of barite, celestite, anglesite, witherite and strontianite in aqueous solutions. Amer. Min., 59:1209-1212.
Blount, C.W., 1977. Barite solubilities and thermodynamic quantities up to 300°C and 1400 bars. Amer. Miner., 62:942-957.
Bluth, G.J. and Ohmoto, H., 1988. Sulphide-sulphate chimneys on the East Pacific Rise, 110 and 130 N latitudes. Part II:sulphur isotopes: Can. Mineral., v. 26, 505-515.
Borisenko, A.S., 1977. Study of the salt compositions of solutions of gas-liquid inclusions in minerals by the cryometric method. Soviet Geol.and Geophys., 18(8):11
17.
Burke, W.H., Denison, R.E., Hetherington, E.A., Koepnick, R.B., Nelson, H.F. and OUo, J.B., 1982. Variation of seawater 87Sr/86Sr throughout Phanerozoic time. Geology, 10: 516-519.
I'�

108
Q>Claypool, G.E., Holser, W.T., Kaplan, I.R., Sakai, H. and Zak, I., 1980.� The age curves of sulphur and oxygen isotopes in marine sulfate and their mutual� interpretation: Chem. Geology, 28: 199-260.�
Q Corbett, K.C., 1989. Stratigraphy, Palaeogeography and Geochemistry of the Mt Read� Volcanics. In Burrett, C.F. and Martin, EL. (Eds) Geology and mineral resources of� Tasmania. Spec. Pub. Geo!. Soc. Aus., 15, p. 86-106.�
• Corbett, K.C. and Solomon, M., 1989. Cambrian Mt. Read Volcanic and associated mineral deposits. In Burrett, C.F. and Martin, EL. (Eds) Geology and mineral resources of Tasmania. Spec. Pub. Geo!. Soc. Aus., 15, p. 84-181.
Craig, J.R. and Vaughan, D.J., 1990. Compositional and textural variations of the major iron base metal sulphide minerals. In Gray, P.M.J., Bowyer, G.J., Castle, JP., Vaughn, D.J. and Warner, N A., (Eds)., Sulphide deposits - Their origin and processing. AusIMM., Parkville, Victoria, p.I-16.
Deer, W.A., Howie, R.A. and Zussman, J., 1962. Rock forming minerals. Vol. 5 Non Silicates. Longman, p. 186-225.
/j> Drown, C.G. and Downs, R.C., 1990. Deformational style and strain partitioning at� the Hellyer volcanogenic massive sulphide deposit. Geol. Soc. Australia, Spec. Pub.� No. 25, p. 176-177.�
Duhig, N.C., 1991. The geology of East Waddy's Mill and the geochemical and textural aspects of ironstones near Thalanga, north Queensland. Unpub. Honours thesis, University ofTasmania, p. 1-96.
Eadie, E.T., Silic, J. and Jack, D.J., 1985. The application of geophysics to the discovery of the Hellyer ore deposit, Tasmania. Expl. Geophys., 16:207-209.
Edmond, J.M., Measures, C., Mangum, B., Grant, B., Sclater, F.R., Collier, R. and Huds.on, A., 1979. On the formation of metal rich deposits at ridge crests. Earth Planet. Sci. Lett., 46:19-30.
q) Eldridge, C.S., Barton, P.B. and Ohmoto, H., 1983. Mineral textures and their bearing on formation of the Kuroko orebodies. In Ohmoto, H. and Skinner, B.J. (Eds.), The Kuroko and Related Volcanogenic Massive Sulphide Deposits. Econ. Geo!. Monograph 5, p. 241-281.
Fernandez-Diaz, L., Putnis, A. and Cumerbatch, T.J., 1990. Barite nucleation kinetics and the effects of additives. Eur. J. Mineral., 2: 495-501.
;;
"

109
Fouquet, Y., Stackelberg, V.V., Charlou, J.L., Donval, J.P., Foucher, J.P., Erzinger, J., Herzig, P., Muhe, R., Wiedicke, M., Soakai, S. and Whitechurch, H., 1991. Hydrothermal activity in the Lau back-arc basin: Sulphides and water chemistry. Geol., 19: 303-306.
t>FrankIin, J.M., Lydon, J.W. and Sangster, D.F., 1981. Volcanic-associated massive sulphide deposits. Econ. Geol., 75th Anniversary Vol., 485-627.
GemmeII, J.B., 1988. Hellyer stringer zone project: Progress report. No. 1: Unpub.� company report for Aberfoyle Resources Ltd., p. 42.�
GemmeII, J.B., 1989. Hellyer stringer zone project: Progress report. No. 2: Unpub.� company reportfor Aberfoyle Resources Ltd., p.55.�
GemmeII, J.B., 1990. Hellyer gold study, preliminary results. Unpub. company report for Aberfoyle Resources Ltd., p. 14.
Cl GemmeII, J.B. and Large, R.R., in press. Stringer system and alteration zones underlying the Hellyer volcanogenic massive sulphide deposit, Tasmania, Australia.
'lIl>GemmeII, J.B., Large, R.R., McArthur, G.J., Drown, C.G. and Downs, R.C., 1990. Formation of the alteration pipe and stringer zone beneath the Hellyer massive sulphide depo~it, Tasmania. [abstr.]: Geol. Soc. Australia, Spec. Pub. No. 25, p.8-9.
Graham, V.M., Bluth, G.J. and Ohmoto, H., 1988. Sulphide-sulphate chimneys on the East Pacific Rise, II°N and l3°N latitudes. Part I: mineralogy and paragenesis. Can. Miner., 26: 487-504.
Green, G.R., Solomon, M. and Walshe, J.L., 1981. The formation of the volcanichosted massive sulphide deposit at Rosebery, Tasmania. Econ. Geol., 76: 304-338.
Grenne, T. and Vokes, F.M., 1990. Sea-floor sulphides at the H<j>ydal volcanogenic
deposit, central Norwegian Caledonides. Econ. Geol., 85: 344-359.
Hannington, M.D. and Scott, S.D., 1988. Mineralogy and geochemistry of a� hydrothermal silica-sulphide-sulphate spire in the caldera of Axial Seamount, Juan de� Fuca Ridge. Canadian Miner. 26:603-625.�
Haymon, R.M., 1983. Hydrothermal deposition on the East Pacific Rise at 21°N. J.� Geochem. Expl., 19:493-495.�
l
110
Hekinian, R. and Fouquet, Y. 1985. Volcanism and metallogenesis of axial and offaxial structures on the East Pacific Rise near BON. Econ. Geol. 80:221-249.
Herzig, P.M., Becker, K.P., Stoffers, P., Backer, H. and Blum, N., 1988. Hydrothermal silica chimney fields in the Galapagos spreading centre at 860 W. Eanh and Planet. Sci. Lett., 89: 261-272.
Huston, D.L., Botrill, R.S., Cteelman, R.A., Zaw, K., Ramsden, T.R., Rand, S.W., Gemmell, J.B., Jablonski, W., Sie, S. and Large, R.R., in
press Geological and geochemical controls on the mineralogy and grain size of gold
bearing phases, eastern Australian volcanic-hosted massive sulphide deposits.
Huston, D.L., 1988. Aspects of the geology of massive sulphide deposits from the� Balcooma district, northern Queensland and Rosebery, Tasmania: Implications for ore� genesis. PhD Thesis, University ofTasmania, p. 182-320.�
Huston, D.L. and Large, R.R., 1989. A chemical model for the concentration of gold
in volcanogenic massive sulphide deposits. Ore Geol. Rev., 4:171-200.
Hust~n, D.L. and Large, R.R., 1986. Distribution, mineralogy, and geochemistry of
gold and silver in the north end orebody, Rosebery, Tasmania. Econ. Geol., 83: 11811192.
Huston, D.L. and Zaw, K., 1988. Controls on the fineness and grain size of electrum. In Controls on gold and silver grades in volcanogenic sulphide deposits (841P21O). AMIRA Final Report, p. 184.
~Jack, D.J., 1989. Hellyer host rock alteration. Unpub. Masters thesis, University of Tasmania, p. 1-181.
Jack, D.J., 1990. Geochemistry and alteration of the hangingwall basalts to the Hellyer volcanogenic massive sulphide deposit, Tasmania. [abstr.]: Geol. Soc. Australia,
Gondwana; Terranes and resources, Tenth A.G.G., Hobart, Australia, Feb 1990, No. 25, p. 7.
Janecky, D.R. and Seyfried, W.E., Jr., 1984. Formation of massive sulphide�
deposits on oceanic ridge crests: Incremental reaction models for mixing between� hydrothermal solutions and seawater. Geochim. et Cosmochim. Acta, 48:2723-2738.�
Janecky, D.R. and Shanks, W.C., 1988. Computational modelling of chemical and
sulphur isotopic reaction processes in seafloor hydrothermal systems: chimneys, massive
sulphides and subadjacent alteration zones. Can. Miner., 26: 859-869.
/;,

111
Kalogeropoulos, S.I. and Scott, S.D., 1983. Mineralogy and geochemistry of tuffaceous exhalites (Tetsusekiei) of the Fukazawa Mine, Hokuroku district, Japan. In Ohmoto, H. and Skinner, BJ. (Eds.), The Kuroko and Related Volcanogenic Massive Sulphide Deposits. Econ. Geol. Monograph 5, p. 412-432.
Kester, D.R., 1975. Dissolved gases other than C02. In Ri/ey, JP. and Skirrow, G. (Eds) Chemical Oceanography: Academic Press, London, 498-556.
Koski, R.A., Shanks, W.C., Bohrson, W.A. and Oscarson, R.L., 1988. The composition of massive sulphide deposits from the sediment-covered floor of Escanaba Trough, Gorda Ridge: implication for depositional processes. Can. Miner., 26: 655-673.
Kusakabe, M. and Chiba, H., 1983. Oxygen and sulphur isotope composition of barite and anhydrite from the Fukazawa deposit, Japan. In Ohmoto, H. and Skinner, BJ. (Eds.), The Kuroko and Related Volcanogenic Massive Sulphide Deposits. Econ. Geol. Monograph 5, p. 292-301.
~ Large, R.R., 1977. Chemical evolution and zonation of massive sulphide deposits in volcanic terrains. Econ. Geol., 72:549-572.
t Large, R.R., 1991. Importance of mineral zonation in understanding the chemistry and processes of ore fonnation. CODES Masters Econ. Geol. Short Course Manual, 12: 112.
Leblanc, M. and BiIIaud, P., 1990. Zoned and recurrent deposition of Na-Mg-Fe-Si exhalites and Cu-Fe sulphides along synsedimentary faults (Bleida, Morocco). Econ. Geol., 85: 1759-1769.
-i) Lydon, J.W., 1988. Volcanogenic massive sulphide deposits Part 1: a descriptive model. Geoscience Canada, 11:195-202.
{j McArthur, G.J., 1986. The Hellyer massive sulphide deposit, In Large, R.R. (Ed.), The Mount Read Volcanics and associated ore deposits. Geol. Soc. Aus., Tasmania Division, p. 11-19.
~. McArthur, G.J., 1989. Hellyer. In Burrett, C.F. and Martin, EL. (Eds) Geology and mineral resources ofTasmania. Spec. Pub. Geol. Soc. Aus., 15, p. 144-148.
.~ McArthur, G.J., 1990. Metal and textural zonation in the Hellyer massive sulphide deposit. [abstr.]: Geol. Soc. Australia, Gondwana; Terranes and resources, Tenth A.G.C., Hobart, Australia, Feb 1990, No. 25, p. 108-109.
l

112
~'McArthur, G.J. and Dronseika, E.V., 1990. Que River and Hellyer zinc-lead deposits. In Hughes, F.E. (Ed.), Geology of the mineral deposits ofAustralia and Papua New Guinea. Mono. 14, AusIMM, Parkville, Victoria, p.1229-1239.
McArthur, G.J. and Kuipers, A.J., 1990. Computer methods for mine geology at� Hellyer. Mine geologists conference, Mt. Iso:, 49-55 p.�
McGoldrick, P., 1988. Sulphur isotope studies at Que River. Final Report to AMIRA, p. 47-52.
Ohmoto, H., 1986. Stable isotopes geochemistry of ore deposits: In Valley, J.W., Taylor, Jr., H.P., and O'Neil, JR., (Eds.), Stable Isotopes in High Temperature Geological Processes. Min. Soc. America, Rev. in Mineralogy, 16: 491-560.
~Ohmoto, H., Mizukami, M., Drummond, S.E., Eldridge, C.S., PisuthaArnond, V. and Lenagh, T.C., 1983. Chemical processes of Kuroko fonnation. In Ohmoto, H. and Skinner, BJ., (Eds.), The Kuroko and Related Volcanogenic Massive Sulphide Deposits. Econ. Geol., Monograph 5, p. 570-604.
Ohmoto, H. and Rye, R.O., 1979. Isotopes of sulphur and carbon: In Barnes, H.L., (Ed.), Geochemistry ofhydrothermal ore deposits: New York, 1. Wiley and Sons, p. 509-567.
Phillips, W.R. and Griffen, D.T., 1981. Optical mineralogy: The non opaque� ~ minerals. W.H. Freeman and Co., p. 86-94.�
~ Pisutha-Arnond, V. and Ohmoto, H., 1983. Thennal history, and chemical and isotopic conditions of the ore-forming fluids responsible for the Kuroko massive sulphide deposits in the Hokuroko District of Japan: In Ohmoto, H. and Skinner, BJ., (Eds)., The Kuroko and Related Volcanogenic Massive Sulphide Deposits, Econ. Geol., Monograph 5, p. 523-558.
Ramsden, A.R., Kinealy, K.M., Creelman, R.A. and French, D.H., 1990. Precious and base metal mineralogy of the Hellyer volcanogenic massive sulphide deposit, northwest Tasmania - A study by electron microprobe. In Gray, P.M.1., Bowyer, GJ., Castle, J.F., Vaughn, DJ. and Warner, NA. (Eds.), Sulphide deposits - Their origin and processing. AusIMM., Parkville, Victoria, p. 49-71.
Rand, S.W., 1988. The geology and mineralisation of the Mt. Charter prospect. Unpub. Honours thesis, University ofTasmania, p. 1- 96.
Ridler,R.H., and Shilts, W.W., 1974. Mineral potential of the Rankin Inlet.� Canadian Min. Jour., 95(7): 32-42.�

1
Roedder, E., 1981. Origin of fluid inclusions and changes that occur after trapping In HoWster, L.S. and Crawford, ML. (Eds), Short course influid inclusions: Applications to petrology. Min. Assoc. Canada, Calgary, 6:101-129.
'J Sato, T., 1972. Behaviours of ore-forming soll;ltions in seawater. Mining Geology, 22:
31-42.
Shanks, W.C. III and Seyfried, W.E. Jr., 1987. Stable isotope studies of vent fluids and chimney minerals, southern Juan de Fuca Ridge: sodium metasomatism and seawater sulphate reduction in Special section on the Southern Juan de Fuca Ridge: hydrothermal fluids, sulphides and geophysical studies. l. Geophys. Res., 92B(lI):11387-11399.
Shimazaki, H. and Horikoshi, E., 1990. Black ore chimney from the Hanaoka� Kuroko deposits, Japan. Mining Geol., 40(5): 313-321.�
Sise, J.R. and Jack, D.J., 1984. Exploration History of the Hellyer Deposit, In Baillie, P.W. and CoWns, PL. (Eds.), Mineral Exploration and Tectonic Processes in Tasmania. Geo!. Soc. Aus. Tasmanian Divsion, p. 48-49.
Solomon, M., Eastoe, C.J., Walshe, J.L. and Green, G.R., 1988. Mineral deposits and sulphur isotope abundances in the Mount Read Volcanics between Que River and Mt. Darwin, Tasmania. Econ. Geol., 83: 1307-1328.
(
Speiss, F.N., MacDonald, K.C., Atwater, T., BaIIard, R., Carranza, A., Cordoba, D., Cox, C., DiazGarcia, V.M., Francheteau, J., Guerrero, J., Hawkins, J., Haymon, R., Hessler, R., Juteau, T., Kastner, M., Larson, R., Luyendyk, B., MacdougaII, J.D., Miller, S., Normark, W., Orcutt, J. and Rangin, C., 1980. East Pacific Rise: Hot springs and geophysical experiments. Science, 207: 1421-1433.
Staff, Aberfoyle Resources Limited, 1990. Geology and discovery of the Que River and Hellyer polymetallic sulphide ores, Tasmania. In Glasson, K R. and Rattigan, l.H., Geological aspects of the discovery ofsome important mineral deposits in Australia. AusIMM. Mono. 17, Parkville, Victoria, p. 187-196.
Stumm, W. and Morgan, J.J., 1981. Aquatic Chemistry, 2nd Edition, Wiley, New York, p. 780.
Ulrich, M.R. and Bodnar, R.J., 1988. Systematics of stretching of fluid inclusions II: Barite at 1 atm confining pressure. Econ. Geol., 83: 1037-1046.

Whitford, D.J. and Craven, S.J., 1986. Strontium isotopic studies at Que River and Hellyer. In Large, R.R., The Mount Read Volcanics and associated ore deposits. GeoL Soc. Australia, Tas Div., p. 87-88.
Williams, L.A. and Crerar, D.A., 1985. Silica diagenesis, IT. general mechanisms. J. sed. Pet., 55: 312-321.
Williams, L.A., Parks, G.A. and Crerar, D.A., 1985. Silica diagenesis, 1.
solubility controls. J. Sed. Pet., 55: 301-311.
Woodruff, L.G. and Shanks, W.C., 1985. Sulphur isotope study of chimney minerals and hydrothermal fluids from 21°N, East Pacific Rise: hydrothermal sulphur sources and disequilibrium sulphate reduction. Jour. Geophys. Res., 93,: 4562-4572. .,..
Zierenberg, R.A. and Schiffman, P., 1990. Microbial· control of silver mineralisation at a sea floor hydrothermal site on the northern Gorda Ridge. Nature, 348: 155-157.
/;

--~-_
_
._.._
._ ..__
._-_..
__
. _ ~._--------------~--

Appendix 1.1: Logging Codes Employed at Hellyer
Aberfoyle Resources Limited� HElLYER DMSION�
DIAMOND DRILL LOG VALID CODES SHEET 1 OF 2
LITHOLOGY STRATIGRAPHY COLOUR VOLCANICLA.STIC MATRIX Upper Rhyolitic Sequence URS Composition Que Rfvor Sh<1le QRS PREF1X o - Oan. Pillow LavQ Sequence PLS L - Ught Cryetal X Hanging Wall Volcaniclastic Sequence HVS 8 ~ Bright Glasey G Hellyer Mineralized Sequence HMS Lithic L
Black� BkF"eldapar Phyric Ande5ito Sequence FPS� Vitric VBrown� SrLowet' Eplcl~tJc Sequence LES� or any standard mineralogy codeGreen Gn� Grey Gy�Stringer Enveloper Zono SEZ Orange� OrStringer Zone m� LOWER CONTACTPink Pk� Polychrome Pc� GradationPurple� PpROCK TYPE Red� Rd Sharp but not faulted S White� WhComposition Prefix /'� Faulted F Yellow� Yw Gradational up to 1m Gl
!:Iarite 80 l-lOm G2 Basalt 8 over lOm GJ Base Metal SUlphides 8MS VOLCANICLA.STIC FRAGMENTS Chert� Ch Docile o Composition ~
feldspar Phyric Andosite FP As per rock type composition prefix codee ConformableGlassy silica - collotorm pyrite ore GSP� C
(nterlingering� FHighly Altered (obliterating primary texture..) HA [rret;Jular� IMassive Chalcopyrite !dCPy SortingMassive Pyrite MPy Polymict Y Well sorted W Pumice Pu Moderately 30rted M VESICLES -Quellito· Q Poorly sorted P Rhyolito R Concentration Sand:ttone. SlItstone S.
Shape� Trace 1Shale� Sh Weak 2
Angular Moderate J Volcanic Texture' Suffix " StrongSub-angular JA� 4
Sub-rounded .R Extreme 5 Ash volcaniclQlltic (O-2mm) QV Rounded R Lapilli yolcaniclastic (2-d4mm) Iv ArcLlate Ar
tin. (2-8mm) tlv EutaxitJc X Shape� medium (S-J2mml mlv Variable V� Annular sub-vesicles A coan:e (,32-64mm clv EJongate� E Elongate� E
Breccia volcaniclastic (>64mm) bv Spherical� SLavQ� I Variable� V Pillow lava pi '1ariolitlc pillow lova vp
........ .,. ......~V__ I�
Aberfoyle Resources Limited� HELLYER DMSION�
DIAMOND DRILL LOG VALID CODES SHEEl 2 OF 2
ALTERATION� FAULTS Texture� Minerolo91 Gouge Disseminated o Aa per mineralogy codee used for CO Brecciated B.�rnterpillow IP alteration and mineralisation, e.9. SI Cavornous Cv� NodLllar N Cl Puggy Pu� Pervosive P Ep Rehealed Rh� Pillow Margins PM Slickensidod SI� Pseudomorphous�
R Carbonate� Selected fragments F Chlorile Cl� Stockwork K Texture Mylonite My� Stn.cture controlled S Quartz Si� Veins V Rubblo Ru�
Rim '" MINERALISATION� CO
Banded Sn� Brecciated Br� Sericito� S. CQlloform� Cm Diueminated O.� Euhedral Eu�
As per stlJndard Inten:Jity coding 1 Fragmontal Fr FOLIATION� 2 Framboidal Fb�
Intens~
~J ~i~~-~::~: Coating
lP 4� JP Bedding 8d 5� Massive Ma Ctallt Alignment CA
Nodular No Cloavage Cl PUlow margin Pm Aow Banding FE
~!,erology Recrystal1ised Rx Shearing Sh� Carbonate CO�
Reworked Rk' Sulphide Banding ss� Chlorite Cl�
Sheared� Sh Vesicle A119nment VA Shrinkage Shadow3 S.Epldot. Ep�
Feld:llpar Fd� Voins Vn� Vein Seivedge VS�Fuchsite Fu� WEATHERINGBox.ork Voining� S.Dlite U Fragmsnt Rim Rm Type prefix. standard Intensity�
Pyrite Py�K-Feldspar� >b coding lIL1ffix� Sericite Se and�Mineralogy Contents Leached L
Oxidised oSilica� Si Hematite He Mineralogy profix, percentage suffix� Tremolite Tm (tr for traco). I for empha:li8�
Code in order of predominanc., Nsenopyrite M� use bracketB for trace contenL Barite� 80
Chalcopynle Cp Galena Gn
VEINING� Pyrite PySphalerit. Sp�
!nt~!!~~ Gangue G.�
Alii per :Jtandard inhJnsity cOding 1� 2� J�
! 4 5 ......... .,.-....tw.AllClv•..-z

/

Department
SAMPLE FROM TO Rock Type BHID Northing Easting R.L Catalouge Numbers ;I>'0 '0 to :I
RSOOl 55.7 55.8 Ba1lMS HL386 10670 5679 441 Q. ~.
RSOO2 99.1 99.24 Ba HL365 10691 5762 488 hi
RS003 96.3 96.4 GSP HL363 10691 5751 491 ;...
RSOOS 139.42 139.49 Ba HL322 107107 5n8 528 en RS006 52.45 52.57 GSPA3A HL324 10712 5745 447 3 RSOO7 49.1 49.2 GSPA3a HL324 10712 5743 444
'0
" RSOOS 123.5 123.7 Contact HL324 10710 5783 507 0" n ~
10 106.5 106.7 BMSA3a HL413 10633 5727 510 o' :>
11 115.5 115.6 Ba vein HL413 10633 5728 519 '" '" 12 118.5 118.7 Ba HL413 10633 5729 522
:> Q.
13
14
130.1
134.6
130.2
134.8 - GSP
Ba
HL413
HL413
10633
10634
5731
5731
533
537
Cl.. 0 0"
15 72.5 72.65 Contact HL417 10629 5686 472 aq '<
17 119 119.1 GSPA3MS HL414 10632 5718 523 t:I.. 18 127.1 127.3 Ba HL414 10632 5719 531 '0
~ 19
20
136.25
134.7
136.58
134.83
Ba
Contact
HL414
HL414
10632
10632
5719
5719
540 539
a.. ~
21
22
23
140.7
148.8
150.7
140.9
149.5
150.8
Ba
Ba
B-pI
HL414
HL414
HL414
10632
10632
10632
5719
5720
5720
545
553
555
()
'" Eo 0s::
24 103.3 103.4 BMSA3a HL41 0 10649 5719 507 !IQ.. 25 105.1 105.3 Ba HL41 0 10649 5719 509 :>s:: 26 118.5 118.87 Contact HL410 10649 5719 523 a
0" 27 115.9 116 Ba HL410 10649 5719 520 ~
28 129.3 129.5 Ba HL410 10649 5719 533 !"
29 141.2 141.3 Ba1lMS HL410 10648 5719 545
SAMPLE FROM TO Rock Type BHID Northing Easting R.L Department
Catalogue Numbers
30 145.5 145.6 Ba HL410 10648 5719 550
31 84.6 84.7 Ba vein HL452 10612 5709 490
32 91 91.3 GSP HL452 10612 5709 496
33 78 78.2 GSP HL452 10612 5709 483
34 99.7 99.8 GSP HL452 10612 5710 504
35 102.75 102.9 Ba1lMS HL452 10612 5710 507
36 110.05 110.1 Ba HL452 10613 5710 515
37 115.9 116 B-pI HL452 10613 5710 520
38 183.3 184.4 Ba1lMS HL329 10803 5818 554
39 187.5 189 Contact HL329 10803 5820 557
40 189.9 190.2 Contact HL329 10803 5822 559
41 190.6 190.7 Ba HL329 10803 5823 559
42 163 163.15 GSP HL295 10814 5789 551
43 165.3 165.4 GSP HL295 10814 5790 553
44 168.6 168.75 GSPA3MS HL295 10814 5791 556
45 117.15 117.2 GSP Hl346 10831 5797 503
46 118.95 119.03 B-pI Hl346 10831 5798 504
47 118.8 118.9 Ba Hl346 10831 5798 504
48 139.5 139.6 GSP HL364 10752 5759 536
49 140.55 140.65 Ba HL364 10752 5759 537
50 140.95 141.05 Contact HL364 10752 5759 538
51 152.6 152.7 X-tal HL364 10752 5763 549
52 155.1 155.25 BMSIGSP HL364 10752 5763 551
53 158.3 158.4 Conlact HL364 10752 5764 554 54 159.2 159.3 Ba HL364 10752 5764 555
55 168.75 168.85 Conlact HL364 10752 5767 564
56 171.7 171.8 Ba HL364 10752 5768 567
57 180_35 180.45 GSP HL364 10752 5nO 575
58 182.8 182.9 Ba HL364 10752 5n2 578
63 174.95 175.1 Contact HL315 lOnl 5810 560

SAMPLE FROM TO Rock Type BHID Northing Easting RL Department�
Catalogue Numbers�
64 173.35 173.5 GSP HL315 10771 5811 562�
65 175.9 176 GSP HL315 10771 5811 562�
66 178.4 178.5 B-pl Contad HL315 10771 5812 565�
67 247.5 247.6 BaXlal HL461 10434 5685 459�
68 75.97 76.17 BaXtal HL625 10285 5667 613�
69 81.8 81.9 BMS.GSP HL625 10285 5665 608�
70 85.5 85.7 Ba vein HL625 10285 5664 604�
71 94.8 94.9 GSP HL625 10284 5662 595�
72 154.6 154.8 GSP veins in Ba HL366 10747 5754 553�
73 160.5 160.6 Banded Ba HL366 10746 5755 559�
74 162.1 162.3 GSP in Ba HL366 10746 5756 560�
75 162.4 162.55 SVGSP in Ba HL366 10746 5756 561�
76 162.9 163 GSP/Ba HL366 10746 5756 561�
77 163.6 163.7 BMS/Ba Contact HL366 10746 5756 562�
78
79 167.6 167.7 BainBMS HL366 10746 5757 566�
164 163.9 GSP/BMS Contact HL366 10746 5756 562�-80 168.4 168.5 Zoned Sp with Ba HL366 10746 5757 566�
81 169 169.1 HGOwithBa HL366 10746 5757 567�
82 176.05 176.15 HGO HL366 10746 5757 574�
83 177.8 177.95 Ba fragment in BMS HL366 10746 5759 576�
84 185.4 185.5 GSP HL366 10746 5761 583�
85 188 188.1 B-pl fragment in Ba HL366 10746 .5762 585�
86 10.7 10.8 GSP HL349 10731 5763 445�
87 12.75 12.95 GSP with carbonate HL349 10731 5764 444�
89 15.3 15.45 Ba.GSP HL349 10731 5766 442�
90 106.85 106.93 HVSContad HL610 10316 5638 594�
91 106.7 106.8 Si Vein HL610 10316 5638 593�
92 107.1 107.2 HVSin Ba HL610 10316 5637 593�
93 109.49 109.5 BnBalBMS HL61 0 10316 5637 593�
SAMPLE FROM TO Rock Type BHID Northing Easting RL Depatrment Catalogue number!
94 110 110.95 Contact BalBMS HL610 10316 5636 590�
95 105.25 105.5 Massive Ba HL610 10316 5638 590�
100 127.05 127.25 Ba Vn in BMS HL326 10804 5769 517�
101 132.75 132.83 Ba in BMS HL326 10804 5772 522�
102 139.1 139.2 Ba in LGO HL326 10804 5774 528�
103 148.9 149 Si vein HL326 10804 5779 536�
104 149.4 149.5 BMS.GSP HL326 10804 5780 537�
105 167.7 167.8 Zoned Sp &Ba HL326 10804 5788 553�
106(0 168.4 168.5 BMS.GSP HL326 10804 5788 554�
106(iO 170.7 170.8 FrBMS.GSP HL326 10804 5790 556�
107 174.6 174.75 Cherty Fr in BMS HL326 10804 5791 559�
108 177.65 177.75 Ba with pyrite HL326 10804 5793 562�
109 181.85 181.95 Contact BalGSP HL326 10803 5795 566�
110 183 183.1 BMS.GSP(?) HL326 10803 5795 567�
111 187.4 187.5 Banded Ba HL326 10803 5797 570�
112 190.4 190.6 B-PI HL326 10803 5799 573�
113 191.2 191.3 InterpilJow margin HL326 10803 5799 574�
114 192.3 192.4 Attered Basah HL326 10803 5800 575�
115 195.7 195.8 B-pI HL326 10803 5801 578�
116 197.8 198 FutSe attered B-pl HL326 10802 5802 580�
117 202.1 202.2 Se!Fu attered B-pl HL326 10802 5804 583�
118 202.9 203 B-pI HL326 10802 5805 584�
120 125.6 125.7 HVS HL381 10667 5762 523�
121 126.8 126.7 Attered HVS HL381 10670 5762 524�
122 126.3 126.4 Attered HVS HL381 10667 5762 524�
123 126.9 127 Banded HVS HL381 10667 5762 525�
124 127.9 128 GSP/HVS Contad HL381 10667 5762 525�
;:
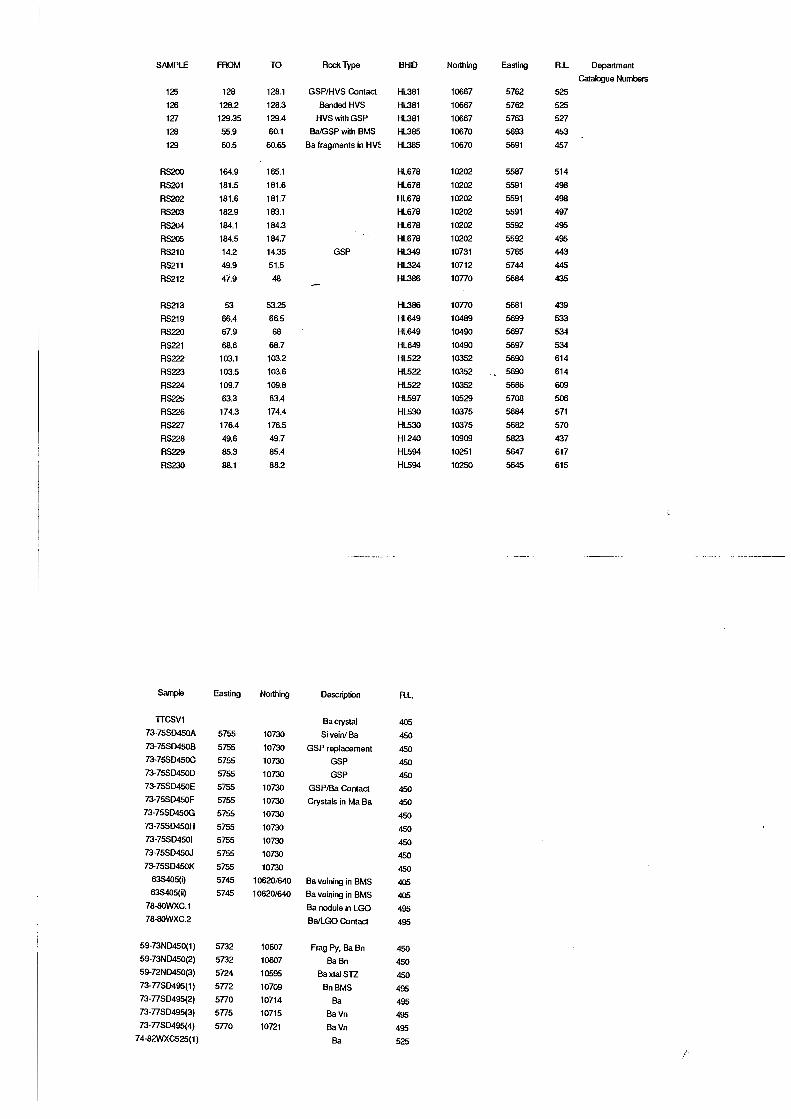
SAMPLE FROM TO Rock Type BHID Northing Easting RL Department
Catalogue Numbers
125 128 128.1 GSP/HVS Contact H1.381 10667 5762 525
126 128.2 128.3 BandedHVS H1.381 10667 5762 525
127 129.35 129.4 HVSwhhGSP H1.381 10667 5763 527
128 55.9 60.1 BaiGSP with BMS H1.385 10670 5693 453
129 60.5 60.65 Ba fragments in HV~ HL.385 10670 5691 457
RS200 164.9 165.1 HL678 10202 5587 514
RS201 181.5 181.6 HL678 10202 5591 498
RS202 181.6 181.7 HL678 10202 5591 498
RS203 182.9 183.1 HL678 10202 5591 497
RS204 184.1 184.3 HL678 10202 5592 495
RS205 184.5 184.7 HL678 10202 5592 495
RS210 14.2 14.35 GSP HL349 10731 5765 443
RS211 49.9 51.5 H1.324 10712 5744 445
RS212 47.9 48 - H1.386 10770 5684 435
RS213 53 53.25 H1.386 10770 5681 439
RS219 66.4 66.5 HL649 10489 5699 533
RS220 67.9 68 HL649 10490 5697 534
RS221 68.6 68.7 HL649 10490 5697 534
RS222 103.1 103.2 HL522 10352 5690 614
RS223 103.5 103.6 HL522 10352 5690 614
RS224 109.7 109.8 HL522 10352 5686 609
RS225 63.3 63.4 HL597 10529 5708 506
RS226 174.3 174.4 HL530 10375 5684 571
RS227 176.4 176.5 HL530 10375 5682 570
RS228 49.6 49.7 HL240 10909 5823 437
RS229 85.3 85.4 HL594 10251 5647 617
RS230 88.1 88.2 HL594 10250 5645 615

Appendix 2.2a: Coordinates used in the construction of the plan projection of the Hellyer barite cap. The Eastings are derived largely from existing mine Sections.
Northing 11030� 10930� 10910� 10890� 10890� 10870� 10870� 10850� 10850� 10830�
.-10830� 10810� 10810� 10790� 10790� 10770� 10770� 10770� 10770� 10770� 10750� 10750� 10730� 10710� 10710� 10710� 10690� 10690� 10690� 10670� 10670� 10650� 10650� 10630� 10630� 10630� 10610� 10590� 10570� 10570� 10570� 10550� 10530� 10510� 10490� 10470� 10450� 10430� 10410� 10350� 10350� 10330� 10285�
Relation to Jack Fault� East� East� East� East� East� East� East� East� East� East� East� East� East� East� West� East� East� East� East� West� East� East� East� West�
East� East� East� West� West� West� West� West� West� West� West� West� West� West� West� West� West� West�
West� West� West� West� West�
West� West�
East� West� West� West�
Min Easting� 5870� 5867� 5806� 5824� 5838� 5791� 5848� 5766� 5810� 5780� 5789� 5803� 5834� 5780� 5727� 5753� 5753� 5759� 5836� 5760� 5743� 5780� 5771� 5722� 5747� 5737� 5746� 5677� 5752� 5670� 5725� 5642� 5714� 5679� 5713� 5748� 5686� 5688� 5701� 5670� 5638� 5674� 5655� 5651� 5711� 5680� 5690� 5696�
?�
5697� 5690� 5665� 5664�
MaxEasting� 5877� 5892� 5866� 5835� 5869� 5837� 5863� 5789� 5864� 5784� 5856� 5820� 5854� 5830� 5736� 5780� 5816� 5812� 5851� 5770� 5770� 5805� 5804� 5777� 5793� 5798� 7755� 5700� 5769� 5708� 5745� 5702� 5751� 5703� 5737� 5750� 5730� 5725� 5723� 5692� 5640� 5720� 5700� 5706� 5650� 5634� 5640� 5680�
?�
5680� 5623� 5635� 5630�
,/

Appendix 2.2b: Coordinates used in the construction of the plan projection of the� Hellyer-siliceolls cap_ The Eastings are derived largely from existing mine Sections�
Northing� 10870� 10850� 10830� 10810� 10790� 10790� 10770� 10770� 10770� 10770� 10750�
/10750� 10750� 10750� 10730� 10730� 10730� 10710� 10690� 10690� 10670� 10670� 10630� 10630� 10610� 10590� 10590� 10530� 10370� 10350� 10330� 10330� 10310�
Relation to Jack Fault
East� East� East� East� East� West�
East� East� East� West� West� West�
West� East� West� West�
East� West� West�
West�
West� East� West� West� West�
West� West�
West� West�
West�
East� West�
West�
Min Easting 5803� 5766� 5794� 5772� 5794� 5726� 5753� 5775� 5835� 5768� 5651� 5709� 5722� 5753� 5660�
5733� 5778� 5741� 5643� 5742� 5727� 5745� 5697� 5713� 5675� 5688� 5700� 5685� 5688� 5697� 5695� 5685� 5670�
MaxEasting 5814� 5787� 5814� 5828�
. 5830� 5732� 5807� 5826� 5851� 5774� 5691� 5716� 5732� 5787� 5680� 5778.� 5808� 5777� 5654� 5758� 5745� 5770� 5703� 5723� 5690� 5694� 5721� 5702� 5643� 5675� 5675� 5665� 5656�

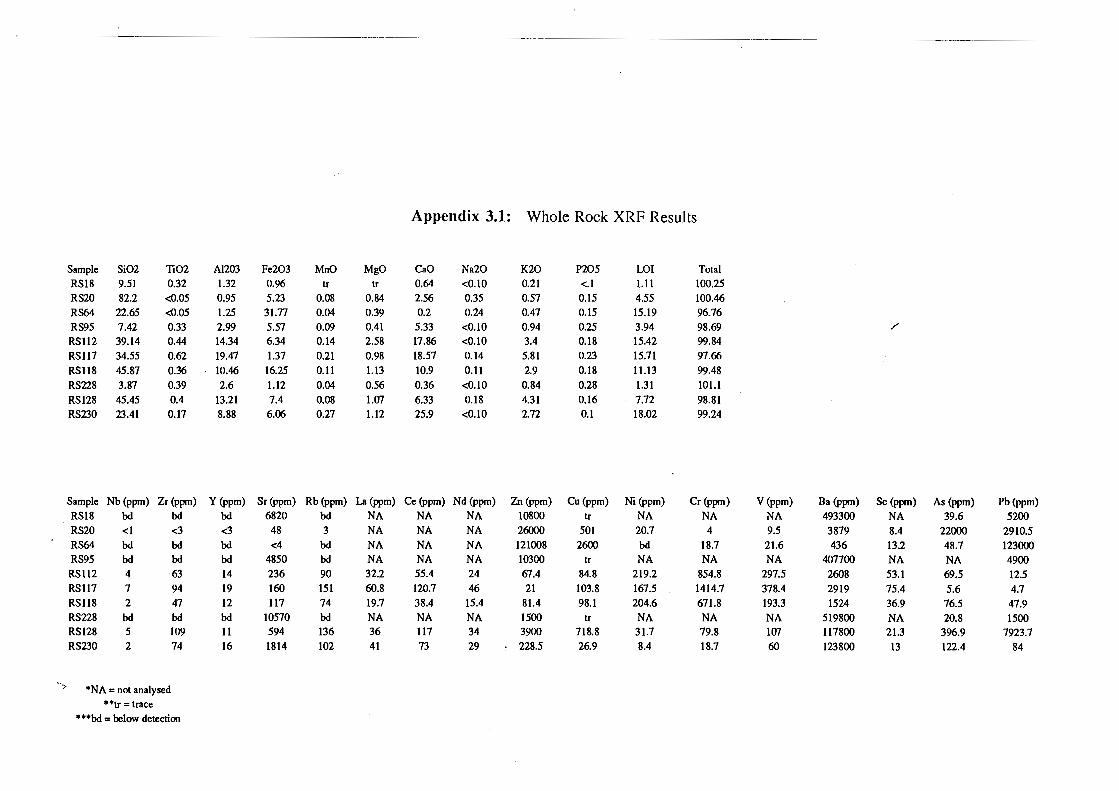
Appendix 3.1: Whole Rock XRF Results
Sample Si02 Ti02 AI203 Fe203 MnO MgO CaO Na20 K20 P205 LOI Total RSI8 9.51 0.32 1.32 0.96 tr tr 0.64 <0.10 0.21 <.1 1.11 100.25 RS20 82.2 <0.05 0.95 5.23 0.08 0.84 2.56 0.35 0.57 0.15 4.55 100.46
RS64 22.65 <0.05 1.25 31.77 0.04 0.39 0.2 0.24 0.47 0.15 15.19 96.76
RS95 7.42 0.33 2.99 5.57 0.09 0.41 5.33 <0.10 0.94 0.25 3.94 98.69 /'
RS112 39.14 0.44 14.34 6.34 0.14 2.58 17.86 <0.10 3.4 0.18 15.42 99.84
RSll7 34.55 0.62 19.47 1.37 0.21 0.98 18.57 0.14 5.81 0.23 15.71 97.66 RS118 45.87 0.36 10.46 16.25 0.11 1.13 10.9 0.11 2,9 0.18 11.13 99.48
RS228 3.87 0.39 2,6 1.12 0.04 0.56 0.36 <0.10 0.84 0.28 1.31 101.1
RS128 45.45 0.4 13.21 7.4 0.08 1.07 6,33 0.18 4.31 0.16 7.72 98.81 RS230 23.41 0.17 8.88 6.06 0.27 1.12 25.9 <0.10 2.72 0.1 18.02 99.24
Sample Nb (ppm) Zr(ppm) Y (ppm) Sr(ppm) Rb(ppm) La (ppm) Ce (ppm) Nd (ppm) Zn (ppm) Cu (ppm) Ni (ppm) Cr (ppm) V (ppm) Ba (ppm) Se (ppm) As (ppm) Pb(ppm) RS18 bd bd bd 6820 bd NA NA NA 10800 tr NA NA NA 493300 NA 39.6 5200 RS20 <1 <3 <3 48 3 NA NA NA 26000 501 20.7 4 9.5 3879 8.4 22000 2910.5 RS64 bd bd bd <4 bd NA NA NA 121008 2600 bd 18,7 21.6 436 13.2 48.7 123000 RS95 bd bd bd 4850 bd NA NA NA 10300 tr NA NA NA 407700 NA NA 4900 RS112 4 63 14 236 90 32.2 55.4 24 67.4 84.8 219.2 854.8 297.5 2608 53.1 69.5 12.5 RS117 7 94 19 160 151 60.8 120.7 46 21 103.8 167.5 1414.7 378.4 2919 75.4 5,6 4.7 RS118 2 47 12 117 74 19.7 38.4 15,4 81.4 98.1 204.6 671.8 193.3 1524 36.9 76.5 47.9 RS228 bd bd bd 10570 bd NA NA NA 1500 tr NA NA NA 519800 NA 20.8 1500 RS128 5 109 11 594 136 36 117 34 3900 718,8 31.7 79.8 107 117800 21.3 396.9 7923.7 RS230 2 74 16 1814 102 41 73 29 228,5 26,9 8.4 18.7 60 123800 13 122.4 84
"':-:~ *NA =not analysed� **tr =trace�
***bd =below detection�


Appendix 3.2: Microprobe Barite Analysis(cont.)
Locarion Sr(%) Ba(%) S (%) 0(%) Total
" "4 1.48 56.80 1211 25.88 96.TT " "5 1.15 56.23 1204 25.66 95.08
" "6 1.10 56.18 1251 26.66 96.45
" -r 1.01 56.18 1245 26.33 95.97 " "8 0.91 56.65 1240 26.18 96.14
" "9 0.62. 56.61 1200 25.84 95.07
" "10 0.69 56.93 1228 26.00 95.90
R 2-3 Point Ilower section 0.25 58.91 1293 26.70 98.79 " "Point 2 0.33 58.81 1268 26.34 98.17
" "Point 3 0.30 58.36 1290 26.62 98.19
" " Point 4 0.31 58.25 13.00 26.71 98.26
" " Point 5 0.33 58.69 1282 26.53 98.36
" " Point 6 0.75 57.67 1294 26.67 98.02
" "Point 7 0.30 58.56 1299 26.77 98.62
RS70
random point 0.29 59.76 13.55 TT.63 101.24
Section 2 Long Ba Point 1 0.91 57.55 13.55 TT.50 99.52
Point 2 0.71 58.68 13.90 28.14 101.43
Point 3 0.87 58.37 13.95 28.17 101.37
Point 4 0.73 58.16 13.90 28.06 100.84
Point 5 0.99 58.11 13.83 TT.99 100.91
Point 6 0.81 57.95 13.95 28.13 100.83 Point 7 0.69 57.80 13.47 TT.36 99.31 Point 8 0.69 57.50 13.66 TT.61 99.45
Point 9 0.78 57.47 13.49 TT.4O 99.15
Point 10 1.75 57.00 13.96 28.23 100.95
Point ll-edge 0.46 58.93 13.70 TT.80 100.88
Section 3 Long Ba Point 1 1.24 57.62 13.88 28.07 100.80
Point 2 1.38 56.28 13.62 TT.52 98.80
Point 3 1.58 57.46 14.11 28.42 101.57
Point 4 1.55 57.92 13.80 28.01 101.29 Point 5 1.65 57.41 13.82 28.02 100.89
Point 6 1.03 57.84 13.84 TT.98 100.69 Point 7 0.94 57.49 13.49 TT.39 99.30 Point 8 0.92 58.38 13.83 28.01 101.14
Point 9 0.99 58.27 13.72 TT.86 100.84 Point 10 0.85 57.81 13.53 TT.49 99.69 Point 11 1.38 56.12 13.65 TT.56 98.70
R-4 Length TravCTSC isolated Ba grain 1 0.12 59.79 13.60 TT.70 101.21
" Point 2 0.CT1 59.16 13.87 28.01 101.10 " Point 3 0.10 58.63 13.54 TT.47 99.74 " Point 4 O.TT 59.14 13.85 28.00 101.26 " Point 5 0.18 58.96 13.96 28.16 101.26 " Point 6 0.33 58.94 13.77 TT.89 100.93
" Point 7 0.41 58.65 13.64 TT.65 100.35 " Point 8 0.21 59.62 13.71 TT.85 101.40
R-4 Width Traverse Isolated Ba grain 1 b.d. 59.87 13.59 TT.69 101.15
" Point 2 0.45 57.52 13.47 TT.31 98.75 " Point 3 0.25 59.17 13.62 TT.71 100.75
R-5 Ba proximal to Rx pyrite rim • Point 1 0.20 58.71 1253 26.08 97.52 R-5 Ba Rx proximal to pyrite rim - Point: 0.26 58.75 13.62 TT.60 100.23 R-l Length traverse along 2mm Ba lath 1 0.83 58.59 13.79 TT.95 101.15
" Point 2 0.92 58.60 13.86 28.08 101.46 " Point 3 1.28 57.76 13.87 28.06 100.98
" Point 4 1.22 57.87 13.65 TT.79 100.53 " Point 5 1.02 58.05 14.08 28.35 101.50
" Point 6 1.61 56.99 13.99 28.21 100.80 " Point 7 0.99 58.17 13.67 TT.74 100.57
" Point 8 1.15 57.58 13.57 TT.55 99.86 " Point 9 1.69 57.43 13.68 TT.82 100.62 " Point 10 1.46 56.46 13.81 TT.84 99.57
Detection Limit 0.10 0.03
·b.d. =below detection

Appendix 3.3: Microprobe Carbonate Analysis
Mg Ca Mn Fe Sr Ba C 0 Total RS32 RS32 Ring 6-Carl> 1 0.16 35.88 2.01 0.55 0.00 0.05 11.40 ' 45.55 97.93 RS32 Ring 6- Carl> 2 b.d. 36.74 1.69 0.19 0.01 b.d. 11.44 45.71 98.20 RS32 Ring 2 - Carl> 1 0.20 35.64 1.76 0.62 0.00 0.07 11.31 45.20 97.23 RS32 Ring 2 - Carb 2 0.35 35.32 1.90 0.87 0.00 0.08 11.58 45.73 98.42
RS63 Ring 1- edge of ba rcpL 0.27 37.14 0.61 0.08 0.36 b.d. 11.47 45.82 95.76
Ring 5 - co in ba grain 0.28 36.36 0.48 0.20 0.57 0.04 11.27 45.02 94.23
RS57 Ring 1 in centre of cam 0.05 38.21 1.07 0.95 D.d. 0.08 11.93 47.67 100.00
Ring 3 in GSP Si impurity 0.18 39.35 1.61 1.63 0.54 0.05 12.66 50.58 106.59 '"'-
Aberfoyle Resources Limited Microprobe CarbcJnate analyses
1 0.06 40.48 0.75 0.72 b.d. b.d. 11.28 46.67 100.00
2 0.03 36.87 2.83 0.73 0.23 b.d. 11.87 47.42 100.00
3 0.18 37.97 0.85 0.92 0.40 b.d. 11.95 47.70 100.00
4 0.04 40.62 0.24 0.12 0.12 b.d. 11.60 47.27 100.00
5 0.03 40.00 0.24 0.13 0.08 b.d. 11.84 47.66 100.00
6 0.08 39.49 0.51 0.84 0.06 b.d. 11.68 47.34 100.00
7 b.d. 40.57 0.35 0.07 0.08 b.d. 11.62 47.30 100.00
8 0.11 38.89 0.42 0.94 0.08 b.d. 11.88 47.66 100.00
9 0.17 37.52 2.45 0.58 b.d. b.d. 11.82 47.45 100.00
10 0.10 39.02 1.17 1.05 b.d. b.d. 11.57 47.09 100.00
11 0.15 38.78 0.41 0.39 0.32 b.d. 12.02 47.89 100.00
12 0.24 39.19 0.35 0.41 0.06 b.d. 11.93 47.81 100.00
13 0.31 39.58 0.10 0.46 b.d. b.d. 11.8~ 47.70 100.00
14 0.23 39.69 0.14 0.53 0.10 b.d. 11.76 47.55 100.00
15 0.11 38.83 0.23 0.40 b.d. b.d. 12.18 48.21 100.00
16 0.15 38.85 0.35 0.41 0.05 b.d. 12.11 48.09 100.00
17 0.22 38.93 0.37 0.53 0.12 b.d. , 11.97 47.86 100.00
18 0.05 39.61 0.34 0.30 0.09 b.d. 11.89 47.72 100.00
19 0.07 39.79 0.94 0.22 0.12 b.d. 11.62 47.24 100.00
20 0.16 40.26 0.53 0.50 0.54 b.d. 11.31 46.70 100.00
Average 0.14 38.56 0.09 0.55 0.15 b.d. 11.33 45.57
Detection limit 0.02 0.04 0.04 0.04 0.04
Appendix 3.4: Microprobe Sphalerite Analysis f.:')
Sample ID. S (wt%) Mn (wt%) Fe (wt%) Cu (wt%) Zn (wt%) Ag (wt%) Hg (wt%) Se (wt%) Total GSP
1.801 ;;RS42:R4-Spl 32.87 b.d. b.d. 65.11 b.d. b.d. b.d. 99.87 RS42:R4-Sp2-edge 33.00 b.d. 1.80Z ~!, 0.12 64.76 b.d. b.d. b.d. 99.68 RS42:R2-sp inel. in asp 32.50 b.d. 3.60';:" 0.13 61.24 b.d. b.d. b.d. 97.49 RS42:R6 sph in chen 1 32.48 b.d. 1.83 .~ . "', 0.21 61.65 b.d. b.d. b.d. 96.26..... RS42:R6sph in chen 2 33.03 b.d. 1.86", ." 0.99 60.79 b.d. b.d. b.d. 96.73 RS42:R7 sph 1 32.76 b.d. 2.32 .;; .\c b.d. 62.55 b.d. b.d. b.d. 97.71
RS 100:Rl sph in aspy 32.93 b.d. 2.81 ~. ,:e. 1.37 60.41 b.d. b.d. b.d. 97.68 RSI06:R3 Sph acie text 33.13 b.d. 2.59, "' b.d. 62.31 b.d. b.d. b.d. 98.09 Barite Cap
~~
RS83- Ring 1 Sphl 32.93 0.04 3.77 0.37 61.41 b.d. h.d. h.d. 98.51 RS83-Ring 1 sph2 32.81 b.d. 3.59 b.d. 62.20 h.d. h.d. h.d. 98.64 RS83-R3--sph 33.12 b.d. 2.64 0.47 62.10 0.24 0.46 h.d. 99.04 RS83 R3 sph2 32.48 b.d. 1.24 0.30 62.66 0.20 h.d. h.d. 97.00 RS83 R5 Sphalerite 32.91 b.d. 1.26 h.d. 64.73 0.09 h.d. b.d. 99.20 RS75 RI sph 32.70 b.d. 3.22 3.00 58.64 0.19 h.d. h.d. 97.77 RS75 R3 sph 33.09 b.d. 0.57 h.d. 63.42 h.d. h.d. 0.04 97.13
Deteetion Limit 0.04 0.06 0.10 0.05 0.21 0.04
"b.d. = below deteetion limit

Appendix-3.5: Microprobe Pyrite Analysis
Au (%) N(%) A8(%) S (%) Fe(%) Cu (%) Se(%) TOIa1 GSP·RS57 Ring 3 - Py fm core N.A. 0.51 0.11 51.47 45.02 b.d. 0.07 98.60 Ring 3 - Py fm rim N.A. 0.22 b.d. 5217 45.40 b.d. 0.07 98.96 Ring 3 - Py cubed. point N.A. 1.34 b.d. 5264 45.44 b.d. 0.09 99.64 Ring 5 Zoned Py Point 1 N.A. 1.43 b.d. 5267 45.75 b.d. b.d. 100.11
Point 2 N.A. 1.33 b.d. 5213 45.98 b.d. 0.17 99.64 Point 3 N.A. 1.53 b.d. 51.79 45.46 b.d. 0.04 99.03 Point 4 N.A. 0.83 b.d. 50.44 45.72 b.d. b.d. 99.20 Point 5 N.A. 1.24 b.d. 5272 45.41 b.d. b.d. 99.51 Point 6 N.A. 0.97 b.d. 5256 46.41 b.d. b.d. 100.28
RS42:R4-PyI N.A. b.d. 0.07 53.05 46.67 b.d. b.d. 100.00 RS42:R4-Py2 N.A. b.d. b.d. 53.47 46.77 b.d. b.d. 100.46
RS42:R4-Py-small grain N.A. b.d. b.d. 5281 46.23 b.d. 0.D7 99.45 RS42:Rl.Py framboid - N.A. 1.90 0.16 49.89 43.38 b.d. b.d. 96.77 RS42:RS-pyrite 1 N.A. 0.06 b.d. 5202 45.39 b.d. b.d. 97.S7 RS42:RS-pyrite 2 N.A. 0.42 0.14 5218 45.55 b.d. b.d.. 98.52 RS42:RS-pyrite ovcrgrowth on Ga N.A. 239 b.d. 50.13 43.47 0.19 0.02 96.41 RS42:RS-pyrite finl>-rim b.d. 1.00 b.d. 50.61 43.34 0.35 b.d. 95.32 RS42:RS-pyrite finl>-core 0.06 0.68 0.10 51.93 43.67 0.62 b.d. 97.06 RS42:RS-pyrite fmb rim2 b.d. 0.74 0.17 51.75 43.03 1.30 0.64 97.08 RS42:RS-py ovcrgrowth riml b.d. 1.49 b.d. 50.75 44.13 0.42 b.d. 96.86 RS42: RS-py ovcrgrowth rim2 b.d. 1.10 b.d. 50.61 43.39 0.40 b.d. 95.50 RS42: PyrilC euhcdra in rbcrt b.d. 0.12 b.d. 5249 45.42 0.28 0.03 98.34 RSI06:RI-Euhcdra1 pyrite b.d. b.d. 0.07 5284 46.17 0.05 0.02 99.18 RSI06:RI-Colloform pyrite b.d. 239 b.d. 51.52 44.24 0.73 b.d. 98.90 RSI06:RI-Pyrite framboid 0.09 0.41 b.d. 53.08 45.60 0.12 b.d. 99.37 RSI06:R3-Euhcdra1 Pyrite b.d. b.d. 0.06 53.88 46.83 b.d. b.d. 100.80
RSI06:R3 PY acic text core I 0.11 b.d. 0.16 5297 ~5.85 0.06 b.d. 99.60 RSI06:R3 py acic text -edgel b.d. 0.14 b.d. 5282 46.67 0.05 b.d. 99.74 RSI06:R3 py acic text - edse2 0.10 1.81 0.25 51.22 44.59 0.36 b.d. 98.34 RS106:R3 Euhedral pyrite b.d. b.d. 0.08 53.10 46.12 b.d. 0.02 99.32 RSI06:R3 py acic text centre 0.06 b.d. b.d. 5292 46.62 b.d. 0.02 99.66 RSI06:R3 Fmb pyrite rim D.45 1.34 b.d. 51.76 43.81 0.24 0.05 97.66 RSI06:R4pyrite ovcrgrowth b.d. 287 0.10 50.81 45.26 0.08 b.d. 99.13
RSI06:R4-pyrilC euhcdra cere b.d. b.d. b.d. 53.07 46.57 b.d. 0.04 99.69
RSI06:R4-py finb in chcrt b.d. 1.26 b.d. 48.09 40.08 0.10 b.d. 89.53
RSI06:R4-pyrilC cuhcdra in chcrt b.d. b.d. 0.06 52SO 45.75 b.d. 0.09 98.41 RSI06:R5-pyrilC acicular tCXlUrC b.d. 0.25 b.d. 52n 46.33 0.05 b.d. 99.41 RSI06:R5-acicular pyrite b.d. O.OS b.d. 5295 46.32 0.04 b.d. 99.39 bariteCap RS83 R2·sman py .euhedra b.d. 0.51 0.08 46.20 40.40 0.08 0.02 87.29 RS83-R3 fluffy py b.d. 4.96 0.05 48.59 43.81 0.10 0.04 97.55 RS83-R3 pyrite fluffy 2 b.d. 269 0.08 51.27 44.34 0.08 b.d. 98.48 RS83 R3 Py frambiod 0.06 1.39 0.07 51.80 44.84 0.10 0.04 98.28 RS83 RS Sman pyrite euhedra b.d. 214 b.d. 5l.85 44.25 0.22 0.02 98.55 RSS3 RS Small pyrite fn.mboid 0.08 1.53 b.d. 5224 45.14 b.d. b.d. 99.03 RS83 R6 small py framboid b.d. 0.07 b.d. 5288 45.39 b.d. b.d. 98.36 RS75 RI py euhcdra b.d. 0.15 b.d. 5252 44.98 b.d. 0.02 97.70 RS75 R3 py euhcdra b.d. 1.40 b.d. 5211 46.08 b.d. b.d. 99.60 RS83 R6py2 b.d. 0.07 b.d. 53.11 45.98 b.d. b.d. 99.18 Detection Limit 0.06 0.06 0.05 0.04 0.02
·N.A. Not Analysed ··b.d. below detection
Appendix 3.6: Microprobe Arsenopyrite Analysis
Sample 1.0. S (wt%) Fe (wt%) N(wt%) Se (wt%) Ag (wt%) Au (wt%) TOIa1 GSP AsenopyrilC Analyses RS42:R3-Euhcdral Asp - Rim 21.50 34.97 43.80 0.07 b.d. b.d. 100.34 RS42:R3-" " -Core 21.89 35.47 43.18 b.d. 0.13 0.10 100.79 RS42:R3-" " -Rim 21.59 35.00 44.29 b.d. b.d. 0.13 101.02 RS42:R2-Euhcdral Asp - Rim point 1 22.08 35.48 41.98 0.11 b.d. b.d. 99.65 RS42:R2-Euhcdral Asp - point 2 21.74 35.57 44.22 b.d. 0.17 b.d. 101.78 RS42:R2-EuhcdraIAsp. point 3 21.84 35.74 43.79 b.d. b.d. b.d. 101.38 RS42:R2-Euhcdral Asp - Rim point 4 21.58 35.42 44.60 b.d. b.d. b.d. 101.93 RSI06:R I Asp euhedra-rim I 22.46 35.50 4252 0.27 0.12 b.d. 100.88 RSI06:Rl Asp euhedra-cere 2 22.53 35.19 41.97 b.d. b.d. b.d. 99.80 RSI06:RI Asp euhednt-rim 3 22.50 35.16 4200 b.d. b.d. 99.830.11 RSI06:R3 Asp euhedra in acicular texture 22.08 34.94 43.66 b.d. 0.13 100.84b.d. RSI06:R4-aps in gal ovcrgrowths 22.21 34.42 43.09 b.d. b.d. b.d. 99.85 Detection Limits 0.05 0.03 0.060.05 0.05

Appendix 3.7: Microprobe Galena Analysis
Sample ID. S (wt%) Pb (wt%) Total
GSPdata RS42:R4-Ga I 12.86 86.40 99.Tl RS42:R4-Ga2 13.59 90.12 103.77
RS42:R5-Ga pseudomorpb point I 15.50 83.80 99.31
RS42:R5-Ga pseudomorpb point 2(very spongy) 17.55 76.67 94.25
RS42:R5 Galena core of framboid py 13.37 87.73 101.14
RS42:R5 Galena intergrowth with pyrite 13.45 ./ 84.44 97.89
RS42:R7 Galena infiIlings 13.41 88.77 102.23
RS 106:R3 acicular textures 13.52 86.96 100.54
RS 106:R3-acicular textures 13.58 86.71 100.34
RS 106:R4-matrix galena 13.49 87.92 101.42
RS 106:R4-core of pyrite framboid 13.78 84.54 98.38
Barite Cap RS83 R2 galena 13.45 84.83 98.28
RS 83 Galena 13.40 85.32 98.73
RS 83 R6 galena 13.50 85.98 99.53
RS83 R5 galena 13.62 85.31 99.00
RS75 galena R I 13.70 86.00 99.71
RS75 R3 galena 13.27 86.20 99.57
RS75 R2 galena 13.59 86.00 99.65
Appendix 3.8: Microprobe Tetrahedrite Analysis
Sample ID. S (wt%) Fe (wt%) Cu (wt%) Zn (wt%) Aa (wt%) Ag (wt%) Sb (wt%) Bi (wt%) Total GSP RS 42:Ring 4-Tetrahedrite pointl 24.66 2.70 37.64 4.46 0.06 2.83 28.60 0.08 101.03 RS 42:Ring 4-Tetrahedrite point 2 24.65 2.82 37.62 4.34 0.34 3.04 28.35 0.00 101.16 RS42:R7 Tetra, 28.96 2.62 16.40 5.47 0.74 1.73 11.38 0.00 97.29 Barite RS75 R I tetra 23.88 0.04 14.73 0,01 19.44 0.00 19.50 17.60 95.20 Detection Limit 0.06 0.12 0.08 0.04 0.10 0.23
Appendix 3.9: Microprobe Electrum Analysis
Description Size (jL) Ag (wt%) Au (wt%) Hg(wt%)
Grain 1 Barite-core 12.5 45.42 47.22 7.35 Grain I Barite-rim 12.5 42.77 47.4 9.84 Grain I Barite-core 12.5 34.04 60.19 5.76 Grain 2 9.5 19.12 80.51 0.37 Grain 3 5.5 20.23 78.99 0.78 Grain 4 4.5 20.38 79.44 0.18 GrainS 4.5 9.84 89.85 0.31 Grain 6 10.5 21.49 78.27 0.24 Grain 8 3 9.84 90.17 b.d. Grain 9 2 20.91 79 b.d. Grain 10 6 21.55 78.45 b.d. Grain 10 6 21.3 78.7 b.d. Grain ll· rim 25 19.09 80.7 0.21 Grain ll· core 25 19.24 80.39 0.37 Grain ll- rim 25 19.04 80.82 0.13 Grain 12 7 9.83 90.18 b.d. Grain 13-rim 20 19.18 80.61 0.21 Grain 13- core 20 18.86 81.01 0.13 Grain 13- rim 20 19.27 80.5 0.23 Grain 15 Barite 6.5 53.33 38.98 7.68 Grain 16 5 21.08 77.77 1.15 Grain 17 6 10.59 89.41 b.d.
°b.d. below detection

----
·
I

Appendix 4.1: Barite Cap - Sulphur isotope sample descripitions, sample locations and 034s values.
Sample No. DescripLion
RSOOl contact between barite and EMS�
RS008 fragmental barite with recrystallized�
galena between fragments�
RSI0 small acicular barite needles�
RS11 fme grained banded barite� -..... RS12 pyrite, barite vein in massive barite
RS14 fragmental barite laths in barite matrix
RS15 fine grained massive barite close to HVS
RS17 siliceous cutLing massive barite
RS18B barite lath in fine grained barite malrix
RS18C fme grained barite malrix
RS19� massive fine grained barite with silica
cavity infilIings
RS20� massive fme grained barite near GSP contact
RS22 small barite acicular needles in barite
RS25 fragmental BMS with framboidal pyrite in
fme grained massive barite
RS26� barite laths in fine grained pyrite matrix
RS27 fme grained barite in BMS/Ba
RS29 barite in earbonale!BMS fragmental
RS35 fme grained barite with coarse py and sph
RS55 banded pyrite and barite
RS70 acicular barite near BMSIBa contact
RS73 banded barite and sulphides
RS76 pyrite vein crosscutLing massive barite
RS80 BaiBMS fine grained barite matrix with
recrystallized galena and zoned sphalerite
RS81 wned sphalerite in Ba/BMS matrix
RS82 BMS with coarse galena and sphalerite
RS83 contact between fine grained massive barite
and coarse sphalerile!galena BMS
RS93 fme grained banded barite�
RS94 contact between massive Ba/EMS�
RSI0l barite veins (0.5mm) cutLing BMS�
RS200 south end fragmental barite
RS219 barite grain rimmed by pyrite in massive
fme grained barite
RS223 barite vein cutling massive barite
RS22S fIDe grained fragmental barite with GSP
RS450E pyrite vein in massive barite�
7375SDA barite veining in BMS - centre of vein�
7482WXC65 massive interlocking barite - no sulphides�
7377SD5A barite vein in EMS -centre of vein�
7377SD5B barite vein in BMS -outer part of vein�
·U/G ~ Underground Sample
Bl-IID
HL386
HL324
I-ll.413
I-ll.413
I-ll.413
I-ll.413
I-ll.417
HL414
I-ll.414
I-ll.414
I-ll.414
I-ll.414
I-ll.414
HL414
HL410
HL410
I-ll.410
I-ll.410
I-ll.410
I-ll.452
HL364
HL625
HL366
HL366
HL366
HL366
HL366
HL366
HL366
HL366
HL610
HL610
HL326
HL678
HL649
HL522
HL597
U/G·
U/G·
U/G·
UtG·
U/G·
DEPnI
55.8
123.5
106.5�
115.5� 118.5�
134.6�
72.5�
119�
127.1
127.1
136.3
134.7
148.8
105.1
118.5
115.9
141.2
102.8
168.8
85.5
160.5
162.9
168.4
169�
176.1�
177.8�
109.5�
110�
132.8�
164.9�
66.4�
103.5�
63.3�
495 Level�
495 Level�
495 Level�
495 Level�
495 Level�
NORTIIING
10670�
10710�
10633�
10633�
10633�
10634�
10629�
10632�
10632�
10632�
10632�
10632�
10632�
10649�
10649�
10649�
10648�
10612�
10752�
10285�
10746�
10746�
10746�
10746�
10746�
10746�
10316�
10316�
10804�
10201�
10489�
10352�
10529�
10730�
10730�
10715�
10715�
EASTING
5679�
5783�
5727�
5728�
5729�
5731�
5686�
5718�
5719�
5719�
5719�
5719�
5720�
5719�
" 5719�
5719�
5719�
5710�
5767�
5664�
5755�
5756�
5757�
5757�
5757�
5759�
5637�
5636�
5772�
5587�
5699�
5690�
5708�
5755�
5755�
5755�
5755�
Averal!e
d34S value (%0)
Baritel Pvritel SPhaleritel Galena
424 9.9
26:0 7.1
43.7
45.4 7.6 40.7 10.3 40.8
36.0
37.6 11�
37.8
36.6
34.0
39.5
38.2
37.9 8.1
44:9
46.0 6.5
33.5
43.4 8.1 7.9
7.9
39.8 9.9
16.1
10.7
39.6
7.5
8.2 6.8
42.4 7.6 6.4
35.3 6.6
35.2 6.1
8.7
41.8
38.2
43.7
41.9
14.6
44.0
37.6
41.5
42.0
39.6 9.7 7.5 6.8
; \

Appendix 4.2: Siliceous Cap - Sulphur isotope sample descripirlons, sample
locations and 834S values.
034S value ('fo.l Sample No. Descriplion Bllm DEP'm NORll lINO EASTlNO
Barite I Pvrile ISph.lerite IGalena
RSOO6 fine grained pyrite in siliceous chen 1Il.324 52.5 10712 5745 9
RSOO7 rounded pyrite grain (2cm) in asp 1ll.324 49.1 10712 5743 8.7
RS13 bmtc crynalii in a 5i1iceou5 vein 11L413 130.1 10633 5731 47.3
RS21 colloform pyrite with" .phalerite in asp IllA 14 140.7 10632 5719 32.2 10.4
RSJ2 framboidal pyrite in OSPlBa , 11L452 91.3 10612 5709 49.6 9.5
RS42 collofonn pyrile nodule in asp lD...7.95 163 10814 5789 36.9
RS43 large (2cm) rounded pyrite grain in asp HL295 165.3 10814 5790 23
RS44 low iron sphalerite in siliceous maarix HU95 168.6 10814 5791 8.3
RS57 balite veining in asp & framboidal pyriLC 11l.364 180.4 10752 5770 43.4 8.2
RS63 rounded b.rite and pyrite in asp 111.315 174.9 10771 5810 46.4 9.6
RS64 pyrit.e grain in asp HL315 173.4 10771 5811 9.7
RS65 fLne grained pyrite in asp IIl.315 175.9 10771 5811 8.2
RS67 acicular needles of barite in milky chert 11I.A61 247.5 lQ.434 5685 45.0 7.8
RS69 large zoned sph.lerite in asp (Fe rich) 1lL625 81.8 10285 5665 6
RS69 large zoned sphaterite in asp (Fe poor) 1lL625 81.8 10285 5665 6.1
RS84 low irom sphalerile in silica (pyriLC poor) HL366 185.4 10746 5761 7.5
RS87 pyrite in asp IIL349 17.8 10731 5764 11.8
RS89 siliceous fragmenl in pyritic BMS 11l.349 15.3 10731 5766 12.3
RSI03 framboidal pyrit.e at edge of siliceous vein IILJ26 148.9 10804 5779 11.1
RS104 GSP with high pyrite COntenl IIL326 149.4 10804 5780 11.1 5.5
RSI05 cenlre 0 f pyrile grain in asp 11l.326 167.7 10804 5780 7.5
RSI06(i) framboidal pyrite in asp HL326 168.4 10804 5788 12.3
RSI06(ii) framboidal pyrite aggregale in asp H1.326 170.7 10804 5790 14.5
RS202 south end fragmemal OSP/Da 111.678 181.6 10202 5591 428
RS224 barite grain in asp 1IL522 109.7 10352 5686 40.8
. RS450F contacl Ba/aSP with siliceous pyrilic vein UfO· 450 Level 10730 5755 39.5 16.9
73774 intergrowths of Ba & mill:y chere UfO" 450 Level 10715 5775 38.2
Averaee 43.7 14.5 7.7 5.5
"UfG= Underground Sample
- :ndicaLCs no Au assay
f~Dpendix 4.3: Hangingwall Volcanic1astic Sequence - Sulphur isotope sample
de~.::lipitions, sample locations and ()34s values.
034S value (%.) i Sample No. Descriplion BlIID DEPTH NORTIIINO EASTINO
Barice I Pvrite ISohalerite IGalena
RS68A barit.e fragmenl in IIVS 111.625 76 10285 5667 40.64
RS68B large barite crystals forming in IIVS 111.625 76 10285 ~667 41.784
RS92 fragmental barite in HVS 111.610 107.1 10316 5637 40.675
RS229 barit.e grain close 10 HVS/Ba conlacl IILS94 85.3 10251 5647 41.084
RS230 barite fragment in HVS IILS94 88.1 10250 5645 36.509
HVS450 barite lath in fragmeDtal & pyrilic HVS UfO" 450 Level 10730 5755 40.929
Averal!e 40.3
"UfG - Underground Sample