the influence of ph on barite nucleation and growthgrupo179/pdf/ruiz agudo 2015.pdf · the...
TRANSCRIPT
Chemical Geology 391 (2015) 7–18
Contents lists available at ScienceDirect
Chemical Geology
j ourna l homepage: www.e lsev ie r .com/ locate /chemgeo
The influence of pH on barite nucleation and growth
Cristina Ruiz-Agudo a,⁎, Christine V. Putnis a, Encarnación Ruiz-Agudo b, Andrew Putnis a
a Institut für Mineralogie, University of Münster, Corrensstrasse 24, 48149 Münster, Germanyb Departament of Mineralogy and Petrology, University of Granada, Fuentenueva s/n, 18071 Granada, Spain
⁎ Corresponding author.
http://dx.doi.org/10.1016/j.chemgeo.2014.10.0230009-2541/© 2014 Elsevier B.V. All rights reserved.
a b s t r a c t
a r t i c l e i n f oArticle history:Received 29 May 2014Received in revised form 20 October 2014Accepted 23 October 2014Available online 4 November 2014
Editor: J. Fein
Keywords:Barite growthAtomic Force MicroscopyAFMpH dependence
Nanoscale Atomic ForceMicroscopy (AFM) experiments show that barite (BaSO4) growth is influenced by the pHof the growth solution. AFM observations provide evidence that growth and nucleation ratesmeasured along the[100] crystallographic direction on the initial layer grown on barite (001) natural surfaces increase at both highand low pH of the growth solutions. At alkaline pH, growth is arrested in the second and successive layers,possibly as a result of the structure distortion resulting from incorporation of foreign ions (OH− and/or CO3
2−).Macroscopic nucleation experiments also show that with increasing pH, the induction times, the precipitationrate and the interfacial tension are all reduced, consistent with nanoscale observations. Smaller particle size athigh pH provides further evidence for enhanced barium sulfate nucleation in alkali solutions. This enhancementin growth as well as in nucleation of barite at high pH could be explained by taking into account the effect ofhydroxyl ions on hydration shells of aqueous Ba2+ and SO4
2− in solution and on the barite surface. The energeticinteraction between water molecules and the barite building units is affected by the presence of OH− ions insolution. The frequency of water exchange around Ba2+ and SO4
2− could increase due to the effect of OH− ionson the structure of water and consequently promote nucleation and growth. Increased growth at low pH canbe attributed to increased Ba2+ activity with respect to SO4
2−.© 2014 Elsevier B.V. All rights reserved.
1. Introduction
Barite scale formation is a major problem in many industrialprocesses, including paper-making, chemical manufacturing, cementoperations, off-shore oil extraction, and geothermal energy production(Todd and Yuan, 1990). It is especially problematic (and costly) inoilfields due to its low solubility, resulting in solid layers of barite scalethat can block pipes and reservoir rocks, reducing the production of anoil well. Barite scale in oilfields results frommixing the injected seawa-ter containing SO4
−2 (to maintain pressure within the reservoir andtherefore increase the oil extraction) and formation of water (contain-ing Ba2+) in the reservoir.
The incorporation of trace amounts of radium (Ra2+) into barite,due to the similarity to Ba2+ in ionic radius and charge (Hanor, 2000)also leads to the problem that the scale can be radioactive (Ceccarelloet al., 2003). Depending on the location of the precipitates, the tech-niques used to remove barite scales can be “mechanical” or “chemical”treatments, the latter based on the use of chemical compounds — suchas chelating agents (commonly used diethylenetriamine pentaaceticacid, DTPA or ethylenediamine triacetic acid, EDTA) or variousinhibitors such as organophosphonates (sodium phosphonobutanetricarboxylic acid, PBTC; nitro trimethyl phosphonic acid, NTMP;methylene diphosphonic acid, MDP; hydroxyethylene diphosphonic
acid, HEDP; amino methylene phosphonic acid, AMP). The effective-ness of these compounds is pH-dependent, usually more effectiveat high pH where they are highly deprotonated (Van Rosmalen,1983). Jones et al. (2002) studied the effect of various phosphonateinhibitors on barium sulfate precipitation and they found that the bestinhibition effect of these inhibitors tested was at pH 8. Because bariumsulfate is highly insoluble (log Ksp (25 °C) = −9.96, Blount, 1977), bothchemical approaches for scale prevention involving chelation (dissolu-tion) or inhibition (control of crystal growth) have limited successand sometimes it is finally necessary to shut down the oil productionand replace the damaged pipes with the subsequent economicconsequences.
In the case of chemical treatments, unsuccessful results are also re-lated to the fact that the mechanisms of BaSO4 scale formation andthose by which the “chemical” methods could reduce or prevent it arein general poorly understood. To be able to control crystal growth, wefirst need to know how barite grows, the conditions for optimal growth,as well as any factors that inhibit or reduce its nucleation and growthto a minimum. This is a crucial first step for the development of moreeffective tools for scale prevention or removal treatments. Due tothe dependence of the effectiveness of barite scale inhibitors on pH,we consider that it is important to determine the influence of pH onbarite nucleation and growth before the performance of organicadditives as barite scale inhibitors can be fully assessed. To the best ofour knowledge there has been no previous published research on thepH dependence on the growth of barite. Dove and Czank (1995) studied
8 C. Ruiz-Agudo et al. / Chemical Geology 391 (2015) 7–18
the pH effect on the dissolution of barite but no other published studieshave been carried out on the influence of pH on barite growth ordissolution.
To unambiguously assess the role of solution pH on barite growth,other solution parameters influencing the kinetics or mechanisms ofBaSO4 formation need to be held constant. The three main solutionparameters which may affect barite growth kinetics and mechanismsare: saturation index (SI) expressed as SI = log (IAP/Ksp) where IAP ision activity product and Ksp is the solubility product; ionic strength(IS) and Ba2+ and SO4
−2 activities. All of these parameters are interrelat-ed, so that changing the pH of the growth solution alters IS, speciation,Ba2+ and SO4
−2 activities and consequently SI. Thus varying the pH ofthe experimental solution also introduces changes in the otherparameters.
The main goal of this study is to gain a better understanding of theeffect of pH on barite two-dimensional (2D) nucleation and growthand to corroborate or compare these nanoscale findings with 3D-nucleation observations. This has been done by carrying out in situAFM observations during the growth of (001) barite surfaces, turbidityand conductivity precipitation experiments aswell as calorimetricmea-surements on barite crystallization.
2. Experimental procedure
2.1. AFM experiments
AFM experiments were performed at room temperature (22 °C ±2 °C) in a fluid cell of a Digital Instruments (Bruker) Multimode AFM,Nanoscope IIIa working in contact mode. Optically clear barite singlecrystals from Arran (Scotland) were used for the experiments. Electronmicroprobe analysis of a polished section of the crystals showed nomeasurable chemical zonation and a composition of 99.7–99.5 mol%BaSO4, with minor SrSO4 and CaSO4 (up to 0.3–0.5 mol%) in solid solu-tion. The crystals were cleaved immediately before each experiment toobtain a fresh (001) surface. Growth solutions were injected into thefluid cell before each AFM scan, giving a flow rate of approximately80 ml/h. Previous results suggest that, under such flow conditions,growth is surface controlled (e.g. Kowacz and Putnis, 2008) ratherthan diffusion controlled. Images and time were continuously recordedso that it was possible to measure growth rates in different crystallo-graphic directions, using the Nanoscope software (Bruker).
BaSO4 growth solutions were prepared immediately prior to eachexperiment from stock solutions made from solids from MerckSuprapur min. 99.995% (BaCl2) and Aldrich min. 99% (Na2SO4) and de-ionized water (Milli-Q, resistivity N18.2 MΩ·cm). The pH and ionicstrength (IS) were adjusted by the addition of NaOH or HCl and NaClaqueous solutions, respectively. No attempt was made to remove CO2
from the growth solutions since PHREEQC simulations (Parkhurstand Appelo, 1999) indicated that its presence does not significantly in-fluence the saturation state of the solution with respect to bariumsulfate.
Therefore, once NaOH or HCl was added to adjust the pH of thegrowth solutions, with the consequent increase in ionic strengthand the decrease of the mean activity coefficients of aqueous Ba2+
and SO4−2, Ba2+ and SO4
−2 concentrations had to be slightly in-creased in order to keep the SI approximately constant during ourexperiments. The saturation index with respect to barite (SI) variesin all growth experiments between 0.92 and 0.94. The speciationsoftware PHREEQC (Parkhurst and Appelo, 1999) was used to calcu-late SI, IS and pH. The pH of the solutions was also confirmed with apH meter. Potential equilibration of the solutions with atmosphericCO2 was taken into account in all the PHREEQC simulations. For di-lute electrolyte solutions (IS b 0.1), the activity coefficients are de-scribed by the Debye–Hückel equation as a function of IS and theincrease in the IS results in a decrease in the activity coefficients.This directly influences the IAP and consequently the SI of the
solution. Another consequence of the variation in the solution pHis the change in concentration of different species present in solu-tionthatincludestheconcentrationofbuildingunits(Ba2+andSO4
2−) and therefore the IAP and consequently the SI. For our specif-ic case, the speciation does not vary significantly when working athigh pH solutions but in acidic solutions the [HSO4
- ] species in-creased so that at pH 2 the concentration of BaSO4 had to be signif-icantly adjusted in order to maintain the same SI as in all otherexperiments.
To checkwhether differences in IS of growth solutionswhen pHwasbeing changed were responsible for the observed change in growthrates, we performed three additional growth experiments at neutralpH inwhich NaCl was added to obtain the same IS as that of the growthsolutions of pH 2, pH 10 and pH 11 (Table 1). The SI was kept constant(0.94) and in order to achieve this, the concentration of Ba2+ and SO-4
−2
had to be slightly adjusted.All the images were analyzed using the software NanoScope 1.40
Analysis and the computer design program AUTOCAD 2013. Growthrates along the [100] direction on sector-shaped growth islands arereported as the average value determined for each experiment takenfrom at least 3–5 growth islands per scan. Errors in the measuredrateswere calculated as the standard deviation (σ) and the experimentswere repeated at least twice to ensure that errors were below 15%. Arough quantification of nucleation density was performed by countingthe number of nuclei in a given area of 5 × 5 μm after 270 s injectingsolution (Baynton et al., 2012). The induction time was determined asthe time at which the first nuclei were observed on the surface. Thecomposition of the different solutions used in AFM experiments isshown Table 1.
2.2. Nucleation experiments
The induction time for nucleation (tind) was defined as the elapsedtime between the moment at which supersaturation is reached (bymixing of BaCl2 and Na2SO4 solutions) and that atwhich a critical nucle-us is observed (Söhnel and Mullin, 1978). Our approach to measure tindwas to observe changes in various physical properties of the mixedsolution, as outlined below.
2.2.1. Turbidity experimentsIn a first set of experiments, nucleation was determined by moni-
toring the variation in solution turbidity (measured as absorbance)using UV–visible spectrophotometry. These experiments were carriedout at room temperature by mixing equal volumes (1 ml) of BaCl2and Na2SO4 solutions with different pH values (2, 6.5, 8.5, 10, 11, 12)in a fluid cell, resulting in a solution supersaturated with respect tobarium sulfate. The range of concentrations used in these experimentsvaried from 1.5 × 10⁻⁴ M to 4 × 10⁻⁴ M. The evolution of the absor-bance of the mixed solutions was monitored at 600 nm using a Cary 50UV–Vis spectrophotometer. Changes in the absorbance of the solutiondue to the precipitation of barite were used to determine the inductiontime. The induction time was determined by the intersection betweenthe line tangent to the absorbance plot in the initial stages of the ex-periment and the line corresponding to the linear increase in the ab-sorbance stage. Measurements were repeated at least 4 times toensure reproducibility of the results. After the experiments, the bariteprecipitates formed in 1.5 × 10⁻⁴ M solutions with different pH valueswere filtered (0.45 μm pore diameter), washed and then dried for 24 hat 40 °C before analysis by field emission scanning electron microscopy(Auriga Carl Zeiss SMT). This FESEMwas equipped with Energy Disper-sive X-ray analysis (EDX) that allows us to characterize the particlesobtained.
The interfacial tension between a crystalline solid and a solution ofthe dissolved solid is an important parameter to characterize crystalgrowth and nucleation processes (Nielsen and Söhnel, 1971). Accordingto the classical nucleation theory (Mullin, 1992)we can express the rate
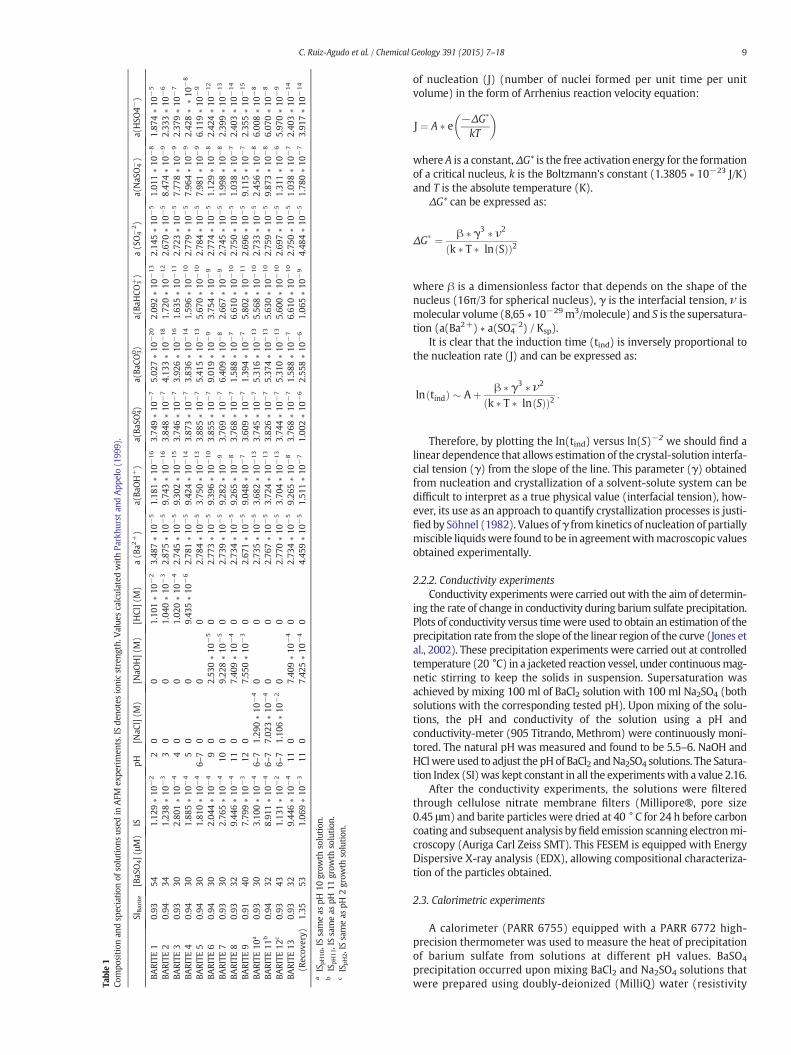
Table1
Compo
sition
andsp
eciation
ofsolution
sus
edin
AFM
expe
rimen
ts.ISde
notesionicstreng
th.V
alue
scalculated
withPa
rkhu
rsta
ndApp
elo(199
9).
SIBarite
[BaS
O4](
μM)
ISpH
[NaC
l](M
)[N
aOH](M
)[H
Cl](M
)a(B
a2+)
a(Ba
OH+)
a(Ba
SO40)
a(Ba
CO30)
a(Ba
HCO
3+)
a(SO4−
2)
a(NaS
O4−)
a(HSO
4−)
BARITE
10.93
541.12
9∗10
−2
20
01.10
1∗10
−2
3.48
7∗10
−5
1.18
1∗10
−16
3.74
9∗10
−7
5.02
7∗10
−20
2.09
2∗10
−13
2.14
5∗10
−5
1.01
1∗10
−8
1.87
4∗10
−5
BARITE
20.94
341.23
8∗10
−3
30
01.04
0∗10
−3
2.87
5∗10
−5
9.74
3∗10
−16
3.84
8∗10
−7
4.13
3∗10
−18
1.72
0∗10
−12
2.67
0∗10
−5
8.47
4∗10
−9
2.33
3∗10
−6
BARITE
30.93
302.80
1∗10
−4
40
01.02
0∗10
−4
2.74
5∗10
−5
9.30
2∗10
−15
3.74
6∗10
−7
3.92
6∗10
−16
1.63
5∗10
−11
2.72
3∗10
−5
7.77
8∗10
−9
2.37
9∗10
−7
BARITE
40.94
301.88
5∗10
−4
50
09.43
5∗10
−6
2.78
1∗10
−5
9.42
4∗10
−14
3.87
3∗10
−7
3.83
6∗10
−14
1.59
6∗10
−10
2.77
9∗10
−5
7.96
4∗10
−9
2.42
8∗
∗10
−8
BARITE
50.94
301.81
0∗10
−4
6–7
00
02.78
4∗10
−5
3.75
0∗10
−13
3.88
5∗10
−7
5.41
5∗10
−13
5.67
0∗10
−10
2.78
4∗10
−5
7.98
1∗10
−9
6.11
9∗10
−9
BARITE
60.94
302.04
4∗10
−4
90
2.53
0∗10
−5
02.77
3∗10
−5
9.39
6∗10
−10
3.85
5∗10
−7
9.01
9∗10
−9
3.75
4∗10
−9
2.77
4∗10
−5
1.12
9∗10
−8
2.42
4∗10
−12
BARITE
70.93
302.76
5∗10
−4
100
9.22
8∗10
−5
02.73
9∗10
−5
9.28
2∗10
−9
3.76
9∗10
−7
6.40
9∗10
−8
2.66
7∗10
−9
2.74
5∗10
−5
1.99
8∗10
−8
2.39
9∗10
−13
BARITE
80.93
329.44
6∗10
−4
110
7.40
9∗10
−4
02.73
4∗10
−5
9.26
5∗10
−8
3.76
8∗10
−7
1.58
8∗10
−7
6.61
0∗10
−10
2.75
0∗10
−5
1.03
8∗10
−7
2.40
3∗10
−14
BARITE
90.91
407.79
9∗10
−3
120
7.55
0∗10
−3
02.67
1∗10
−5
9.04
8∗10
−7
3.60
9∗10
−7
1.39
4∗10
−7
5.80
2∗10
−11
2.69
6∗10
−5
9.11
5∗10
−7
2.35
5∗10
−15
BARITE
10a
0.93
303.10
0∗10
−4
6–7
1.29
0∗10
−4
00
2.73
5∗10
−5
3.68
2∗10
−13
3.74
5∗10
−7
5.31
6∗10
−13
5.56
8∗10
−10
2.73
3∗10
−5
2.45
6∗10
−8
6.00
8∗10
−8
BARITE
11b
0.94
328.91
1∗10
−4
6–7
7.02
3∗10
−4
00
2.76
7∗10
−5
3.72
4∗10
−13
3.82
6∗10
−7
5.37
4∗10
−13
5.63
0∗10
−10
2.75
9∗10
−5
9.87
3∗10
−8
6.07
0∗10
−8
BARITE
12c
0.93
431.13
1∗10
−2
6–7
1.10
6∗10
−2
00
2.77
0∗10
−5
3.70
4∗10
−13
3.74
4∗10
−7
5.31
0∗10
−13
5.60
0∗10
−10
2.69
7∗10
−5
1.31
1∗10
−6
5.97
0∗10
−9
BARITE
13(R
ecov
ery)
0.93
329.44
6∗10
−4
110
7.40
9∗10
−4
02.73
4∗10
−5
9.26
5∗10
−8
3.76
8∗10
−7
1.58
8∗10
−7
6.61
0∗10
−10
2.75
0∗10
−5
1.03
8∗10
−7
2.40
3∗10
−14
1.35
531.06
9∗10
−3
110
7.42
5∗10
−4
04.45
9∗10
−5
1.51
1∗10
−7
1.00
2∗10
−6
2.55
8∗10
−6
1.06
5∗10
−9
4.48
4∗10
−5
1.78
0∗10
−7
3.91
7∗10
−14
aIS
pH10,ISsameas
pH10
grow
thsolution
.b
ISpH11,ISsameas
pH11
grow
thsolution
.cIS
pH2,IS
sameas
pH2grow
thsolution
.
9C. Ruiz-Agudo et al. / Chemical Geology 391 (2015) 7–18
of nucleation (J) (number of nuclei formed per unit time per unitvolume) in the form of Arrhenius reaction velocity equation:
J ¼ A � e −ΔG�
kT
� �
where A is a constant,ΔG* is the free activation energy for the formationof a critical nucleus, k is the Boltzmann's constant (1.3805 ∗ 10−23 J/K)and T is the absolute temperature (K).
ΔG* can be expressed as:
ΔG� ¼ β � γ3 � ν2
k � T � ln Sð Þð Þ2
where β is a dimensionless factor that depends on the shape of thenucleus (16π/3 for spherical nucleus), γ is the interfacial tension, ν ismolecular volume (8,65 ∗ 10−29m3/molecule) and S is the supersatura-tion (a(Ba2+) ∗ a(SO4
−2) / Ksp).It is clear that the induction time (tind) is inversely proportional to
the nucleation rate (J) and can be expressed as:
ln tindð Þ � Aþ β � γ3 � ν2
k � T � ln Sð Þð Þ2 :
Therefore, by plotting the ln(tind) versus ln(S)−2 we should find alinear dependence that allows estimation of the crystal-solution interfa-cial tension (γ) from the slope of the line. This parameter (γ) obtainedfrom nucleation and crystallization of a solvent-solute system can bedifficult to interpret as a true physical value (interfacial tension), how-ever, its use as an approach to quantify crystallization processes is justi-fied by Söhnel (1982). Values ofγ fromkinetics of nucleation of partiallymiscible liquidswere found to be in agreementwithmacroscopic valuesobtained experimentally.
2.2.2. Conductivity experimentsConductivity experiments were carried out with the aim of determin-
ing the rate of change in conductivity during barium sulfate precipitation.Plots of conductivity versus timewere used to obtain an estimation of theprecipitation rate from the slope of the linear region of the curve (Jones etal., 2002). These precipitation experiments were carried out at controlledtemperature (20 °C) in a jacketed reaction vessel, under continuousmag-netic stirring to keep the solids in suspension. Supersaturation wasachieved by mixing 100 ml of BaCl2 solution with 100 ml Na2SO4 (bothsolutions with the corresponding tested pH). Upon mixing of the solu-tions, the pH and conductivity of the solution using a pH andconductivity-meter (905 Titrando, Methrom) were continuously moni-tored. The natural pH was measured and found to be 5.5–6. NaOH andHClwere used to adjust the pH of BaCl2 andNa2SO4 solutions. The Satura-tion Index (SI)was kept constant in all the experimentswith a value 2.16.
After the conductivity experiments, the solutions were filteredthrough cellulose nitrate membrane filters (Millipore®, pore size0.45 μm) and barite particles were dried at 40 ° C for 24 h before carboncoating and subsequent analysis byfield emission scanning electronmi-croscopy (Auriga Carl Zeiss SMT). This FESEM is equipped with EnergyDispersive X-ray analysis (EDX), allowing compositional characteriza-tion of the particles obtained.
2.3. Calorimetric experiments
A calorimeter (PARR 6755) equipped with a PARR 6772 high-precision thermometer was used to measure the heat of precipitationof barium sulfate from solutions at different pH values. BaSO4
precipitation occurred upon mixing BaCl2 and Na2SO4 solutions thatwere prepared using doubly-deionized (MilliQ) water (resistivity
10 C. Ruiz-Agudo et al. / Chemical Geology 391 (2015) 7–18
N18.2 MΩ·cm). The Dewar flask in the calorimeter was filled with100 ml of a 1.65·10−3 M Na2SO4 solution and 10 ml of 1.65·10−2 MBaCl2 solution were loaded into a glass cell sealed with a detachableTeflon dish. The glass cell was introduced in theDewarflask and rotatedby an external electric motor. As soon as the thermal equilibrium wasreached, the BaCl2 solution in the cell was poured out and the reactantswere mixed. The electric motor then stopped and the calorimeter mea-sured the change in temperature once the precipitation process hadtaken place. The solution was filtered through a 0.45 μm pore diameterfilter after each experiment and then analyzed by ICP-AES (inductivelycoupled plasma atomic emission spectroscopy) to obtain the final Ba2+
concentration. The difference in the Ba2+ concentration before and
a b c
e f g
i j k
m n o
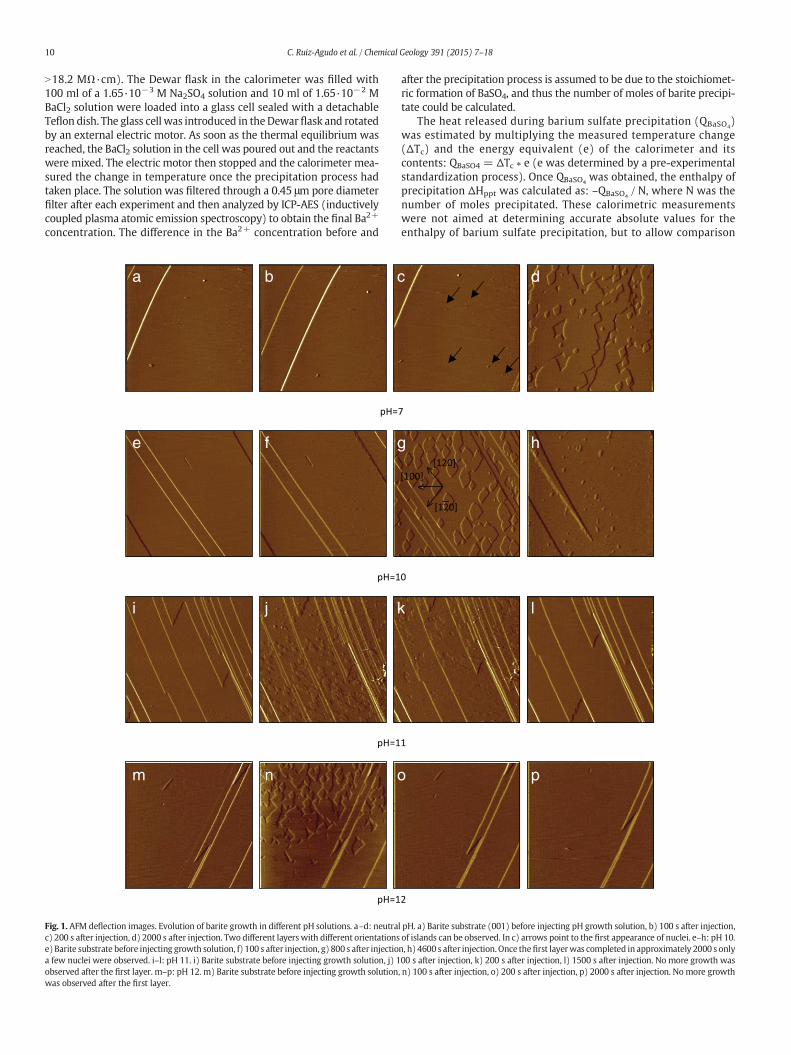
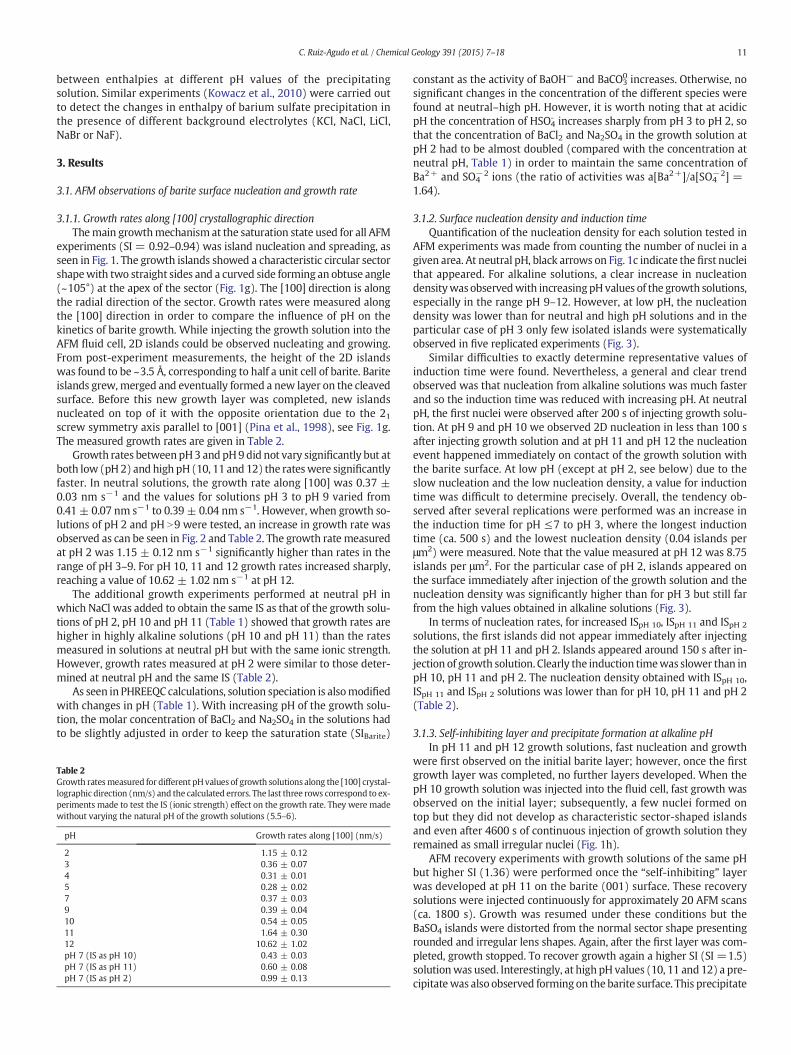
Fig. 1. AFM deflection images. Evolution of barite growth in different pH solutions. a–d: neutrac) 200 s after injection, d) 2000 s after injection. Two different layers with different orientationse) Barite substrate before injecting growth solution, f) 100 s after injection, g) 800 s after injectioa few nuclei were observed. i–l: pH 11. i) Barite substrate before injecting growth solution, j) 1observed after the first layer. m–p: pH 12. m) Barite substrate before injecting growth solutionwas observed after the first layer.
after the precipitation process is assumed to be due to the stoichiomet-ric formation of BaSO4, and thus the number of moles of barite precipi-tate could be calculated.
The heat released during barium sulfate precipitation (QBaSO4)
was estimated by multiplying the measured temperature change(ΔTc) and the energy equivalent (e) of the calorimeter and itscontents: QBaSO4 = ΔTc ∗ e (e was determined by a pre-experimentalstandardization process). Once QBaSO4
was obtained, the enthalpy ofprecipitation ΔHppt was calculated as: –QBaSO4
/ N, where N was thenumber of moles precipitated. These calorimetric measurementswere not aimed at determining accurate absolute values for theenthalpy of barium sulfate precipitation, but to allow comparison
d
h
l
p
l pH. a) Barite substrate (001) before injecting pH growth solution, b) 100 s after injection,of islands can be observed. In c) arrows point to the first appearance of nuclei. e–h: pH 10.n, h) 4600 s after injection.Once thefirst layerwas completed in approximately 2000 s only00 s after injection, k) 200 s after injection, l) 1500 s after injection. No more growth was, n) 100 s after injection, o) 200 s after injection, p) 2000 s after injection. Nomore growth
11C. Ruiz-Agudo et al. / Chemical Geology 391 (2015) 7–18
between enthalpies at different pH values of the precipitatingsolution. Similar experiments (Kowacz et al., 2010) were carried outto detect the changes in enthalpy of barium sulfate precipitation inthe presence of different background electrolytes (KCl, NaCl, LiCl,NaBr or NaF).
3. Results
3.1. AFM observations of barite surface nucleation and growth rate
3.1.1. Growth rates along [100] crystallographic directionThemain growthmechanism at the saturation state used for all AFM
experiments (SI = 0.92–0.94) was island nucleation and spreading, asseen in Fig. 1. The growth islands showed a characteristic circular sectorshapewith two straight sides and a curved side forming an obtuse angle(~105°) at the apex of the sector (Fig. 1g). The [100] direction is alongthe radial direction of the sector. Growth rates were measured alongthe [100] direction in order to compare the influence of pH on thekinetics of barite growth. While injecting the growth solution into theAFM fluid cell, 2D islands could be observed nucleating and growing.From post-experiment measurements, the height of the 2D islandswas found to be ~3.5 Å, corresponding to half a unit cell of barite. Bariteislands grew,merged and eventually formed a new layer on the cleavedsurface. Before this new growth layer was completed, new islandsnucleated on top of it with the opposite orientation due to the 21screw symmetry axis parallel to [001] (Pina et al., 1998), see Fig. 1g.The measured growth rates are given in Table 2.
Growth rates betweenpH3 and pH9 did not vary significantly but atboth low (pH2) and high pH (10, 11 and 12) the rateswere significantlyfaster. In neutral solutions, the growth rate along [100] was 0.37 ±0.03 nm s−1 and the values for solutions pH 3 to pH 9 varied from0.41 ± 0.07 nm s−1 to 0.39 ± 0.04 nm s−1. However, when growth so-lutions of pH 2 and pH N9 were tested, an increase in growth rate wasobserved as can be seen in Fig. 2 and Table 2. The growth rate measuredat pH 2 was 1.15 ± 0.12 nm s−1 significantly higher than rates in therange of pH 3–9. For pH 10, 11 and 12 growth rates increased sharply,reaching a value of 10.62 ± 1.02 nm s−1 at pH 12.
The additional growth experiments performed at neutral pH inwhich NaCl was added to obtain the same IS as that of the growth solu-tions of pH 2, pH 10 and pH 11 (Table 1) showed that growth rates arehigher in highly alkaline solutions (pH 10 and pH 11) than the ratesmeasured in solutions at neutral pH but with the same ionic strength.However, growth rates measured at pH 2 were similar to those deter-mined at neutral pH and the same IS (Table 2).
As seen in PHREEQC calculations, solution speciation is alsomodifiedwith changes in pH (Table 1). With increasing pH of the growth solu-tion, the molar concentration of BaCl2 and Na2SO4 in the solutions hadto be slightly adjusted in order to keep the saturation state (SIBarite)
Table 2Growth ratesmeasured for different pHvalues of growth solutions along the [100] crystal-lographic direction (nm/s) and the calculated errors. The last three rows correspond to ex-periments made to test the IS (ionic strength) effect on the growth rate. They were madewithout varying the natural pH of the growth solutions (5.5–6).
pH Growth rates along [100] (nm/s)
2 1.15 ± 0.123 0.36 ± 0.074 0.31 ± 0.015 0.28 ± 0.027 0.37 ± 0.039 0.39 ± 0.0410 0.54 ± 0.0511 1.64 ± 0.3012 10.62 ± 1.02pH 7 (IS as pH 10) 0.43 ± 0.03pH 7 (IS as pH 11) 0.60 ± 0.08pH 7 (IS as pH 2) 0.99 ± 0.13
constant as the activity of BaOH− and BaCO30 increases. Otherwise, no
significant changes in the concentration of the different species werefound at neutral–high pH. However, it is worth noting that at acidicpH the concentration of HSO4
- increases sharply from pH 3 to pH 2, sothat the concentration of BaCl2 and Na2SO4 in the growth solution atpH 2 had to be almost doubled (compared with the concentration atneutral pH, Table 1) in order to maintain the same concentration ofBa2+ and SO4
−2 ions (the ratio of activities was a[Ba2+]/a[SO4−2] =
1.64).
3.1.2. Surface nucleation density and induction timeQuantification of the nucleation density for each solution tested in
AFM experiments was made from counting the number of nuclei in agiven area. At neutral pH, black arrows on Fig. 1c indicate the first nucleithat appeared. For alkaline solutions, a clear increase in nucleationdensitywas observedwith increasingpH values of the growth solutions,especially in the range pH 9–12. However, at low pH, the nucleationdensity was lower than for neutral and high pH solutions and in theparticular case of pH 3 only few isolated islands were systematicallyobserved in five replicated experiments (Fig. 3).
Similar difficulties to exactly determine representative values ofinduction time were found. Nevertheless, a general and clear trendobserved was that nucleation from alkaline solutions was much fasterand so the induction time was reduced with increasing pH. At neutralpH, the first nuclei were observed after 200 s of injecting growth solu-tion. At pH 9 and pH 10 we observed 2D nucleation in less than 100 safter injecting growth solution and at pH 11 and pH 12 the nucleationevent happened immediately on contact of the growth solution withthe barite surface. At low pH (except at pH 2, see below) due to theslow nucleation and the low nucleation density, a value for inductiontime was difficult to determine precisely. Overall, the tendency ob-served after several replications were performed was an increase inthe induction time for pH ≤7 to pH 3, where the longest inductiontime (ca. 500 s) and the lowest nucleation density (0.04 islands perμm2) were measured. Note that the value measured at pH 12 was 8.75islands per μm2. For the particular case of pH 2, islands appeared onthe surface immediately after injection of the growth solution and thenucleation density was significantly higher than for pH 3 but still farfrom the high values obtained in alkaline solutions (Fig. 3).
In terms of nucleation rates, for increased ISpH 10, ISpH 11 and ISpH 2
solutions, the first islands did not appear immediately after injectingthe solution at pH 11 and pH 2. Islands appeared around 150 s after in-jection of growth solution. Clearly the induction timewas slower than inpH 10, pH 11 and pH 2. The nucleation density obtained with ISpH 10,ISpH 11 and ISpH 2 solutions was lower than for pH 10, pH 11 and pH 2(Table 2).
3.1.3. Self-inhibiting layer and precipitate formation at alkaline pHIn pH 11 and pH 12 growth solutions, fast nucleation and growth
were first observed on the initial barite layer; however, once the firstgrowth layer was completed, no further layers developed. When thepH 10 growth solution was injected into the fluid cell, fast growth wasobserved on the initial layer; subsequently, a few nuclei formed ontop but they did not develop as characteristic sector-shaped islandsand even after 4600 s of continuous injection of growth solution theyremained as small irregular nuclei (Fig. 1h).
AFM recovery experiments with growth solutions of the same pHbut higher SI (1.36) were performed once the “self-inhibiting” layerwas developed at pH 11 on the barite (001) surface. These recoverysolutions were injected continuously for approximately 20 AFM scans(ca. 1800 s). Growth was resumed under these conditions but theBaSO4 islands were distorted from the normal sector shape presentingrounded and irregular lens shapes. Again, after the first layer was com-pleted, growth stopped. To recover growth again a higher SI (SI =1.5)solutionwas used. Interestingly, at high pH values (10, 11 and 12) a pre-cipitatewas also observed forming on the barite surface. This precipitate
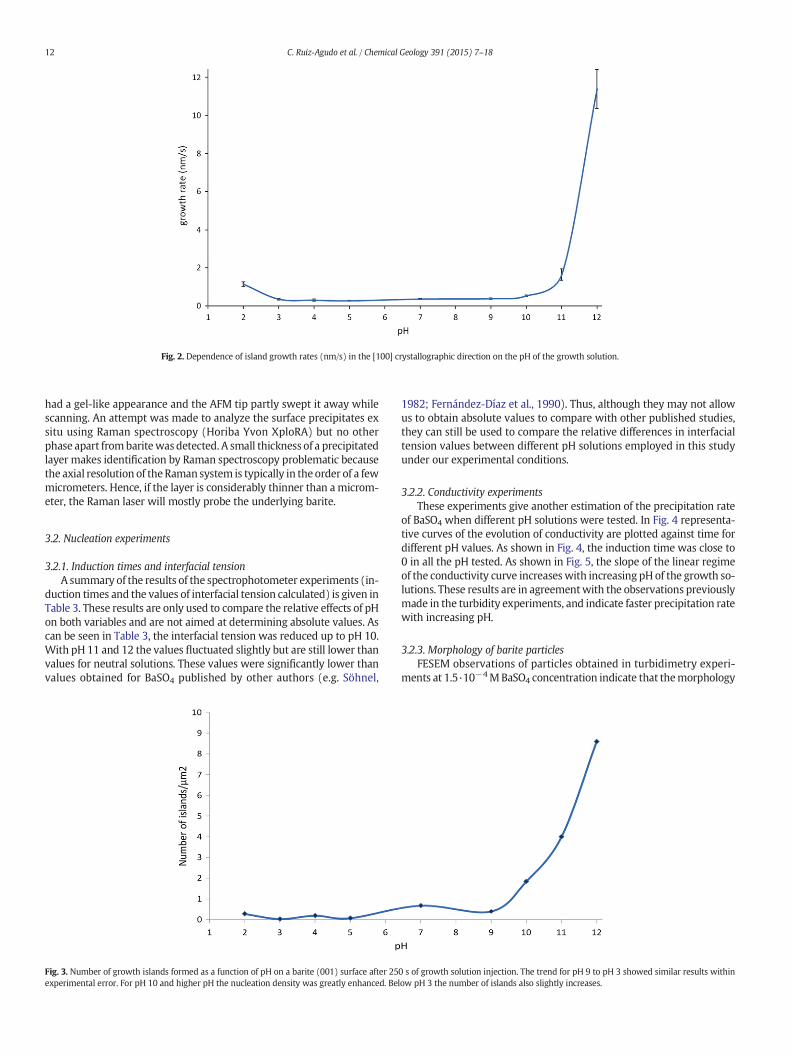
Fig. 2. Dependence of island growth rates (nm/s) in the [100] crystallographic direction on the pH of the growth solution.
12 C. Ruiz-Agudo et al. / Chemical Geology 391 (2015) 7–18
had a gel-like appearance and the AFM tip partly swept it away whilescanning. An attempt was made to analyze the surface precipitates exsitu using Raman spectroscopy (Horiba Yvon XploRA) but no otherphase apart frombaritewasdetected. A small thickness of a precipitatedlayer makes identification by Raman spectroscopy problematic becausethe axial resolution of theRaman system is typically in the order of a fewmicrometers. Hence, if the layer is considerably thinner than amicrom-eter, the Raman laser will mostly probe the underlying barite.
3.2. Nucleation experiments
3.2.1. Induction times and interfacial tensionA summary of the results of the spectrophotometer experiments (in-
duction times and the values of interfacial tension calculated) is given inTable 3. These results are only used to compare the relative effects of pHon both variables and are not aimed at determining absolute values. Ascan be seen in Table 3, the interfacial tension was reduced up to pH 10.With pH 11 and 12 the values fluctuated slightly but are still lower thanvalues for neutral solutions. These values were significantly lower thanvalues obtained for BaSO4 published by other authors (e.g. Söhnel,
Fig. 3. Number of growth islands formed as a function of pH on a barite (001) surface after 25experimental error. For pH 10 and higher pH the nucleation density was greatly enhanced. Bel
1982; Fernández-Díaz et al., 1990). Thus, although they may not allowus to obtain absolute values to compare with other published studies,they can still be used to compare the relative differences in interfacialtension values between different pH solutions employed in this studyunder our experimental conditions.
3.2.2. Conductivity experimentsThese experiments give another estimation of the precipitation rate
of BaSO4 when different pH solutions were tested. In Fig. 4 representa-tive curves of the evolution of conductivity are plotted against time fordifferent pH values. As shown in Fig. 4, the induction time was close to0 in all the pH tested. As shown in Fig. 5, the slope of the linear regimeof the conductivity curve increaseswith increasing pH of the growth so-lutions. These results are in agreementwith the observations previouslymade in the turbidity experiments, and indicate faster precipitation ratewith increasing pH.
3.2.3. Morphology of barite particlesFESEM observations of particles obtained in turbidimetry experi-
ments at 1.5·10−4MBaSO4 concentration indicate that themorphology
0 s of growth solution injection. The trend for pH 9 to pH 3 showed similar results withinow pH 3 the number of islands also slightly increases.
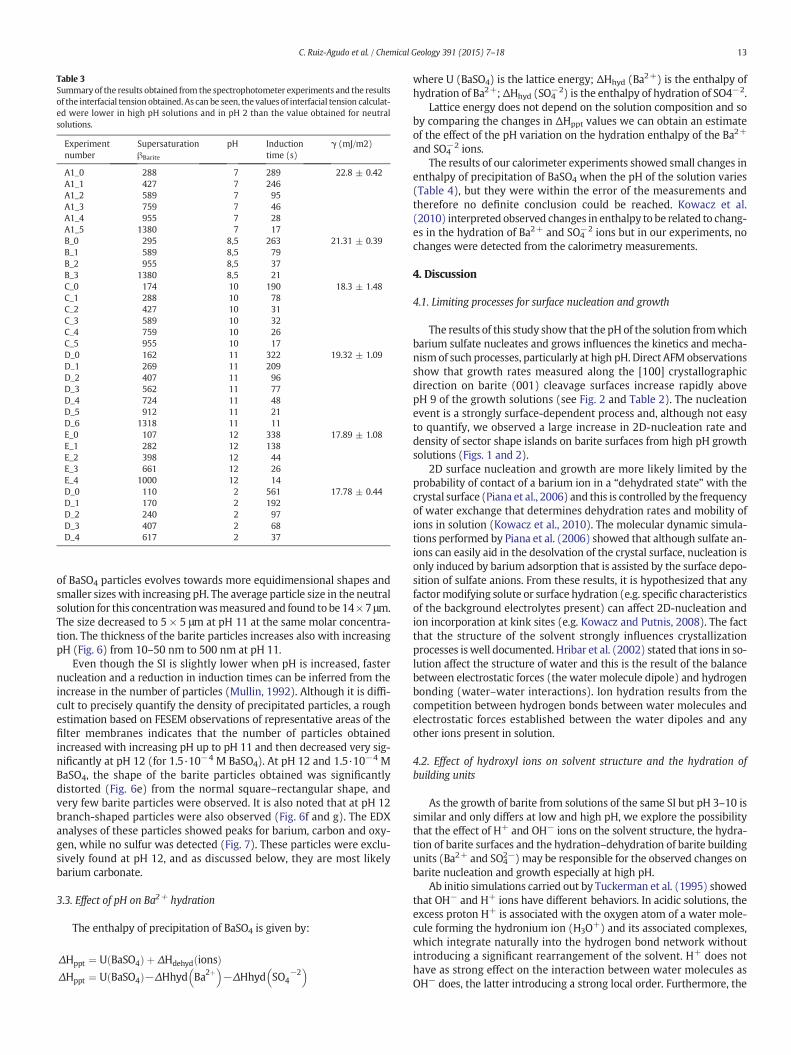
Table 3Summary of the results obtained from the spectrophotometer experiments and the resultsof the interfacial tension obtained. As can be seen, the values of interfacial tension calculat-ed were lower in high pH solutions and in pH 2 than the value obtained for neutralsolutions.
Experimentnumber
SupersaturationβBarite
pH Inductiontime (s)
γ (mJ/m2)
A1_0 288 7 289 22.8 ± 0.42A1_1 427 7 246A1_2 589 7 95A1_3 759 7 46A1_4 955 7 28A1_5 1380 7 17B_0 295 8,5 263 21.31 ± 0.39B_1 589 8,5 79B_2 955 8,5 37B_3 1380 8,5 21C_0 174 10 190 18.3 ± 1.48C_1 288 10 78C_2 427 10 31C_3 589 10 32C_4 759 10 26C_5 955 10 17D_0 162 11 322 19.32 ± 1.09D_1 269 11 209D_2 407 11 96D_3 562 11 77D_4 724 11 48D_5 912 11 21D_6 1318 11 11E_0 107 12 338 17.89 ± 1.08E_1 282 12 138E_2 398 12 44E_3 661 12 26E_4 1000 12 14D_0 110 2 561 17.78 ± 0.44D_1 170 2 192D_2 240 2 97D_3 407 2 68D_4 617 2 37
13C. Ruiz-Agudo et al. / Chemical Geology 391 (2015) 7–18
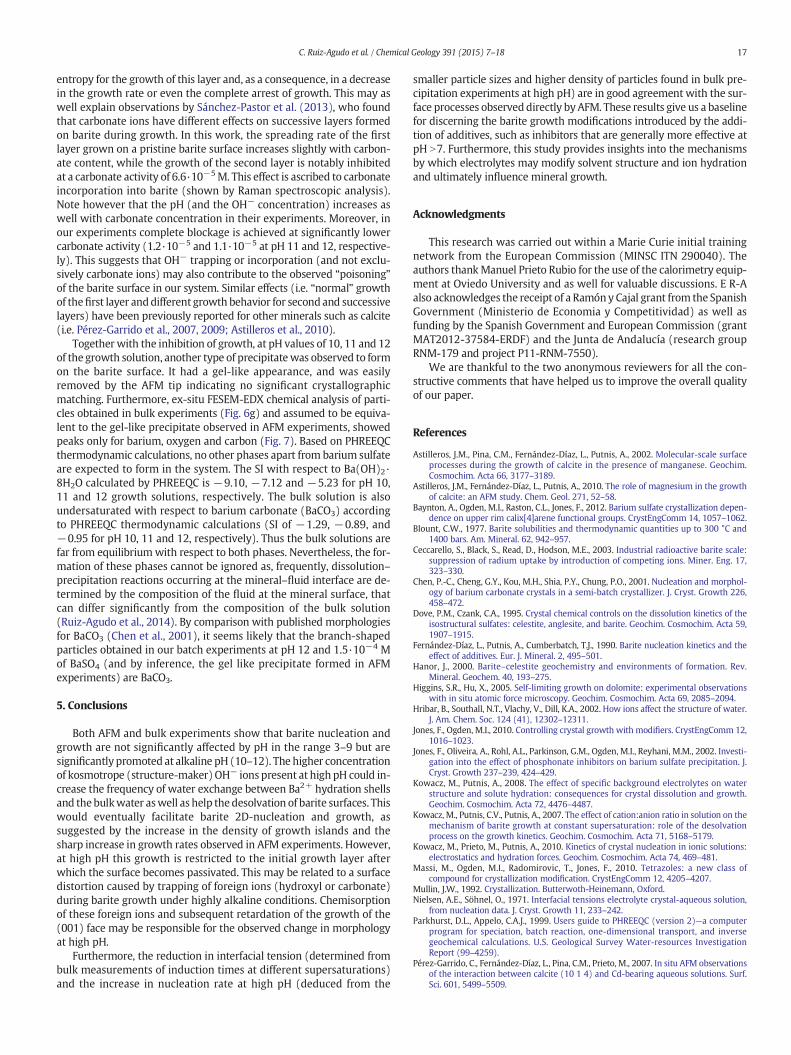
of BaSO4 particles evolves towards more equidimensional shapes andsmaller sizes with increasing pH. The average particle size in the neutralsolution for this concentrationwasmeasured and found to be 14×7 μm.The size decreased to 5 × 5 μm at pH 11 at the same molar concentra-tion. The thickness of the barite particles increases also with increasingpH (Fig. 6) from 10–50 nm to 500 nm at pH 11.
Even though the SI is slightly lower when pH is increased, fasternucleation and a reduction in induction times can be inferred from theincrease in the number of particles (Mullin, 1992). Although it is diffi-cult to precisely quantify the density of precipitated particles, a roughestimation based on FESEM observations of representative areas of thefilter membranes indicates that the number of particles obtainedincreased with increasing pH up to pH 11 and then decreased very sig-nificantly at pH 12 (for 1.5·10−4 M BaSO4). At pH 12 and 1.5·10−4 MBaSO4, the shape of the barite particles obtained was significantlydistorted (Fig. 6e) from the normal square–rectangular shape, andvery few barite particles were observed. It is also noted that at pH 12branch-shaped particles were also observed (Fig. 6f and g). The EDXanalyses of these particles showed peaks for barium, carbon and oxy-gen, while no sulfur was detected (Fig. 7). These particles were exclu-sively found at pH 12, and as discussed below, they are most likelybarium carbonate.
3.3. Effect of pH on Ba2+ hydration
The enthalpy of precipitation of BaSO4 is given by:
ΔHppt ¼ U BaSO4ð Þ þ ΔHdehyd ionsð ÞΔHppt ¼ U BaSO4ð Þ−ΔHhyd Ba2þ
� �−ΔHhyd SO4
−2� �
where U (BaSO4) is the lattice energy; ΔHhyd (Ba2+) is the enthalpy ofhydration of Ba2+;ΔHhyd (SO4
−2) is the enthalpy of hydration of SO4−2.Lattice energy does not depend on the solution composition and so
by comparing the changes in ΔHppt values we can obtain an estimateof the effect of the pH variation on the hydration enthalpy of the Ba2+
and SO4−2 ions.
The results of our calorimeter experiments showed small changes inenthalpy of precipitation of BaSO4 when the pH of the solution varies(Table 4), but they were within the error of the measurements andtherefore no definite conclusion could be reached. Kowacz et al.(2010) interpreted observed changes in enthalpy to be related to chang-es in the hydration of Ba2+ and SO4
−2 ions but in our experiments, nochanges were detected from the calorimetry measurements.
4. Discussion
4.1. Limiting processes for surface nucleation and growth
The results of this study show that the pH of the solution fromwhichbarium sulfate nucleates and grows influences the kinetics and mecha-nismof such processes, particularly at high pH. Direct AFM observationsshow that growth rates measured along the [100] crystallographicdirection on barite (001) cleavage surfaces increase rapidly abovepH 9 of the growth solutions (see Fig. 2 and Table 2). The nucleationevent is a strongly surface-dependent process and, although not easyto quantify, we observed a large increase in 2D-nucleation rate anddensity of sector shape islands on barite surfaces from high pH growthsolutions (Figs. 1 and 2).
2D surface nucleation and growth are more likely limited by theprobability of contact of a barium ion in a “dehydrated state” with thecrystal surface (Piana et al., 2006) and this is controlled by the frequencyof water exchange that determines dehydration rates and mobility ofions in solution (Kowacz et al., 2010). The molecular dynamic simula-tions performed by Piana et al. (2006) showed that although sulfate an-ions can easily aid in the desolvation of the crystal surface, nucleation isonly induced by barium adsorption that is assisted by the surface depo-sition of sulfate anions. From these results, it is hypothesized that anyfactormodifying solute or surface hydration (e.g. specific characteristicsof the background electrolytes present) can affect 2D-nucleation andion incorporation at kink sites (e.g. Kowacz and Putnis, 2008). The factthat the structure of the solvent strongly influences crystallizationprocesses is well documented. Hribar et al. (2002) stated that ions in so-lution affect the structure of water and this is the result of the balancebetween electrostatic forces (the water molecule dipole) and hydrogenbonding (water–water interactions). Ion hydration results from thecompetition between hydrogen bonds between water molecules andelectrostatic forces established between the water dipoles and anyother ions present in solution.
4.2. Effect of hydroxyl ions on solvent structure and the hydration ofbuilding units
As the growth of barite from solutions of the same SI but pH 3–10 issimilar and only differs at low and high pH, we explore the possibilitythat the effect of H+ and OH− ions on the solvent structure, the hydra-tion of barite surfaces and the hydration–dehydration of barite buildingunits (Ba2+ and SO4
2−) may be responsible for the observed changes onbarite nucleation and growth especially at high pH.
Ab initio simulations carried out by Tuckerman et al. (1995) showedthat OH− and H+ ions have different behaviors. In acidic solutions, theexcess proton H+ is associated with the oxygen atom of a water mole-cule forming the hydronium ion (H3O+) and its associated complexes,which integrate naturally into the hydrogen bond network withoutintroducing a significant rearrangement of the solvent. H+ does nothave as strong effect on the interaction between water molecules asOH− does, the latter introducing a strong local order. Furthermore, the
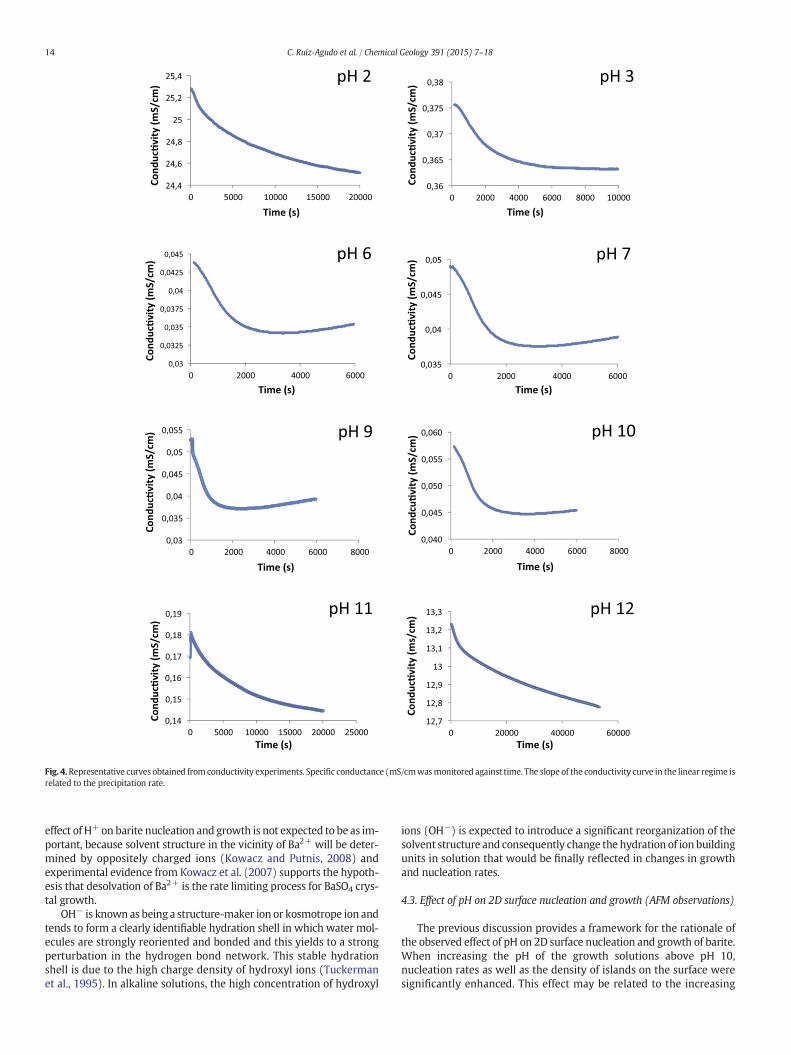
Fig. 4.Representative curves obtained from conductivity experiments. Specific conductance (mS/cmwasmonitored against time. The slope of the conductivity curve in the linear regime isrelated to the precipitation rate.
14 C. Ruiz-Agudo et al. / Chemical Geology 391 (2015) 7–18
effect of H+ on barite nucleation and growth is not expected to be as im-portant, because solvent structure in the vicinity of Ba2+ will be deter-mined by oppositely charged ions (Kowacz and Putnis, 2008) andexperimental evidence from Kowacz et al. (2007) supports the hypoth-esis that desolvation of Ba2+ is the rate limiting process for BaSO4 crys-tal growth.
OH− is known as being a structure-maker ion or kosmotrope ion andtends to form a clearly identifiable hydration shell in which water mol-ecules are strongly reoriented and bonded and this yields to a strongperturbation in the hydrogen bond network. This stable hydrationshell is due to the high charge density of hydroxyl ions (Tuckermanet al., 1995). In alkaline solutions, the high concentration of hydroxyl
ions (OH−) is expected to introduce a significant reorganization of thesolvent structure and consequently change the hydration of ion buildingunits in solution that would be finally reflected in changes in growthand nucleation rates.
4.3. Effect of pH on 2D surface nucleation and growth (AFM observations)
The previous discussion provides a framework for the rationale ofthe observed effect of pH on 2D surface nucleation and growth of barite.When increasing the pH of the growth solutions above pH 10,nucleation rates as well as the density of islands on the surface weresignificantly enhanced. This effect may be related to the increasing
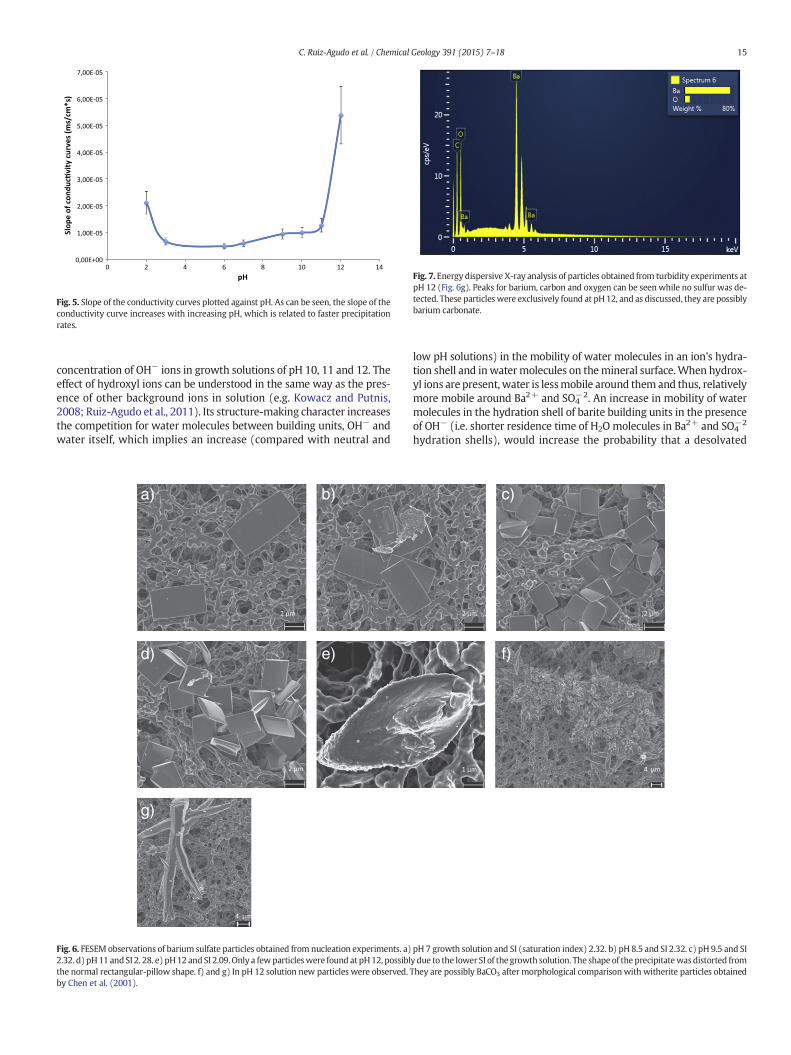
Fig. 5. Slope of the conductivity curves plotted against pH. As can be seen, the slope of theconductivity curve increases with increasing pH, which is related to faster precipitationrates.
Fig. 7. Energy dispersive X-ray analysis of particles obtained from turbidity experiments atpH 12 (Fig. 6g). Peaks for barium, carbon and oxygen can be seen while no sulfur was de-tected. These particles were exclusively found at pH12, and as discussed, they are possiblybarium carbonate.
15C. Ruiz-Agudo et al. / Chemical Geology 391 (2015) 7–18
concentration of OH− ions in growth solutions of pH 10, 11 and 12. Theeffect of hydroxyl ions can be understood in the same way as the pres-ence of other background ions in solution (e.g. Kowacz and Putnis,2008; Ruiz-Agudo et al., 2011). Its structure-making character increasesthe competition for water molecules between building units, OH− andwater itself, which implies an increase (compared with neutral and
a) b)
d)
g)
e)
Fig. 6. FESEM observations of barium sulfate particles obtained from nucleation experiments. a)2.32. d) pH11 andSI 2. 28. e) pH12 andSI 2.09.Only a fewparticleswere found atpH12, possiblthe normal rectangular-pillow shape. f) and g) In pH 12 solution new particles were observed.by Chen et al. (2001).
low pH solutions) in the mobility of water molecules in an ion's hydra-tion shell and inwatermolecules on themineral surface.When hydrox-yl ions are present, water is lessmobile around them and thus, relativelymore mobile around Ba2+ and SO4
−2. An increase in mobility of watermolecules in the hydration shell of barite building units in the presenceof OH− (i.e. shorter residence time of H2O molecules in Ba2+ and SO4
−2
hydration shells), would increase the probability that a desolvated
c)
f)
pH 7 growth solution and SI (saturation index) 2.32. b) pH 8.5 and SI 2.32. c) pH 9.5 and SIy due to the lower SI of the growth solution. The shape of the precipitatewasdistorted fromThey are possibly BaCO3 after morphological comparison with witherite particles obtained
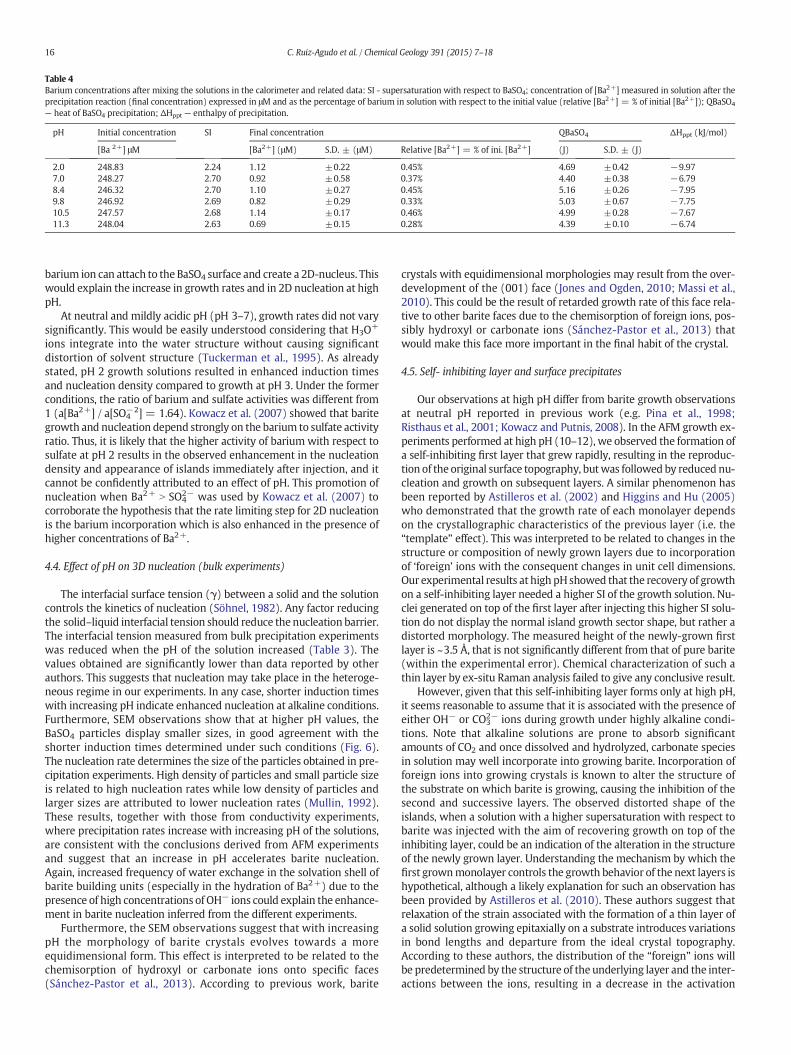
Table 4Barium concentrations after mixing the solutions in the calorimeter and related data: SI - supersaturation with respect to BaSO4; concentration of [Ba2+] measured in solution after theprecipitation reaction (final concentration) expressed in μM and as the percentage of barium in solution with respect to the initial value (relative [Ba2+] = % of initial [Ba2+]); QBaSO4
— heat of BaSO4 precipitation; ΔHppt — enthalpy of precipitation.
pH Initial concentration SI Final concentration QBaSO4 ΔHppt (kJ/mol)
[Ba 2+] μM [Ba2+] (μM) S.D. ± (μM) Relative [Ba2+] = % of ini. [Ba2+] (J) S.D. ± (J)
2.0 248.83 2.24 1.12 ±0.22 0.45% 4.69 ±0.42 −9.977.0 248.27 2.70 0.92 ±0.58 0.37% 4.40 ±0.38 −6.798.4 246.32 2.70 1.10 ±0.27 0.45% 5.16 ±0.26 −7.959.8 246.92 2.69 0.82 ±0.29 0.33% 5.03 ±0.67 −7.7510.5 247.57 2.68 1.14 ±0.17 0.46% 4.99 ±0.28 −7.6711.3 248.04 2.63 0.69 ±0.15 0.28% 4.39 ±0.10 −6.74
16 C. Ruiz-Agudo et al. / Chemical Geology 391 (2015) 7–18
barium ion can attach to the BaSO4 surface and create a 2D-nucleus. Thiswould explain the increase in growth rates and in 2D nucleation at highpH.
At neutral and mildly acidic pH (pH 3–7), growth rates did not varysignificantly. This would be easily understood considering that H3O+
ions integrate into the water structure without causing significantdistortion of solvent structure (Tuckerman et al., 1995). As alreadystated, pH 2 growth solutions resulted in enhanced induction timesand nucleation density compared to growth at pH 3. Under the formerconditions, the ratio of barium and sulfate activities was different from1 (a[Ba2+] / a[SO4
−2] = 1.64). Kowacz et al. (2007) showed that baritegrowth and nucleation depend strongly on the barium to sulfate activityratio. Thus, it is likely that the higher activity of barium with respect tosulfate at pH 2 results in the observed enhancement in the nucleationdensity and appearance of islands immediately after injection, and itcannot be confidently attributed to an effect of pH. This promotion ofnucleation when Ba2+ N SO4
2− was used by Kowacz et al. (2007) tocorroborate the hypothesis that the rate limiting step for 2D nucleationis the barium incorporation which is also enhanced in the presence ofhigher concentrations of Ba2+.
4.4. Effect of pH on 3D nucleation (bulk experiments)
The interfacial surface tension (γ) between a solid and the solutioncontrols the kinetics of nucleation (Söhnel, 1982). Any factor reducingthe solid–liquid interfacial tension should reduce the nucleation barrier.The interfacial tension measured from bulk precipitation experimentswas reduced when the pH of the solution increased (Table 3). Thevalues obtained are significantly lower than data reported by otherauthors. This suggests that nucleation may take place in the heteroge-neous regime in our experiments. In any case, shorter induction timeswith increasing pH indicate enhanced nucleation at alkaline conditions.Furthermore, SEM observations show that at higher pH values, theBaSO4 particles display smaller sizes, in good agreement with theshorter induction times determined under such conditions (Fig. 6).The nucleation rate determines the size of the particles obtained in pre-cipitation experiments. High density of particles and small particle sizeis related to high nucleation rates while low density of particles andlarger sizes are attributed to lower nucleation rates (Mullin, 1992).These results, together with those from conductivity experiments,where precipitation rates increase with increasing pH of the solutions,are consistent with the conclusions derived from AFM experimentsand suggest that an increase in pH accelerates barite nucleation.Again, increased frequency of water exchange in the solvation shell ofbarite building units (especially in the hydration of Ba2+) due to thepresence of high concentrations of OH− ions could explain the enhance-ment in barite nucleation inferred from the different experiments.
Furthermore, the SEM observations suggest that with increasingpH the morphology of barite crystals evolves towards a moreequidimensional form. This effect is interpreted to be related to thechemisorption of hydroxyl or carbonate ions onto specific faces(Sánchez-Pastor et al., 2013). According to previous work, barite
crystals with equidimensional morphologies may result from the over-development of the (001) face (Jones and Ogden, 2010; Massi et al.,2010). This could be the result of retarded growth rate of this face rela-tive to other barite faces due to the chemisorption of foreign ions, pos-sibly hydroxyl or carbonate ions (Sánchez-Pastor et al., 2013) thatwould make this face more important in the final habit of the crystal.
4.5. Self- inhibiting layer and surface precipitates
Our observations at high pH differ from barite growth observationsat neutral pH reported in previous work (e.g. Pina et al., 1998;Risthaus et al., 2001; Kowacz and Putnis, 2008). In the AFM growth ex-periments performed at high pH (10–12), we observed the formation ofa self-inhibiting first layer that grew rapidly, resulting in the reproduc-tion of the original surface topography, butwas followed by reduced nu-cleation and growth on subsequent layers. A similar phenomenon hasbeen reported by Astilleros et al. (2002) and Higgins and Hu (2005)who demonstrated that the growth rate of each monolayer dependson the crystallographic characteristics of the previous layer (i.e. the“template” effect). This was interpreted to be related to changes in thestructure or composition of newly grown layers due to incorporationof ‘foreign’ ions with the consequent changes in unit cell dimensions.Our experimental results at high pHshowed that the recovery of growthon a self-inhibiting layer needed a higher SI of the growth solution. Nu-clei generated on top of the first layer after injecting this higher SI solu-tion do not display the normal island growth sector shape, but rather adistorted morphology. The measured height of the newly-grown firstlayer is ~3.5 Å, that is not significantly different from that of pure barite(within the experimental error). Chemical characterization of such athin layer by ex-situ Raman analysis failed to give any conclusive result.
However, given that this self-inhibiting layer forms only at high pH,it seems reasonable to assume that it is associated with the presence ofeither OH− or CO3
2− ions during growth under highly alkaline condi-tions. Note that alkaline solutions are prone to absorb significantamounts of CO2 and once dissolved and hydrolyzed, carbonate speciesin solution may well incorporate into growing barite. Incorporation offoreign ions into growing crystals is known to alter the structure ofthe substrate on which barite is growing, causing the inhibition of thesecond and successive layers. The observed distorted shape of theislands, when a solution with a higher supersaturation with respect tobarite was injected with the aim of recovering growth on top of theinhibiting layer, could be an indication of the alteration in the structureof the newly grown layer. Understanding the mechanism by which thefirst grownmonolayer controls the growth behavior of the next layers ishypothetical, although a likely explanation for such an observation hasbeen provided by Astilleros et al. (2010). These authors suggest thatrelaxation of the strain associated with the formation of a thin layer ofa solid solution growing epitaxially on a substrate introduces variationsin bond lengths and departure from the ideal crystal topography.According to these authors, the distribution of the “foreign” ions willbe predetermined by the structure of the underlying layer and the inter-actions between the ions, resulting in a decrease in the activation
17C. Ruiz-Agudo et al. / Chemical Geology 391 (2015) 7–18
entropy for the growth of this layer and, as a consequence, in a decreasein the growth rate or even the complete arrest of growth. This may aswell explain observations by Sánchez-Pastor et al. (2013), who foundthat carbonate ions have different effects on successive layers formedon barite during growth. In this work, the spreading rate of the firstlayer grown on a pristine barite surface increases slightly with carbon-ate content, while the growth of the second layer is notably inhibitedat a carbonate activity of 6.6·10−5M. This effect is ascribed to carbonateincorporation into barite (shown by Raman spectroscopic analysis).Note however that the pH (and the OH− concentration) increases aswell with carbonate concentration in their experiments. Moreover, inour experiments complete blockage is achieved at significantly lowercarbonate activity (1.2·10−5 and 1.1·10−5 at pH 11 and 12, respective-ly). This suggests that OH− trapping or incorporation (and not exclu-sively carbonate ions) may also contribute to the observed “poisoning”of the barite surface in our system. Similar effects (i.e. “normal” growthof thefirst layer anddifferent growth behavior for secondand successivelayers) have been previously reported for other minerals such as calcite(i.e. Pérez-Garrido et al., 2007, 2009; Astilleros et al., 2010).
Together with the inhibition of growth, at pH values of 10, 11 and 12of the growth solution, another type of precipitatewas observed to formon the barite surface. It had a gel-like appearance, and was easilyremoved by the AFM tip indicating no significant crystallographicmatching. Furthermore, ex-situ FESEM-EDX chemical analysis of parti-cles obtained in bulk experiments (Fig. 6g) and assumed to be equiva-lent to the gel-like precipitate observed in AFM experiments, showedpeaks only for barium, oxygen and carbon (Fig. 7). Based on PHREEQCthermodynamic calculations, no other phases apart from barium sulfateare expected to form in the system. The SI with respect to Ba(OH)2·8H2O calculated by PHREEQC is −9.10, −7.12 and −5.23 for pH 10,11 and 12 growth solutions, respectively. The bulk solution is alsoundersaturated with respect to barium carbonate (BaCO3) accordingto PHREEQC thermodynamic calculations (SI of −1.29, −0.89, and−0.95 for pH 10, 11 and 12, respectively). Thus the bulk solutions arefar from equilibriumwith respect to both phases. Nevertheless, the for-mation of these phases cannot be ignored as, frequently, dissolution–precipitation reactions occurring at the mineral–fluid interface are de-termined by the composition of the fluid at the mineral surface, thatcan differ significantly from the composition of the bulk solution(Ruiz-Agudo et al., 2014). By comparison with published morphologiesfor BaCO3 (Chen et al., 2001), it seems likely that the branch-shapedparticles obtained in our batch experiments at pH 12 and 1.5·10−4 Mof BaSO4 (and by inference, the gel like precipitate formed in AFMexperiments) are BaCO3.
5. Conclusions
Both AFM and bulk experiments show that barite nucleation andgrowth are not significantly affected by pH in the range 3–9 but aresignificantly promoted at alkaline pH (10–12). The higher concentrationof kosmotrope (structure-maker)OH− ions present at high pH could in-crease the frequency of water exchange between Ba2+ hydration shellsand thebulkwater aswell as help thedesolvation of barite surfaces. Thiswould eventually facilitate barite 2D-nucleation and growth, assuggested by the increase in the density of growth islands and thesharp increase in growth rates observed in AFM experiments. However,at high pH this growth is restricted to the initial growth layer afterwhich the surface becomes passivated. This may be related to a surfacedistortion caused by trapping of foreign ions (hydroxyl or carbonate)during barite growth under highly alkaline conditions. Chemisorptionof these foreign ions and subsequent retardation of the growth of the(001) face may be responsible for the observed change in morphologyat high pH.
Furthermore, the reduction in interfacial tension (determined frombulk measurements of induction times at different supersaturations)and the increase in nucleation rate at high pH (deduced from the
smaller particle sizes and higher density of particles found in bulk pre-cipitation experiments at high pH) are in good agreement with the sur-face processes observed directly byAFM. These results give us a baselinefor discerning the barite growth modifications introduced by the addi-tion of additives, such as inhibitors that are generally more effective atpH N7. Furthermore, this study provides insights into the mechanismsby which electrolytes may modify solvent structure and ion hydrationand ultimately influence mineral growth.
Acknowledgments
This research was carried out within a Marie Curie initial trainingnetwork from the European Commission (MINSC ITN 290040). Theauthors thankManuel Prieto Rubio for the use of the calorimetry equip-ment at Oviedo University and as well for valuable discussions. E R-Aalso acknowledges the receipt of a Ramóny Cajal grant from the SpanishGovernment (Ministerio de Economia y Competitividad) as well asfunding by the Spanish Government and European Commission (grantMAT2012-37584-ERDF) and the Junta de Andalucía (research groupRNM-179 and project P11-RNM-7550).
We are thankful to the two anonymous reviewers for all the con-structive comments that have helped us to improve the overall qualityof our paper.
References
Astilleros, J.M., Pina, C.M., Fernández-Díaz, L., Putnis, A., 2002. Molecular-scale surfaceprocesses during the growth of calcite in the presence of manganese. Geochim.Cosmochim. Acta 66, 3177–3189.
Astilleros, J.M., Fernández-Díaz, L., Putnis, A., 2010. The role of magnesium in the growthof calcite: an AFM study. Chem. Geol. 271, 52–58.
Baynton, A., Ogden, M.I., Raston, C.L., Jones, F., 2012. Barium sulfate crystallization depen-dence on upper rim calix[4]arene functional groups. CrystEngComm 14, 1057–1062.
Blount, C.W., 1977. Barite solubilities and thermodynamic quantities up to 300 °C and1400 bars. Am. Mineral. 62, 942–957.
Ceccarello, S., Black, S., Read, D., Hodson, M.E., 2003. Industrial radioactive barite scale:suppression of radium uptake by introduction of competing ions. Miner. Eng. 17,323–330.
Chen, P.-C., Cheng, G.Y., Kou, M.H., Shia, P.Y., Chung, P.O., 2001. Nucleation and morphol-ogy of barium carbonate crystals in a semi-batch crystallizer. J. Cryst. Growth 226,458–472.
Dove, P.M., Czank, C.A., 1995. Crystal chemical controls on the dissolution kinetics of theisostructural sulfates: celestite, anglesite, and barite. Geochim. Cosmochim. Acta 59,1907–1915.
Fernández-Díaz, L., Putnis, A., Cumberbatch, T.J., 1990. Barite nucleation kinetics and theeffect of additives. Eur. J. Mineral. 2, 495–501.
Hanor, J., 2000. Barite–celestite geochemistry and environments of formation. Rev.Mineral. Geochem. 40, 193–275.
Higgins, S.R., Hu, X., 2005. Self-limiting growth on dolomite: experimental observationswith in situ atomic force microscopy. Geochim. Cosmochim. Acta 69, 2085–2094.
Hribar, B., Southall, N.T., Vlachy, V., Dill, K.A., 2002. How ions affect the structure of water.J. Am. Chem. Soc. 124 (41), 12302–12311.
Jones, F., Ogden, M.I., 2010. Controlling crystal growth with modifiers. CrystEngComm 12,1016–1023.
Jones, F., Oliveira, A., Rohl, A.L., Parkinson, G.M., Ogden, M.I., Reyhani, M.M., 2002. Investi-gation into the effect of phosphonate inhibitors on barium sulfate precipitation. J.Cryst. Growth 237–239, 424–429.
Kowacz, M., Putnis, A., 2008. The effect of specific background electrolytes on waterstructure and solute hydration: consequences for crystal dissolution and growth.Geochim. Cosmochim. Acta 72, 4476–4487.
Kowacz, M., Putnis, C.V., Putnis, A., 2007. The effect of cation:anion ratio in solution on themechanism of barite growth at constant supersaturation: role of the desolvationprocess on the growth kinetics. Geochim. Cosmochim. Acta 71, 5168–5179.
Kowacz, M., Prieto, M., Putnis, A., 2010. Kinetics of crystal nucleation in ionic solutions:electrostatics and hydration forces. Geochim. Cosmochim. Acta 74, 469–481.
Massi, M., Ogden, M.I., Radomirovic, T., Jones, F., 2010. Tetrazoles: a new class ofcompound for crystallization modification. CrystEngComm 12, 4205–4207.
Mullin, J.W., 1992. Crystallization. Butterwoth-Heinemann, Oxford.Nielsen, A.E., Söhnel, O., 1971. Interfacial tensions electrolyte crystal-aqueous solution,
from nucleation data. J. Cryst. Growth 11, 233–242.Parkhurst, D.L., Appelo, C.A.J., 1999. Users guide to PHREEQC (version 2)—a computer
program for speciation, batch reaction, one-dimensional transport, and inversegeochemical calculations. U.S. Geological Survey Water-resources InvestigationReport (99–4259).
Pérez-Garrido, C., Fernández-Díaz, L., Pina, C.M., Prieto, M., 2007. In situ AFM observationsof the interaction between calcite (10 1 4) and Cd-bearing aqueous solutions. Surf.Sci. 601, 5499–5509.

18 C. Ruiz-Agudo et al. / Chemical Geology 391 (2015) 7–18
Pérez-Garrido, C., Astilleros, J.M., Fernández-Díaz, L., Prieto, M., 2009. In situ AFM study ofthe interaction between calcite {l014} surface and supersaturated MnH-CO-aqueoussolutions. J. Cryst. Growth 311, 4730–4739.
Piana, S., Jones, F., Gale, J.D., 2006. Assisted desolvation as a key kinetic step for crystalgrowth. J. Am. Chem. Soc. 128, 13568–13574.
Pina, C.M., Becker, U., Risthaus, P., Bosbach, D., Putnis, A., 1998. Molecular-scale mecha-nisms of crystal growth in barite. Nature 395, 483–486.
Risthaus, P., Bosbach, D., Becker, U., Putnis, A., 2001. Barite scale formation and dissolutionat high ionic strength studied with atomic force microscopy. Colloids Surf. APhysicochem. Eng. Asp. 191, 201–214.
Ruiz-Agudo, E., Putnis, C.V., Rodríguez-Navarro, C., Putnis, A., 2011. Effect of pH on calcitegrowth at constant aCa2+/aCO3
−2 ratio and supersaturation. Geochim. Cosmochim.Acta 75, 284–296.
Ruiz-Agudo, E., Putnis, C.V., Putnis, A., 2014. Coupled dissolution and precipitationprocesses at mineral–fluid interfaces. Chem. Geol. 383, 132–146.
Sánchez-Pastor, N., Kaliwoda, M., Veintemillas-Verdaguer, S., Jordan, G., 2013. On theeffect of carbonate on barite growth at elevated temperatures. Am. Mineral. 98,1235–1240.
Söhnel, O., 1982. Electrolyte crystal—aqueous solution interfacial tensions from crystalli-zation data. J. Cryst. Growth 57, 101–108.
Söhnel, O., Mullin, J.W., 1978. A method for determination of precipitation of inductionperiods. J. Cryst. Growth 44, 377–382.
Todd, A.C., Yuan, M., 1990. Barium and strontium sulfate solid solution formation inrelation to North Sea scaling problems. SPE Prod. Eng. 5, 279–285.
Tuckerman, M., Laasonen, K., Sprik, M., 1995. Ab initio molecular dynamics simulations ofthe solvation and transport of hydronium and hydroxyl ions in water. J. Chem. Phys.103, 150–161.
Van Rosmalen, G.M., 1983. Scale prevention with special reference to thresholdtreatment. Chem. Eng. Commun. 20, 209–233.