the dimensions of the policy debate over transportation
TRANSCRIPT
ARTICLE IN PRESS
0301-4215/$ - se
doi:10.1016/j.en
�CorrespondAffairs, Kenne
Street, Cambrid
fax: +1617 496
E-mail addr
Please cite thi
Energy Policy
Energy Policy ] (]]]]) ]]]–]]]
www.elsevier.com/locate/enpol
The dimensions of the policy debate over transportation energy:The case of hydrogen in the United States
Gustavo Collantesa,b,�
aInstitute of Transportation Studies, University of California at Davis, One Shields Avenue, Davis, CA 95616, USAbKennedy School of Government, Harvard University, 79 JFK Street, Cambridge, MA 02138, USA
Received 1 September 2007; accepted 13 November 2007
Abstract
Environmental and politico-strategic concerns have driven the increase in policy activity related to energy that the United States
witnessed in the last few years. The nature of the issues at stake and the level of stakeholder involvement result in a highly complex policy
debate. The broad concern of this paper is the study of this energy-policy process and the identification of the main policy issues.
Specifically, multivariate analysis is applied to data on a wide variety of stakeholders’ policy beliefs and policy preferences to identify the
policy dimensions that characterize the debate over energy policy in the United States. The focus is on the policy debate over hydrogen as
a transportation fuel, although many results are applicable to the debate over transportation energy at large. The analysis uses a dataset
of 502 individuals from 323 different stakeholder organizations obtained via a web-based survey specifically designed for this study.
r 2007 Elsevier Ltd. All rights reserved.
Keywords: Policy process; Hydrogen; Transportation energy policy
1. Introduction
These are exciting times for everyone interested in energypolicy. Fundamental questions related to the societal andstrategic implications of the way we provide for our energyneeds have installed themselves in the policy debate in away reminiscent of the late 1980s. Thirty years ago, policyactivity on transportation energy rose driven predomi-nantly by concerns over urban ambient air quality, andresulted in such landmark statutory pieces as the 1990Clean Air Act Amendments, California’s Sher Act of 1988,and the California Low-Emission Vehicle and Clean Fuelsprogram. The dominant issue then was essentially domesticin nature. In the 21st century, and after dramaticimprovements on ambient air quality, stronger awarenessabout the finiteness of recoverable oil reserves, and the riseof a virtual consensus about the causal link from carbon
e front matter r 2007 Elsevier Ltd. All rights reserved.
pol.2007.11.020
ing author at: Belfer Center for Science and International
dy School of Government, Harvard University, 79 JFK
ge, MA 02138, USA. Tel.: +1617 496 6743;
0606.
ess: [email protected]
s article as: Collantes, G., The dimensions of the policy debate
(2008), doi:10.1016/j.enpol.2007.11.020
emissions to global climate disruption, the nature of thedominant policy issues became international.Also reminiscent of the late 1980s, much of the policy
discussion on transportation energy that we witness todayis directed to finding paths away from the status quo.Because most of the oil consumed in the majority of theindustrialized countries (with few exceptions like Canadaand Norway) comes from foreign sources—leading to asense of energy insecurity—and because every bit of carbonin petroleum fuels eventually ends up in the atmosphere,the bottom-line question has become ‘‘What is the besttrajectory toward lower reliance on oil?’’ Every stakeholderin the transportation-energy arena—including oil compa-nies—is mulling over this question.My choice of the word ‘‘trajectory’’ is not fortuitous.
Dosi (1982) defined ‘‘technological trajectory’’ as thedirection of progress within a given technological para-digm.1 Indeed, key to finding answers to the question justposed is technological progress and innovation. However,
1Dosi (1982) introduced the notion of ‘‘technological paradigm’’,
defined as ‘‘an ‘outlook’, a set of procedures, a definition of the ‘relevant’
problems and of the specific knowledge related to their solution’’ (p. 148)
over transportation energy: The case of hydrogen in the United States.

ARTICLE IN PRESS
Catalytictrends and
events
Information
G. Collantes / Energy Policy ] (]]]]) ]]]–]]]2
whenever policy elites believe that progress within thedominant technological paradigm may be insufficient tosolve the policy problem, much of the policy debate startsfocusing on paradigm shifts. In the 1990s, for instance, anew paradigm was proposed in the form of battery electricvehicles (BEVs).2 In the 2000s, the proposed new paradigmtook the form of hydrogen fuel-cell vehicles (FCVs).
While important lessons were learned during the policyprocess over BEV and FCV (Collantes, 2006), our under-standing of how radical innovations and paradigm transi-tions take place and the role of public policy in inducingthese processes is far from complete. Kemp (1997) arguedthat ‘‘what is missing in the policy debate [over a transitionaway fossil fuels] is a framework for understanding changein complex technology systems, especially how the dy-namics of technology interact with the socio-economicsystem from which it emerges’’ (p. 290). Indeed, withdebates over paradigm shifts, not only technology learningtakes place—policy learning occurs as well through thecomplex interaction of stakeholders, each of who has her/his particular set of policy preferences. This paper isconcerned with identifying the issues that define suchpolicy debates—I refer to these issues as policy dimensions.As a case study, I use the recent policy debate overhydrogen in the US, which, as I will show, yields manyresults that may be generalized to the broader debate oftransportation energy.
Typically, scholarly studies that identify the policydimensions of a particular policy process are alsoconcerned with the positions that affected stakeholderstake along each of the policy dimensions (e.g. Jenkins-Smith and St. Clair, 1993; Zafonte and Sabatier, 2004;Weible and Sabatier, 2005; Collantes, 2006). The studyherein presented covers a wider set of specific policy aspectsthan typical studies. The consequent abundance of dataand results justifies focusing this paper only on the policydimensions. I expect to discuss stakeholders’ policypreferences in a separate paper.
I structure this paper as follows. In Section 2, I describethe methodology, including a conceptual model of thepolicy process concerned with technological innovation,the data-gathering process, and methods for data analysis.In Section 3, I present and discuss my findings on the policydimensions that characterize the policy debate. In Section4, I discuss my results and draw general conclusions.
PolicyPreferences
Policy BeliefsTechnologyinnovationSocial
pressure
StrategicChoices
Technologicalprogress
2. MethodologyThe analysis presented in this paper is part of a largerproject aimed at understanding the dynamics of the policyprocess when significant technology progress is involved or
(footnote continued)
One such technological paradigm is the petroleum-fueled internal
combustion engine.2The adoption of methanol as a transportation fuel also took center
stage in the debates in Washington, DC, and California.
Please cite this article as: Collantes, G., The dimensions of the policy debate
Energy Policy (2008), doi:10.1016/j.enpol.2007.11.020
pursued. The project focuses on the adoption of hydrogenas a transportation fuel. To guide the study and theassociated data collection, the conceptual frameworkoutlined in Section 2.1 was developed. The data-gatheringprocess is described in Section 2.2, while the methods ofanalysis are detailed in Section 2.3.
2.1. Conceptual framework
Building upon existing theories of the policy processsuch as the Advocacy Coalition Framework (Sabatier,1987, 1988; Jenkins-Smith, 1988) and Multiple Streams(Kingdon, 1984; Zahariadis, 1999), theories of organiza-tion decision making such as the Garbage Can (Cohenet al., 1972; Padgett, 1980; Bendor et al., 2001; Olsen,2001), social psychology theories such as the theory ofPlanned Behavior (Fishbein and Ajzen, 1975; Ajzen andFishbein, 1980), and my own studies of the policy process(e.g. Collantes, 2006; Collantes and Sperling, 2007), Ideveloped a conceptual framework for the study of policyprocesses that involve technology innovation. The basicstructure of the framework is shown in Fig. 1.For the purpose of this paper, we need not dwell on the
specifics of the theoretical foundations of the buildingblocks of the model or on how they integrate into anexplanatory framework of the policy process. It suffices toexplain the meaning of each of the concepts comprising theconceptual model shown in Fig. 1.
2.1.1. Policy beliefs
Policy beliefs are here understood as empirical percep-tions and normative opinions about relevant policyquestions and/or policy behavior. Essentially, empiricalperceptions are subjective assessments of cause–effectrelationships. One example would be a stakeholder’sassessment of the level of abatement of anthropogenicemissions of carbon dioxide necessary to prevent severedisruptions of the global climate. Normative opinions aresubjective value assessments of policy questions and/or
Policy adoption Resources
Fig. 1. Conceptual model of policy processes involving technological
innovation.
over transportation energy: The case of hydrogen in the United States.

ARTICLE IN PRESSG. Collantes / Energy Policy ] (]]]]) ]]]–]]] 3
behavior—they relate to the question of how policy-relatedbehavior should or ought to be. Normative opinions areaffected by empirical perceptions and by the expectationsof relevant sectors of society (social pressure) weightedby the stakeholder’s motivation to comply with socialpressure.
2.1.2. Policy preferences
A policy preference is a behavioral intention and it canbe defined as the level of support that a stakeholder isready to give to a specific policy course of action. Reliablemeasures of true policy preferences are often difficult toobtain. Public statements on policy preferences can bemore reliably considered a mix of true policy preferencesand strategic behavior. In general, what a stakeholderexpresses in a public setting (public hearing, media,conference, etc.). will be the result of her true policypreferences, the coordination with policy allies, and theexpectations of the audience (e.g. peers, policy-makers,the general public, etc.) Such dissonance between trueand stated may, to some extent, apply to policy beliefsas well.
2.1.3. Social pressure
Although indicated by a single block in the schematic inFig. 1, social pressure encompasses a wide variety ofmechanisms, internal and external to the stakeholderorganization. One important form of internal socialpressure is the organization’s goals and/or interests. Tosome extent, organizations’ goals may be affected by theexpectations of their constituencies (e.g. members ofenvironmental NGOs, corporate shareholders, elected-officials’ constituents, the executive-branch office to whicha regulatory agency responds, etc.) Examples of forms ofsocial pressure external to the organization are marketdemand for consumer-good attributes and expectationsof the public opinion regarding, say, pro-environmentalbehavior.
2.1.4. Strategic choices
Stakeholders’ strategic choices are broadly defined as allstakeholders’ activities directed toward the achievement oftheir strategic goals in the policy process. These activitiescan take myriad forms, including coalition formation,lobbying, partnership building, legislation drafting, educa-tion and outreach, budget allocations, public relations,policy implementation, policy enforcement, suit filing, re-search and development, publishing in scientific journals,testifying at congressional hearings, deploying a newtechnology, colluding, etc.
Specific concepts like coalition choices (ACF) and policyentrepreneurship (Multiple Streams) are encompassed bythe broader concept of strategic choices. The inclusion ofthis concept in the model recognizes the behavioralcomplexity of the policy process, whereby multiplestrategies are often pursued, either collectively or indivi-dually. Some of such activities are difficult to operationa-
Please cite this article as: Collantes, G., The dimensions of the policy debate
Energy Policy (2008), doi:10.1016/j.enpol.2007.11.020
lize and measure, so it is often left to the researcher todecide which ones are amenable to treatment in eachparticular case.
2.1.5. Catalytic trends and events
The notion of catalytic trends/events captures theevolution of the policy problem—it denotes conditions,sometimes exogenous, that trigger, motivate, and/orprovide a rationale for policy activity. Examples includethe trend in ambient air quality, a natural disaster, achange in administration, and a disruption in energysupply. Such factors do not affect the policy processdirectly—as shown in Fig. 1, they are filtered throughinformation to then affect stakeholders’ set of beliefs.Strictly, it is not the problem per se that motivates thepolicy process, but rather the information availableabout it and the accepted information (scientific orotherwise) about the cause–effect relationship betweenthe problem and how it affects society. Catalytic events/trends provide a subset of the stakeholders with robuststorylines to ‘‘sell’’ their policy preferences to other playersin the policy subsystem (predominantly the media andpolicy-makers).
2.1.6. Technological progress and technological innovation
The ultimate variable that I am interested in modelingis technological innovation, which is here understoodas the commercial deployment of a technology soughtafter—explicitly or implicitly—by the policy process.Technological innovation is the result of a number offactors, some of which the policy process has no controlover. For example, whether and when technologies mayreach commercial maturity is, as a general rule, uncertain,often highly uncertain, and virtually always asymmetricallyuncertain.The policy process has more direct control over
technological progress, a concept here defined as themeasurable evolution of a technology toward a state ofcommercial maturity. Technological progress is fundamen-tally a function of research and development, which in turnis a function of resources—human and capital. Providedthat meaningful resources are allocated for R&D in a giventechnology, the question is not whether that technologywill undergo progress or not, but rather whether it willundergo sufficient—and sufficiently rapid—progress. Thisuncertainty is a central feature of technology-driven policyprocesses.
2.2. Data
In the context of a study of the policy process related tohydrogen as a fuel, I designed a web-based survey to collectinformation from a wide range of stakeholders. In May2005, an email was sent to a sample of about 4000individuals, from about 1450 different organizations in theUS and many other countries, inviting them to take thesurvey. The target population is the set of stakeholder
over transportation energy: The case of hydrogen in the United States.
ARTICLE IN PRESSG. Collantes / Energy Policy ] (]]]]) ]]]–]]]4
organizations that are active in the hydrogen policyprocess, most of which, it should be noted, are also activein other policy processes related to transportation energy.Details on the survey sampling scheme, respondents’characteristics, and general descriptive statistics, can befound in Collantes (2005).
The survey was designed to obtain information on thebuilding blocks of the conceptual model in Fig. 1, inaddition to respondents’ characteristics. The policy ques-tions ranged from general policy issues to technology-specific. The latter were mostly centered on hydrogen, sincethe main purpose of the study is to understand the policydebate over hydrogen—no assumption was made regardingthe pros and cons of hydrogen vis-a-vis other alternatives.The survey elicits responses in support of as well as inopposition to hydrogen.
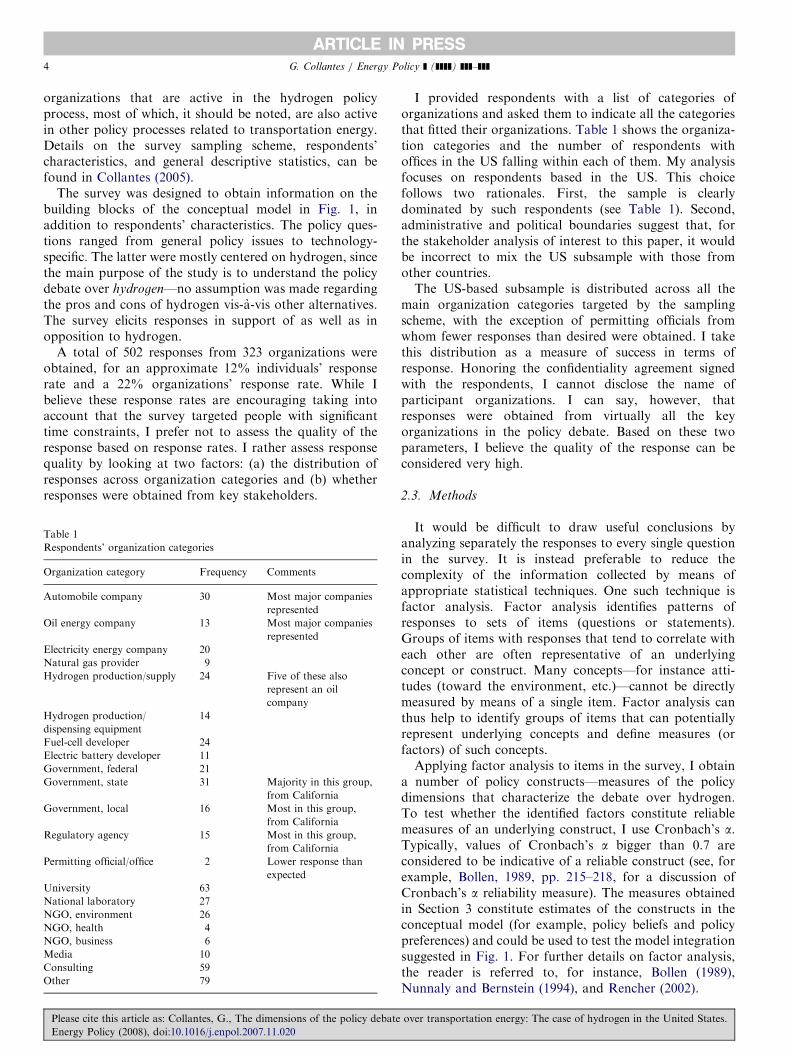
A total of 502 responses from 323 organizations wereobtained, for an approximate 12% individuals’ responserate and a 22% organizations’ response rate. While Ibelieve these response rates are encouraging taking intoaccount that the survey targeted people with significanttime constraints, I prefer not to assess the quality of theresponse based on response rates. I rather assess responsequality by looking at two factors: (a) the distribution ofresponses across organization categories and (b) whetherresponses were obtained from key stakeholders.
Table 1
Respondents’ organization categories
Organization category Frequency Comments
Automobile company 30 Most major companies
represented
Oil energy company 13 Most major companies
represented
Electricity energy company 20
Natural gas provider 9
Hydrogen production/supply 24 Five of these also
represent an oil
company
Hydrogen production/
dispensing equipment
14
Fuel-cell developer 24
Electric battery developer 11
Government, federal 21
Government, state 31 Majority in this group,
from California
Government, local 16 Most in this group,
from California
Regulatory agency 15 Most in this group,
from California
Permitting official/office 2 Lower response than
expected
University 63
National laboratory 27
NGO, environment 26
NGO, health 4
NGO, business 6
Media 10
Consulting 59
Other 79
Please cite this article as: Collantes, G., The dimensions of the policy debate
Energy Policy (2008), doi:10.1016/j.enpol.2007.11.020
I provided respondents with a list of categories oforganizations and asked them to indicate all the categoriesthat fitted their organizations. Table 1 shows the organiza-tion categories and the number of respondents withoffices in the US falling within each of them. My analysisfocuses on respondents based in the US. This choicefollows two rationales. First, the sample is clearlydominated by such respondents (see Table 1). Second,administrative and political boundaries suggest that, forthe stakeholder analysis of interest to this paper, it wouldbe incorrect to mix the US subsample with those fromother countries.The US-based subsample is distributed across all the
main organization categories targeted by the samplingscheme, with the exception of permitting officials fromwhom fewer responses than desired were obtained. I takethis distribution as a measure of success in terms ofresponse. Honoring the confidentiality agreement signedwith the respondents, I cannot disclose the name ofparticipant organizations. I can say, however, thatresponses were obtained from virtually all the keyorganizations in the policy debate. Based on these twoparameters, I believe the quality of the response can beconsidered very high.
2.3. Methods
It would be difficult to draw useful conclusions byanalyzing separately the responses to every single questionin the survey. It is instead preferable to reduce thecomplexity of the information collected by means ofappropriate statistical techniques. One such technique isfactor analysis. Factor analysis identifies patterns ofresponses to sets of items (questions or statements).Groups of items with responses that tend to correlate witheach other are often representative of an underlyingconcept or construct. Many concepts—for instance atti-tudes (toward the environment, etc.)—cannot be directlymeasured by means of a single item. Factor analysis canthus help to identify groups of items that can potentiallyrepresent underlying concepts and define measures (orfactors) of such concepts.Applying factor analysis to items in the survey, I obtain
a number of policy constructs—measures of the policydimensions that characterize the debate over hydrogen.To test whether the identified factors constitute reliablemeasures of an underlying construct, I use Cronbach’s a.Typically, values of Cronbach’s a bigger than 0.7 areconsidered to be indicative of a reliable construct (see, forexample, Bollen, 1989, pp. 215–218, for a discussion ofCronbach’s a reliability measure). The measures obtainedin Section 3 constitute estimates of the constructs in theconceptual model (for example, policy beliefs and policypreferences) and could be used to test the model integrationsuggested in Fig. 1. For further details on factor analysis,the reader is referred to, for instance, Bollen (1989),Nunnaly and Bernstein (1994), and Rencher (2002).
over transportation energy: The case of hydrogen in the United States.

ARTICLE IN PRESS
Table 2
Response frequency for influence questions
Influence question 1 ¼ ‘‘Strongly disagree’’ 2 ¼ ‘‘Disagree’’ 3 ¼ ‘‘Neutral’’ 4 ¼ ‘‘Agree’’ 5 ¼ ‘‘Strongly agree’’
A 16 48 78 142 63
B 10 24 69 144 106
G. Collantes / Energy Policy ] (]]]]) ]]]–]]] 5
3. Results
I now proceed to the analysis, to identify the variousdimensions of the policy debate over hydrogen, as revealedby the data.
3.1. Efficacy
The notion of efficacy comes out of the political scienceliterature and essentially denotes how influential a politicalactor perceives herself to be. Prewitt (1968) defines politicalefficacy as ‘‘the person’s belief that political and socialchange can be effected or retarded and his efforts, alone orin concert with others, can produce desired behavior on thepart of political authorities’’ (p. 225). The influence that apolicy actor may have on the policy behavior of theirrespective organizations and on the policy process at largeis determined by a variety of factors, such as level ofexpertise in a relevant field, organization size, rank orauthority, and others. In the study of a policy process,understanding the landscape of ideas does not suffice—it isalso necessary to establish a connection between the ideasand the influence of those who hold them.
I conceptualize efficacy as having two components: theindividual’s influence within her own organization and herorganization’s influence within the policy process. Ioperationalize this concept in the survey by means of thefollowing two statements:
A.
Pl
En
Policy-makers seriously consider the opinions of yourorganization on hydrogen technology/policy.
B.
Your organization seriously considers your opinions onhydrogen technology/policy.3The marginal increase in influence is not constant. A one-unit
increment in the response to statement A or B will have a larger impact
on the overall measure of influence as the response moves toward the
higher end of the response scale.4By policy drivers, I refer to public policy issues that may motivate
stakeholder participation in a policy process.5This notion is borrowed from Ajzen and Fishbein’s theory of planned
behavior.
Table 2 shows the frequencies of responses for each ofthese questions, excluding missing values, for the US-basedsubsample.
Influence within organizations may materialize directlyor indirectly, as decision-makers are likely influenced byorganization members whom they consult with. About71% of the US-based responses indicated either agreementor strong agreement with the statement that their opinionson hydrogen technology/policy are seriously considered bytheir organizations.
In any one-policy process, not all opinions countequally. The more influential a stakeholder, the greaterher ability to steer the debate. I believe that this influenceheterogeneity needs to be reflected in the analysis. There is,however, no established methodology to do this. I hereby
ease cite this article as: Collantes, G., The dimensions of the policy debate
ergy Policy (2008), doi:10.1016/j.enpol.2007.11.020
propose a measure of influence defined by the product ofthe responses to statements A and B. Efficacy is a policyactor’s belief and does not necessarily correspond exactlywith the actual influence that she may have. The evidencesuggests, however, that efficacy and actual influence docorrelate closely (e.g. Weissberg, 1975). Under the pro-posed operationalization, efficacy may take values rangingfrom 1 to 25. The opinion of a respondent with efficacy 25is thus expected to be extremely important in formulatingthe positions related to hydrogen policy of an organizationthat has direct influence over policy-making. Fig. 2 showsthe distribution of this measure of influence across theUS-based subsample.Ways to operationalize influence other than the one used
here are also possible. For lack of an establishedmethodology, I feel comfortable with the operationaliza-tion used, because it avoids sample-wide homogeneity andbecause it reflects the non-constant marginal increase ofinfluence that, I believe, exists in real-world policyprocesses.3 I will incorporate this measure of influenceinto the rest of my analysis.
3.2. Policy drivers
Policy activity necessarily responds to one or moredrivers.4 In the broadest, simplest, categorization, stake-holders invest resources in a policy process either to protecteconomic interests or to pursue societal benefits. Theconceptual model represents policy drivers as objectivemeasures (catalytic trends/events). However, it is stake-holders’ perceptions of and beliefs about the policy problemsthat influence their decision to participate.5
To understand what policy issues motivate stakeholderparticipation in the policy process related to hydrogen, thesurvey included the following question: In your opinion,how much of a problem is each of the following issuesPRESENTLY? The question was followed by five options:dependence on foreign oil, global warming, air pollution,the need to find alternatives to oil, and economicdevelopment. Beliefs on the seriousness of each of thesepolicy issues were collected on a seven-point semantic scale
over transportation energy: The case of hydrogen in the United States.

ARTICLE IN PRESS
0
10
20
30
40
50
60
70
80
Frequency
0 5 10 15 20 25
Influence
Fig. 2. Distribution of influence in the US-based subsample.
Table 3
Beliefs about seriousness of policy problems
Weighted
statistic
Policy problem
Oil
dependency
Global
warming
Air
pollution
Oil
scarcity
Mean 5.98 5.49 4.99 5.38
Std. deviation 1.23 1.59 1.43 1.55
G. Collantes / Energy Policy ] (]]]]) ]]]–]]]6
anchored by 1 ¼ ‘‘Not at all a problem’’ to 7 ¼ ‘‘Extremelyserious problem’’. The main reason for using a seven-pointscale with verbal ratings only to the end points was tosafely assume a linear progression in the value of thevariable between the lower and upper ends.6 The idea wasto use these questions as ‘‘thermometers’’ of the policydrivers that would enable temporal comparisons, in thecase of subsequent administrations of the survey.
Table 3 shows the weighted mean of the responses toeach of the policy issues, for the entire US-basedsubsample.7 I present means instead of medians because Iunderstand these perceptions as continuous constructs,even though responses are collected on a discrete scale.
On average, respondents perceive oil dependency asthe more serious problem. The difference between thisvariable’s mean and those of the other three variables isstatistically significant (p-value ¼ 0.000).
Perceptions on the seriousness of policy problems maybe an indicator of motivation for policy activity, but notnecessarily of motivation for activity on hydrogen policy.To complement the measure of motivation above de-scribed, the survey included the following question: In youropinion, how important is to develop a HYDROGEN-based transportation system in the country where you arebased to (a) reduce the dependency on foreign oil of the
6Such assumption is less robust for Likert-type response scales.7For weighting throughout the paper I use the efficacy variable.
Please cite this article as: Collantes, G., The dimensions of the policy debate
Energy Policy (2008), doi:10.1016/j.enpol.2007.11.020
country where you are based? (b) reduce greenhouse gasemissions in the long term? (c) comply with ambient airquality standards in the country where you are based? (d)develop alternatives to oil? (e) comply with existinglegislation or regulations in the country where you arebased? Answers were collected on seven-point semanticscales anchored by 1 ¼ ‘‘Absolutely unimportant’’ to7 ¼ ‘‘Extremely important’’. A summary of the responsesis presented in Table 4.On average, respondents think that the problem that
hydrogen is most fit to address is the need to findalternatives to oil. The difference between the samplemean for this variable and the other four is statisticallysignificant (p-value ¼ 0.000).
3.3. Policy beliefs and general policy preferences
The survey contained 14 policy-belief statements, re-sponses to which were collected on a five-point Likert scaleanchored by ‘‘strongly disagree’’ (coded as 1) and ‘‘stronglyagree’’ (coded as 5). Table 5 shows the weighted and non-weighted means and standard deviations of the responsesto each of the policy-belief items. Even though the responsescale is discrete, I show means and standard deviationsinstead of medians and quartiles because beliefs areactually continuous constructs.Factor analysis of the statements in Table 5 on the
US-based subsample uncovered two reliable underlyingpolicy-belief dimensions, shown in Table 6.8 Shaded cells ineach column indicate the statements that were used toestimate Cronbach’s a and to interpret the meaning of thelatent construct (policy dimension) measured by the factor.The first factor, Pro Government Support, is composed of
the first three statements in Table 6. This factor capturesthe underlying policy belief that governments should take
8The specifics of the type of factor analysis used are shown at the foot of
the tables.
over transportation energy: The case of hydrogen in the United States.

ARTICLE IN PRESS
Table 4
Beliefs about fitness of hydrogen as a solution to issues
Weighted statistic Issue
Oil dependency Global warming Air pollution Oil scarcity Comply regulations
Mean 4.73 4.91 4.31 5.37 3.52
Std. deviation 1.92 1.93 1.94 1.77 1.89
Table 5
Means and standard deviations for responses to policy-belief statements
Statement Non-weighted Weighted
Mean Std. deviation Mean Std. deviation
Governments should be first adopters of hydrogen vehicles 3.72 1.18 3.81 1.15
Governments should provide funds or the development of hydrogen fueling
infrastructure
3.84 1.26 3.95 1.24
Governments should provide funds for demonstration programs on hydrogen
technologies/systems
4.15 1.03 4.20 1.00
Environmental regulations should be standard based, not technology based 4.13 1.08 4.20 1.03
Government regulations can accelerate technological innovation 4.18 0.85 4.21 0.84
All policy benefits and costs can be reflected reasonably well in a cost–benefit
analysis
2.90 1.14 2.89 1.14
Sequestration is a promising way to deal with CO2 emissions from hydrogen
production
3.20 1.16 3.25 1.17
The external costs of energy PRODUCTION should be internalized 4.06 0.90 4.06 0.92
The external costs of energy USE should be internalized 4.10 0.88 4.12 0.89
Anthropogenic CO2 emissions are a significant cause of global warming 4.03 1.05 4.08 1.02
Governmental policies should be more concerned with helping lower-income
groups than helping higher-income groups
3.52 1.12 3.49 1.13
In general, market-based policies are more effective than command-and-
control policies
3.95 1.03 3.96 1.03
In general, protecting the economy is more important than protecting the
environment
2.39 0.94 2.38 0.89
More international collaboration is desirable on policies related to hydrogen 3.94 0.90 3.97 0.89
Table 6
Factor loadings on policy-belief statements
G. Collantes / Energy Policy ] (]]]]) ]]]–]]] 7
Please cite this article as: Collantes, G., The dimensions of the policy debate over transportation energy: The case of hydrogen in the United States.
Energy Policy (2008), doi:10.1016/j.enpol.2007.11.020

ARTICLE IN PRESS
Table 7
Means and standard deviations for responses to policy-preference statements
Statement Non-weighted Weighted
Mean Std.
deviation
Mean Std.
deviation
A tax on gasoline to account for its air pollution costs 3.95 1.17 3.94 1.19
A tax on gasoline to encourage less driving 3.51 1.34 3.55 1.31
Incentives for buyers of vehicles that bring societal benefits relative to standard gasoline vehicles 4.23 0.99 4.28 0.97
A carbon tax 3.85 1.19 3.88 1.21
Increasing fuel-efficiency requirements on new light-duty vehicles 4.46 0.90 4.47 0.91
A tax on gasoline as a source of revenue for the development of a hydrogen infrastructure 3.20 1.38 3.26 1.39
Promote basic research on hydrogen technologies at universities 4.31 0.84 4.31 0.86
Economic incentives (‘‘carrots’’) for firms to accelerate the market introduction of fuel-cell vehicles 3.95 1.11 3.99 1.15
Regulation that ensures liability insurance of hydrogen infrastructure at reasonable prices 3.66 1.13 3.66 1.16
A mandate on the quantity/percentage of hydrogen-fueled vehicles produced 2.30 1.21 2.33 1.25
A mandate on the quantity/percentage of zero-emission vehicles produced 2.97 1.38 3.01 1.40
A mandate on the quantity/percentage of fueling stations that offer hydrogen 2.65 1.25 2.63 1.27
Regulating the minimum percentage of hydrogen to be produced from renewable sources of energy 3.32 1.32 3.32 1.32
G. Collantes / Energy Policy ] (]]]]) ]]]–]]]8
an active role, particularly financial, to help movingforward toward a potential adoption of hydrogen as atransportation fuel. As characterized by the operationalstatements, government investments may take the form ofearly purchases of hydrogen vehicles, financing thedeployment of a hydrogen delivery infrastructure, andfunding demonstration programs. I expect this policydimension to be found in policy process related to anyalternative fuel, not just to hydrogen.
The second factor, Pro Internalization, defined by the lasttwo items in Table 6, captures the underlying policy beliefthat policies should provide for the internalization of theexternal costs derived from energy production andconsumption.
Some of the policy-belief items in Table 5 were droppedfrom the factor analysis because they did not formadditional reliable measures of policy dimensions.9 Thefact that these items were dropped does not mean that theyare not important policy questions though. Some of themmight have formed a factor (defining a policy dimension)had the survey included more questions.10 Others areprobably too narrow or specific to be part of a broaderpolicy issue or dimension.
Measures of stakeholders’ preferences were obtained ona variety of specific policy tools, using a five-point Likert-type scale anchored by ‘‘strongly oppose’’ (coded as 1) and‘‘strongly support’’ (coded as 5). Table 7 shows the meansand standard deviations of the responses to thesestatements.
9In general, the reason to drop items was that the corresponding
Cronbach’s a’s were too low, in which case most of the commonalities in
the variances are more the result of random effects than of underlying
latent constructs.10The design of a survey generally involves tradeoffs. While increasing
the number of questions may improve the quality of the information, it
also increases the burden on the respondent, which is likely to result in
fewer responses (smaller sample size).
Please cite this article as: Collantes, G., The dimensions of the policy debate
Energy Policy (2008), doi:10.1016/j.enpol.2007.11.020
A factor analysis of the items in Table 7 identified thethree policy-preference dimensions presented in Table 8.I use parentheses to denote loadings that, though not thehighest on a given item, they are helpful in understandingthe construct (or policy dimension) that the factor iscapturing. Cronbach’s reliability measures including suchitems are shown between parentheses.The first factor captures the underlying preference for
policies that require from industry the supply of technol-ogies and products in levels or quantities determined byregulation. This factor, which I call Pro Command and
Control, defines the more dominant policy-preferencedimension, as suggested by the relative magnitude of theeigenvalues.The support for fuel-economy regulation, for a tax on
gasoline to finance a hydrogen refueling infrastructure, forhydrogen research at universities, and for regulatingliability insurance for hydrogen infrastructure have mar-ginally significant loadings on this factor. A Cronbach’s aincluding these three items remains high (0.83), indicatingthat they can help us in interpreting this first policy-preference dimension. The negative loading on the third ofthese marginal items suggests that supporters of strongcommand-and-control policies are in general also disin-clined to promote basic research at universities.The second factor captures the underlying policy
preference for reducing externalities associated with theuse of road motor vehicles by means of technology-neutralstrategies. Such strategies include increasing fuel-economystandards, providing incentives for the purchase of cleanervehicles, and end-use taxing schemes to internalizeexternalities like criteria pollutant emissions, fuel con-sumption, traffic congestion, and greenhouse gas emis-sions. I call this policy-preference dimension Pro Tech-
Neutral Policy. Compared with the first factor, this policydimension is more concerned with addressing the specificpolicy problem through taxation of the externality sourceor setting standards, rather than favoring specific technologies.
over transportation energy: The case of hydrogen in the United States.

ARTICLE IN PRESS
Table 8
Factor loadings on policy-preference questions
G. Collantes / Energy Policy ] (]]]]) ]]]–]]] 9
Note that although the preferences for taxing gasoline tofinance a hydrogen infrastructure and for requirements onhydrogen refueling stations have only marginal loadings onthe Pro Tech-Neutral Policy factor, they contribute toincrease Cronbach’s a. This means that these two items canbe thought of as being conceptually part of the Pro Tech-Neutral Policy dimension too. The second of these itemshas negative loadings on the Pro Tech-Neutral Policyfactor, which is consistent with the philosophy of thispolicy preference, namely not to favor specific technologywinners.
An interesting finding is that the support for fuel taxesand the support for increasing light-duty vehicle fuel-economy standards coexist in the same policy dimension.This suggests that stakeholders tend to view fuel taxes andfuel-economy standards as different facets of the samepolicy-preference dimension, and, in general, supporters(opponents) of one strategy support (oppose) the other too.The slight decrease of Cronbach’s a when the support forfuel-economy standards is excluded shows that this set ofitems does constitute a reliable measure of a commondimension. Nevertheless, the higher loading of the taxitems relative to the other two items in the factor indicatesthat this policy-preference dimension has a slightly strongermarket-based than command-and-control ‘‘flavor’’. Theresults also reveal the philosophical difference between
Please cite this article as: Collantes, G., The dimensions of the policy debate
Energy Policy (2008), doi:10.1016/j.enpol.2007.11.020
these two policy approaches. Looking at the Pro Com-mand and Control column, one notices that the loadings ofthe carbon tax and fuel-economy standard variables—though very marginally significant—are negative andpositive, respectively. These signs indicate that stake-holders who are more supportive of command-and-controlapproaches have, on average, a tendency to favor thesetting of fuel-economy standards, over carbon taxes.Taken as a whole however, the first two dimensionsare positively, significantly correlated (0.40). This resultindicates that supporters of command-and-control ap-proaches are, on average, also somewhat inclined tosupport technology-neutral policies.The third factor captures the preference for policies
directed to areas key to facilitating the commercializationof hydrogen vehicles: basic research, the deployment of arefueling infrastructure, incentives to production, andliability issues. Stakeholders with higher scores in thisdimension are conscious of the processes involved intechnological innovation and support policies aimed atfostering them. Reflecting this interpretation, I label thispolicy-preference dimension Pro Facilitating Innovation.Consistent with my interpretation, the incentives for buyersof clean vehicles has a marginally significant positiveloading, while the mandate on zero-emission vehicles has amarginally significant negative loading on this factor.
over transportation energy: The case of hydrogen in the United States.

ARTICLE IN PRESSG. Collantes / Energy Policy ] (]]]]) ]]]–]]]10
Indeed, adding these two items, Cronbach’s a increasesslightly to 0.77, indicating that they contribute to defining,along with the other four items, a reliable policy-preferencedimension.
Dimensions should not be interpreted as necessarilymutually exclusive. They define the issues that dominate acertain area of policy debate (in this case, the general policypreferences) but they are not necessarily indicative of howstakeholders split on this debate. For example, the fact thata stakeholder has a high positive score on the ProCommand and Control factor does not necessarily sayanything about her score on the other two factors. In thisparticular case, I find that stakeholders with higher (lower)scores in the Pro Command and Control tend to havehigher (lower) scores on the other two dimensions, asindicated by the positive pairwise correlations, shown inTable 8.
3.4. Preferences on hydrogen production pathways
The various pathways for the production of hydrogendiffer rather significantly in terms of technology maturity,process economics, and societal impacts. Therefore, Iexpect to find a non-trivial variance in the levels of supportfor the different pathways across stakeholders. The surveyincluded the question ‘‘For the SHORT TERM, would yousupport policies that promote the following sourcesof energy for the production of hydrogen?’’ Responseswere collected on five-point scales anchored by ‘‘stronglyoppose’’ and ‘‘strongly support’’, for 10 different hydrogenproduction pathways. The means and standard deviationsfor the weighted and non-weighted responses are shown inTable 9.
A factor analysis of these items yielded the two reliableunderlying policy dimensions presented in Table 10.
The first factor reveals a policy dimension characterizedby the preference for hydrogen production pathways withlower environmental impacts. The interpretation of thisPro Environmental H2 dimension is interesting. The items‘‘Natural gas with CO2 sequestration’’ and ‘‘Coal withoutCO2 sequestration’’ keep marginally significant loadings on
Table 9
Means and standard deviations for responses to hydrogen production pathwa
Statement Non-weighted
Mean
Coal with CO2 sequestration 3.21
Coal without CO2 sequestration 2.00
Natural gas with CO2 sequestration 3.50
Natural gas without CO2 sequestration 2.79
Nuclear 3.35
Geothermal 4.10
Petroleum/coke 2.34
Wind 4.22
Solar 4.25
Biomass 4.15
Please cite this article as: Collantes, G., The dimensions of the policy debate
Energy Policy (2008), doi:10.1016/j.enpol.2007.11.020
this dimension. Cronbach’s a of this policy dimension,including these two items, would still be 0.75—high enoughto argue that they should be taken into account to interpretthe policy dimension. The positive loading on the item‘‘Natural gas with CO2 sequestration’’ indicates thatsupporters of renewable production pathways would ingeneral be supportive of producing hydrogen from naturalgas in the short term, if the CO2 resulting from methanereforming is captured and stored. The negative loading onthe item ‘‘Coal without CO2 sequestration’’ reveals thatsupporters of renewable production pathways tend to beopponents of producing hydrogen from coal if the resultingCO2 is not sequestered.The second factor, Pro Non-renewable Hydrogen, cap-
tures the preference dimension related to policies that favorhydrogen production from fossil and nuclear sources ofenergy. The low-carbon non-renewable production path-ways—nuclear and coal with CO2 capture and storage—fall into this factor along with the fossil productionpathways. These two pathways have virtually zero loadingson the Pro Environmental H2 Production factor, indicatingthat they clearly belong in the Pro Non-renewable policy-preference dimension. The option of natural gas withcarbon sequestration, however, shows a non-trivial loading(0.34) on the Pro Environmental H2 Production factor.How can this pattern of loadings be interpreted? It suggeststhat the Pro Environmental H2 Production policy-pre-ference dimension is defined by preferences on the entirespectrum of environmental impacts of hydrogen produc-tion, including ambient air pollution, greenhouse gasemissions, and nuclear waste disposal. Stakeholders withhigher loading on this factor tend to be unwilling, forexample, to accept the risks of nuclear waste to reducecarbon emissions, or to accept the societal costs associatedwith coal even if most of the CO2 emitted was captured andsequestered. The moderate acceptability of hydrogenproduction from natural gas with sequestration reflectedin this policy-preference dimension, in my interpretationbased on multiple conversations with stakeholders, reflectsthe fact that this production pathway is perceived as alower-cost, relatively clean alternative suitable for the short
y statements
Weighted
Std. deviation Mean Std. deviation
1.22 3.25 1.25
1.06 1.99 1.08
1.08 3.56 1.13
1.14 2.87 1.18
1.32 3.28 1.38
0.89 4.10 0.91
1.02 2.29 1.03
0.96 4.22 0.99
0.97 4.25 1.00
0.99 4.14 1.00
over transportation energy: The case of hydrogen in the United States.

ARTICLE IN PRESS
Table 10
Factor loadings on hydrogen production pathway preferences
G. Collantes / Energy Policy ] (]]]]) ]]]–]]] 11
term, until production from renewable sources of energybecomes more economically competitive.
3.5. Social pressure
The notion of social pressure encompasses a wide varietyof mechanisms, internal and external to the stakeholderorganization. Social pressure has a direct impact onnormative policy beliefs. Two important forms of socialpressure were measured: market demand and organiza-tion’s goals and/or interests.
Measures of perceived market demand were obtainedthrough the following questions:
a.
P
E
In your opinion, CURRENTLY, how many of thefollowing types of light-duty vehicles could potentiallybe sold/leased annually IN THE MARKET in thecountry where you are based?
b.
What is your best estimate of the EARLIEST andLATEST years when production fuel-cell automobilescould be ready to enter the automotive showrooms inthe country where you are based? Assume no new policyincentives.c.
When do you think FCVs will capture 5% of the marketof NEW private vehicles in the country where you arebased? Assume no new policy incentives.Question a included two vehicle types: hydrogen FCVsand hydrogen internal combustion engine vehicles. Answer
options were offered in the form of ranges of sales volumesas ‘‘0–100’’, ‘‘100–1000’’, y, ‘‘100,000–1 million’’, plus theoptions ‘‘More than 1 million’’ and ‘‘Don’t know’’. Forquestion b, answer options were provided as year numberslease cite this article as: Collantes, G., The dimensions of the policy debate
nergy Policy (2008), doi:10.1016/j.enpol.2007.11.020
from 2010 to 2030, plus the options ‘‘Before 2010’’,‘‘Later’’, ‘‘Never’’, and ‘‘Don’t know’’. For question c,answer options were provided as year ranges in the form‘‘Before 2020’’, ‘‘Before 2025’’, y, ‘‘Before 2050’’, plus theoptions ‘‘Later’’, ‘‘Never’’, and ‘‘Don’t know’’. Responsefrequencies for the two vehicle types in question a areshown cross-tabulated in Table 11, while response fre-quencies to questions b and c are shown in Tables 12and 13, respectively. A detailed analysis of the responses tothe market-demand questions can be found in Collantes(2007).Another form of social pressure that affects policy beliefs
and motivates participation in the policy process is theorganization’s market-related interests. Such interests arenot necessarily economic; they can be grounded, amongother factors, on the societal benefits that the marketdeployment of a given technology may bring about. Thisform of social pressure is pre-eminently, though notexclusively, internal to the organization, and may origi-nate, for instance, in shareholders’ or constituencies’preferences, and management’s strategic decisions. Stake-holders’ market-related interests were captured with thefollowing question: ‘‘To the interests of your organization,how important is the short-term development of marketsfor each of these end-use products?’’ Respondents werethen presented with a list of technologies with threeresponse options: ‘‘not important’’, ‘‘somewhat impor-tant’’, and ‘‘very important’’.Shown in Table 14 are the results of the factor analysis
performed on these items.These results show that stakeholders’ market-related
interests essentially lie along three dimensions. The first
over transportation energy: The case of hydrogen in the United States.

ARTICLE IN PRESS
Table 11
Frequencies of beliefs about the sizes of markets for fuel-cell and hydrogen ICE vehicles
Number of fuel-cell vehicles Number of hydrogen internal combustion vehicles
Don’t know 0–102 102–103 103–104 104–105 105–106 4106 Total
Don’t know 64 0 0 0 0 0 0 64
0–102 0 40 22 13 3 2 0 80
102–103 0 8 39 24 7 1 2 81
103–104 2 0 8 24 13 6 2 55
104–105 4 1 1 5 12 8 1 32
105–106 2 2 1 2 4 14 4 29
4106 2 0 1 1 1 2 21 28
Total 74 51 72 69 40 33 30 369
Table 12
Frequencies of estimates of earliest market entrance of fuel-cell vehicles
Year Frequency
2009 46
2010 70
2011 3
2012 33
2013 8
2014 4
2015 106
2016 3
2017 3
2018 6
2020 44
2025 20
2030 9
Later 4
Never 7
Don’t know 11
Table 13
Frequencies of estimates of when fuel-cell vehicles capture 5% of new-
vehicle market
Year Frequency
2020 73
2025 71
2030 63
2035 33
2040 23
2045 8
2050 28
Later 11
Never 30
Don’t know 24
G. Collantes / Energy Policy ] (]]]]) ]]]–]]]12
factor, comprising eight items, represents the underlyinginterest in the market introduction of hydrogen-fueledtechnologies in the short term. Naturally, the factorincludes the interest in energy stations, where hydrogen-fueled vehicles would refuel. I name this dimensionHydrogen Tech Interest.
Please cite this article as: Collantes, G., The dimensions of the policy debate
Energy Policy (2008), doi:10.1016/j.enpol.2007.11.020
The second factor—Grid-Connected Interest—capturesthe underlying interest in grid-fed battery electric drive-trains. The interest in gasoline hybrid electric vehicles has amarginally significant loading (0.34) on this factor,indicating that interest in this drivetrain is consistent withinterest in vehicles with grid-fed batteries. This effect isexplained by the fact that hybrid electric vehicles can bethought of as a stepping stone in the technologicalevolution toward vehicles with all-electric driving range.The loading on hydrogen plug-in electric vehicles issignificant, consistent with the interpretation of this factor.In fact, the loading of this variable is higher than that ofalternative fuel vehicles (AFVs), which I included amongthe main three variables defining this factor. The role ofAFV in these results warrants some elaboration. Noticethat the loading of AFV on all three factors is relativelylow. Even when excluding this variable would haveincreased the respective Cronbach’s a’s, I decided to keepthis variable in the final solution to show that stakeholderswith stronger views (positive or negative) in any of thesethree factors (issues) would also have relatively strongviews on AFV. ‘‘Alternative fuel’’ is, most likely, inter-preted differently in each of the factors though. For thefirst factor, alternative fuel may be interpreted as hydrogen,for the second factor as electricity, and for the third factoras E85 or compressed natural gas.The third factor—Mainstream Drivetrains Interest—
captures the interest in internal combustion vehicledrivetrains. The loadings of the two technologies thatdefine this factor—gasoline internal combustion and gaso-line hybrid electric vehicles—are high, at 0.89 and 0.76,respectively. The relatively low value of Cronbach’s a(0.60) begs the question of whether the interests in thesetwo technologies can reliably be considered to define amarket-related interest. I would argue that they can. It isnatural for the interest in the development of markets forhybrid electric vehicles to be part of two of the dimensionsshown in Table 14. This technology may interest stake-holders either because it constitutes a natural step in atransition toward powertrain electrification or/and becauseit constitutes the next step in the evolution of the internalcombustion powertrain.
over transportation energy: The case of hydrogen in the United States.

ARTICLE IN PRESS
Table 14
Factor loadings on organization interests’ items
G. Collantes / Energy Policy ] (]]]]) ]]]–]]] 13
3.6. Preferences on research policy
To elicit statements of preferences about hydrogen-relatedresearch policies, the survey posed the question ‘‘How muchwould you support government programs for research,development, and/or demonstration in each of the followingareas?’’ Response options were offered on a five-point Likert-type scale anchored by ‘‘strongly oppose’’ and ‘‘stronglysupport’’. A factor analysis resulted in the two reliabledimensions of research-policy preferences shown in Table 15.
The first factor—Zero-Emission Research—captures thelatent policy-preference dimension-related research ontechnologies that would enable the introduction of zero-emission vehicles, including fuel cells, hydrogen storage,hydrogen distribution, and hydrogen production fromrenewable sources of energy.
The items that define the second of the research policy-preference dimensions—Non-Renewable-Hydrogen Re-
search—relate to hydrogen production pathways withmore negative environmental impacts. Stakeholders withhigh scores in this policy-preference dimension tend tosupport research on CO2 storage, which constitutes aphilosophical difference with the Zero-Emission Researchdimension, namely to manage carbon emissions instead ofreducing them. The relative size of the eigenvalues indicatesthat the Zero-Emission Research policy-preference dimen-sion is the more important in shaping the debate overhydrogen-related research policy.
Please cite this article as: Collantes, G., The dimensions of the policy debate
Energy Policy (2008), doi:10.1016/j.enpol.2007.11.020
4. Discussion
Using an online survey, I collected information ongeneral policy preferences, policy beliefs, social pressure,preferences about hydrogen production pathways, andresearch policy preferences, from a wide range of stake-holders. Through multivariate analysis of the collecteddata, I identified, and obtained measures of, the maindimensions of the policy debate related to the adoption ofhydrogen as a transportation fuel in the US. Identifying thedimensions of a policy debate is useful in that it reveals themain policy issues that concern stakeholders. Groupingmyriad very specific policy issues or questions into a muchsmaller number of broader policy issues greatly reduces thecomplexity of the policy picture, helps us better understandwhat the dominant issues in the policy process are, andmay facilitate policy discussions across stakeholders. Inthis paper, I have not addressed the question of what thepositions of different stakeholders are in each of thesepolicy dimensions—this will be the focus of a forthcomingarticle.Although some of the policy dimensions identified in this
paper are specific to hydrogen policy, many others areapplicable to transportation energy policy at large. Thedata do not allow a comprehensive analysis of all areas oftransportation energy policy though. For instance, thispaper presents only limited information on climate policy.The results presented herein cannot be generalized to
over transportation energy: The case of hydrogen in the United States.

ARTICLE IN PRESS
Table 15
Factor loadings for technology research policy preferences
G. Collantes / Energy Policy ] (]]]]) ]]]–]]]14
broader debates on energy policy because the sample ofrespondents is representative of stakeholders in thetransportation arena only.
For reasons explained in Section 2.2, this analysisfocused on the subsample of stakeholders based in theUS. This focus precludes a generalization of the results toother parts of the world where hydrogen is givenconsideration as an energy-policy option. Preliminaryexamination of the data shows that, indeed, the resultsmay be somewhat different for the non-US subsample. Forinstance, for respondents based in countries other than theUS, global warming takes the first place among the policydrivers for hydrogen. Such differences are consonant withexpectations and with discussions presented in the litera-ture (see, for example, Hake et al., 2006). In China, interestin alternative fuels has been typically driven by concernswith ambient air quality in urban areas (e.g. Zhao andMelaina, 2006). It is important to recognize, however, thatpolicy processes are not static—they evolve over timeaccording to a complex interplay of exogenous andendogenous determinants. Concerns about energy securityand awareness about the importance of reducing green-house gases emissions, for example, have been increasingsignificantly in China, thus creating additional drivers foralternative fuels such as hydrogen (e.g. NDRC, 2007).
In terms of general policy beliefs, the two salientdimensions that I identified are the internalization of
Please cite this article as: Collantes, G., The dimensions of the policy debate
Energy Policy (2008), doi:10.1016/j.enpol.2007.11.020
energy externalities and the role that the governmentought to have on supporting—particularly financially—theadoption to hydrogen as a fuel. The result that stake-holders tend to have similar positions about the inter-nalization of the external costs of both energy generationand energy consumption was not necessarily obviousa priori.I found three salient general policy-preference dimen-
sions: the preference for command-and-control appro-aches, the preference for addressing externalities withtechnology-neutral strategies, and the preference forfacilitating technological progress and innovation. Whilethe latter is mostly comprised of items related to hydrogen,it can be expected that this dimension will be found in ananalysis of transportation energy policy at large. Thishypothesis is supported by the fact that the requirementson hydrogen-fueled vehicles and hydrogen refuelingstations have insignificant loadings on this factor, suggest-ing that this policy dimension is representative of aphilosophical policy preference rather than a hydrogen-specific one. The taxing of gasoline to support the financingof a hydrogen infrastructure has non-trivial positiveloadings on the three policy dimensions. This resultsuggests that, in general, stakeholders who have a positivestand on any one of the policy dimensions will tend to havea positive stance on this particular policy measure.The market-related interests of the surveyed stake-
holders can be categorized in three areas or technologies:applications of hydrogen, plug-in drivetrains, and gasoline-fueled engine architectures. Observation of the loadings onthe last two items shows that organizations mostlyinterested in plug-in drivetrains have some interest ingasoline hybrid electric vehicles too. The evidence showsthat the inverse does not apply: organizations mainlyinterested in gasoline-powered drivetrains do not showsignificant interest in grid-fed architectures, although thisresult may be less robust now, as some car companies startworking on the development of plug-in hybrid electricvehicle prototypes. Organizations interested in the successof fuel cells (mobile and/or stationary) tend to be interestedin the success of hydrogen (and vice versa). This findingreflects an understanding among stakeholders of theinterdependence of the market success of these products.The debate over how hydrogen should be produced in
the short term is, according to my analysis, characterizedby two dimensions: the support for production fromenvironmentally friendly sources and the support forproduction from non-renewable sources of energy. Inter-estingly, these two dimensions have a significant, thoughlow, positive pairwise correlation. This means thatstakeholders who support environmentally- friendly hydro-gen production have a slight tendency, on average, tosupport non-renewable production pathways. Probably themost interesting result in this area of policy is that whetherCO2 emissions are captured and stored or not has littleinfluence on stakeholders’ perception about the environ-mental costs of hydrogen production from fossil fuels.
over transportation energy: The case of hydrogen in the United States.

ARTICLE IN PRESSG. Collantes / Energy Policy ] (]]]]) ]]]–]]] 15
There is some indication that stakeholders supportive ofhydrogen production from renewable sources are inclinedto lend some support to production from natural gas, giventhat carbon capture and storage is included, but they wouldnot be supportive to production from coal, regardless ofwhether carbon capture and storage is included or not.
In terms of research policy, the clearer policy issue iswhether to support research on areas that would enable anemission-free transportation system. While this result maynot seem too surprising, it does provide additional insightinto the role of government. The result that supportfor government funding of research in fuel cells and onrenewable production of hydrogen correlates with eachother signals a debate over whether government fundingshould prioritize research toward achieving the maximumsocietal benefits that a hydrogen-based transportationsystem can yield.
Having identified the main policy dimensions of thepolicy debate over hydrogen, future research steps includeexploring what the positions of different stakeholders arein each of these dimensions and testing the causal pathsproposed in the conceptual model. Research on these areasis currently underway.
Acknowledgments
I wish to gratefully acknowledge the valuable input of PaulSabatier, Joan Ogden, Anthony Eggert, Ken Kurani,Jonathan Hughes, and Dan Sperling during the process ofresearch design. I would also like to thank the Institute ofTransportation Studies at the University of California,Davis, for the financial support of research implementationand analysis, and the Energy Technology Innovation Policygroup at the Kennedy School of Government of HarvardUniversity for the financial support of much of the analysis.
References
Ajzen, I., Fishbein, M., 1980. Understanding Attitudes and Predicting
Social Behavior. Prentice-Hall, Englewood Cliffs, NJ.
Bendor, J., Moe, T., Shotts, K., 2001. Recycling the garbage can: an
assessment of the research program. The American Political Science
Review 95 (1), 169–190.
Bollen, K., 1989. Structural Equations with Latent Variables. Wiley,
New York.
Collantes, G., 2005. The hydrogen policy survey: descriptive statistics
of the study sample and their policy perspectives. Research report
Please cite this article as: Collantes, G., The dimensions of the policy debate
Energy Policy (2008), doi:10.1016/j.enpol.2007.11.020
UCD-ITS-RR-05-21. Institute of Transportation Studies, University
of California, Davis, CA, November.
Collantes, G., 2006. The California zero-emission vehicle mandate: a study
of the policy process, 1990–2004. Ph.D. Dissertation. Report UCD-
ITS-RR-06-09. Institute of Transportation Studies, University of
California, Davis, CA.
Collantes, G., 2007. Incorporating stakeholders’ perspectives into models
of new technology diffusion: the case of fuel-cell vehicles. Technolo-
gical Forecasting & Social Change 74, 267–280.
Collantes, G., Sperling, D., 2007. The origin of the ZEV mandate.
Submitted for publication.
Dosi, G., 1982. Technological paradigms and technological trajectories.
Research Policy 11, 147–162.
Fishbein, M., Ajzen, I., 1975. Belief, Attitude, Intention, and Behavior:
An Introduction to Theory and Research. Addison-Wesley, Reading,
MA.
Hake, J., Linssen, J., Walbeck, M., 2006. Prospects for hydrogen in the
German energy system. Energy Policy 34, 1271–1283.
Jenkins-Smith, H., 1988. Analytical debates and policy learning: analysis
and change in the federal bureaucracy. Policy Sciences 21, 169–212.
Kemp, R., 1997. Environmental Policy and Technical Change: A
Comparison of the Technological Impact of Policy Instruments.
Edward Elgar, Cheltenham, UK.
National Development and Reform Commission, 2007. National Climate
Change Program. Available on the Web at /www.china.org.cnS.
Accessed on November, 2007.
Nunnaly, J., Bernstein, I., 1994. Psychometric Theory. McGraw-Hill,
New York.
Olsen, J., 2001. Garbage cans, new institutionalism, and the study of
politics. The American Political Science Review 95 (1), 191–198.
Padgett, J., 1980. Managing garbage can hierarchies. Administrative
Science Quarterly 25 (4), 583–604.
Prewitt, K., 1968. Political efficacy. In: Sills, D. (Ed.), International
Encyclopedia of the Social Sciences. Crowell, Collier and Macmillan,
New York, pp. 225–228.
Rencher, A., 2002. Methods of Multivariate Analysis, second ed. Wiley,
New York.
Sabatier, P., 1987. Knowledge, policy-oriented learning, and policy
change. Knowledge 8, 649–692.
Sabatier, P., 1988. An advocacy coalition framework of policy change and
the role of policy-oriented learning therein. Policy Sciences 21,
129–168.
Weible, C., Sabatier, P., 2005. Comparing policy networks: marine protected
areas in California. The Policy Studies Journal 33 (2), 181–201.
Weissberg, R., 1975. Political efficacy and political illusion. The Journal of
Politics 37 (2), 469–487.
Zafonte, M., Sabatier, P., 2004. Short-term versus long-term coalitions in
the policy process: automotive pollution control, 1963–1989. The
Policy Studies Journal 32 (1), 75–107.
Zahariadis, N., 1999. Ambiguity, time, and multiple streams. In: Sabatier,
P. (Ed.), Theories of the Policy Process. Westview Press, Boulder, CO,
pp. 73–93.
Zhao, J., Melaina, M., 2006. Transition to hydrogen-based transportation
in China: lessons learned from alternative fuel vehicle programs in the
United States and China. Energy Policy 34, 1299–1309.
over transportation energy: The case of hydrogen in the United States.