the detection and summation of squamous epithelial
TRANSCRIPT
THE DETECTION AND SUMMATION OF SQUAMOUS EPITHELIAL CELLS
FOR SPUTUM QUALITY TESTING
NUR SHAHIDA BINTI NAWI
This thesis is submitted as partial fulfillment of the requirements for the award of the
Bachelor of Electrical (Electronics)
Faculty of Electrical & Electronics Engineering
University Malaysia Pahang
JUNE 2012
vi
ABSTRACT
Sputum is mucus that coughs up from the lower airways, which consists of cells such
as squamous epithelial cells (SEC), pus cells, macrophages and other cells. SEC that found in
sputum is an epithelium characterized by its most superficial layer consisting of flat cells,
known as skin cells. Sputum with good quality is important to detect diseases. The quality of
sputum is determined using Bartlett‟s Criteria by considering the score of SEC, pus cell
(neutrophils) and macroscopy. If the total score is 1 and above, the sputum will be cultured
and the specimens will be proceed accordingly. Whereas if the total score is 0 and below, the
process of sputum will stop. For squamous epithelial cells, the score is 0 if SEC is less than 10.
Whereas if SEC is between 10 to 25, the score is -1 and the score is -2 if the number of SEC is
greater than 25. Currently, the detection of SEC in sputum is manually done by technologists.
However, the problems if the human do are time consuming and human constraint. So, another
method is needed which is by automated vision system using image processing technique in.
Image processing such as image segmentation is used to detect and count the number of SEC.
Then, the result of SEC is displayed using graphical user interface (GUI). The advantage of
GUI is to make computer operation more intuitive and thus easier to use. In conclusion,
squamous epithelial cells can be detected using image processing and the score of SEC is
determined. Lastly, the percentage of error for this project is calculated.
vii
ABSTRAK
Kahak ialah lendir yang keluar melalui saluran pernafasan yang terdiri daripada sel-sel
seperti sel skuamus epitelium (SEC), sel nanah, makrofaj dan sel-sel lain. SEC yang terdapat
di dalam sputum ialah epithelium yang dicirikan oleh lapisan yang paling atas yang terdiri
daripada sel-sel rata, dikenali sebagai sel-sel kulit. Kahak yang mempunyai kualiti yang bagus
amat penting untuk mengesan penyakit. Kualiti kahak ditentukan dengan menggunakan
‘Bartlett’s Criteria’, berpandukan kepada skor SEC, sel nanah dan „macroscopy’. Jika jumlah
skor ialah 1 dan ke atas, kahak akan dikulturkan dan spesimen akan diproses dengan
sewajarnya. Manakala jika jumlah skor ialah 0 dan ke bawah, proses kahak akan dihentikan.
Untuk sel skuamus epitelium, skor ialah 0 jika bilangan SEC kurang daripada 10. Manakala
jika bilangan SEC ialah di antara 10 hingga 25, skornya ialah -1, dan skor ialah -2 jika
bilangan SEC lebih besar daripada 25. Pada masa kini, pengesanan SEC dalam kahak
dilakukan secara manual oleh manusia. Bagaimanapun, masalah jika dilakukan secara manual
ialah memakan masa dan had mata manusia semasa melihat sel di bawah mikroskop. Jadi,
langkah lain yang diperlukan ialah dengan menggunakan teknik pemprosesan imej yang
terdapat di dalam visi sistem automatik. Pemprosesan imej seperti segmentasi imej digunakan
untuk mengesan dan mengira imej SEC. Kemudian, hasil daripada pengesanan dan pengiraan
SEC akan dipaparkan dengan menggunakan „graphical user interface’ (GUI). Kelebihan
menggunakan GUI ialah membolehkan komputer beroperasi dengan lebih intuitif dan lebih
mudah digunakan. Kesimpulannya, sel skuamus epitelium boleh dikesan menggunakan
pemprosesan imej dan skor untuk SEC akan ditentukan. Akhir sekali, peratusan kesalahan
untuk projek ini akan dikira.
viii
TABLE OF CONTENTS
CHAPTER TITLE PAGE
1 INTRODUCTION 1
1.0 Introduction 1
1.1 Problem Statement 2
1.2 Objective 2
1.3 Scope of Project 3
2 LITERATURE REVIEW 4
2.1 Introduction 4
2.2 Squamous Epithelial Cells 5
2.3 Bartlett‟s Criteria 6
2.4 Image Processing Technique Using Image 7
Processing
2.5 Image Processing Technique Using Image 8
ix
Enhancement
2.6 Image Processing Technique Using Digital 9
Morphology
2.7 Segmentation of Sputum Color Image for Lung 10
Cancer Diagnosis
2.8 Watershed-based Segmentation of Cell Nuclei 12
Boundaries in Pap Smear Images
2.9 Color Image Segmentation Using a K-Means 14
Clustering Algorithm
2.10 Creating GUI in Matlab 16
3 METHODOLOGY 18
3.1 Introduction 18
3.2 Read the Image 20
3.3 Image Segmentation 20
3.3.1 K-Means Clustering 20
3.3.2 Color Thresholding 21
3.4 Binary Image 22
3.5 Morphologically Open Binary Image 22
3.6 Morphologically Close Image 23
x
3.7 Count the Number of SEC 24
3.8 GUI 24
4 RESULTS 25
4.1 Introduction 25
4.2 Read the image 25
4.3 Image Segmentation Using K-Means Clustering 26
4.4 Binary Image 27
4.5 Morphologically Open Binary Image 27
4.6 Morphologically Close Image 28
4.7 Count the Number of SEC 28
4.8 Graphical User Interface 29
5 DISCUSSION AND ANALYSIS 33
6 CONCLUSION 42
xi
7 RECOMMENDATION 43
8 REFERENCES 44
9 APPENDICES 46
9.1 Appendix A 47
9.2 Appendix B 50

xii
LIST OF TABLES
TABLE NO. TITLE PAGE
2.1 Comparison of Six Different Criteria for Judging the
Acceptability of Sputum Specimens 5
2.2 Modified Bartlett‟s Criteria 7
5.1 Comparison by Using Color Thresholding and
K-Means Clustering 33
5.2 Result Validation 38
5.3 The Comparison of the Score between HUSM and 41
MATLAB
xiii
LIST OF FIGURES
FIGURE NO. TITLE PAGE
2.1 Squamous Epithelial Cells 6
2.2 Image of SEC after Using Color Thresholding 8
2.3 Erosion Process in a Test Image 9
2.4 Dilation Process in a Test Image 10
2.5 A Sample of Color Sputum Image Using HNN 11
2.6 The Segmentation Result obtained Using HNN 11
2.7 Initial Pap smear Image and Nuclei Markers Superimposed 12
2.8 The Result of the Distance Transform, Nuclei Marker and
the Cytoplasm Marker 13
2.9 MR Image after K-Means Clustering 15
2.10 Object in Each Clusters 16
2.11 Graphical User Interface 17
3.1 Image Processing Technique 19
3.2 Object in Cluster 1, 2 and 3 21
xiv
3.3 Binary Image 22
3.4 Morphologically Open Binary Image 23
3.5 Morphological Close Operation 23
3.6 Count the Image 24
3.7 GUI 24
4.1 Original Image of SEC 26
4.2 Image Segmentation Using K-Means Clustering 26
4.3 Binary Image of SEC 27
4.4 Remove Small Images 27
4.5 Morphological Close Operations 28
4.6 Watermark Image and Count 28
4.7 Create GUI 29
4.8 Click Me Button 30
4.9 Sample Image Button 30
4.10 Run Button 31
4.11 Count Button 31
4.12 Score Button 32
5.1 Negative Sample : Sample 1 35
5.2 Negative Sample : Sample 2 36
5.3 Negative Sample : Sample 3 37

xv
5.4 Negative Sample : Sample 4 37
5.5 Negative Sample : Sample 5 38
5.6 The Comparison of the Score between HUSM and 41
MATLAB

xvi
LIST OF SYMBOLS
c - Set of pixels
S1 - Structuring element
xvii
LIST OF APPENDICES
APPENDIX TITLE PAGE
A GUI Coding 47
B Negative Sample for SEC Image 50
CHAPTER 1
INTRODUCTION
1.0 Introduction
Squamous Epithelial Cells (SEC) is an epithelium characterized by its most
superficial layer consisting of flat cells, known as skin cells and this SEC present in
sputum. Sputum is mucus that coughs up from the lower airways. It is usually used for
microbiological investigations of respiratory infections. The best sputum samples
contain very little saliva, as this contaminates the sample with oral bacteria. Then for
squamous epithelial cell, more than 25 of SEC at low enlargement indicates saliva
contamination. Microbiological sputum samples are usually used to look for infections
by Moraxella catarhalis, Mycobacterium tuberculosis, Streptococcus pneumoniae and
Haemophilus influenzae. Sputum can be bloody (hemoptysis), rusty colored which
usually caused by pneumococcal bacteria, purulent, foamy white which may come from
obstruction or even edema and frothy pink (pulmonary edema). The main purpose of
this sputum quality checking is to determine whether sputum suitable for cultured or
not. Cultured sputum is used to detect and identify bacteria or fungi that are infecting
the lung or breathing passages. To get a sample of sputum, the fresh sputum will be
collected when early in the morning before eating or drinks anything. Once the sputum
sample is collected, it will be taken to a laboratory and placed in a container with
substances that promote the growth of infecting organisms such as cells, bacteria or
2
fungi. If no organisms grow, the culture is negative. So, this experiment will be stop.
But if organisms that can cause infection grow, the culture is positive and will proceed
to the next step.
1.1 Problem Statement
Currently, the detection of organism in sputum is manually done by human.
However, the disadvantages of the current system are time consuming and human
constraint. So, another method is needed which is by using automated vision system.
The main purpose of this method is to accept or reject the sputum specimen; means that
only accepted sample will be proceed for culturing.
1.2 Objective
The objectives of this project are to:
i. Detect the presence of squamous epithelial cells (SEC) in sputum.
ii. Count the amount of SEC using MATLAB.
iii. Identify the grading of SEC based on Bartlett‟s Criteria.

3
1.3 Scope of Project
MATLAB software:
This project only uses software and not includes hardware. Image processing and
graphical user interface (GUI) in MATLAB is used to develop the project.
Squamous Epithelial Cells (SEC):
Sputum consists of squamous epithelial, pus cells, macrophages and other cells.
However, this project is only to detect and count the number SEC, while eliminating
other cells like pus cell.

CHAPTER 2
LITERATURE REVIEW
This chapter will review on the information gathered in developing the system for
object detection and color recognition using image processing techniques. The
information is the entire basic introduction to do this project for learning purpose
including the basic knowledge about the image processing and graphical user interface
(GUI) using Matlab.
2.1 Introduction
Squamous Epithelial Cells (SEC) is presence in sputum of people who have
diseases like pneumonia [1], tuberculosis (TB) [2] or lung cancer [3]. In lung cancer for
example, Qi Qiu et al. [3] propose to obtain concentrated and purified bronchial
epithelial cells to improve early detection of lung cancer in sputum samples. The
presence of SEC was the most universal criterion for judging specimen quality and
acceptability for culture, used by 98% of participant laboratories [4]. The quality of
sputum is determined by using Bartlett‟s criteria that required by Hospital Universiti
5
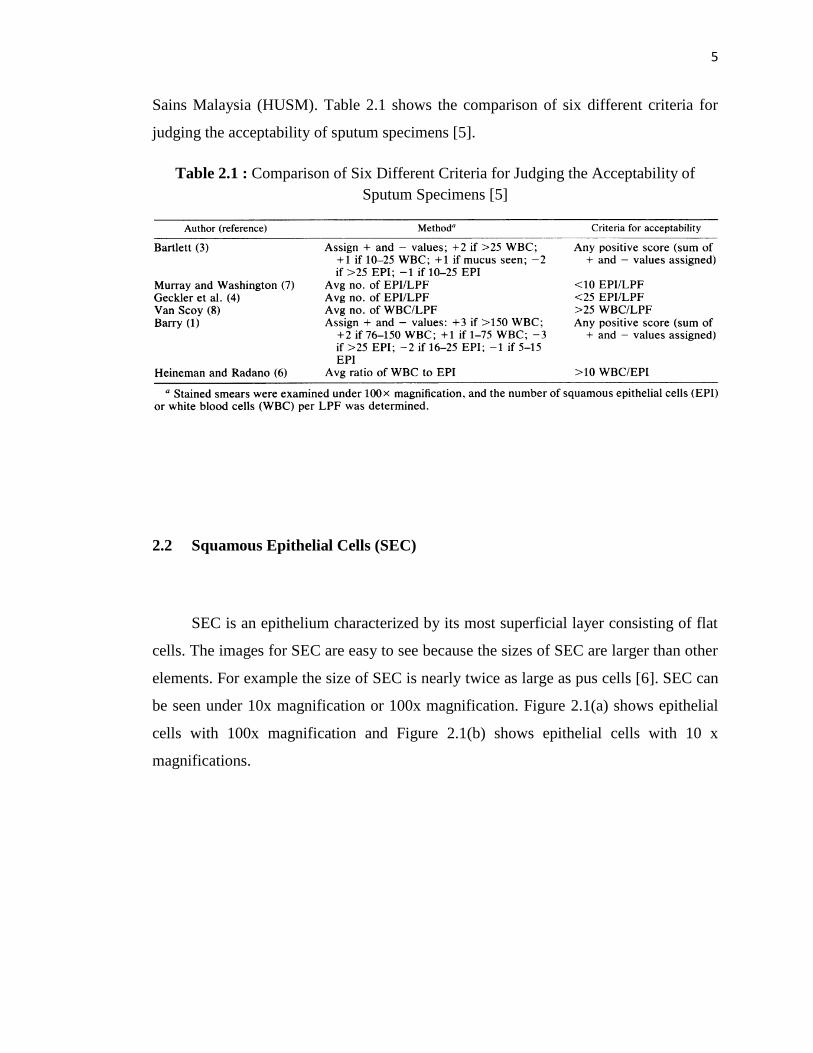
Sains Malaysia (HUSM). Table 2.1 shows the comparison of six different criteria for
judging the acceptability of sputum specimens [5].
Table 2.1 : Comparison of Six Different Criteria for Judging the Acceptability of
Sputum Specimens [5]
2.2 Squamous Epithelial Cells (SEC)
SEC is an epithelium characterized by its most superficial layer consisting of flat
cells. The images for SEC are easy to see because the sizes of SEC are larger than other
elements. For example the size of SEC is nearly twice as large as pus cells [6]. SEC can
be seen under 10x magnification or 100x magnification. Figure 2.1(a) shows epithelial
cells with 100x magnification and Figure 2.1(b) shows epithelial cells with 10 x
magnifications.

6
Figure 2.1 (a) Epithelial Cells 100x Magnification, (b) Epithelial Cells 10x
Magnification
2.3 Bartlett’s Criteria
Bartlett‟s criteria are the criterion that is used by HUSM for sputum quality
testing purpose. This criterion were chosen due to easiness for interpretation because it
proposed a scheme for grading the quality of sputum specimens and also lower rejection
rate than other criterions, thus minimizing the number of missed potential pathogen [7].
Bartlett‟s criteria divided into three score which is score A, B, and C. Score A is for
neutrophils count, score B is for macroscopic appearance like mucoid, mucopurulent,
purulent or blood stained and score C is for squamous epithelial cells. The score of each
criterion is summarized in the Table 2.2.
7
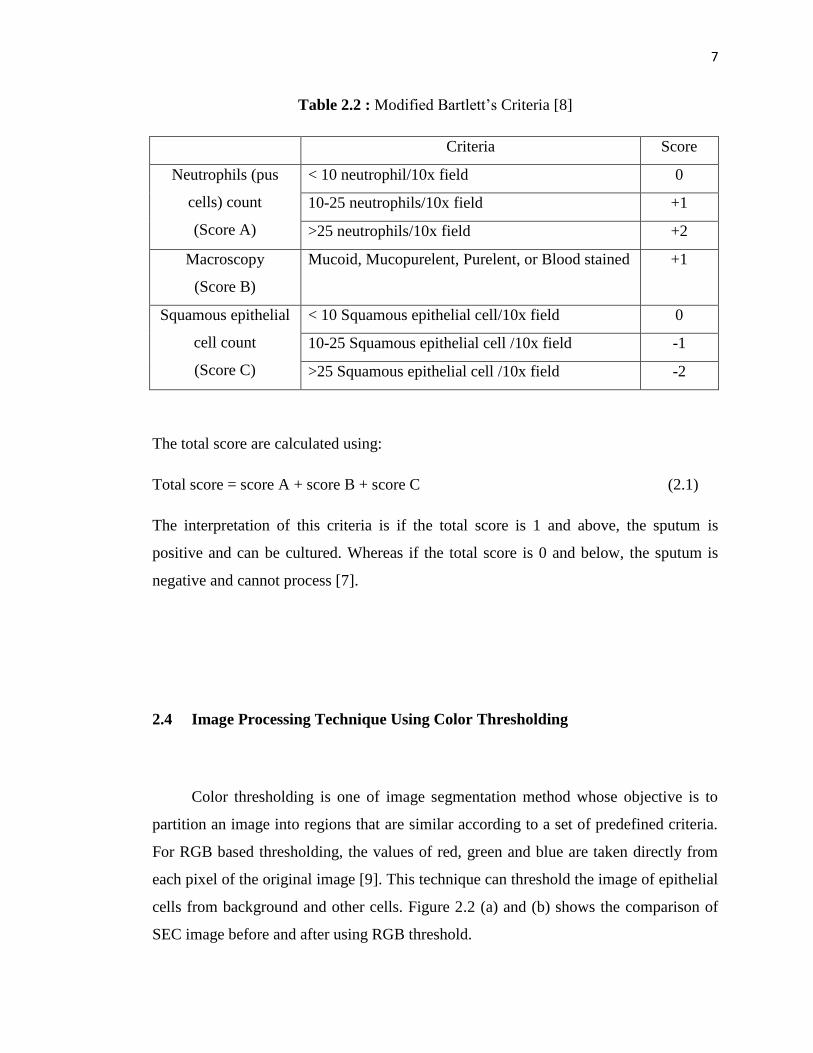
Table 2.2 : Modified Bartlett‟s Criteria [8]
Criteria Score
Neutrophils (pus
cells) count
(Score A)
< 10 neutrophil/10x field 0
10-25 neutrophils/10x field +1
>25 neutrophils/10x field +2
Macroscopy
(Score B)
Mucoid, Mucopurelent, Purelent, or Blood stained +1
Squamous epithelial
cell count
(Score C)
< 10 Squamous epithelial cell/10x field 0
10-25 Squamous epithelial cell /10x field -1
>25 Squamous epithelial cell /10x field -2
The total score are calculated using:
Total score = score A + score B + score C (2.1)
The interpretation of this criteria is if the total score is 1 and above, the sputum is
positive and can be cultured. Whereas if the total score is 0 and below, the sputum is
negative and cannot process [7].
2.4 Image Processing Technique Using Color Thresholding
Color thresholding is one of image segmentation method whose objective is to
partition an image into regions that are similar according to a set of predefined criteria.
For RGB based thresholding, the values of red, green and blue are taken directly from
each pixel of the original image [9]. This technique can threshold the image of epithelial
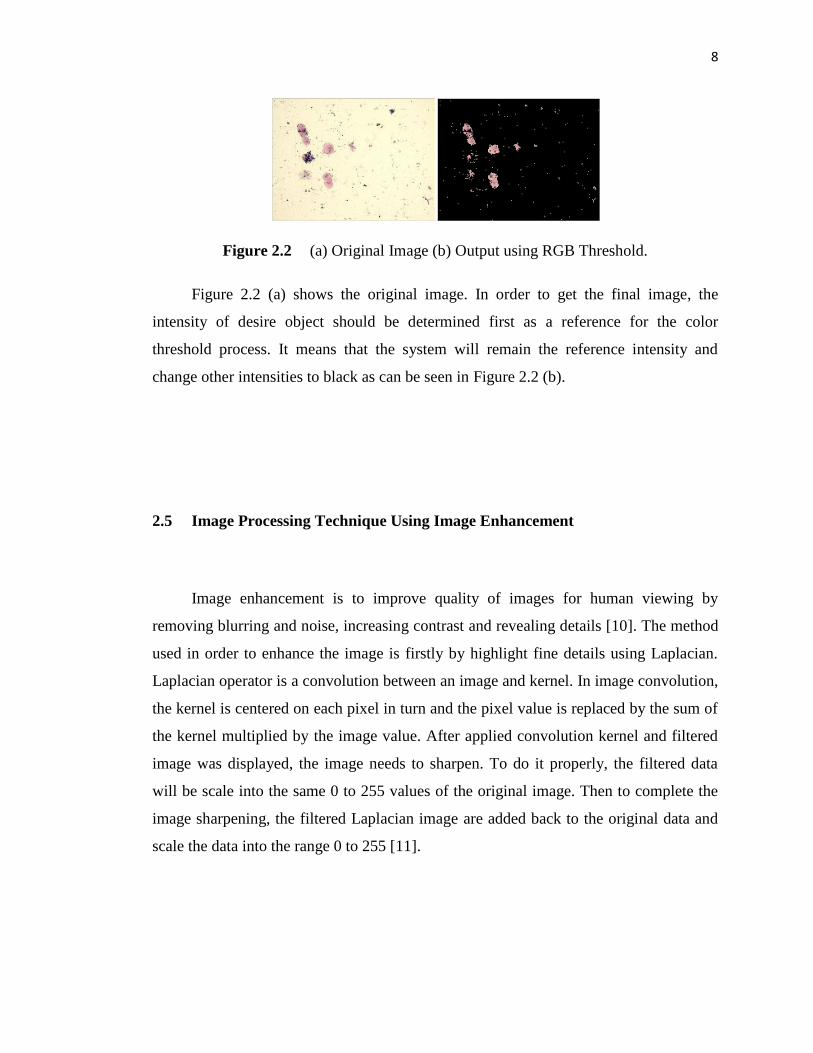
cells from background and other cells. Figure 2.2 (a) and (b) shows the comparison of
SEC image before and after using RGB threshold.
8
Figure 2.2 (a) Original Image (b) Output using RGB Threshold.
Figure 2.2 (a) shows the original image. In order to get the final image, the
intensity of desire object should be determined first as a reference for the color
threshold process. It means that the system will remain the reference intensity and
change other intensities to black as can be seen in Figure 2.2 (b).
2.5 Image Processing Technique Using Image Enhancement
Image enhancement is to improve quality of images for human viewing by
removing blurring and noise, increasing contrast and revealing details [10]. The method
used in order to enhance the image is firstly by highlight fine details using Laplacian.
Laplacian operator is a convolution between an image and kernel. In image convolution,
the kernel is centered on each pixel in turn and the pixel value is replaced by the sum of
the kernel multiplied by the image value. After applied convolution kernel and filtered
image was displayed, the image needs to sharpen. To do it properly, the filtered data
will be scale into the same 0 to 255 values of the original image. Then to complete the
image sharpening, the filtered Laplacian image are added back to the original data and
scale the data into the range 0 to 255 [11].
9
2.6 Image Processing Technique Using Digital Morphology
The concept of digital morphology is based on the fact that images consist of set
of picture elements called pixels. This pixel is collected into group which has a two-
dimensional structure called shape. A group of mathematical operations can be applied
to the set of pixels to enhance or highlight specific aspects of the shape, which then can
be counted or recognized. Morphology is divided into 4 types which are erosion,
dilation, closing and opening. Erosion is elimination of set of pixels having a given
pattern and dilation is addition of a given pattern to a small area [12].
For erosion, the binary erosion of the S by a set S1 is:
(2.2)
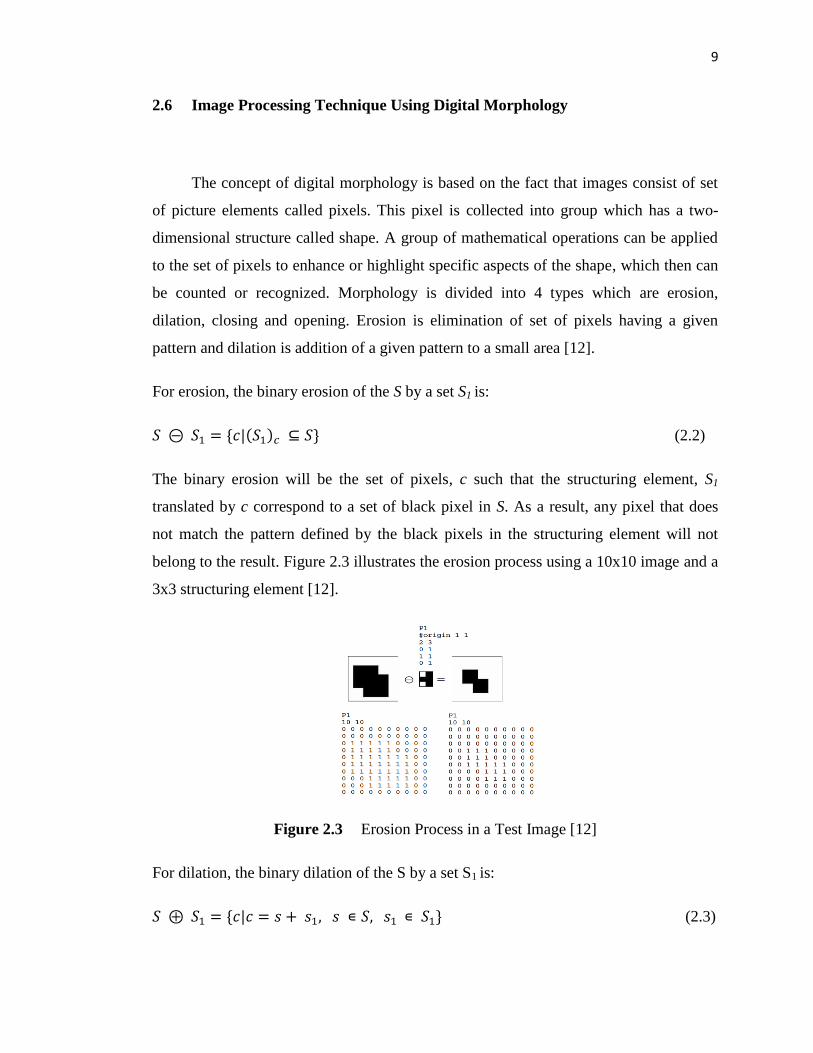
The binary erosion will be the set of pixels, c such that the structuring element, S1
translated by c correspond to a set of black pixel in S. As a result, any pixel that does
not match the pattern defined by the black pixels in the structuring element will not
belong to the result. Figure 2.3 illustrates the erosion process using a 10x10 image and a
3x3 structuring element [12].
Figure 2.3 Erosion Process in a Test Image [12]
For dilation, the binary dilation of the S by a set S1 is:
(2.3)
10
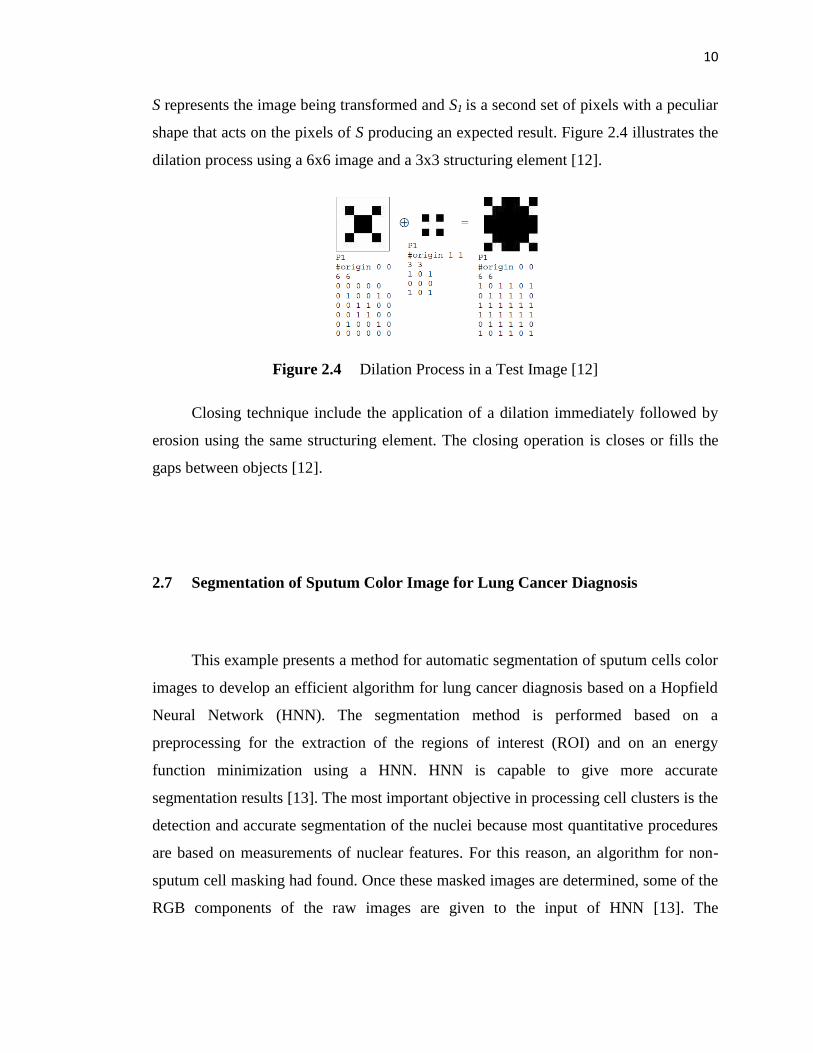
S represents the image being transformed and S1 is a second set of pixels with a peculiar
shape that acts on the pixels of S producing an expected result. Figure 2.4 illustrates the
dilation process using a 6x6 image and a 3x3 structuring element [12].
Figure 2.4 Dilation Process in a Test Image [12]
Closing technique include the application of a dilation immediately followed by
erosion using the same structuring element. The closing operation is closes or fills the
gaps between objects [12].
2.7 Segmentation of Sputum Color Image for Lung Cancer Diagnosis
This example presents a method for automatic segmentation of sputum cells color
images to develop an efficient algorithm for lung cancer diagnosis based on a Hopfield
Neural Network (HNN). The segmentation method is performed based on a
preprocessing for the extraction of the regions of interest (ROI) and on an energy
function minimization using a HNN. HNN is capable to give more accurate
segmentation results [13]. The most important objective in processing cell clusters is the
detection and accurate segmentation of the nuclei because most quantitative procedures
are based on measurements of nuclear features. For this reason, an algorithm for non-
sputum cell masking had found. Once these masked images are determined, some of the
RGB components of the raw images are given to the input of HNN [13]. The
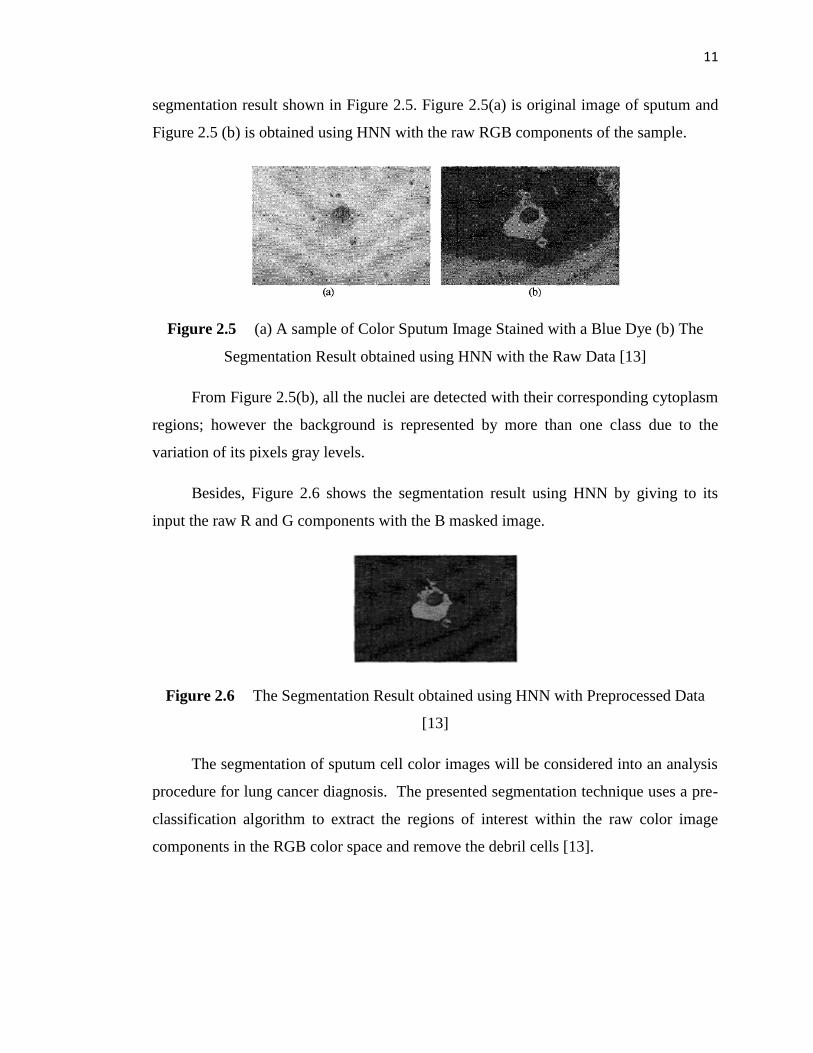
11
segmentation result shown in Figure 2.5. Figure 2.5(a) is original image of sputum and
Figure 2.5 (b) is obtained using HNN with the raw RGB components of the sample.
Figure 2.5 (a) A sample of Color Sputum Image Stained with a Blue Dye (b) The
Segmentation Result obtained using HNN with the Raw Data [13]
From Figure 2.5(b), all the nuclei are detected with their corresponding cytoplasm
regions; however the background is represented by more than one class due to the
variation of its pixels gray levels.
Besides, Figure 2.6 shows the segmentation result using HNN by giving to its
input the raw R and G components with the B masked image.
Figure 2.6 The Segmentation Result obtained using HNN with Preprocessed Data
[13]
The segmentation of sputum cell color images will be considered into an analysis
procedure for lung cancer diagnosis. The presented segmentation technique uses a pre-
classification algorithm to extract the regions of interest within the raw color image
components in the RGB color space and remove the debril cells [13].