the definitive look at school test scores in milwaukee and ... · milwaukee offers its children a...
TRANSCRIPT

Wisconsin Institute for Law & Liberty
The Definitive Look at School Test Scores in Milwaukee and Wisconsin
Will Flanders, Ph.D. Research Director
Wisconsin Institute for Law & Liberty
March, 2017

Apples to Apples
The Definitive Look at School Test Scores in Milwaukee and Wisconsin

Wisconsin Institute for Law & Liberty
Executive Summary For too long, the debate over student achievement in public, charter, and private schools has been muddied by insufficient data and inappropriate apples-to-oranges comparisons. Comparisons of test scores between schools in the various sectors could not take into account differences in the students served by those sectors. This study, for the first time using the most recent test score results, dispels that confusion and provide parents and policymakers with the clearest possible comparison of student outcomes in each school sector in Milwaukee – as well as across Wisconsin. Our study, while taking into account students’ socio-economic status and demographics, compares academic performance on 2016’s Forward Exam and ACT in all school sectors in Milwaukee and Wisconsin
We find that private schools in the choice programs and public charter schools in Milwaukee and Wisconsin perform significantly better on the ACT and Forward Exams than traditional public schools when a proper apples-to-apples comparison is made. This means, when things like poverty, race, and English language learners are taken into account and properly controlled for, we are finding that student outcomes on test scores are simply better in the private and charter sector as opposed to traditional public schools.
This matters for parents. It is not about building one sector up or tearing another down. But if we are to take seriously the wish of all Wisconsin parents to provide their children with the best opportunity to succeed, we have to make the best use of the available data to provide parents with accurate information about what is working and what isn’t.
1. MPCP outperforms MPS. Private schools in the Milwaukee Parental Choice Program (MPCP) significantly outperform traditional Milwaukee Public Schools (MPS). On the Forward Exam, students in the MPCP were approximately 5% more likely to be proficient in English/Language Arts and about 4% more likely to be proficient in Math. On the ACT, students in the MPCP score, on average, 2.8 points higher than students in traditional public schools.
2. Charters outperform MPS. Both independent and non-instrumentality charters have higher proficiency rates than MPS. Students in non-instrumentality charter schools were about 8% more likely to be proficient in English/Language Arts and 7% more likely to be proficient in math than traditional public school students. Independent charter school students were about 8% more likely to be proficient English/Language Arts and in math. Instrumentality charters display little difference from MPS.
3. Affiliation with long-established religious school system matters. There is a significant, positive relationship between student performance and whether the private school is Catholic or Lutheran. These religious schools drive the overall positive effect of the MPCP. When compared to MPS, students in Catholic schools are about 7% more likely to be proficient on the Forward Exam in Math

Wisconsin Institute for Law & Liberty
and 15% more likely to be proficient in English than students in MPS. Other MPCP schools perform no differently than MPS on average.
4. UWM charters outperform others. Among charter schools, the best performers are those authorized by UWM. On the Forward exam, UW-Milwaukee charters have approximately 9% higher proficiency rates in English and 7% higher proficiency rates in mathematics compared to MPS. City charter schools and MPS instrumentality charters do not differ from traditional MPS schools.
5. MPS’ specialty schools are no different than neighborhood MPS. On its face, MPS’ citywide specialty schools – Golda Meir, Ronald Reagan, King IB, etc. – outperform the vast majority of schools in City. But is this a product of the school or the students? It turns out it is the latter. When schools’ race and socio-economic status are taken into account, specialty schools perform no better than neighborhood MPS schools and are outperformed significantly by the MPCP average. The reason? MPS’ specialty schools – many of which have admissions policies – are more affluent and “white” than the rest of MPS, MPCP, and charter schools.
6. Racial achievement gap is significant. Across sectors, a school with a non-white student make-up is predicted to have 52.9% lower proficiency in English/Language Arts and 46.5% lower proficiency in math than a school that is all white. This is evidence that the racial achievement gap is real and a major issue.
7. Statewide comparisons. On the Forward Exam, there is little significant difference between WPCP/RPCP, charter schools, and public schools. However schools in the Racine and Wisconsin choice programs score approximately 6 points higher on the ACT composite score than traditional public schools.
8. Rural Wisconsin struggles as much as urban Wisconsin. After breaking down public schools based on urbanicity, we see that public schools in rural and small town Wisconsin are 8% and 4% less likely to be proficient in Math compared to suburban schools respectively. This is very similar to urban schools.

1 Wisconsin Institute for Law & Liberty
Table of Contents
Introduction ......................................................................................................2
Overview of Education in Wisconsin ..............................................................2
Literature Review of MPCP, Charters .............................................................3
Study Methodology ..........................................................................................4
Study Results ...................................................................................................5
A. Comparing the MPCP, Charters, and Traditional MPS .......................5 B. Exploring different types of MPS, private, and charter schools ...........8 C. Statewide Comparisons ...................................................................... 12 D. Further Breakdowns of Statewide Data ............................................. 15
Limitations .................................................................................................... 15
Conclusions ................................................................................................... 16
References ..................................................................................................... 17
Appendices .................................................................................................... 18

2 Wisconsin Institute for Law & Liberty
Figure 1. Enrollment by School Type, Milwaukee
I. INTRODUCTION
Milwaukee offers its children a wide variety of educational options. Beyond traditional public schools within the Milwaukee Public Schools (MPS) district, students in the city have access to several types of public charter schools and the Milwaukee Parental Choice Program (MPCP) to attend a private school. These options have been growing outside of Milwaukee with the relatively new Wisconsin Parental Choice Program.
Concurrent with this exciting growth has been a wealth of misinformation about the performance of these schools. For example, Mary Young of Save Our Schools Wauwatosa told the Milwaukee Journal Sentinel last October, “After 25 years of study there’s no proof that voucher schools outperform public schools. In many cases, they do worse (Johnson 2016)."
Is this true? And how should people compare schools across sectors? Schools in Milwaukee have different characteristics and their students have different demographic and socio-economic make-up. For example, there are specialty schools in MPS that have application requirements. Private schools in the MPCP are far from homogenous with some being Lutheran, Catholic, or non-denominational.
This often makes “apples-to-apples” comparisons of schools difficult. Many in the media, advocacy groups, as well as politicians fall into the trap of making erroneous comparisons.
Building off of a WILL report 2015, “Apples to Oranges?” this study attempts to, for the first time, compare student performance on the Forward Exam and ACT scores in schools across all sectors while controlling for students’ socio-economic status and other factors related to performance simultaneously. By bringing to bare the most extensive data ever made publically available on schools in Choice programs, this paper shows how to create a fairer, apples-to-apples comparisons of schools in Milwaukee and across the state.
II. OVERVIEW: EDUCATION IN WISCONSIN
Wisconsin enjoys some of the most diverse educational options of any state in the country. Consider the following types of schools and choice programs:
Milwaukee Parental Choice Program (MPCP): The MPCP is the oldest school choice program in the country. Started in 1990 by a diverse coalition of Republicans and Democrats, the program aimed to provide better educational options for a public school system that had failed its kids for too long. The program is open to students in the city of Milwaukee whose families are within 300% of the poverty line. There are no enrollment caps. The program served over 27,000 students in 121 private schools during the 2016-17 school year.
Racine Parental Choice Program (RPCP): The RPCP expanded access to voucher schools beyond Milwaukee in Wisconsin. The program began in 2011 and is open only to residents of the city of Racine whose family income is within 300% of the poverty

3 Wisconsin Institute for Law & Liberty
Figure 2. Enrollment by School Type, Wisconsin
line. During the 2016-17 school year, the program included 19 schools and 2,532 students.
Wisconsin Parental Choice Program (WPCP): The newest school voucher program in Wisconsin, the WPCP expanded access to vouchers statewide in 2013. Unfortunately the program has a lower income limit than other choice programs in Wisconsin, at only 175% of the poverty line. This program also faces strict enrollment caps that are set to increase over the years at a slow rate. For 2016-17, 2% of students in each school district will be eligible for enrollment. This increases by 1%
per year until caps are lifted after 10 years. During the 2016-17 academic year, there are 121 schools enrolled in the program serving 3,061 students.
Independent Charters: Independent charter schools are public schools outside of the purview of local school boards. They are chartered by a number of entities throughout the state including universities and the city of Milwaukee. These schools are freed from many of the regulatory burdens found in traditional public schools. 24 independent charters operate in Milwaukee. Only two independent charters operate outside of Milwaukee.1
Non-Instrumentality Charters: These charter schools are under the purview of the school district, but maintain a level of independence not seen in traditional public schools. The teachers are employees of the school rather than the district and are non-unionized. 13 non-instrumentalities operate in Milwaukee. 17 Non-instrumentality charters operate outside of Milwaukee, however many of these are virtual schools or schools devoted to at-risk students.
Instrumentality Charters: They are under the purview of the local school board, and their employees are employees of the district. These schools also have far more limited curriculum freedom than other charters. Of the 211 charters in Wisconsin outside of Milwaukee, 193 (91.4%) are instrumentality charters.
Traditional public schools: Public schools make up the vast majority of all schools in Wisconsin. They are run by local school districts and in many cases have unionized teachers. There are also different types of public schools that vary in the extent to which they are open to all students. Some public schools, such as citywide specialties in Milwaukee, may have admissions requirements.
III. LITERATURE REVIEW OF MPCP, CHARTERS
As the nation’s oldest school voucher program, there has been extensive research conducted about the effects of school vouchers on student performance in Milwaukee. The School Choice Demonstration Project (SCDP) was funded by the state in 2006 to conduct extensive research on the effectiveness of the program on a wide variety of metrics. Scholars in the SCDP applied state-of-the-art matching methods to compare students in the MPCP with students in MPS who were similar in neighborhood, race, and prior achievement. Short of true experiments where students are randomly assigned to one
1 These schools operate in Waukesha and Racine Counties.

4 Wisconsin Institute for Law & Liberty
school or another, such methods represent the best approach to showing causal relationships (Stuart and Rubin 2008; Bilfulco 2012).
Among the findings from this matching analysis are that students in the MPCP were 4-7 percentage points more likely to graduate from high school (Cowen et. al. 2013). Moreover, students in the MPCP were found to have higher achievement in reading, though similar levels of achievement in math (Witte et. al. 2012). Other, findings not related to academic achievement include lower incidences of criminal behavior (DeAngelis and Wolf 2016) and extensive economic benefits resulting from these effects (Flanders and DeAngelis 2017).
Later research has found similar positive effects of the MPCP. Lueken and Szafir (2015) used publically-available data at the school level to compare MPCP and public schools. They found that religious schools in MPCP performed significantly better than similar public schools once racial and economic characteristics of the schools are taken into account. In the charter sector, this research also found significantly better performance for independent charter schools. Building off this research, Flanders (2017) found that charter schools in Milwaukee with greater independence from the school district (independent and non-instrumentality) gave Wisconsin taxpayers a better return-on-investment per tax dollar spent than charters more closely tied to the district (instrumentality) and traditional public schools.
There is not extensive research into the Racine and Wisconsin Parental Choice Programs because they are relatively small and new.
III. STUDY METHODOLOGY
For the first time, extensive data has been made available on the demographic and economic characteristics of schools in Wisconsin across all school sectors – public, charter, and private in choice programs. The data set shows a school’s racial make-up, socioeconomic status make-up, enrollment counts, and English language learner counts. This data enables a more fine-grained analysis than has been conducted previously outside of the work by the School Choice Demonstration Project, for whom individual-level student data was made available by the Department of Public Instruction.
Also, all students in Wisconsin are now mandated to participate in the ACT. In previous years, ACT score analysis would lead to important concerns about selection bias. However, the mandated universal participation in the exam now makes it an appropriate measure of high school performance.
In each of the analyses that follow, we control for many factors that could account for differences in student achievement other than school sector. These factors include the percentage minority in the school, the percentage of students in the school that are economically disadvantaged, the enrollment of the school, the percentage of students in the school that are English language learners, and the grade levels served by the school. Doing so results in the most “apples-to-apples” comparison between schools that is possible short of student-level data.
It is important to note the manner of calculation for poverty has changed in this analysis from what we have produced previously. In the past, we relied upon data from the state’s Free and Reduced Lunch Program to provide an estimate of poverty. However, a provision in federal law known as the Community Eligibility Provision has rendered entire school districts as eligible for the free lunch

5 Wisconsin Institute for Law & Liberty
program if poverty levels in the district are high enough (USDA 2017). This includes Milwaukee Public School district. In such districts, DPI now relies on a separate form sent home to parents to identify the share of students in poverty. We utilize this alternative measure for Milwaukee.
Our dependent variables are primarily measures of attainment gathered from DPI’s WISEdash system. We gathered data on two of the most important subject areas for success later in life, reading and mathematics. This data is aggregated at the school level. Students who took the alternative exam for disabilities are not included in the analysis. ACT results were also gathered from DPI’s publically available data.
Because the MPCP is so large, we are able to break out Milwaukee and examine the effects of choice sectors on performance with the city. Additionally, Milwaukee contains a far wide variety of charter schools than the rest of the state, with varying degrees of connectedness to the school district (Flanders 2017). For the Milwaukee, I run the following model on both Forward Exam and ACT data:
Test Score=𝛽1(𝑃𝑟𝑖𝑣𝑎𝑡𝑒) + 𝛽2(𝐼𝑛𝑑𝑒𝑝𝑒𝑛𝑑𝑒𝑛𝑡 𝐶ℎ𝑎𝑟𝑡𝑒𝑟) + 𝛽3(𝐼𝑛𝑠𝑡𝑟𝑢𝑚𝑒𝑛𝑡𝑎𝑙𝑖𝑡𝑦 𝐶ℎ𝑎𝑟𝑡𝑒𝑟) +𝛽4(𝑁𝑜𝑛 − 𝐼𝑛𝑠𝑡𝑟𝑢𝑚𝑒𝑛𝑡𝑎𝑙𝑖𝑡𝑦 𝐶ℎ𝑎𝑟𝑡𝑒𝑟) + 𝛽5(𝐶𝑜𝑛𝑡𝑟𝑜𝑙𝑠)
For districts in Wisconsin outside of Milwaukee, there is a need to additionally control for variation that occurs at the school district level. This is done through the inclusion of school district fixed effects2. There is also little need to control for the types of charter schools, which are almost universally instrumentalities outside of the city. I run the following model:
Test Score=𝛽1(𝑃𝑟𝑖𝑣𝑎𝑡𝑒) + 𝛽2(𝐶ℎ𝑎𝑟𝑡𝑒𝑟) + 𝛽3(𝐷𝑖𝑠𝑡𝑟𝑖𝑐𝑡 𝐷𝑢𝑚𝑚𝑖𝑒𝑠) + 𝛽4(𝐶𝑜𝑛𝑡𝑟𝑜𝑙𝑠)
IV. STUDY RESULTS
A. Comparing Milwaukee Parental Choice Program, Charter Schools, and Traditional Milwaukee Public Schools
We begin our analysis with a look at the outcomes observed for students in Milwaukee on the Forward Exam. Table 1 below presents the scores of students in both English/Language Arts and Mathematics on the exam. Stars indicate the level of confidence that we have that an observed effect is not the product of chance. For instance, the three stars on private schools in the English/Language Arts column indicate that similar results would be found less than 1% of the time if there was not relationship, thus giving us 99% confidence this effect is not a product of chance. The two stars on private schools in the math column indicate 95% confidence of a relationship.
2 Private schools are assigned a single district fixed effect, as are independent charters. Instrumentality and non-instrumentality charters are included in their home district fixed effect.

6 Wisconsin Institute for Law & Liberty
Table 1. Effect of School Type on Forward Exam Performance, Milwaukee 2016
VARIABLES Mathematics English/Language Arts Private School 0.0410** 0.0567*** (0.0180) (0.0186) Independent Charter 0.0787*** 0.0757*** (0.0259) (0.0268) Non-Instrumentality 0.0987*** 0.0912*** (0.0331) (0.0342) Instrumentality 0.0798* 0.0393 (0.0462) (0.0478) Non-White 0.462*** 0.530*** (0.0536) (0.0554) Enrollment 1.38e-05 5.03e-05* (2.78e-05) (2.88e-05) Economically Disadvantaged -0.114*** -0.170*** (0.0434) (0.0449) English-Language Learner 0.151** 0.0971 (0.0585) (0.0605) Alternative School -0.0412 -0.0598 (0.0797) (0.0825) Elementary/Secondary -0.0429* -0.0291 (0.0245) (0.0253) Middle School -0.0475** -0.0270 (0.0223) (0.0231) High School 0.0753* 0.0892** (0.0417) (0.0431) Constant 0.196** 0.276*** (0.0938) (0.0970) Observations 241 241 R-squared 0.497 0.559
Standard errors in parentheses *** p<0.01, ** p<0.05, * p<0.1
As can be seen in Figure 3 below, private schools in the MPCP significantly outperform Milwaukee Public Schools, the baseline group to which comparisons are made. Students in the MPCP were approximately 5% more likely to be proficient in English/Language Arts and about 4% more likely to be proficient in Math.

7 Wisconsin Institute for Law & Liberty
Figure 3. Effect of School Sector on Proficiency, 2016 Forward Exam Milwaukee
In addition, both independent charters and non-instrumentality charters have higher proficiency rates than MPS. Students in non-instrumentality schools were about 8% more likely to be proficient in English/Language Arts and 7% more likely to be proficient than traditional public school students. Independent charter school students were about 8% more likely to be proficient in English/Language Arts and Math. Instrumentality charter students were more likely to be proficient in Math, though only at the lowest level of statistical significance (p<.1).
Across sectors, the data speaks to the difficulty Milwaukee faces in educating minority children. By far the biggest predictor of proficiency in this model is the percentage of students in the school who are non-white—and it is a negative predictor. A school with a non-white student make-up is predicted to have 52.9% lower proficiency in English/Language Arts and 46.5% lower proficiency in Math than a hypothetical school that is all-white. The racial achievement gap is significant and real across all sectors.
Next, we run the numbers for student composite scores on the ACT between sectors in Milwaukee. Independent charters must be excluded from this analysis because the sample size is too low to draw any valid conclusions from the model. The results of this analysis are included in Table 2 below.
Table 2. Effect of School Sector on ACT Composite Scores, 2016 Milwaukee
VARIABLES ACT Composite MPCP 2.811*** (0.776) Instrumentality -0.588 (1.460) Non-Instrumentality 4.474*** (0.961) English Language Learners
-4.974
(3.530) Economically Disadvantaged
0.901
8 Wisconsin Institute for Law & Liberty
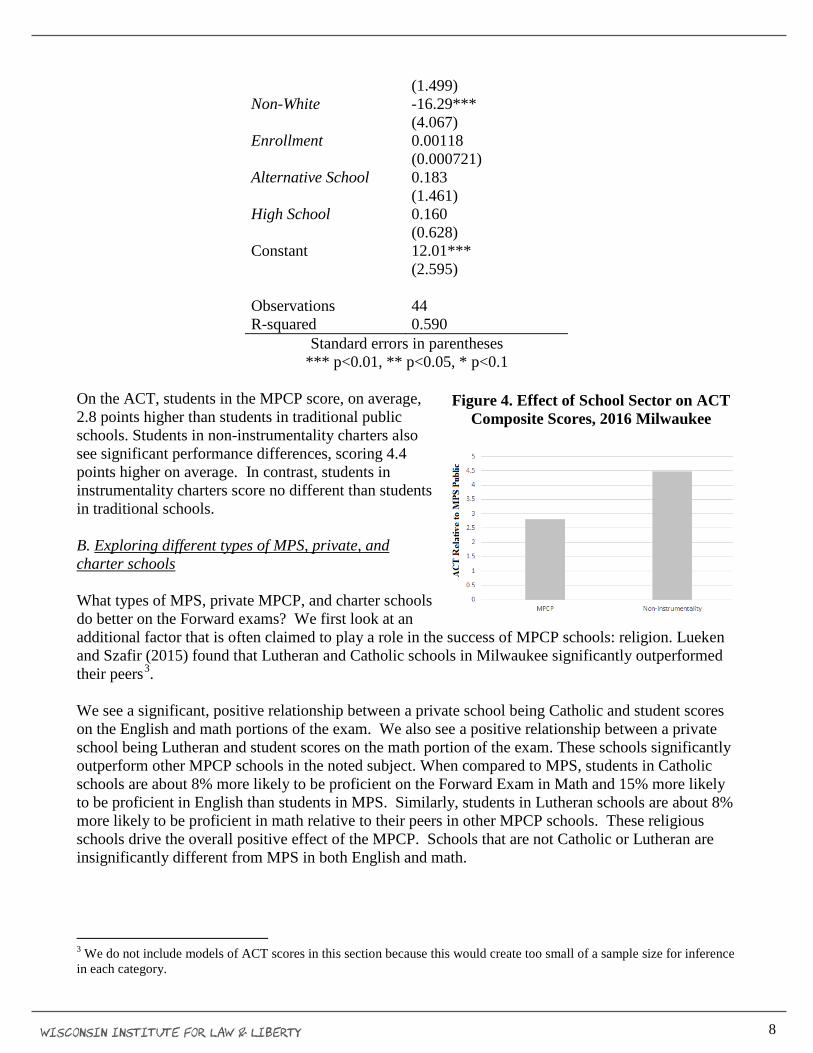
Figure 4. Effect of School Sector on ACT Composite Scores, 2016 Milwaukee
(1.499) Non-White -16.29*** (4.067) Enrollment 0.00118 (0.000721) Alternative School 0.183 (1.461) High School 0.160 (0.628) Constant 12.01*** (2.595) Observations 44 R-squared 0.590
Standard errors in parentheses *** p<0.01, ** p<0.05, * p<0.1
On the ACT, students in the MPCP score, on average, 2.8 points higher than students in traditional public schools. Students in non-instrumentality charters also see significant performance differences, scoring 4.4 points higher on average. In contrast, students in instrumentality charters score no different than students in traditional schools. B. Exploring different types of MPS, private, and charter schools What types of MPS, private MPCP, and charter schools do better on the Forward exams? We first look at an additional factor that is often claimed to play a role in the success of MPCP schools: religion. Lueken and Szafir (2015) found that Lutheran and Catholic schools in Milwaukee significantly outperformed their peers3. We see a significant, positive relationship between a private school being Catholic and student scores on the English and math portions of the exam. We also see a positive relationship between a private school being Lutheran and student scores on the math portion of the exam. These schools significantly outperform other MPCP schools in the noted subject. When compared to MPS, students in Catholic schools are about 8% more likely to be proficient on the Forward Exam in Math and 15% more likely to be proficient in English than students in MPS. Similarly, students in Lutheran schools are about 8% more likely to be proficient in math relative to their peers in other MPCP schools. These religious schools drive the overall positive effect of the MPCP. Schools that are not Catholic or Lutheran are insignificantly different from MPS in both English and math.
3 We do not include models of ACT scores in this section because this would create too small of a sample size for inference in each category.

9 Wisconsin Institute for Law & Liberty
Figure 5. Effect of School Religiosity on Forward Exam Performance, 2016 Milwaukee
Figure 5 highlights the differences between Lutheran and Catholic schools, MPCP schools, charter schools, and MPS schools (which is the baseline). Only differences that significantly differ from 0 in the analysis are shown. Next, we compare the performance of different charter school authorizers in Milwaukee. Currently independent charters in Milwaukee are authorized by the University of Wisconsin-Milwaukee or by the city. Non-instrumentality and instrumentality charters are authorized by the Milwaukee Public School district. Among independent charters, the best performers are those charter schools authorized by the University of Wisconsin-Milwaukee. On the Forward exam, UW-Milwaukee charters have approximately 9% higher proficiency rates in English and 7% higher proficiency rates in mathematics compared to MPS. The performance of city-authorized charters does not differ significantly from traditional public schools. Figure 64 below compares the performance of these schools on the Forward Exam relative to the performance of other public schools.5
Figure 6. Effect of Charter School Type on Proficiency, Forward Exam 2016
In our final analysis, we break down traditional MPS schools by type of school. MPS designates its traditional schools as neighborhood, citywide specialty, or neighborhood specialty. Neighborhood
4 The regression for this figure appears in Appendix Table A2. 5 MPCP schools are not included in this table to allow a look at public schools only.

10 Wisconsin Institute for Law & Liberty
schools are public schools assigned on the basis of where a student resides. Neighborhood specialty schools have specific areas of focus such as arts or technology and give significant preference to local students in enrollment. Citywide specialty schools offer specific programs of study, such as language immersion, a Montessori curriculum, or International Baccalaureate (MPS 2017). These schools do not always give priority to neighborhood students. Are there performance differences among these schools? In the table below we separate the specialty schools from the baseline, neighborhood schools. In the ‘fewer controls’ models, we leave out the economically disadvantaged and race variables for reasons that will be made clear below. Table 3. Effect of Public School Type on Performance, Forward Exam 2016
(1) (2) (3) (4) VARIABLES Math Math English English Citywide Special. 0.0800** 0.0153 0.130*** 0.0466 (0.0314) (0.0258) (0.0356) (0.0270) Neigh. Special. -0.0284 -0.0241 -0.00831 -0.00231 (0.0618) (0.0492) (0.0700) (0.0515) Non-Instrumentality 0.0841** 0.0978*** 0.0856* 0.101*** (0.0418) (0.0335) (0.0473) (0.0350) Instrumentality 0.175*** 0.0802* 0.163** 0.0427 (0.0570) (0.0462) (0.0645) (0.0483) Independent 0.0759** 0.0782*** 0.0829** 0.0835*** (0.0327) (0.0263) (0.0370) (0.0275) MPCP 0.0431* 0.0420** 0.0687*** 0.0650*** (0.0228) (0.0186) (0.0258) (0.0194) Enrollment 5.42e-06 5.53e-06 4.08e-05 4.01e-05 (3.34e-05) (2.66e-05) (3.78e-05) (2.79e-05) ELL 0.0362 0.145** -0.0473 0.0955 (0.0716) (0.0584) (0.0811) (0.0611) Alternative -0.0552 -0.0392 -0.0536 -0.0345 (0.0991) (0.0790) (0.112) (0.0826) Economic Status -- -0.0899** -- -0.141*** (0.0448) (0.0469) Non-White -- -0.460*** -- -0.555*** (0.0587) (0.0614) Elementary/Secondary -0.0491* -0.0333 -0.0390 -0.0208 (0.0292) (0.0235) (0.0331) (0.0246) High School -0.0561** -0.0537** -0.0554* -0.0522** (0.0279) (0.0223) (0.0316) (0.0233) Middle School -0.116** -0.0598 -0.121** -0.0492 (0.0533) (0.0427) (0.0603) (0.0447) Constant 0.173* 0.179* 0.189 0.225** (0.104) (0.0949) (0.118) (0.0992) Observations 237 237 237 237 R-squared 0.106 0.438 0.106 0.520
***p<.01, **p<.05, *p<.1

11 Wisconsin Institute for Law & Liberty
Figure 7. Proficiency Relative to MPS Neighborhood Schools with Controls
Figure 9. Disadvantaged Students by Sector
Figure 8. Percent of White Students by Sector
Before race and economic status are taken into account, we see that city specialty schools outperform neighborhood public schools in both reading and mathematics. However, once the race and economic composition of these schools is taken into account, these performance differences disappear. Figure 7 details the differences in the performance of school types in the full model. Note that, because we have further pared down MPS schools, the baseline group is now neighborhood MPS schools. Why are the results for specialty schools so flat? More than any other sectors in Milwaukee, citywide specialty schools have major racial and economic differences that correlate with performance. It appears that these differences chiefly explain the performance advantage of citywide specialties. Figure 8 below shows the percentage of students in each school type in Milwaukee who are white.
The chart shows that city specialty schools (and instrumentality charters) have significantly more white students than any other school sector in Milwaukee. Charter and private schools are very similar to neighborhood MPS schools in terms of the percentage of their students who are white. Figure 9 shows a similar story for economically disadvantaged students.
Citywide specialty schools and instrumentality charters have the lowest percentage of students from economically disadvantaged backgrounds of any schools in the city, while private and charter schools are far more similar to neighborhood publics.

12 Wisconsin Institute for Law & Liberty
What accounts for these disparities? A number of these public schools have admissions procedures (MPS 2017) which may be prohibitive for poor and minority students. A cursory examination of admission information on the MPS website revealed some type of admission requirement beyond the normal MPS process in the case of 21 out of 30 (70%) citywide specialty MPS schools.6 For example, many of the citywide specialty schools are Montessori schools which have a requirement that students attend a Montessori school continually through their school career. Because economically disadvantaged people are more likely to change housing and neighborhoods (Crowley 2003), this makes it difficult for such students to persist in Montessori education. High school specialty schools often conduct enrollment admissions primarily through early admissions, during which academic records in middle school can be taken into account. In the case of Golda Meir, this admissions process may begin as early as third grade. These complex, long term processes can sort out disadvantaged kids. Other requirements identified include requiring parents to pay fees to the school and requiring letters of recommendation from teachers.
Another possible explanation would be that poor parents simply don’t have ready access information to help their children enroll in specialty schools. However, the lack of significant disparities among the choice and charter sector—where an affirmative action to enter is also required on the part of parents—suggests that this is not the case.
The point here is not to say that any admissions requirements are bad. But admissions standards are going to impact the composition of the student body which will have some impact on the school’s test scores. And it makes it hard to compare specialty schools – with admissions policies – against MPCP, charter, and neighborhood MPS schools that do not.
C. Statewide Comparisons
Next, we consider performance by all school sectors on the Forward Exam and ACT statewide excluding Milwaukee. It should be noted that a sizable percentage of students in the WPCP previously attended private schools without a voucher. According to DPI, approximately 75.7% of students in the WPCP attended a private school during the previous year (DPI Press Release 2015). Because the child attended the private school prior to enrolling in the WPCP, it is difficult to state whether the findings below are a result of the WPCP. Nonetheless we proceed to compare performance by public, charter, and WPCP/RPCP in the hopes of gaining some idea of performance.
Many of the schools in Wisconsin’s non-Milwaukee choice programs (WPCP and RPCP) include only a small number of choice students as part of a larger student body. Only those students who are utilizing the voucher in the private school are included in these results. The differences in the income caps of the programs are accounted for by the inclusion of a control variable for economic status, which accounts for students who are under 185% of the poverty line—the income limit for the statewide program and less than the income limit for the RPCP. These results are included in the analysis. Note that fixed effects for each school district are included in the model but excluded from the table for ease of viewing.7
6 A list of these requirements is found in appendix table A3. 7 Virtual schools are technically defined as charter schools However, their unique characteristics warranted the inclusion of a separate variable for these schools.

13 Wisconsin Institute for Law & Liberty
Table 4. Effect of School Type on Forward Exam Performance, Wisconsin 2016
VARIABLES Mathematics English/Language Arts Choice -0.0925 -0.0159 (0.0578) (0.0532) Charter -0.0128 0.0152 (0.0118) (0.0108) English Language Learner -0.0760 -0.0175 (0.0560) (0.0515) Economically Disadvantaged -0.570*** -0.548*** (0.0240) (0.0221) Non-White -0.0532 -0.0416 (0.0326) (0.0300) Enrollment 2.86e-05*** 1.90e-05** (1.05e-05) (9.63e-06) Alternative School -0.00815 -0.0588* (0.0349) (0.0321) Virtual School -0.192*** -0.121*** (0.0314) (0.0289) Elementary/Secondary -0.0970*** -0.0184 (0.0250) (0.0230) High School -0.187*** -0.0866*** (0.00703) (0.00648) Junior High School -0.155*** -0.0832*** (0.0247) (0.0227) Middle School -0.103*** -0.0439*** (0.00645) (0.00593) Constant 0.803*** 0.722*** (0.116) (0.107) Observations 1,766 1,765 R-squared 0.749 0.709
Standard errors in parentheses *** p<0.01, ** p<0.05, * p<0.1
When comparing the private, charter, and public schools across the state (excluding Milwaukee), we do not observe significant proficiency differences on the Forward Exam The coefficients are negative, but do not reach traditional levels of statistical significance.
The most significant factor in predicting performance is the socio-economic status of the family. Similar to the effect of race seen in Milwaukee, schools with high levels of poverty have proficiency rates more than 50% lower on both subjects under study here with all other variables held constant.

14 Wisconsin Institute for Law & Liberty
Figure 10. Effect of School Sector on ACT Scores, 2016
However, with regard to the ACT exam, there is a statistically significant effect of WPCP/RPCP and charter on ACT scores. Once all control variables are taken into account, schools in the Racine and Wisconsin choice programs score approximately 6 points higher on the ACT composite score than traditional public schools. When one considers that the highest possible score on the ACT is a 36, this movement of 6 points represents a more than 16% increase in ACT scores associated with attending a choice program school. Because the ACT is a college entrance exam, such a large shift could open up new opportunities for college admissions and scholarships. Charter schools score about 1.1 points higher on the ACT, though this number is at the lowest level of statistical significance (p<.1).
Table 5. Effect of School Type on ACT Composite Scores, 2016 Wisconsin
VARIABLES ACT Composite Choice School 6.435*** (1.919) Charter School 1.119* (0.587) Economically Disadvantaged -7.436*** (1.069) English Language Learner 3.192 (6.388) Non-White -1.869 (1.504) Enrollment 0.000506 (0.000321) Alternative School -1.333 (0.873) Virtual School -2.160* (1.109) High School 1.380** (0.678) Constant 21.55*** (2.889) Observations 411 R-squared 0.930
Standard errors in parentheses *** p<0.01, ** p<0.05, * p<0.1

15 Wisconsin Institute for Law & Liberty
D. Further Breakdowns of Statewide Data We are able to breakdown public school performance based upon urbanicity. Data limitations prevent us from comparing private schools based upon geography. Figure 11 below highlights the results from a regression including all of the controls from the previous analyses along with DPI’s designation of a school district as urban, suburban, rural or small town.8 Because these designations are only included for public schools, choice schools are left out of this analysis.9
Figure 11. Forward Exam Proficiency by Urbanicity, Wisconsin 2016
Relative to suburban schools, we see that Wisconsin’s rural and small town schools have significantly lower performance. In Math, students in rural schools are about 8% less likely to be proficient. Small town students are about 4% less likely to be proficient. In English, rural students are about 5%, and small town students about 4%, less likely to be proficient. In terms of proficiency disparities, rural areas look a lot like Milwaukee.
V. LIMITATIONS
Several limitations on this research warrant mention. Of primary concern is that a sizable share of data is missing from the analysis of the outstate program due to either high levels of parental opt-out or too few students in the school participating in the program to allow for the results to be released. This lack of data may partially explain our lack of significant differences when we exclude Milwaukee with respect to Forward Exam results. As the program grows in future years, more data will likely become available, leading to a higher degree of confidence in our findings about the programs outside of Milwaukee.
Another limitation is the lack of accurate data for disabled students at private schools in the Choice programs relative to public schools. Previous academic studies have concluded that disabled students are under-reported in choice schools (Wolf, Witte and Fleming 2012):
“Most private schools lack the incentives, personnel, protocols, and organizational culture that lead public school systems to label students
8 “Towns” are defined as areas not in metropolitan areas with between 2,000 and 25,000 people. Ripon is an example of a town. “Rural” areas have fewer people than towns. An example of rural area by DPI’s definition is Weyauwega. “Urban” areas include large central cities like Green Bay or Madison. “Suburbs” are smaller designations located close to urban areas. 9 The regression for this table is found in Appendix Figure A2.

16 Wisconsin Institute for Law & Liberty
with disabilities as requiring special education services (Wolf et. al. 2012).”
Others have suggested that the framework of laws and subsidies for disabled students results in over identification in public schools (Greene 2007). Wolf et. al. estimated a rate of disabled students in choice schools significantly higher than that reported by DPI. However, the rate of disabled students observed in our data (3.1%) was far closer to the DPI numbers. Further evidence of underreporting is found among choice schools that have the explicit purpose of serving students with disabilities, such as St. Coletta Day School and Lutheran Special School, which report disability rates of less than 62%, suggestive of undercounting.10 Because we do not have confidence in the between-sector comparability of the disability data, we do not include this variable in our analysis. In future years, as more accurate data become available, we may be able to better account for this variable.
A final issue of note is that this paper is not yet able to account for growth due to a lack of growth data for private schools. We believe that such growth measures are a better metric for measuring the performance of choice schools, as students may enter schools several years behind academically. Future iterations of the state report card will include data on student growth and we will be able to account for it across all sectors.
VI. CONCLUSIONS
For too long, the debate over education outcomes and student performance in various school sectors has been muddied by insufficient data and apples to oranges comparisons. This paper seeks to dispel some of this confusion and provide policymakers, parents, and the general public with the clearest possible comparison of student outcomes in each school sector.
Once again, we find that choice and charter schools in Wisconsin perform better when a proper apples to apples comparison is made. This means, when things like poverty, race, and English language learners are taken into account and properly controlled for, we are finding that student outcomes on test scores are simply better in the choice and charter sector as opposed to traditional public schools. On both the ACT and Forward Exams, students in Milwaukee’s choice and charter sectors performed better, even when compared to the schools often held up by the city as the best. And the younger choice programs in Racine and across the state show students significantly outperforming their public school peers on the ACT.
This matters, not to build one sector up and tear another down, but because if we are to take seriously the wish of all Wisconsin parents to provide their children with the best opportunity to succeed, we have to make the best use of the available data to provide parents with the best information about what is working and what isn’t. This model does that for the very first time.
To continue comparing choice and charter students directly with students in public schools without accounting for important racial and socioeconomic differences is unfair and hinders the debate. Policymakers and reporters would do well to consider the more even-handed comparisons made in this paper before making claims that there is “no evidence” for higher performance in choice and charter.
10 Coletta Day School describes its purpose as “serving students with intellectual disabilities. Its Forward Exam disability rate is 61%. Lutheran Special School describes its purpose as “prepar(ing) students with unique learning challenges. Its Forward Exam disability rate is 57%.

17 Wisconsin Institute for Law & Liberty
REFERENCES
American Civil Liberties Union. 2015. “Milwaukee Voucher Schools Still Discriminate Against Kids with Disabilities.” Press Release
Bilfulco, Robert. 2012. “Can Nonexperimental Estimates Replicate Estimates Based on Random Assignment in Evaluations of School Choice? A Within-Study Comparison.” Methods for Policy Analysis 31: 729-751 Cowen, Joshua, David Fleming, John Witte, Patrick Wolf and Brian Kisida. 2013. “School Vouchers and Attainment: Evidence from a State-Mandated Study of Milwaukee’s Parental Choice Program.” Policy Studies 41: 147-168
Crowley, Sheila. 2003. “The Affordable Housing Crisis: Residential Mobility of Poor Families and School Mobility of Poor Children.” Journal of Negro Education 72.
DeAngelis, Corey and Patrick Wolf. 2016. “The School Voucher: A Get out of Jail Free Card?” Unpublished manuscript.
Department of Public Instruction 2015. “Statewide voucher program enrollment counts.” News release. https://dpi.wi.gov/sites/default/files/news-release/dpinr2015_103.pdf
Flanders, Will. 2017. “Bang for the Buck: Autonomy and Charter School Efficiency in Milwaukee.” Journal of School Choice, forthcoming.
Flanders, Will and Corey DeAngelis. 2016. “Economic Benefit of School Choice.” Unpublished manuscript.
Greene, Jay. 2007. “Fixing Special Education.” Peabody Journal of Education 82: 703-723.
Johnson, Annysa. October 24, 2016. “School Voucher Programs Grow in 2015-’16.” Milwaukee Journal Sentinel.
Lueken, Marty and CJ Szafir. 2015. “Apples to Oranges? When comparisons are made between MPCP and MPS Schools” Wisconsin Institute for Law and Liberty Policy Brief.
Milwaukee Public Schools. “Find a School” http://mps.milwaukee.k12.wi.us/en/Schools/Find-a-School.htm. Accessed February 21, 2017.
Stuart, E.A. and Rubin, D.B. 2008. “Matching with multiple control groups and adjusting for group differences.” Journal of Educational and Behavioral Statistics 33: 279-306. Wolf, Patrick, John Witte and David Fleming. 2012. “Special Choices: Do voucher schools serve students with disabilities? Education Next 12. Witte, John F., Deven E. Carlson, Joshua M. Cowen, and David J. Fleming. 2011. “MPCP Longitudinal Educational Growth Study: Fourth Year Report.” Department of Education Reform, University of Arkansas

18 Wisconsin Institute for Law & Liberty
Appendix A1. Effect of Years in Program and Religiosity on Forward Exam Results Milwaukee
VARIABLES Math English/Language Arts Catholic School 0.0821*** 0.152*** (0.0276) (0.0286) Lutheran School 0.0807*** 0.0255 (0.0267) (0.0276) Other MPCP -3.61e-05 0.0266 (0.0208) (0.0215) Non-Instrumentality 0.0946*** 0.0890*** (0.0319) (0.0331) Instrumentality 0.0808* 0.0348 (0.0446) (0.0462) Independent 0.0760*** 0.0723*** (0.0250) (0.0260) Non-White 0.447*** 0.545*** (0.0573) (0.0594) Enrollment 9.32e-06 4.69e-05* (2.56e-05) (2.66e-05) ELL 0.145** 0.0695 (0.0571) (0.0592) Economic Status -0.0896** -0.156*** (0.0433) (0.0449) Alternative School -0.0413 -0.0485 (0.0769) (0.0797) Elementary/Secondary -0.0329 -0.0234 (0.0228) (0.0236) High School -0.0531** -0.0452** (0.0215) (0.0223) Middle School -0.0535 -0.0386 (0.0401) (0.0416) Constant 0.183** 0.261*** (0.0916) (0.0950) Observations 237 237 R-squared 0.464 0.551
Standard errors in parentheses *** p<0.01, ** p<0.05, * p<0.1

19 Wisconsin Institute for Law & Liberty
Appendix A2. Effect of Charter Type on Forward Exam Proficiency, Milwaukee 2016
VARIABLES English Mathematics UW Milwaukee 0.0932*** 0.0716** (0.0298) (0.0317) City of Milwaukee 0.0263 0.0491 (0.0306) (0.0326) MPS Non-Instrumentality 0.0781*** 0.0836*** (0.0283) (0.0301) MPS Instrumentality 0.0397 0.0720* (0.0395) (0.0420) Non-White -0.341*** -0.263*** (0.0829) (0.0882) Enrollment 7.01e-05** 9.42e-06 (3.11e-05) (3.31e-05) Economically Disadvantaged -0.436*** -0.379*** (0.0836) (0.0889) English Language Learners 0.111* 0.225*** (0.0625) (0.0664) Alternative School -0.0247 -0.0275 (0.0680) (0.0724) Elementary/Secondary -0.0394 -0.0489 (0.0309) (0.0329) High School -0.0638*** -0.0699*** (0.0228) (0.0243) Middle School -0.0118 -0.0316 (0.0379) (0.0404) Constant 0.486*** 0.435*** (0.113) (0.120) Observations 163 163 R-squared 0.728 0.625
Standard errors in parentheses *** p<0.01, ** p<0.05, * p<0.1

20 Wisconsin Institute for Law & Liberty
Table A3 shows citywide specialty schools that have listed admissions requirements on the MPS website.11 These requirements vary on a school-by-school basis. Other requirements beyond these may exist. “Early Admissions Process” schools require students to begin the application process in the months of October and November of eighth grade. In some cases, this involves evaluation of previous academic records. Golda Meir accepts applications for students as early as 3rd grade. “More than general MPS application” means that parents are unable to apply for the school through the normal process. For example, Morse Marshall requires applicants to complete a form where the teacher rates students in a number of categories. Requirements beyond those described here may exist. Note that all MPS high schools now offer early admissions. However, only the schools listed here require it.
Table A3. Admissions Requirements at Citywide Specialty Schools, Milwaukee
School Name Admission Requirement
Identified School Name Admission Requirement
Identified
King IB HS Early Admissions Process Maryland Ave Montessori Previous Montessori experience
Meir School Early Admissions Process Morse MS More than general MPS application
MKE HS-arts Early Admissions Process New School Students must have HS 10 credits
Hayes Bilingual K-1 only, previous language experience 2-5
MKE French Immersion School
K-1 only, previous language experience 2-5
MKE German Immersion School
K-1 only, previous language experience 2-5
MKE Spanish Immersion
K-1 only, previous language experience 2-5
Bradley Tech More than general MPS application School of Languages More than general MPS application Audubon HS More than general MPS application
Elm Creative Arts Parents must pay fees for art experiences
Barbee Montessori Previous Montessori experience Craig Montessori Previous Montessori experience Fernwood Montessori
Previous Montessori experience
MacDowell Montessori
Previous Montessori experience
11 Kluge School and Academy of Accelerated Learning are described as “specialty schools” but not classified as such by MPS.