the decision to go private - goizueta business...
TRANSCRIPT

The Decision to Go Private
Bo Becker, Joshua Pollet***
This version: June 2008
Abstract. Several theories have been proposed to explain the flow from public to private equity ownership. By studying the propensity of individual firms to become private during the previous few decades, we attempt to distinguish between the various theories. Firm size, risk, valuation, growth, and profitability all predict the decision to go private, consistent with many plausible theories. We find support for several specific explanations of buyout volumes, including the importance of junk bonds, the supply of private equity, the impact of Sarbanes-Oxley, and the risk-sharing benefits of public ownership. However, we do not find evidence that the break up of conglomerates was a motivation for buyouts, nor does corporate governance appear to play a role in this decision. (JEL: G32, G34)
* Bo Becker: Department of Finance, University of Illinois at Urbana-Champaign, [email protected];
Joshua Pollet: Goizueta Business School, Emory University, [email protected].**
We wish to thank Chris Leach, Timothy Johnson, David Matsa, Geoffrey Smith, René Stulz and Michael Weisbach, as well as seminar participants at UIUC, Ohio State, and the Stockholm Institute for Financial Research for helpful comments. We are especially grateful to Per Strömberg for fruitful suggestions and providing the data on private equity capital commitments.

1
1. Introduction
The flow of US firms from public to private ownership in the last decades has been
volatile and at times very considerable (occasionally reaching close to a percent of aggregate
market value). In the last few decades, there were two big US waves of buyouts, the first
peaking in 1987-1988 and the second perhaps peaking in 2006-2007. The year-to-year variation
is large (the dollar value of buyout transactions in 2006 was approximately 14 times the value
in 1992). Similarly, variation in the flow across industries is considerable (see Figure 2). Which
theories of the private-public choice can explain the patterns of this flow? In this paper, we
examine empirically a wide set of theories and compare their ability to explain the choice of
public firms to go private over the 1980-2006 period.
We first discuss a number of theories that relate to the choice between private and
public ownership, and outline the time-series and cross-sectional predictions about the
incidence of buyouts from each. These include a trade-off between risk sharing benefits of
public ownership (see e.g. Leland and Pyle (1977)) and better control of agency problems in
private firms (see e.g. Fama and Jensen (1983), Jensen (1986), Jensen (1989) and Kaplan (1989)).
We discuss several reasons for risk-averse behavior beyond the utility functions of owners,
such as bankruptcy costs, and what predictions these alternatives make regarding the private-
public choice.1 Agency problems related to free cash flow (Jensen (1986), Lehn and Poulsen
(1989)) may be less severe in private firms. Debt overhang (Myers (1977)) may be more severe
because firms that go private typically increase leverage considerably.
Another category of explanations is institutional in nature. This includes the claim that
the development of junk bond markets in the first half of the 1980s allowed firms to raise more
external finance without relying on equity markets (see Jensen 1989), facilitating private
ownership of large firms. The recent buyout wave has been explained by Sarbanes-Oxley
legislation (SOX), which allegedly has made listing less attractive (see Zingales 2006, Engel,
Hayes and Wang (2007) and Leuz, Triantis and Wang (2008)). Yet another group of
explanations can be summarized as “cheap debt”. These theories suggest that when (long term)
interest rates are low, it is “cheap” to finance a firm with public debt, relative to public equity,
and that this allows firms to go private by exploiting the cheap debt financing (see e.g. Kaplan
1 See Bodnaruk, Kandel, Massa and Simonov (forthcoming) as well as Aslan and Kumar (2007) for evidence that owners of firms may be risk averse.

2
and Stein (1993) and Axelson, Jenkinson, Strömberg and Weisbach (2007)). Beyond the cost of
debt, the cost of private equity may potentially vary as well (see e.g. Kaplan and Strömberg
(2008) for a discussion of the supply of private equity). What really matters for the decision to
go private is the relative cost of public and private equity. The risk sharing and agency theories
have direct implications for this relative cost, but other factors, such as regulation of
institutional investors, can potentially drive these differences as well.
We attempt to evaluate the full set of theories and derive from each a set of predictions
applicable to firm choices of public and private ownership. We test the various theories’
predictions in panel data for US firms that could choose to switch from public to private
ownership during the 1980-2006 period. We find that smaller firms, firms with low volatility,
firms with low asset growth, firms with high book-to-market ratios, and firms with high
profitability are likely to go private. The magnitudes of these effects are economically
important. While the unconditional average annual probability of a firm in our sample going
private is 0.56%, changing each of the five variables one standard deviation in the appropriate
direction increase the probability to 2.24%. These five variables provide considerable predictive
power for which firms go private, but they generally do not provide sharp tests of the
alternative theories. In each case, the evidence is consistent with multiple explanations.2
Several sharper tests are provided by other variables. We find that conglomerates are
not more likely to go private, neither during the 1980s nor at other times, which seems at odds
with the conglomerate break-up theory of the 1980s buyout wave. On the other hand, we find
that the junk bond wave of the 1980s coincides with a higher relative propensity of large firms
to go private. This is consistent with the theory that the development of junk bonds was a key
financial innovation allowing larger firms to switch to private status. It is also consistent with a
more demand-driven view of the advent of junk bonds. We find no evidence that either
economy-wide or firm-specific interest rates are determinants of going private volumes, in
contrast to the predictions of cheap debt theories. We also examine the effect of the supply of
equity, as opposed to debt. To address serious endogeneity concerns (the amount of financing
raised by buyout funds reflects the future investment opportunities of such funds) we follow
Gompers and Lerner (2000) and employ an instrument for the supply of capital for buyouts.
2 For example, the finding that smaller firms are more likely to go private is consistent with any theory positing fixed costs of being public but benefits which scale. This set of theories includes, but is not limited to, the standard risk sharing argument.

3
We find considerable evidence that exogenous supply shifts are related to the decision to go
private. We also find support for the argument that Sarbanes-Oxley forced smaller firms off the
stock exchange. Examining firm-level corporate governance variation, we find no evidence that
entrenched managers are able to reduce the probability of going-private transactions.
To summarize, our evidence points to the importance of many of the institutional
explanations that have been advanced for going private waves, and suggests that the standard
trade-offs (e.g. risk and agency problems) account for a substantial portion of the evidence at
the firm-level. However, the evidence does not support some of the institutional explanations
(e.g. cheap debt, the break-up of conglomerates, and corporate governance).
This paper is part of a literature, partially inspired by recent buyout volumes, that
explores the role of public and private equity ownership, including Boot, Gopalan and Thakor
(2006, forthcoming) and Axelson, Jenkinson, Strömberg and Weisbach (2007). In particular, our
results are related to the recent empirical papers by Aslan and Kumar (2007), who study the
decision to go public and go private in the UK and Ireland, and Bharath and Dittmar (2007),
who compare private and public firms as well as considering the timing of going private
decisions. Unlike these papers, we do not study IPOs, nor do we compare public firms to
similar private peers. Instead we focus exclusively on the decision to go private. Also unlike
both these papers, we consider several of the proposed institutional explanations for the recent
buyout waves in detail. For example, we examine the cheap debt theory of buyouts, the theory
that junk bonds constituted a key innovation which allowed a different set of firms to go
private, as well as the theory that 1980s buyouts aimed to break up conglomerates. Finally,
unlike both Aslan and Kumar (2007) and Bharath and Dittmar (2007), we study how
governance issues at the firm level interact with the process of going private. Engel, Hayes and
Wang (2007) examine the quarterly frequency of going private volumes as well as
announcement returns before and after the passage of Sarbanes-Oxley, but do not apply our
difference-in-difference method (i.e. using firm size). They do not consider other theories of
going private.
There is a large literature on prices of going private transactions, the leverage before
and after such deals, and performance changes around the event (see e.g. Kaplan and
Strömberg (2008)). Since we are specifically interested in explaining the flow from public to
private ownership, we do not consider these related questions.

4
2. Theories of the choice between private and public status
A number of theories and hypotheses involve predictions about which firms will be
public and which will be private. Many of these theories are specifically related to the buyout
decision, and some are of a more general nature. In this section, we outline a series of the most
closely related arguments as well as a few arguments about the public-private choice that have
not been codified but rely on standard arguments from the literature on corporate finance. We
focus on the implications in terms of which public firms are most likely to go private, as
opposed to how firm performance might change around a going private event or the price at
which a transaction to go private takes place. Finally, we summarize the empirical predictions
of all theories at the end of the section.
2.1 Risk aversion
The risk sharing benefits of public equity are lost when a firm goes private. The private
firm will likely have fewer owners, and those owners will probably be less diversified than the
typical owners of public equity. Hence, the cost of risk is higher for private firms. This impacts
welfare directly, if agents are risk averse, but possibly also indirectly, if private firms are
making investment, capital structure, and organizational choices to reduce risk in a manner
that is not first best optimal.
Even with risk neutral owners, private firms may be effectively more risk averse if
owners have limited capital and firms face bankruptcy costs or costs of financial distress.3
Essentially, the limited capital of the owners forces private firms to be highly levered and face
relatively high probabilities of financial distress and inefficient liquidation. In this situation
private firms may also choose to forgo risky but otherwise valuable investment opportunities.
Of course, these difficulties can be avoided by going (or remaining) public.
This argument for the benefits of ownership through the stock market does not provide
a theory of private and public ownership choices without some countervailing benefit of
private ownership (or, equivalently, some disadvantage of public ownership). An argument
that involves an advantage of only one form of ownership is half a theory at most. One
potential benefit to being private is that agency costs are lower for private firms (see also
3 Costs of financial distress could be due to debt overhang problems (Myers (1977), see also the next section), or fire-sale discounts (Shleifer and Vishny (1992)).

5
section 2.3 below). However, there are many potential advantages and disadvantages to being
private firm instead of publicly owned, and therefore, considering partial theories when they
provide empirical predictions is useful. We must keep in mind that some countervailing force
is implicitly assumed to exist, favoring the other form of ownership.
In the case of risk sharing, the main predictions are as follows; first, firms whose cash
flows entail more risk will be less likely to go private than those with stable cash flows. Second,
the limits to private risk sharing are likely more severe for large firms, and therefore, large
firms are also less likely to become private. Third, firms with high cash flow and low growth
prospects provide a cushion for their owners’ consumption, thereby reducing the risk sharing
problems for privately held firms.
2.2 Debt overhang
Myers (1977) suggests that leverage can distort investment incentives, causing debt
overhang. Debt overhang refers to a situation where the cash flow generated by new
investment is partially appropriated by existing debt holders, and hence positive net present
value projects are not always be accepted by the owners. Firms for which debt overhang is
likely to be important are those firms that have high investment needs, especially if the
investment in question has volatile investment payoffs. Hence, to the extent that buyouts
necessitate high leverage (to replace public equity), growth firms should be less likely to go
private than more stable firms.
2.3 Free cash flow
Jensen (1986) suggests that managers will dislike paying out cash because it reduces the
amount of resources under their control and increases the likelihood that they will have to raise
external finance, incurring capital markets’ scrutiny. Instead, managers prefer to grow their
firms, creating substantial agency problems between management and owners. Jensen suggests
that high leverage capital structures and the threat of takeovers can help remedy these agency
problems. In particular, he indicates that going private transactions are useful because they
result in increased leverage. He also suggests that going private is most useful for firms with
“stable business histories and substantial free cash flow (i.e. low growth prospects and high
potential for generating cash flows) – situations where agency costs of free cash flow are likely
to be high.” The free cash flow theory predicts that leveraged buyouts will occur for firms low

6
asset growth and high book-to-market (due to lower investment needs), low volatility
(stability), and high cash flow.
2.4 The supply of debt and equity
Several arguments for the benefits of going private are related to the considerable use of
debt in going private transactions (see e.g. Kaplan (1989)). One obvious reason is that by
leaving the public equity markets, the supply of equity financing becomes more limited for
private firms. It has also been suggested that public firms take on too little debt because of
managerial preferences (Jensen (1989)) and that privatized firms are closer to their optimal
capital structure, fully exploiting tax and other advantages of debt. Whatever the reason, the
high leverage suggests that private firms will benefit more from a reduction in the price of debt
relative to the price of equity. In a Modigliani-Miller world, such relative price changes are
impossible, but it has been argued that in practice, the relative price of debt and equity changes
(Baker and Wurgler (2000)). In the context of buyouts, Axelson, Jenkinson, Strömberg and
Weisbach (2007) find that prices paid in going private transactions are related to the economy-
wide cost of borrowing, and interprets this as evidence that the “availability of financing
impacts booms and busts in the private equity market”. If the price of debt is an important
driver of the decision to go private, we expect those firms that face low borrowing costs to be
particularly likely to go private.
The cost of equity for privately held firms may vary, for example due to variation the
assets available to buyout-oriented private equity firms (see e.g. Kaplan and Strömberg (2008)
for a discussion of the supply of private equity). Periods of high supply private equity may
reduce the cost of private equity relative to public equity, and thus encouraging firms to go
private. As pointed out in the introduction, several theories, including risk sharing and agency
theories, have implications for the relative prices. Kaplan and Strömberg (2008) and Gompers
and Lerner (2000) argue that much of the variation in the amount of money committed to
private equity funds is driven by institutional factors and long-term trends. If we can identify
these factors, we can test whether the supply of private equity drives the frequency of going
private transactions.
2.5 Breaking up conglomerates
One explanation of the breakups in the 1980s is that they represented the breakup of
conglomerates largely formed in 1960s. This is suggested by Shleifer and Vishny (1990) both for
7
hostile takeovers (by listed acquirers) and for buyouts: “To a significant extent the 1980s reflect
the deconglomeration of American business. Hostile takeovers and leveraged buyouts ...
facilitated this process”. If this theory is true for buyouts, multi-segment firms should be more
likely to go private than single segment firms, at least during the 1980s.
2.6 Other institutional theories
Many attempts to explain the large and volatile buyout volumes have invoked
institutional and legal factors.
The wave of going private activity in the 1980s followed on the heels of a vast increase
in the availability of non-investment grade debt issues, also called junk bonds. Junk bonds were
rarely issued prior to the 1980s, and the volumes grew very quickly until the late 1980s and
then declined substantially (see Kaplan and Holmström (2003), who report that non-investment
grade bond issuance peaked in 1986). Jensen (1989) suggests that this constituted a key
financial innovation, allowing firms to go private which had previously been unable to. This
interesting argument is difficult to test directly. However, there is an indirect implication that
may be more amenable to econometric tests. Jensen (1989) emphasizes that the threat of
buyouts increased especially for large firms. Presumably, funds for small transactions were
available from lenders before the advent of junk bonds, but larger deals were facilitated by the
large amounts of debt that could be issued after the advent of large scale junk bond issues. If
this argument is true, the 1980s wave of buyouts would have been affected larger firms more
than waves before and perhaps after. To the extent that size negatively impacts the probability
of going private, this coefficient should have been less negative during the 1980s.4
The Sarbanes-Oxley Act of 2002 raised reporting and accounting standards for U.S.
public companies. Therefore, SOX raised the costs of participating in public equity markets and
it has been suggested that this makes public status less attractive (Zingales (2006), Engel, Hayes
and Wang (2007) and Leuz, Triantis and Wang (2008)). This predicts a decrease in IPOs and an
increase in buyouts. Because many of the costs imposed by SOX are independent of firm size,
this effect is likely to be stronger for small firms.
4 Institutional investors participated in buyouts during the 1980s as important buyers of junk bonds and sellers of large blocks of shares, something Donaldson (1994) ties to the LBO wave of that decade.

8
2.8 Summary of predictions
A large number of theories bear on the question of which and how many public firms
are likely to go private and many implications differ between theories. Predictions vary
regarding the variables that should be relevant, their relative importance, and the direction of
influence. However, several firm-level variables are implied by many or even most of the
theories. These variables do not allow sharp distinction between theories, but because they are
strongly implied by the overall body of theory they constitute a useful empirical baseline.
Initially, we discuss these variables.
First, the valuation of a firm in the public market is predicted to affect the going private
decisions in many theories. We will use the book-to-market ratio to capture firm valuations,
and this is measure that is likely to capture many things. Apart from valuations, the book-to-
market ratio is probably correlated with a firm’s growth opportunities and investment need.
The book-to-market ratio is predicted to decrease the probability of going private under the
free cash flow theory (if book-to-market is correlated with growth opportunities), the debt
overhang theory (if distortions to investment incentives are more severe in firms with low
book-to-market) and if there is the potential for market timing. Second, several theories predict
that a firm’s growth rate should affect the probability of it going private. Growth is predicted
to have a negative effect on the probability of going private by the free cash flow theory, the
risk aversion theory (because a high growth rate is likely to make limited access to outside
capital more costly for private firms) and the debt overhang theory (if distortions to investment
incentives are more severe in firms with high growth). We use the gross asset growth rate to
capture firm-specific growth. The third variable is risk. Risk is predicted to have a negative
effect on the probability of going private by the risk aversion and free cash flow theories. We
use the volatility of stock returns to measure the riskiness of cash flows. The fourth variable is
firm size. Firm size is predicted to affect the probability of going private whenever the benefits
and costs of being public depend on firm size in different ways. For example, if being public
entails fixed listing costs but produces benefits that increase in firm size, smaller firms will be
more likely to go private. We capture firm size with normalized market capitalization. The fifth
variable is profitability, which is important for exploiting the tax advantage of debt.5 For each
5 To the extent that profitability is correlated with free cash flow, the free cash flow theory also predicts that high profit firms should be more likely to go private. However, this is only true if we do not control for free cash flow itself. In section 4.9, we consider this issue in detail.
9
of these five variables, several theories make similar predictions. Theses variables are therefore
unlikely to provide sharp test of which theories are more accurate. However, several of the
theories also make more specific predictions, which allow us to make sharper distinctions
between theories.
The free cash flow theory predicts that firms with high free cash flow will be more
likely to go private. Similarly, risk aversion generated by financing constraints will be more
severe for firms with low cash flow, suggesting that low cash flow firms be more likely to be
(or remain) public.
The cheap debt theory predicts that firms with low interest costs (controlling for
leverage) should be more likely to go private and that periods with low interest rates (either
low long horizon risk free rates or low credit spreads) should see more buyouts.
The cost of private equity explanation suggests that when the supply of capital for
private equity funds is high, there will be more buyouts.
The breaking up conglomerates theory predicts that multi-segment firms should be
more likely to go private than single segment firms, particularly (or perhaps only) during the
1980s.
Firms vary considerably in their governance structure (see e.g. Gompers, Ishii and
Metrick (2003)). If managers resist buyouts, measures of poor governance or CEO
entrenchment may predict lower likelihood of takeovers. On the other hand, poor governance
may increase the potential gains to going private transactions (e.g. under the free cash flow
theory), and if managers have limited ability or motivation to resist, poor governance may
increase the likelihood of going private.
Two theories predict that the relative size of firms that go private will vary over time.
The junk bond theory predicts that the effect of size on the likelihood of going private should
be more positive during the 1980s than at other times. On the other hand, the Sarbanes-Oxley
theory of buyouts predicts that small firms, which were disproportionately affected by SOX,
would see the largest response. Therefore, this theory predicts that firm size should have a
stronger negative effect on going private probabilities in the period around and right after the
passing of SOX in 2002 (if the relative propensity of small firms to go public increases, size will
have a more negative coefficient during the period in question).

10
3. Data description
We analyze transactions involving the purchase of public companies listed in the
United States from SDC Platinum between 1981 and 2006. We match firm characteristics for
public companies listed in the United States every year and time-series variables capturing
macroeconomic credit conditions to these going private transactions. The sample of public
companies includes all firms with the accounting information from Compustat for the previous
fiscal year and stock-specific information from CRSP as of December of the previous year.
3.1 SDC Platinum
A public company is deemed to have engaged in a transaction to go private in a
particular year if more than 50% of its shares are owned by a private entity after the
acquisition. We use the target’s public status and target’s ultimate parent’s public status to
classify the target as public or not public. The additional requirement that the target company
be matched to stock performance information in CRSP ensures that the target is a public
company listed in the United States. We match transaction information for each target other
company characteristics using the first six digits of the target’s CUSIP.
The acquirer of the public company is considered to be a private entity if it is not a
public company or state-owned enterprise itself and is also not a direct or indirect subsidiary of
a public company or state-owned enterprise. This classification utilizes the acquirer’s public
status and the acquirer’s ultimate parent’s public status as recorded by SDC Platinum. We only
consider completed transactions where the variable, percentage owned after transaction, is
greater than 50.
3.2 Compustat and CRSP variables
Since we attempt to explain the decision to go private in year t with firm characteristics
known in year t-1, we consider a variety of firm-specific variables as proxies for different
potential inputs into this choice.
The following accounting variables are constructed from the Compustat Industrial
Annual database using information from the fiscal year ending in year t-1. The book value of
equity is stock holder’s equity (data item 216) plus deferred taxes (data item 35) minus
preferred stock (data item 56). If stock holder’s equity is missing we replace it with the sum of
common equity (data item 60) and preferred stock (data item 56). The book-to-market ratio for

11
equity is the book value of equity divided by market capitalization from CRSP as of December
of year t-1.
Asset growth is the annual growth rate of book value of assets (data item 6) measured
between fiscal years. Return on assets is operating income (data item 13) divided by the lagged
book value of assets. Book leverage is the one minus the ratio of the book value of assets to the
book value of equity. Free cash flow is the quantity operating income minus total interest (data
item 15) and taxes (data item 16) divided by lagged book value of assets. Investment is capital
expenditures (data item 128) divided by lagged book value of assets. Depreciation (data item
14) is scaled by lagged book value of assets. Borrowing cost is total interest divided by the
difference between the book value of assets and the book value of equity.
We also consider the organizational structure of the target using the Compustat
Segments database as an additional aspect of the choice to become a private company. If the
firm has more than one (two) business segments, then the firm is classified as multi-segment
(tri-segment). We construct indicators for both classification schemes.
Market capitalization is calculated from CRSP in December. We logarithmically
transform this variable and scale it to be distributed with a mean of zero and standard
deviation of one for each year. This transformation is designed to remove time-series patterns
from firm size. Stock return volatility is calculated from monthly data in CRSP using the
previous 36 months ending in December.
3.2 Macroeconomic variables
It is also possible that macroeconomic credit conditions play an important role in the
decision to go private. The credit spread is the average yield for BAA rated bonds according to
Moody's ratings minus the average yield for US treasury bonds as of December of the previous
year (data provided by the St. Louis Federal reserve bank). The US Treasury YTM is the yield
to maturity for the 1-year and 10-year treasury securities, respectively, (data provided by the St.
Louis Federal Reserve Bank) minus 1-year expected inflation (CPI) from the Survey of
Professional Forecasters (data provided by the Philadelphia Federal Reserve Bank) as of
December of the previous year. The first end-of-year forecast for expected inflation is available
in the fourth quarter of 1981 for 1982.
3.3 Corporate governance indices

12
We analyze the impact of corporate governance on the decision of a public firm to
become private. We focus on two measures for corporate governance. The governance index of
Gompers et al. (2003) is constructed from 22 firm-specific provisions and 6 state provisions
using data from the Investor Responsibility Research Center. This index is defined so that low
values are associated with more rights for shareholders. The entrenchment index of Bebchuk et
al. (2004) incorporates a subset of the governance provisions evaluated by Gompers et al. The
entrenchment index specifically includes provisions that impede a majority shareholder from
imposing decisions on management (e.g. supermajority requirements and limits to shareholder
bylaw amendments) and anti-takeover provisions designed to block changes in corporate
control that are not approved by management (e.g. poison pills and staggered boards).
3.4 Supply of private equity
We also consider link between the supply of capital for private equity activities and the
decision of a public firm to become private. We define buyout inflow as capital commitments to
US buyout funds normalized by the market capitalization of listed companies at the end of the
previous year and venture capital inflow as capital commitments to US venture capital funds
similarly normalized (data provided by Per Strömberg).
4. Results
4.1 Baseline logistic regressions
In Table 2 we consider a series of logistic specifications predicting the decision of a
public company to become a private company using assorted firm characteristics. The variables
of interest include the book-to-market ratio for equity, asset growth, stock return volatility,
market capitalization (normalized), and profitability (return on assets). Columns one through
five of the table present specifications for each of these five variables separately with year and
industry fixed effects. Only book-to-market, asset growth and market capitalization have
significant explanatory power for the decision to go private. The coefficient estimates for these
three variables are of the predicted sign (see theoretical predictions above). The sign of the
coefficient estimate for stock return volatility is consistent with explanations involving risk
aversion or debt overhang, although the relationship is not statistically significant. The
coefficient estimate for profitability is positive but insignificant.
13
Column six of Table 2 presents a specification with all five variables as well as year and
industry fixed effects. All five variables are statistically significant and of the expected sign. The
negative coefficient on stock return volatility indicates that risky firms are less likely to go
private. Since there is a strong negative relation between firm size and volatility, it is critical to
control for firm size when investigating the role of volatility on the decision to go private. The
impact of volatility also suggests that theories of involving cheap debt, junk bonds, and
conglomerate break-ups are not sufficient on their own to fully explain the cross-sectional
variation in the decision to go private (since these theories make no prediction about risk).
Also, profitability is now significantly positively related to the likelihood of going private.
Table 3 presents various permutations of the baseline logistic specification. Columns
one and two present coefficient estimates with no fixed effects, columns three and four present
estimates with year fixed effects only, and columns five and six present estimates with industry
fixed effects only. For each pair of columns in this table, the first column provides standard
errors clustered by firm while the second column provides standard errors clustered by year.
The coefficient magnitudes and pattern of statistical significance are stable across the three
different specifications. In addition, the decision to cluster by firm or by year does not alter any
statistical inferences.6
4.2 Comparison of leverage changes and buyouts
Going private transactions tend to involve large increases in leverage (see e.g. Axelson,
Jenkins, Strömberg and Weisbach (2007) or Jensen (1989)). Is it possible that our logistic
regressions identify the firms which decide to increase leverage, but not specifically the
decision to go private? If this were the case, inferences about the public/private choice would
be misguided. To address this concern we examine public firms that increase leverage
substantially while remaining public. To this end, we employ two alternative definitions of an
indicator for increasing leverage. The first indicator, called large increase in book leverage, is
equal to one for any firm increasing book leverage next year compared to this year by at least
0.45. This cut-off is selected to make the frequency of the event similar to the frequency of
going private transactions (i.e. the indicator is equal to one for about 0.56% of firm-year
observations). The second indicator, called pseudo going private leverage change, is assigned
6 We have also included fixed effects for the industry-year interaction with very similar results.

14
the value one if a firm has leverage of no more than 0.30 the current year and at least 0.7 the
next year (these cut-offs are based on typical values before and after going private transactions
according to Axelson et al (2007)). The probability of this type of leverage change is about half
as likely as the decision to go private.
Table 4 presents results from logistic regressions with these two leverage increase
indicators and the going private indicator as dependent variables. The standard controls are
included, as well as current leverage. For each dependent variable one specification also
includes the lagged change in leverage. The results in Table 4 provide forceful evidence that
going private transactions are different from large leverage increases for public firms. First, the
book-to-market ratio and firm size (market capitalization) are unimportant as determinants of
leverage increases, whereas they predict going private events. Second, volatility and
profitability both have opposite effects on leverage and going private: high volatility firms are
more likely to have a large leverage increase, but less likely to go private, and profitable firms
are less likely to increase leverage substantially, but more prone to go private. Third, leverage,
a key determinant of leverage changes, is unrelated to going private events.
The results in Table 4 indicate that going private is not a side effect of increasing
leverage. Compared to firms that increase leverage, firms going private are smaller and have
lower valuations, less volatile stock returns, and higher profitability. These differences suggest
that theories based on aspects of going private other than leverage changes (e.g. risk sharing)
may be important. This finding is less supportive of theories focusing on leverage, such as debt
overhang, cheap debt, or free cash flow. This is very indirect evidence, however, and some of
these theories can be tested more directly.
4.3 Cheap debt theories
We consider the time-series implications of cheap debt theories. A typical version of a
theory involving cheap debt suggests that the price of debt should predict going private
transactions negatively, because such transactions usually involve a large an increase in
leverage. Therefore, we analyze the relationship between macroeconomic credit conditions and
the decision to go private (we investigate the cross-sectional predictions of cheap debt theories
in the next subsection). We consider the impact of the credit spread, short-term interest rate,
and the long-term interest rate on the decision to go private. All three of these variables should
be negatively related to the decision to go private if cheap debt theories are correct.

15
In Table 5, we include the macroeconomic variables together with the firm level
variables from the baseline specifications of Table 2 and Table 3 as well as industry fixed
effects. Since we are investigating the impact of macroeconomic phenomena, we cannot include
year fixed effects. We also include leverage. The results in Table 4 suggest that leverage is in
itself not an important determinant of going private decisions. However, we might need to
control for leverage to make inferences about a firm’s cost of borrowing, so we include it as a
control. In all six specifications, the estimates for the five baseline variables are quite similar to
the estimates of the analogous specification in column six of Table 3. Book leverage has no
explanatory power in any of the specifications. The coefficient for the credit spread is always
positive and statistically insignificant. The coefficient on the short-term treasury yield is of
inconsistent sign across regressions, and is never statistically significant. The coefficient on the
long-term bond yield has a negative sign but is not statistically significant.
The results in Table 5 provide suggestive evidence that is inconsistent with the cheap
debt story, since there is no statistically significant relation between any of the three
macroeconomic credit variables and the decision to go private. The fact that we only use time-
series variation limits the power of the tests in Table 5 considerably (since the variables of
interest vary by year, we cluster all standard errors by year in this table), so this table presents
weak evidence against the cheap debt story. In the next section, we consider cross-sectional
predictions of cheap debt theories, where identification is easier.
We also investigate the cross-sectional predictions of cheap debt. In Table 6 we focus on
the firm-specific borrowing cost for debt. This variable reflects the firm’s average interest rate
on its debt obligations and should capture the ease with which a firm can borrow to increase
leverage. As in the preceding section, we control for leverage. Column one indicates that
borrowing cost is positively related to the decision to go private, but the coefficient is quite
small and not statistically significant. This result is inconsistent with the main prediction of
cheap debt theories because a high cost of borrowing should make it more difficult to lever up.
The coefficient estimates for the other firm characteristics are similar to the estimates for the
baseline specification in columns 5 and 6 of Table 2. In column two, the errors are clustered by
year instead of firm, with little impact on the pattern of statistical significance.
The next four columns present permutations of the specification in column two.
Columns three and four present coefficient estimates with year fixed effects and columns five
and six present estimates with year and industry fixed effects. For each pair of columns, the
16
first column provides standard errors clustered by firm while the second column provides
standard errors clustered by year. In columns three and four, year fixed effects appear to
strengthen the significance of the relationship between borrowing cost and the decision to go
private compared to column two, but the sign of the estimated coefficient is inconsistent with
cheap debt. Once we add industry fixed effects in columns five and six, leverage loses what
little explanatory power it possesses in other specifications. The coefficient on borrowing cost
remains positive but is only marginally insignificant in both column five and in column six. To
summarize, the results in this table are largely inconsistent with cheap debt theories, and may
suggest that borrowing costs are unrelated to the public-private choice. The most conservative
interpretation of these results is that the firm-specific borrowing cost is unrelated to the
decision to go private.
4.4 The supply of private equity
While there is no evidence that the cost of debt drives the decision to go private, there
are other channels through which the supply of capital could be related to buyouts. For
example, if buyout funds raise large amounts of additional capital, then we expect these funds
to participate in a greater number of transactions. To identify the impact of the supply of
capital for buyouts on the decision to go private, we must first disentangle the role of
exogenous supply shifts from increased funding for buyouts induced by particularly favorable
investment opportunities for this activity. Clearly, favorable investment opportunities for
buyouts would lead to a positive relationship between the supply of capital for buyouts and
the volume of going private transactions even in the absence of an exogenous supply shift.
We identify exogenous supply shifts for buyouts in an instrumental variables approach
using the inflow to a different class of private equity, namely venture capital funds. This
approach is analogous to the identification strategy used by Gompers and Lerner (2000) to
estimate the relationship between the price of venture capital transactions and the supply of
venture capital using the inflow to buyout funds as an instrument. According to Gompers and
Lerner, changes in the supply of capital for buyouts and venture capital are correlated for
institutional reasons (e.g. both are considered alternative investments), while the investment
opportunities for these two investment classes are plausibly unrelated.
In Table 7 we use normalized capital commitments to venture capital funds (venture
capital inflow) as an instrument for normalized capital commitments to buyout funds (buyout

17
inflow). The R2 for the first stage regression of buyout inflow on venture capital inflow is 0.13
with an F-statistic of 5.71. In column one, we find a positive and significant relationship
between the decision to go private and exogenous inflows to buyout funds in the absence of
firm-specific controls or industry fixed effects.7 The magnitude of this estimate indicates that a
one standard deviation increase from the sample mean for the inflow to buyout funds increases
the probability of going private from 0.0056 to 0.0096. While the significance of most estimates
are weaker when clustering by year rather than by firm, the coefficient for buyout inflow
remains statistically significant in column two. The remaining columns of Table 7 indicate that
firm level controls as well as industry fixed effects do not alter this finding. In these
specifications all of the firm-specific controls are of the expected sign and, with the exception of
stock return volatility, statistically significant.
4.5 The 1980s - junk bonds and conglomerates
We consider theories related to the buyout wave of the 1980s. First, we assess the idea
that junk bonds constituted an innovation that increased the availability of financing for large
buyout deals. If true, we expect the coefficient on size to be greater during the 1980s than at
other times.
In Table 8, column one, we test if the estimated coefficient on size varies between the
1980s and later times by including both size and size multiplied with a 1980s indicator (the
specification includes year fixed effects, so the 1980s indicator itself is superfluous). As
predicted by the junk bond theory, size has a significantly less positive effect on the probability
of going private during the 1980s. Indeed, the net effect of size during this period is very close
to zero and insignificant, a finding in stark contrast to the pattern at other times (when smaller
firms are much more likely to go private). The comparison here is with the role of size in later
periods, not earlier (due to data limitations).
Figure 3 plots the coefficient estimate and associated confidence interval for firm size
interacted with an indicator variable for each year. In the figure firm size is virtually unrelated
to the decision to go private in the 1980s. Beginning in 1990 and continuing until 2005, firm size
7 Since we implement a two stage least squares estimation procedure, the coefficient magnitudes are not directly comparable to the magnitudes in other tables. The second stage is a linear probability model rather than a logistic specification.

18
is negatively related to the probability of becoming private. This figure provides additional
evidence regarding the impact of firm size.
What explains the increased role of size after the 1980s? It is possible that the end of the
1980s junk bond era reduced the availability of financing for large deals, and that this
availability never recovered. Alternatively, after a period of more frequent large deals, the
supply of suitable large candidates was exhausted. Or, as a third possibility, the development
of junk bonds reflected an underlying demand for large scale debt financing which was
temporary. Once the conditions of the 1980s had passed, there were fewer large firms that
made good targets, and junk bond volumes declined.
Next, we examine the idea that a main motivation for the 1980s going private-wave was
the breakup of inefficient conglomerates. We us two measures of whether a firms is a
conglomerate, an indicator for whether a firm reports two or more segments in a given year
(multi-segment) and an indicator for whether a firm reports three or more segments in a given
year (tri-segment). In Table 8, column two, we find that the multi-segment indicator has a
coefficient insignificantly different from zero. In column three, the same result holds for the tri-
segment indicator. This suggests that over our full sample period, there is no significant
difference in the incidence of going private transactions for firms with and without multiple
segments, once you control for other important determinants. Is it possible that the differential
role of size during the 1980s can be misinterpreted as a sign of conglomerate breakups (multi-
segment firms are probably larger than single segment firms)? We test this by allowing the
coefficient on the multi-segment to be different during the 1980s, and simultaneously excluding
size from the set of controls. Results are reported in Table 8, column four. The coefficient on the
multi-segment indicator is now significantly negative outside the 1980s, presumably because it
proxies for size, but the net effect during the 1980s is zero. Apart from emphasizing the
importance of properly controlling for size in going private regressions, this result suggests
why the reduced impact of size during the 1980s could have been misinterpreted as reflecting
conglomerates.
Finally, we allow the coefficient on the multi-segment indicator as well as size to vary
between the 1980s and other times. Results are presented in column five. The results for size
remain the same (zero net effect during the 1980s, large negative effect at other times). The
estimated coefficient for conglomerates is insignificant in all periods. In column six, we repeat
this test with the alternative measure of conglomerates, with identical conclusions. Figure 4
19
plots the coefficient estimate and associated confidence interval for multi-segment interacted
with an indicator variable for each year, while controlling for the interaction of firm size with
the indicator variables for each year. In the figure multi-segment is never significantly related
to the decision to go private and the coefficient estimates oscillate around zero. In contrast to
the plot for firm size in Figure 3, the coefficient for multi-segment does not appear to change in
a particular way over time. This figure provides additional evidence that conglomerates were
not an important factor in general or during any specific time period.
Our finding of a very limited role of conglomerate breakups during the 1980s is
consistent with several pieces of indirect evidence from the 1980s. Montgomery (1994) points
out that the typical S&P 500 firm had the same number of segments in 1991 as in 1981. Mitchell
and Mulherin (1996) conclude that takeovers in the 1980s were concentrated in certain
industries rather than to conglomerates. Also, comparing diversifying and related acquisitions,
Kaplan and Weisbach (1992) find that during the 1980s, there was no difference in success.
4.6 Sarbanes-Oxley
We also evaluate the argument that the Sarbanes-Oxley act of 2002 drove smaller firms
away from the stock market. The prediction for our going private regressions is that the effect
of size should be more negative during the period when firms respond to SOX (i.e. smaller
firms became relatively more likely to go private than large firms during this period). Unlike
tests of the aggregate frequency (e.g. Engel et al (2007)), this method differences out any
aggregate time series changes that affect firms equally across sizes.
We use two definitions of the relevant time period for SOX: a narrow and a wide
definition. The narrow definition is 2003 and 2004, the two years immediately following the
act’s passing, when any SOX-induced activity is most likely to have occurred. The wider
definition includes 2002 and 2005, on the basis that the act was passed in July of 2002, allowing
some response to occur that year, and that going private takes time, which suggests that some
transactions might be expected after 2004.
In Table 9 firm size is interacted with one of the SOX indicators and we consider various
controls and error structures. We also allow the coefficient on size to differ in the 1980s (see the
previous section). In columns one and two, we use the two different indicators, controlling for
our baseline firm level controls and year, but not industry, fixed effects, clustering errors by
firm. The result strongly suggests that smaller firms went private in response to SOX. The

20
coefficient estimates is negative and statistically significant, and implies that the coefficient on
size was about two thirds larger during the immediate aftermath of SOX. To get a sense of the
economic magnitude, consider the effect of a one standard deviation decrease in the size of a
firm which would otherwise have a 1% probability of going private. Outside the 1980s and
2003-2004, according to coefficients estimates in column one, the size reduction would increase
the probability of going private to 1.6%. During the 2003-2004 period, the same size reduction
would increase the probability of going private from 1% to 2.5% (using the estimates in for the
wider window of 2002-2005, used in column three, the probability would become 2.1%). This
result provides fairly strong evidence supporting the hypothesis that SOX pushed smaller firms
to leave the stock market, consistent with evidence from voluntary delistings (see Leuz et al
(2008)).
4.7 Corporate governance
There are several reasons why corporate governance may be important for the public-
private choice. If there is managerial resistance to buyouts, and poor governance makes such
resistance more effective, features of a firm’s corporate governance will affect the likelihood of
going private. Alternatively, poor governance may increase the potential gains to going private
transactions. We test these theories by including some measure of firm level governance in the
regressions. The power of these tests declines because the sample size is severely limited by the
lack of governance data for most firms and years.
In Table 10, columns one to three, the measure is the entrenchment index of Bebchuk,
Cohen and Ferrell (2004), with no fixed effects, year fixed effects, and year as well as industry
fixed effects, respectively. The estimated coefficient on the entrenchment variable is negative
and of similar magnitude in all three specifications, but not significant. In columns four to six,
the same regression specifications are repeated with the governance index of Gompers, Ishii
and Metrick (2003). The estimated coefficient is also negative in all three regressions and
remains statistically insignificant.
4.8 Free cash flow
As argued above, Jensen’s (1986) free cash flow theory predicts that leveraged buyouts
will occur for firms with low asset growth and high book-to-market (due to lower investment
needs), low volatility (stability), and high cash flow. The first three predictions hold in our data
21
set, but are not unique predictions of the free cash flow theory. In this section, we therefore
concentrate on the effect of free cash flow.
Jensen’s definition of free cash flow is “cash flow in excess of that required to fund all
projects that have positive net present value”. This quantity is unobservable, since the amount of
positive-NPV investments available is unknown. A simple idea is to use some measure of cash
flow which does not deduct investment, instead. This is equivalent to using Jensen’s free cash
flow if other controls in the regression, including industry fixed effects, perfectly explain the
amount of positive NPV investment available. Other possibilities for addressing this issue
include controlling for actual investment or depreciation, under the assumption that these
variables capture the variation in positive-NPV investment opportunities. We follow both of
these approaches, recognizing that neither is perfectly satisfactory.
Table 11 presents results of logistic regressions including our approximation of free
cash flow as an independent variable. In column one, the main controls except profitability are
included. Free cash flow is positively related to going private events, as predicted by the
theory. Since they only differ by interest and taxes, profitability and cash flow are highly
correlated (the correlation coefficient is 0.9275). In column two, we control for profitability. In
this specification free cash flow loses significance, while profitability is significant. Controlling
for investment or depreciation, columns three and four, respectively, does not change this
conclusion: profitability, but not cash flow, predicts going private. In column five, we again
exclude profitability, and find that free cash flow is highly significant in the presence of both
investment and depreciation. Finally, in column six, we compare profitability and cash flow
while including investment and depreciation. This specification suffers from severe
multicollinearity, but nonetheless it agrees with the previous specifications in rejecting cash
flow as a predictor of going private events. The results in Table 11 consistently reject free cash
flow as a determinant of the decision to go private in the presence of profitability as a control.
This does not mean free cash flow concerns are not important in other contexts, but it does
suggest that the correlation between going private and profitability reflects something other
than Jensen’s (1986) free cash flow-related agency problem.8
8 Lehn and Poulsen (1989) provide some evidence on the free cash flow theory of going private
transactions, and show that high cash flow firms were more likely to go private during the 1980-1987 period. However, they do not control for profitability.

22
5. Conclusions
We test several theories have been proposed to explain the flow from public to private
equity ownership. We attempt to distinguish between the various theories by analyzing the
decision of individual firms to become private. Firm size, risk, valuation, growth, and
profitability all predict the decision to go private, consistent with many plausible theories. For
example, the finding that the book-to-market ratio positively predicts the probability of a firm
going private is consistent with market timing by private buyers as well as firms with high
investment opportunities preferring the improved access to capital for public firms.
We find support for several specific explanations of buyout volumes, including the
importance of junk bonds, the supply of private equity, and the impact of Sarbanes-Oxley.
However, we do not find evidence that the break up of conglomerates was a motivation for
buyouts, nor does corporate governance appear to play a role in this decision. We also find no
support in our sample for cheap debt theories.

23
6. References
Aslan, Hadiye and Praveen Kumar, 2007, “Going Public and Going Private: What Determines the Choice
of Ownership Structure?”, working paper.
Amihud, Yakov, editor, 1989, Leveraged management buyouts: causes and consequences, Homewood, Ill.:
Dow Jones-Irwin.
Axelson, Ulf, Tim Jenkinson, Per Strömberg and Michael Weisbach, 2007, “Leverage and pricing in
buyouts: An empirical analysis”, Working Paper, SIFR.
Baker, Malcolm, and Jeffrey Wurgler, 2000, “The Equity Share in New Issues and Aggregate Stock
Returns”, The Journal of Finance 55(5) , 2219–2257.
Bebchuk, Lucian Arye, Alma Cohen and Allen Ferrell, 2004, “What Matters in Corporate Governance?”,
Harvard Law School John M. Olin Center Discussion Paper No. 491.
Bharath, Sreedhar, and Amy Dittmar, 2007, “Why Do Firms Use Private Equity to Opt Out of Public
Markets?”, working paper, University of Michigan.
Bodnaruk, Andriy, Eugene Kandel, Massimo Massa and Andrei Simonov, forthcoming,” Shareholder
Diversification and the Decision to Go Public”, Review of Financial Studies.
Boot, Arnoud, Radhakrishnan Gopalan, and Anjan Thakor, 2006, “The Entrepreneur’s Choice between
Private and Public Ownership”, Journal of Finance, 61(2), 803-836.
Boot, Arnoud, Radhakrishnan Gopalan, and Anjan Thakor, forthcoming, “Market Liquidity, Investor
Participation and Managerial Autonomy: Why do Firms Go Private?”, Journal of Finance.
Demers, Elizabeth and Katharina Lewellen, 2003, “The marketing role of IPOs: evidence from internet
stocks”, Journal of Financial Economics, 68, 413-437.
Engel, Ellen, Rachel Hayes and Xue Wang, 2007, “The Sarbanes-Oxley Act and firms’ going-private
decisions”, Journal of Accounting and Economics, 44, 116-145.
Fama, Eugene and Michael, Jensen, 1983, ”Separation of Ownership and Control”, Journal of Law and
Economics, 26, June.
Gompers, Paul, Joy Ishii, and Andrew Metrick, 2003, “Corporate Governance and Equity Prices”,
Quarterly Journal of Economics, 118(1), 107-155.
Gompers, Paul, Anna Kovner, Josh Lerner and David Scharfstein, forthcoming, “Venture capital
investment cycles: The impact of public markets”, Journal of Financial Economics.
Gompers, Paul, and Josh Lerner, 2000, “Money chasing deals? The impact of inflows on private equity
valuations?”, Journal of Financial Economics, 55, 281-325.
Holmström, Bengt, and Steven Kaplan, 2003, “The State of U.S. Corporate Governance: What's Right and
What's Wrong?”, NBER Working Paper No. 9613.

24
Holmström, Bengt, and Steven Kaplan, 2001, “Corporate Governance and Merger Activity in the United
States: Making Sense of the 1980s and 1990s”, Journal of Economic Perspectives, 15(2), Spring, 121-
144.
Ibbotson, Roger, Jody Sindelar and Jay Ritter, 1994, “The Market's Problems with the Pricing of Initial
Public Offerings”, Journal of Applied Corporate Finance, Spring, 66-74.
Jensen, Michael, 1986, “Agency Costs of Free Cash Flow”, American Economic Review, 76(2), 323-329.
Jensen, Michael, 1989, “The Eclipse of the Public Corporation”, Harvard Business Review, September-
October, 61-73.
Kaplan, Steven, 1989, “The Effects of Management Buyouts on Operations and Value,” Journal of
Financial Economics, 217-254.
Kaplan, Steven and Jeremy Stein, 1993, ”The Evolution of Buyout Pricing and Financial Structure in the
1980s,” Quarterly Journal of Economics, 108, 313-357.
Kaplan, Steven and Per Strömberg, 2008, “Leveraged Buyouts and Private Equity”, working paper.
Lehn, Kenneth and Anette Poulsen, 1989, “Free Cash Flow and Stockholder Gains in Going Private
Transactions”, Journal of Finance, 44(3), 771-787.
Leland, Hayne and David Pyle, 1977, “Informational Asymmetries, Financial Structure, and Financial
Intermediation”, Journal of Finance, 32(2).
Leuz, Christian, Alexander Triantis and Tracy Wang, 2008, “Why do firms go dark? Causes and
economic consequences of voluntary SEC deregistrations”, Journal of Accounting and Economics,
forthcoming.
Mitchell, Mark and Harold Mulherin, 1996, “The Impact of Industry Shocks on Takeover and
Restructuring Activity”, Journal of Financial Economics, 193-229.
Montgomery, Cynthia, 1994, “Corporate Diversification”, Journal of Economic Perspectives, 8, 163-178.
Myers, Stewart, 1977, “Determinants of Corporate Borrowing”, Journal of Financial Economics, October,
5(2) , 147-75.
Shleifer, Andrei and Robert Vishny, 1990, “The Takeover Wave of the 1980s”, Science, August 17, 249,
745-749.
Shleifer, Andrei and Robert Vishny, 1992, “Liquidation Values and Debt Capacity: A Market Equilibrium
Approach”, Journal of Finance, September 47(4), 1343-1366.
Zingales, Luigi, forthcoming, “Is The U.S. Capital Market losing Its Edge?”, Journal of Economic
Perspectives.

Fig
ure
1:
U.S
. G
oin
g P
riv
ate
Vo
lum
e 1
98
1-2
00
6
0.0
0%
0.2
5%
0.5
0%
0.7
5%
1.0
0%
1.2
5%
1981
1986
1991
1996
2001
2006
Year
Scaled Volume
Perc
enta
ge o
f sto
ck m
ark
et valu
e
Perc
enta
ge o
f firm
s

Fig
ure
2:
U.S
. g
oin
g p
riv
ate
vo
lum
e b
y i
nd
us
try
0.0
%
0.2
%
0.4
%
0.6
%
0.8
%
1.0
%
1.2
%
1.4
%Restaraunts, Hotels, Motels
Healthcare
Entertainment
Personal Services
Beer & Liquor
Rubber and Plastic
Communication
Railroad Equipment
Retail
Shipping Containers
Transportation
Agriculture
Apparel
Tobacco products
Other
Real Estate
Consumer Goods
Textiles
Business Services
Candy & Soda
Wholesale
Construction
Fabricated Products
Steel Works Etc
Construction Materials
Business Supplies
Computers
Recreation
Measuring Equipment
Banking
Printing and Publishing
Machinery
Automobiles and Trucks
Electrical Equipment
Food Products
Insurance
Medical Equipment
Chemicals
Precious Metals
Electronic Equipment
Pharmaceutical Products
Trading
Petroleum and Natural Gas
Utilities
Mining
Aircraft
Defense
Coal
Fam
a-F
ren
ch
In
du
str
y
Average Annual Percentage

Fig
ure
3:
Tim
e-s
eri
es
Fo
r M
ark
et
Ca
pit
ali
za
tio
n C
oe
ffic
ien
t E
sti
ma
tes
-2.5-2
-1.5-1
-0.50
0.51 1
981
1986
1991
1996
2001
2006
Year
Coefficient Estimate
Mark
et C
ap. C
oeffic
ient
95%
CI
5%
CI

Tab
le 1
: S
um
mary
sta
tisti
cs
Go
ing
Pri
va
teB
oo
k-T
o-
Ma
rke
t R
ati
o
As
se
t G
row
thS
toc
k R
etu
rn
Vo
lati
lity
Ma
rke
t C
ap
.
(No
rma
lize
d)
Re
turn
On
As
se
ts
Bo
ok
Le
ve
rag
e
Me
an
0.0
05
60
.83
80
1.1
07
40
.14
12
0.1
41
20
.10
02
0.5
26
7
Sta
nd
ard
De
via
tio
n0
.07
46
0.7
86
00
.23
40
0.0
75
91
.02
71
0.1
68
80
.24
64
Co
rrela
tio
n M
atr
ix
Go
ing
Pri
va
te1
.00
00
.02
8-0
.02
10
.00
1-0
.02
60
.00
7-0
.00
5
Bo
ok
-To
-Ma
rke
t R
ati
o
Fo
r E
qu
ity
1.0
00
-0.2
01
-0.0
20
-0.2
85
-0.1
12
0.0
28
As
se
t G
row
th1
.00
0-0
.06
40
.16
40
.35
40
.00
3
Sto
ck
Re
turn
Vo
lati
lity
1.0
00
-0.4
22
-0.2
88
-0.1
76
Ma
rke
t C
ap
ita
liza
tio
n
(No
rma
lize
d)
1.0
00
0.3
21
0.0
66
Re
turn
On
As
se
ts1
.00
0-0
.11
4
Bo
ok
Le
ve
rag
e1
.00
0
No
tes
:G
oin
gp
riva
teis
an
ind
ica
tor
va
ria
ble
eq
ua
lto
on
eif
mo
reth
an
50
%o
fa
pu
blic
firm
'ssh
are
sa
rep
urc
ha
se
db
ya
priva
tee
ntity
,th
eu
ltim
ate
pa
ren
to
fth
ep
riva
tee
ntity
(if
ith
as
an
ultim
ate
pa
ren
tco
mp
an
y)
isa
lso
priva
te,
an
dth
ep
ub
licfirm
de
lists
with
intw
oye
ars
of
the
eff
ective
da
tefo
rth
etr
an
sa
ctio
n.
Firm
ch
ara
teristics
are
me
asu
red
at
the
en
do
fth
ep
revio
us
fisca
lye
ar
for
acco
un
tin
gd
ata
fro
mC
om
pu
sta
t.T
he
bo
ok-t
o-m
ark
et
ratio
for
eq
uity
isth
era
tio
of
the
bo
ok
va
lue
of
eq
uity
toth
em
ark
et
va
lue
of
eq
uity
wh
ere
the
ma
rke
tva
lue
of
eq
uity
ism
ea
su
red
as
of
De
ce
mb
er
of
the
pre
vio
us
ye
ar.
Asse
tg
row
this
the
an
nu
al
gro
wth
rate
of
the
bo
ok
va
lue
of
asse
tsb
etw
ee
nfisca
lye
ars
.S
tock
retu
rnvo
latilit
yis
ca
lcu
late
dfr
om
mo
nth
lyd
ata
inC
RS
Pu
sin
gth
ep
revio
us
36
mo
nth
se
nd
ing
inD
ece
mb
er.
Ma
rke
tca
pita
liza
tio
n(n
orm
aliz
ed
)is
me
asu
red
as
of
De
ce
mb
er
of
the
pre
vio
us
ye
ar,
log
tra
nsfo
rme
d,
an
dsca
led
tob
ed
istr
ibu
ted
with
am
ea
no
fze
roa
nd
sta
nd
ard
de
via
tio
n o
f o
ne
fo
r e
ach
ye
ar.
Re
turn
on
asse
ts is a
nn
ua
l o
pe
ratin
g in
co
me
sca
led
by la
gg
ed
bo
ok a
sse
ts.
Bo
ok le
ve
rag
e is t
he
qu
an
tity
bo
ok a
sse
ts m
inu
s b
oo
k e
qu
ity s
ca
led
by b
oo
k a
sse
ts.

Tab
le 2
. F
irm
Ch
ara
cte
risti
cs a
nd
th
e D
ecis
ion
to
Go
Pri
vate
De
pe
nd
en
t V
ari
ab
le:
If a
go
ing
pri
va
te t
ran
sa
cti
on
oc
cu
rs y
=1
; o
the
rwis
e,
y=
0
(1)
(2)
(3)
(4)
(5)
(6)
0.2
87
30
.18
40
(0.0
243
)***
(0.0
31
4)*
**
As
se
t G
row
th-1
.45
55
-1.6
80
6
(0.1
910)*
**(0
.24
49
)***
Sto
ck
Re
turn
Vo
lati
lity
-0.6
57
3-2
.11
16
(0.5
978)
(0.6
68
7)*
**
-0.3
37
2-0
.34
36
(0.0
394)*
**(0
.04
61
)***
Re
turn
On
As
se
ts0
.16
62
2.0
77
3
(0.2
17
0)
(0.3
21
7)*
**
Ye
ar
Fix
ed
Eff
ec
tsX
XX
XX
X
Ind
us
try
Fix
ed
Eff
ec
tsX
XX
XX
X
Clu
ste
r B
y F
irm
XX
XX
XX
Ps
eu
do
R2
0.0
53
50
.05
34
0.0
45
80
.05
38
0.0
46
10
.06
85
NN
= 1
14
,26
2N
= 1
14
,26
2N
= 1
14
,26
2N
= 1
14
,26
2N
= 1
14
,26
2N
= 1
14
,26
2
* sig
nific
an
t a
t 1
0%
; **
sig
nific
an
t a
t 5
%;
***
sig
nific
an
t a
t 1
%
Bo
ok
-To
-Ma
rke
t R
ati
o F
or
Eq
uit
y
No
tes
:E
ach
co
lum
np
rese
nts
the
co
eff
icie
nt
estim
ate
sfr
om
alo
gis
tic
sp
ecific
atio
n.
Th
esa
mp
lep
erio
dis
fro
m1
98
1u
ntil2
00
6.
Ap
ub
licfirm
isd
ee
me
dto
ha
ve
be
en
take
np
riva
teif
mo
reth
an
50
%o
fa
pu
blic
firm
'ssh
are
sa
rep
urc
ha
se
db
ya
priva
tee
ntity
,th
eu
ltim
ate
pa
ren
to
fth
ep
riva
tee
ntity
(if
ith
as
an
ultim
ate
pa
ren
tco
mp
an
y)
isa
lso
priva
te,
an
dth
ep
ub
licfirm
de
lists
with
intw
oye
ars
of
the
eff
ective
da
tefo
rth
etr
an
sa
ctio
n.
Th
ein
du
str
yfixe
de
ffe
cts
are
de
fin
ed
usin
gth
e4
8in
du
str
ycla
ssific
atio
nsch
em
ea
va
ilab
leo
nK
en
ne
thF
ren
ch
'sw
eb
site
.T
he
sta
nd
ard
err
ors
for
the
co
eff
icie
nt
estim
ate
s a
re in
pa
ren
the
se
s a
nd
are
clu
ste
red
by f
irm
.
Ma
rke
t C
ap
ita
liza
tio
n
(No
rma
lize
d)
Firm
ch
ara
teristics
are
me
asu
red
at
the
en
do
fth
ep
revio
us
fisca
lye
ar
for
acco
un
tin
gd
ata
fro
mC
om
pu
sta
t.T
he
ma
rke
tva
lue
of
eq
uity
ism
ea
su
red
as
of
De
ce
mb
er
of
the
pre
vio
us
ye
ar
for
the
bo
ok-t
o-
ma
rke
tra
tio
for
eq
uity.
Asse
tg
row
this
the
an
nu
al
gro
wth
rate
of
the
bo
ok
va
lue
of
asse
tsb
etw
ee
nfisca
lye
ars
.S
tock
retu
rnvo
latilit
yis
ca
lcu
late
dfr
om
mo
nth
lyd
ata
inC
RS
Pu
sin
gth
ep
revio
us
36
mo
nth
se
nd
ing
inD
ece
mb
er.
Ma
rke
tca
pita
liza
tio
n(n
orm
aliz
ed
)is
me
asu
red
as
of
De
ce
mb
er
of
the
pre
vio
us
ye
ar,
log
tra
nsfo
rme
d,
an
dsca
led
tob
ed
istr
ibu
ted
with
am
ea
no
fze
roa
nd
sta
nd
ard
de
via
tio
n o
f o
ne
fo
r e
ach
ye
ar.
Re
turn
on
asse
ts is o
pe
ratin
g in
co
me
div
ide
d b
y la
gg
ed
asse
ts.

Tab
le 3
. F
irm
Ch
ara
cte
risti
cs, A
ltern
ati
ve S
tan
dard
Err
ors
, an
d t
he D
ecis
ion
to
Go
Pri
vate
De
pe
nd
en
t V
ari
ab
le:
If a
go
ing
pri
va
te t
ran
sa
cti
on
oc
cu
rs y
=1
; o
the
rwis
e,
y=
0
(1)
(2)
(3)
(4)
(5)
(6)
0.1
75
60
.17
56
0.2
16
10
.21
61
0.1
48
00
.14
80
(0.0
299
)***
(0.0
300)*
**(0
.0289)*
**(0
.0245)*
**(0
.03
21
)***
(0.0
31
1)*
**
As
se
t G
row
th-1
.73
48
-1.7
34
8-1
.76
82
-1.7
68
2-1
.66
65
-1.6
66
5
(0.2
452
)***
(0.2
882)*
**(0
.2452)*
**(0
.28549)*
**(0
.24
38
)***
(0.2
82
8)*
**
Sto
ck
Re
turn
Vo
lati
lity
-1.4
72
5-1
.47
25
-1.6
67
3-1
.66
73
-1.8
32
4-1
.83
24
(0.5
706
)***
(0.8
717)*
(.0.5
649)*
**(.
0.8
363)*
*(0
.65
42
)***
(0.9
97
9)*
-0.3
85
0-0
.38
50
-0.3
78
8-0
.37
88
-0.3
44
7-0
.34
47
(0.0
435
)***
(0.0
728)*
**(0
.0436)*
**(0
.0680)*
**(0
.04
57
)***
(0.0
72
9)*
**
Re
turn
On
As
se
ts2
.57
99
2.5
79
92
.80
27
2.8
02
71
.93
32
1.9
33
2
(0.2
898
)***
(0.3
192)*
**(0
.2911)*
**(0
.3163)*
**(0
.31
51
)***
(0.3
30
3)*
**
Ye
ar
Fix
ed
Eff
ec
tsX
X
Ind
us
try
Fix
ed
Eff
ec
tsX
X
Clu
ste
r B
y F
irm
XX
X
Clu
ste
r B
y Y
ea
rX
XX
Ps
eu
do
R2
0.0
26
90
.02
69
0.0
48
80
.04
88
0.0
47
00
.04
70
NN
= 1
15
,45
5N
= 1
15
,45
5N
= 1
15
,45
5N
= 1
15
,45
5N
= 1
14
,26
2N
= 1
14
,26
2
* sig
nific
an
t a
t 1
0%
; **
sig
nific
an
t a
t 5
%;
***
sig
nific
an
t a
t 1
%
Bo
ok
-To
-Ma
rke
t R
ati
o F
or
Eq
uit
y
No
tes
:E
ach
co
lum
np
rese
nts
the
co
eff
icie
nt
estim
ate
sfr
om
alo
gis
tic
sp
ecific
atio
n.
Th
esa
mp
lep
erio
dis
fro
m1
98
1u
ntil2
00
6.
Ap
ub
licfirm
isd
ee
me
dto
ha
ve
be
en
take
np
riva
teif
mo
reth
an
50
%o
fa
pu
blic
firm
'ssh
are
sa
rep
urc
ha
se
db
ya
priva
tee
ntity
,th
eu
ltim
ate
pa
ren
to
fth
ep
riva
tee
ntity
(if
ith
as
an
ultim
ate
pa
ren
tco
mp
an
y)
isa
lso
priva
te,
an
dth
ep
ub
licfirm
de
lists
with
intw
oye
ars
of
the
eff
ective
da
tefo
rth
etr
an
sa
ctio
n.
Th
ein
du
str
yfixe
de
ffe
cts
are
de
fin
ed
usin
gth
e4
8in
du
str
ycla
ssific
atio
nsch
em
ea
va
ilab
leo
nK
en
ne
thF
ren
ch
'sw
eb
site
.T
he
sta
nd
ard
err
ors
for
the
co
eff
icie
nt
estim
ate
s a
re in
pa
ren
the
se
s a
nd
are
clu
ste
red
by f
irm
(o
r ye
ar)
.
Ma
rke
t C
ap
ita
liza
tio
n
(No
rma
lize
d)
Firm
ch
ara
teristics
are
me
asu
red
at
the
en
do
fth
ep
revio
us
fisca
lye
ar
for
acco
un
tin
gd
ata
fro
mC
om
pu
sta
t.T
he
ma
rke
tva
lue
of
eq
uity
ism
ea
su
red
as
of
De
ce
mb
er
of
the
pre
vio
us
ye
ar
for
the
bo
ok-t
o-
ma
rke
tra
tio
for
eq
uity.
Asse
tg
row
this
the
an
nu
al
gro
wth
rate
of
the
bo
ok
va
lue
of
asse
tsb
etw
ee
nfisca
lye
ars
.S
tock
retu
rnvo
latilit
yis
ca
lcu
late
dfr
om
mo
nth
lyd
ata
inC
RS
Pu
sin
gth
ep
revio
us
36
mo
nth
se
nd
ing
inD
ece
mb
er.
Ma
rke
tca
pita
liza
tio
n(n
orm
aliz
ed
)is
me
asu
red
as
of
De
ce
mb
er
of
the
pre
vio
us
ye
ar,
log
tra
nsfo
rme
d,
an
dsca
led
tob
ed
istr
ibu
ted
with
am
ea
no
fze
roa
nd
sta
nd
ard
de
via
tio
n o
f o
ne
fo
r e
ach
ye
ar.
Re
turn
on
asse
ts is o
pe
ratin
g in
co
me
div
ide
d b
y la
gg
ed
asse
ts.

Tab
le 4
. C
om
pari
so
n o
f th
e L
evera
ge C
ho
ice a
nd
th
e D
ecis
ion
To
Go
Pri
vate
De
pe
nd
en
t V
ari
ab
le:
La
rge
In
cre
as
e i
n B
oo
k L
ev
era
ge
Ps
ue
do
Go
ing
Pri
va
te L
ev
era
ge
Ch
an
ge
Go
ing
Pri
va
te
(1)
(2)
(3)
(4)
(5)
(6)
-0.1
01
7-0
.10
19
-0.1
39
6-0
.13
88
0.1
78
10
.17
83
(0.0
941)
(0.0
944)
(0.1
415)
(0.1
42
0)
(0.0
32
2)*
**(0
.03
22
)***
As
se
t G
row
th-0
.27
77
-0.3
13
7-0
.74
49
-0.8
35
7-1
.74
63
-1.7
59
3
(0.1
897)
(0.1
905)*
(0.3
018)*
*(0
.303
1)*
**(0
.24
83
)***
(0.2
47
7)*
**
Sto
ck
Re
turn
Vo
lati
lity
4.1
93
44
.15
39
2.9
08
42
.81
53
-2.0
85
1-2
.07
76
(0.5
916)*
**(0
.5931)*
**(0
.9462)*
**(0
.945
6)*
**(0
.67
40
)***
(0.6
75
9)*
**
-0.1
13
9-0
.11
31
-0.1
65
6-0
.16
08
-0.3
47
5-0
.34
73
(0.0
722)
(0.0
722)
(0.1
125)
(0.1
12
2)
(0.0
46
3)*
**(0
.04
63
)***
Re
turn
On
As
se
ts-2
.66
88
-2.6
88
2-2
.85
35
-2.8
75
22
.18
55
2.2
23
9
(0.2
080)*
**(0
.2073)*
**(0
.3326)*
**(0
.326
8)*
**(0
.32
86
)***
(0.3
33
0)*
**
Bo
ok
Le
ve
rag
e-5
.22
00
-5.1
48
6-6
.99
42
-6.8
38
40
.00
93
-0.0
09
8
(0.2
174)*
**(0
.2207)*
**(0
.2754)*
**(0
.287
1)*
**(0
.19
82
)(0
.20
29
)
-0.4
23
9-0
.99
66
0.1
75
6
(0.4
028)
(0.5
70
6)*
(0.4
10
4)
Ye
ar
Fix
ed
Eff
ec
tsX
XX
XX
X
Ind
us
try
Fix
ed
Eff
ec
tsX
XX
XX
X
Ps
eu
do
R2
0.2
14
90
.21
52
0.2
43
60
.24
47
0.0
69
10
.06
91
NN
= 1
04
,76
0N
= 1
04
,76
0N
= 9
4,5
14
N=
94
,51
4N
= 1
12
,96
8N
= 1
12
,96
8
* sig
nific
an
t a
t 1
0%
; **
sig
nific
an
t a
t 5
%;
***
sig
nific
an
t a
t 1
%
Bo
ok
-To
-Ma
rke
t R
ati
o
Fo
r E
qu
ity
No
tes
:E
ach
co
lum
np
rese
nts
the
co
eff
icie
nt
estim
ate
sfr
om
alo
gis
tic
sp
ecific
atio
n.
Th
esa
mp
lep
erio
dis
fro
m1
98
1u
ntil2
00
6.
Inco
lum
ns
1a
nd
2th
ed
ep
en
de
nt
va
ria
ble
isa
larg
ein
cre
ase
inb
oo
kle
ve
rag
e,
i.e
.,a
nin
dic
ato
rva
ria
ble
eq
ua
lto
1if
the
ch
an
ge
inb
oo
kle
ve
rag
efo
rye
ar
t+1
isg
rea
ter
tha
n0
.45
.In
co
lum
ns
3a
nd
4th
ed
ep
en
de
nt
va
ria
ble
isa
psu
ed
og
oin
gp
riva
tele
ve
rag
ech
an
ge
,i.e
.,a
nin
dic
ato
r
va
ria
ble
eq
ua
lto
1if
bo
ok
leve
rag
eis
less
tha
n0
.3fo
rye
ar
ta
nd
gre
ate
rth
an
0.7
for
ye
ar
t+1
.In
co
lum
ns
5a
nd
6th
ed
ep
en
de
nt
va
ria
ble
isth
ed
ecis
ion
tog
op
riva
te.
Ap
ub
licfirm
isd
ee
me
dto
ha
ve
be
en
take
np
riva
teif
mo
reth
an
50
%o
fa
pu
blic
firm
'ssh
are
sa
rep
urc
ha
se
db
ya
priva
tee
ntity
,th
eu
ltim
ate
pa
ren
to
fth
ep
riva
tee
ntity
(if
ith
as
an
ultim
ate
pa
ren
tco
mp
an
y)
isa
lso
priva
te,
an
dth
ep
ub
licfirm
de
lists
with
intw
oye
ars
of
the
eff
ective
da
tefo
rth
etr
an
sa
ctio
n.
Th
ein
du
str
yfixe
de
ffe
cts
are
de
fin
ed
usin
gth
e4
8in
du
str
ycla
ssific
atio
nsch
em
ea
va
ilab
leo
nK
en
ne
thF
ren
ch
'sw
eb
site
.T
he
sta
nd
ard
err
ors
for
the
co
eff
icie
nt
estim
ate
s a
re in
pa
ren
the
se
s a
nd
are
clu
ste
red
by f
irm
.
Ma
rke
t C
ap
ita
liza
tio
n
(No
rma
lize
d)
Firm
ch
ara
teristics
are
me
asu
red
at
the
en
do
fth
ep
revio
us
fisca
lye
ar
for
acco
un
tin
gd
ata
fro
mC
om
pu
sta
t.T
he
ma
rke
tva
lue
of
eq
uity
ism
ea
su
red
as
of
De
ce
mb
er
of
the
pre
vio
us
ye
ar
for
the
bo
ok-t
o-
ma
rke
tra
tio
for
eq
uity.
Asse
tg
row
this
the
an
nu
alg
row
thra
teo
fth
eb
oo
kva
lue
of
asse
tsb
etw
ee
nfisca
lye
ars
.S
tock
retu
rnvo
latilit
yis
ca
lcu
late
dfr
om
mo
nth
lyd
ata
inC
RS
Pu
sin
gth
ep
revio
us
36
mo
nth
s
en
din
gin
De
ce
mb
er
of
the
pre
vio
us
ye
ar.
Ma
rke
tca
pita
liza
tio
n(n
orm
aliz
ed
)is
me
asu
red
as
of
De
ce
mb
er
of
the
pre
vio
us
ye
ar,
log
tra
nsfo
rme
d,
an
dsca
led
tob
ed
istr
ibu
ted
with
am
ea
no
fze
roa
nd
sta
nd
ard
de
via
tio
n o
f o
ne
fo
r e
ach
ye
ar.
Re
turn
on
asse
ts is o
pe
ratin
g in
co
me
sca
led
by la
gg
ed
asse
ts.
Bo
ok le
ve
rag
e is t
he
qu
an
tity
bo
ok a
sse
ts m
inu
s b
oo
k e
qu
ity s
ca
led
by b
oo
k a
sse
ts.
Ch
an
ge
in
Bo
ok
Le
ve
rag
e

Tab
le 5
. T
he Im
pact
of
Macro
eco
no
mic
Cre
dit
Co
nd
itio
ns o
n t
he D
ecis
ion
To
Go
Pri
vate
De
pe
nd
en
t V
ari
ab
le:
If a
go
ing
pri
va
te t
ran
sa
cti
on
oc
cu
rs y
=1
; o
the
rwis
e,
y=
0
(1)
(2)
(3)
(4)
(5)
(6)
0.1
50
00
.15
50
0.1
56
60
.15
51
0.1
57
40
.15
57
(0.0
305)*
**(0
.0293)*
**(0
.0292)*
**(0
.029
5)*
**(0
.02
87
)***
(0.0
29
1)*
**
As
se
t G
row
th-1
.62
89
-1.6
43
1-1
.63
15
-1.6
27
7-1
.60
75
-1.6
55
3
(0.2
773)*
**(0
.2779)*
**(0
.2839)*
**(0
.277
9)*
**(0
.27
78
)***
(0.2
72
8)*
**
Sto
ck
Re
turn
Vo
lati
lity
-2.0
06
8-1
.91
84
-1.9
86
8-2
.01
43
-2.1
08
7-1
.89
46
(0.9
498)*
*(0
.9992)*
(0.9
982)*
*(0
.98
52
)**
(0.9
71
9)*
*(1
.00
56
)*
-0.3
51
6-0
.35
79
-0.3
58
0-0
.36
36
-0.3
62
9-0
.35
38
(0.0
731)*
**(0
.0736)*
**(0
.0740)*
**(0
.073
0)*
**(0
.07
39
)***
(0.0
73
6)*
**
Re
turn
On
As
se
ts1
.91
71
1.9
59
91
.96
65
1.9
58
61
.96
50
1.9
71
0
(0.3
199)*
**(0
.3166)*
**(0
.3154)*
**(0
.322
4)*
**(0
.32
01
)***
(0.3
13
0)*
**
Bo
ok
Le
ve
rag
e-0
.10
58
-0.1
11
1-0
.10
56
-0.0
98
2-0
.09
45
-0.1
12
0
(0.1
734)
(0.1
741)
(0.1
757)
(0.1
73
6)
(0.1
74
4)
(0.1
75
4)
Cre
dit
Sp
rea
d0
.11
10
0.1
79
00
.07
90
(0.0
717)
(0.1
28
2)
(0.0
78
7)
US
Tre
as
ury
YT
M (
1-y
ea
r)-0
.00
37
0.0
63
60
.06
30
(0.0
493)
(0.0
70
5)
(0.0
79
9)
US
Tre
as
ury
YT
M (
10
-ye
ar)
-0.4
83
6-0
.03
53
-0.1
07
2
(0.6
631)
(0.0
68
9)
(0.1
07
3)
Ps
eu
do
R2
0.0
47
80
.04
82
0.0
48
50
.04
91
0.0
48
80
.04
88
NN
= 1
14
,26
2N
= 1
11
,01
5N
= 1
11
,01
5N
= 1
11
,01
5N
= 1
11
,01
5N
= 1
11
,01
5
* sig
nific
an
t a
t 1
0%
; **
sig
nific
an
t a
t 5
%;
***
sig
nific
an
t a
t 1
%
Bo
ok
-To
-Ma
rke
t R
ati
o
Fo
r E
qu
ity
No
tes
:E
ach
co
lum
np
rese
nts
the
co
eff
icie
nt
estim
ate
sfr
om
alo
gis
tic
sp
ecific
atio
n.
Th
esa
mp
lep
erio
dis
fro
m1
98
1u
ntil2
00
6.
Ap
ub
licfirm
isd
ee
me
dto
ha
ve
be
en
take
np
riva
teif
mo
reth
an
50
%o
fa
pu
blic
firm
'ssh
are
sa
rep
urc
ha
se
db
ya
priva
tee
ntity
,th
eu
ltim
ate
pa
ren
to
fth
ep
riva
tee
ntity
(if
ith
as
an
ultim
ate
pa
ren
tco
mp
an
y)
isa
lso
priva
te,
an
dth
ep
ub
licfirm
de
lists
with
intw
oye
ars
of
the
eff
ective
da
tefo
r
the
tra
nsa
ctio
n.
Th
ecre
dit
sp
rea
dis
the
ave
rag
eyie
ldfo
rB
AA
rate
db
on
ds
acco
rdin
gto
Mo
od
y's
ratin
gs
min
us
the
ave
rag
eyie
ldfo
rU
Str
ea
su
ryb
on
ds
as
of
De
ce
mb
er
of
the
pre
vio
us
ye
ar
(da
tafr
om
St.
Lo
uis
FR
B).
Th
eU
ST
rea
su
ryY
TM
isth
eyie
ldto
ma
turity
for
the
1-y
ea
ra
nd
10
-ye
ar
tre
asu
ryse
cu
ritie
s(r
esp
ective
ly)
min
us
1-y
ea
re
xp
ecte
din
fla
tio
n(C
PI)
fro
mth
eS
urv
ey
of
Pro
fessio
na
lF
ore
ca
ste
rs(d
ata
fro
mP
hila
de
lph
iaF
RB
)a
so
fD
ece
mb
er
of
the
pre
vio
us
ye
ar.
Th
efirs
te
nd
-of-
ye
ar
fore
ca
st
for
exp
ecte
din
fla
tio
nis
ava
ilab
lein
the
fou
rth
qu
art
er
of
19
81
for
19
82
.A
llsp
ecific
atio
nin
clu
de
ind
ustr
yfixe
d
eff
ects
wh
ich
are
de
fin
ed
usin
g t
he
48
in
du
str
y c
lassific
atio
n s
ch
em
e a
va
ilab
le o
n K
en
ne
th F
ren
ch
's w
eb
site
. T
he
sta
nd
ard
err
ors
fo
r th
e c
oe
ffic
ien
t e
stim
ate
s a
re in
pa
ren
the
se
s a
nd
are
clu
ste
red
by y
ea
r.
Ma
rke
t C
ap
ita
liza
tio
n
(No
rma
lize
d)
Firm
ch
ara
teristics
are
me
asu
red
at
the
en
do
fth
ep
revio
us
fisca
lye
ar
for
acco
un
tin
gd
ata
fro
mC
om
pu
sta
t.T
he
ma
rke
tva
lue
of
eq
uity
ism
ea
su
red
as
of
De
ce
mb
er
of
the
pre
vio
us
ye
ar
for
the
bo
ok-t
o-
ma
rke
tra
tio
for
eq
uity.
Asse
tg
row
this
the
an
nu
alg
row
thra
teo
fth
eb
oo
kva
lue
of
asse
tsb
etw
ee
nfisca
lye
ars
.S
tock
retu
rnvo
latilit
yis
ca
lcu
late
dfr
om
mo
nth
lyd
ata
inC
RS
Pu
sin
gth
ep
revio
us
36
mo
nth
s
en
din
gin
De
ce
mb
er
of
the
pre
vio
us
ye
ar.
Ma
rke
tca
pita
liza
tio
n(n
orm
aliz
ed
)is
me
asu
red
as
of
De
ce
mb
er
of
the
pre
vio
us
ye
ar,
log
tra
nsfo
rme
d,
an
dsca
led
tob
ed
istr
ibu
ted
with
am
ea
no
fze
roa
nd
sta
nd
ard
de
via
tio
n o
f o
ne
fo
r e
ach
ye
ar.
Re
turn
on
asse
ts is o
pe
ratin
g in
co
me
sca
led
by la
gg
ed
asse
ts.
Bo
ok le
ve
rag
e is t
he
qu
an
tity
bo
ok a
sse
ts m
inu
s b
oo
k e
qu
ity s
ca
led
by b
oo
k a
sse
ts.
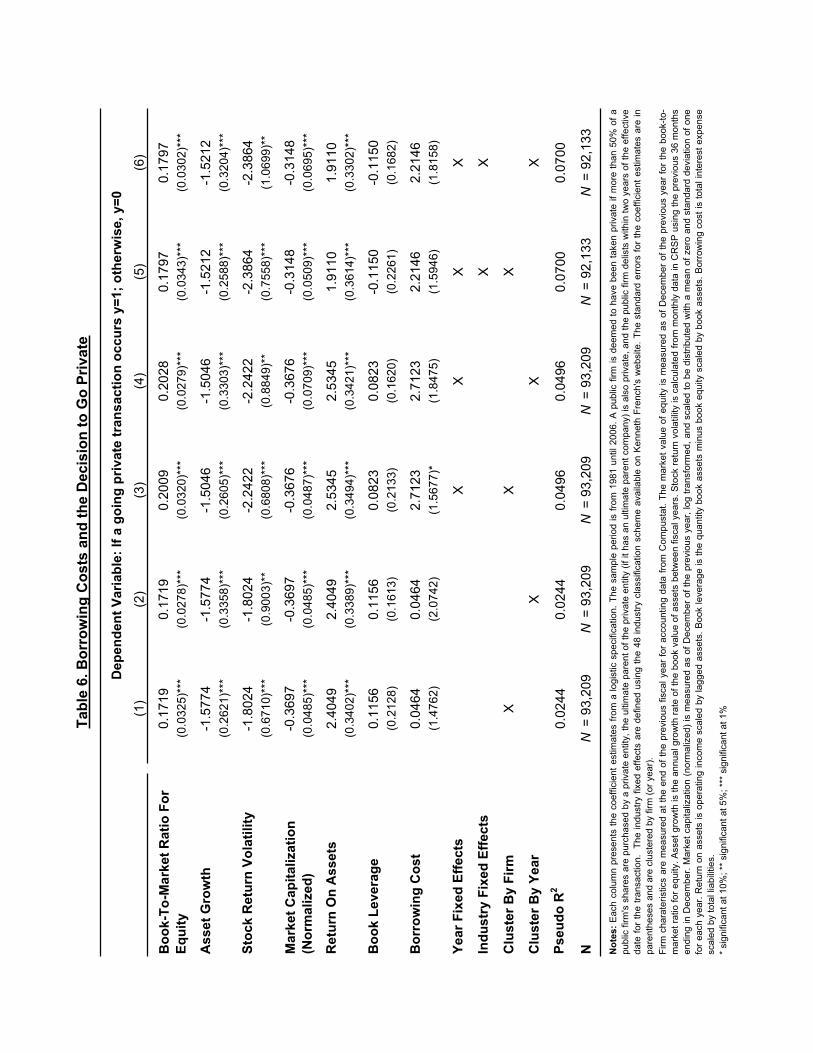
Tab
le 6
. B
orr
ow
ing
Co
sts
an
d t
he D
ecis
ion
to
Go
Pri
vate
De
pe
nd
en
t V
ari
ab
le:
If a
go
ing
pri
va
te t
ran
sa
cti
on
oc
cu
rs y
=1
; o
the
rwis
e,
y=
0
(1)
(2)
(3)
(4)
(5)
(6)
0.1
71
90
.17
19
0.2
00
90
.20
28
0.1
79
70
.17
97
(0.0
325)*
**(0
.0278)*
**(0
.0320)*
**(0
.0279
)***
(0.0
34
3)*
**(0
.03
02
)***
As
se
t G
row
th-1
.57
74
-1.5
77
4-1
.50
46
-1.5
04
6-1
.52
12
-1.5
21
2
(0.2
621)*
**(0
.3358)*
**(0
.2605)*
**(0
.3303
)***
(0.2
58
8)*
**(0
.32
04
)***
Sto
ck
Re
turn
Vo
lati
lity
-1.8
02
4-1
.80
24
-2.2
42
2-2
.24
22
-2.3
86
4-2
.38
64
(0.6
710)*
**(0
.9003)*
*(0
.6808)*
**(0
.8849
)**
(0.7
55
8)*
**(1
.06
99
)**
-0.3
69
7-0
.36
97
-0.3
67
6-0
.36
76
-0.3
14
8-0
.31
48
(0.0
485)*
**(0
.0485)*
**(0
.0487)*
**(0
.0709
)***
(0.0
50
9)*
**(0
.06
95
)***
Re
turn
On
As
se
ts2
.40
49
2.4
04
92
.53
45
2.5
34
51
.91
10
1.9
11
0
(0.3
402)*
**(0
.3389)*
**(0
.3494)*
**(0
.3421
)***
(0.3
61
4)*
**(0
.33
02
)***
Bo
ok
Le
ve
rag
e0
.11
56
0.1
15
60
.08
23
0.0
82
3-0
.11
50
-0.1
15
0
(0.2
128)
(0.1
613)
(0.2
133)
(0.1
62
0)
(0.2
26
1)
(0.1
68
2)
Bo
rro
win
g C
os
t0
.04
64
0.0
46
42
.71
23
2.7
12
32
.21
46
2.2
14
6
(1.4
762)
(2.0
742)
(1.5
677)*
(1.8
475
)(1
.59
46
)(1
.81
58
)
Ye
ar
Fix
ed
Eff
ec
tsX
XX
X
Ind
us
try
Fix
ed
Eff
ec
tsX
X
Clu
ste
r B
y F
irm
XX
X
Clu
ste
r B
y Y
ea
rX
XX
Ps
eu
do
R2
0.0
24
40
.02
44
0.0
49
60
.04
96
0.0
70
00
.07
00
NN
= 9
3,2
09
N =
93
,20
9N
= 9
3,2
09
N =
93
,20
9N
= 9
2,1
33
N =
92
,13
3
* sig
nific
an
t a
t 1
0%
; **
sig
nific
an
t a
t 5
%;
***
sig
nific
an
t a
t 1
%
Bo
ok
-To
-Ma
rke
t R
ati
o F
or
Eq
uit
y
No
tes
:E
ach
co
lum
np
rese
nts
the
co
eff
icie
nt
estim
ate
sfr
om
alo
gis
tic
sp
ecific
atio
n.
Th
esa
mp
lep
erio
dis
fro
m1
98
1u
ntil
20
06
.A
pu
blic
firm
isd
ee
me
dto
ha
ve
be
en
take
np
riva
teif
mo
reth
an
50
%o
fa
pu
blic
firm
'ssh
are
sa
rep
urc
ha
se
db
ya
priva
tee
ntity
,th
eu
ltim
ate
pa
ren
to
fth
ep
riva
tee
ntity
(if
ith
as
an
ultim
ate
pa
ren
tco
mp
an
y)
isa
lso
priva
te,
an
dth
ep
ub
licfirm
de
lists
with
intw
oye
ars
of
the
eff
ective
da
tefo
rth
etr
an
sa
ctio
n.
Th
ein
du
str
yfixe
de
ffe
cts
are
de
fin
ed
usin
gth
e4
8in
du
str
ycla
ssific
atio
nsch
em
ea
va
ilab
leo
nK
en
ne
thF
ren
ch
'sw
eb
site
.T
he
sta
nd
ard
err
ors
for
the
co
eff
icie
nt
estim
ate
sa
rein
pa
ren
the
se
s a
nd
are
clu
ste
red
by f
irm
(o
r ye
ar)
.
Ma
rke
t C
ap
ita
liza
tio
n
(No
rma
lize
d)
Firm
ch
ara
teristics
are
me
asu
red
at
the
en
do
fth
ep
revio
us
fisca
lye
ar
for
acco
un
tin
gd
ata
fro
mC
om
pu
sta
t.T
he
ma
rke
tva
lue
of
eq
uity
ism
ea
su
red
as
of
De
ce
mb
er
of
the
pre
vio
us
ye
ar
for
the
bo
ok-t
o-
ma
rke
tra
tio
for
eq
uity.
Asse
tg
row
this
the
an
nu
alg
row
thra
teo
fth
eb
oo
kva
lue
of
asse
tsb
etw
ee
nfisca
lye
ars
.S
tock
retu
rnvo
latilit
yis
ca
lcu
late
dfr
om
mo
nth
lyd
ata
inC
RS
Pu
sin
gth
ep
revio
us
36
mo
nth
s
en
din
gin
De
ce
mb
er.
Ma
rke
tca
pita
liza
tio
n(n
orm
aliz
ed
)is
me
asu
red
as
of
De
ce
mb
er
of
the
pre
vio
us
ye
ar,
log
tra
nsfo
rme
d,
an
dsca
led
tob
ed
istr
ibu
ted
with
am
ea
no
fze
roa
nd
sta
nd
ard
de
via
tio
no
fo
ne
for
ea
ch
ye
ar.
Re
turn
on
asse
tsis
op
era
tin
gin
co
me
sca
led
by
lag
ge
da
sse
ts.
Bo
ok
leve
rag
eis
the
qu
an
tity
bo
ok
asse
tsm
inu
sb
oo
ke
qu
ity
sca
led
by
bo
ok
asse
ts.
Bo
rro
win
gco
st
isto
talin
tere
st
exp
en
se
sca
led
by t
ota
l lia
bili
tie
s.

Tab
le 7
. T
he S
up
ply
of
Pri
vate
Eq
uit
y a
nd
th
e D
ecis
ion
to
Go
Pri
vate
(IV
Ap
pro
ach
)
De
pe
nd
en
t V
ari
ab
le:
If a
go
ing
pri
va
te t
ran
sa
cti
on
oc
cu
rs y
=1
; o
the
rwis
e,
y=
0
(1)
(2)
(3)
(4)
(5)
(6)
0.0
02
20
.00
22
0.0
02
20
.00
22
(0.0
004)*
**(0
.0004
)***
(0.0
00
4)*
**(0
.00
04
)***
As
se
t G
row
th-0
.00
73
-0.0
07
3-0
.00
70
-0.0
07
0
(0.0
009)*
**(0
.0011
)***
(0.0
00
9)*
**(0
.00
11
)***
Sto
ck
Re
turn
Vo
lati
lity
-0.0
03
8-0
.00
38
-0.0
07
4-0
.00
74
(0.0
031)
(0.0
04
7)
(0.0
03
5)*
**(0
.00
54
)
-0.0
01
8-0
.00
18
-0.0
01
5-0
.00
15
(0.0
002)*
**(0
.0003
)***
(0.0
00
2)*
**(0
.00
03
)***
Re
turn
On
As
se
ts0
.01
22
0.0
12
20
.00
88
0.0
08
8
(0.0
013)*
**(0
.0017
)***
(0.0
01
3)*
**(0
.00
17
)***
1.6
54
81
.65
48
1.7
58
01
.75
80
1.7
85
81
.78
58
(0.3
607)*
**(0
.7426)*
*(0
.3617)*
**(0
.8154
)**
(0.3
73
8)*
**(0
.82
28
)**
Ind
us
try
Fix
ed
Eff
ec
tsX
X
Clu
ste
r B
y F
irm
XX
X
Clu
ste
r B
y Y
ea
rX
XX
R2
0.0
00
20
.00
02
0.0
02
30
.00
23
0.0
03
80
.00
38
NN
= 1
15
,45
5N
= 1
15
,45
5N
= 1
15
,45
5N
= 1
15
,45
5N
= 1
15
,45
5N
= 1
15
,45
5
* sig
nific
an
t a
t 1
0%
; **
sig
nific
an
t a
t 5
%;
***
sig
nific
an
t a
t 1
%
Bo
ok
-To
-Ma
rke
t R
ati
o
Fo
r E
qu
ity
No
tes
:E
ach
co
lum
np
rese
nts
the
co
eff
icie
nt
estim
ate
sfr
om
atw
osta
ge
lea
st
sq
ua
res
(2S
LS
)sp
ecific
atio
n.
Th
esa
mp
lep
erio
dis
fro
m1
98
1u
ntil2
00
6.
Ap
ub
licfirm
isd
ee
me
dto
ha
ve
be
en
take
np
riva
teif
mo
reth
an
50
%o
fa
pu
blic
firm
'ssh
are
sa
rep
urc
ha
se
db
ya
priva
tee
ntity
,th
eu
ltim
ate
pa
ren
to
fth
ep
riva
tee
ntity
(if
ith
as
an
ultim
ate
pa
ren
tco
mp
an
y)
isa
lso
priva
te,
an
dth
ep
ub
licfirm
de
lists
with
intw
o
ye
ars
of
the
eff
ective
da
tefo
rth
etr
an
sa
ctio
n.
Th
eb
uyo
ut
(ve
ntu
reca
pita
l)in
flo
wis
the
am
ou
nt
of
mo
ne
yfo
rn
ew
bu
yo
ut
(ve
ntu
reca
pita
l)fu
nd
sn
orm
aliz
ed
by
the
ma
rke
tca
pita
liza
tio
no
fa
lllis
ted
co
mp
an
ies
as
of
De
ce
mb
er
of
the
pre
vio
us
ye
ar
(da
tap
rovid
ed
by
Pe
rS
tro
mb
erg
).T
he
ind
ustr
yfixe
de
ffe
cts
are
de
fin
ed
usin
gth
e4
8in
du
str
ycla
ssific
atio
nsch
em
ea
va
ilab
leo
nK
en
ne
thF
ren
ch
'sw
eb
site
.A
ll
sp
ecific
atio
ns in
clu
de
in
du
str
y a
nd
ye
ar
fixe
d e
ffe
cts
. T
he
sta
nd
ard
err
ors
fo
r th
e c
oe
ffic
ien
t e
stim
ate
s a
re in
pa
ren
the
se
s a
nd
are
clu
ste
red
by f
irm
(o
r ye
ar)
.
Ma
rke
t C
ap
ita
liza
tio
n
(No
rma
lize
d)
Firm
ch
ara
teristics
are
me
asu
red
at
the
en
do
fth
ep
revio
us
fisca
lye
ar
for
acco
un
tin
gd
ata
fro
mC
om
pu
sta
t.T
he
ma
rke
tva
lue
of
eq
uity
ism
ea
su
red
as
of
De
ce
mb
er
of
the
pre
vio
us
ye
ar
for
the
bo
ok-t
o-
ma
rke
tra
tio
for
eq
uity.
Asse
tg
row
this
the
an
nu
alg
row
thra
teo
fth
eb
oo
kva
lue
of
asse
tsb
etw
ee
nfisca
lye
ars
.S
tock
retu
rnvo
latilit
yis
ca
lcu
late
dfr
om
mo
nth
lyd
ata
inC
RS
Pu
sin
gth
ep
revio
us
36
mo
nth
s
en
din
gin
De
ce
mb
er
of
the
pre
vio
us
ye
ar.
Ma
rke
tca
pita
liza
tio
n(n
orm
aliz
ed
)is
me
asu
red
as
of
De
ce
mb
er
of
the
pre
vio
us
ye
ar,
log
tra
nsfo
rme
d,
an
dsca
led
tob
ed
istr
ibu
ted
with
am
ea
no
fze
roa
nd
sta
nd
ard
de
via
tio
n o
f o
ne
fo
r e
ach
ye
ar.
R
etu
rn o
n a
sse
ts is o
pe
ratin
g in
co
me
sca
led
by la
gg
ed
asse
ts.
Bu
yo
ut
Infl
ow
(In
str
um
en
t w
/ V
C I
nfl
ow
)

Tab
le 8
. D
ivers
ity a
nd
th
e D
ecis
ion
to
Go
Pri
vate
De
pe
nd
en
t V
ari
ab
le:
If a
go
ing
pri
va
te t
ran
sa
cti
on
oc
cu
rs y
=1
; o
the
rwis
e,
y=
0
(1)
(2)
(3)
(4)
(5)
(6)
0.1
62
70
.18
27
0.1
83
50
.18
01
0.1
60
50
.16
14
(0.0
323)*
**(0
.0326)*
**(0
.0327)*
**(0
.032
8)*
**(0
.03
36
)***
(0.0
33
7)*
**
As
se
t G
row
th-1
.67
56
-1.6
57
2-1
.65
81
-1.6
55
5-1
.64
60
-1.6
46
9
(0.2
475)*
**(0
.2460)*
**(0
.2457)*
**(0
.246
5)*
**(0
.24
82
)***
(0.2
47
9)*
**
Sto
ck
Re
turn
Vo
lati
lity
-2.2
66
5-2
.29
64
-2.3
10
2-2
.34
36
-2.5
01
0-2
.51
80
(0.6
718)*
**(0
.6857)*
**(0
.6904)*
**(0
.689
1)*
**(0
.69
05
)***
(0.6
94
7)*
**
-0.5
47
0-0
.31
31
-0.3
08
6-0
.31
90
-0.5
19
9-0
.51
50
(0.0
558)*
**(0
.0492)*
**(0
.0492)*
**(0
.325
7)*
**(0
.05
89
)***
(0.0
58
7)*
**
Re
turn
On
As
se
ts2
.05
75
1.8
89
51
.88
09
1.8
92
01
.87
07
1.8
59
2
(0.3
229)*
**(0
.3257)*
**(0
.3259)*
**(0
.325
7)*
**(0
.32
56
)***
(0.3
25
8)*
**
(Ma
rke
t C
ap
.)*
(In
d1980s)
0.5
06
90
.49
25
0.4
93
8
(0.0
704)*
**(0
.07
47
)***
(0.0
76
4)*
**
Mu
lti-
se
gm
en
t-0
.04
26
-0.1
56
2-0
.09
33
(0.0
943)
(0.1
16
2)
(0.1
16
3)
(Mu
lti-
se
gm
en
t)*(
Ind
1980s)
0.3
07
00
.07
57
(0.1
80
3)*
(0.1
88
2)
Tri
-se
gm
en
t-0
.08
31
-0.1
47
0
(0.1
093)
(0.1
34
1)
(Tri
-se
gm
en
t)*(
Ind
1980s)
0.0
86
7
(0.2
21
2)
Ps
eu
do
R2
0.0
73
10
.06
79
0.0
67
90
.06
83
0.0
67
90
.07
26
NN
= 1
14
,26
2N
= 1
01
,57
4N
= 1
01
,57
4N
= 1
01
,57
4N
= 1
01
,57
4N
= 1
01
,57
4
* sig
nific
an
t a
t 1
0%
; **
sig
nific
an
t a
t 5
%;
***
sig
nific
an
t a
t 1
%
Bo
ok
-To
-Ma
rke
t R
ati
o
Fo
r E
qu
ity
No
tes
:E
ach
co
lum
np
rese
nts
the
co
eff
icie
nt
estim
ate
sfr
om
alo
gis
tic
sp
ecific
atio
n.
Th
esa
mp
lep
erio
dis
fro
m1
98
1u
ntil2
00
6.
Ap
ub
licfirm
isd
ee
me
dto
ha
ve
be
en
take
np
riva
teif
mo
reth
an
50
%o
fa
pu
blic
firm
'ssh
are
sa
rep
urc
ha
se
db
ya
priva
tee
ntity
,th
eu
ltim
ate
pa
ren
to
fth
ep
riva
tee
ntity
(if
ith
as
an
ultim
ate
pa
ren
tco
mp
an
y)
isa
lso
priva
te,
an
dth
ep
ub
licfirm
de
lists
with
intw
oye
ars
of
the
eff
ective
da
tefo
r
the
tra
nsa
ctio
n.
Ind
19
80
sis
an
ind
ica
tor
eq
ua
lto
1if
the
ob
se
rva
tio
nis
be
twe
en
19
80
an
d1
98
9.
Th
ein
du
str
yfixe
de
ffe
cts
are
de
fin
ed
usin
gth
e4
8in
du
str
ycla
ssific
atio
nsch
em
ea
va
ilab
leo
nK
en
ne
thF
ren
ch
's
we
bsite
. A
ll sp
ecific
atio
ns in
clu
de
in
du
str
y a
nd
ye
ar
fixe
d e
ffe
cts
. T
he
sta
nd
ard
err
ors
fo
r th
e c
oe
ffic
ien
t e
stim
ate
s a
re in
pa
ren
the
se
s a
nd
are
clu
ste
red
by f
irm
.
Ma
rke
t C
ap
ita
liza
tio
n
(No
rma
lize
d)
Firm
ch
ara
teristics
are
me
asu
red
at
the
en
do
fth
ep
revio
us
fisca
lye
ar
for
acco
un
tin
gd
ata
fro
mC
om
pu
sta
t.T
he
ma
rke
tva
lue
of
eq
uity
ism
ea
su
red
as
of
De
ce
mb
er
of
the
pre
vio
us
ye
ar
for
the
bo
ok-t
o-
ma
rke
tra
tio
for
eq
uity.
Asse
tg
row
this
the
an
nu
alg
row
thra
teo
fth
eb
oo
kva
lue
of
asse
tsb
etw
ee
nfisca
lye
ars
.S
tock
retu
rnvo
latilit
yis
ca
lcu
late
dfr
om
mo
nth
lyd
ata
inC
RS
Pu
sin
gth
ep
revio
us
36
mo
nth
s
en
din
gin
De
ce
mb
er
of
the
pre
vio
us
ye
ar.
Ma
rke
tca
pita
liza
tio
n(n
orm
aliz
ed
)is
me
asu
red
as
of
De
ce
mb
er
of
the
pre
vio
us
ye
ar,
log
tra
nsfo
rme
d,
an
dsca
led
tob
ed
istr
ibu
ted
with
am
ea
no
fze
roa
nd
sta
nd
ard
de
via
tio
n o
f o
ne
fo
r e
ach
ye
ar.
R
etu
rn o
n a
sse
ts is o
pe
ratin
g in
co
me
sca
led
by la
gg
ed
asse
ts.
If t
he
firm
ha
s m
ore
th
an
on
e (
two
) b
usin
ess s
eg
me
nts
th
en
th
e f
irm
is c
lassifie
d a
s m
ulti-se
gm
en
t (t
ri-s
eg
me
nt)
.

Ta
ble
9.
Th
e S
arb
an
es
-Ox
ley
Ac
t a
nd
th
e D
ec
isio
n t
o G
o P
riv
ate
De
pe
nd
en
t V
ari
ab
le:
If a
go
ing
pri
va
te t
ran
sa
cti
on
oc
cu
rs y
=1
; o
the
rwis
e,
y=
0
(1)
(2)
(3)
(4)
(5)
(6)
0.1
56
60
.15
66
0.1
38
60
.15
94
0.1
59
40
.14
13
(0.0
328)*
**(0
.0330)*
**(0
.0348)*
**(0
.0326)*
**(0
.0304)*
**(0
.0347)*
**
As
se
t G
row
th-1
.66
48
-1.6
64
8-1
.65
24
-1.6
69
4-1
.66
94
-1.6
56
6
(0.2
471)*
**(0
.2781)*
**(0
.2458)*
**(0
.2470)*
**(0
.2781)*
**(0
.2458)*
**
Sto
ck
Re
turn
Vo
lati
lity
-2.2
76
8-2
.27
68
-2.0
90
5-2
.24
60
-2.2
46
0-2
.05
79
(0.6
702)*
**(0
.9751)*
*(0
.70339)*
*(0
.6711)*
**(0
.9761)*
*(0
.7048)*
**
-0.4
93
4-0
.49
34
-0.4
81
9-0
.48
14
-0.4
81
4-0
.46
74
(0.0
571)*
**(0
.0673)*
**(0
.0577)*
**(0
.0614)*
**(0
.0752)*
**(0
.0624)*
**
Re
turn
On
As
se
ts2
.03
74
2.0
37
42
.11
60
2.0
39
82
.03
98
2.1
18
2
(0.3
228)*
**(0
.3340)*
**(0
.3167)*
**(0
.3227)*
**(0
.3332)*
**(0
.3167)*
**
(Ma
rke
t C
ap
.)*
(In
d1980s)
0.4
52
00
.45
20
0.4
49
30
.44
19
0.4
41
90
.43
68
(0.0
716)*
**(0
.0883)*
**(0
.0711)*
*(0
.0746)*
**(0
.0902)*
**(0
.0742)*
**
(Ma
rke
t C
ap
.)*
(In
dS
OX
-N)
-0.4
14
9-0
.41
49
-0.4
30
0
(0.1
480)*
**(0
.1724)*
*(0
.1479)*
**
(Ma
rke
t C
ap
.)*
(In
dS
OX
-W)
-0.2
37
8-0
.23
78
-0.2
53
9
(0.1
062)*
*(0
.1750)
(0.1
065)*
*
Av
era
ge
Sto
ck
Re
turn
-1.6
48
0-1
.65
62
(1.0
151)*
(1.0
198)
Clu
ste
r B
y F
irm
XX
XX
Clu
ste
r B
y Y
ea
rX
X
Ps
eu
do
R2
0.0
73
90
.07
39
0.0
74
30
.07
39
0.0
73
60
.07
39
NN
= 1
14
,26
2N
= 1
14
,26
2N
= 1
14
,25
5N
= 1
14
,26
2N
= 1
14
,26
2N
= 1
14
,25
5
* sig
nific
ant at 10%
; **
sig
nific
ant at 5%
; **
* sig
nific
ant at 1%
Bo
ok
-To
-Ma
rke
t R
ati
o
Fo
r E
qu
ity
No
tes:
Each
colu
mn
pre
sents
the
coeffic
ient
estim
ate
sfr
om
alo
gis
tic
specific
ation.
The
sam
ple
period
isfr
om
1981
until
2006.
Apublic
firm
isdeem
ed
tohave
been
taken
private
ifm
ore
than
50%
of
a
public
firm
'sshare
sare
purc
hased
by
aprivate
entity
,th
eultim
ate
pare
nt
of
the
private
entity
(if
ithas
an
ultim
ate
pare
nt
com
pany)
isals
oprivate
,and
the
public
firm
delis
tsw
ithin
two
years
of
the
effective
date
for
the
transaction.
Ind
1980s
isan
indic
ato
requalto
1if
the
observ
ation
isbetw
een
1980
and
1989.
Ind
SO
X-W
(Ind
SO
X-N
)is
an
indic
ato
requalto
1if
the
observ
ation
isbetw
een
2002
and
2005
(2003
and
2004).
The
industr
yfixed
effects
are
defined
usin
gth
e48
industr
ycla
ssific
ation
schem
eavaila
ble
on
Kenneth
Fre
nch's
website.
All
specific
ation
sin
clu
de
industr
yand
year
fixed
effects
.T
he
sta
ndard
err
ors
for
the c
oeffic
ient estim
ate
s a
re in p
are
nth
eses a
nd a
re c
luste
red b
y firm
(or
year)
.
Ma
rke
t C
ap
ita
liza
tio
n
(No
rma
lize
d)
Firm
chara
teristics
are
measure
dat
the
end
of
the
pre
vio
us
fiscal
year
for
accounting
data
from
Com
pusta
t.T
he
mark
et
valu
eof
equity
ism
easure
das
of
Decem
ber
of
the
pre
vio
us
year
for
the
book-t
o-
mark
et
ratio
for
equity.
Asset
gro
wth
isth
eannualgro
wth
rate
of
the
book
valu
eof
assets
betw
een
fiscalyears
.S
tock
retu
rnvola
tilit
yis
calc
ula
ted
from
month
lydata
inC
RS
Pusin
gth
epre
vio
us
36
month
s
endin
gin
Decem
ber
ofth
epre
vio
us
year.
Mark
etcapitaliz
ation
(norm
aliz
ed)
ism
easure
das
ofD
ecem
ber
ofth
epre
vio
us
year,
log
transfo
rmed,
and
sca
led
tobe
dis
trib
ute
dw
ith
am
ean
ofzero
and
sta
ndard
devia
tion o
f one for
each y
ear.
Retu
rn o
n a
ssets
is o
pera
ting incom
e s
cale
d b
y lagged a
ssets
. A
vera
ge s
tock r
etu
rn is the a
vera
ge m
onth
ly s
tock r
etu
rn d
uring the p
revio
us c
ale
ndar
year.

Tab
le 1
0. C
orp
ora
te G
overn
an
ce a
nd
th
e D
ecis
ion
to
Go
Pri
vate
De
pe
nd
en
t V
ari
ab
le:
If a
go
ing
pri
va
te t
ran
sa
cti
on
oc
cu
rs y
=1
; o
the
rwis
e,
y=
0
(1)
(2)
(3)
(4)
(5)
(6)
0.1
42
00
.25
21
0.2
73
90
.14
32
0.2
57
60
.27
79
(0.0
726)*
*(0
.0713)*
**(0
.0779)*
**(0
.0730)*
*(0
.07
04
)***
(0.0
76
2)*
**
As
se
t G
row
th-2
.13
02
-2.3
42
3-2
.06
36
-2.1
50
5-2
.37
22
-2.0
75
5
(0.6
479)*
**(0
.6647)*
**(0
.66344)*
**(0
.6496)*
**(0
.66
72
)***
(0.6
64
2)*
**
Sto
ck
Re
turn
Vo
lati
lity
0.2
51
61
.14
87
-1.1
48
50
.17
20
1.0
74
7-1
.17
96
(1.0
964)
(1.1
720)
(1.4
949)
(1.0
923)
(1.1
72
7)
(1.4
96
7)
-0.9
01
4-0
.74
33
-0.7
64
5-0
.88
42
-0.7
23
0-0
.74
98
(0.0
948)*
**(0
.1040)*
**(0
.1104)*
**(0
.0963)*
**(0
.10
49
)***
(0.1
11
8)*
**
Re
turn
On
As
se
ts3
.40
98
3.5
06
32
.71
90
3.3
88
93
.49
85
2.6
98
7
(0.7
055)*
**(0
.7009)*
**(0
.8204)*
**(0
.7055)*
**(0
.70
08
)***
(0.8
21
7)*
**
En
tre
nc
hm
en
t In
de
x-0
.04
99
-0.0
67
1-0
.05
11
(0.0
713)
(0.0
729)
(0.0
752)
Go
ve
rna
nc
e I
nd
ex
-0.0
44
6-0
.05
13
-0.0
39
3
(0.0
378)
(0.0
38
9)
(0.0
39
9)
Ye
ar
Fix
ed
Eff
ec
tsX
XX
X
Ind
us
try
Fix
ed
Eff
ec
tsX
X
Ps
eu
do
R2
0.0
70
90
.09
82
0.1
33
20
.07
16
0.0
99
00
.13
36
NN
= 2
7,0
78
N=
25
,79
0N
= 2
3,3
47
N=
27
,07
8N
= 2
5,7
90
N =
2
3,3
47
* sig
nific
an
t a
t 1
0%
; **
sig
nific
an
t a
t 5
%;
***
sig
nific
an
t a
t 1
%
Bo
ok
-To
-Ma
rke
t R
ati
o
Fo
r E
qu
ity
No
tes
:E
ach
co
lum
np
rese
nts
the
co
eff
icie
nt
estim
ate
sfr
om
alo
gis
tic
sp
ecific
atio
n.
Th
esa
mp
lep
erio
dis
fro
m1
98
1u
ntil2
00
6.
Ap
ub
licfirm
isd
ee
me
dto
ha
ve
be
en
take
np
riva
teif
mo
reth
an
50
%o
f
ap
ub
licfirm
'ssh
are
sa
rep
urc
ha
se
db
ya
priva
tee
ntity
,th
eu
ltim
ate
pa
ren
to
fth
ep
riva
tee
ntity
(if
ith
as
an
ultim
ate
pa
ren
tco
mp
an
y)
isa
lso
priva
te,
an
dth
ep
ub
licfirm
de
lists
with
intw
oye
ars
of
the
eff
ective
da
tefo
rth
etr
an
sa
ctio
n.
Th
ein
du
str
yfixe
de
ffe
cts
are
de
fin
ed
usin
gth
e4
8in
du
str
ycla
ssific
atio
nsch
em
ea
va
ilab
leo
nK
en
ne
thF
ren
ch
'sw
eb
site
.T
he
sta
nd
ard
err
ors
for
the
co
eff
icie
nt
estim
ate
s a
re in
pa
ren
the
se
s a
nd
are
clu
ste
red
by f
irm
.
Ma
rke
t C
ap
ita
liza
tio
n
(No
rma
lize
d)
Firm
ch
ara
teristics
are
me
asu
red
at
the
en
do
fth
ep
revio
us
fisca
lye
ar
for
acco
un
tin
gd
ata
fro
mC
om
pu
sta
t.T
he
ma
rke
tva
lue
of
eq
uity
ism
ea
su
red
as
of
De
ce
mb
er
of
the
pre
vio
us
ye
ar
for
the
bo
ok-t
o-
ma
rke
tra
tio
for
eq
uity.
Asse
tg
row
this
the
an
nu
alg
row
thra
teo
fth
eb
oo
kva
lue
of
asse
tsb
etw
ee
nfisca
lye
ars
.S
tock
retu
rnvo
latilit
yis
ca
lcu
late
dfr
om
mo
nth
lyd
ata
inC
RS
Pu
sin
gth
ep
revio
us
36
mo
nth
se
nd
ing
inD
ece
mb
er
of
the
pre
vio
us
ye
ar.
Ma
rke
tca
pita
liza
tio
n(n
orm
aliz
ed
)is
me
asu
red
as
of
De
ce
mb
er
of
the
pre
vio
us
ye
ar,
log
tra
nsfo
rme
d,
an
dsca
led
tob
ed
istr
ibu
ted
with
am
ea
no
f
ze
roa
nd
sta
nd
ard
de
via
tio
no
fo
ne
for
ea
ch
ye
ar.
Re
turn
on
asse
tsis
op
era
tin
gin
co
me
sca
led
by
lag
ge
da
sse
ts.
Th
eE
ntr
en
ch
me
nt
Ind
ex
isd
escrib
ed
by
Be
bch
uk
et
al.
(20
04
)a
nd
the
Go
ve
rna
nce
Ind
ex is d
escrib
ed
by G
om
pe
rs e
t a
l. (
20
03
).
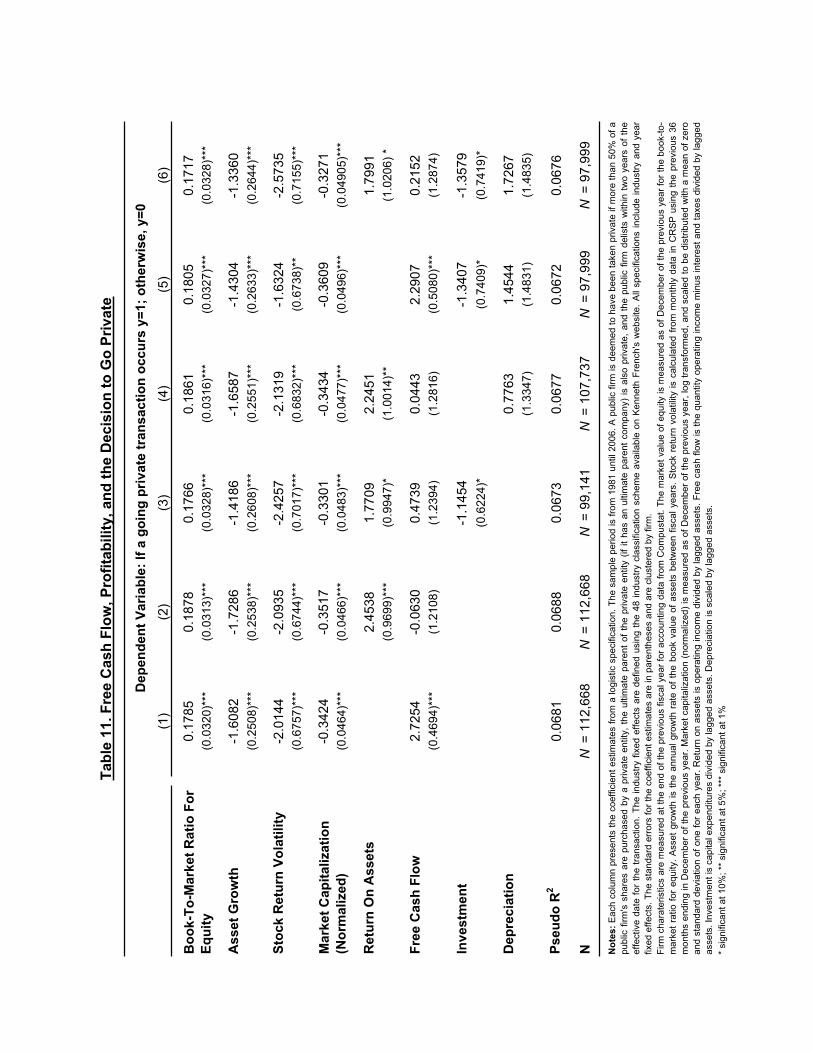
Tab
le 1
1. F
ree C
ash
Flo
w, P
rofi
tab
ilit
y, an
d t
he D
ecis
ion
to
Go
Pri
vate
De
pe
nd
en
t V
ari
ab
le:
If a
go
ing
pri
va
te t
ran
sa
cti
on
oc
cu
rs y
=1
; o
the
rwis
e,
y=
0
(1)
(2)
(3)
(4)
(5)
(6)
0.1
78
50
.18
78
0.1
76
60
.18
61
0.1
80
50
.17
17
(0.0
320
)***
(0.0
313)*
**(0
.0328)*
**(0
.0316)*
**(0
.03
27
)***
(0.0
32
8)*
**
As
se
t G
row
th-1
.60
82
-1.7
28
6-1
.41
86
-1.6
58
7-1
.43
04
-1.3
36
0
(0.2
508
)***
(0.2
538)*
**(0
.2608)*
**(0
.2551)*
**(0
.26
33
)***
(0.2
64
4)*
**
Sto
ck
Re
turn
Vo
lati
lity
-2.0
14
4-2
.09
35
-2.4
25
7-2
.13
19
-1.6
32
4-2
.57
35
(0.6
757
)***
(0.6
744)*
**(0
.7017)*
**(0
.6832)*
**(0
.67
38
)**
(0.7
15
5)*
**
-0.3
42
4-0
.35
17
-0.3
30
1-0
.34
34
-0.3
60
9-0
.32
71
(0.0
464
)***
(0.0
466)*
**(0
.0483)*
**(0
.0477)*
**(0
.04
96
)***
(0.0
49
05
)***
Re
turn
On
As
se
ts2
.45
38
1.7
70
92
.24
51
1.7
99
1
(0.9
699)*
**(0
.9947)*
(1.0
014)*
*(1
.02
06
) *
Fre
e C
as
h F
low
2.7
25
4-0
.06
30
0.4
73
90
.04
43
2.2
90
70
.21
52
(0.4
694
)***
(1.2
108)
(1.2
394)
(1.2
816)
(0.5
08
0)*
**(1
.28
74
)
Inv
es
tme
nt
-1.1
45
4-1
.34
07
-1.3
57
9
(0.6
224)*
(0.7
40
9)*
(0.7
41
9)*
De
pre
cia
tio
n0
.77
63
1.4
54
41
.72
67
(1.3
347)
(1.4
83
1)
(1.4
83
5)
Ps
eu
do
R2
0.0
68
10
.06
88
0.0
67
30
.06
77
0.0
67
20
.06
76
NN
= 1
12
,66
8N
= 1
12
,66
8N
= 9
9,1
41
N=
10
7,7
37
N=
97
,99
9N
= 9
7,9
99
* sig
nific
an
t a
t 1
0%
; **
sig
nific
an
t a
t 5
%;
***
sig
nific
an
t a
t 1
%
Bo
ok
-To
-Ma
rke
t R
ati
o F
or
Eq
uit
y
No
tes
:E
ach
co
lum
np
rese
nts
the
co
eff
icie
nt
estim
ate
sfr
om
alo
gis
tic
sp
ecific
atio
n.
Th
esa
mp
lep
erio
dis
fro
m1
98
1u
ntil2
00
6.
Ap
ub
licfirm
isd
ee
me
dto
ha
ve
be
en
take
np
riva
teif
mo
reth
an
50
%o
fa
pu
blic
firm
'ssh
are
sa
rep
urc
ha
se
db
ya
priva
tee
ntity
,th
eu
ltim
ate
pa
ren
to
fth
ep
riva
tee
ntity
(if
ith
as
an
ultim
ate
pa
ren
tco
mp
an
y)
isa
lso
priva
te,
an
dth
ep
ub
licfirm
de
lists
with
intw
oye
ars
of
the
eff
ective
da
tefo
rth
etr
an
sa
ctio
n.
Th
ein
du
str
yfixe
de
ffe
cts
are
de
fin
ed
usin
gth
e4
8in
du
str
ycla
ssific
atio
nsch
em
ea
va
ilab
leo
nK
en
ne
thF
ren
ch
'sw
eb
site
.A
llsp
ecific
atio
ns
inclu
de
ind
ustr
ya
nd
ye
ar
fixe
d e
ffe
cts
. T
he
sta
nd
ard
err
ors
fo
r th
e c
oe
ffic
ien
t e
stim
ate
s a
re in
pa
ren
the
se
s a
nd
are
clu
ste
red
by f
irm
.
Ma
rke
t C
ap
ita
liza
tio
n
(No
rma
lize
d)
Firm
ch
ara
teristics
are
me
asu
red
at
the
en
do
fth
ep
revio
us
fisca
lye
ar
for
acco
un
tin
gd
ata
fro
mC
om
pu
sta
t.T
he
ma
rke
tva
lue
of
eq
uity
ism
ea
su
red
as
of
De
ce
mb
er
of
the
pre
vio
us
ye
ar
for
the
bo
ok-t
o-
ma
rke
tra
tio
for
eq
uity.
Asse
tg
row
this
the
an
nu
al
gro
wth
rate
of
the
bo
ok
va
lue
of
asse
tsb
etw
ee
nfisca
lye
ars
.S
tock
retu
rnvo
latilit
yis
ca
lcu
late
dfr
om
mo
nth
lyd
ata
inC
RS
Pu
sin
gth
ep
revio
us
36
mo
nth
se
nd
ing
inD
ece
mb
er
of
the
pre
vio
us
ye
ar.
Ma
rke
tca
pita
liza
tio
n(n
orm
aliz
ed
)is
me
asu
red
as
of
De
ce
mb
er
of
the
pre
vio
us
ye
ar,
log
tra
nsfo
rme
d,
an
dsca
led
tob
ed
istr
ibu
ted
with
am
ea
no
fze
ro
an
dsta
nd
ard
de
via
tio
no
fo
ne
for
ea
ch
ye
ar.
Re
turn
on
asse
tsis
op
era
tin
gin
co
me
div
ide
db
yla
gg
ed
asse
ts.
Fre
eca
sh
flo
wis
the
qu
an
tity
op
era
tin
gin
co
me
min
us
inte
rest
an
dta
xe
sd
ivid
ed
by
lag
ge
d
asse
ts.
Inve
stm
en
t is
ca
pita
l e
xp
en
ditu
res d
ivid
ed
by la
gg
ed
asse
ts.
De
pre
cia
tio
n is s
ca
led
by la
gg
ed
asse
ts.