the cross-channel conversation
TRANSCRIPT
The Cross-Channel Conversation
2015 3
Monetate Ecommerce Quarterly Report
Table of Contents
1 About the EQ
2 The Cross-Channel Conversation
3 Add-to-Cart Rate
4 Bounce Rate
5 Conversion Rate
7 A Spotlight on The UK
9 Optimizing Channel Performances Across Devices
10 Benchmark Reports
21 About Monetate
2015 3
About the EQAs ecommerce companies look for ways to increase customer engagement and sales in a highly competitive online environment, they’re faced with challenges centered on massive amounts of data. This big data conundrum goes beyond the collection and storage of information about customers and prospects.
Using a combination of historical and real-time data allows ecommerce marketers to glean meaningful insights that result in more relevant shopping experiences that drive loyal customers who share their experiences with others. Ecommerce businesses that tackle big data head-on focus their attention on different customer segments that continue to be explored in every release of the Ecommerce Quarterly (EQ):
• Predefined: New versus returning; referring traffic sources; technographics; geography.
• Custom or Proprietary: Demographics; proximity to location; offline and CRM data.
• On-Site Behavior: Shopping cart activity; brand or category affinity.
• Behaviors Across the Web: Browsing and purchase patterns demonstrated on third-party websites.
The EQ also includes takeaways, ideas and best practices used by leading ecommerce websites, based on insights gained from the more than seven billion online shopping sessions that contribute to the analysis and benchmark reports found in every release.
2015 3
2 | Ecommerce Quarterly Report - Q3 2015
The Cross-Channel Conversation
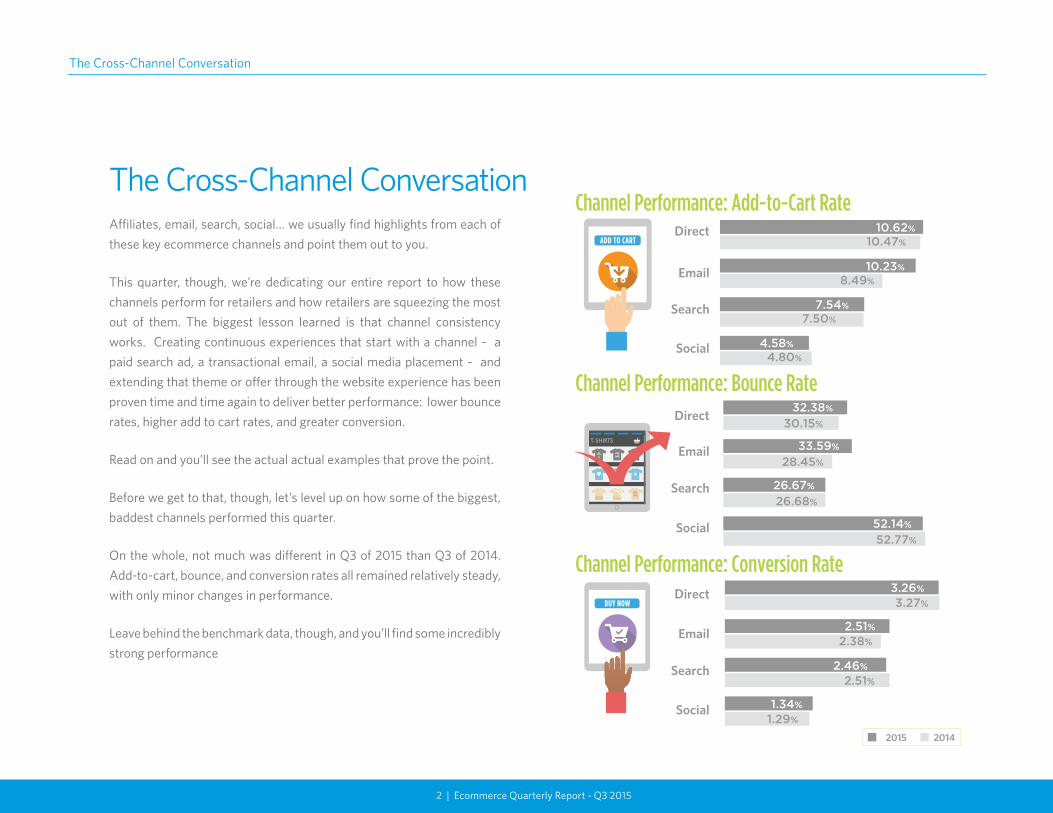
The Cross-Channel ConversationAffiliates, email, search, social… we usually find highlights from each of these key ecommerce channels and point them out to you.
This quarter, though, we’re dedicating our entire report to how these channels perform for retailers and how retailers are squeezing the most out of them. The biggest lesson learned is that channel consistency works. Creating continuous experiences that start with a channel - a paid search ad, a transactional email, a social media placement - and extending that theme or offer through the website experience has been proven time and time again to deliver better performance: lower bounce rates, higher add to cart rates, and greater conversion.
Read on and you’ll see the actual actual examples that prove the point.
Before we get to that, though, let’s level up on how some of the biggest, baddest channels performed this quarter.
On the whole, not much was different in Q3 of 2015 than Q3 of 2014. Add-to-cart, bounce, and conversion rates all remained relatively steady, with only minor changes in performance.
Leave behind the benchmark data, though, and you’ll find some incredibly strong performance
ADD TO CART
Channel Performance: Add-to-Cart RateDirect
Search
Social
10.62%
10.23%
7.54%
4.58%
10.47%
8.49%
7.50%
4.80%
Channel Performance: Bounce RateDirect
Search
Social
32.38%
33.59%
26.67%
52.14%
30.15%
28.45%
26.68%
52.77%
Channel Performance: Conversion Rate
BUY NOWDirect
Search
Social
3.26%
2.51%
2.46%
1.34%
3.27%
2.38%
2.51%
1.29%
2015 2014
3 | Ecommerce Quarterly Report - Q3 2015
Add-to-Cart RateIf you were to plot global add-to-cart rates by quarter since Q3 2014, you’d have a bit of a choppy sea. Up, down. Up, down. And that’s where we are now.
The movement hasn’t been much—a couple percentage points here, then a couple more back in the other direction—so it’s fairly predictable. There has been one exception, though: email.
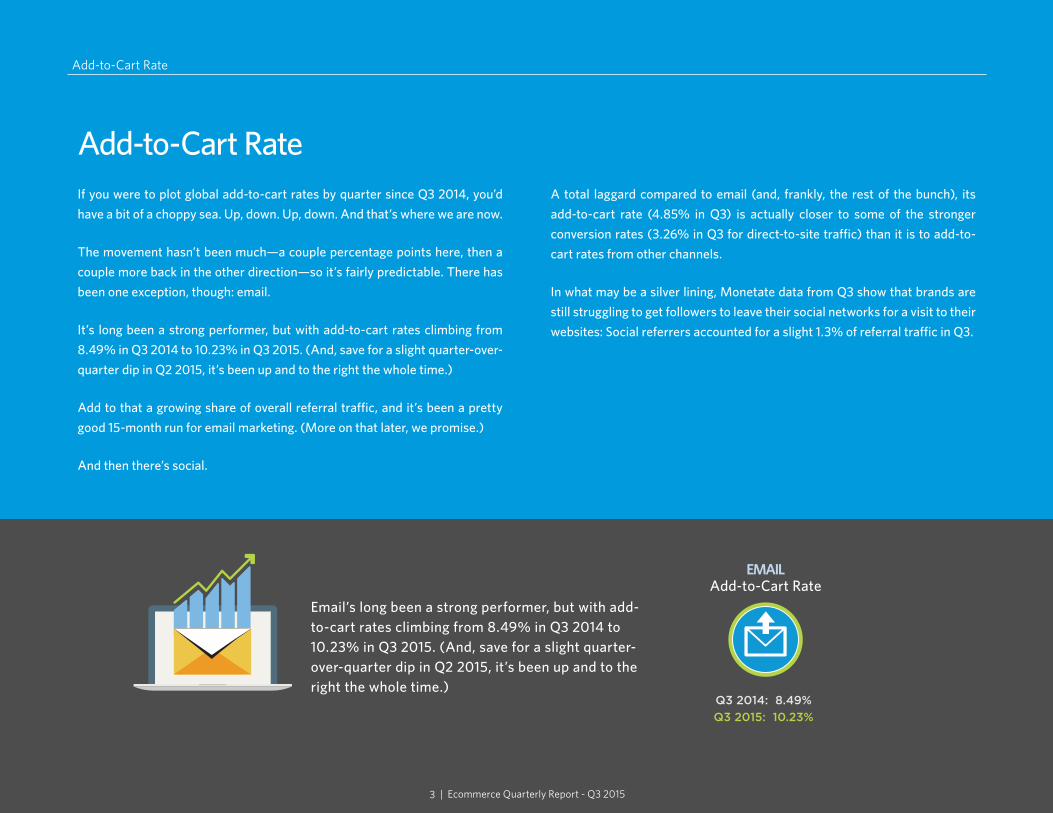
It’s long been a strong performer, but with add-to-cart rates climbing from 8.49% in Q3 2014 to 10.23% in Q3 2015. (And, save for a slight quarter-over-quarter dip in Q2 2015, it’s been up and to the right the whole time.)
Add to that a growing share of overall referral traffic, and it’s been a pretty good 15-month run for email marketing. (More on that later, we promise.)
And then there’s social.
A total laggard compared to email (and, frankly, the rest of the bunch), its add-to-cart rate (4.85% in Q3) is actually closer to some of the stronger conversion rates (3.26% in Q3 for direct-to-site traffic) than it is to add-to-cart rates from other channels.
In what may be a silver lining, Monetate data from Q3 show that brands are still struggling to get followers to leave their social networks for a visit to their websites: Social referrers accounted for a slight 1.3% of referral traffic in Q3.
Add-to-Cart Rate
Email’s long been a strong performer, but with add-to-cart rates climbing from 8.49% in Q3 2014 to 10.23% in Q3 2015. (And, save for a slight quarter-over-quarter dip in Q2 2015, it’s been up and to the right the whole time.)39%
in Q3 2015
SMARTPHONEBounce Rate
29%in Q3 2015
TABLETBounce Rate
28%
DESKTOPBounce Rate
in Q3 2015
Q3 2014: 8.49% Q3 2015: 10.23%
EMAILAdd-to-Cart Rate
SOCIALCart Abandon Rate
73%in Q3 2015
EMAILCart Abandon Rate
76%in Q3 2015
SEARCHCart Abandon Rate
68%in Q3 2015
DIRECT-TO-SITE Cart Abandon Rate
69%in Q3 2015
A C
LOSER LOO
K
4 | Ecommerce Quarterly Report - Q3 2015
Bounce RateIn what seems to be a trend now, global bounce rate has regressed year-over-year from 29% to 31%.
You might think that such a slide is attributable to the growth in mobile traffic, which—as of Q3 2015—now accounts for 25% of all ecommerce traffic. You’d be right.
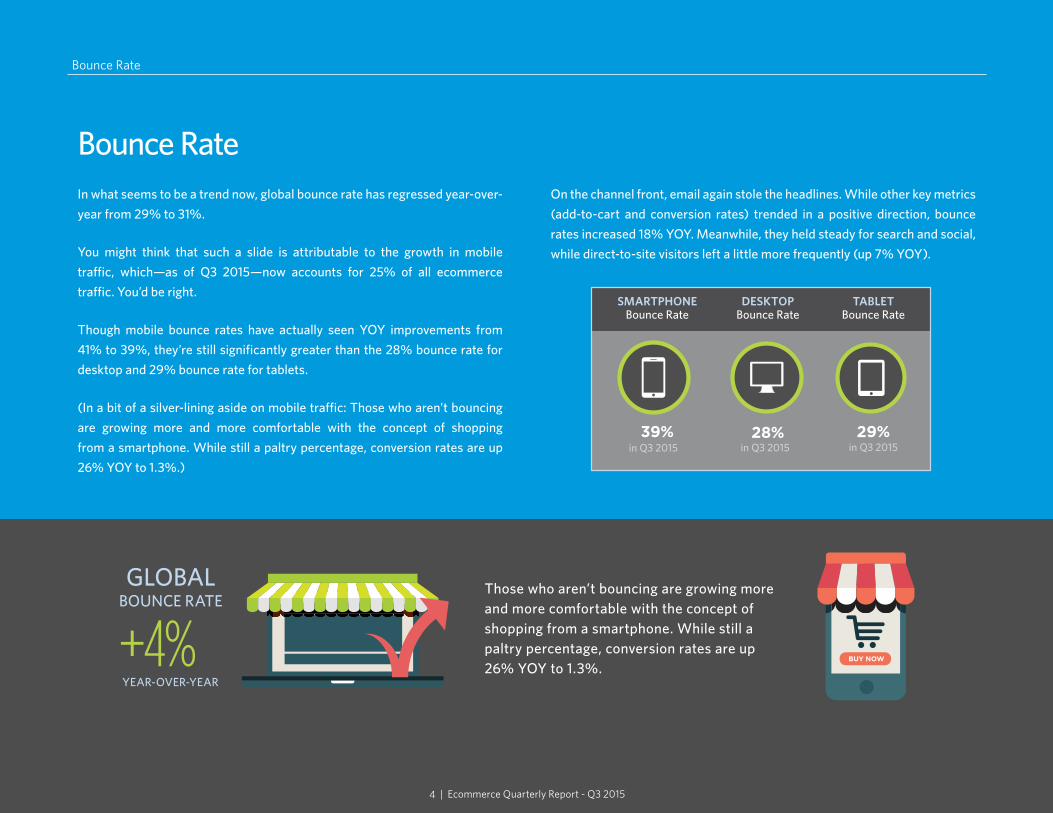
Though mobile bounce rates have actually seen YOY improvements from 41% to 39%, they’re still significantly greater than the 28% bounce rate for desktop and 29% bounce rate for tablets.
(In a bit of a silver-lining aside on mobile traffic: Those who aren’t bouncing are growing more and more comfortable with the concept of shopping from a smartphone. While still a paltry percentage, conversion rates are up 26% YOY to 1.3%.)
On the channel front, email again stole the headlines. While other key metrics (add-to-cart and conversion rates) trended in a positive direction, bounce rates increased 18% YOY. Meanwhile, they held steady for search and social, while direct-to-site visitors left a little more frequently (up 7% YOY).
Bounce Rate
+4%GLOBAL
BOUNCE RATE
YEAR-OVER-YEAR
Those who aren’t bouncing are growing more and more comfortable with the concept of shopping from a smartphone. While still a paltry percentage, conversion rates are up 26% YOY to 1.3%.
39%in Q3 2015
SMARTPHONEBounce Rate
29%in Q3 2015
TABLETBounce Rate
28%
DESKTOPBounce Rate
in Q3 2015
Q3 2014: 8.49% Q3 2015: 10.23%
EMAILAdd-to-Cart Rate
SOCIALCart Abandon Rate
73%in Q3 2015
EMAILCart Abandon Rate
76%in Q3 2015
SEARCHCart Abandon Rate
68%in Q3 2015
DIRECT-TO-SITE Cart Abandon Rate
69%in Q3 2015
A C
LOSER LOO
K
5 | Ecommerce Quarterly Report - Q3 2015
39%in Q3 2015
SMARTPHONEBounce Rate
29%in Q3 2015
TABLETBounce Rate
28%
DESKTOPBounce Rate
in Q3 2015
Q3 2014: 8.49% Q3 2015: 10.23%
EMAILAdd-to-Cart Rate
SOCIALCart Abandon Rate
73%in Q3 2015
EMAILCart Abandon Rate
76%in Q3 2015
SEARCHCart Abandon Rate
68%in Q3 2015
DIRECT-TO-SITE Cart Abandon Rate
69%in Q3 2015
A C
LOSER LOO
K
Conversion RateThough the reputation for social traffic has gotten a bit beat up during this EQ, we will give credit where credit is due. And, perhaps surprisingly, conversion performance is where it really deserves a polite round of applause.
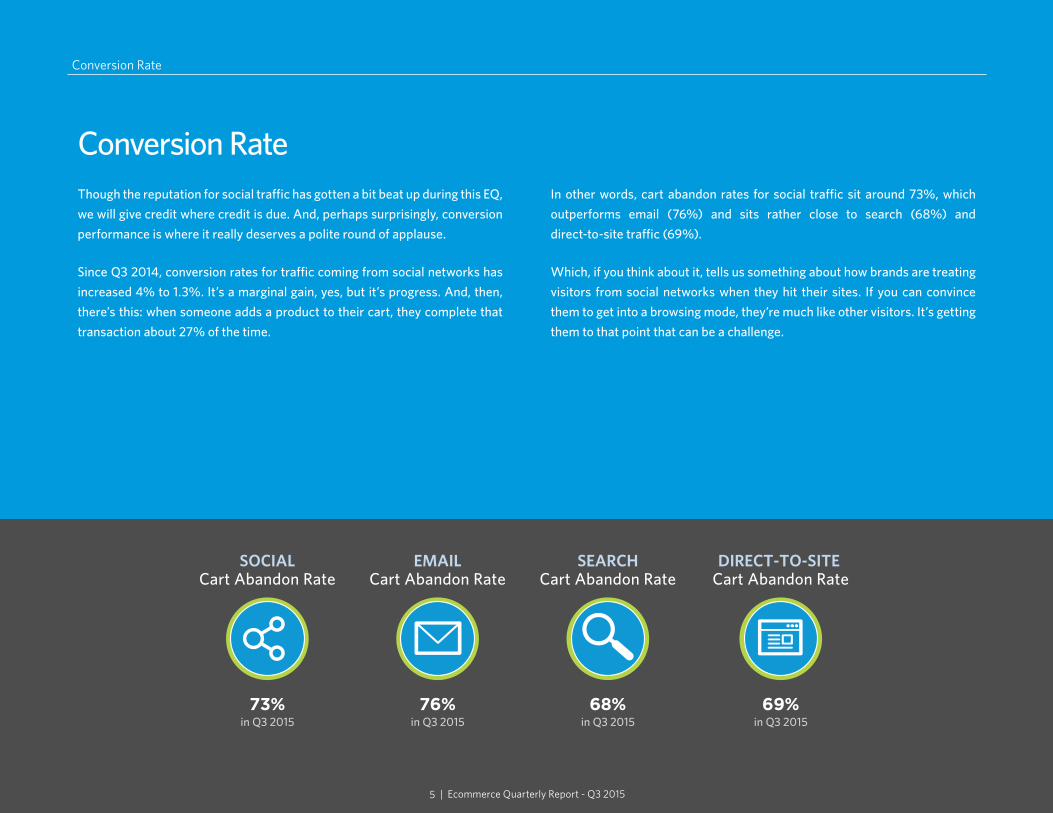
Since Q3 2014, conversion rates for traffic coming from social networks has increased 4% to 1.3%. It’s a marginal gain, yes, but it’s progress. And, then, there’s this: when someone adds a product to their cart, they complete that transaction about 27% of the time.
In other words, cart abandon rates for social traffic sit around 73%, which outperforms email (76%) and sits rather close to search (68%) and direct-to-site traffic (69%).
Which, if you think about it, tells us something about how brands are treating visitors from social networks when they hit their sites. If you can convince them to get into a browsing mode, they’re much like other visitors. It’s getting them to that point that can be a challenge.
Conversion Rate
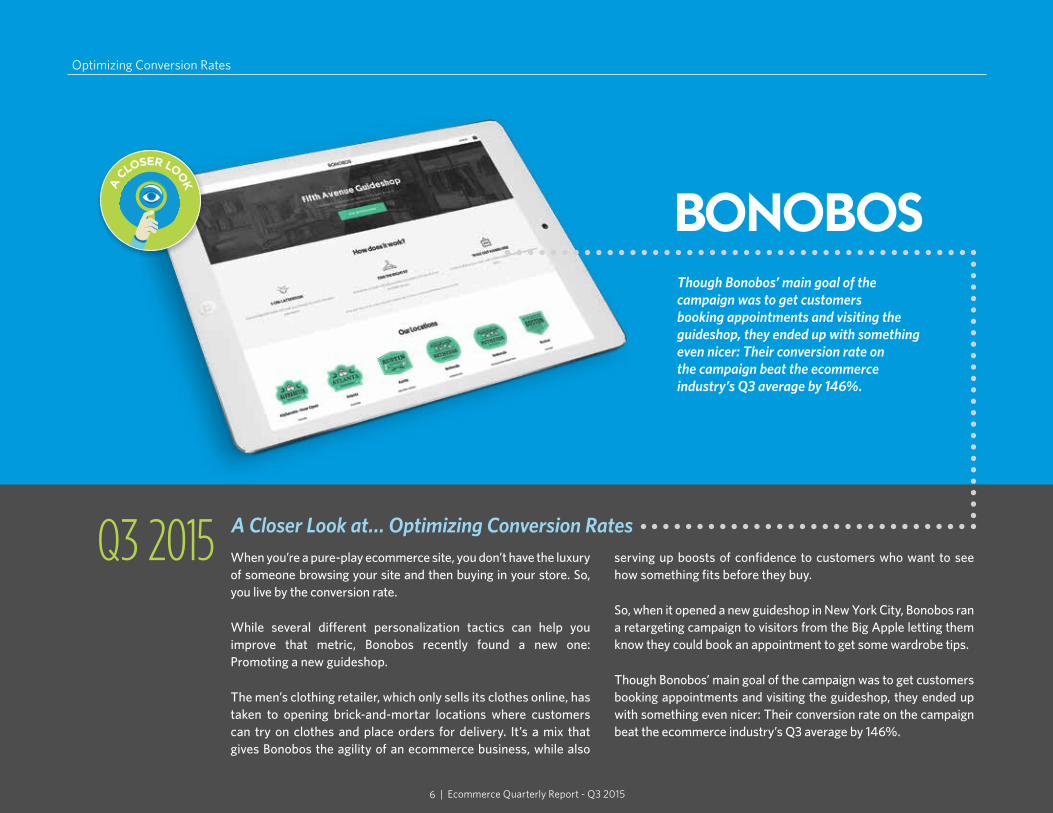
Though Bonobos’ main goal of the campaign was to get customers booking appointments and visiting the guideshop, they ended up with something even nicer: Their conversion rate on the campaign beat the ecommerce industry’s Q3 average by 146%.
6 | Ecommerce Quarterly Report - Q3 2015
Q3 2015 When you’re a pure-play ecommerce site, you don’t have the luxury of someone browsing your site and then buying in your store. So, you live by the conversion rate.
While several different personalization tactics can help you improve that metric, Bonobos recently found a new one: Promoting a new guideshop.
The men’s clothing retailer, which only sells its clothes online, has taken to opening brick-and-mortar locations where customers can try on clothes and place orders for delivery. It’s a mix that gives Bonobos the agility of an ecommerce business, while also
serving up boosts of confidence to customers who want to see how something fits before they buy.
So, when it opened a new guideshop in New York City, Bonobos ran a retargeting campaign to visitors from the Big Apple letting them know they could book an appointment to get some wardrobe tips.
Though Bonobos’ main goal of the campaign was to get customers booking appointments and visiting the guideshop, they ended up with something even nicer: Their conversion rate on the campaign beat the ecommerce industry’s Q3 average by 146%.
Optimizing Conversion Rates
A Closer Look at… Optimizing Conversion Rates
39%in Q3 2015
SMARTPHONEBounce Rate
29%in Q3 2015
TABLETBounce Rate
28%
DESKTOPBounce Rate
in Q3 2015
Q3 2014: 8.49% Q3 2015: 10.23%
EMAILAdd-to-Cart Rate
SOCIALCart Abandon Rate
73%in Q3 2015
EMAILCart Abandon Rate
76%in Q3 2015
SEARCHCart Abandon Rate
68%in Q3 2015
DIRECT-TO-SITE Cart Abandon Rate
69%in Q3 2015
A C
LOSER LOO
K
UK Spotlight
7 | Ecommerce Quarterly Report - Q3 2015
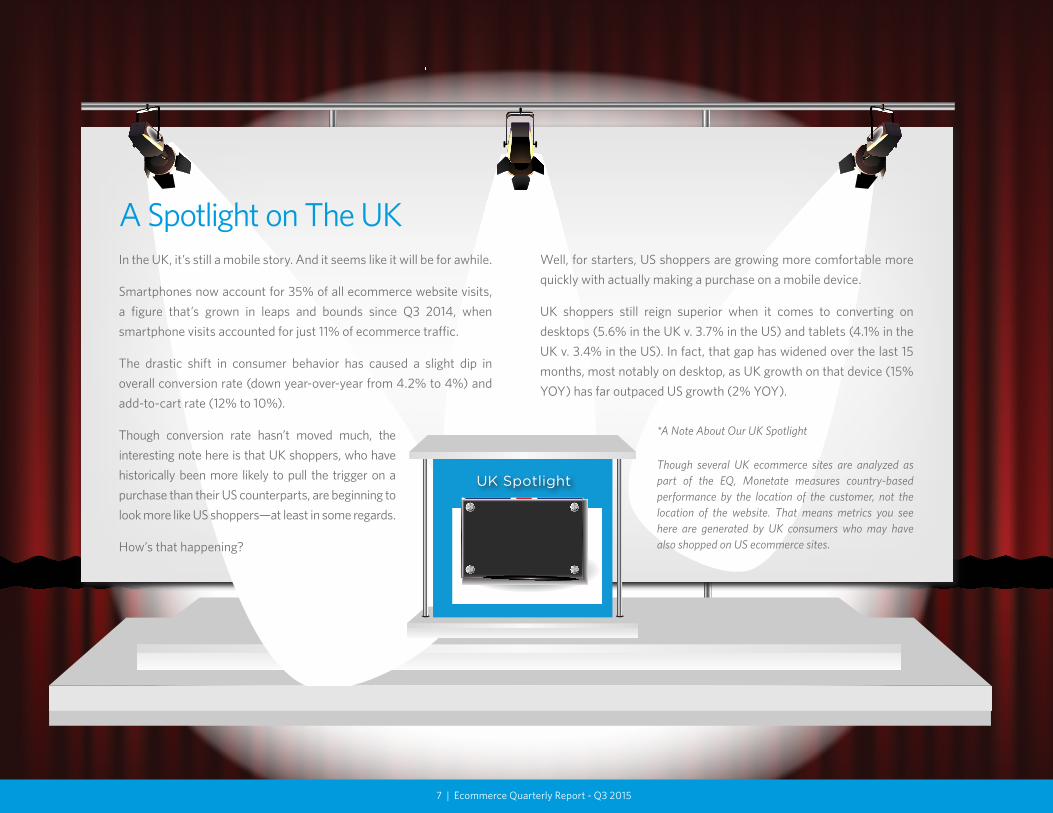
A Spotlight on The UKIn the UK, it’s still a mobile story. And it seems like it will be for awhile.
Smartphones now account for 35% of all ecommerce website visits, a figure that’s grown in leaps and bounds since Q3 2014, when smartphone visits accounted for just 11% of ecommerce traffic.
The drastic shift in consumer behavior has caused a slight dip in overall conversion rate (down year-over-year from 4.2% to 4%) and add-to-cart rate (12% to 10%).
Though conversion rate hasn’t moved much, the interesting note here is that UK shoppers, who have historically been more likely to pull the trigger on a purchase than their US counterparts, are beginning to look more like US shoppers—at least in some regards.
How’s that happening?
Well, for starters, US shoppers are growing more comfortable more quickly with actually making a purchase on a mobile device.
UK shoppers still reign superior when it comes to converting on desktops (5.6% in the UK v. 3.7% in the US) and tablets (4.1% in the UK v. 3.4% in the US). In fact, that gap has widened over the last 15 months, most notably on desktop, as UK growth on that device (15% YOY) has far outpaced US growth (2% YOY).
*A Note About Our UK Spotlight
Though several UK ecommerce sites are analyzed as part of the EQ, Monetate measures country-based performance by the location of the customer, not the location of the website. That means metrics you see here are generated by UK consumers who may have also shopped on US ecommerce sites.
8 | Ecommerce Quarterly Report - Q3 2015
Q3 2015
A Spotlight on The UK
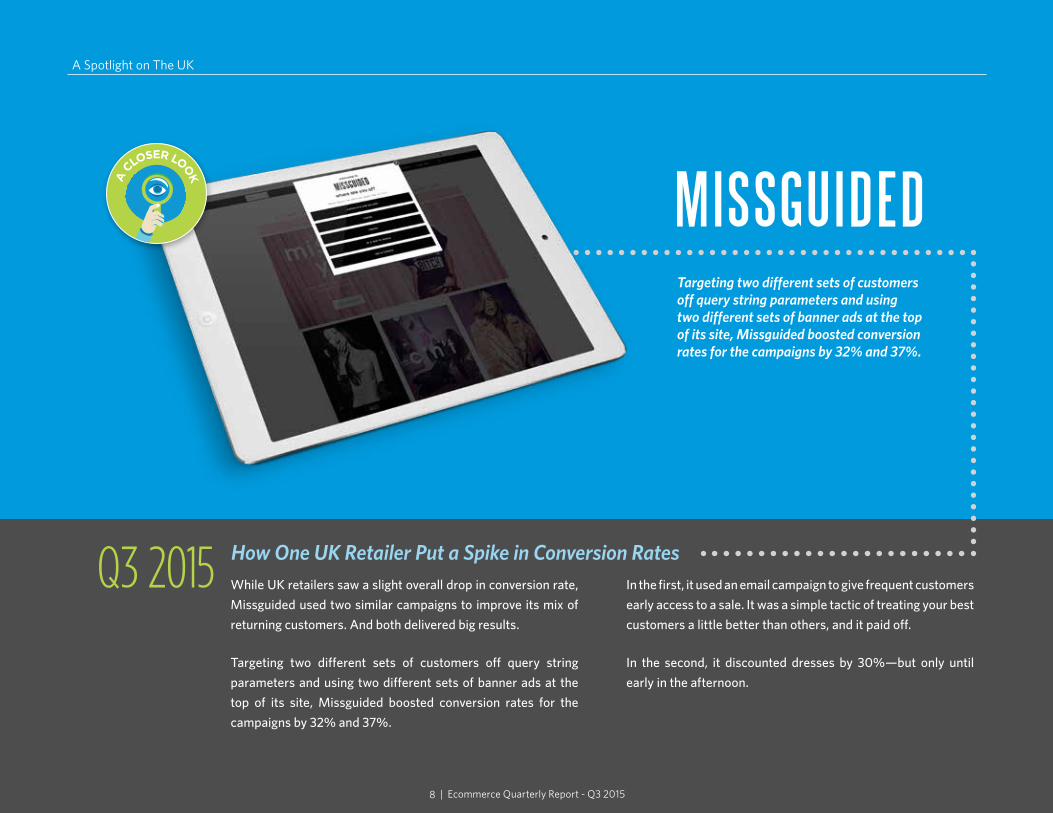
Targeting two different sets of customers off query string parameters and using two different sets of banner ads at the top of its site, Missguided boosted conversion rates for the campaigns by 32% and 37%.
How One UK Retailer Put a Spike in Conversion RatesWhile UK retailers saw a slight overall drop in conversion rate, Missguided used two similar campaigns to improve its mix of returning customers. And both delivered big results.
Targeting two different sets of customers off query string parameters and using two different sets of banner ads at the top of its site, Missguided boosted conversion rates for the campaigns by 32% and 37%.
In the first, it used an email campaign to give frequent customers early access to a sale. It was a simple tactic of treating your best customers a little better than others, and it paid off.
In the second, it discounted dresses by 30%—but only until early in the afternoon.
39%in Q3 2015
SMARTPHONEBounce Rate
29%in Q3 2015
TABLETBounce Rate
28%
DESKTOPBounce Rate
in Q3 2015
Q3 2014: 8.49% Q3 2015: 10.23%
EMAILAdd-to-Cart Rate
SOCIALCart Abandon Rate
73%in Q3 2015
EMAILCart Abandon Rate
76%in Q3 2015
SEARCHCart Abandon Rate
68%in Q3 2015
DIRECT-TO-SITE Cart Abandon Rate
69%in Q3 2015
A C
LOSER LOO
K

Matches Made In Ecommerce Heaven:Optimizing Channel Performances Across Devices
As you’ve probably noticed in reading this EQ, each channel has its strong suits. But one thing we haven’t touched on is how each of those channels performs on various devices. We thought we’d take a look at that here.
We analyzed channel performance across devices, looking at things like bounce rate, add-to-cart rate, conversion rate and AOV to determine which channels on which devices perform the best … and where they can be improved.
So, without further ado, here are the pairings you should be looking to optimize:
What MakesThis Combo Rock:
What’s HoldingThis Combo Back:
Quick Take:
Bounce rate could be improved here, but the real culprit that’s holding the email + tablet combo back is a little more basic: tra�c. You can’t really change that, so focus on driving relevant emails and relevant landing page experiences. It’ll help your tablet performance (and everything else, too, for that matter).
31.6%Bounce Rate
12.8%Add-to-Cart
Rate
2.5%Conversion
Rate
$109.20AOV
What MakesThis Combo Rock:
What’s HoldingThis Combo Back:
Quick Take:
It’s no surprise that direct-to-site visitors perform so well on desktop (they perform pretty darn well everywhere), but this combo is where those visitors are at their best. Since these visitors are more likely to be return visitors (or a�liate referrals), focus on personalizing their experiences based on the data you already have about them.
4%Conversion
Rate
$124.30AOV
12.3%Add-to-Cart
Rate
Err… nothing really.
9%Conversion
Rate
What MakesThis Combo Rock:
What’s HoldingThis Combo Back:
Quick Take:
You might take a look at the conversion rate and say, “meh.” Don’t. The search-mobile combination is exploding. Tra�c is up 58% year-over-year and key metrics—like bounce rate, add-to-cart rate and conversion rate—have all seen significant improvements over the same time period. The only downside? A sliding AOV, which dropped from $95.61 in Q3 2014 to $80.04 in Q3 2015. Use smart product recommendations to improve that.
$80.04AOV
↑58%
Traffic GrowthYOY
SEARCH + MOBILEEMAIL + TABLETDIRECT-TO-SITE + DESKTOP
www
Optimizing Channel Performances Across Devices
10 | Ecommerce Quarterly Report - Q3 2015
Benchmarks
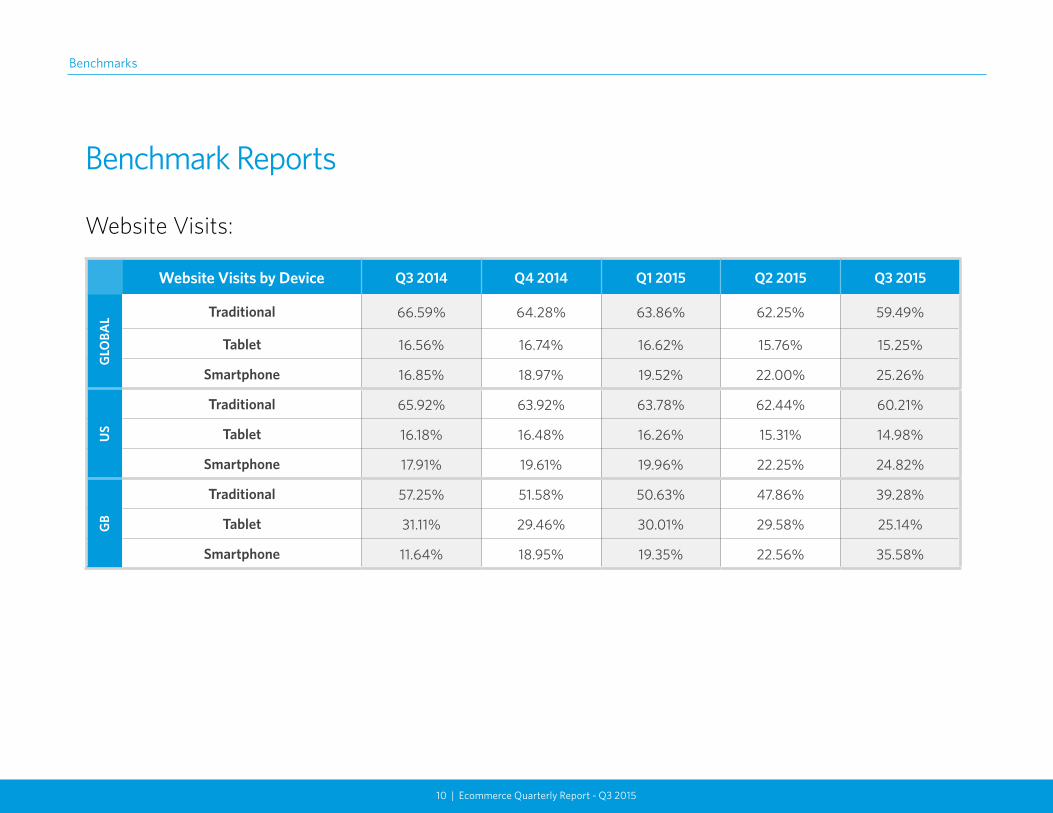
Website Visits by Device Q3 2014 Q4 2014 Q1 2015 Q2 2015 Q3 2015
GLO
BAL Traditional 66.59% 64.28% 63.86% 62.25% 59.49%
Tablet 16.56% 16.74% 16.62% 15.76% 15.25%
Smartphone 16.85% 18.97% 19.52% 22.00% 25.26%
US
Traditional 65.92% 63.92% 63.78% 62.44% 60.21%
Tablet 16.18% 16.48% 16.26% 15.31% 14.98%
Smartphone 17.91% 19.61% 19.96% 22.25% 24.82%
GB
Traditional 57.25% 51.58% 50.63% 47.86% 39.28%
Tablet 31.11% 29.46% 30.01% 29.58% 25.14%
Smartphone 11.64% 18.95% 19.35% 22.56% 35.58%
Website Visits:
Benchmark Reports
11 | Ecommerce Quarterly Report - Q3 2015
Benchmarks
Website Visits:
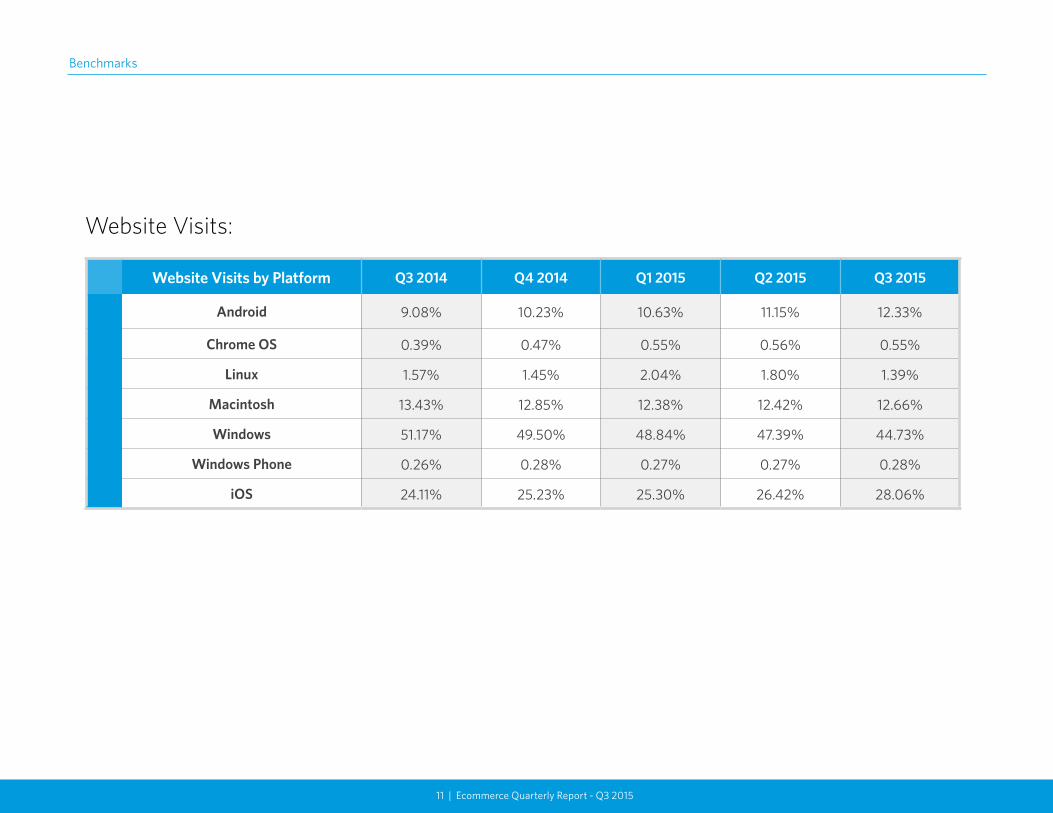
Website Visits by Platform Q3 2014 Q4 2014 Q1 2015 Q2 2015 Q3 2015
Android 9.08% 10.23% 10.63% 11.15% 12.33%
Chrome OS 0.39% 0.47% 0.55% 0.56% 0.55%
Linux 1.57% 1.45% 2.04% 1.80% 1.39%
Macintosh 13.43% 12.85% 12.38% 12.42% 12.66%
Windows 51.17% 49.50% 48.84% 47.39% 44.73%
Windows Phone 0.26% 0.28% 0.27% 0.27% 0.28%
iOS 24.11% 25.23% 25.30% 26.42% 28.06%
12 | Ecommerce Quarterly Report - Q3 2015
Benchmarks
GB
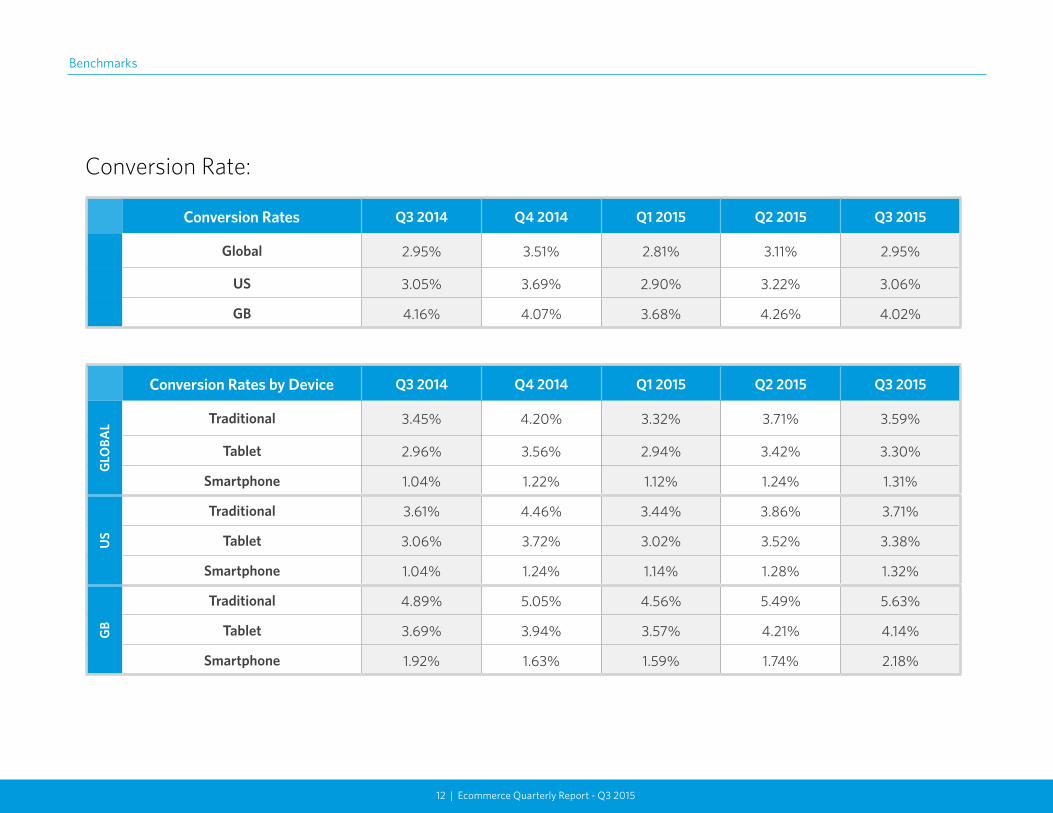
Conversion Rates Q3 2014 Q4 2014 Q1 2015 Q2 2015 Q3 2015
Global 2.95% 3.51% 2.81% 3.11% 2.95%
US 3.05% 3.69% 2.90% 3.22% 3.06%
GB 4.16% 4.07% 3.68% 4.26% 4.02%
Conversion Rates by Device Q3 2014 Q4 2014 Q1 2015 Q2 2015 Q3 2015
GLO
BAL Traditional 3.45% 4.20% 3.32% 3.71% 3.59%
Tablet 2.96% 3.56% 2.94% 3.42% 3.30%
Smartphone 1.04% 1.22% 1.12% 1.24% 1.31%
US
Traditional 3.61% 4.46% 3.44% 3.86% 3.71%
Tablet 3.06% 3.72% 3.02% 3.52% 3.38%
Smartphone 1.04% 1.24% 1.14% 1.28% 1.32%
GB
Traditional 4.89% 5.05% 4.56% 5.49% 5.63%
Tablet 3.69% 3.94% 3.57% 4.21% 4.14%
Smartphone 1.92% 1.63% 1.59% 1.74% 2.18%
Conversion Rate:
13 | Ecommerce Quarterly Report - Q3 2015
Benchmarks
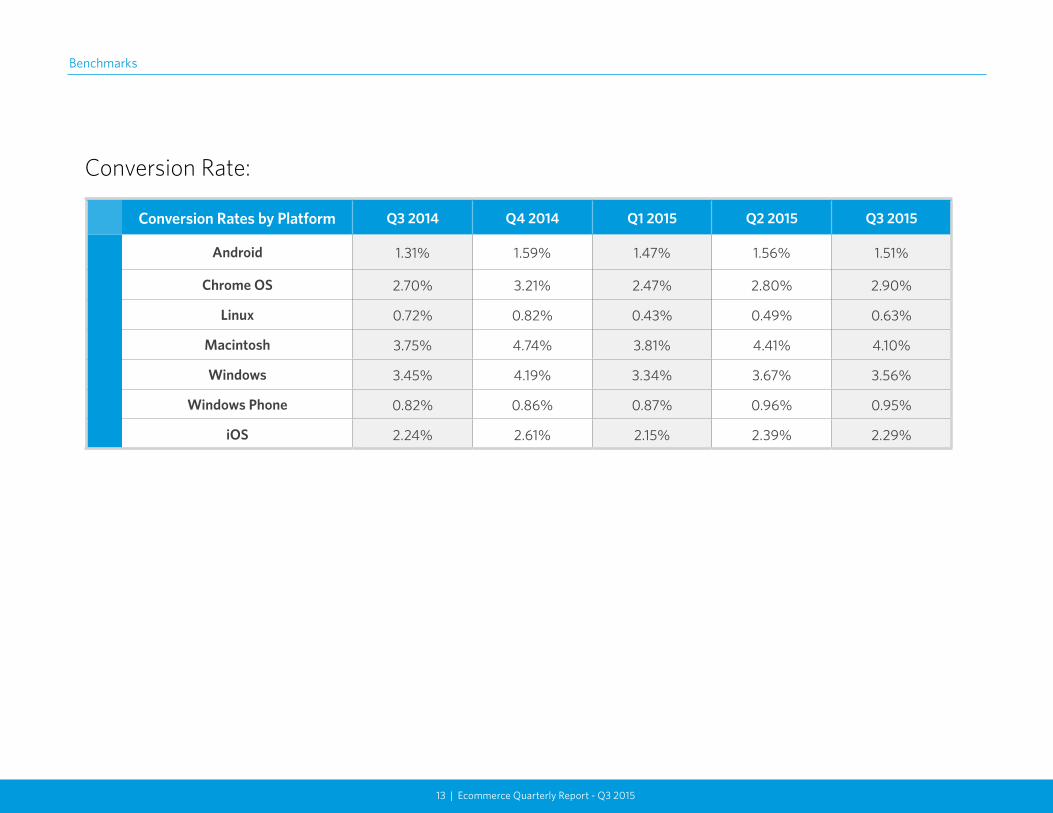
Conversion Rate:
Conversion Rates by Platform Q3 2014 Q4 2014 Q1 2015 Q2 2015 Q3 2015
Android 1.31% 1.59% 1.47% 1.56% 1.51%
Chrome OS 2.70% 3.21% 2.47% 2.80% 2.90%
Linux 0.72% 0.82% 0.43% 0.49% 0.63%
Macintosh 3.75% 4.74% 3.81% 4.41% 4.10%
Windows 3.45% 4.19% 3.34% 3.67% 3.56%
Windows Phone 0.82% 0.86% 0.87% 0.96% 0.95%
iOS 2.24% 2.61% 2.15% 2.39% 2.29%
14 | Ecommerce Quarterly Report - Q3 2015
Benchmarks
GB
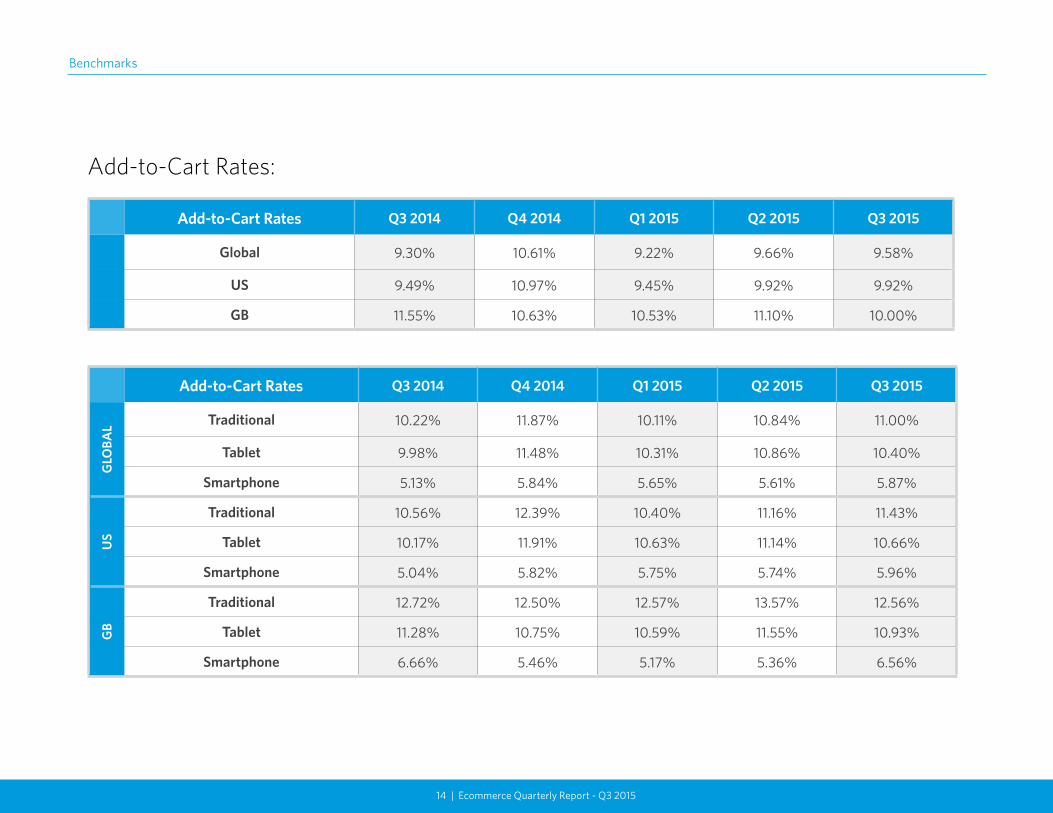
Add-to-Cart Rates Q3 2014 Q4 2014 Q1 2015 Q2 2015 Q3 2015
Global 9.30% 10.61% 9.22% 9.66% 9.58%
US 9.49% 10.97% 9.45% 9.92% 9.92%
GB 11.55% 10.63% 10.53% 11.10% 10.00%
Add-to-Cart Rates Q3 2014 Q4 2014 Q1 2015 Q2 2015 Q3 2015
GLO
BAL Traditional 10.22% 11.87% 10.11% 10.84% 11.00%
Tablet 9.98% 11.48% 10.31% 10.86% 10.40%
Smartphone 5.13% 5.84% 5.65% 5.61% 5.87%
US
Traditional 10.56% 12.39% 10.40% 11.16% 11.43%
Tablet 10.17% 11.91% 10.63% 11.14% 10.66%
Smartphone 5.04% 5.82% 5.75% 5.74% 5.96%
GB
Traditional 12.72% 12.50% 12.57% 13.57% 12.56%
Tablet 11.28% 10.75% 10.59% 11.55% 10.93%
Smartphone 6.66% 5.46% 5.17% 5.36% 6.56%
Add-to-Cart Rates:
15 | Ecommerce Quarterly Report - Q3 2015
Benchmarks
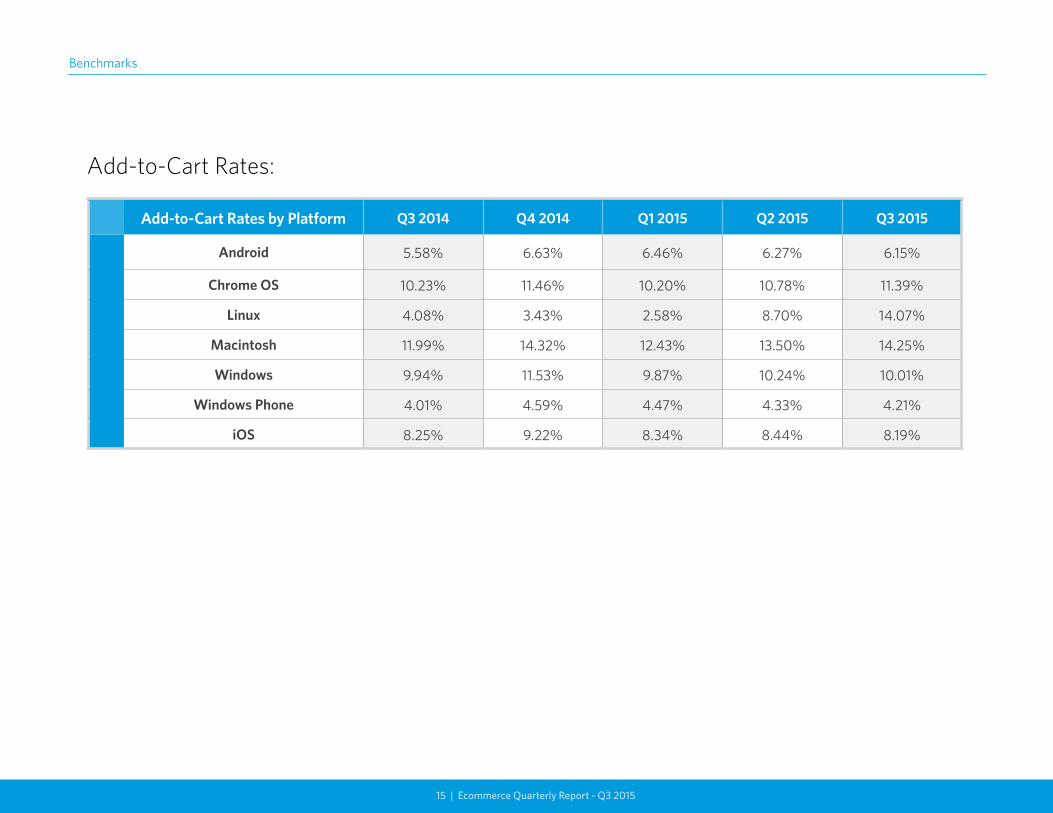
Add-to-Cart Rates:
Add-to-Cart Rates by Platform Q3 2014 Q4 2014 Q1 2015 Q2 2015 Q3 2015
Android 5.58% 6.63% 6.46% 6.27% 6.15%
Chrome OS 10.23% 11.46% 10.20% 10.78% 11.39%
Linux 4.08% 3.43% 2.58% 8.70% 14.07%
Macintosh 11.99% 14.32% 12.43% 13.50% 14.25%
Windows 9.94% 11.53% 9.87% 10.24% 10.01%
Windows Phone 4.01% 4.59% 4.47% 4.33% 4.21%
iOS 8.25% 9.22% 8.34% 8.44% 8.19%
16 | Ecommerce Quarterly Report - Q3 2015
Benchmarks
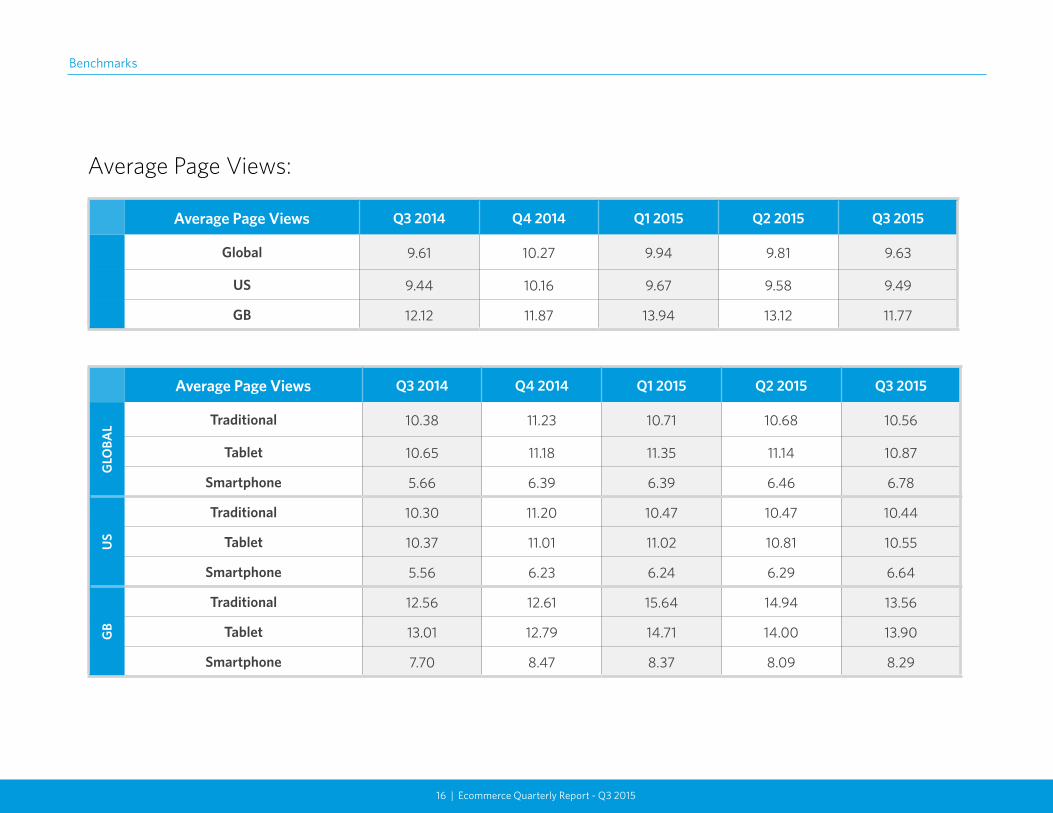
Average Page Views Q3 2014 Q4 2014 Q1 2015 Q2 2015 Q3 2015
Global 9.61 10.27 9.94 9.81 9.63
US 9.44 10.16 9.67 9.58 9.49
GB 12.12 11.87 13.94 13.12 11.77
Average Page Views Q3 2014 Q4 2014 Q1 2015 Q2 2015 Q3 2015
GLO
BAL Traditional 10.38 11.23 10.71 10.68 10.56
Tablet 10.65 11.18 11.35 11.14 10.87
Smartphone 5.66 6.39 6.39 6.46 6.78
US
Traditional 10.30 11.20 10.47 10.47 10.44
Tablet 10.37 11.01 11.02 10.81 10.55
Smartphone 5.56 6.23 6.24 6.29 6.64
GB
Traditional 12.56 12.61 15.64 14.94 13.56
Tablet 13.01 12.79 14.71 14.00 13.90
Smartphone 7.70 8.47 8.37 8.09 8.29
Average Page Views:

17 | Ecommerce Quarterly Report - Q3 2015
Benchmarks
Average Page Views:
Average Page Views Q3 2014 Q4 2014 Q1 2015 Q2 2015 Q3 2015
Android 7.23 8.10 8.22 8.07 7.99
Chrome OS 11.22 11.58 11.74 11.48 11.58
Linux 5.23 5.08 3.95 4.05 4.96
Macintosh 10.90 12.27 12.09 12.14 11.63
Windows 10.43 11.18 10.68 10.57 10.45
Windows Phone 6.03 6.41 6.38 6.34 6.41
iOS 8.47 8.85 8.86 8.56 8.46
18 | Ecommerce Quarterly Report - Q3 2015
Benchmarks
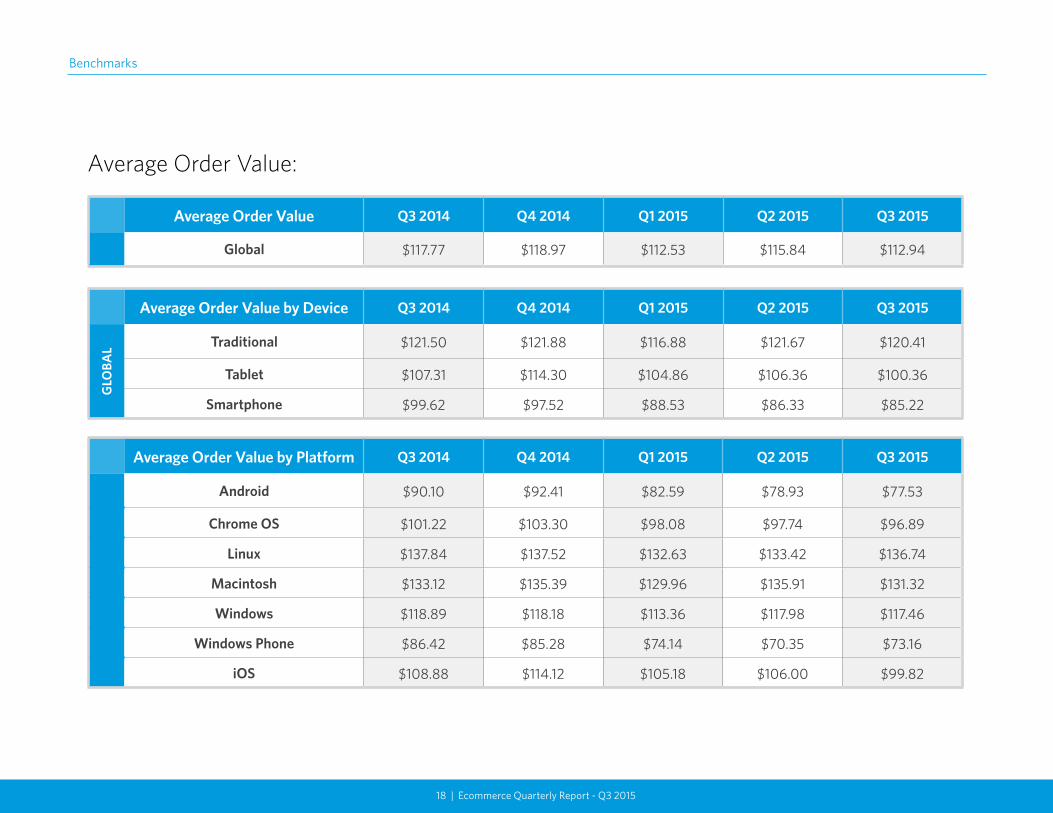
Average Order Value Q3 2014 Q4 2014 Q1 2015 Q2 2015 Q3 2015
Global $117.77 $118.97 $112.53 $115.84 $112.94
Average Order Value by Platform Q3 2014 Q4 2014 Q1 2015 Q2 2015 Q3 2015
Android $90.10 $92.41 $82.59 $78.93 $77.53
Chrome OS $101.22 $103.30 $98.08 $97.74 $96.89
Linux $137.84 $137.52 $132.63 $133.42 $136.74
Macintosh $133.12 $135.39 $129.96 $135.91 $131.32
Windows $118.89 $118.18 $113.36 $117.98 $117.46
Windows Phone $86.42 $85.28 $74.14 $70.35 $73.16
iOS $108.88 $114.12 $105.18 $106.00 $99.82
Average Order Value by Device Q3 2014 Q4 2014 Q1 2015 Q2 2015 Q3 2015
GLO
BAL Traditional $121.50 $121.88 $116.88 $121.67 $120.41
Tablet $107.31 $114.30 $104.86 $106.36 $100.36
Smartphone $99.62 $97.52 $88.53 $86.33 $85.22
Average Order Value:
19 | Ecommerce Quarterly Report - Q3 2015
Benchmarks
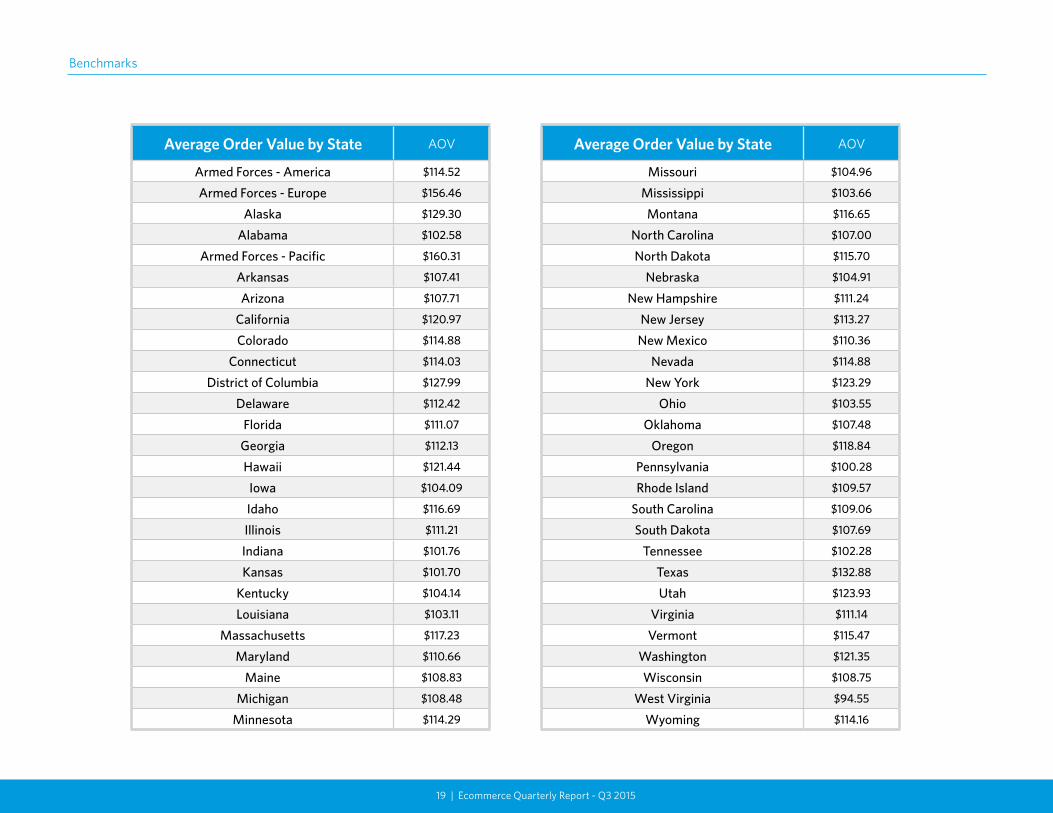
Average Order Value by State AOV
Missouri $104.96
Mississippi $103.66
Montana $116.65
North Carolina $107.00
North Dakota $115.70
Nebraska $104.91
New Hampshire $111.24
New Jersey $113.27
New Mexico $110.36
Nevada $114.88
New York $123.29
Ohio $103.55
Oklahoma $107.48
Oregon $118.84
Pennsylvania $100.28
Rhode Island $109.57
South Carolina $109.06
South Dakota $107.69
Tennessee $102.28
Texas $132.88
Utah $123.93
Virginia $111.14
Vermont $115.47
Washington $121.35
Wisconsin $108.75
West Virginia $94.55
Wyoming $114.16
Average Order Value by State AOV
Armed Forces - America $114.52
Armed Forces - Europe $156.46
Alaska $129.30
Alabama $102.58
Armed Forces - Pacific $160.31
Arkansas $107.41
Arizona $107.71
California $120.97
Colorado $114.88
Connecticut $114.03
District of Columbia $127.99
Delaware $112.42
Florida $111.07
Georgia $112.13
Hawaii $121.44
Iowa $104.09
Idaho $116.69
Illinois $111.21
Indiana $101.76
Kansas $101.70
Kentucky $104.14
Louisiana $103.11
Massachusetts $117.23
Maryland $110.66
Maine $108.83
Michigan $108.48
Minnesota $114.29
20 | Ecommerce Quarterly Report - Q3 2015
Benchmarks: Average Order Value
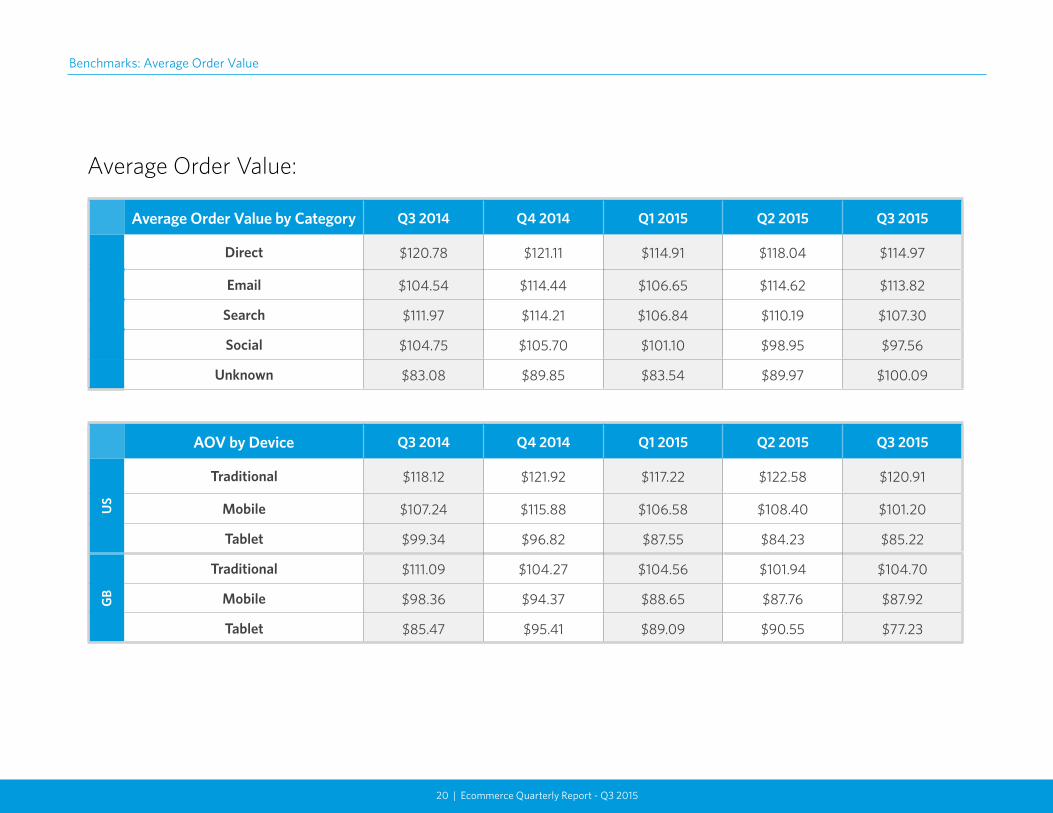
Average Order Value by Category Q3 2014 Q4 2014 Q1 2015 Q2 2015 Q3 2015
Direct $120.78 $121.11 $114.91 $118.04 $114.97
Email $104.54 $114.44 $106.65 $114.62 $113.82
Search $111.97 $114.21 $106.84 $110.19 $107.30
Social $104.75 $105.70 $101.10 $98.95 $97.56
Unknown $83.08 $89.85 $83.54 $89.97 $100.09
AOV by Device Q3 2014 Q4 2014 Q1 2015 Q2 2015 Q3 2015
US
Traditional $118.12 $121.92 $117.22 $122.58 $120.91
Mobile $107.24 $115.88 $106.58 $108.40 $101.20
Tablet $99.34 $96.82 $87.55 $84.23 $85.22
GB
Traditional $111.09 $104.27 $104.56 $101.94 $104.70
Mobile $98.36 $94.37 $88.65 $87.76 $87.92
Tablet $85.47 $95.41 $89.09 $90.55 $77.23
Average Order Value:
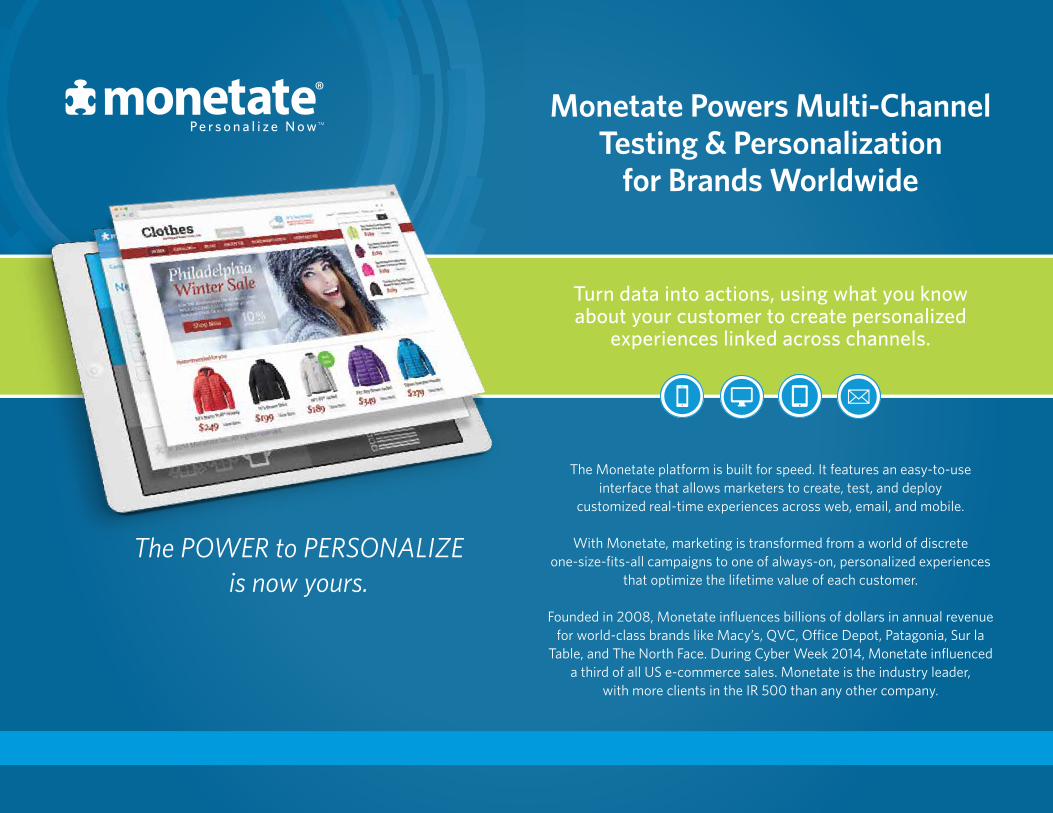
Monetate Powers Multi-ChannelTesting & Personalization
for Brands Worldwide
The POWER to PERSONALIZEis now yours.
The Monetate platform is built for speed. It features an easy-to-useinterface that allows marketers to create, test, and deploy
customized real-time experiences across web, email, and mobile.
With Monetate, marketing is transformed from a world of discrete one-size-fits-all campaigns to one of always-on, personalized experiences
that optimize the lifetime value of each customer.
Founded in 2008, Monetate influences billions of dollars in annual revenue for world-class brands like Macy’s, QVC, O�ce Depot, Patagonia, Sur la
Table, and The North Face. During Cyber Week 2014, Monetate influenced a third of all US e-commerce sales. Monetate is the industry leader,
with more clients in the IR 500 than any other company.
P e r s o n a l i z e N o w TM
Turn data into actions, using what you know about your customer to create personalized
experiences linked across channels.
Expert Personalization ResourcesValuable case studies, eBooks, white papers, webinars & infographics monetate.com/resources
Request a DemoCall 0800 014 8282 (EMEA) | 877-MONETATE (US) | 484-323-6313 (everywhere else) demo.monetate.com
©2015 Monetate Inc. All Rights Reserved.
US Sales & ServiceCall 877-MONETATE (US)
EMEA Sales & Service0800 014 8282
monetate.com monetate.com/twitter monetate.com/linkedinmonetate.com/facebook