the crisis of microrayon - arc1.uniroma1.it · housing of "academichesky" is divided ......
TRANSCRIPT

THE CRISIS OF MICRORAYON The Problem of the Quality of the living Environment of Russian residential Development
in the last Decade (2007-2017) Second volume
CASE STUDY
Dottoranda: Alfiia Gibadulina, XXIX ciclo Curriculum: Architettura – Teorie e Progetto Supervisore: Prof. Filippo Lambertucci Corso di Dottorato in Architettura – Teorie e Progetto Coordinatore: Prof. Antonino Saggio
2018


Dottoranda: Alfiia Gibadulina, XXIX ciclo Curriculum: Architettura – Teorie e Progetto Supervisore: Prof. Filippo Lambertucci Corso di Dottorato in Architettura – Teorie e Progetto Coordinatore: Prof. Antonino Saggio COLLEGIO DOCENTI Antonino Saggio Maurizio Bradaschia Orazio Carpenzano Alessandra Criconia Fabrizio De Cesaris Paola Veronica Dell’Aira Gianluca Frediani Cherubino Gambardella Anna Giovannelli Andrea Grimaldi Antonella Greco Paola Gregory Filippo Lambertucci Renzo Lecardane Domizia Mandolesi Renato Partenope Piero Ostilio Rossi Simona Salvo Zeila Tesoriere Nicoletta Trasi Graziano Maria Valenti Nilda Maria Valentin
MEMBRI ESTERNI Lucio Altarelli Lucio Barbera Luciano De Licio Marcello Pazzaglini Franco Purini Antonella Romano Guendalina Salimei Roberto Secchi
February 22, 2018

CONTENTS
1. ACADEMICHESKIY.EKATERINBURG ...................................................................................................... 5
2. MICROGOROD V LESU. MOSCOW REGION ........................................................................................ 35
3. BALTIYSKAYA ZHEMCHUZHINA. SAINT PETERSBURG ....................................................................... 65
4. SLAVYANKA. SAINT PETERSBURG ...................................................................................................... 91
5. SEVRERNAYA DOLINA. SAINT PETERSBURG .................................................................................... 119
LIST OF REFERENCES ................................................................................................................................. 147

1. ACADEMICHESKIY.EKATERINBURG

ACADEMICHESKIY.EKATERINBURG

CASE STUDY 7
ACADEMICHESKIY
district introduction Ekaterinburg location
design 2005-2025 construction 2007-2026
terms of realization
The preliminary project Valode & Pistre (France) The executive project ZAO "Ekaterinburggorproekt" (Russia) MBI "Masterskaya Genplana" (Russia)
project group
"KORTROS" (until 2013 was called "Renova Stroy Group")
promoters and developers
Land area: 1300 ha Population: 325000 inh Population density: 250 inh/ha Gross floor area (F): 16 000 000 m2
dimensional data

8 AKADEMICHESKIYI
ACADEMICHESKY - is one the largest integrated development projects in Russia, a part of the Leninskiy and Verh-Isetskiy administrative areas, located in the southwestern part of the Ekaterinburg. The development of the project began in 2005 at the initiative of the developer "Renova Stroy Group" in collaboration with the administration of the Ekaterinburg city. The construction of the first microrayons is launched in October 2007.
HOUSING of "Academichesky" is divided into five classes: the economy class - 51%, the middle class - 33%, business class - 11%, the elite class - 4%, the townhouses" - 1%. According to the architects, all types of l dwellings are located in such manner that citizens have the same conditions to access of services and district infrastructure. "We refused to create separate blocks of the economy, medium and business class. The apartments can be on variable size, but in terms of location in the urban space all citizens must have the same conditions " - convinced the chief urban architect of the French bureau "Valode & Pistre" Gilles Sabbaros.
SOCIAL INFRASTRUCTURE AND PUBLIC SERVICES. Social services and commercial property - 1.8 million m2, including shopping center - 0.403 million m2 . Buisiness, sports and cultural facilities - 2.4 million m2; including business-park of 130 000 m2 26 kindergartens; 18 primary and secondary schools; Clinic for children and adults; Medical Center: hospital, ambulance service, outpatient and obstetric institution. Moreover, in the territory of the new district will be built a university campus.
TRANSPORT INFRASTRUCTURE 160,000 parking spaces for cars. District Academichesky will be connect with the center of Ekaterinburg by the high speed tram line which allows to reach the city center in 18 minutes. The line will pass through special-purpose path, and trams will have priority over other vehicles. Consequently the trams will be moving non-stop. In addition to the lines of the high-speed trams (including the metro line), have been designed the usual buses, trolleybuses and trams routes.
GREEN AREAS The district is surrounded by two forest parks. According to the concept of masterplan of Valode & Pistre Bureau of Architecture (France), green walking areas should penetrate the territory from the south-western forest park to the southern forest massif. In the central part of the district will be situated Preobrazhenskiy park with a total area of 60 hectares. The river Patrushikha flows from south-west to north-east of the area. Around its riverbed it is planned to create a recreational area for residents of the district.
According to the development company at the end of 2016 built and put into operation: residential real estate - 90 residential buildings with an area of more than 1 million sq.m.;
CASE STUDY 9 non-residential premises - 150 thousand sq.m.; underground parking lots - 8451 car places ; current population – 45000 inhabitants
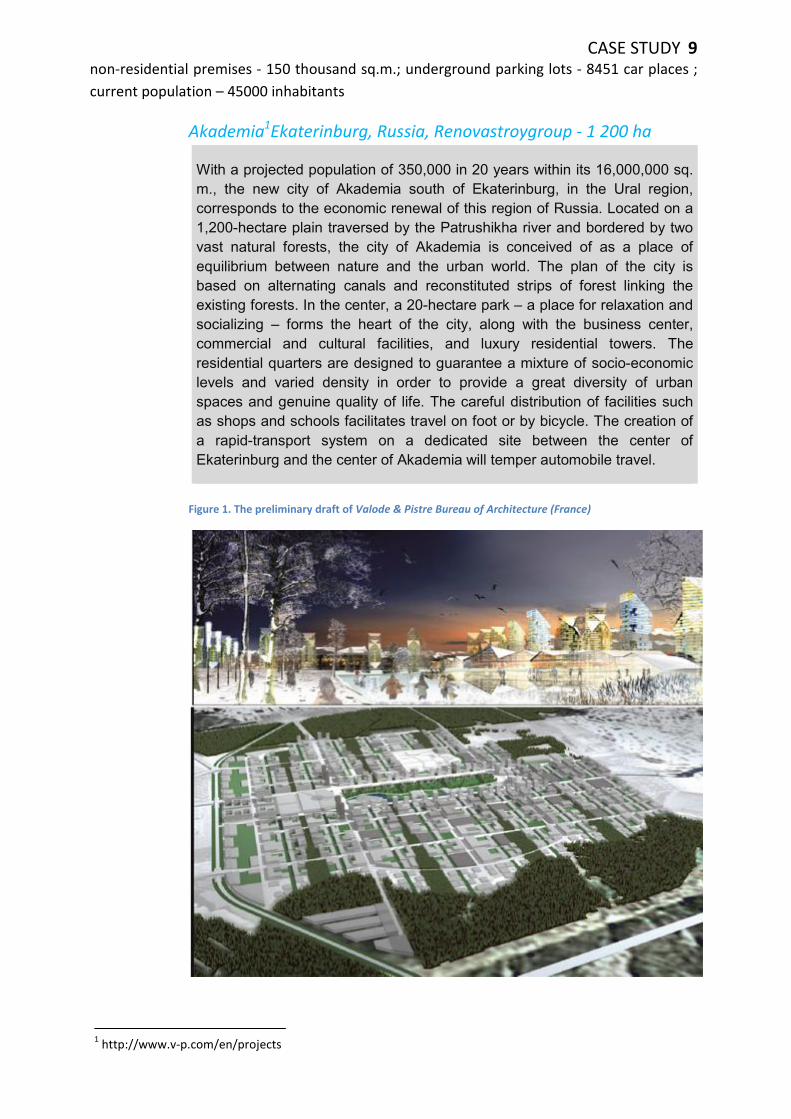
Akademia1Ekaterinburg, Russia, Renovastroygroup - 1 200 ha
With a projected population of 350,000 in 20 years within its 16,000,000 sq. m., the new city of Akademia south of Ekaterinburg, in the Ural region, corresponds to the economic renewal of this region of Russia. Located on a 1,200-hectare plain traversed by the Patrushikha river and bordered by two vast natural forests, the city of Akademia is conceived of as a place of equilibrium between nature and the urban world. The plan of the city is based on alternating canals and reconstituted strips of forest linking the existing forests. In the center, a 20-hectare park – a place for relaxation and socializing – forms the heart of the city, along with the business center, commercial and cultural facilities, and luxury residential towers. The residential quarters are designed to guarantee a mixture of socio-economic levels and varied density in order to provide a great diversity of urban spaces and genuine quality of life. The careful distribution of facilities such as shops and schools facilitates travel on foot or by bicycle. The creation of a rapid-transport system on a dedicated site between the center of Ekaterinburg and the center of Akademia will temper automobile travel.
Figure 1. The preliminary draft of Valode & Pistre Bureau of Architecture (France)
1 http://www.v-p.com/en/projects

10 AKADEMICHESKIYI Figure 2. District development project of MBI "Masterskaya Genplana" (Russia)
Figure 3. LAYOUT OF TRANSPORT NETWORK INEGRATED DEVELOPMENT PROJECT “ACADEMICHESKIY”. Source: District planning project of MBI «Masterskaya genplana»

CASE STUDY 11

12 AKADEMICHESKIYI .
MICRORAYON ANALYSIS Currently on the territory of district have been implemented microrayons №2 and №5,
microrayon №1 is implemented in the end of 2017, the microrayons №7 and №4 is in the
initial stage of construction.
As an object of the study was selected microrayon N2 implemented in 2010. The
microrayon share borders with: the microrayon № 5 in the north-west , the forest site
which grubbing for future development in the north-east, the low-rise elite residential area
in the south-east, the job site of microrayon № 1 in the south-west.
Figure 4. Microrayon position in district structure. Actual situation according to data Yandex.map 18/02/2017

CASE STUDY 13 Microrayon 2 The area of microrayon has a rectangular plan layout.
dimensional data: land area
footprint
gross floor area
population
population density
dwelling density
housing per capita
43,5 ha
77260 m2
823203 m2
15456 inh
355 inh/ha
193 dw/ha
30m2/inh
Figure 5. Layoyt of urban plan
14 AKADEMICHESKIYI LAND USE INTENSITY
Spacemate analysis
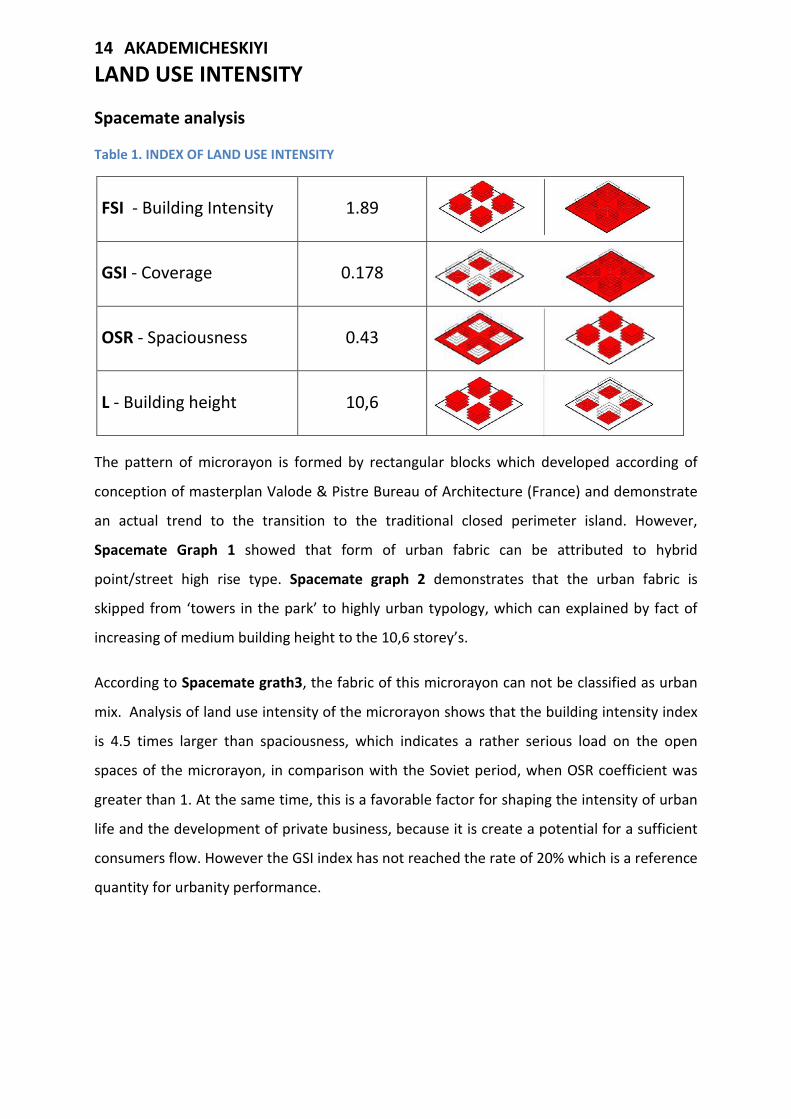
Table 1. INDEX OF LAND USE INTENSITY
FSI - Building Intensity 1.89
GSI - Coverage 0.178
OSR - Spaciousness 0.43
L - Building height 10,6
The pattern of microrayon is formed by rectangular blocks which developed according of
conception of masterplan Valode & Pistre Bureau of Architecture (France) and demonstrate
an actual trend to the transition to the traditional closed perimeter island. However,
Spacemate Graph 1 showed that form of urban fabric can be attributed to hybrid
point/street high rise type. Spacemate graph 2 demonstrates that the urban fabric is
skipped from ‘towers in the park’ to highly urban typology, which can explained by fact of
increasing of medium building height to the 10,6 storey’s.
According to Spacemate grath3, the fabric of this microrayon can not be classified as urban
mix. Analysis of land use intensity of the microrayon shows that the building intensity index
is 4.5 times larger than spaciousness, which indicates a rather serious load on the open
spaces of the microrayon, in comparison with the Soviet period, when OSR coefficient was
greater than 1. At the same time, this is a favorable factor for shaping the intensity of urban
life and the development of private business, because it is create a potential for a sufficient
consumers flow. However the GSI index has not reached the rate of 20% which is a reference
quantity for urbanity performance.

CASE STUDY 15 Spacemate graph 1. BUILDING TYPES ON THE SCALE OF THE FABRIC
Spacemate graph 2. TYPE OF LIVING ENVIRONMENTS (as a zone in the spacemate diagram).
Spacemate graph 3. TYPE OF LIVING ENVIRONMENTS (Revised Renewal Plan)
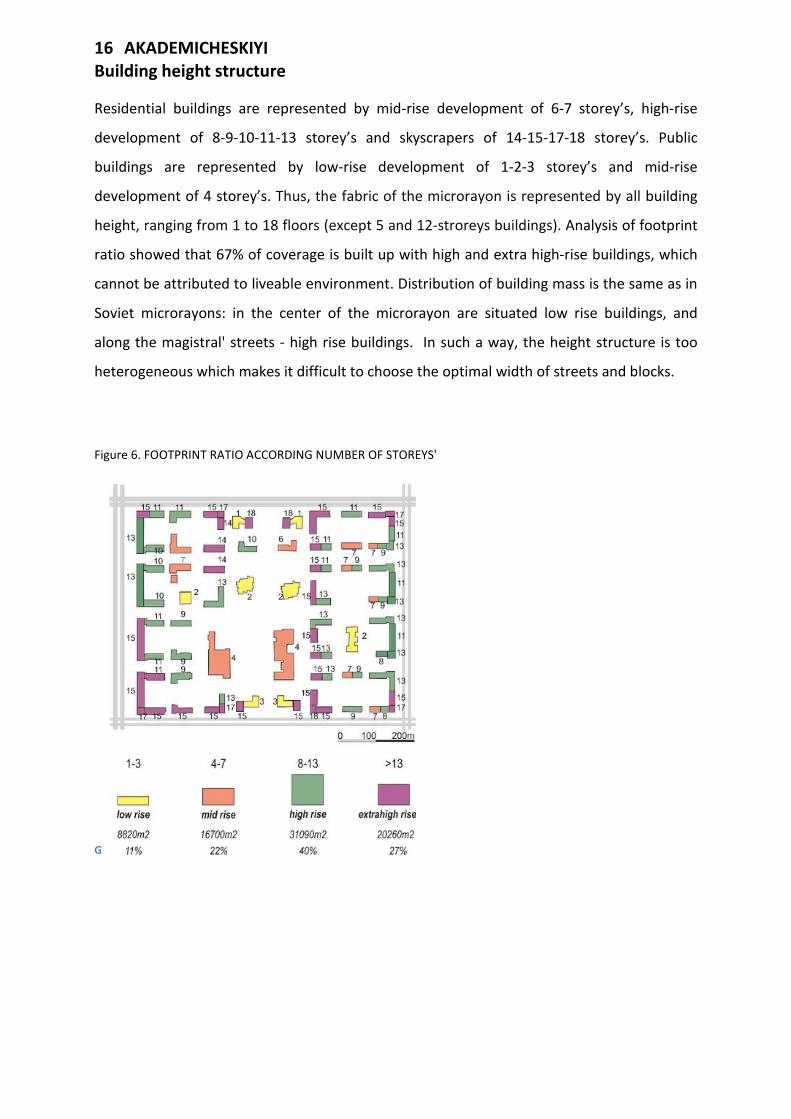
16 AKADEMICHESKIYI Building height structure
Residential buildings are represented by mid-rise development of 6-7 storey’s, high-rise
development of 8-9-10-11-13 storey’s and skyscrapers of 14-15-17-18 storey’s. Public
buildings are represented by low-rise development of 1-2-3 storey’s and mid-rise
development of 4 storey’s. Thus, the fabric of the microrayon is represented by all building
height, ranging from 1 to 18 floors (except 5 and 12-stroreys buildings). Analysis of footprint
ratio showed that 67% of coverage is built up with high and extra high-rise buildings, which
cannot be attributed to liveable environment. Distribution of building mass is the same as in
Soviet microrayons: in the center of the microrayon are situated low rise buildings, and
along the magistral' streets - high rise buildings. In such a way, the height structure is too
heterogeneous which makes it difficult to choose the optimal width of streets and blocks.
Figure 6. FOOTPRINT RATIO ACCORDING NUMBER OF STOREYS'
G

CASE STUDY 17 Spaciousness - open space ratio
gross plan area 43,5 ha
net plan area 39,8 ha footprint area 7,73ha OPEN SPACE AREA: 320700 m2 - parking 97680 m2 - children's playgrounds 20730 m2
- sports area 15200 m2 - kindergartens and schools area 44000 m2
- green area 67340 m2 - sidewalks 75750 m2

18 AKADEMICHESKIYI An analysis of the distribution of open spaces showed that 54,5% refer to public space,
which consists of three parts, parking and driveways, sidewalks and green areas, distributed
almost in equal proportions. Also there are sports and playgrounds, however their share is
insignificant and makes 2% of all open spaces. A careful analysis of the plan shows that this
area in its structure and functions can be attributed to the network space. There are located
all the main driveways and pedestrian routes of the microrayon. The space of residential
blocks and children's institutions occupies less than half of the entire territory of the
microrayon. The internal block area attributed at semipublic space because it open for all
visitors and the boundaries of this space are poorly articulated and practically inseparable
from the public area. Semi-public spaces are occupied almost in equal proportions by
children's institutions and by passages with parking lots (13% each), as well as children's and
sports grounds and sidewalks (9% each).
The greatest provision of spaces is intended for the children's institutions and children's
playgrounds, which is 12,54 sq. m. per one child. This is twice the area occupied by parking
lots and driveway, which is 6,31 sq. m. per capita. Green spaces and sidewalks are divided
almost in equal proportions of 4,35 sq. m. and 4,9 sq. m. per capita, respectively. Sports
grounds occupy 0.98 sq. m. per capita, which less than 1% of the territory, besides their
large area is closed for general access, as it is located behind the school fence.
Parking lots and driveways occupy more than 30% of the territory, and together with the
sidewalks consist more than half of the territory (54,2%). Despite the fact that these two
zones are both public and in courtyard spaces, they practically coincide in area with the area
of public spaces (54,5%). Thus, it can be concluded that parking lots and driveways and
sidewalks could be placed in a public area, which can be considered a network space. As it
was established in the theoretical part, the network part should not exceed 40% of the
percent. Therefore, it can conclude that lawns, that occupy more than half, moved from the
sidewalk area to green space, would reduce the network space to the required 40%. While
green spaces are 21%, which does not reach the necessary minimum 25%, could be
recuperated by the area of these lawns.

CASE STUDY 19
parking
Parking area is organized in three different modes: on-street, off-street and underground lots. Parking lots are situated around the perimeter of residential blocks, along the fences of school and kindergarten and surround of children playgrounds. The lots are bordered by sidewalks and green stripes separating the residential area from the magistral’ streets and roads. Distribution of parking area per capita, m2
97680 m2/15456inh=6,31m2 Required number of parking spaces 98298m2/100m2*3lots=2949 lots for visitors 8395dwelings*1 lots=8395 lots for residents In total 11344 lots, 260lots/ha Actual number of parking spaces 97680m2/39m2 =2505 - street lots 4083 underground lots In total 6588 lots, 151lots/ha Distribution of parking lots for visitors: -444 lots for residents: -4312 lots In total: - 4756 lots
children's playgrounds
The playgrounds are situated in the middle of residential courts. The territory is surrounded by parking lots of residents. Thus, the main advantage of the microrayon model - safe playgrounds for children separated from the traffic flows - is lost in this case. The area includes the lawns and young plantation. Distribution of playgrounds for one child, m2 20730/15456*3=4.02m2/child
20 AKADEMICHESKIYI
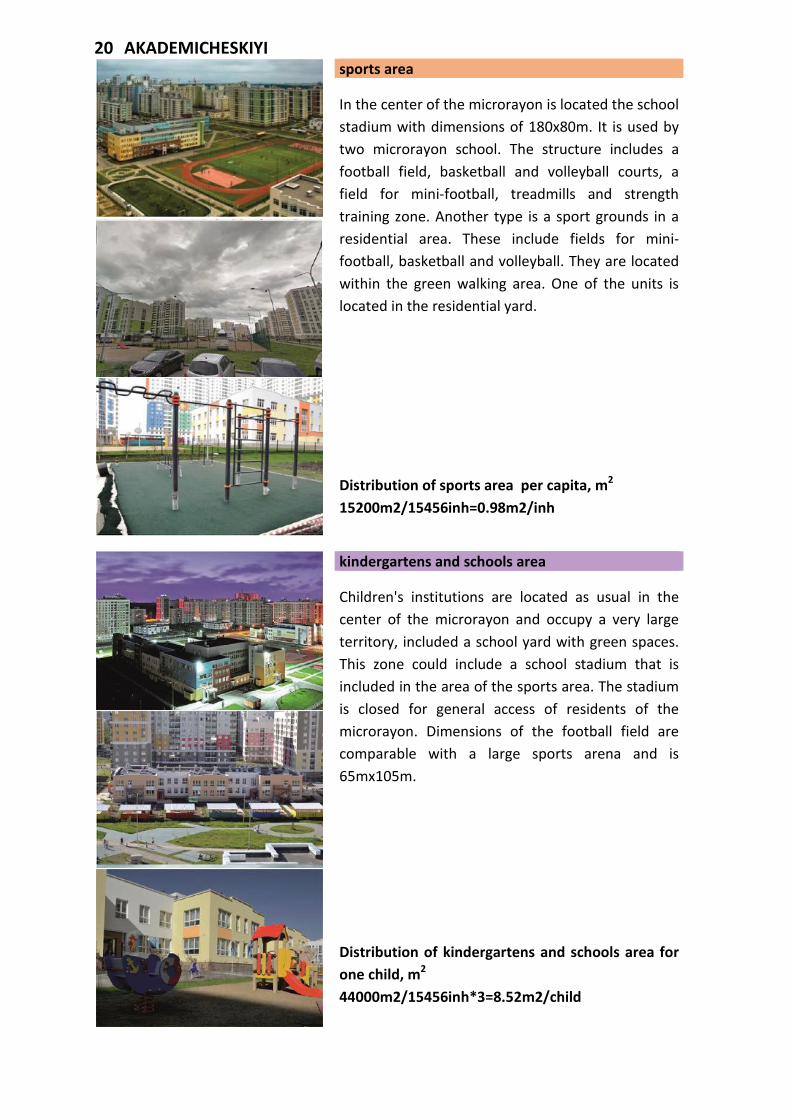
sports area
In the center of the microrayon is located the school stadium with dimensions of 180x80m. It is used by two microrayon school. The structure includes a football field, basketball and volleyball courts, a field for mini-football, treadmills and strength training zone. Another type is a sport grounds in a residential area. These include fields for mini-football, basketball and volleyball. They are located within the green walking area. One of the units is located in the residential yard. Distribution of sports area per capita, m2 15200m2/15456inh=0.98m2/inh
kindergartens and schools area
Children's institutions are located as usual in the center of the microrayon and occupy a very large territory, included a school yard with green spaces. This zone could include a school stadium that is included in the area of the sports area. The stadium is closed for general access of residents of the microrayon. Dimensions of the football field are comparable with a large sports arena and is 65mх105m.
Distribution of kindergartens and schools area for one child, m2
44000m2/15456inh*3=8.52m2/child

CASE STUDY 21
green area
The green area is represented by green stripes separating the residential area from the magistral’ streets, which cannot be used as recreation area for residents. Also at this zone was attributed the green pedestrian strips of infra microrayon territory. This zone consists of wide paved pedestrian paths, lawns and young plantations. Within this zone limits are located sports grounds, excluded from the green area. According to the idea of Valode & Pistre Bureau green walking areas should penetrate the territory from the south-western forest park to the southern forest massif. It is interesting that, before the project development (according to data of Google Earth 06/03/2006) on the site was an array of young forest, which was completely cut down. Thus, the landscape advantages of the site were not used. Distribution of green area per capita, m2
67340m2/15456inh=4,35m2
sidewalks
This zone includes the sidewalks around residential building which have not entered the surface of other zones. In their area are also included lawns around residential buildings, that violates the interaction between the building and the street. As the practice of the Soviet period shows, the placement of lawns in the sidewalk zone leads to their trampling and to the soil ablation into the sidewalks, which leads to their contamination.
Distribution of sidewalks per capita, m2
75750m2/15456inh=4,9m 2/inh

22 AKADEMICHESKIYI BLOCK PATTERN ANALYSIS
Size ranges and archetypes of block units
Figure 7. STRUCTURAL FABRIC AXES
The microrayon structure is an orthogonal grid with cells 140x80 meters. The pattern of residential groups form rectangular blocks demonstrated the tendency to move to the traditional closed perimeter island. The buildings grouped according this grid in 31 rectangular islands. The small size blocks are prevalent on the fabric. Two fabric units are representing medium size blocks which occupied of school territories. The structure of the plan at first glance seems to be formed by perimeter building blocks. However, a detailed analysis of 26 residential islands showed that most of them (67%) have been designed as a semi-block type with parts of the perimeter of the block left open. Around 23% of islands are developed by the street type. 3 residential units have been built up only by one building. On the territory of the microrayon there are not the residential islands representing the extreme close court and point types. The 5 fabric units of schools and kindergartens can be attributed to pavilion (point) type. According Spacemate analysis Graph 1 that form of urban fabric can be attributed to hybrid point/street high rise type. However, Figure 10 demonstrates that most of residential islands are representing by hybrid block/street type. This can be explained by fact that the 46,8 % of the island margins are open and fenced edges. Thus, we can conclude that in this sample the fabric units are representing the transitional type from modernist open building block to traditional closed perimeter building block. According the In such a way, the height structure is too heterogeneous which makes it difficult to choose the optimal width of streets and blocks.

CASE STUDY 23 Figure 6 the most part of footprint ratio take up by high and extra rise development
Figure 8. PATTERN OF FABRIC UNITS
Figure 9. BLOCK SIZE RANGES
Figure 10. ARCHETYPES OF RESIDENTIAL BLOCKS

24 AKADEMICHESKIYI Analysis of block margins
Analysis of block units showed that mixed, inactive and fenced edges are presented in
almost equal proportions each about 20 %. Active and friendly edges are compiled only
6%. They are located along the main urban magistral’ - ulitsa Vilgelma de Gennina - and
dead-end driveways adjacent to it. Facades that are attributed to the mixed type are
found along the main magistral’ streets of microrayon. The majority of the block
perimeters are blind facades, which situated along the axes of pedestrian activity.
Fenced territories of kindergartens and schools are located in the center of the
microrayon. There is not the fenced residential block on the area. Based on the figure of
total area population, we can conclude that for one commercial entrance there is a
stream of 64 residents.

CASE STUDY 25 total built edges extension: 7740 m total open edges extension: 2862 m
extension active edges: 159 m
Good Quality – 5.9%
extension friendly edges: 471 m
extension mix edges: 2073 m
Average Quality -24,5%
extension dumb edges: 519 m
extension inactive edges: 2306 m
Poor Quality – 42,6%
extension fenced edges: 2212 m
IN total 242 entrances 63,8inh/ent

26 AKADEMICHESKIYI STREET NETWORK ANALYSIS
Structure of street layout
The urban plan of the district follows a cardo decumanus structure oriented along the line of the main urban streets which are connected the district with city center. According planning project of MBI “Masterskaya Genplana”, borders of the microrayon are represented by main urban artery (main urban magistral’) – ulitsa Vilgelma De Gennina; district magistral’ streets – ulitsa Krasnolesia, ulitsa Pavla Shamanova, ulitsa Anatoliya Mehrentseva; and local passages. Communication with the city center is carried out in two directions: across the main urban magistral’ (ulitsa Vilgelma De Gennina), which is a dead-end street at the present; and district magistral’ streets (ulitsa Krasnolesia).
Figure 11. THE SCHEME OF THE MICRORAYONS NETWORK STRUCTURE

CASE STUDY 27 Connectivity of street networks The layout of the microrayon is characterized by isolation from the surrounding urban fabric. Microrayon is surrounded by magistral’ streets that deprives it of solutions of continuity between exterior and interior. There is not a single crossing between the main intersections of magistral streets, which would link the tissue of the microrayon with neighboring territories. The urban layout recalls some principles of modernist development: inter-magistral driveways are represented by cul-de-sacs. All these factors influenced on the Composite Street Connectivity Index of Microrayon that is critically small and is only 5%.
In accordance with the logic of the main axes along which the residential blocks are formed and the composition of public space, 25 internal intersections and 22 intersections with magistral’ streets could be organized in this case. This would increase the IC ext (Connectivity with main streets) up to 1.1, INC (Connectivity with neighboring area) up to 1.0, DI (Intersection density) up to 1.17, TR (Index permeability of network) up to 1.0 and CSCIM - Composite Street Connectivity Index of Microrayon up to 1.5
Table1. INDICATORS OF CONNECTIVITY OF MICRORAYON NETWORK
Land area, ha 43.5 Graphical representation of CSCIM
CSCIM - Composite Street Connectivity Index of Microrayon 0.05
1. DR (Network Density), m/ha 233
2. DI (Intersection density) 0.59
3. TR (Index permeability of network) 0.13
4. IC ext (Connectivity with main streets) 0.65
5. INC (Connectivity with neighboring area) 0.27

28 AKADEMICHESKIYI
Internal microrayon network analysis
The main pedestrian routes in the space between the blocks and coincide with the fabric
grid 80x140. The local pedestrian routes are laid inside the yard spaces (Figure 13). The 62%
of pedestrian network is permeable.
The internal transport network of the microrayon is represented by dead-end and circular
two-line passages, which are intended for access to residential courts and public buildings of
the microrayon (Figure 14).
The structure of internal microrayon driveways does not coincide with the rectangular grid
pedestrian ways, and, in contrast to them, it is absolutely nontransparent. Thus, it can
conclude that the system of internal networks is conceived in the concept of the traditional
Soviet microrayon, with the restriction of transport and the prevalence of pedestrian traffic.
Separation of pedestrian and transport flows is well organized in the center of the
microrayon, where there are absolutely absence the local driveways. However, yard spaces
are organized in such way that traffic and pedestrians constantly intersect, creating conflict.
Thus, one can come to the conclusion, as well as from the analysis of open spaces, that one
of the most significant advantages of the microrayon model, namely the safe movement of
children through the territory of courtyards, is lost in this case.
Table 2. INDICATORS OF INTERNAL MICRORAYON NETWORK
Area NT, ha 39,8
INDICATORS OF DRIVEWAY NETWORK INDICATORS OF PEDESTRIAN NETWORK
LR (Total driveway network length),m 8810 LR(P) (Total pedestrian network length),m 13200
DR (Driveway network density ) m/ha 221 DR(P) (Pedestrian network density) m/ha 331
LRC (Length of connected driveways), m 0 LRC(P) (Length of connected routs), m 8150
TR (Driveway network permeability) % 0 TR(P) (Pedestrian network permeability), % 61,7

CASE STUDY 29 Figure 12. SCHEME OF DRIVEWAYS AND PEDESTRIAN NETWORK
Figure 13. SCHEME OF PEDESTRIAN NETWORK
Figure 14. SCHEME OF DRIVEWAYS NETWORK

30 AKADEMICHESKIYI Street centrality
Notably, the fabric of the microrayon includes a high proportion of cul-de-sacs, rather than main streets and absolute absence of connectors. Table shows that the central a streets have ‘good’ and 'average' overall quality of street fronts. However, the Street fronts of best quality are into one of the cul-de-sacs. Most street fronts in the cul-de-sacs do not have entrances at all or they are fenced. And if we see to the structure of pedestrian routes we can conclude that street fronts of the 'poor' quality are projected precisely in to the main pedestrian routes.
Network density, m/ha
Main streets
Connecting streets
Cul-de-sac Total street length, m
233.10 1330 0 8810 10140
13% 87%
STREET FRONT QUALITY
good 400 0 230 630
average 1401 0 1191 2592
poor 0 0 4518 4518
1801 0 5939 7740
good average poor

CASE STUDY 31 FIGURE 15. MAIN URBAN ARTERY (MAGISTRAL’) - ULITSA VILGELMA DE GENNINA
FIGURE 16. MAIN DISTRICT STREET (DISTRICT MAGISTRAL’) - ULITSA KRASNOLESYA

32 AKADEMICHESKIYI FIGURE 17. MAIN DISTRICT STREET (DISTRICT MAGISTRAL’) - ULITSA ANATOLIYA MEHRENTSEVA
FIGURE 18. MAIN DISTRICT STREET (DISTRICT MAGISTRAL’) - ULITSA PAVLA SHAMANOVA

CASE STUDY 33 ANALYSIS OF FUNCTIONS AND SERVICES
Basic functional indicators
Indicator
Population, a thousand inhabitants 15.456
Number of companies, total 368
N1 – Number of companies per thousand inhabitants 24
N2 – Number of companies per 7000 inhabitants 167
Fh – Housing Gross Floor Area, sq.m. 670256
Fs – Services Gross Floor Area, sq.m. 54649
Fa – Activities Gross Floor Area, sq.m. 98298
F – Gross floor area, sq.m. 823203
MXI – Index of non residential facilities, (Fs+Fa)/F, % 18,6
MXIh– (Index of housing), Fh/F, % 81,4
MXIs – (Index of services), Fs/F, % 6,6
MXIa – (Index of activities), Fa/F, % 12
Medium area of facilities for commercial activity, sq.m. 267
There are 4 kindergartens and two schools, a municipal polyclinic and a police station and
also sales offices for the development company, as well as the managing company of the
Residential Academic District, several hypermarkets, cafes, and bank branches on the
territory of the microrayon. As can be seen from the diagram 19, the greatest concentration
of services is observed along the city magistral' street - ulitsa Vilgelma de Gennina,- as well
as in the cul-de-sucs that depart from it. The concentration of services decreases towards
the center of the microrayon. In the center are some monofunctional blocks, occupied either
by children's institutions or by residential buildings without non-residential premises. It is
here that the main pedestrian routs, which are absolutely devoid of functional filling. The
combination of the building intensity and non-residential facilities characterizes this
microrayon as belonging to the transitional type, located on the border of the modernist city
and of the late 19th century district. This is due to the increase in FSI in comparison with the
Soviet housing estates and the increase in the share of commercial premises. However, as
can be seen from Diagram 21, the area can not be attributed to the good level of mixitè, but
only to bifunctional ones, which confirmed the results of Spacemate analysis.

34 AKADEMICHESKIYI Figure 19. Scheme of number of registered companies and the distribution of public services.
Figure 20. The character of urban districts according FSI-MXI indexes combination.
Figure 21. FSI- MXI Ternary diagram: monofunctional, bifunctional, mixed

2. MICROGOROD V LESU. MOSCOW REGION

MICROGOROD V LESU. MOSCOW REGION

CASE STUDY 37
MICROGOROD V LESU
district introduction Moscow region location
design 2008-2020 construction 2011-2021
terms of realization
SPEECH (Russia) AssmannSalomon AS (Germany) LANGHOF (Germany) TPO «Reserve» (Russia) Ortner & Ortner (Austria) Will Alsop Architects (UK)
project group
ROSE GROUP promoters and developers Land area: 100 ha
Population: 35000 inh
Population density: 350 inh/ha
Gross floor area (F): 1 500 000 m2
dimensional data

38 MICROGOROD V LESU
Integrated development progect “Microgorod v lesu” is a new residential area in the six kilometers to the west from the Moscow Ring Road on Pyatnitskoye Highway. The project is being implemented in the Otradnenskoe rural settelment1 of Krasnogorsky district of the Moscow region. The developer of the project is the "Rose Group" company.
Within the project it is planned to build 8 neighborhoods, each of which has a unique name:, , "Aktivnyiy" Active, "Centralnyiy" (Central), "Parkovyiy" Park, " Oblachnyiy " (Cloud), "Radostnyiy" Joyful, " Dalnyiy " (Distal). Neighborhood "Pervyiy" (First) as the initial stage of construction was implemented in the end of 2013. The first blocks of "Semeynyiy" (Family) neighborhood has to be completed by the end of 2017. The first residential buildings of the "Semeynyiy" (Family) neighborhood were commissioned in December 2015, and the final completion of the construction of this stage is scheduled for the second quarter of 2017.
ARCHITECTURAL AND DESIGN CONCEPT2 The concept of “Microgorod v lesu” (MicroCity in the Forest) was developed by the leading Russian architectural bureau SPEECH. The huge Russian and European experience of the architectural bureau influenced the architectural solutions of the project. The architects made an attempt to completely remove the sensation of a typical Soviet microrayon and create a fragment of a humanized urban fabric: with a closed perimeter blocks, shops and cafes not only on the ground floors, but especially on the boulevard, which will be built within the third stage of construction. In the opinion of architects, the boulevard should become a center of public life, adding of trade, cultural and recreational function to the residential area, which is necessary to create a full-fledged urban environment. Figure 1
At the heart of the architectural project is the idea of individual design of each residential section of closed building block, which makes it easy for inhabitants to identify not only condominium, 1 In 2017 it received a statue of the municipality 2 http://www.microgorodvlesu.ru/about

but also the entrance . Bureauarchitectural appearance of the area. The facades of the first stage of construction were developed by the AssmannSalomon AS and LANGHOF (Germany), TPO "Reseralso by SPEECH. The 30 sections Alsop Architects (Great Britain) and TPO" Reserve "the second stage of the construction. that differ in color or in the rhythm of architectural elements.Figure 2. FACADES THE FIRST STAGE OF PROJECT
Figure 3. FACADES THE SECOND STAGE OF PROJECT
HOUSING There are more than 35 types of apartment with a floor area from 25.5 to 117.3 square meters.
ureau SPEECH invited an international team of designers architectural appearance of the area. The facades of the first stage of construction were developed by the AssmannSalomon AS and LANGHOF (Germany), TPO "Reser
he 30 sections were shared by this companies. Ortner & Ortner (Austria), Will Alsop Architects (Great Britain) and TPO" Reserve "(Russia) were invited to design the facades of the second stage of the construction. As a result, several facade subtypes have been developed that differ in color or in the rhythm of architectural elements.
. FACADES THE FIRST STAGE OF PROJECT
STAGE OF PROJECT
There are more than 35 types of apartment with a floor area from 25.5 to 117.3 square
CASE STUDY 39
SPEECH invited an international team of designers to develop the architectural appearance of the area. The facades of the first stage of construction were developed by the AssmannSalomon AS and LANGHOF (Germany), TPO "Reserve" (Russia), and
Ortner & Ortner (Austria), Will were invited to design the facades of
everal facade subtypes have been developed
There are more than 35 types of apartment with a floor area from 25.5 to 117.3 square

40 MICROGOROD V LESU
A Tale of a Town3 The project is a manifesto in many ways…. The dance of lines and colors is not the only special feature of this project. Nearly the most important peculiarity is the gridiron planning, proposed by the designers. Now that Sergey Kuznetsov 4 …insists on prioritizing the gridiron development over the micro-district open one, only a lazy or a short-sighted author would not call his project a block. In 2007, when it all only started the priorities were not that clear yet – although one must admit, that not only SPEECH was among the devotees of gridiron planning at that time: for instance, Bart Goldhorn promoted the same idea in his project A101 – and still the project of a large-scale gridiron development must be recognized as a certain manifesto. Most of the houses on the master plan, except for the dozen towers of the boulevard – surround the large yards with their dense perimeter. The perimeter breaks as if unwillingly, giving away one, less frequently two sections. The defined rhythm of the large blocks is inscribed into a fairly flexible, but still stubbornly orthogonal scale.
SOCIAL INFRASTRUCTURE AND PUBLIC SERVICES. Since September 2014, a general school for 1100 pupils and a kindergarten for 180 pupils have been working for the residents. In the future stage of development, it is planned to build another school and two pre-school institutions, theater, office complex and supermarket. The ground floors of residential buildings are reserved for service facilities: shops, cafes, bank branches, pharmacies, beauty salons etc. A minimarket, several cafes, hairdressers and a beauty salon, an educational center, a veterinary clinic, a flower and gift shop, sports sections for children and adults, furniture and interior shops, children's goods stores, etc. are already open to residents. In addition to its own infrastructure, in close proximity to the area there are the shopping mall "Otrada", the center of country rest and the equestrian club, as well as the Clinical Hospital MEDSI.
TRANSPORT INFRASTRUCTURE and PARKING FASILITIES The residential area is located at the distance of 6 km from the Moscow Ring Road and 1.8 km from “Pyatnickoe shosse” metro station. At a 5 minutes walking distance from the residential area there is a bus stop. But the bulk of residents use their own vehicles. Parking spaces are placed outside the courts of residential blocks. The vast majority of parking lots are located in underground garages, the guest parking - along the perimeter of island. Parking spaces are designed at the rate of 1 car lot per 1 apartment. Total number of parking spaces: 10 000 lots
GREEN AREAS The territory borders on the lands of the Goslesfund, and in the immediate vicinity there are two rivers. Next to the school territory there are 7 hectares of natural forest, which are planned to be transformed into parkland. At the present time in the area are carried out improvement works.
3 Sergey Kuznetsov - one of the two founders of the SPEECH bureau. Since 2012 he is architect in chief of Moscow city. 4 Fragment of the article «A Tale of a Town» in the electronic Russian edition ARCHI.RU 14.10.2014 Date of reference to the site 29.03.2017 http://archi.ru/en/57558/skazka-o-gorode

CASE STUDY 41
Currently on the territory of integrated development “Microgorod v lesu” have been implemented first stage and almost completed the 2nd stage of construction. The area of the first stage of construction is only 7,5 hа. The school complex and a kindergarten are built on the territory of the 2nd stage. They are designed for service of half housing provided for in the project. Therefore, in order to obtain more correct results, comparable with Soviet microrayons, we consider it expedient to analyze both stages as a single whole. In addition, the second stage should be completed by the end of 2017.
Figure 4. MICRORAYON POSITION IN THE DISTRICT STRUCTURE. Actual situation according to data Yandex.map 18/02/2017

42 MICROGOROD V LESU
Figure 5. LAYOUT OF TRANSPORT NETWORK. According to data - general plan of the Otradnenskoye rural
settlement of Krasnogorsk district of the Moscow regio

CASE STUDY 43
MICRORAYON ANALYSIS The site is inscribed in a rectangle of 600x570 meters, however it has an irregular shape from the southeast side which is defined by the cadastral parcel boundaries.
The area share borders with:
the fenced park area of a hospital in the north-west, the forest site and full service filling station in the north-east, the warehouse, natural forest area and sites of future developvent in the south-east, the job site second stage of development in the south-west.
1st and 2nd stages dimensional data5 land area
footprint
gross floor area
population
population density
dwelling density
medium area of dwelling
23ha
41300 m2
367450 m2
6050 inh
263 inh/ha
107dw/ha
73m26
Figure 6.
5 Site of SPEECH bureau http://www.speech.su 6 According to project data the figure is 35inh/ha. However, for the purposes of comparative analysis, for all samples is accepted a figure of 30 inh/ha, which is determinate of actual Russian building standards.

44 MICROGOROD V LESU
LAND USE INTENSITY AND URBANITY
Spacemate analysis
Table 1. INDEX OF LAND USE INTENSITY
FSI - Building Intensity 1.60
GSI - Coverage 0.18
OSR - Spaciousness 0.51
L - Building height 9.3
Morphologically speaking it can be defined as block type but in Spacemate Graph 1 it is
located in to a cluster of hybrid point/street high rise type. This can be explained by the
fact that the closed perimeter block was opened up and that a significant part of the
territory occupied by school and kindergarten block units. These units, as usual in Soviet
microrayon, can be attributed to the cluster of point type. In addition, the blocks size
analysis showed that 3 of 9 units are medium and large sizes blocks, which occupies more
than 50% of total islands area. According the Ошибка! Источник ссылки не найден.
almost 60% of footprint ratio take up by high and extra high rise development. Medium
building height of fabric has the figures of 9.3 storey’s.
According to graph 2 the density characteristics of living environment are located in to
border between the park and highly urban clusters and close to the urban cluster. OSR
index which is slightly higher than 0.5 allows to attribute the project environment to the
highly urban type. However, the GSI index is lower than required for urban environment.
Thus, the fabric of this integrated development project can not be classified as urban mix.

CASE STUDY 45
Spacemate graph 1. BUILDING TYPES ON THE SCALE OF THE FABRIC
Spacemate graph 2. TYPE OF LIVING ENVIRONMENTS
Spacemate graph 3. TYPE OF LIVING ENVIRONMENTS . Level of functional mix

46 MICROGOROD V LESU
Building height structure
Analysis of footprint ratio (Ошибка! Источник ссылки не найден.) showed that the
most part of the territory 43% is built up with high rise buildings In addition, a significant
area is occupied by the mid rise building. Three residential block of first stage of
development have the high rise building, which is explained by the developer's desire to
maximize profits in the initial stages of construction.
Figure 7. FOOTPRINT RATIO ACCORDING NUMBER OF STOREYS’

CASE STUDY 47
Open space ratio
gross plan area 23 ha
net plan area 22,3 ha footprint area 4,13ha OPEN SPACE AREA: 181700 m2 - parking 48430 m2 - children's playgrounds 33590 m2 - sports area 15760 m2 - kindergartens and schools area 39500 m2 - green area 24550 m2 - sidewalks 19870 m2

48 MICROGOROD V LESU
An analysis of the distribution of open spaces showed that 54,4 % refer to public space,
which consists of three parts, parking and driveways, sidewalks and green areas. More
than half of public spaces are occupied by parking and driveways, and slightly less than
half by sidewalks and green spaces. The analysis of the plan layout shows that the most
part of public space can be attributed to the network space. Therefore it can concluded
that it should be reduced to at least 40%, according to the parameters established in the
theoretical part. The area of children's institutions, sport zone and point residential blocks
was assigned to the typology of semipublic spaces, which occupies one fifth of all open
spaces. The internal area of perimeter blocks attributed at semiprivate space, because,
despite the fact that they are available for visitors, their boundaries are clearly read, and
spaces are used only by tenants of condominiums. It takes almost one fifth from total
open space. This territory is used to playgrounds and lawns around the buildings.
The greatest provision of spaces for one customers is intended for the children's
institutions and children's playgrounds, which is 36.2 sq. m. per one child. The area of
parking, which is 8 sq. m. per capita, is the second one. The third is the green area of –
4,0 sq. m. per capita, however the total amount of green space is 13,5% which less than
required 25%. The provision of sidewalks is 3.3 sq. m. per capita .

CASE STUDY 49
parking
The surface parking lots are represent in two types: on-street and off-street lots. Calculations of the minimum parking needs show an excess of 1886 parking lots. However, the project is developed for business class segment where 2 parking spaces per apartment should be provided, so this surplus is explained by the greater need for parking space.
Distribution of parking area per capita, m2
48430 m2/6050inh=8.0m2 Required number of parking spaces 9820m2/100m2х3lots=295 lots for visitors 2461dwelingsх1 lots=2461 lots for residents In total 2756 lots, 120lots/ha Actual number of parking spaces 48430m2/39m2 =1242 3400 underground lots In total 4642 lots, 201lots/ha Distribution of parking lots for visitors +947 lots for residents +939 lots In total +1886 lots
children's playgrounds
The court spaces of residential blocks are isolated from the movement of vehicles and are occupied by children's playgrounds. It is assumed that children have the opportunity to play on the street without accompanying adults. Playgrounds are divided by age - for the youngest, for junior and middle school students, for teenagers. In the area, except for the directly game zones, there are also lawns and green plantations. Along the courtyard facades, are organized the firetrucks using for biking, rollerblading and skateboards. Part of the territory in some blocks is occupied by sports grounds. Distribution of playgrounds for one child, m2 33590/6050х3=16,65m2/child Distribution of playgrounds per capita, m2 33590/6050х3=5,55m2/inh

50 MICROGOROD V LESU
sports area Sports grounds can be divided into three categories: local court, specialization grounds and stadiums. In the courts there are neighbors with children's playgrounds and are represented by small multifunctional courts. Specialized sites are located in the first stage of construction from the north-eastern side and adjoin to the green massif. There are a mini football field and others. On the school territory there is a stadium with running tracks and a football field, as well as a combined basketball and volleyball courts. Distribution of sports area per capita, m2 15760m2/6050inh=2,6 m2/inh
kindergartens and schools area
Territories of kindergartens and schools include areas of lawns and greenery plantations, pedestrian paths, technical and fire-prevention driveways, playgrounds and sites for various purposes. The surface of the open school stadium is included in the territory of the sports zone.
Distribution of kindergartens and schools area for one child, m2
39500m2/6050inhx3=19.58m2/child

CASE STUDY 51
green area
The green area includes green stripes separating the residential area from the magistral’ street and access road, and pieces of the forest that enter the boundaries of the cadastral area. A piece of forest with an area of about 7 hectares adjoins the site from the south-west side. This site is not included in the boundaries of the project, but is actively used by residents for recreation. The forest plot is bordered by the magistral’ street (ulitsa Lesnaya), with a school fence and parking area. The small piece of the forest plot is included in the area of this green zone. Another piece of woodland included in the area of this zone is located on the north-eastern side and is bordered by the main access road and parking lots. Green separating stripes are representing by lawns with young plantings.
Distribution of green area per capita, m2
24550m2/6050inh=4,05m2
sidewalks
This zone includes sidewalks around residential islands, as well as sidewalks that have not entered the surface of other zones. Sidewalk areas include fairly wide strip of lawns and the spaces of open perimeter in residential blocks intended for access of residents and fire trucks to the territory of the yards.
Distribution of sidewalks per capita, m2
19870m2/6050inh=3,28m 2/inh

52 MICROGOROD V LESU
Block pattern analysis
Figure 8. STRUCTURAL FABRIC AXES
Size ranges and archetypes of block units The urban fabric model is an orthogonal grid with cells 110x135, 150x135 meters.
The small size blocks are prevalent on the fabric. Two fabric units are representing
medium size residential blocks. One unit which occupied of schools territory is a large size
block.
A detailed analysis of 8 residential islands showed that most of them (87%) have been
designed as a block type with parts of the perimeter of the block left open. One unit is
designed as strip typology. The 2 fabric units of schools and kindergartens can be
attributed to pavilion (point) type. Thus, we can conclude that in this sample the fabric
units are represented by all types of block.

CASE STUDY 53
Figure 9. STRUCTURE OF FABRIC UNITS
Figure 10. BLOCK SIZE RANGES
Figure 11. ARCHETYPES OF RESIDENTIAL ISLANDS

54 MICROGOROD V LESU
analysis of block margins
Analysis of block units showed that most of edges (64%) can be attributed in dumb type.
Unified design solution of residential islands which made from the calculation of one
commercial space in the ground level per one section is formed an uniform structure of
the residential blocks margins. On the territory there’re not margins that can be
attributed to active, friendly and mixed edges. We can state the fact that the attempt to
form a friendly street environment is failed. Fenced margins are represented by 28% of
total built edges. Open edges extension is about 8% and it represented by spaces of open
perimeter of residential island. There isn’t the fenced residential block on the area. Total
numbers of commercial entrances are 85 units. Based on the figure of total area
population, we can conclude that for one commercial entrance there is a stream of 71
residents.

CASE STUDY 55
total built edges extension: 4145 m total open edges extension: 324m
extension active edges: 0 m
Good Quality – 0%
extension friendly edges: 0 m
extension mix edges: 0 m
Average Quality - 64.3%
extension dumb edges: 2664 m
extension inactive edges: 0 m
Poor Quality – 32,7%
extension fenced edges: 1157 m
IN total 85 entrances 71 inh/ent

56 MICROGOROD V LESU
STREET NETWORK ANALYSIS
Structure of street layout
Figure 12.
Main district magistral’ ulitsa Lesnaya divide the analyzed area in two parts. This situation is not typical for Soviet urban planning practice, since the magistral’ streets should not have crossed the territory of microrayons. However, this situation is conditioned by the limits associated with the construction site, rather than with any tendency to change the design approaches. Structure of urban plan is based on the medium-scale gridiron with a step of 110, 150 meters in one direction and 135 meters in the other. On the basis of this grid are built streets surrounding the residential blocks. On the territory there is one magistral’ street connected with the road leading to highway “Pyatnitskoye shosse”. In general, the structure street network is impermeable respect to the surrounding areas, since the communication with them is carried out only through a single road. However, it should be noted that the internal system of streets forms a permeable fabric, limited to the outside of the territory.

CASE STUDY 57
Connectivity of microrayon network
The layout of the microrayon is characterized by good organization of street structure. Residential blocks are formed rectangular street grid. There are only some cul-de-sacs for entrance on the area of off-street parking. Internal driveway network is connected with neighboring territories from two parts except from part of Pyantitskoe shosse and road led to it. Almost all internal streets are connected with the main district magistral’ ulitsa Lesnaya, there are many intersections in the territory of the microrayon. However, on the main streets there are only for intermediate intersections. Therefore, despite the fact that this example has the best indicator of connectivity with neighboring territories, but it is only 21%.
Table1. INDICATORS OF CONNECTIVITY OF MICRORAYON NETWORK
Land area, ha 23.0ha Graphical representation of CSCIM
CSCIM - Composite Street Connectivity Index of Microrayon 0.21
1. DR (Network Density), m/ha 226
2. DI (Intersection density) 1.04
3. TR (Index permeability of network) 0.92
4. IC ext (Connectivity with main streets) 0.49
5. INC (Connectivity with neighboring area) 0.40

58 MICROGOROD V LESU
Figure 13. SCHEME OF DRIVEWAYS AND PEDESTRIAN NETWORK
Figure 14. SCHEME OF PEDESTRIAN NETWORK
Figure 15. SCHEME OF DRIVEWAYS NETWORK

CASE STUDY 59
Internal microrayon network analysis
The structure of the internal transport and pedestrian routes of the micro is formed in the
form of traditional streets - passages limited by sidewalks that go along the perimeter of
residential blocks. Driveways and sidewalk are good connected. The street grid is the
medium size by cells 110x135, 150x135 meters, what contributes to the permeability of
the street network.
Table 2. INDICATORS OF INTERNAL MICRORAYON NETWORK
Area NT, ha 22.3
INDICATORS OF DRIVEWAY NETWORK INDICATORS OF PEDESTRIAN NETWORK
LR (Total driveway network length),m 4380 LR(P) (Total pedestrian network length),m 8688
DR (Driveway network density ) m/ha 196 DR(P) (Pedestrian network density ) m/ha 389
LRC (Length of connected driveways), m 3945 LRC(P) (Length of connected routs), m 6646
TR (Driveway network permeability) % 90 TR(P) (Driveway network permeability) % 76
Street centrality and street life
Despite the fact that the length of the main streets is less than the connectors, the length
of the street fronts differs not in such a large proportion. The streets have a smaller width
than in the Soviet micro-districts. The quality of street fronts in the level of the first floor
is rather attractive, but the entrances are very rarely located due to the fact that large
commercial premises are projected. The main district magistral’, - ulitsa Lesnaya, -
equipped by bicycle paths.
Network density, m/ha
Main streets Connecting streets
Cul-de-sac Total street length, m
226 825 3945 435 5205 16% 76% 8%
STREET FRONT QUALITY good 0 0 0 0
average 1026 1103 534 2643 poor 318 549 0 867
1324 1652 534 3510

60 MICROGOROD V LESU
Figure 16. MAIN ROAD
Figure 17. MAIN DISTRICT MAGISTRAL’ - ULITSA LESNAYA
CASE STUDY 61
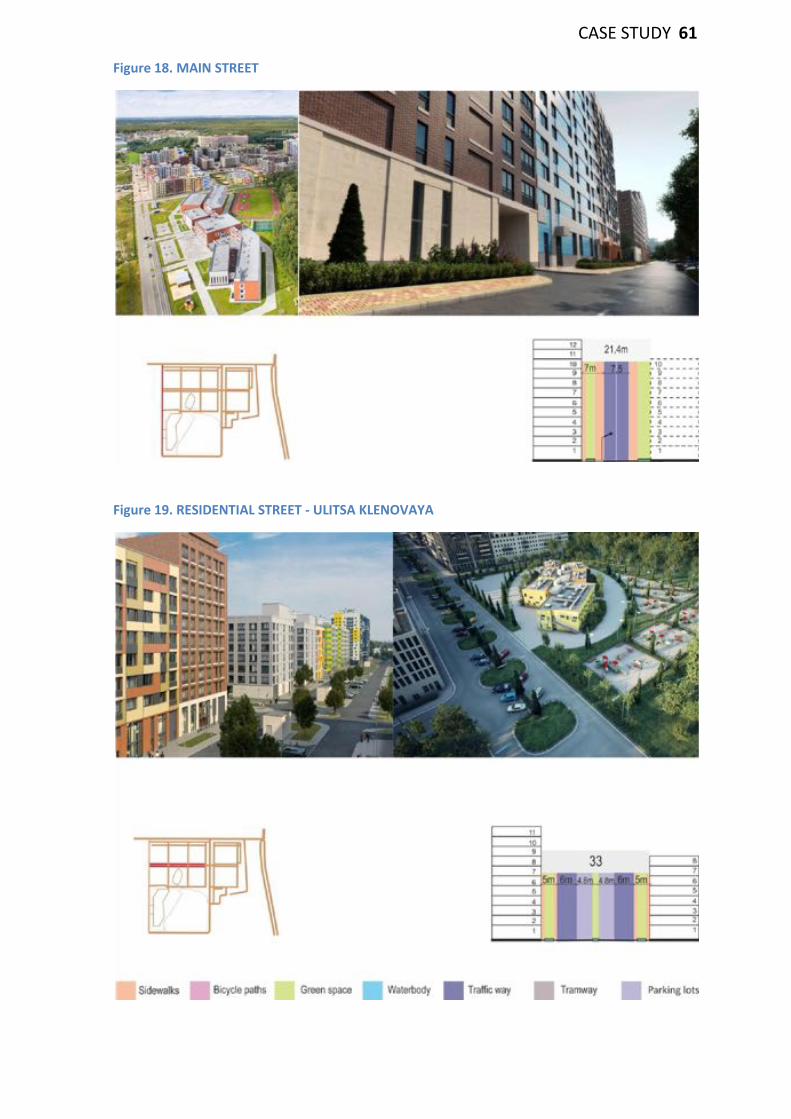
Figure 18. MAIN STREET
Figure 19. RESIDENTIAL STREET - ULITSA KLENOVAYA

62 MICROGOROD V LESU
ANALYSIS OF FUNCTIONS AND SERVICES
Basic functional indicators
Indicator
Population, a thousand inhabitants 6.050
Number of companies, total 87
N1 – Number of companies per thousand inhabitants 14
N2 – Number of companies per 7000 inhabitants 101
Fh – Housing Gross Floor Area, sq.m. 336429
Fs – Services Gross Floor Area, sq.m. 21200
Fa – Activities Gross Floor Area, sq.m. 9820
F – Gross floor area, sq.m. 367450
MXI – Index of non residential facilities, (Fs+Fa)/F, % 9
MXIh– (Index of housing), Fh/F, % 91
MXIs – (Index of services), Fs/F, % 6
MXIa – (Index of activities), Fa/F, % 3
Medium area of facilities for commercial activity, sq.m. 113
There are one kindergarten and one school, offices of district doctors several grocery
stores, cafes, and bank branches, pharmacies on the territory of the microrayon. As can
be seen from the diagram 20, the concentration of services is sufficiently low but
homogeneous. The combination of the building intensity and non-residential facilities
characterizes this microrayon as belonging to the tipical modernist extention. This is due
to the increase in FSI in comparison with the Soviet housing estates and the decrease in
the share of commercial premises. As can be seen from Diagram 22, the area can not be
attributed to the good level of mixitè, but only to monofuctional typology, which
confirmed the results of Spacemate analysis.

CASE STUDY 63
Figure 20. Scheme of number of registered companies and the distribution of public services.
Figure 21. The character of urban districts according FSI-MXI indexes combination.
Figure 22. FSI- MXI Ternary diagram: monofunctional, bifunctional, mixed

64 MICROGOROD V LESU

3. BALTIYSKAYA ZHEMCHUZHINA. SAINT PETERSBURG

BALTIYSKAYA ZHEMCHUZHINA. SAINT PETERSBURG

CASE STUDY 67
BALTIYSKAYA ZHEMCHUZHINA
district introduction Saint Petersburg location design 2004-2020 construction 2005-2020
terms of realization
OJSC LenNIIproekt ARUP & OMA, HOK, SWECO и STUDIO 44 Shanghai Construction Corporation
project group
Baltiyskaya Zhemchuzhina CJSC Selt group
promoters and developers
Land area: 205 ha Population: 35200 inh Population density: 171 inh/ha Gross floor area (F): 1 980 000 m2
dimensional data

68 BALTIYSKAYA ZHEMCHUZHINA
"BALTIYSKAYA ZHEMCHUZHINA " is an integrated development territory in the south-west of St. Petersburg located on the coast of the Gulf of Finland It is actively built up since 2005 with the participation of Chinese and Russian developers. The project includes the reclamation of the land from the sea, the strengthening of the shore of the Gulf of Finland, the restoration of the Matisov Canal. "BALTIYSKAYA ZHEMCHUZHINA " is one of the largest integrated development projects in St. Petersburg with foreign capital. The investor of the project is China. ZAO Baltic Pearl, the developer of the project, is a subsidiary of the Shanghai Overseas Joint Investment Company in St. Petersburg, established by the five largest Shanghai corporations. The question of investing Chinese capital was decided at the level of Russian President Vladimir Putin and Chinese President Hu Jintao. LOCATION "BALTIYSKAYA ZHEMCHUZHINA "- a new residential area, located in the south-west of the city, in the Krasnoselsky district of St. Petersburg. From the north side the area is washed by the Gulf of Finland. From the west there is a large forest area, and from the east there are the Duderhof Canal and the South Primorsky Park. Right in the center of the neighborhood there are Matisov and the Nameless Channel. On the south side, the area adjoins the Peterhof Highway.
SOCIAL INFRASTRUCTURE AND PUBLIC SERVICES. Commercial property - 600000 m2, including shopping center, business, sports and cultural facilities 7 kindergartens; 4 primary and secondary schools; Clinic for children and adults; Police station. TRANSPORT INFRASTRUCTURE 6 bridges will be built on the territory of the project. The main route, which will link the complex's territory to the city, will be the Heroes Avenue, which is a continuation of Leninsky Prospekt. To ensure transport accessibility of the residential area, the project envisaged the construction of an overhead express. October 15, 2009 it became known that the authorities of St. Petersburg completely abandoned its construction, in connection with the economic crisis. The "Baltic Pearl" is connected to the metro stations "Kirovsky Zavod" and "Avtovo" by several bus routes. At the intersection of Peterhof highway and Pogranichnika Garkavogo street there is a tramway ring, which is the final stop. From the shopping center "Zhemchuzhnaya Plaza" go free shuttle buses that carry passengers on two routes to the city center. GREEN SPACES, NATURAL AND CULTURAL OBJECTS A district that boasts a favorable neighborhood with the famous palace and park ensembles of Peterhof, Strelna and the Konstantinovsky Palace. Today this territory has a huge historical and natural value. The list of the world cultural heritage of UNESCO includes palace and park ensembles, parks and historical centers of Petrodvorets and Strelny, manors Mikhailovka, Znamenka and Sergievka, the Orthodox male Trinity-Sergius Monastery. In the immediate vicinity of the "Baltic Pearl" there are 5 parks: Novoznamenka, Alexandrino, Sosnovaya Polyana, Polezhaevsky, Alexandria.

CASE STUDY 69 About the advantages of the architectural concept of the "Baltic Pearl"
Wang Chand - CEO of the development company1 "Baltic Pearl" is the first and unique experience of such scale of the integrated development of the coast of the Gulf of Finland in the history of Saint Petersburg. Our company strives to transform the beautiful green area of the city with its unique seaside atmosphere and unique network of canals to the thriving, comfortable, rest and business alternative metropolitan center. Our company strives to transform the beautiful green area of the city with its unique seaside atmosphere and unique network of canals to the thriving, comfortable, rest and business alternative metropolis center. ….
The peculiarity of the project lies in its carefully designed infrastructure, which allows to have everything necessary for an active lifestyle of a present-day business person: shopping and entertainment, sports, exhibition, tourist and business centers, hotels and restaurants. …
Speaking about the peculiarities of the architectural concept of the complex, it should be noted that the most famous architectural workshops of Europe: ARUP & OMA, HOK, SWECO and STUDIO took part in the development of the "Baltic Pearl" project. The project was also worked by design studios in Shanghai and St. Petersburg, such as the Shanghai Construction Corporation and the project institute LenNIIproekt ... As a result, the well thought-out concept …allowed to give individuality to each residential block, maximum insolation of houses during the day, protect from adverse environmental influences and create a comfortable living environment. …
Equally important is the fact that we have made positive changes to the usual model of living in St. Petersburg. So, under all residential blocks there will be an underground parking - this will allow to liberate space in the courtyards and turn them into landscaped recreation areas, sports and children's playgrounds. … On the ground floors of the vast majority of buildings will open shops and pharmacies, beauty salons, fitness centers and cafes that will provide future residents with everything needed in walking distance.
1 translation from Russian, Site “Baltiyskaya zhemchuzhina” 29 /09/2008 http://bpearl.net/press-centr/publikacii/baltiyskaya-zhemchuzhina-arkhitektura-dlya-zhizni-/ Date of reference to the site 22/05/2017 .

70 BALTIYSKAYA ZHEMCHUZHINA
MICRORAYON ANALYSIS The territory of district сonditionally can be divided into 5 residential microrayons and a public-business area. As an object of research we have chosen the only fully built up microrayon which includes five residential complex.
Figure 1. Microrayon position in district structure. Actual situation according to data Yandex.map 18/02/2017

CASE STUDY 71
microrayon I
dimensional data land area
footprint
gross floor area
population
population density
dwelling density
medium area of dwelling
47,3 ha
87890 m2
647793 m2
10524 inh
222 inh/ha
152 dw/ha
44 m2
Figure 2.

CASE STUDY 69 LAND USE INTENSITY AND URBANITY
Spacemate analysis
Table 1. LAND USE INTENSITY INDEX
FSI - Building Intensity 1.37
GSI - Coverage 0.186
OSR - Spaciousness 0.59
L - Building height 7.4
The pattern of microrayon demonstrates an actual trend to the transition to the traditional
closed perimeter island. However, some residential blocks represent the hybrid of open
modernist and traditional perimeter block. In the Spacemate Graph 1 the samples is on the
border zone from mid rise street type and hybrid point/street high rise type_ which
confirmed by diagram of building height structure (figure 4). Spacemate graph 2
demonstrates that the urban fabric is skipped from Park and Garden City typology, and
according Spacemate grath3 this sample can be attributed at the fully-featured modernist
typology.
Spacemate grath3 shows that this microrayon can not be classified as urban mix area.
Analysis of land use intensity of the microrayon shows that the building intensity index is 2.3
times larger than spaciousness, which indicates a good load on the open spaces. This is a
favorable factor for shaping the intensity of urban life and the development of private
business, because it is create a potential for a sufficient consumers flow. However the GSI
index has not reached the rate of 20% which is a reference quantity for urbanity
performance.

70 BALTIYSKAYA ZHEMCHUZHINA Spacemate graph 1. BUILDING TYPES ON THE SCALE OF THE FABRIC
Spacemate graph 2. TYPE OF LIVING ENVIRONMENTS
Spacemate graph 3. TYPE OF LIVING ENVIRONMENTS (Revised Renewal Plan)

CASE STUDY 71 Building height structure
Analysis of footprint ratio (Figure 3) showed that 28% of the territory is built up with low rise
buildings. This figure is formed due to the huge number of single-story buildings in which
there are exits from underground parking lots, car washes and other buildings for communal
purposes. In addition, a significant area is occupied by the 3-story shopping complex "Pearl
Plaza". Nevertheless, it is worth noting that the coverage ratio is fairly evenly distributed
among all 4 types of building height. Altitude structure of microrayon is extremely uneven.
Nineteen-storey buildings are built in one row with five-, six- and eight-storey houses; and
form a united perimeter blocks.
Figure 3. FOOTPRINT RATIO ACCORDING NUMBER OF STOREYS'

72 BALTIYSKAYA ZHEMCHUZHINA Open space ratio
gross plan area 47.5 ha
net plan area 46,4 ha footprint area 8,87ha OPEN SPACE AREA: 375300 m2 - parking 119000 m2 - children's playgrounds 17550 m2 - sports area 6200 m2 - kindergartens and schools area 33800 m2 - green area 112150 m2 - sidewalks 86600 m2

CASE STUDY 73 An analysis of the distribution of open spaces showed that 70% refer to public space, which
consists of three parts, parking and driveways, sidewalks and green areas. Also there are
sports and playgrounds, however their share is insignificant and makes 1.5 % of all open
spaces. The space of residential blocks and children's institutions occupies only 30% of the
entire territory of the microrayon. The internal blocks area in some cases attributed at
semipublic space because it open for all visitors and block margins are poorly articulated and
the courtyards are practically inseparable from the public area. Semi-public spaces are
occupied almost by children's institutions 9 %.
The greatest provision of spaces is intended for parking lots and green area almost in equal
proportion which is about 11 sq. m. per capita. The second largest figure is the land
provisions by children institutions which is 9,6 sq. m. per child, that together with children's
playgrounds is almost 15 sq. m. per child. Sidewalks occupy 8,2 sq. m. per capita, that is a
quarter less than driveways and parking. Sports grounds occupy 0.6 sq. m. per capita, which
less than 1% of the territory, besides their large area is closed for general access, as it is
located behind the school fence.
Parking lots and driveways occupy more than 30% of the territory, and together with the
sidewalks consist more than half of the territory (54,7%). Despite the fact that these two
zones are in both public and in courtyard spaces, they take up a little less space than public
spaces (69,6%). For another thing, the parking spaces are situated in two-level courtyards in
the both levels, however in this calculation was taken in account only upper one. However,
even with the active use of underground space to locate parking lots, in the microrayon
there is a shortage of parking spaces in almost 2000 parking lots.

74 BALTIYSKAYA ZHEMCHUZHINA
parking
Parking facilities are organized as off-street and underground lots. Surface parking are situated around the shopping center, in the in two level courtyard and along the Admiral Cherokov street, where are also underground parking. Ground parking lots very often adjoin the area of playgrounds. Distribution of parking area per capita, m2
119000m2/10524inh=11,3m2 Required number of parking spaces 113146m2/100m2*3lots=3394 lots for visitors 5912dwelings*1 lots=5912 lots for residents In total 9306 lots – 196lots/ha Actual number of parking spaces 119000m2/39m2 =3051 - street lots 3657 underground lots In total 6708 lots, 141lots/ha Distribution of parking lots for visitors +343 lots for residents -2255 lots In total - 1912 lots
children's playgrounds
Children's playgrounds are usually located in the second level of a two-level courtyard and are surrounded by parking lots. Under the playgrounds are parking located in the ground level. The game zone as rules is surrounded by parking lots. There are also three play areas outside the condominiums: on the north-west side, in the center of the microrayon on the west of the school site, and along the street of Admiral Cherokov next to the parking area. Distribution of playgrounds for one child, m2 17550/10524*3=5,0m2/child

CASE STUDY 75
sports area
Multifunctional sports grounds are located in the
play areas adjacent to the street of the Lyotchika
Tikhomirova and on the west side of the school site.
The largest area of sports grounds is located on the
school grounds, but it is closed for free access.
Distribution of sports area per capita, m2 6200m2/10524inh=0,6m2/inh
kindergartens and schools area
In the central part of the microrayon there are two
kindergartens and one school. The territory is
equipped with playgrounds and green areas. On the
school site is a stadium with a large football field.
Distribution of kindergartens and schools area for one child, m2
33800m2/10524inh*3=9,6m2/child

76 BALTIYSKAYA ZHEMCHUZHINA
green area
Green areas are located along the magistral'
streets, and there is also a park in the zone of the
Matisov Canal. In the park areas there are no
benches, sports and playgrounds. Vegetation is
represented by lawns with young plantings.
Distribution of green area per capita, m2
112150m2/10524inh=10,7m2
sidewalks
This zone includes the sidewalks around residential
building which have not entered the surface of
other zones. In their area are also included lawns
around buildings, which separate building fronts
from the street. As the practice of the Soviet
period shows, the placement of lawns in the
sidewalk zone leads to their trampling and to the
soil ablation into the sidewalks, which leads to
their contamination.
Distribution of sidewalks per capita, m2
86600m2/6050inh=8,2m 2/inh

CASE STUDY 77 BLOCK PATTERN ANALYSIS
Size ranges and archetypes of block units
Figure 4. STRUCTURAL FABRIC AXES
The structure of the intermagistral’ network, as well as the pattern of the fabric units, is
subordinated to orthogonal-diagonal layout. The Matisov canal is the axis of symmetry for
two residential complexes located on its sides, as well as for a shopping complex that
completes the composition. The residential complex "Pearl Premiere" is separated from the
rest of microrayon by a residential street (ulitsa Kapitana Grishchenko).
To build the structure of the microrayon used a fairly small grid with a step of 80 to 130
meters. However, residential blocks are quite large. 10 of the 15 elements refer to blocks of
medium and large size. The 5 of the 11 residential islands can be attributed to the block
archetype with minor discontinuities in the perimeter, the 4 refer to the hybrid block-street
archetype and 2 to the strip archetype.

78 BALTIYSKAYA ZHEMCHUZHINA Figure 5. PATTERN OF FABRIC UNITS
Figure 6. BLOCK SIZE RANGES
Figure 7. ARCHETYPES OF RESIDENTIAL ISLANDS

CASE STUDY 79 Analysis of block margins
Analysis of block units showed that dumb, inactive and fenced edges are presented in
almost equal proportions each about 25 %. There aren’t active and friendly edges on
building blocks. Mixed margins consist only 14%. They are located in residential blocks
situated along the district magistral’ - ulitsa Admirala Tributsa . The long fronts of
shopping centers also attributed to the mixed type. The half of the block perimeters
are blind or fensed margins, which situated along the axes of pedestrian activity.
Fenced territories of kindergartens and schools are located in the center of the
microrayon. Based on the figure of total area population, we can conclude that for one
commercial entrance there is a stream of 94 residents.

80 BALTIYSKAYA ZHEMCHUZHINA
total built edges extension: 5176 m total open edges extension: 763 m
extension active edges: 0 m
Good Quality – 0%
extension friendly edges: 0 m
extension mix edges: 848m
Average Quality -37,2%
extension dumb edges: 1362 m
extension inactive edges: 1561 m
Poor Quality – 49,9%
extension fenced edges: 1405 m
IN total 112 entrances 94 inh/ent Figure 8.

CASE STUDY 81 STREET NETWORK ANALYSIS
Structure of street layout
The structure of the street network of the microrayon is represented by two district
magistral' ulitsa Admirala Tributsa in the east and ulitsa Admirala Cherokova in the west; by
the Peterhof highway in the south and by the residential street ulitsa Lyotchika Tihomirova
in the north. The listed streets are the boundaries of the area. There is only one residential
street on the territory of microrayon. Internal driveway network represented by permeable
passages and some cul-de-sacs. The high-speed tram line adjoins the territory from the side
of Peterhof Highway.
Figure 9. THE SCHEME OF THE MICRORAYONS NETWORK STRUCTURE

82 BALTIYSKAYA ZHEMCHUZHINA Connectivity of microrayon network
The layout of the microrayon is characterized by isolation from the surrounding urban fabric. microrayon is surrounded by magistral’ streets. There is only a single intermediate intersection on the magistral’ street Ulitsa Admirala Tiburtsa, which would link the tissue of the microrayon with neighboring territories. Despite the fact that 65% of intra-microrayon passages are permeable with a total connectivity ratio of only about 8% The urban layout recalls some principles of modernist development: inter-magistral driveways are represented by cul-de-sacs. All these factors influenced on the Composite Street Connectivity Index of Microrayon that is critically small and is only 5%.
Table 2. INDICATORS OF CONNECTIVITY OF MICRORAYON NETWORK
Land area, ha 47.3ha Graphical representation of CSCIM
CSCIM - Composite Street Connectivity Index of Microrayon 0.08
1. DR (Network Density), m/ha 181
2. DI (Intersection density) 0.84
3. TR (Index permeability of network) 0.71
4. IC ext (Connectivity with main streets) 0.78
5. INC (Connectivity with neighboring area) 0.20

CASE STUDY 83 Internal microrayon network analysis
The internal transport network of the microrayon is represented by one residential street
and local driveways, which are intended for access to residential courts and public buildings
of the microrayon. The 72% of pedestrian routs and 65% driveways are permeable.
The internal driveways coincides with pedestrian ways, however internal network does not
form street structure. The system of driveways, passing through the courtyard spaces,
intricately snaggles in the space between the blocks. Thus, it can be said that the system of
internal networks is conceived in the concept of the traditional Soviet microrayon, but with
the only difference is that most of the driveways are not cul-de-sacs. Despite the high
percentage of permeable passages and pedestrian paths, many sites of the microrayon are
isolated from each other both in pedestrian and transport modes, due to the lack of
connected routes.
Table 3. INDICATORS OF INTERNAL MICRORAYON NETWORK
Area NT, ha 46.4
INDICATORS OF DRIVEWAY NETWORK INDICATORS OF PEDESTRIAN NETWORK
LR (Total driveway network length),m 7170 LR(P) (Total pedestrian network length),m 17475
DR (Driveway network density ) m/ha 155 DR(P) (Pedestrian network density) m/ha 376
LRC (Length of connected driveways), m 4655 LRC(P) (Length of connected routs), m 12550
TR (Driveway network permeability) % 64.9 TR(P) (Pedestrian network permeability), % 71.8

84 BALTIYSKAYA ZHEMCHUZHINA
Figure 10. SCHEME OF DRIVEWAYS AND PEDESTRIAN NETWORK
Figure 11. SCHEME OF PEDESTRIAN NETWORK
Figure 12. SCHEME OF DRIVEWAYS NETWORK

CASE STUDY 85 Street centrality
The fabric of the microrayon includes a high proportion of cul-de-sacs, rather than main
streets and absolute prevalence of connectors 55%. Table shows that the streets with all
levels of centrality have almost equal proportions of 'average' and ‘poor’ street fronts.
There aren’t street fronts of good quality in the area. The width of the magistal' streets
along the front line remains too wide, dividing the street fronts and streams of people. Such
streets are arranged as roads, the carriageway of which is separated by wide sanitary green
strips. They are deprived of opportunities for the organization of optional activities. The
facades are organized as cascades along the main streets, as for example along the street
Admirala Cherokova, or are separated by fences as from part of the Peterhof highway. All
these measures are taken to protect pedestrians, but they have a negative impact on the
convenience of the street activity , creating obstacles for human flows. All this in general
negatively affects street life. Only one street has an acceptable width - the street Lyotchika
Tikhomirova. However, residential blocks are organized in such a way that there is a
minimum number of street fronts.
Network density, m/ha
Main streets
Connecting streets
Cul-de-sac Total street length, m
181 1372 4655 2515 8542
16% 55% 29%
STREET FRONT QUALITY
good 0 0 0 0
average 429 1364 417 2210
poor 538 1977 451 2966
Total Front length, m
967 3341 868 5176

86 BALTIYSKAYA ZHEMCHUZHINA Figure 13. Highway and its doubler - Peterhof shosse
Figure 14. Main district street (district magistral’) - ulitsa lyotchika Tihomirova

CASE STUDY 87 Figure 15. Main district street (district magistral’) - ulitsa Admirala Tiburtsa
Figure 16. Main district street (district magistral’) - ulitsa Admirala Cherokova

88 BALTIYSKAYA ZHEMCHUZHINA
ANALYSIS OF FUNCTIONS AND SERVICES
Basic functional indicators
Indicator
Population, a thousand inhabitants 10.524 Number of companies, total 341 N1 – Number of companies per thousand inhabitants 32 N2 – Number of companies per 7000 inhabitants 226 Fh – Housing Gross Floor Area, sq.m. 508469 Fs – Services Gross Floor Area, sq.m. 26178 Fa – Activities Gross Floor Area, sq.m. 113146 F – Gross floor area, sq.m. 647793 MXI – Index of non residential facilities, (Fs+Fa)/F, % 21,5 MXIh– (Index of housing), Fh/F, % 78,5 MXIs – (Index of services), Fs/F, % 4 MXIa – (Index of activities), Fa/F, % 17,5 Medium area of facilities for commercial activity, sq.m. 341
There are 2 kindergartens and one school, offices of district doctors several grocery stores,
cafes, and bank branches, pharmacies on the territory of the microdistrict. As can be seen
from the diagram 19, the greatest concentration of services is on the area of shopping
centers and low concentration in the area of residential blocks. The combination of the
building intensity and non-residential facilities characterizes this microrayon as belonging to
the transitional type, located on the border of the modernist city. This is due to the increase
in FSI in comparison with the Soviet housing estates and the increase in the share of
commercial premises. However, as can be seen from Diagram 20, the area can not be
attributed to the good level of mixitè, but only to bifunctional ones, which confirmed the
results of Spacemate analysis.

CASE STUDY 89 Figure 17. Scheme of number of registered companies and the distribution of public services.
Figure 18. The character of urban districts according FSI-MXI indexes combination.
Figure 19 FSI- MXI Ternary diagram: monofunctional, bifunctional, mixed

90 BALTIYSKAYA ZHEMCHUZHINA

4. SLAVYANKA. SAINT PETERSBURG

SLAVYANKA. SAINT PETERSBURG

CASE STUDY 93
SLAVYANKA
district introduction Saint Petersburg location
design 2004-2014 construction 2009-2015
terms of realization
«PSK proejct» LTD
«Nevskaya Logistica» LTD
project group
Baltros group promoters and developers
Land area: 280 ha Population: 46600 inh Population density: 250 inh/ha Gross floor area (F): 1 444 800 m2
dimensional data

94 SLAVYANKA
SLAVYANKA is integrated development territory in south part of Saint Petersburg. The area is in the close proximity of the famous palace and park ensembles of the cities Pushkin and Pavlovsk.
SOCIAL INFRASTRUCTURE AND PUBLIC SERVICES. - 4 schools for 1,300 places (total - 5,200 places); - 9 kindergartens for 170 seats (a total of 1,530 places); - a polyclinic for adults for 540 visits per shift; - a polyclinic for children for 216 visits per shift; - emergency ambulance station for 5 cars; - fire station for 10 cars; - an item of law and order protection for 450 sq. m.
TRANSPORT INFRASTRUCTURE Main transport routes: Moscow highway, Kolpinskoye highway, Sofiyska Street, Pulkovskoe highway, Vitebsk Avenue Saint Petersburg Ring Road - 9 km, 10 minutes by car Railway station "Detskoye Selo" (Pushkin) 15-20 minutes on foot (1.5 km) or 5 minutes by shuttle bus №180 Metro: "Kupchino", "Zvezdnaya" - 20 minutes by transport Public transport, stops - 5-10 minutes on foot Buses: 179, 325, 374 Shuttle bus: K202, K354, K291, K294, K363 Airport Pulkovo - 20 minutes by transport
Comfortable novelty of "Slavyanka" Publications on the project site 22/03/2011. Interview with the head of marketing department Svetlana Arshinnikova http://oslavyanke.ru/pressa/novizna-slavyanki The new residential area is focused on medium-rise buildings and a return to the block principle of planning, in which several residential buildings form a microquarter with a closed courtyard. Already during the construction of the first two microrayons the distinctive features, the character of the "Slavyanka", were manifested. So, one of the streets - ulitsa Rostovskaya - became one of the widest in St. Petersburg. Its width is 90 meters. This is wider than Nevsky, and even than the Moscow prospectus. The area of the central park of the district will be 12.5 hectares - this is one and a half times more than the Summer Garden. In the first two microrayons, more than 3,000 ground parking spaces are provided, the following microrayons are provided for both ground and built-in parking lots.
In total, in the "Slavyanka" for 220 hectares, eight residential quarters will be built. All of them are executed in different architectural style, but they are united by a common atmosphere of comfort, coziness home and security. The houses have mid-rise height, the neighborhoods - wide streets, giving the feeling of space and freedom, a large number of green areas and playgrounds.
The microrayons built in 2010, are kept in altitude of 4-5 floors. 9-storey buildings are planned in the projected blocks. As for the closed yard layout, its peculiarity is that it excludes through passes of cars through yards. This allows to provide security for the residents of the district.

CASE STUDY 95
Figure 1. Microrayon position in district structure. Actual situation according to data Yandex.map 18/02/2017

96 SLAVYANKA
Currently the territory of integrated development project «Slavyanka» is implemented on 90%. Residential development is fully implemented in all seven residential blocks, construction of public buildings is underway. As an object of research, we have chosen block VII since this area includes the schools and kindergartens’ area
Figure 2. LAYOUT OF TRANSPORT NETWORK. Source District planning project of «Nevskaya Logistica» LTD

CASE STUDY 97
MICRORAYON ANALYSIS microrayon VII The area of microrayon share borders with: the block I in the north-west , the park area in the north the block VI in the north-east, the residential area Detskoselskiy in the south-east, the block VIII in the south-west
dimensional data
land area
footprint
gross floor area
population
population density
dwelling density
medium area of dwelling
28.4 ha
49400 m2
202735 m2
4985 inh
175 inh/ha
86 dw/ha
94m2
Figure 3.

98 SLAVYANKA LAND USE INTENSITY AND URBANITY
Spacemate analysis
Table 1. LAND USE INTENSITY INDEX
FSI - Building Intensity 0.71
GSI - Coverage 0.174
OSR - Spaciousness 1.16
L - Building height 4.0
The most part of microrayon blocks are rectangular blocks which developed accoding an
actual trend to the transition to the traditional closed perimeter island. However,
Spacemate Graph 1 showed that form of urban fabric can be attributed to street meed rise
type. Spacemate graph 2 demonstrates the mix of suburban type to garden city typology,
which in the Spacemate grath3 refer to the transitional type from park to the suburban
environment. According to Spacemate grath3, the fabric of this microrayon can not be
classified as urban mix.
Analysis of land use intensity of the microrayon shows that the building intensity index is 1.6
times lower than spaciousness, which indicates a rather serious load on the open spaces of
the microrayon, in comparison with the Soviet period, when OSR coefficient was greater
than 1. At the same time, this is a favorable factor for shaping the intensity of urban life and
the development of private business, because it is create a potential for a sufficient
consumers flow. However the GSI index has not reached the rate of 20% which is a reference
quantity for urbanity performance.

CASE STUDY 99 Spacemate graph 1. BUILDING TYPES ON THE SCALE OF THE FABRIC
Spacemate graph 2. TYPE OF LIVING ENVIRONMENTS (as a zone in the spacemate diagram).
Spacemate graph 3. TYPE OF LIVING ENVIRONMENTS (Revised Renewal Plan)
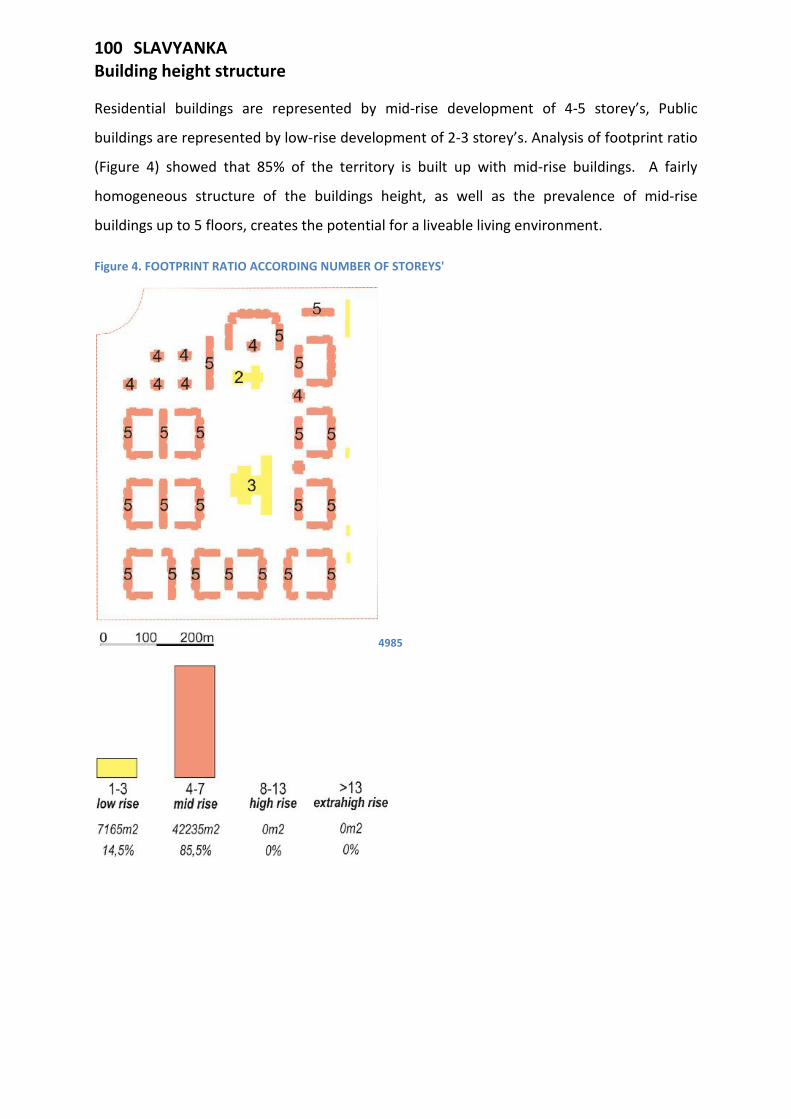
100 SLAVYANKA Building height structure
Residential buildings are represented by mid-rise development of 4-5 storey’s, Public
buildings are represented by low-rise development of 2-3 storey’s. Analysis of footprint ratio
(Figure 4) showed that 85% of the territory is built up with mid-rise buildings. A fairly
homogeneous structure of the buildings height, as well as the prevalence of mid-rise
buildings up to 5 floors, creates the potential for a liveable living environment.
Figure 4. FOOTPRINT RATIO ACCORDING NUMBER OF STOREYS'
4985

CASE STUDY 101 Open space ratio
gross plan area 28,4 ha
net plan area 27,5 ha
footprint area 4,94ha OPEN SPACE AREA: 225500
m2 - parking 82760 m2 - children's playgrounds 7290 m2 - sports area 8770 m2 - kindergartens and schools area 34400 m2 - green area 29650 m2 - sidewalks 62630 m2
102 SLAVYANKA An analysis of the distribution of open spaces showed that 54 % refer to public space, which
consists of three parts, parking and driveways, sidewalks and green areas. More than half of
public spaces are occupied by parking and driveways, and slightly less than half by sidewalks
and green spaces. The analysis of the plan layout shows that the most part of public space,
except of the green zone adjacent to the circular intersection, can be attributed to the
network space. Therefore it can concluded that it should be reduced to at least 40%,
according to the parameters established in the theoretical part. The area of children's
institutions, sport zone and point residential blocks was assigned to the typology of
semipublic spaces, which occupies just over a quarter of all open spaces. The internal area of
perimeter blocks attributed at semiprivate space, because, despite the fact that they are
available for visitors, their boundaries are clearly read, and spaces are used only by tenants
of condominiums. It takes one fifth from total open space. This territory is used to place
parking lots, playgrounds and sidewalks with lawns around the buildings.
The greatest provision of spaces for one customers is intended for the children's institutions
and children's playgrounds, which is 25.3 sq. m. per one child. The area of parking, which is
16,6 sq. m. per capita, is the second one. The third is the area of sidewalks – 12.6 sq. m. per
capita. The provision of green spaces is 6 sq. m. per capita which exactly corresponds to the
norm of gardening of residential areas according to (Минрегион России, 2011), however
the total amount of green space is 13% which less than required 25%.
The sidewalks area is 28% of the territory. The Spacemate analysis shows that the index of
spaciousness is more than 1, indicated a low pedestrian load on open spaces. Taking into
account this fact we can conclude that more than a quarter of pedestrian areas occupied by
pavements with separating lawns can be reduced and redistributed in favor of green spaces.
Parking lots and driveways occupy 37%, which is almost equal to the maximum limit
allocated to the network space, which also includes the sidewalks. From this, we can take
two conclusions: or all required parking lots can not be placed in the street area and
additional underground or off-steet lots will be required, or the number of parking lots in the
given territory is redundant, which is confirmed by the calculation of parking needs. In
general, this analysis confirms the results of the Spacemate analysis about of low land use
intensity of the site.

CASE STUDY 103
parking
The most part of parking space is on-street lots. One quarter of parking lots situated on the inner block courts. Calculations of the minimum parking needs show an excess of 595 parking lots.
Distribution of parking area per capita, m2
82760 m2/4985inh=16,6m2 Required number of parking spaces 982m2/100m2*3lots=30 lots for visitors 2442dwelings*1 lots=2442 lots for residents In total 2472 lots, 87lots/ha Actual number of parking spaces 82760m2/27m2 =3065 - street lots 0 underground lots In total 3065 lots, 108lots/ha Distribution of parking lots In total + 593 lots
children's playgrounds
The playgrounds are situated in the middle of residential courts. Some playground also include sport equipment. The territory is surrounded by parking lots of residents. Despite the fact that the yards are closed for transit traffic of vehicles, this arrangement of playgrounds is not safe for children. The area includes the poor area of lawns and young plantation.
Distribution of playgrounds for one child, m2 7290/4985*3=4,4m2/child

104 SLAVYANKA
sports area
In the center of the microrayon is located the school stadium with dimensions of 100x70m. The structure includes a football field, basketball and volleyball courts, a field for mini-football, treadmills and strength training zone. However the area is closed for free use of resident. Some types of sport equipment are in the playgrounds in residential courts, but there are no special sports grounds. Despite the fact that the indicators of the provision of sports grounds are among the highest, but residents do not have access to sports grounds in general. Distribution of sports area per capita, m2 8770m2/4985inh=1,8m2/inh
kindergartens and schools area
The area of children’s institutions as usual is situated in the center of microrayon and occupied 15% of territory. It is a common figures, but the distribution of this area for one child is excessively high, this is due to low land use intensity of the site.
Distribution of kindergartens and schools area for one child, m2
34400m2/4985inh*3=20,7m2/child

CASE STUDY 105
green area
The green area is represented by green stripes separating the residential area from the highway “Kolpinskoe shosse”. This area cannot be used as recreation area for residents. Also at this zone was attributed the green zone adjacent to the circular intersection. However, this zone was reserved for the construction of a shopping center. Different parts of the greenery that not counted as part of this zone are on playgrounds, in childcare facilities and on sidewalks zone. Despite the fact that the number of green plantations corresponds to the Russian norms for gardening, but the quality of design solutions such that most of green area will either be trampled down or landscapically non attractive.
Distribution of green area per capita, m2
24550m2/6050inh=6,0m2
sidewalks The sidewalks are quite wide strips along the main thoroughfares. This zone also includes lawns located along the perimeter of residential buildings, which separates the facades from the pedestrian flow. There are benches along the sidewalks, but there are no any attractors on the way, except of people and cars passing by. The combination of high distribution by sidewalks with low population density confirms the results of Spacemate analysis about of inefficient land use. Distribution of sidewalks per capita, m2
19870m2/6050inh=12,6m 2/inh

106 SLAVYANKA BLOCK PATTERN ANALYSIS
Size ranges and archetypes of block units
Figure 5. STRUCTURAL FABRIC AXES
The urban fabric model is an orthogonal grid with cells 125x125, 125x185, meters.
The small size blocks are prevalent on the fabric. Three fabric units are representing medium
size residential blocks. One unit which occupied of schools territory is a large size block.
A detailed analysis of 15 residential islands showed that most of them (53.5%) have been
designed as a block type with parts of the perimeter of the block left open. One unit is
designed as semi-open block. Two blocks are represented by a street type, hybrid
street/point and point type. The 2 fabric units of schools and kindergartens can be attributed
to pavilion (point) type. Thus, we can conclude that in this sample the fabric units are
represented by all types of block.

CASE STUDY 107 Figure 6. PATTERN OF FABRIC UNITS
Figure 7. BLOCK SIZE RANGES
Figure 8. ARCHETYPES OF RESIDENTIAL ISLANDS

108 SLAVYANKA Analysis of block margins
Analysis of block units showed that the ground floors are completely devoid of service and commercial functions, so despite the fact that residential blocks formed clear street structure with good sidewalks and parking lots along them, however street fronts are inactive. Only the windows of the apartments go to the street. Thus, this project does not use the positive aspectss of the mid-rise block typology and the commercial street fronts has not been formed. There is only one entrance from Polotskaya ulitsa, organized in the premises of the former apartment, bought out for the organization of a children's center. Based on the figure of total area population, we can conclude that for one commercial entrance there is a stream of 4985 residents.

CASE STUDY 109
total built edges extension: 4420m total open edges extension: 800 m
extension active edges: 0 m
Good Quality – 0%
extension friendly edges: 0 m
extension mix edges: 0 m
Average Quality -2.4%
extension dumb edges: 110 m
extension inactive edges: 3300 m
Poor Quality – 97,6%
extension fenced edges: 1010 m
IN total 1 entrances 4985inh/ent
Figure 9.

110 SLAVYANKA STREET NETWORK ANALYSIS
Structure of street layout
According planning project of «Nevskaya Logistica» LTD, borders of the microrayon are represented by main artery – Kolpinskoe shosse and ulitsa Polotskaya; main district street ulitsa Rostovskaya; residential street ulitsa Galitskaya; and local passages. At the moment Ulitsa Polotskaya can not be considered as main magistral’ artery because it is a dead-end street. The traffic capacity of the main district street ulitsa Rostovskaya is no different from the capacity of the residential street ulitsa Galitskaya. Despite the different profile width, they have the same width of the carriageway
Figure 10. THE SCHEME OF THE MICRORAYONS NETWORK STRUCTURE
Figure 11. Layout of district street structure. Actual situation according to data Yandex.map 18/02/2017

CASE STUDY 111 Connectivity of microrayon network
The layout of the microrayon is characterized by good organization of street structure. Residential blocks are formed rectangular street grid. There are only some cul-de-sacs for entrance on the area of inner courtyard. Internal driveway network is connected with with neighboring territories from free parts except of Kolpinskoe shosse. Almost all internal streets are connected with the main roads, there are many intersections in the territory of the microrayon. However, on the main streets there are only three intermediate intersections. Therefore, despite the fact that this example has the best indicator of connectivity with neighboring territories, but it is only 30%.
Table 2. INDICATORS OF CONNECTIVITY OF MICRORAYON NETWORK
Land area, ha 28.4ha Graphical representation of CSCIM
CSCIM - Composite Street Connectivity Index of Microrayon 0.30
1. DR (Network Density), m/ha 220
2. DI (Intersection density) 1.25
3. TR (Index permeability of network) 0.98
4. IC ext (Connectivity with main streets) 0.42
5. INC (Connectivity with neighboring area) 0.54

112 SLAVYANKA Internal microrayon network analysis
The structure of the internal transport and pedestrian routes of the micro is formed in the
form of traditional streets - passages limited by sidewalks that go along the perimeter of
residential blocks. Driveways and sidewalk are good connected. Residential blocks are
permeable for pedestrian because some part of perimeters are disconnected for
organization additional pedestrian routs.
Table 3. INDICATORS OF INTERNAL MICRORAYON NETWORK
Area NT, ha 27,5
INDICATORS OF DRIVEWAY NETWORK INDICATORS OF PEDESTRIAN NETWORK
LR (Total driveway network length),m 6810 LR(P) (Total pedestrian network length),m 12645
DR (Driveway network density ) m/ha 248 DR(P) (Pedestrian network density) m/ha 459
LRC (Length of connected driveways), m 4508 LRC(P) (Length of connected routs), m 10905
TR (Driveway network permeability) % 66 TR(P) (Pedestrian network permeability), % 86,2

CASE STUDY 113 Figure 12. SCHEME OF DRIVEWAYS AND PEDESTRIAN NETWORK
Figure 13. SCHEME OF PEDESTRIAN NETWORK
Figure 14. SCHEME OF DRIVEWAYS NETWORK
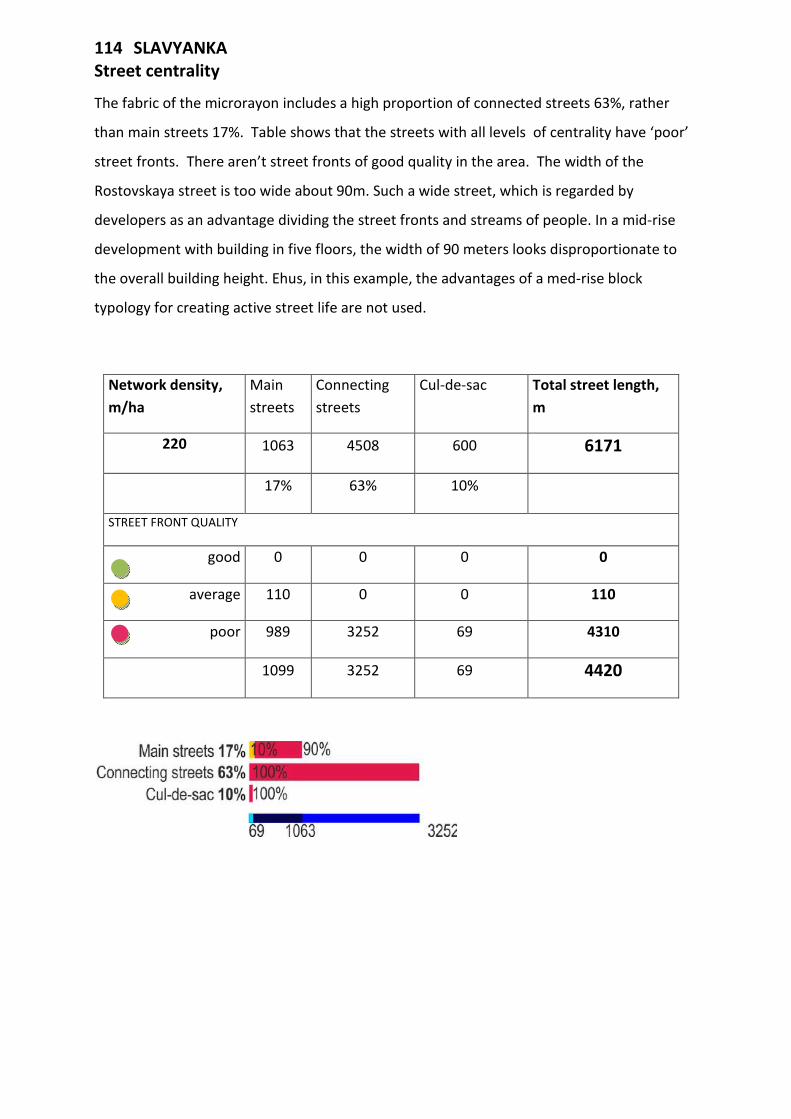
114 SLAVYANKA Street centrality
The fabric of the microrayon includes a high proportion of connected streets 63%, rather
than main streets 17%. Table shows that the streets with all levels of centrality have ‘poor’
street fronts. There aren’t street fronts of good quality in the area. The width of the
Rostovskaya street is too wide about 90m. Such a wide street, which is regarded by
developers as an advantage dividing the street fronts and streams of people. In a mid-rise
development with building in five floors, the width of 90 meters looks disproportionate to
the overall building height. Еhus, in this example, the advantages of a med-rise block
typology for creating active street life are not used.
Network density, m/ha
Main streets
Connecting streets
Cul-de-sac Total street length, m
220 1063 4508 600 6171
17% 63% 10%
STREET FRONT QUALITY
good 0 0 0 0
average 110 0 0 110
poor 989 3252 69 4310
1099 3252 69 4420

CASE STUDY 115 Figure 15. Main urban artery (magistral’) - Kolpinskoe Shosse
Figure 16. Main district street (district magistral’) - ulitsa Rostovskaya

116 SLAVYANKA Figure 17. Main district street (district magistral’) - ulitsa Polotskaya
Figure 18. Residential - ulitsa Galitskaya
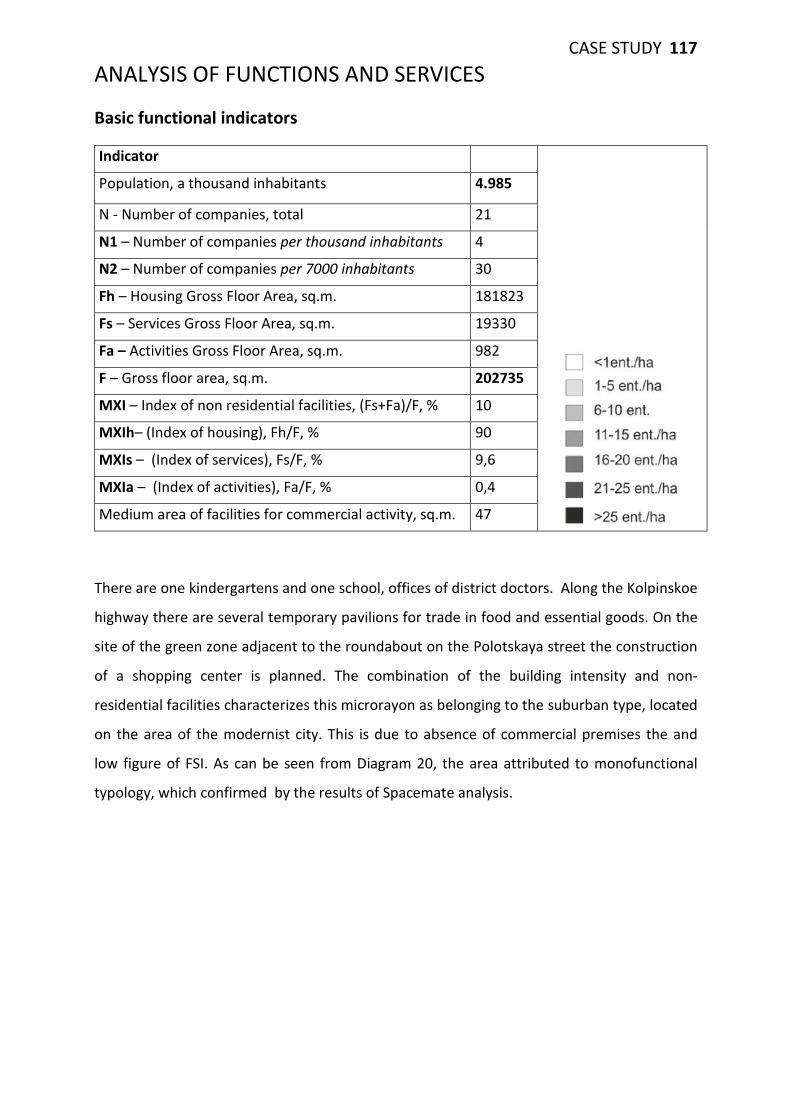
CASE STUDY 117 ANALYSIS OF FUNCTIONS AND SERVICES
Basic functional indicators
Indicator
Population, a thousand inhabitants 4.985
N - Number of companies, total 21
N1 – Number of companies per thousand inhabitants 4
N2 – Number of companies per 7000 inhabitants 30
Fh – Housing Gross Floor Area, sq.m. 181823
Fs – Services Gross Floor Area, sq.m. 19330
Fa – Activities Gross Floor Area, sq.m. 982
F – Gross floor area, sq.m. 202735
MXI – Index of non residential facilities, (Fs+Fa)/F, % 10
MXIh– (Index of housing), Fh/F, % 90
MXIs – (Index of services), Fs/F, % 9,6
MXIa – (Index of activities), Fa/F, % 0,4
Medium area of facilities for commercial activity, sq.m. 47
There are one kindergartens and one school, offices of district doctors. Along the Kolpinskoe
highway there are several temporary pavilions for trade in food and essential goods. On the
site of the green zone adjacent to the roundabout on the Polotskaya street the construction
of a shopping center is planned. The combination of the building intensity and non-
residential facilities characterizes this microrayon as belonging to the suburban type, located
on the area of the modernist city. This is due to absence of commercial premises the and
low figure of FSI. As can be seen from Diagram 20, the area attributed to monofunctional
typology, which confirmed by the results of Spacemate analysis.

118 SLAVYANKA Figure 19. Scheme of number of registered companies and the distribution of public services.
Figure 20. The character of urban districts according FSI-MXI indexes combination.
Figure 21. FSI- MXI Ternary diagram: monofunctional, bifunctional, mixed

5. SEVRERNAYA DOLINA. SAINT PETERSBURG

SEVRERNAYA DOLINA. SAINT PETERSBURG

CASE STUDY 121
SEVERNAYA DOLINA
district introduction Saint Petersburg location
design 2008-2017 construction 2009-2021
terms of realization
LLC “GlavStroySPB” Architectural Bureau GS (Russia)
project group
LLC “GlavStroySPB” promoters and developers Land area: 270 ha
Population: 80000 inh
Population density: 296 inh/ha
Gross floor area (F): 3075000 m2
dimensional data

122 SEVERNAYA DOLINA
Integrated development progect “SEVERNAYA DOLINA” is a new residential area in the north of St. Petersburg (Vyborg district), located near the metro station Parnas.
The land plot is located in the north of the city, on its periphery. The plot is separated from the residential areas of the city by a railway track. The peculiarities of the location of the object are: a) located near by actively developing industrial zone "Parnas", b) located near the St. Petersburg Ring Road and the main exit roads of the city (Vyborg Highway and the future Novopriozerskoe Highway), c) located on the border with Shuvalovsky Park, d) located New metro station "Parnas". In accordance with the General Plan of St. Petersburg, the district will be built up by multi-storey residential development.
SOCIAL INFRASTRUCTURE AND PUBLIC SERVICES
Within the framework of the project it is planned to build the following facilities:
General schools with at least 9210 places in the microrayons of 15, 19, 20, 21, 22; Children's preschool general educational establishments not less than 2801 places in the microrayons of 13, 15, 19, 20, 21, 22; School of arts (aesthetic education) for 640 places in the 13th microrayon; Polyclinics for adults for 960 visits per shift in the 13th microrayon; Polyclinics for children at 384 visits per shift in the 13th microrayon; Emergency and emergency medical care for 8 ambulances in the 13th microrayon; Market complex of 1920 sq.m. The sales area in the 14th microrayon; Clubs for 2560 visitors in the 14th microrayon and for 700 visitors in the block 7b-2; Cinemas for 250 seats, shopping and entertainment complexes in the 14th microrayon; Baths for 400 beds in the block 6b; Laundry facilities for 8000 kg of laundry per shift in block 6b; Dry cleaning for 560 kg of laundry per shift in block 6b; Gyms for 4 800 square meters. Floor in the block 7b-2; Swimming pools for 1280 m² of water in the block 7b-2. ARCHITECTURAL AND DESIGN CONCEPT Da scrivere Figure 1

CASE STUDY 123
"Severnaya Dolina" will be home to 80 thousand people. Commercial Director of LLC "Glavstroy-SPb" Alexei Gusev. (Гусев, 2014)
"Severnaya Dolina" is one of the largest integrated development projects in St. Petersburg. At 2.7 million square meters will be inhabited about 80 thousand people - the same population has the Italian city of Pisa or the famous Luxembourg.
This is a large-scale project, united by one idea - the formation of a new comfortable living environment for the modern Petersburger and his family. Over the embodiment of this idea works a large number of company specialists in various fields. Each decision - architectural, engineering, planning - is weighed and taken in consideration of the interests of future residents. We are building a new modern district of the city from scratch. The company conducts complex landscaping, deals with engineering issues and infrastructure development (cozy yards, playgrounds and recreation areas, 13 kindergartens, 10 schools, shopping and entertainment and sports facilities, a church), builds intra-quarter roads for residents. We create the necessary level of comfort and safety.
If we talk about the architecture of the project, the architectural and planning solutions of the complex are realized by the own architectural bureau of Glavstroy-SPb. Each building is designed according to an individual project, but the entire complex has a unified recognizable style of the "Severnaya Dolina". The roof of underground parking is decorated with elements of Greek architecture - gazebos, antique columns, balls. The design solution for the design of common areas corresponds to a higher category of housing than the economy class.
The layout of the apartments is functional and thought out to the smallest detail, allowing to effectively use every square meter of the area. Engineering systems, communications, building materials, technical equipment - all meet high standards. Therefore, I am sure that for St. Petersburg "North Valley" is a unique project, unlike other residential complexes.

124 SEVERNAYA DOLINA
Figure 2. MICRORAYON POSITION IN THE DISTRICT STRUCTURE. Actual situation according to data Yandex.map 18/02/2017

CASE STUDY 125
MICRORAYON ANALYSIS
Microrayon 15 Currently on the territory of integrated development have been implemented microrayon №15, which is chosen as an object of study. The site is inscribed in a rectangle of 980x730 meters, however it has an irregular shape which is defined by the cadastral parcel boundaries. The area share borders with: the abandoned low-rise development and project park area in the north-west, the job site second stage of development in the north-east, the public business development in the south-east, the service area of the terminal metro station in the south-west. dimensional data1 land area
footprint
gross floor area
population
population density
dwelling density
medium area of dwelling
52,8ha
73611 m2
1035510 m2
23340 inh
442 inh/ha
261 dw/ha
51m2
Figure 3.
1 https://sevdol.ru/ 15/05/2017

126 SEVERNAYA DOLINA
LAND USE INTENSITY AND URBANITY
Spacemate analysis
Table 1. INDEX OF LAND USE INTENSITY
FSI - Building Intensity 1.96
GSI - Coverage 0.139
OSR - Spaciousness 0.44
L - Building height 14.1
The pattern of microrayon is formed by open plan modernist blocks. Building intensity
(FSI) has dramatically increased under of economic pressure of free market and the value
reached almost 20000 m2 / ha.
Spacemate Graph 1 showed that form of urban fabric can be attributed to hybrid
point/street high rise type. Spacemate graph 2 demonstrates that the urban fabric is
skipped from ‘towers in the park’ to highly urban typology, which can explained by fact of
increasing of medium building height to the 14storey’s.
According to Spacemate grath3, the fabric of this microrayon can not be classified as
urban mix. Analysis of land use intensity of the microrayon shows that the building
intensity index is 4.5 times larger than spaciousness, which indicates a rather serious load
on the open spaces of the microrayon, in comparison with the Soviet period, when OSR
coefficient was greater than 1. At the same time, this is a favorable factor for shaping the
intensity of urban life and the development of private business, because it is create a
potential for a sufficient consumers flow. However the GSI index has not reached the rate
of 20% which is a reference quantity for urbanity performance.

CASE STUDY 127
Spacemate graph 1. BUILDING TYPES ON THE SCALE OF THE FABRIC
Spacemate graph 2. TYPE OF LIVING ENVIRONMENTS
Spacemate graph 3. TYPE OF LIVING ENVIRONMENTS . Level of functional mix

128 SEVERNAYA DOLINA
Analysis building height structure
Analysis of footprint ratio showed that 63% of coverage is built up with extra high-rise
buildings of 25 storey’s, which cannot be attributed to liveable environment. Distribution
of building mass is the same as in Soviet microrayons: the low rise buildings of children
institutions are situated in the center of the microrayon, high rise buildings are along the
magistral' streets. There are some low rise public buildings of retail facilities along the
main district magistral’ ulitsa Fyodora Abramova. Thus, the building height structure is
very contrasting.
Figure 4. FOOTPRINT RATIO ACCORDING NUMBER OF STOREYS’

CASE STUDY 129
Open space ratio
gross plan area 52,8 ha
net plan area 50,7 ha footprint area 8,39ha OPEN SPACE AREA: 423100 m2 - parking 148900 m2 - children's playgrounds 2750 m2 - sports area 14350 m2 - kindergartens and schools
area 88000 m2
- green area 76040 m2 - sidewalks 93060 m2

130 SEVERNAYA DOLINA
An analysis of the distribution of open spaces showed that 64% refer to public space,
which consists of three parts, parking and driveways, sidewalks and green areas. Also
there are playgrounds, however their share is insignificant and makes only 0,6% of all
open spaces. For the most part, almost half are occupied by parking lots. Sidewalks
(16,2%) and lawns (18%) are distributed in almost equal proportions. The children's
institutions occupy one fifth of the entire territory of the microrayon. The internal block
area attributed at public and semipublic space because it open for all visitors and the
boundaries of this space are poorly articulated and practically inseparable from the public
area. Most of the semipublic spaces are occupied by children's institutions with sports
area (24,3%) and almost in equal proportions by passages with parking lots (6,3%) each
and sidewalks (5,9%).
The greatest provision of spaces is intended for the children's institutions, which is 11,3
sq. m. per one child. This is almost twice the area occupied by parking lots and driveway,
which is 6,4 sq. m. per capita. However, the provision of microrayon with playgrounds is
very small - only 0.35 sq. m. per one child. Green spaces and sidewalks are divided almost
in equal proportions of 3,25 sq. m. and 4,0 sq. m. per capita, respectively. Sports grounds
occupy 0,6 sq. m. per capita.
Parking lots and driveways occupy 35% of the territory, and together with the sidewalks consist more than half of the territory (57%).
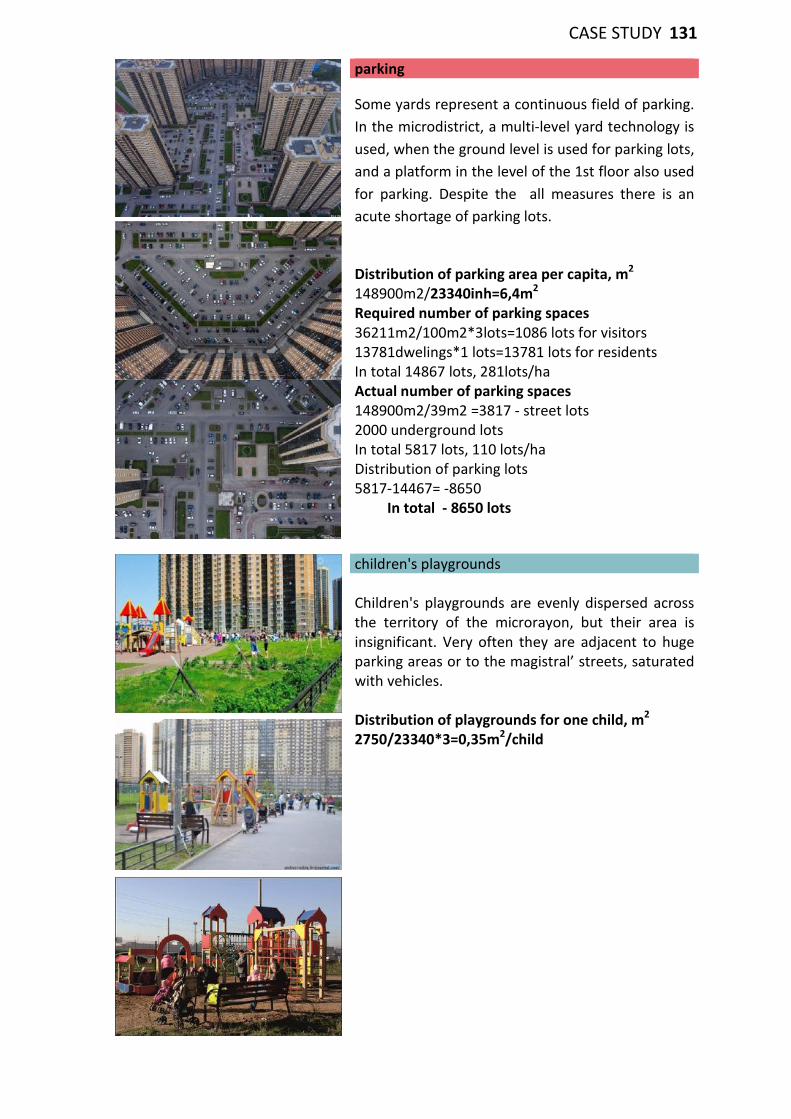
CASE STUDY 131
parking
Some yards represent a continuous field of parking. In the microdistrict, a multi-level yard technology is used, when the ground level is used for parking lots, and a platform in the level of the 1st floor also used for parking. Despite the all measures there is an acute shortage of parking lots.
Distribution of parking area per capita, m2
148900m2/23340inh=6,4m2 Required number of parking spaces 36211m2/100m2*3lots=1086 lots for visitors 13781dwelings*1 lots=13781 lots for residents In total 14867 lots, 281lots/ha Actual number of parking spaces 148900m2/39m2 =3817 - street lots 2000 underground lots In total 5817 lots, 110 lots/ha Distribution of parking lots 5817-14467= -8650 In total - 8650 lots
children's playgrounds
Сhildren's playgrounds are evenly dispersed across the territory of the microrayon, but their area is insignificant. Very often they are adjacent to huge parking areas or to the magistral’ streets, saturated with vehicles. Distribution of playgrounds for one child, m2 2750/23340*3=0,35m2/child

132 SEVERNAYA DOLINA
sports area Sports area is represented only by a school stadium with several types of sports grounds and running tracks. In contrast to many other new microrayons, the school stadium is open for visits by residents. Distribution of sports area per capita, m2 8770m2/4985inh=0,6m2/inh
kindergartens and schools area Children's institutions are located as usual in the center of the microrayon and occupy a very large territory, included a school yard with green spaces. Distribution of kindergartens and schools area for one child, m2
34400m2/4985inh*3=11,3m2/child

CASE STUDY 133
green area
The green area is represented by green stripes separating the residential area from the magistral’ streets, which cannot be used as recreation area for residents. Also at this zone was attributed the green pedestrian lawns of infra microrayon territory. The lawns are located in places free from parking lots and often in the area of sidewalk. As the practice of the Soviet period shows, the placement of lawns in the sidewalk zone leads to their trampling and to the soil ablation into the sidewalks, which leads to their contamination. Therefore, to protect against trampling and the cars parking, lawns are protected by fences.
Distribution of green area per capita, m2
24550m2/6050inh=3,25m2
sidewalks
This zone includes the sidewalks around residential building which have not entered the surface of other zones. In their area are also included lawns around residential buildings, that violates the interaction between the building and the street. Distribution of sidewalks per capita, m2
19870m2/6050inh=4,0m 2/inh
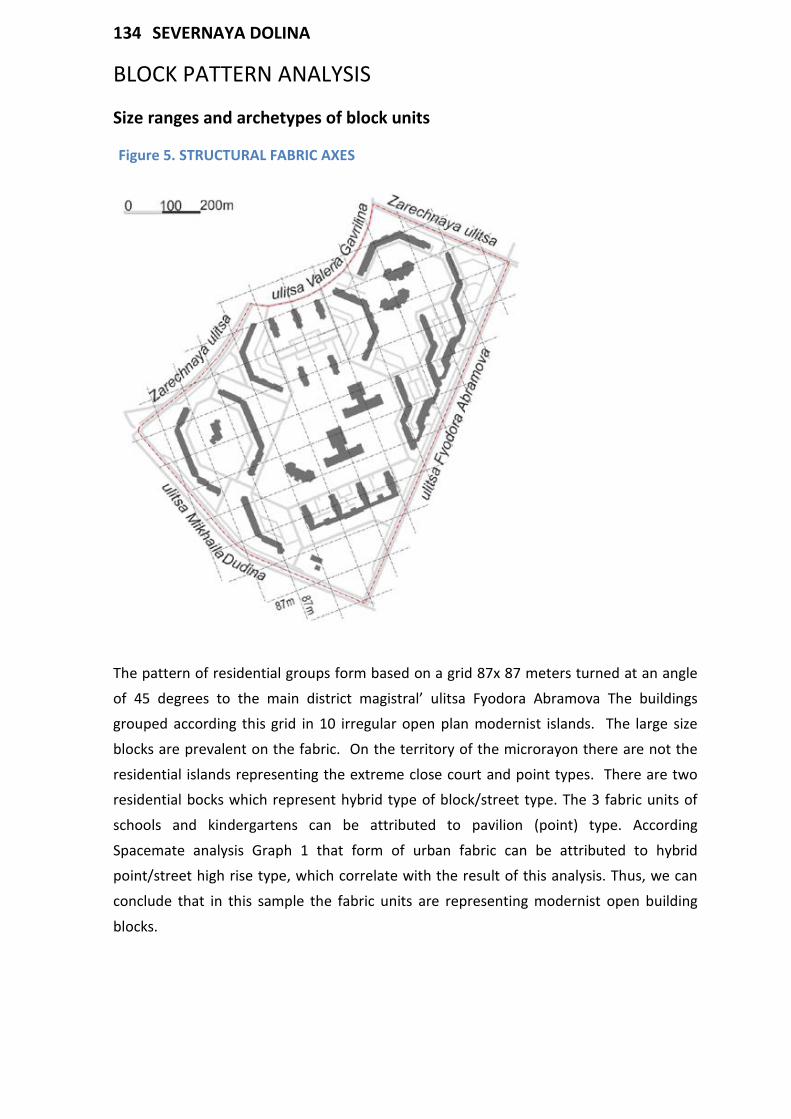
134 SEVERNAYA DOLINA
BLOCK PATTERN ANALYSIS
Size ranges and archetypes of block units
Figure 5. STRUCTURAL FABRIC AXES
The pattern of residential groups form based on a grid 87x 87 meters turned at an angle of 45 degrees to the main district magistral’ ulitsa Fyodora Abramova The buildings grouped according this grid in 10 irregular open plan modernist islands. The large size blocks are prevalent on the fabric. On the territory of the microrayon there are not the residential islands representing the extreme close court and point types. There are two residential bocks which represent hybrid type of block/street type. The 3 fabric units of schools and kindergartens can be attributed to pavilion (point) type. According Spacemate analysis Graph 1 that form of urban fabric can be attributed to hybrid point/street high rise type, which correlate with the result of this analysis. Thus, we can conclude that in this sample the fabric units are representing modernist open building blocks.

CASE STUDY 135
Figure 6. STRUCTURE OF FABRIC UNITS
Figure 7. BLOCK SIZE RANGES
Figure 8. ARCHETYPES OF RESIDENTIAL ISLANDS

136 SEVERNAYA DOLINA
analysis of block margins
Analysis of block units showed that most of them are the modern open building block. In
this cases when the blocks not formed the street line we have analyzed the edges of
buildings. Analysis showed that the most of building facades can be characterized as
inactive edges (43%). Fenced margins are represented by 31% of total built edges. Some
residential blocks with two-level courtyards2 are assigned to fenced areas. On the
territory of the microrayon there’re not buildings with active and friendly margins. Some
residential blocks . Total numbers of commercial entrances are 139 units. Based on the
figure of total area population, we can conclude that for one commercial entrance there
is a stream of 166 residents.
2 The ground level is used as parking area, the second level for the placement of playgrounds and parking of residents

CASE STUDY 137
total built edges extension: 7160 m total open edges extension: 710m
extension active edges: 0 m
Good Quality – 0%
extension friendly edges: 0 m
extension mix edges: 455 m
Average Quality -48,4%
extension dumb edges: 3360 m
extension inactive edges: 895 m
Poor Quality – 42,5%
extension fenced edges: 2450 m
IN total 139entrances 168 inh/ha

138 SEVERNAYA DOLINA
STREET NETWORK ANALYSIS
Structure of street layout
Ulitsa Fyodora Abramova, Ulitsa Nicolaya Rubtsova and ulitsa Mikhaila Dudina refer to main district magistral' with bus stops, pedestrian crossings, traffic lights. Street Valeria Gavrilina is local street. The section of ulitsa Zarechnaya passing from the western side of the microrayon should become part of the main urban magistral' linking the area with Vyborgsky highway and the Engels prospect. Internal network of microrayon is represented by local driveways. There are some cul-de-sacs on the area.

CASE STUDY 139
Connectivity of microrayon network
The layout of the microrayon is characterized by isolation from the surrounding urban fabric. Microrayon is surrounded by magistral’ streets that deprives it of solutions of continuity between exterior and interior. There is not a single crossing between the main intersections of magistral’ streets, which would link the tissue of the microrayon with neighboring territories. The urban layout recalls some principles of modernist development: the wide magistral’ street are intended for vehicles movement and internal network is represented by system of local passages. However, despite the fact that, unlike the Soviet microrayons, the majority of local driveways are permeable, the Composite Street Connectivity Index of Microrayon that is critically low and is only 5%.
Table1. INDICATORS OF CONNECTIVITY OF MICRORAYON NETWORK
Land area, ha 52.8 Graphical representation of CSCIM
CSCIM - Composite Street Connectivity Index of Microrayon 0.05
1. DR (Network Density), m/ha 210
2. DI (Intersection density) 0.59
3. TR (Index permeability of network) 0.74
4. IC ext (Connectivity with main streets) 0.39
5. INC (Connectivity with neighboring area) 0.27

140 SEVERNAYA DOLINA
Internal microrayon network analysis
The internal transport network of the microrayon is represented by local driveways,
which are intended for access to residential courts and public buildings of the microrayon.
The 86% of pedestrian routs and 70% driveways are permeable. However, the density of
network is not high because the fabric consist of large size open plan residential units.
The internal driveways coincides with pedestrian ways, however internal network does
not form street structure. Thus, it can be said that the system of internal networks is
conceived in the concept of the traditional Soviet microrayon, but with the only
difference is that most of the driveways are not cul-de-sacs. Despite the high percentage
of permeable passages and pedestrian paths, many sites of the microrayon are isolated
from each other both in pedestrian and transport modes, due to the present of large size
blocks in the center of territory.
Table 2. INDICATORS OF INTERNAL MICRORAYON NETWORK
Area NT, ha 50.7
INDICATORS OF DRIVEWAY NETWORK INDICATORS OF PEDESTRIAN NETWORK
LR (Total driveway network length),m 9561 LR(P) (Total pedestrian network length),m 15050
DR (Driveway network density ) m/ha 189 DR(P) (Pedestrian network density) m/ha 297
LRC (Length of connected driveways), m 6686 LRC(P) (Length of connected routs), m 12995
TR (Driveway network permeability) % 70 TR(P) (Pedestrian network permeability), % 86

CASE STUDY 141
Figure 9. SCHEME OF DRIVEWAYS AND PEDESTRIAN NETWORK
Figure 10. SCHEME OF PEDESTRIAN NETWORK
Figure 11. SCHEME OF DRIVEWAYS NETWORK
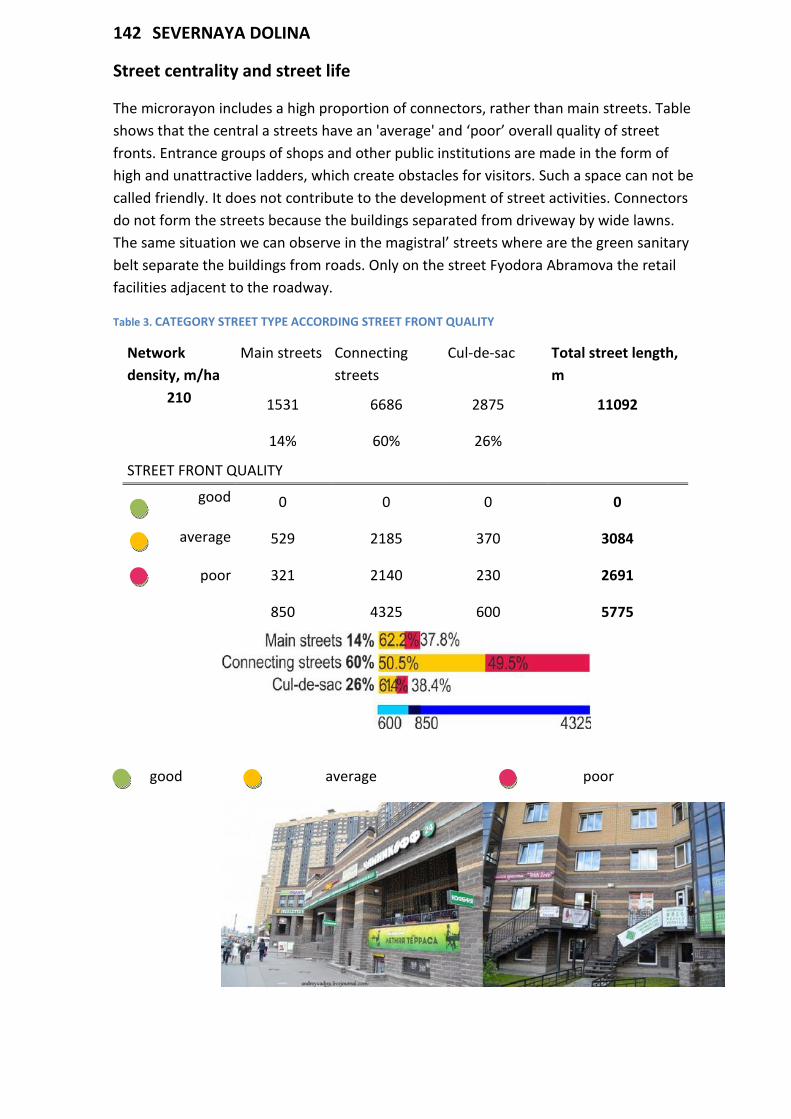
142 SEVERNAYA DOLINA
Street centrality and street life
The microrayon includes a high proportion of connectors, rather than main streets. Table shows that the central a streets have an 'average' and ‘poor’ overall quality of street fronts. Entrance groups of shops and other public institutions are made in the form of high and unattractive ladders, which create obstacles for visitors. Such a space can not be called friendly. It does not contribute to the development of street activities. Connectors do not form the streets because the buildings separated from driveway by wide lawns. The same situation we can observe in the magistral’ streets where are the green sanitary belt separate the buildings from roads. Only on the street Fyodora Abramova the retail facilities adjacent to the roadway. Table 3. CATEGORY STREET TYPE ACCORDING STREET FRONT QUALITY
Network density, m/ha
Main streets Connecting streets
Cul-de-sac Total street length, m
210 1531 6686 2875 11092
14% 60% 26%
STREET FRONT QUALITY good 0 0 0 0
average 529 2185 370 3084
poor 321 2140 230 2691
850 4325 600 5775
good average poor

CASE STUDY 143
Figure 12. MAIN URBAN MAGISTRAL’ – ULITSA ZERECHNAYA
Figure 13. MAIN DISTRICT MAGISTRAL’ - ULITSA MIKHAILA DUDINA

144 SEVERNAYA DOLINA
FIGURE 14. MAIN DISTRICT MAGISTRAL’ - ULITSA NICOLAYA RUBTSOVA
Figure 15. MAIN DISTRICT MAGISTRAL’ – FYODORA ABRAMOVA

CASE STUDY 145
ANALYSIS OF FUNCTIONS AND SERVICES
Basic functional indicators Indicator
Population, a thousand inhabitants 23. 340
Number of companies, total 326
N1 – Number of companies per thousand inhabitants 14
N2 – Number of companies per 7000 inhabitans 98
Fh – Housing Gross Floor Area, sq.m. 970718
Fs – Services Gross Floor Area, sq.m. 36221
Fa – Activities Gross Floor Area, sq.m. 28571
F – Gross floor area, sq.m. 1035510
MXI – Index of non residential facilities, (Fs+Fa)/F, % 6
MXIh– (Index of housing), Fh/F, % 94
MXIs – (Index of services), Fs/F, % 3,5
MXIa – (Index of activities), Fa/F, % 2,5
Medium area of facilities for commercial activity, sq.m. 88
There are 4 kindergartens and two schools, a, several hypermarkets, cafes, and bank
branches on the territory of the microrayon. As can be seen from the diagram 16, the
greatest concentration of services is observed along the city magistral' street - ulitsa
Fyodora Abramova. The concentration of services decreases towards the center of the
microrayon. In the center are some monofunctional blocks, occupied either by children's
institutions or by residential buildings without non-residential premises. It is here that the
main pedestrian routs, which are absolutely devoid of functional filling. The combination
of the building intensity and non-residential facilities characterizes this microrayon as the
modernist city development. This is due to the increase in and the decrease in the share
of commercial premises. As can be seen from Diagram 21, the area can not be attributed
to the good level of mixitè, but only to monofunctional ones, which confirmed the results
of Spacemate analysis.

146 SEVERNAYA DOLINA
Figure 16. Scheme of number of registered companies and the distribution of public services.
Figure 17. The character of urban districts according FSI-MXI indexes combination.
Figure 18. FSI- MXI Ternary diagram: monofunctional, bifunctional, mixed

LIST OF REFERENCES
www.akademicheskiy.org
https://akademekb.ru/
http://uk-akadem.ru/
http://www.v-p.com/en/projects
http://www.microgorodvlesu.ru/
https://archi.ru/projects/russia/8742/mikrogorod-v-lesu
http://www.speech.su
http://bpearl.net/
http://www.setlcity.ru/projects/builds/live/id85/declarations/
http://oslavyanke.ru/
http://glavstroi-spb.ru/
http://varlamov.ru/
https://andreyvadjra.livejournal.com/
https://gelio.livejournal.com/