the correlation of serum bicarbonate and metabolic
TRANSCRIPT

THE CORRELATION OF SERUM BICARBONATE AND METABOLIC ACIDOSIS TO
ALBUMIN IN HEMODIALYSIS PATIENTS
BY
JENNIFER L. VYDUNA, RD, LD
Submitted to the graduate degree program in Dietetics and Nutrition and the Graduate Faculty of the University of Kansas in partial fulfillment of the
requirements for the degree of Master of Science.
________________________________________
Chairperson Linda D. Griffith, PhD, RD, CNSC
________________________________________
Debra Sullivan, PhD, RD
________________________________________
Susan E. Carlson, PhD
Date Defended: November 27, 2012

ii
The Thesis Committee for Jennifer L. Vyduna, RD, LD certifies that this is the approved version of the following thesis:
THE CORRELATION OF SERUM BICARBONATE AND METABOLIC ACIDOSIS TO
ALBUMIN IN HEMODIALYSIS PATIENTS
________________________________________
Chairperson Linda D. Griffith, PhD, RD, CNSC
________________________________________
Debra Sullivan, PhD, RD
________________________________________
Susan E. Carlson, PhD
Date Approved: November 27, 2012
iii
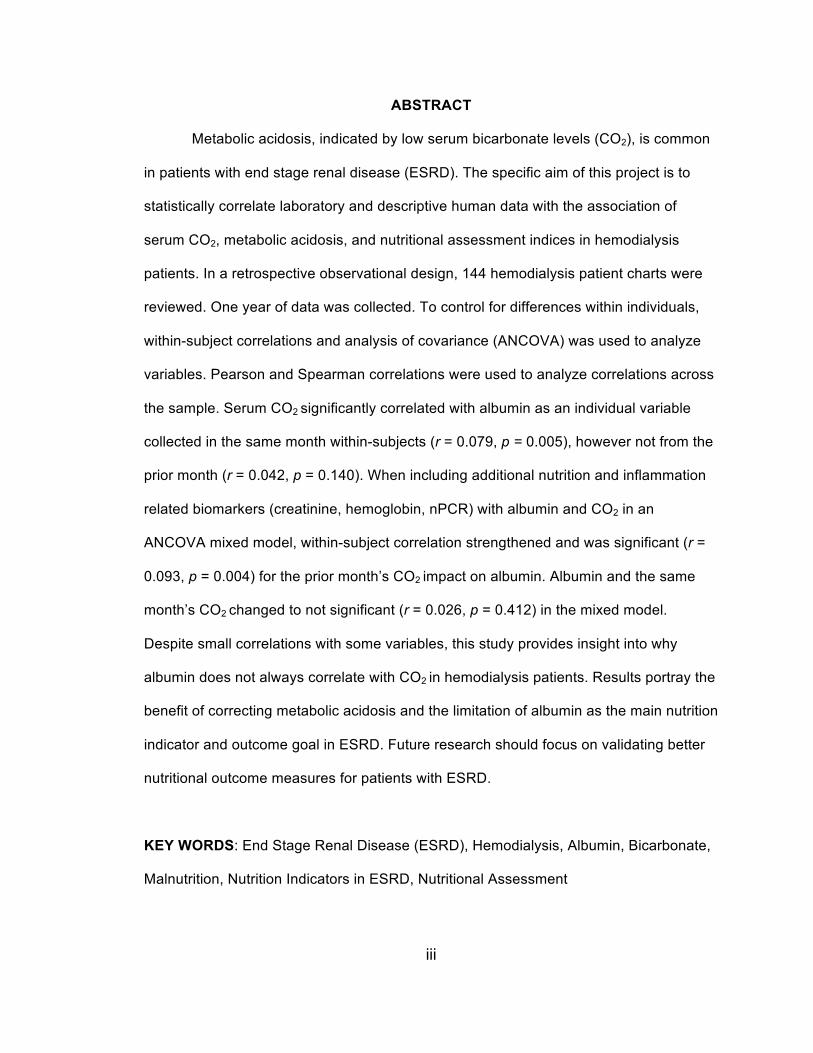
ABSTRACT
Metabolic acidosis, indicated by low serum bicarbonate levels (CO2), is common
in patients with end stage renal disease (ESRD). The specific aim of this project is to
statistically correlate laboratory and descriptive human data with the association of
serum CO2, metabolic acidosis, and nutritional assessment indices in hemodialysis
patients. In a retrospective observational design, 144 hemodialysis patient charts were
reviewed. One year of data was collected. To control for differences within individuals,
within-subject correlations and analysis of covariance (ANCOVA) was used to analyze
variables. Pearson and Spearman correlations were used to analyze correlations across
the sample. Serum CO2 significantly correlated with albumin as an individual variable
collected in the same month within-subjects (r = 0.079, p = 0.005), however not from the
prior month (r = 0.042, p = 0.140). When including additional nutrition and inflammation
related biomarkers (creatinine, hemoglobin, nPCR) with albumin and CO2 in an
ANCOVA mixed model, within-subject correlation strengthened and was significant (r =
0.093, p = 0.004) for the prior month’s CO2 impact on albumin. Albumin and the same
month’s CO2 changed to not significant (r = 0.026, p = 0.412) in the mixed model.
Despite small correlations with some variables, this study provides insight into why
albumin does not always correlate with CO2 in hemodialysis patients. Results portray the
benefit of correcting metabolic acidosis and the limitation of albumin as the main nutrition
indicator and outcome goal in ESRD. Future research should focus on validating better
nutritional outcome measures for patients with ESRD.
KEY WORDS: End Stage Renal Disease (ESRD), Hemodialysis, Albumin, Bicarbonate,
Malnutrition, Nutrition Indicators in ESRD, Nutritional Assessment
iv
Acknowledgements
A sincere thank you to my advisor, Linda Griffith, PhD, RD, CNSC, for her
mentorship, support, and encouragement throughout this project. Thank you to Debra
Sullivan, PhD, RD and Susan E. Carlson, PhD for extending their support and
advisement on important issues throughout this process. I would like to thank Kirk
Finchem, my former Vice President of Clinical Operations at Renal Advantage, Inc. for
his guidance and help in data collection. Thank you to Joyce Jiang, PhD for her
guidance in data analysis. Finally, thank you to my husband Joel Vyduna for his love and
encouragement during my two years at The University of Kansas Medical Center.
v
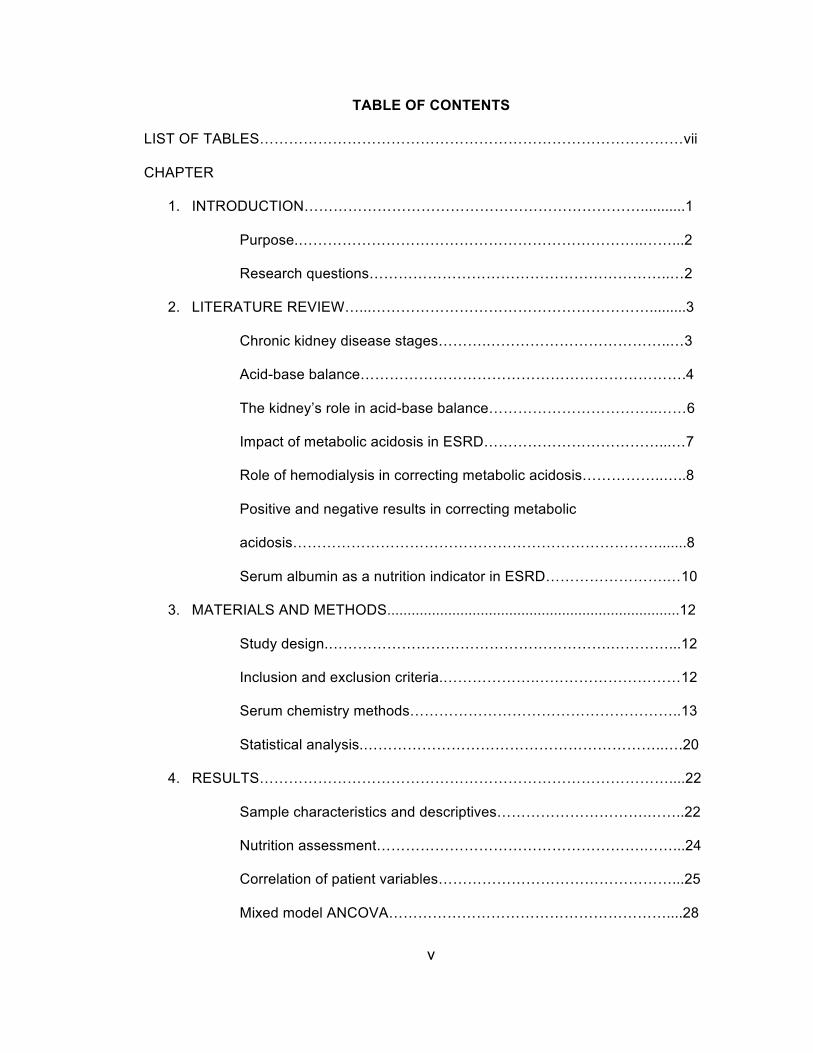
TABLE OF CONTENTS
LIST OF TABLES……………………………………………………………………………vii
CHAPTER
1. INTRODUCTION……………………………………………………………...........1
Purpose.……………………………………………………………..……...2
Research questions……………………………………………………..…2
2. LITERATURE REVIEW…...………………………………………………….........3
Chronic kidney disease stages……….………………………………..…3
Acid-base balance………………………………………………………….4
The kidney’s role in acid-base balance……………………………..……6
Impact of metabolic acidosis in ESRD………………………………...…7
Role of hemodialysis in correcting metabolic acidosis……………..…..8
Positive and negative results in correcting metabolic
acidosis………………………………………………………………….......8
Serum albumin as a nutrition indicator in ESRD…………………….…10
3. MATERIALS AND METHODS........................................................................12
Study design.………………………………………………….…………...12
Inclusion and exclusion criteria.……………….…………………………12
Serum chemistry methods………………………………………………..13
Statistical analysis.……………………………………………………..….20
4. RESULTS…………………………………………………………………………....22
Sample characteristics and descriptives………………………….……..22
Nutrition assessment……………………………………………….……...24
Correlation of patient variables…………………………………………...25
Mixed model ANCOVA…………………………………………………....28
vi
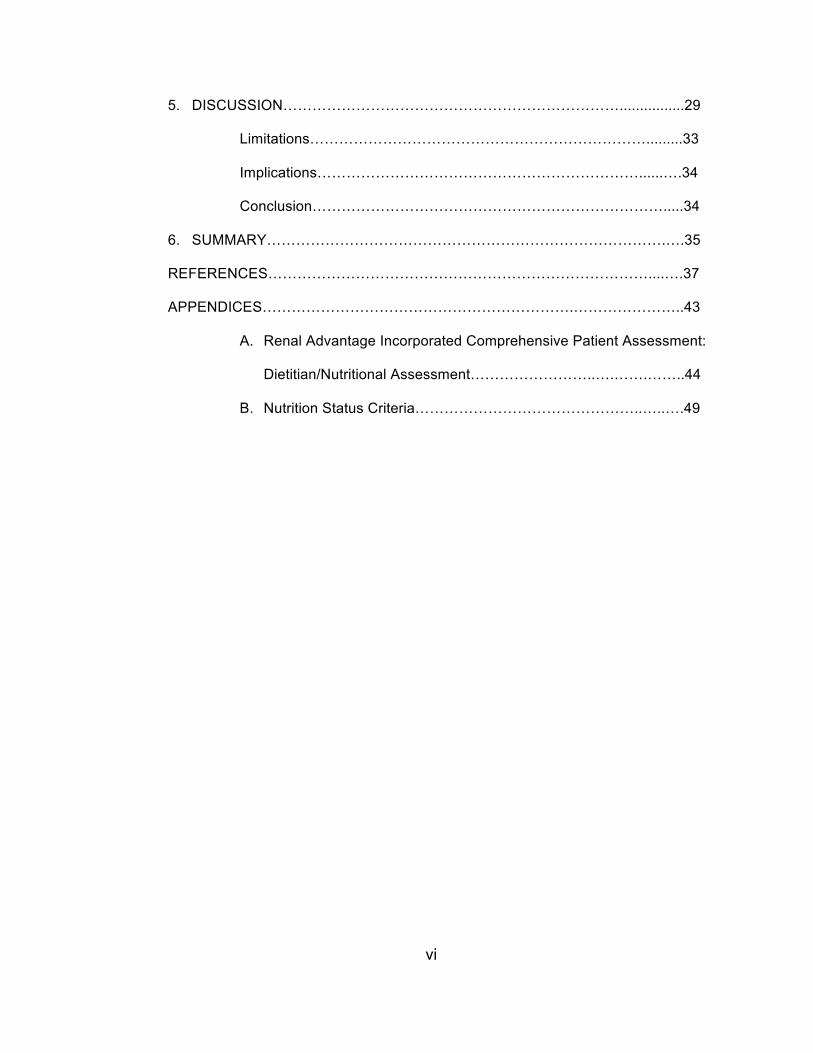
5. DISCUSSION……………………………………………………………................29
Limitations…………………………………………………………….........33
Implications…………………………………………………………......….34
Conclusion……………………………………………………………….....34
6. SUMMARY……………………………………………………………………….….35
REFERENCES……………………………………………………………………....….37
APPENDICES……………………………………………………….…………………..43
A. Renal Advantage Incorporated Comprehensive Patient Assessment:
Dietitian/Nutritional Assessment……………………..….…….……..44
B. Nutrition Status Criteria………………………………………..…..….49

vii
LIST OF TABLES
TABLE
1. Stages of Chronic Kidney Disease
2. Acid-Base Diagnoses
3. Patient Characteristics
4. Patient Laboratory Descriptives
5. Patient Nutrition Status from the Comprehensive Patient Assessment
6. Correlation of Patient Variables with Albumin
7. Correlation of Bicarbonate with Patient Variables
8. Correlation of Prior Month Bicarbonate with Patient Variables
9. Mixed Model ANCOVA
1
CHAPTER 1
INTRODUCTION
Low serum bicarbonate levels are common in individuals with chronic kidney
disease (CKD) (1). According to the National Kidney Foundation’s Kidney Disease
Outcome Quality Indicators (K/DOQI), serum bicarbonate levels should be measured
monthly and maintained > 22 mEq/L. Levels < 22 mEq/L indicate metabolic acidosis (2).
Metabolic acidosis in End Stage Renal Disease (ESRD) is the result of the kidney’s
inability to synthesize ammonia from protein and excrete hydrogen ions (3). Concern
arises when patients with ESRD are not able to maintain acid-base balance due to loss
of kidney function. Negative nutrition outcomes including renal osteodystrophy, protein
catabolism, decreased normalized protein catabolic rate (nPCR), decreased serum
albumin synthesis, and protein energy wasting are observed with metabolic acidosis
during maintenance hemodialysis (3, 4). Maintenance hemodialysis refers to the process
of cleaning water and waste from blood using an artificial kidney or hemodialyzer.
Maintenance hemodialysis can be done at a clinic, referred to as in-center dialysis (5).
For the purpose of this thesis, the term dialysis refers to in-center maintenance
hemodialysis.
There is no one indicator providing a comprehensive assessment of nutritional
status in ESRD (6, 7). Serum albumin is the main nutrition indicator and outcome used in
assessment of ESRD and a measure of the visceral protein pool. The outcome goal for
albumin according to K/DOQI is set at > 4.0 g/dL. Albumin values < 4.0 g/dL are
associated with increased mortality in ESRD on dialysis (6, 8). One disadvantage of
using serum albumin is it’s long half-life of ~ 20 days.
Correcting low serum bicarbonate shows improved serum albumin levels in this
patient population (9). It is hypothesized a low serum bicarbonate, indicating metabolic
2
acidosis, influences albumin and other nutritional assessment indicies in hemodialysis
patients. Nutrition assessment indicies include any of the monthly laboratories,
subjective nutrition status designation, or anthropometrics. With serum albumin’s long
half-life of 20 days, the prior month’s serum bicarbonate level (from ~ 20 days ago)
would likely impact current serum albumin greater than current serum bicarbonate. The
specific aim of this project was to statistically correlate laboratory and descriptive human
data from in-center hemodialysis patients at Renal Advantage Incorporated in Westwood,
KS.
Purpose:
The purpose of this thesis is to:
1) Determine if serum bicarbonate influences albumin and nutrition assessment
indices in hemodialysis patients. Nutrition assessment indicies include any of the
monthly laboratories, subjective nutrition status designation, or anthropometrics.
2) Demonstrate the prior month’s serum bicarbonate level has a greater impact on
current serum albumin versus the current month’s serum bicarbonate in
hemodialysis patients.
Research questions:
1. Are low bicarbonate levels (CO2) associated with low albumin and nutritional
assessment indices in hemodialysis patients? Nutrition assessment indices
include any of the monthly laboratories, subjective nutrition status designation, or
anthropometrics.
2. Is the preceding month’s serum CO2 (from ~ 20 days ago) associated with
current serum albumin levels more than current serum bicarbonate levels?
3
CHAPTER 2
LITERATURE REVIEW
Chronic kidney disease stages
The prevalence of ESRD is rising in the United States. The rate of ESRD cases
was 1,763 per million in 2010, a four percent increase from 2009. At the end of 2010,
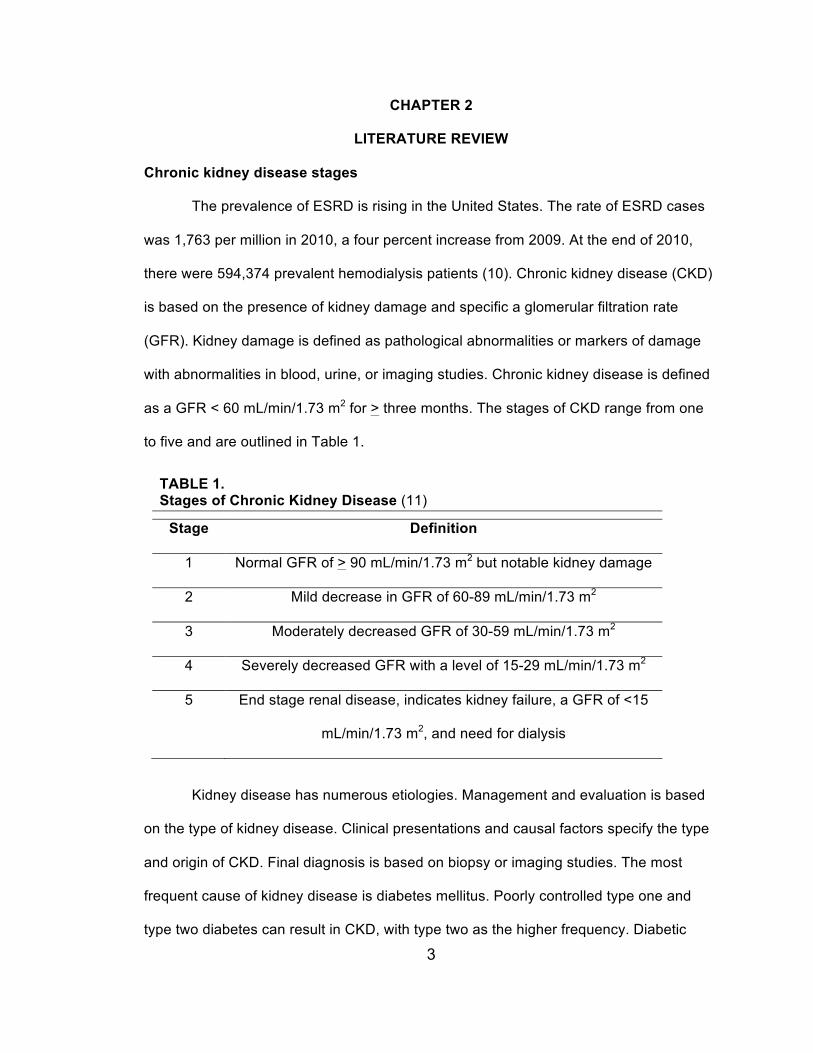
there were 594,374 prevalent hemodialysis patients (10). Chronic kidney disease (CKD)
is based on the presence of kidney damage and specific a glomerular filtration rate
(GFR). Kidney damage is defined as pathological abnormalities or markers of damage
with abnormalities in blood, urine, or imaging studies. Chronic kidney disease is defined
as a GFR < 60 mL/min/1.73 m2 for > three months. The stages of CKD range from one
to five and are outlined in Table 1.
Kidney disease has numerous etiologies. Management and evaluation is based
on the type of kidney disease. Clinical presentations and causal factors specify the type
and origin of CKD. Final diagnosis is based on biopsy or imaging studies. The most
frequent cause of kidney disease is diabetes mellitus. Poorly controlled type one and
type two diabetes can result in CKD, with type two as the higher frequency. Diabetic
TABLE 1. Stages of Chronic Kidney Disease (11)
Stage Definition
1 Normal GFR of > 90 mL/min/1.73 m2 but notable kidney damage
2 Mild decrease in GFR of 60-89 mL/min/1.73 m2
3 Moderately decreased GFR of 30-59 mL/min/1.73 m2
4 Severely decreased GFR with a level of 15-29 mL/min/1.73 m2
5 End stage renal disease, indicates kidney failure, a GFR of <15
mL/min/1.73 m2, and need for dialysis
4
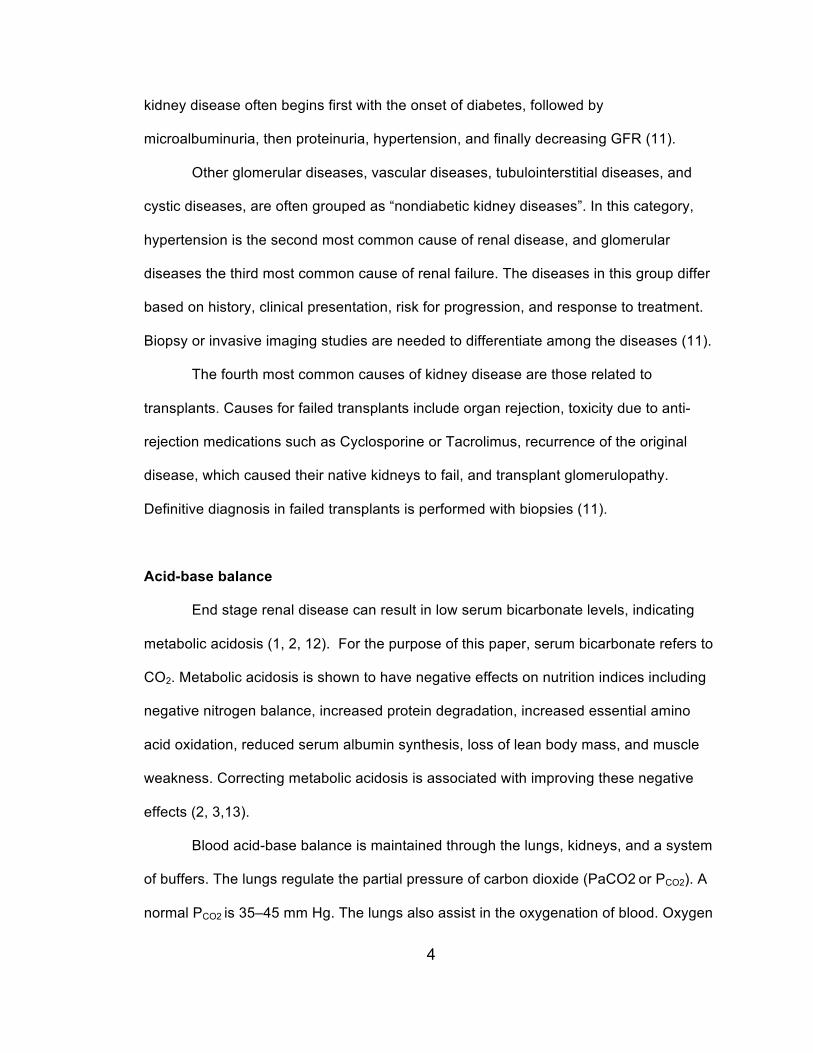
kidney disease often begins first with the onset of diabetes, followed by
microalbuminuria, then proteinuria, hypertension, and finally decreasing GFR (11).
Other glomerular diseases, vascular diseases, tubulointerstitial diseases, and
cystic diseases, are often grouped as “nondiabetic kidney diseases”. In this category,
hypertension is the second most common cause of renal disease, and glomerular
diseases the third most common cause of renal failure. The diseases in this group differ
based on history, clinical presentation, risk for progression, and response to treatment.
Biopsy or invasive imaging studies are needed to differentiate among the diseases (11).
The fourth most common causes of kidney disease are those related to
transplants. Causes for failed transplants include organ rejection, toxicity due to anti-
rejection medications such as Cyclosporine or Tacrolimus, recurrence of the original
disease, which caused their native kidneys to fail, and transplant glomerulopathy.
Definitive diagnosis in failed transplants is performed with biopsies (11).
Acid-base balance
End stage renal disease can result in low serum bicarbonate levels, indicating
metabolic acidosis (1, 2, 12). For the purpose of this paper, serum bicarbonate refers to
CO2. Metabolic acidosis is shown to have negative effects on nutrition indices including
negative nitrogen balance, increased protein degradation, increased essential amino
acid oxidation, reduced serum albumin synthesis, loss of lean body mass, and muscle
weakness. Correcting metabolic acidosis is associated with improving these negative
effects (2, 3,13).
Blood acid-base balance is maintained through the lungs, kidneys, and a system
of buffers. The lungs regulate the partial pressure of carbon dioxide (PaCO2 or PCO2). A
normal PCO2 is 35–45 mm Hg. The lungs also assist in the oxygenation of blood. Oxygen
5
in the arterial blood is present as PaO2, dissolved oxygen and oxygen bound to
hemoglobin. The lungs respond the quickest to acid-base imbalances through exhaling
carbon dioxide, the acid component of the carbonic acid/bicarbonate buffer system (14).
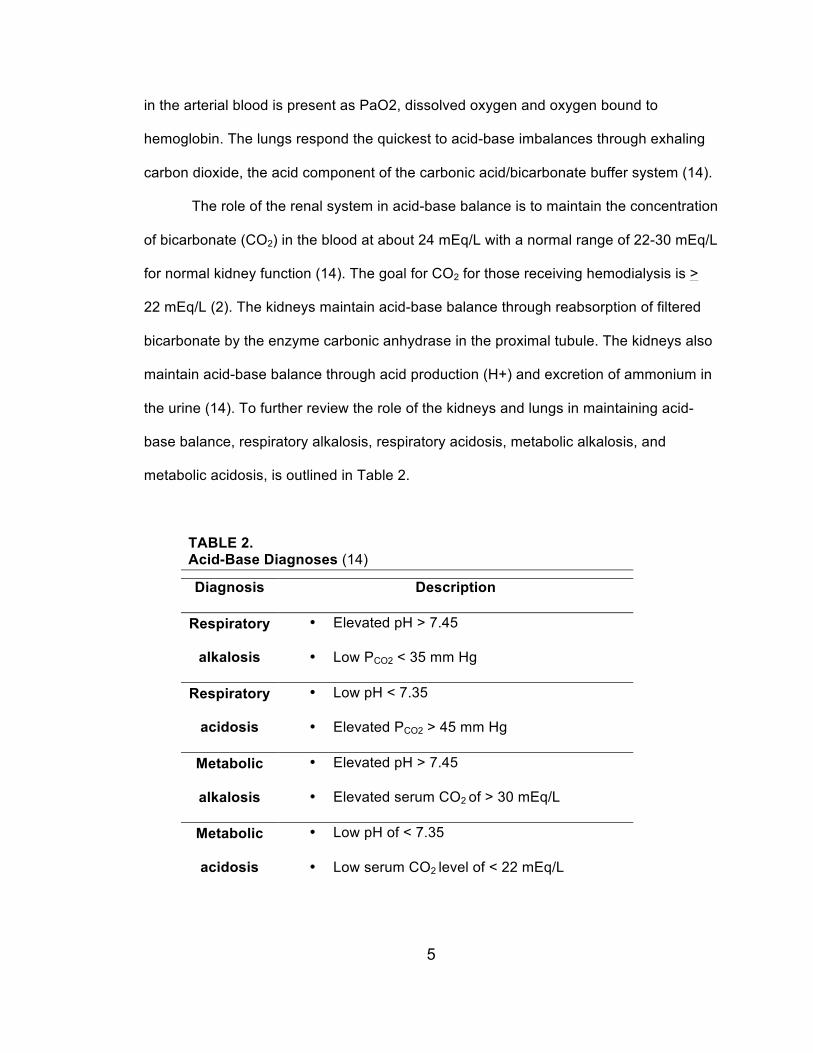
The role of the renal system in acid-base balance is to maintain the concentration
of bicarbonate (CO2) in the blood at about 24 mEq/L with a normal range of 22-30 mEq/L
for normal kidney function (14). The goal for CO2 for those receiving hemodialysis is >
22 mEq/L (2). The kidneys maintain acid-base balance through reabsorption of filtered
bicarbonate by the enzyme carbonic anhydrase in the proximal tubule. The kidneys also
maintain acid-base balance through acid production (H+) and excretion of ammonium in
the urine (14). To further review the role of the kidneys and lungs in maintaining acid-
base balance, respiratory alkalosis, respiratory acidosis, metabolic alkalosis, and
metabolic acidosis, is outlined in Table 2.
TABLE 2. Acid-Base Diagnoses (14)
Diagnosis Description
Respiratory
alkalosis
• Elevated pH > 7.45
• Low PCO2 < 35 mm Hg
Respiratory
acidosis
• Low pH < 7.35
• Elevated PCO2 > 45 mm Hg
Metabolic
alkalosis
• Elevated pH > 7.45
• Elevated serum CO2 of > 30 mEq/L
Metabolic
acidosis
• Low pH of < 7.35
• Low serum CO2 level of < 22 mEq/L
6
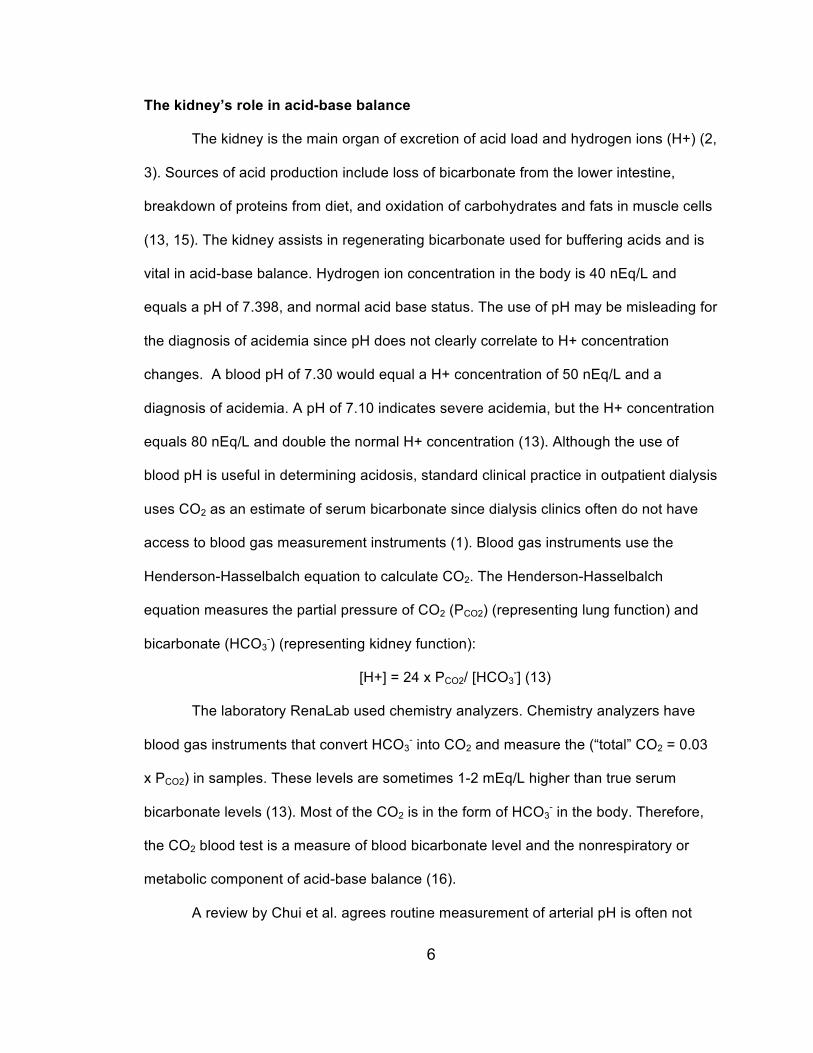
The kidney’s role in acid-base balance
The kidney is the main organ of excretion of acid load and hydrogen ions (H+) (2,
3). Sources of acid production include loss of bicarbonate from the lower intestine,
breakdown of proteins from diet, and oxidation of carbohydrates and fats in muscle cells
(13, 15). The kidney assists in regenerating bicarbonate used for buffering acids and is
vital in acid-base balance. Hydrogen ion concentration in the body is 40 nEq/L and
equals a pH of 7.398, and normal acid base status. The use of pH may be misleading for
the diagnosis of acidemia since pH does not clearly correlate to H+ concentration
changes. A blood pH of 7.30 would equal a H+ concentration of 50 nEq/L and a
diagnosis of acidemia. A pH of 7.10 indicates severe acidemia, but the H+ concentration
equals 80 nEq/L and double the normal H+ concentration (13). Although the use of
blood pH is useful in determining acidosis, standard clinical practice in outpatient dialysis
uses CO2 as an estimate of serum bicarbonate since dialysis clinics often do not have
access to blood gas measurement instruments (1). Blood gas instruments use the
Henderson-Hasselbalch equation to calculate CO2. The Henderson-Hasselbalch
equation measures the partial pressure of CO2 (PCO2) (representing lung function) and
bicarbonate (HCO3-) (representing kidney function):
[H+] = 24 x PCO2/ [HCO3-] (13)
The laboratory RenaLab used chemistry analyzers. Chemistry analyzers have
blood gas instruments that convert HCO3- into CO2 and measure the (“total” CO2 = 0.03
x PCO2) in samples. These levels are sometimes 1-2 mEq/L higher than true serum
bicarbonate levels (13). Most of the CO2 is in the form of HCO3- in the body. Therefore,
the CO2 blood test is a measure of blood bicarbonate level and the nonrespiratory or
metabolic component of acid-base balance (16).
A review by Chui et al. agrees routine measurement of arterial pH is often not
7
feasible or common in clinical practice. A high-normal arterial pH is generally associated
with a CO2 level of 24–30 mEq/L when using the Henderson-Hasselbalch equation. The
authors recommend this range as the therapeutic goal for chronic kidney disease
patients with protein-energy wasting (17).
Impact of metabolic acidosis in ESRD
According to the National Kidney Foundation’s Kidney Disease Outcome Quality
Indicators (K/DOQI), CO2 levels should be measured monthly and maintained > 22
mEq/L. Levels < 22 mEq/L indicate metabolic acidosis (2). Metabolic acidosis in ESRD is
the result of the kidney’s inability to synthesize ammonia and excrete hydrogen ions (3).
Concern arises due to the inability of the kidney to excrete the hydrogen ions. Negative
nutrition outcomes including renal osteodystrophy, protein catabolism, decreased
normalized protein catabolic rate (nPCR), decreased albumin synthesis, and protein
energy wasting are observed with metabolic acidosis in maintenance hemodialysis (3, 4).
In a retrospective observational study in 2011 by Raphael et al., African
Americans with higher and more normal CO2 levels of 28-30 mEq/L were associated with
a lower risk of mortality. Low CO2 was an independent predictor of chronic kidney
disease progression in this study (18). Soleymanian et al. found patients with metabolic
acidosis to have a lower albumin even with adequate hemodialysis. An inverse effect of
nPCR on albumin was found in acidotic patients. The authors believe metabolic acidosis
leads to hypercatabolism and contributes to negative effects on nutritional status (19).
Mortality is linked to metabolic acidosis with higher CO2 considered better for
long-term patient outcomes (18). Wu et al. found the lowest unadjusted mortality to be
associated with predialysis CO2 below 17-23 mEq/L. Bicarbonate values > 23 mEq/L
were associated with higher total and cardiovascular death rates. After adjusting for

8
patient characteristics and malnutrition-inflammation complex syndrome multivariate
adjustment, patients with bicarbonate values > 22 mEq/L had lower death risk (20). The
international observational Dialysis Outcomes and Practice Patterns Study (DOPPS)
found CO2 concentration to have no association between mortality at baseline or six-
months (21).
A review by Gennari suggests attention should focus on patients with very low (<
18 mEq/L), and very high CO2 levels (> 27 mEq/L). Gennari’s review found the lowest
mortality risk in patients with levels of 18-23 mEq/L. Ensuring correct alkali delivery
during hemodialysis therapy, evaluating potential acid–base disorders, and assessing
diet and fluid retention between treatments is recommended for patients with low
bicarbonate levels (22).
Role of hemodialysis in correcting metabolic acidosis
Hemodialysis assists in correcting metabolic acidosis and compensates for the
kidney in ESRD. Dialysate fluids with added sodium bicarbonate are infused during the
hemodialysis treatment. The concentration of bicarbonate dialysate can range from 30-
40 mmol/L for in-center hemodialysis (2, 23, 24). The mmol/L of bicarbonate dialysate
prescribed is adjusted and based on a patient’s CO2 level. Oral pill supplementation is an
option with the recommendation usually of 2-4 g/day or 25 to 50 mEq/day (2). Patients
discussed in this study are all in-center hemodialysis patients who receive dialysate
fluids with added bicarbonate during their dialysis treatment on average three days per
week.
Positive and negative results in correcting metabolic acidosis
Studies indicate correcting acid-base imbalances have a positive effect on
9
preventing muscle wasting, low albumin, and decreased nutrition status. In acidosis,
there is loss of protein from skeletal muscle. The protein loss results from accelerated
breakdown of the myofibril proteins actin and myosin. The adenosine triphosphate
(ATP)-dependent ubiquitin-proteasome system is increased and possibly responsible for
accelerated proteolysis in metabolic acidosis (13, 25). A Cochrane review on the
correction of metabolic acidosis found few randomized control trials demonstrate positive
effects on nutrition when correcting metabolic acidosis in patients with kidney disease.
Some studies in the Cochrane review demonstrated positive results while others did not
(3).
Lin et al. attempted to distinguish between metabolic acidosis due to poor
nutrition versus metabolic acidosis due to better nutrient intake causing greater
hydrogen production. They found patients with metabolic acidosis had a higher protein
intake, higher nPCR, and were associated with better nutritional parameters. The
authors suggest metabolic acidosis was not found to be a negative risk factor due to
reflecting a higher protein intake, which is the precursor of hydrogen production (26).
De Brito-Ashurst et al. found bicarbonate supplementation to slow the rate of
progression of renal failure to ESRD and improve nutrition status in chronic kidney
disease (CKD) patients (27). Blair and colleagues conducted an observational study and
found increasing dialysate bicarbonate improved predialysis CO2 levels, decreased
protein catabolism as measured by nPCR, and enhanced phosphorus control, but found
no positive change in albumin (28).
Ruggieria et al. conducted an intervention on eight hemodialysis patients.
Patients were treated daily with oral sodium bicarbonate for 10–14 days. Despite
improved acid-base balance of the patients, increasing patients to a more alkalotic state
was not associated with a positive effect on albumin, muscle protein synthesis, or
10
nutritional and endocrinal parameters (29). Full benefits of the oral sodium bicarbonate
could not have been seen in albumin due to albumin’s long half-life of about 20 days. In
contrast, a six month study by Verove et al. found significant increases in both albumin
and prealbumin levels using oral sodium bicarbonate (30). Movilli et al. in 2009 found no
adverse effects in high interdialytic weight gains, plasma sodium, or blood pressure
using oral sodium bicarbonate supplementation to correct metabolic acidosis in
hemodialysis patients. Correcting metabolic acidosis was effective in reducing protein
catabolism as defined by nPCR in hemodialysis patients. Albumin was only improved in
patients without inflammation (31). One contributing factor for the varied results between
metabolic acidosis and albumin could be the long half-life of albumin.
Serum albumin as a nutrition indicator in ESRD
There is no single protein-energy nutrition indicator for ESRD patients. The
International Society of Renal Nutrition and Metabolism recommends the use of the term
protein-energy wasting for loss of body protein mass and energy stores in chronic kidney
disease and ESRD. To diagnose protein-energy wasting, three characteristics are
present. The first includes low serum levels of albumin, prealbumin, or cholesterol. All
three biomarkers have been used in the CKD population as nutritional biomarkers. The
second characteristic includes reduced body mass as low or reduced body or fat mass
or weight loss with reduced intake of protein and energy. Reduced muscle mass with
muscle wasting, sarcopenia, or reduced mid-arm muscle circumference is the third
recommended characteristic to diagnose protein energy wasting (32). In the United
States, albumin continues to primarily be used as the main nutrition indicator and
outcome goal for ESRD (8).
Albumin is synthesized in the liver and has a long half-life of ~ 20 days (6, 33, 34).

11
It functions in maintaining osmotic pressure and transporting a variety of molecules
throughout the body (7). Visceral protein pool size can be estimated by the
measurement of circulating proteins in the blood, such as serum albumin (6, 34). Levels
are influenced by exchanges between intra- and extracellular fluid compartments,
lymphatic uptake, alterations in fluid status, protein degradation, body losses (i.e.
proteinuria), inflammation, acid-base imbalance, the liver’s production of albumin, and
acute phase response (4, 6-8, 33, 34). Debate continues regarding use of serum
albumin as a nutrition indicator since a low level does not always indicate protein-energy
malnutrition (6, 33). Although albumin levels of < 4.0 g/dL are associated in ESRD with
higher mortality rates, Friedman and Fadem suggest albumin should be used more as
an index of the severity of illness versus nutrition status (7). Steinman suggests
eliminating albumin totally as the nutrition indicator for ESRD (6).
12
CHAPTER 3
MATERIALS AND METHODS
Approval for the study was initially received from The University of Kansas
Medical Center Human Subjects Committee. Renal Advantage, Incorporated (RAI)
Medical Advisory Committee and RAI’s Chief Legal Counsel determined final approval.
A limited data set was created with the assistance of RAI by removing protected health
information as required by the Health Insurance Portability and Accountability Act
(HIPAA). Kirk Finchem, RAI Vice President of Clinical Operations, assisted in creating
the limited data set. All data was kept in a password protected and locked computer in a
secure location at all times.
Study design
This study was a retrospective observational study using a convenience sample
of 144 patients being treated with hemodialysis at RAI in Westwood, Kansas. Greater
than one year’s data was collected to account for demonstrating the prior month’s serum
bicarbonate level has an impact on nutrition indicators. Laboratory and medical histories
were collected from electronic medical records from December 2010 through January
2012. The electronic medical records were kept and backed up at RAI headquarters in
Nashville, Tennessee. Patients were predominately on Medicaid and Medicare and of a
lower socioeconomic status.
Inclusion and exclusion criteria
Subjects were included in data analysis regardless of comorbidities. Subjects
were excluded for: 1) being on hemodialysis at RAI as defined as less than three
months; 2) receiving artificial intravenous nutrition containing amino acids, such as total
13
parenteral nutrition (TPN) or intradialylitic parenteral nutrition (IDPN).
Serum chemistry methods
Certified Hemodialysis Technicians or Registered Nurses collected arterial blood
samples at the beginning of each week on a Monday or a Tuesday based on a patient’s
dialysis schedule. The blood tests listed below were collected monthly at the dialysis
center according to the doctor’s orders (35). Blood samples were collected through the
patients’ dialysis accesses (e.g. AV fistula, graft, or catheter). If a sample was
hemolyzed, the clinic was notified and the samples were recollected. RenaLab, RAI’s
laboratory located in Richland, Mississippi, analyzed the blood samples. RenaLab is no
longer in business as of summer 2012 due Renal Advantage Inc. being purchased by
another dialysis company. Details regarding laboratory assays and instruments are
limited to what was available in the policies and procedures outlined below.
Blood samples were air shipped overnight to RenaLab, Inc. for processing. Cold
packs were first placed in the bottom of a RenaLab Transport Box on top of an
absorbent blue pad. Samples were placed in holes of a foam insert in the shipping box.
They were then packed in sealed plastic bags to prevent any broken or punctured tubes
leaking into the box. Cold packs were placed on top to maintain preservation. A
Styrofoam lid was placed on top of the contents. An itemized list of contents was placed
between the Styrofoam lid and the outer box. The box was sealed with packing tape,
labeled with a packing slip, and sent to RenaLab. Samples resulted in the patient
electronic medical record after two days from shipment to RenaLab due to travel time
(36).
Patients’ body temperatures were recorded to assist in tracking potential illness
or infection. Post dialysis weight (kg) was used to estimate dry weight after each
14
hemodialysis treatment. The dry weights recorded in the limited data set were from the
same days as monthly lab days. Height (cm) was updated at least annually (37, 38). The
dry weights and heights were used to calculate BMI as kg/m2 on the same day as
monthly lab day.
Subjective nutrition assessment data was collected from the comprehensive
patient assessments with the classifications of “well nourished”, “mild malnutrition”,
“moderate malnutrition”, and “severe malnutrition” (Appendix A). The nutrition status
classification is based on criteria adopted from the Center for Disease Control’s ICD-9
codes (39) and the Academy of Nutrition and Dietetics (AND) and American Society for
Parenteral and Enteral Nutrition (A.S.P.E.N.) recommendations for malnutrition (40).
Appendix B outlines the Nutrition Status Criteria table used in this study.
A total of four blood tubes were collected with monthly labs including one serum
separator tube (SST), two lavender topped tubes, and one green topped tube. Patient
monthly labs included the following:
1) Serum albumin: Serum albumin is an acute-phase protein with a goal of > 4.0
g/dL in ESRD (8). The normal non-ESRD range for albumin is 3.5-5.2 g/dL (41).
Albumin was analyzed by RenaLab using the bromocresol green assay (BCG).
The BCG assay is a colorimetric method for the measurement of the serum
albumin concentration and is shown to be the preferred method for hemodialysis
patients (41). Bromocresol green dye binds with albumin at a specific pH. For
example, a pH of 4.2 has a specific colored complex measured
spectrophotometrically at 628 nm. It is directly proportional to the albumin
concentration in the sample (42).
Arterial blood was collected in a serum separator tube (SST) tube and
15
allowed to clot for about 15 minutes (41). Each SST tube contained clot activator
and gel for serum separation (43). The sample was centrifuged for 20 minutes at
3000 rotations per minute (rpm) (8, 41).
2) Serum bicarbonate: Serum bicarbonate (CO2) levels are influenced by kidney
and respiratory function. The goal for ESRD is > 22 mEq/L CO2 (2). The kidney is
the primary organ responsible for maintaining normal bicarbonate levels. The
procedure uses a blood gas instrument and the Henderson-Hasselbalch equation
where the partial pressure of CO2 (PCO2) represents lung function and
bicarbonate (HCO3-) represents kidney function:
[H+] = 24 x PCO2/ [HCO3
-] (13).
Because CO2 content primarily reflects the concentration of bicarbonate, it
is primarily a measure of the nonrespiratory or metabolic component of acid-base
balance (16). Arterial blood was collected in an SST and allowed to clot for about
15 minutes (41). Each SST tube contained clot activator and gel for serum
separation (43). The sample was then centrifuged for 20 minutes at 3000 rpm
(41).
3) Serum calcium: Serum calcium is used to determine parathyroid function and
calcium homeostasis. Hyperparathyroidism is the most common cause of
elevated serum calcium values, which leads to bone disease in ESRD.
Hypoalbuminemia is the most common cause of decreased calcium values since
calcium is bound to serum albumin (41). Adjusted calcium was calculated when
albumin levels are < 4.0 g/dL using the equation:
16
[0.8 x (4.0 – Measured Serum Albumin g/dL) + Serum Calcium mg/dL] (41, 44).
The desired goal for adjusted calcium range is > 8.4 - < 10.2 mg/dL in
ESRD. Measurement is performed using a colorimetric assay. Arterial blood was
collected in an SST and allowed to clot for about 15 minutes (41). Each SST tube
contained clot activator and gel for serum separation (43). The sample was then
centrifuged for 20 minutes at 3000 rpm (41).
4) Serum creatinine: Serum creatinine is a product in the breakdown of muscle
creatine phosphate from energy exertion. It is produced at a constant rate based
on muscle mass and is excreted from the body by the kidneys (41). Patients with
little or no renal function receiving dialysis will have predialysis serum creatinine
levels proportional to dietary protein intake and skeletal muscle mass:
Predialysis Serum Creatinine = [(Intake of Foods Rich in Creatine and Creatinine
+ Endogenous Creatinine Production) – (Urine Output + Removal During Hemodialysis + Degradation of Creatinine)] (45)
Normal kidney function creatinine range is 0.7-1.3 mg/dL for males and
0.5-0.9 mg/dL for females (41). Creatinine levels above these ranges indicate
impairment of kidney function, but a level < 10 mg/dL can be a sign of protein
energy malnutrition, inadequate intake, and muscle wasting (45). Measurement
was performed using a kinetic colorimetric Jaffe assay (41, 46). Creatinine reacts
with alkaline picrate forming a red color in the Jaffe assay. The intensity of the
color is measured spectrophotometrically. Sodium lauryl sulphate is added to
prevent protein influence. Acidifying the sample with 30% acetic acid prevents
influence from non-specific chromogens in the samples. A second absorbance
17
reading is taken. To determine creatinine results, the second absorbance values
are subtracted from the first set of values. Corrected absorbance values are then
plotted on a calibration graph. The measurable range with this graph is from 0.2
to 8.0 mg/dL. Plotting the corrected absorbance of the test provides the values of
creatinine (47).
Arterial blood was collected in an SST and allowed to clot for about 15
minutes (41). Each SST tube contained clot activator and gel for serum
separation (43). The sample was then centrifuged for 20 minutes at 3000 rpm
(41).
5) Hemoglobin: Hemoglobin is a protein used to determine the oxygen-carrying
capacity of blood, to assess ESRD related anemia, and to assess patient
response to erythropoietin therapy. The kidney produces the hormone
erythropoietin, which signals red blood cell production. Patients with ESRD do
not produce a sufficient amount of erythropoietin to make red blood cells,
resulting in erythropoietin-deficient anemia (48). The goal range for hemoglobin
is 9-11 g/dL per RAI protocol (49). Measurement was performed using a
colorimetric assay. Arterial blood was collected in the first lavender-topped tube
and immediately mixed by gentle inversion to allow the anticoagulant to combine
with the blood and prevent clotting (41). Each lavender top tube contained the
spray dried additive potassium (K2) ethylene diamine tetraacetic acid (K2EDTA)
to assist in clotting (50).
6) Intact parathyroid hormone: Intact parathyroid hormone (PTH) is produced by
the parathyroid gland. Disorders of the parathyroid glands can lead to
18
hypercalcemia or hypocalcemia due to a change in PTH secretion (51). Patients
with CKD frequently develop secondary hyperplasia of the parathyroid glands
causing high blood levels of PTH. The abnormality develops due to
hypocalcemia common in the course of kidney disease. A deficiency of 1,25-
dihydroxycholecalciferol [1,25(OH)2D3] (active vitamin D) also affects the function
of the parathyroid glands. A decrease in vitamin D receptors and calcium-sensing
receptors in the parathyroid gland occurs resulting in resistance to the action of
vitamin D and calcium (52).
Measurement of PTH was performed using an electrochemiluminescent
immunoassay. Intact parathyroid hormone was collected monthly after Zemplar ®
vitamin D analogue medication adjustments or if PTH levels were considered
unstable. An unstable PTH was defined as < 150 or > 300 pg/dL per RAI protocol
(49). If PTH was stable after two months, it was tested quarterly. Arterial blood
was collected in the second lavender-topped tube and immediately mixed by
gentle inversion to allow the anticoagulant to combine with the blood and prevent
clotting (51). Each lavender top tube contained the spray dried additive
potassium (K2) ethylene diamine tetraacetic acid (K2EDTA) to assist in clotting
(50).
7) Serum phosphorus: There is an inverse relationship between serum
phosphorus and serum calcium levels. Excess serum phosphorus levels cause
the kidneys to excrete serum calcium. Excess serum calcium levels cause the
kidneys to excrete serum phosphorus. The ESRD goal range for serum
phosphorus is 3.5-5.5 mg/dL per RAI protocol (49). Measurement was performed
using a colorimetric assay. Arterial blood was collected in an SST and allowed to
19
clot for about 15 minutes (51). Each SST tube contained clot activator and gel for
serum separation (43). The sample was then centrifuged for 20 minutes at 3000
rpm (51).
8) Serum potassium: Serum potassium is the primary electrolyte of intracellular
fluid. The goal range for potassium is 3.5-5.5 mEq/L per RAI protocol (49).
Measurement was performed using an ion selective electrode for potassium.
Arterial blood was collected in an SST and allowed to clot for about 15 minutes
(51). Each SST tube contained clot activator and gel for serum separation (43).
The sample was then centrifuged for 20 minutes at 3000 rpm (51).
9) Kt/V, pre-blood urea nitrogen, and post-blood urea nitrogen: Hemodialysis
adequacy, defined by Kt/V, is taken at least monthly using pre-treatment blood
urea nitrogen (pre-BUN) and post-treatment BUN (mg/dL) (post-BUN). The letter
K represents clearance of urea, t represents hemodialysis time, and V represents
volume of distribution of urea (53). Blood urea nitrogen is used to evaluate kidney
function. Urea is formed in the liver in the urea cycle and represents the final
products of protein and amino acid metabolism. Urea is carried to the kidneys to
be excreted in the urine (41). A normal BUN is 7-20 mg/dL (54). Protein
catabolism and impairment of kidney function results in a high BUN above 20
mg/dL (41). The Daugirdas II logarithmic kinetics Kt/V method is the tool used for
measuring and assessing the effectiveness of hemodialysis (41, 55):
Kt/V = -ln(Post BUN/Pre BUN-0.008·t) + (4–3.5·Post-BUN/Pre-BUN)·Ultrafiltrate
Volume/Weight (56)
Pre-BUN samples were collected arterially in an SST and allowed to clot for
20
about 15 minutes. The sample was then centrifuged for 20 minutes at 3000 rpm.
Post-BUN samples were collected arterially in a green-topped tube. Green
topped tubes are mixed by gentle inversion to allow the anticoagulant to combine
with blood and prevent clotting. Green topped tubes required no centrifuging (41).
Each green topped tube contained spray dried lithium heparin to prevent clotting
(57). If Kt/V levels were less than the goal of 1.4, hemodialysis prescriptions were
adjusted to achieve the goal of > 1.4.
10) Normalized protein catabolic rate: Normalized protein catabolic rate (nPCR)
is calculated with each Kt/V as an estimate of protein intake by g/kg/day. The
ideal nPCR range is > 1.2, indicating an intake of about 1.2 g/kg/day of protein
(53). There are limitations to nPCR as an estimate of protein intake. First, nPCR
approximates protein intake only when the patient is in nitrogen equilibrium
(steady-state). In a catabolic patient, nPCR will appear higher than protein intake
from degradation and metabolism of protein pools to form urea. Second, a single
measurement may not reflect usual protein intake. When protein intake is high,
nPCR underestimates protein intake where nitrogen balance is positive.
Normalized protein catabolic rate may overestimate protein when the protein
intake is less than 1 g/kg/day, possibly due to protein catabolism (58).
Statistical analysis
Data was analyzed using Statistical Package for Social Sciences 20 (SPSS 20).
Outliers in the limited data set for all variables were removed. An outlier was defined as
a not feasibly possible value or lies outside the possible range of values for any given
variable. The program SPSS automatically removed variables through pairwise deletion
21
for cases with missing values. Laboratory and anthropometric data analyzed included
serum albumin, serum CO2, serum phosphorus, hemoglobin, adjusted serum calcium,
serum potassium, PTH, Kt/V, pre- BUN, post-BUN, serum creatinine, nPCR,
temperature during hemodialysis, weight, height, and BMI. Patient characteristics
collected included gender, age, cause of renal failure, BMI class, months on
hemodialysis, and subjective nutrition status. The variable of race/ethnic group was
originally requested, however was excluded from analysis.
To control for differences among individuals, within-subject correlations were
used to analyze individual variables and the mixed model ANCOVA variables. For
example, to determine if a decrease in albumin within an individual was associated with
a decrease in CO2, the differences between subjects were removed and only changes
within the individual was calculated (59). The following calculation was used to find
within-subjects correlation:
√(Sum of Squares for Variable of Interest)/(Sum of Squares for Variable of Interest + Sum of Squares Residual) (59)
P-values of < 0.05 were considered to be statistically significant for all within-subjects
correlations.
Pearson correlations were calculated to ensure reliability of the within-subjects
correlation for continuous variables across subjects. Spearman correlations were
calculated to ensure reliability of the within-subjects correlation for categorical variables
across subjects. Pearson and Spearman calculations also assisted in determining the
directionality (positive or negative) of the correlation as the within-subject correlation
losses the negative directionality when calculating with a square root. P-values of < 0.05
and < 0.01 were considered to be statistically significant depending on variable.
22
Chapter 4
RESULTS
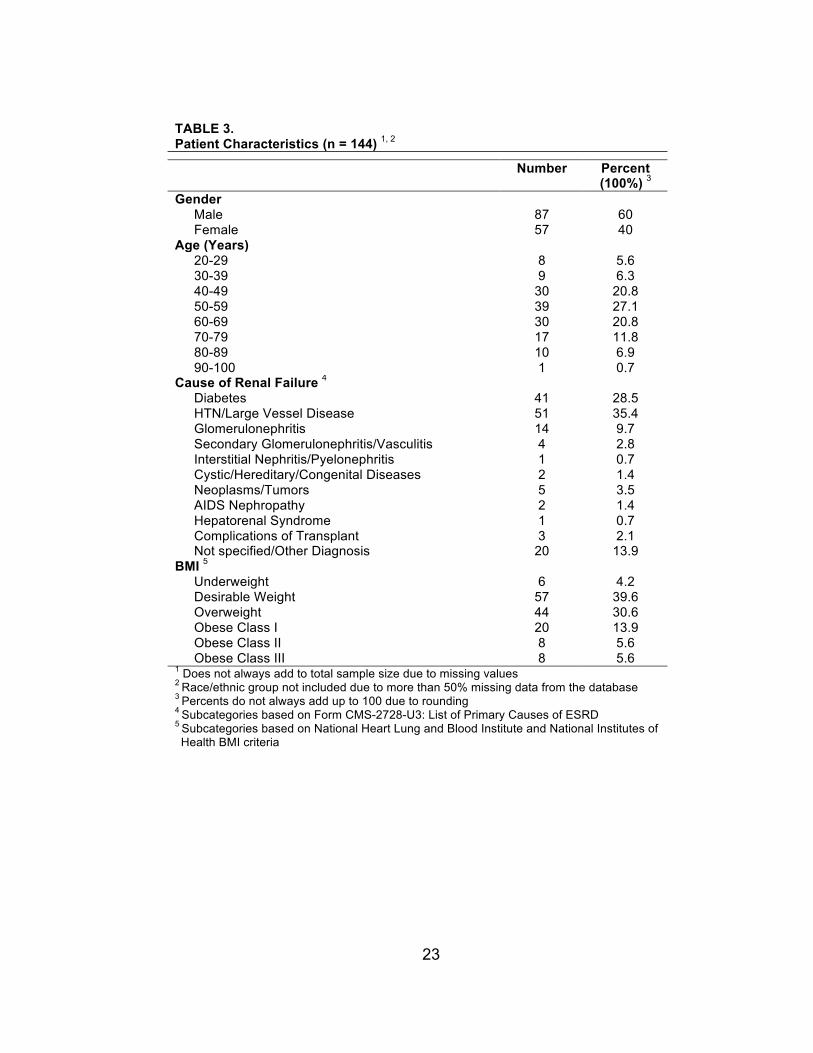
Sample characteristics and descriptives
The sample included 144 in-center hemodialysis patients, 87 males and 57
females. Patient characteristics are presented in Table 3. The mean age was 56.75 +
15.21 years with a majority of patients between the ages of 40 and 69 years (68.7%).
Cause of renal failure was subcategorized according to the Department of Health
and Human Services and Center for Medicare and Medicaid Services Form-CMS-U3:
List of Primary Causes of ESRD (60). The primary causes of ESRD categories are listed
in Table 3. The top two causes of ESRD were 28.5% caused by diabetes and 35.4%
caused by hypertension/large vessel disease.
The mean BMI was 28.11 + 6.65 kg/m2. The majority of patients had a desirable
weight (39.6%). Subcategories were based on the BMI criteria of the National Heart
Lung and Blood Institute and National Institutes of Health (61) (Table 3).
Patients were excluded if they were new to hemodialysis as defined by less than
three months of receiving treatment. The mean months on hemodialysis were 51.78 +
45.80 months with a minimum of three months and a max of more than 23 years (287.10
months) (Table 4).
Monthly laboratory values included albumin, bicarbonate, phosphorus,
hemoglobin, adjusted calcium, potassium, PTH, Kt/V adequacy calculation derived from
pre-BUN and post-BUN, creatinine, nPCR, and patient temperature during hemodialysis.
Patient laboratory descriptives are shown in Table 4.
23
TABLE 3. Patient Characteristics (n = 144) 1, 2
Number Percent (100%) 3
Gender Male 87 60 Female 57 40
Age (Years) 20-29 8 5.6 30-39 9 6.3 40-49 30 20.8 50-59 39 27.1 60-69 30 20.8 70-79 17 11.8 80-89 10 6.9 90-100 1 0.7
Cause of Renal Failure 4 Diabetes 41 28.5 HTN/Large Vessel Disease 51 35.4 Glomerulonephritis 14 9.7 Secondary Glomerulonephritis/Vasculitis 4 2.8 Interstitial Nephritis/Pyelonephritis 1 0.7 Cystic/Hereditary/Congenital Diseases 2 1.4 Neoplasms/Tumors 5 3.5 AIDS Nephropathy 2 1.4 Hepatorenal Syndrome 1 0.7 Complications of Transplant 3 2.1 Not specified/Other Diagnosis 20 13.9
BMI 5 Underweight 6 4.2
Desirable Weight 57 39.6 Overweight 44 30.6 Obese Class I 20 13.9 Obese Class II 8 5.6 Obese Class III 8 5.6
1 Does not always add to total sample size due to missing values 2 Race/ethnic group not included due to more than 50% missing data from the database 3 Percents do not always add up to 100 due to rounding 4 Subcategories based on Form CMS-2728-U3: List of Primary Causes of ESRD 5 Subcategories based on National Heart Lung and Blood Institute and National Institutes of Health BMI criteria

24
Nutrition Assessment
Dietary intake was not collected for this project due to time constraints. Nutrition
status was determined at least annually on stable patients by a Registered Dietitian.
Medically unstable patients were assessed more often until deemed stable. The
Comprehensive Patient Nutrition Assessment included appetite, typical meal pattern,
anthropometrics, and laboratory results (Appendix A) (62). Each Comprehensive Patient
Nutrition Assessment provided a designation of whether a patient was “well-nourished”,
or had a “mild”, “moderate”, or “severe malnutrition” status. Criteria for nutrition status
were based on findings from the Comprehensive Patient Nutrition Assessment and
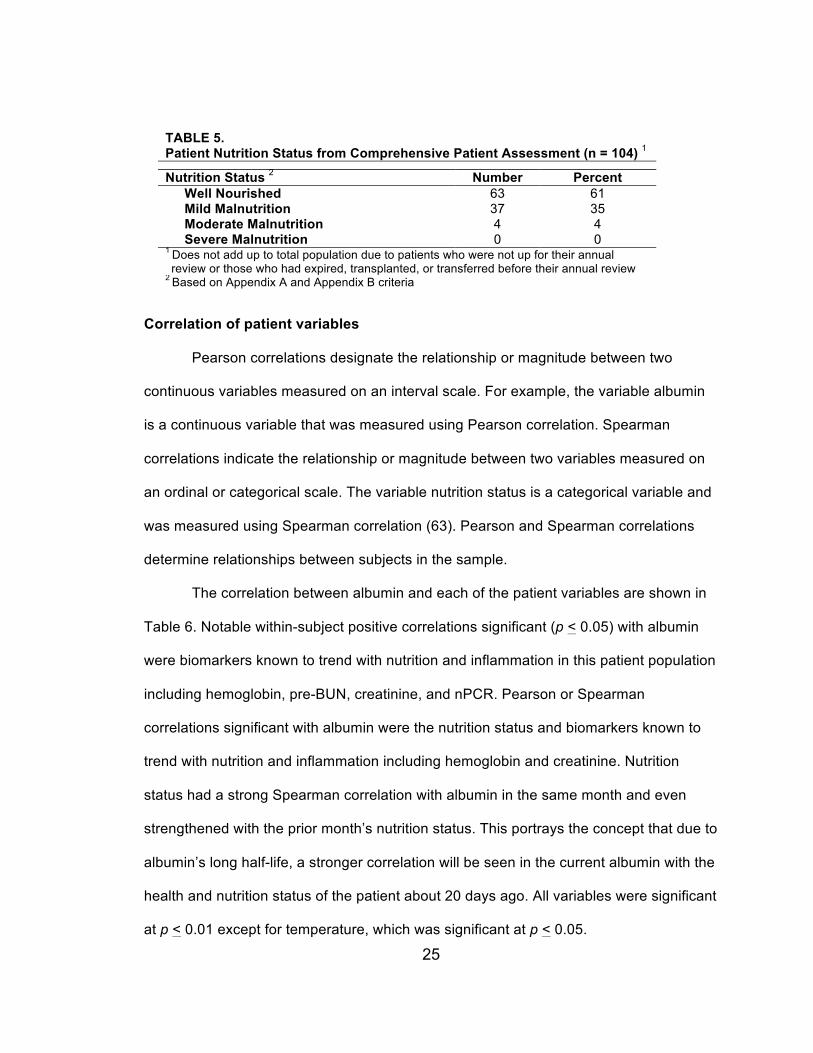
Nutrition Status Criteria outlined in Appendix B. Table 5 shows the nutrition status of
those patients who had nutrition assessments during the study time. The chi-squared
test is used to test hypotheses relating to group differences in proportions (63). When
evaluating the difference between the nutrition status designations, the groups were not
statistically the same as designated by a Chi-squared of 50.44 (p = 1.11325E-11).
TABLE 4. Patient Laboratory Descriptives (n = 144) 1
Biomarker Mean Minimum Maximum Standard Deviation
Age (years) 56.75 21.10 90.50 15.21 BMI (kg/m2) 28.11 15.60 53.50 6.65 Months on Hemodialysis 51.78 3.00 287.10 45.80 Albumin (g/dL) 3.75 1.90 5.00 0.40 Bicarbonate (mEq/L) 23.95 12.00 35.00 3.24 Phosphorus (mg/dL) 5.48 1.50 13.00 1.68 Hemoglobin (g/L) 10.86 5.50 15.60 1.36 Adjusted Calcium (mg/dL) 9.05 5.80 13.20 0.81 Potassium (mEq/L) 4.63 2.50 8.10 0.73 Intact PTH (pg/dL) 489.09 2.00 2272.00 396.10 Kt/V 1.69 0.44 4.53 0.36 Pre-BUN (mg/dL) 60.40 14.00 139.00 19.87 Post-BUN (mg/dL) 17.55 2.00 80.00 9.71 Creatinine (mg/dL) 9.71 2.13 22.29 3.46 nPCR 0.89 0.17 2.29 0.32 Temperature During Hemodialysis (°F) 97.17 93.90 101.40 1.01 1 Each variable does not always include total sample size due to missing values.
25
Correlation of patient variables
Pearson correlations designate the relationship or magnitude between two
continuous variables measured on an interval scale. For example, the variable albumin
is a continuous variable that was measured using Pearson correlation. Spearman
correlations indicate the relationship or magnitude between two variables measured on
an ordinal or categorical scale. The variable nutrition status is a categorical variable and
was measured using Spearman correlation (63). Pearson and Spearman correlations
determine relationships between subjects in the sample.
The correlation between albumin and each of the patient variables are shown in
Table 6. Notable within-subject positive correlations significant (p < 0.05) with albumin
were biomarkers known to trend with nutrition and inflammation in this patient population
including hemoglobin, pre-BUN, creatinine, and nPCR. Pearson or Spearman
correlations significant with albumin were the nutrition status and biomarkers known to
trend with nutrition and inflammation including hemoglobin and creatinine. Nutrition
status had a strong Spearman correlation with albumin in the same month and even
strengthened with the prior month’s nutrition status. This portrays the concept that due to
albumin’s long half-life, a stronger correlation will be seen in the current albumin with the
health and nutrition status of the patient about 20 days ago. All variables were significant
at p < 0.01 except for temperature, which was significant at p < 0.05.
TABLE 5. Patient Nutrition Status from Comprehensive Patient Assessment (n = 104) 1
Nutrition Status 2 Number Percent Well Nourished 63 61 Mild Malnutrition 37 35 Moderate Malnutrition 4 4 Severe Malnutrition 0 0
1 Does not add up to total population due to patients who were not up for their annual review or those who had expired, transplanted, or transferred before their annual review
2 Based on Appendix A and Appendix B criteria

26
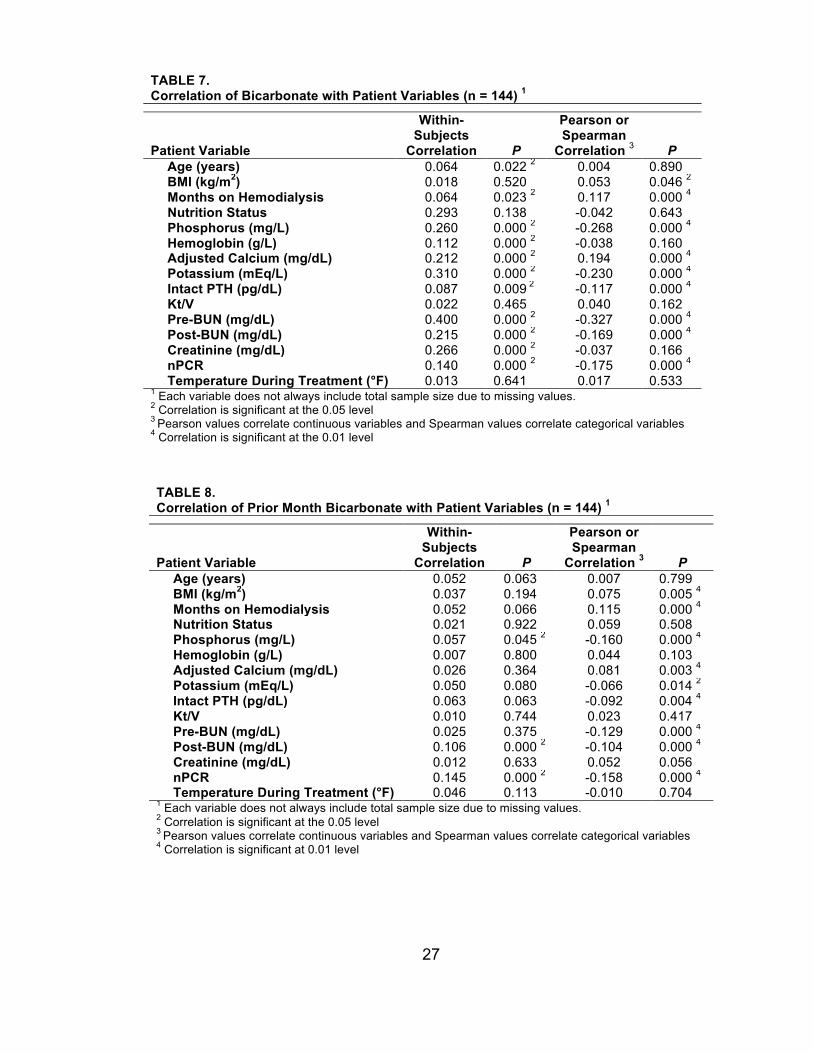
The correlation between bicarbonate and each of the patient variables are shown
in Table 7. Notable within-subject correlations significant with bicarbonate (p < 0.05)
were mineral-bone related biomarkers including phosphorus and adjusted calcium.
Bicarbonate correlated with nutrition biomarkers including hemoglobin, pre-BUN, post-
BUN, creatinine, and nPCR. The Pearson or Spearman correlations assisted in
assigning directionality to the within-subjects correlation. For example, phosphorus and
the nutrition biomarkers BUN and nPCR negatively correlated with bicarbonate. A higher
CO2 therefore indicated a lower phosphorus, BUN, and nPCR. All variables were
significant at p < 0.01 except for BMI, which was significant at p < 0.05. The correlation
between the prior month’s bicarbonate and the individual patient variables are shown in
Table 8. Within-subject correlations, Pearson, and Spearman correlations did not
improve with the prior month’s bicarbonate and the individual patient variables in Table 8.
TABLE 6. Correlation of Patient Variables with Albumin (n = 144) 1
Patient Variable
Within-Subjects
Correlation P
Pearson or Spearman
Correlation 3 P Age (years) 0.009 0.000 2 -0.076 0.004 4
BMI (kg/m2) 0.028 0.314 -0.029 0.272 Months on Hemodialysis 0.009 0.756 -0.066 0.013 4
Nutrition Status 0.098 0.618 -0.566 0.000 4
Nutrition Status Prior Month 0.240 0.212 -0.631 0.000 4
Bicarbonate Same Month (mEq/L) 0.079 0.005 2 0.024 0.376 Bicarbonate Prior Month (mEq/L) 0.042 0.140 0.083 0.002 4
Phosphorus (mg/L) 0.099 0.000 2 0.176 0.000 4
Hemoglobin (g/L) 0.287 0.000 2 0.247 0.000 4
Adjusted Calcium (mg/dL) 0.004 0.886 0.005 0.867 Potassium (mEq/L) 0.108 0.000 2 0.131 0.000 4
Intact PTH (pg/dL) 0.109 0.001 2 0.134 0.000 4
Kt/V 0.099 0.001 2 0.207 0.000 4
Pre-BUN (mg/dL) 0.125 0.000 2 0.088 0.001 4
Post-BUN (mg/dL) 0.099 0.001 2 0.051 0.078 Creatinine (mg/dL) 0.097 0.001 2 0.224 0.000 4
nPCR 0.121 0.000 2 0.119 0.000 4
Temperature During Treatment (°F) 0.493 0.086 -0.063 0.020 2
1 Each variable does not always include total sample size due to missing values 2 Correlation is significant at the 0.05 level 3 Pearson values correlate continuous variables and Spearman values correlate categorical variables 4 Correlation is significant at the 0.01 level
27
TABLE 8. Correlation of Prior Month Bicarbonate with Patient Variables (n = 144) 1
Patient Variable
Within-Subjects
Correlation P
Pearson or Spearman
Correlation 3 P Age (years) 0.052 0.063 0.007 0.799 BMI (kg/m2) 0.037 0.194 0.075 0.005 4
Months on Hemodialysis 0.052 0.066 0.115 0.000 4
Nutrition Status 0.021 0.922 0.059 0.508 Phosphorus (mg/L) 0.057 0.045 2 -0.160 0.000 4
Hemoglobin (g/L) 0.007 0.800 0.044 0.103 Adjusted Calcium (mg/dL) 0.026 0.364 0.081 0.003 4
Potassium (mEq/L) 0.050 0.080 -0.066 0.014 2
Intact PTH (pg/dL) 0.063 0.063 -0.092 0.004 4
Kt/V 0.010 0.744 0.023 0.417 Pre-BUN (mg/dL) 0.025 0.375 -0.129 0.000 4
Post-BUN (mg/dL) 0.106 0.000 2 -0.104 0.000 4
Creatinine (mg/dL) 0.012 0.633 0.052 0.056 nPCR 0.145 0.000 2 -0.158 0.000 4
Temperature During Treatment (°F) 0.046 0.113 -0.010 0.704 1 Each variable does not always include total sample size due to missing values. 2 Correlation is significant at the 0.05 level 3 Pearson values correlate continuous variables and Spearman values correlate categorical variables 4 Correlation is significant at 0.01 level
TABLE 7. Correlation of Bicarbonate with Patient Variables (n = 144) 1
Patient Variable
Within-Subjects
Correlation P
Pearson or Spearman
Correlation 3 P
Age (years) 0.064 0.022 2 0.004 0.890 BMI (kg/m2) 0.018 0.520 0.053 0.046 2
Months on Hemodialysis 0.064 0.023 2 0.117 0.000 4
Nutrition Status 0.293 0.138 -0.042 0.643 Phosphorus (mg/L) 0.260 0.000 2 -0.268 0.000 4
Hemoglobin (g/L) 0.112 0.000 2 -0.038 0.160 Adjusted Calcium (mg/dL) 0.212 0.000 2 0.194 0.000 4
Potassium (mEq/L) 0.310 0.000 2 -0.230 0.000 4
Intact PTH (pg/dL) 0.087 0.009 2 -0.117 0.000 4
Kt/V 0.022 0.465 0.040 0.162 Pre-BUN (mg/dL) 0.400 0.000 2 -0.327 0.000 4
Post-BUN (mg/dL) 0.215 0.000 2 -0.169 0.000 4
Creatinine (mg/dL) 0.266 0.000 2 -0.037 0.166 nPCR 0.140 0.000 2 -0.175 0.000 4
Temperature During Treatment (°F) 0.013 0.641 0.017 0.533 1 Each variable does not always include total sample size due to missing values. 2 Correlation is significant at the 0.05 level 3 Pearson values correlate continuous variables and Spearman values correlate categorical variables 4 Correlation is significant at the 0.01 level
28
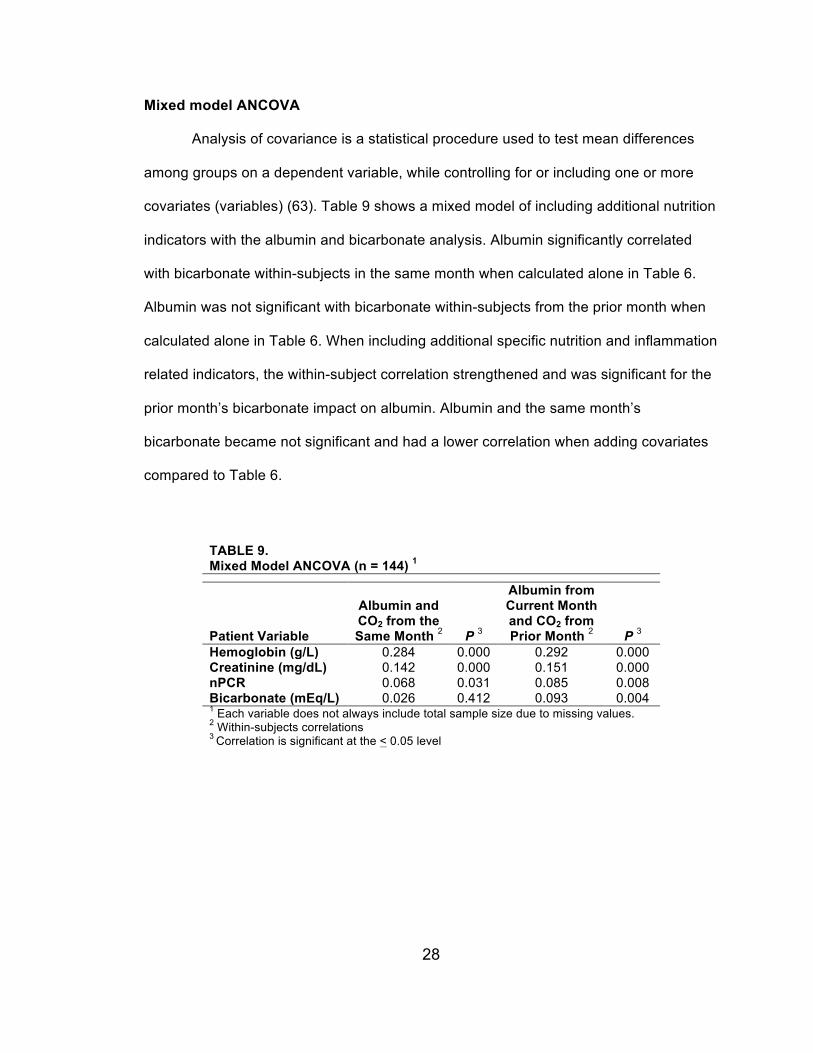
Mixed model ANCOVA
Analysis of covariance is a statistical procedure used to test mean differences
among groups on a dependent variable, while controlling for or including one or more
covariates (variables) (63). Table 9 shows a mixed model of including additional nutrition
indicators with the albumin and bicarbonate analysis. Albumin significantly correlated
with bicarbonate within-subjects in the same month when calculated alone in Table 6.
Albumin was not significant with bicarbonate within-subjects from the prior month when
calculated alone in Table 6. When including additional specific nutrition and inflammation
related indicators, the within-subject correlation strengthened and was significant for the
prior month’s bicarbonate impact on albumin. Albumin and the same month’s
bicarbonate became not significant and had a lower correlation when adding covariates
compared to Table 6.
TABLE 9. Mixed Model ANCOVA (n = 144) 1
Patient Variable
Albumin and CO2 from the Same Month 2 P 3
Albumin from Current Month and CO2 from Prior Month 2 P 3
Hemoglobin (g/L) 0.284 0.000 0.292 0.000 Creatinine (mg/dL) 0.142 0.000 0.151 0.000 nPCR 0.068 0.031 0.085 0.008 Bicarbonate (mEq/L) 0.026 0.412 0.093 0.004 1 Each variable does not always include total sample size due to missing values. 2 Within-subjects correlations 3 Correlation is significant at the < 0.05 level

29
Chapter 5
DISCUSSION
Serum CO2 is the primary hemodialysis outpatient biomarker used to determine
acid-base status of this patient population. Low serum bicarbonate is shown to
negatively impact nutrition status and biomarkers such as albumin. Albumin is known to
have a long half-life of ~20 days and not always indicate the current nutrition status of a
patient. As an individual indicator, albumin did not correlate significantly with the prior
month’s bicarbonate within-subjects (r = 0.042, p = 0.140), but did in the same month (r
= 0.079, p = 0.005). When including additional nutrition indicators as outlined in the
ANCOVA model, albumin did significantly correlate with bicarbonate from the prior
month (r = 0.093, p = 0.004). Because there is no one biomarker indicating overall
nutrition status in hemodialysis patients, it is important for clinicians to consider multiple
biomarkers versus only albumin as the main nutrition indicator in ESRD.
This study’s results support the potential reason some studies find significance
for metabolic acidosis on nutrition biomarkers such as albumin while other research
does not. Results appear to be the first to take both current and prior month’s serum CO2
and correlate them to nutrition biomarkers in hemodialysis patients. A patient’s prior
month’s CO2 was used to see if it correlated better with the biomarker albumin which is
know to have a long half-life. A further advantage of this study was the use of both
within-subjects and Pearson or Spearman correlations. Studies often appear to only use
Pearson correlation to look at the relationship of CO2 and biomarkers between subjects
(9, 19, 28) and not at trends within the individual.
Intervention studies have attempted to answer the question whether increasing
serum CO2 improves protein synthesis and albumin. Ruggieri et al. found raising blood
pH of dialysis patients was not associated with a positive effect on albumin and muscle

30
protein synthesis, or nutritional and endocrinal parameters (29). Bossola et al. found no
significant effect of bicarbonate treatment on albumin, dry weight, total cholesterol, or C-
reactive protein (64). Movilli et al. in 1998 demonstrated the correction of metabolic
acidosis improved serum albumin concentrations in hemodialysis patients from 3.49 +
2.1 g/dL to 3.79 + 2.9 g/dL (p < 0.01) (65). Movilli and colleagues in 2009 found
correcting metabolic acidosis in hemodialysis patients increased albumin only in patients
without inflammation (C-reactive protein < 10 mg/L) from 3.7 + 0.3 g/dL to 4.0 + 0.3 g/dL
(p < 0.01). In inflamed patients, the correction of low CO2 did not improve albumin (3.5 +
0.17 g/dL vs. 3.4 + 0.13 g/dL; p = NS) (31). This current study suggests when looking
within individual patient trends (within-subjects correlation), a higher albumin significantly
correlated with a higher CO2 collected in the same month (r = 0.079, p = 0.005). Albumin
did not significantly correlate as hypothesized with CO2 collected from the prior month
within-subjects. However, the correlation was significant between subjects (Pearson
correlation) for albumin and prior month’s CO2.
Normalized protein catabolic rate is used as a biomarker for trending estimated
protein intake as defined by grams of protein consumed per kilogram body weight (53).
This study showed a significant trend in a lower nPCR with a higher CO2. Blair et al.
found similar results in nPCR after increasing bicarbonate dialysate from 35 to 39
mmol/L for six months. The nPCR decreased significantly compared to baseline (0.99 +
0.26 vs. 0.93 + 0.23, p = 0.001) (28). Results from Movilli et al. in 2009 were consistent
with this study, but they supplemented ESRD patients with oral sodium bicarbonate. The
nPCR decreased significantly (1.13 + 0.14 g/kg/day to 1.05 + 0.14 g/kg/day, p < 0.0001)
(31). Lin et al. evaluated acidotic hemodialysis patients and the effect on nutritional
status of increasing the bicarbonate dialysate from 35 to 38 mmol/L for one month and
then to 38–40 mmol/L for five months. The nPCR was lower with those patients who had

31
a higher CO2 (p < 0.001). Lin et al. states, it appears a higher rate of endogenous protein
production, and therefore nPCR, from protein oxidation contributes to the lower
predialysis CO2 (26).
Subjective Global Assessment (SGA) scores were not calculated for patients at
RAI to determine nutrition status. Scores for SGA are based on a medical history and
physical examination using a four-item, seven-point scale by Baker and colleagues. A
higher score indicates better nutrition (66). Nutrition status for RAI patients are based on
findings from the Comprehensive Patient Nutrition Assessment and malnutrition
diagnosis criteria outlined in Appendix B. Albumin and nutrition status designation
negatively trended between subjects’ results and had an even stronger correlation with
the prior month’s nutrition status. A strong negative correlation was found because “well-
nourished” = 1, “mild” = 2, “moderate” = 3, and “severe malnutrition” = 4 on the patient
nutrition assessment, indicating a higher albumin did trend with a better nutrition status
of “1”. Nutrition status did not correlate with the same month’s CO2 or the prior month’s
CO2 in this study. Szeto et al. in 2003 found overall improved SGA score when
correcting CO2 in the treatment group compared the placebo group at 24 weeks (5.07
points + 0.94 vs. 4.40 points + 1.00, p = 0.015). This study’s results are more consistent
with Bossola et al. Bossolo and colleagues which showed no improved SGA after 12
months (4.53 points + 0.37 at baseline and 4.58 points + 0.54 (p = 0.1).
Analysis of covariance includes additional variables in the correlation, which
could have an impact on the dependent variable. Additional nutrition related covariates
such as hemoglobin, creatinine, nPCR, were analyzed with albumin and CO2 in a mixed
model ANCOVA. Other variables were attempted in the mixed model including impact of
age, gender, Pre-BUN, and nutrition status, however they were not significant (not
shown). ANCOVA correlations were higher and all significant for the prior month’s CO2
32
and albumin compared to the same month’s CO2 and albumin. ANCOVA correlations
were also all higher and significant compared to when albumin was analyzed alone with
CO2. Including multiple nutrition or inflammatory variables versus only albumin improved
the correlations with single variables in Table 6. Kovesdy et al. conducted a similar
analysis combining three biomarkers albumin, percent lymphocytes, and white blood
cells and their correlation on all-cause mortality in CKD patients. Lower serum albumin
and percent lymphocytes and a higher WBC count, alone or in combination, were
independently associated with increased all-cause mortality (67).
The within-subjects correlations provided positive correlations and significance.
The Pearson correlations assisted in detecting the lost negative correlation in the within-
subjects correlation. Phosphorus, potassium, and pre-BUN were negatively correlated
with CO2. Results indicate a higher CO2 trends with lower or more normal phosphorus,
potassium, and pre-BUN, which are consistent with findings by Wu et al. (20). The
variables did not trend as high when analyzed with the prior month’s CO2. Phosphorus,
potassium, and pre-BUN had lower correlations with the prior month’s CO2 and not all
variables were significant. The correlation of bone related labs, such as phosphorus,
with bicarbonate is consistent with the literature as metabolic acidosis worsens bone
disease (15, 68). Due to the buffer function of bone, calcium and phosphate release from
bone into blood stream (68). Potassium was inversely associated with bicarbonate. A
higher CO2 was associated with lower potassium in this study. A higher CO2 was
associated with a lower pre-BUN in this study. Pre-BUN was lowered by Ruggieri and
colleagues after correcting metabolic acidosis (29). Correction of acidosis can reduce
muscle protein degradation and reduce urea generation rates (23). Williams et al. found
a slight initial lowered BUN after one month of administering a high 40 mmol/L
bicarbonate bath. However they did not find continued lowered urea after 12 months (23).
33
Limitations
Using serum CO2 to determine metabolic acidosis has the potential for
inaccuracy if sample tubes are underfilled. Underfilled samples influence the dissipation
of CO2 and may result in falsely low measurements (13). Renal Advantage Inc.
employees who collect blood samples are educated on the correct method for collection
and handling upon hire. The blood samples were not analyzed at a close location to the
dialysis unit and were processed in Richmond, Mississippi by RenaLab. The mean total
CO2 content of shipped blood samples can be up to ~5 mEq/L lower than samples
processed immediately. Changes in atmospheric pressure in pressurized airliner cabins
or in the cargo hold lead to the escape of CO2 from the tube. If the sample is stored at
room temperature or refrigerated for 24 hours, without air transport, the change in total
CO2 is only ~1 mEq/L (2, 13).
Certain labs are only collected on a monthly basis, such as CO2 and albumin.
One monthly result does not fully determine health trends throughout the rest of the
month on patients. A nutrition assessment was conducted for most patients one time per
year, which does not reflect the nutrition status of the patient throughout the rest of the
year. Race/ethnic group was excluded due a significant amount of missing
demographics. This was due to the newness of the electronic medical record system for
the time the limited data set was collected.
This study was limited by its observational design and establishes associations.
The sample was from a single clinic and therefore may not generalize to the entire
ESRD population. It would be beneficial for future researchers to both provide
intervention of correcting metabolic acidosis and assess the impact the prior month’s
bicarbonate on nutrition biomarkers and nutrition status.
34
Implications
In the current study, the prior month’s CO2 as a single variable did not
significantly correlate with albumin. When including additional continuous variable
nutrition biomarkers with the prior month’s CO2, the selected biomarkers significantly
correlated with albumin within-subjects (r = 0.093, p = 0.004). The results suggest the
possibility of using a combination of biomarkers (covariates) to indicate changes in
nutrition, which can be used in future interventions. Albumin is useful in trending nutrition,
however should be used in combination as illustrated with other biomarkers to assess
overall nutrition status in ESRD.
Conclusion
Low serum bicarbonate, indicating metabolic acidosis, influences nutritional
assessment indices in hemodialysis patients. Prior month’s serum bicarbonate (~ 20
days ago) impacts current albumin slightly more than current serum bicarbonate in a
mixed-model ANCOVA within-subjects. Conducting this project provided further insight
into the importance of preventing metabolic acidosis to improve nutrition biomarkers as
well as portraying one more limitation of albumin as the main nutrition indicator in
hemodialysis.

35
Chapter 6
SUMMARY
The purpose of this thesis was to: (1) determine whether serum CO2 influences
nutrition assessment indices in hemodialysis patients; and (2) demonstrate the prior
month’s CO2 level has a greater impact on current serum albumin versus the current
month’s serum bicarbonate in hemodialysis patients. The sample consisted of adult in-
center hemodialysis patients at RAI in Westwood, KS.
A limited data set with 144 patients was created by RAI. Laboratory and medical
histories were collected for about one year. Data was collected from electronic medical
records from December 2010 through January 2012.
Within-subject correlations and analysis of covariance (ANCOVA) were used to
analyze individual variables and a mixed-model to determine correlations within
individuals. Pearson and Spearman correlations were calculated to ensure reliability of
the within-subjects correlations for variables across subjects. Pearson and Spearman
correlations assisted in determining the directionality (positive or negative) of the
correlation as within-subject correlations lose negative directionality when calculating
with a square root.
A correlation was found between the single variables albumin and CO2 collected
in the same month (p = 0.005) however not the prior month’s CO2 when looking at the
individual (within-subjects) (p = 0.140). A significant Pearson correlation was found with
albumin and the prior month’s CO2 when looking at the group as a whole (p = 0.002).
The correlations for albumin and the prior month’s CO2 improved within-subjects when
including additional nutritional and inflammation biomarkers in a mixed model ANCOVA.
This suggests including additional covariates provide a better indication of overall
nutrition status in hemodialysis patients versus only albumin when evaluating the impact
36
of metabolic acidosis. A mixed model ANCOVA demonstrates the prior month’s serum
CO2 level has a greater impact on current serum albumin versus the current month’s
serum CO2 in hemodialysis patients (p = 0.004 vs. p = 0.41).
Therefore, the prior month’s CO2 significantly correlated to albumin within-
subjects when including covariates. Results suggest the importance of considering
additional biomarkers to indicate overall nutrition status in hemodialysis patients. Further
intervention-based studies are needed to confirm these results.
37
REFERENCES
1. Eustace JA, Astor B, Muntner PM, Ikizler TA, Coresh J. Prevalence of acidosis and inflammation and their association with low serum albumin in chronic kidney disease. Kidney Int 2004;65(3):1031-40. doi: 10.1111/j.1523-1755.2004.00481.x.
2. National Kidney Foundation. NKF-KDOQI Clinical Practice Guidelines: Nutrition in chronic renal failure: Management of acid base status. Am J Kidney Dis 2000;35:S38-S9.
3. Roderick P, Willis NS, Blakeley S, Jones C, Tomson C. Correction of chronic metabolic acidosis for chronic kidney disease patients. Cochrane Database Syst Rev 2007(1):CD001890. doi: 10.1002/14651858.CD001890.pub3.
4. Muscaritoli M, Molfino A, Bollea MR, Rossi Fanelli F. Malnutrition and wasting in renal disease. Curr Opin Clin Nutr Metab Care 2009;12(4):378-83. doi: 10.1097/MCO.0b013e32832c7ae1.
5. National Kidney Foundation. Dialysis. Version current as of 2011. Available at: http://wwwkidneyorg/atoz/content/dialysisinfocfm (accessed 31 October 2011).
6. Steinman TI. Serum albumin: Its significance in patients with ESRD. Semin Dial 2000;13(6):404-8.
7. Friedman AN, Fadem SZ. Reassessment of albumin as a nutritional marker in kidney disease. J Am Soc Nephrol 2010;21(2):223-30. doi: 10.1681/asn.2009020213.
8. National Kidney Foundation. NKF-KDOQI Clinical Practice Guidelines: Nutrition in chronic renal failure: Serum albumin. Am J Kidney Dis 2000;35:S20-S1.
9. Menon V, Tighiouart H, Vaughn NS, et al. Serum bicarbonate and long-term outcomes in CKD. Am J Kidney Dis 2010;56(5):907-14. doi: 10.1053/j.ajkd.2010.03.023.
10. U.S. Renal Data System. USRDS 2012 Annual Data Report: Atlas of Chronic Kidney Disease and End-Stage Renal Disease in the United States, National Institutes of Health, National Institute of Diabetes and Digestive and Kidney Diseases. Bethesda, MD, 2012.
11. National Kidney Foundation. NKF-K/DOQI Clinical Practice Guidelines for Chronic Kidney Disease: Evaluation, Classification and Stratification. Am J Kidney Dis 2002;39:S1-S266.
12. Kuhlmann MK, Levin NW. How common is malnutrition in ESRD? New approaches to diagnosis of malnutrition. Blood Purif 2008;26(1):49-53. doi: 10.1159/000110564.

38
13. Kalantar-Zadeh K, Mehrotra R, Fouque D, Kopple JD. Metabolic acidosis and malnutrition-inflammation complex syndrome in chronic renal failure. Semin Dial 2004;17(6):455-65. doi: 10.1111/j.0894-0959.2004.17606.x.
14. Ayers P, Dixon C. Simple acid-base tutorial. JPEN J Parenter Enteral Nutr 2012;36(1):18-23. doi: 10.1177/0148607111429794.
15. Kraut JA, Madias NE. Consequences and therapy of the metabolic acidosis of chronic kidney disease. Pediatr Nephrol 2011;26(1):19-28. doi: 10.1007/s00467-010-1564-4.
16. Metheny NM. Fluid & Electolyte Balance Nursing Considerations. 4th. ed. Chapter 9: Acid-Base Imbalances. Philadelphia, PA: Lippincott, 2000:160.
17. Chiu YW, Mehrotra R. What should define optimal correction of metabolic acidosis in chronic kidney disease? Semin Dial 2010;23(4):411-4. doi: 10.1111/j.1525-139X.2010.00749.x.
18. Raphael KL, Wei G, Baird BC, Greene T, Beddhu S. Higher serum bicarbonate levels within the normal range are associated with better survival and renal outcomes in African Americans. Kidney Int 2011;79(3):356-62. doi: 10.1038/ki.2010.388.
19. Soleymanian T, Ghods A. The deleterious effect of metabolic acidosis on nutritional status of hemodialysis patients. Saudi J Kidney Dis Transpl 2011;22(6):1149-54.
20. Wu DY, Shinaberger CS, Regidor DL, McAllister CJ, Kopple JD, Kalantar-Zadeh K. Association between serum bicarbonate and death in hemodialysis patients: Is it better to be acidotic or alkalotic? Clin J Am Soc Nephrol 2006;1(1):70-8. doi: 10.2215/cjn.00010505.
21. Pifer TB, McCullough KP, Port FK, et al. Mortality risk in hemodialysis patients and changes in nutritional indicators: DOPPS. Kidney Int 2002;62(6):2238-45. doi: 10.1046/j.1523-1755.2002.00658.x.
22. Gennari FJ. Very low and high predialysis serum bicarbonate levels are risk factors for mortality: What are the appropriate interventions? Semin Dial 2010;23(3):253-7. doi: 10.1111/j.1525-139X.2010.00737.x.
23. Williams AJ, Dittmer ID, McArley A, Clarke J. High bicarbonate dialysate in haemodialysis patients: Effects on acidosis and nutritional status. Nephrol Dial Transplant 1997;12(12):2633-7.
24. King RS, Glickman JD. Electrolyte management in frequent home hemodialysis. Semin Dial 2010;23(6):571-4. doi: 10.1111/j.1525-139X.2010.00792.x.
25. Szeto CC, Chow KM. Metabolic acidosis and malnutrition in dialysis patients. Semin Dial 2004;17(5):371-5. doi: 10.1111/j.0894-0959.2004.17347.x.

39
26. Lin SH, Lin YF, Chin HM, Wu CC. Must metabolic acidosis be associated with malnutrition in haemodialysed patients? Nephrol Dial Transplant 2002;17(11):2006-10.
27. de Brito-Ashurst I, Varagunam M, Raftery MJ, Yaqoob MM. Bicarbonate supplementation slows progression of CKD and improves nutritional status. J Am Soc Nephrol 2009;20(9):2075-84. doi: 10.1681/asn.2008111205.
28. Blair D, Bigelow C, Sweet SJ. Nutritional effects of delivered bicarbonate dose in maintenance hemodialysis patients. J Ren Nutr 2003;13(3):205-11.
29. Ruggieri F, Caso G, Wegmann M, et al. Does increasing blood pH stimulate protein synthesis in dialysis patients? Nephron Clin Pract 2009;112(4):c276-83. doi: 10.1159/000224795.
30. Verove C, Maisonneuve N, El Azouzi A, Boldron A, Azar R. Effect of the correction of metabolic acidosis on nutritional status in elderly patients with chronic renal failure. J Ren Nutr 2002;12(4):224-8.
31. Movilli E, Viola BF, Camerini C, Mazzola G, Cancarini GC. Correction of metabolic acidosis on serum albumin and protein catabolism in hemodialysis patients. J Ren Nutr 2009;19(2):172-7. doi: 10.1053/j.jrn.2008.08.012.
32. Fouque D, Kalantar-Zadeh K, Kopple J, et al. A proposed nomenclature and diagnostic criteria for protein-energy wasting in acute and chronic kidney disease. Kidney Int 2008;73(4):391-8. doi: 10.1038/sj.ki.5002585.
33. Sipahioglu MH, Levin NW. Improvement of albumin control in hemodialysis patients – What is possible? US Nephrology 2008;3(2):54-8.
34. Kamimura MA, Majchrzak KM, Cuppari L, Pupim LB. Protein and energy depletion in chronic hemodialysis patients: clinical applicability of diagnostic tools. Nutr Clin Pract 2005;20(2):162-75.
35. Renal Advantage Incorporated. Laboratory Prescription Form. Clinical Forms November 2011.
36. RenaLab Incorporated. Section H: Packing and shipping laboratory samples rev 20. RenaLab Polices and Procedures 2011 Reference Manual 2011.
37. Renal Advantage Incorporated. TIME InCenter Training Manual: Flowsheet Renal Advantage Training Manual 2009:67-86.
38. Renal Advantage Incorporated. TIME Home Therapy Training: HH Flowsheet. Renal Advantage Training Manual 2009:103-25.
39. Yale-New Haven Department of Dietetics and Nutrition. Table 4: Protein Calorie Malnutrition Diagnostic Criteria. Adult Nutrition Care Manual 2008:IV-14A.
40
40. Skipper A. AND/A.S.P.E.N. Clinical characteristics that the RD can obtain and document to support a diagnosis of malnutrition. Nutrition Care Manual. Current as of 18 October 2011. Available at http://nutritioncaremanual.org/category.cfm?ncm_category_id=11. Accessed 25 September 2012.
41. RenaLab Incorporated. Section C: Test samples (A-H). RenaLab Polices and Procedures 2011 Reference Manual 2011.
42. Duly EB, Grimason S, Grimason P, Barnes G, Trinick TR. Measurement of serum albumin by capillary zone electrophoresis, bromocresol green, bromocresol purple, and immunoassay methods. J Clin Pathol 2003;56:780–1.
43. BD Company. Product Catalog: Venous Blood Collection Tubes Product 367988. Current as of 2011. Available at: http://catalog.bd.com/bdCat/viewProduct.doCustomer?productNumber=367988 (accessed 15 September 2012).
44. National Kidney Foundation. NKF-KDOQI Clinical Practice Guidelines for Bone Metabolism and Disease in Chronic Kidney Disease. Am J Kidney Dis October 2003;42(4):S80.
45. National Kidney Foundation. NKF-KDOQI Clinical Practice Guidelines: Nutrition in chronic renal failure: Serum creatinine and the creatinine index. Am J Kidney Dis 2000;35:S23-S4.
46. Peake M, Whiting M. Measurement of serum creatinine--Current status and future goals. Clin Biochem Rev 2006;27(4):173-84.
47. World Health Organization. Blood Safety and Clinical Technology. Guidelines on Standard Operating Procedures for Clinical Chemistry: Creatinine – Jaffe’s method. Current as of 27 April 2006. Available at: http://www.searo.who.int/en/Section10/Section17/Section53/Section481_1755.htm (accessed 25 September 2012).
48. National Kidney Foundation. NKF-KDOQI Clinical Practice Guidelines and Practice Recommendations for Anemia in Chronic Kidney Disease. Am J Kidney Dis 2006;47(5):S11-S2.
49. Renal Advantage Incorporated. Hemodialysis Standards and Outcome Goals. Clinical Forms August 2011.
50. BD Company. Product Catalog: Venous Blood Collection Tubes Product 367841. Current as of 2011. Available at: http://catalog.bd.com/bdCat/viewProduct.doCustomer?productNumber=367841 (accessed 15 September 2012).
51. RenaLab Incorporated. Section D: Test samples (I-Z). RenaLab Polices and Procedures 2011 Reference Manual 2011.
41
52. National Kidney Foundation. NKF-KDOQI Clinical Practice Guidelines for Bone Metabolism and Disease in Chronic Kidney Disease. Am J Kidney Dis October 2003;42(4):S29.
53. National Kidney Foundation. NKF-KDOQI Cinical Practice Guidelines and Clinical Practice Recommendations for Hemodialysis Adequacy: 2006 Updates. Am J Kidney Dis 2006;48(S1-S322).
54. National Kidney Foundation. Tests to measure kidney function, damage, and detect abnormalities. Version current as of 2012. Available at: http://wwwkidneyorg/atoz/content/kidneytestscfm (accessed 8 October 2012).
55. Daugirdas JT. Estimation of equilibarated Kt/V using the unequilibrated post dialysis BUN. Semin Dial 1995;8:283-4.
56. Daugirdas JT. Second generation logarithmic estimates of single-pool variable volume Kt/V: An analysis of error. JASN 1993;4(5):1205-13.
57. BD Company. Product Catalog: Venous Blood Collection Tubes Product 366667. Current as of 2011. Available at: http://catalog.bd.com/bdCat/viewProduct.doCustomer?productNumber=366667. (accessed September 2012).
58. National Kidney Foundation. NKF-KDOQI Clinical Practice Guidelines: Nutrition in chronic renal failure: Protein equivalent of total nitrogen appearance (PNA). Am J Kidney Dis 2000;35:S28-S9.
59. Bland JM, Altman DG. Calculating correlation coefficients with repeated observations: Part 1--Correlation within subjects. BMJ 1995;310(6977):446.
60. Department of Health and Human Services and Center for Medicare and Medicaid Services. List of primary causes of end stage renal disease: Form CMS-2728-U3. End Stage Renal Disease Medical Evidence Report Medicare Entitlement And/Or Patient Registration; March 2006.
61. National Heart Lung and Blood Institute, National Institutes of Health. Calculate your body mass index. Current as of 2 September 2012. Available at: http://www.nhlbisupport.com/bmi/ (accessed 2 September 2012).
62. Renal Advantage Incorporated. Comprehensive Patient Assessment: TIME CfC Changes. Renal Advantage Clinical Forms: Conditions for Coverage Training Documents Revised 5 September 2008.
63. Polit D, Beck C. Nursing Research: Generating and Assessing Evidence for Nursing Practice. 8th. ed. 2008:289, 571, 599-600, 747.
64. Bossola M, Giungi S, Tazza L, Luciani G. Long-term oral sodium bicarbonate supplementation does not improve serum albumin levels in hemodialysis patients. Nephron Clin Pract 2007;106(1):c51-6. doi: 10.1159/000101484.
42
65. Movilli E, Zani R, Carli O, et al. Correction of metabolic acidosis increases serum albumin concentrations and decreases kinetically evaluated protein intake in haemodialysis patients: A prospective study. Nephrol Dial Transplant 1998;13(7):1719-22.
66. Baker JP, Detsky AS, Wesson DE, et al. Nutritional assessment: a comparison of clinical judgement and objective measurements. N Engl J Med 1982;306(16):969-72. doi: 10.1056/nejm198204223061606.
67. Kovesdy CP, George SM, Anderson JE, Kalantar-Zadeh K. Outcome predictability of biomarkers of protein-energy wasting and inflammation in moderate and advanced chronic kidney disease. Am J Clin Nutr 2009;90(2):407-14. doi: 10.3945/ajcn.2008.27390.
68. Oka M, Ohtake T, Mochida Y, et al. Correlation of coronary artery calcification with pre-hemodialysis bicarbonate levels in patients on hemodialysis. Ther Apher Dial 2012;16(3):267-71. doi: 10.1111/j.1744-9987.2011.01054.x.

43
APPENDICES
44
APPENDIX A
Renal Advantage Incorporated Comprehensive Patient Assessment:
Dietitian/Nutritional Assessment

45
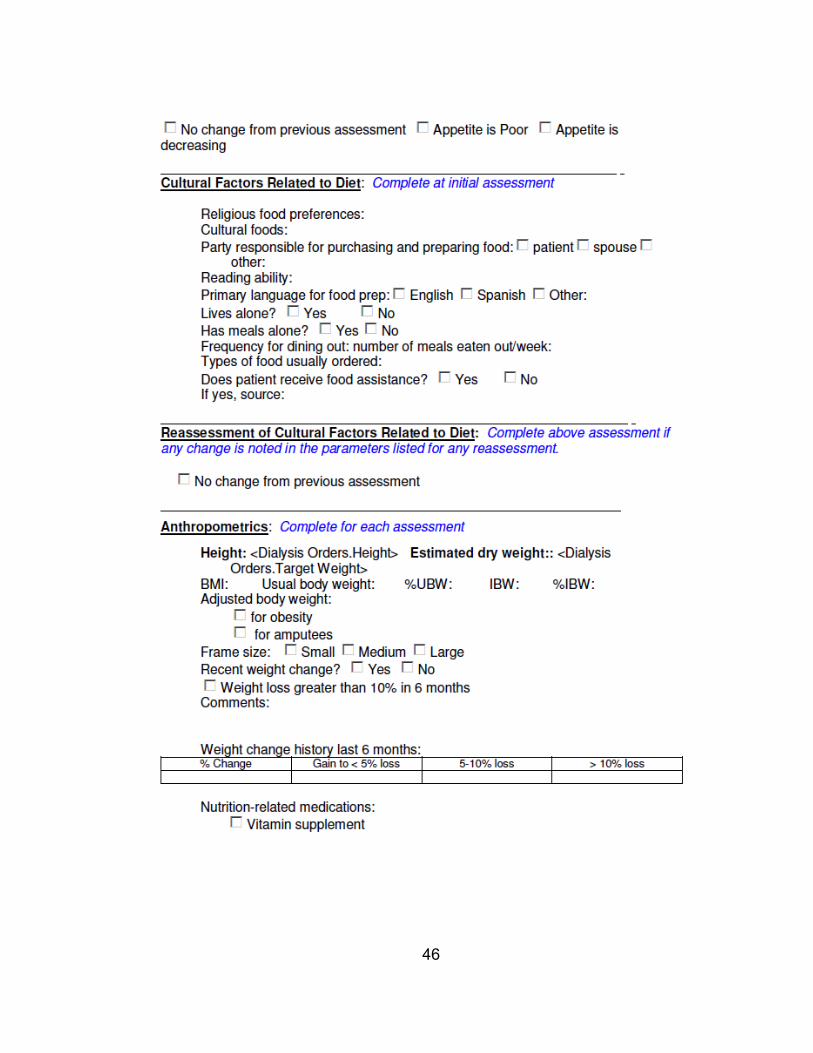
46
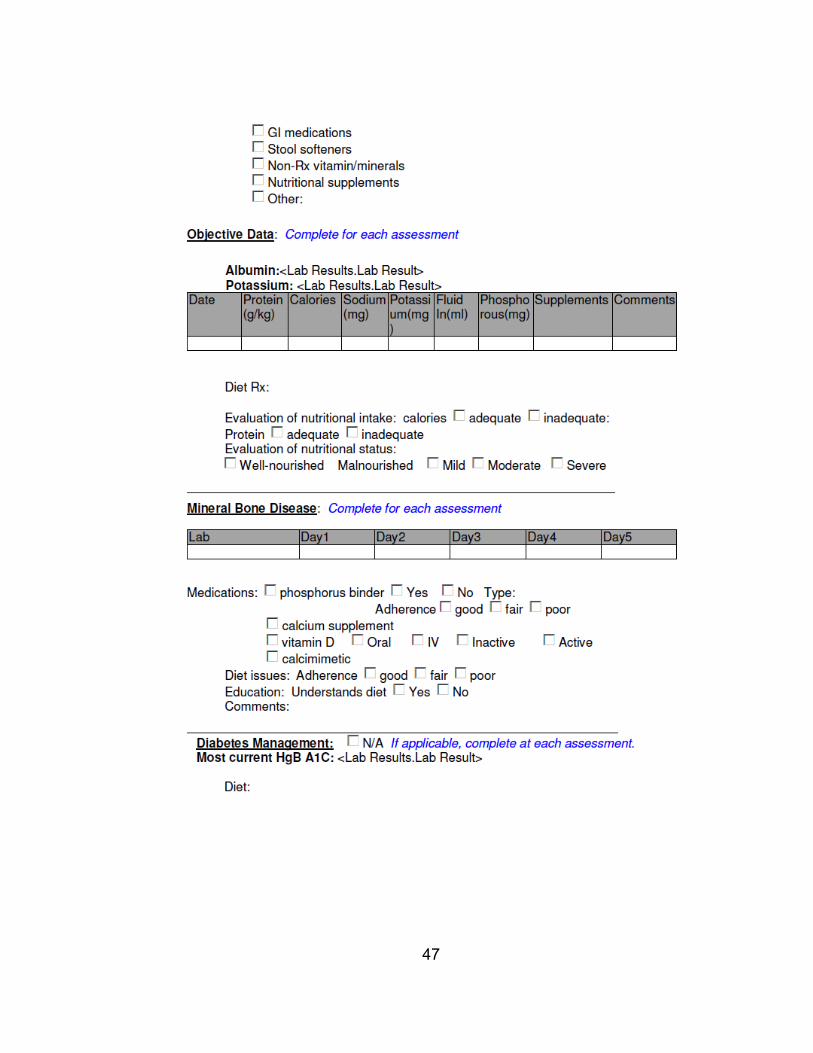
47
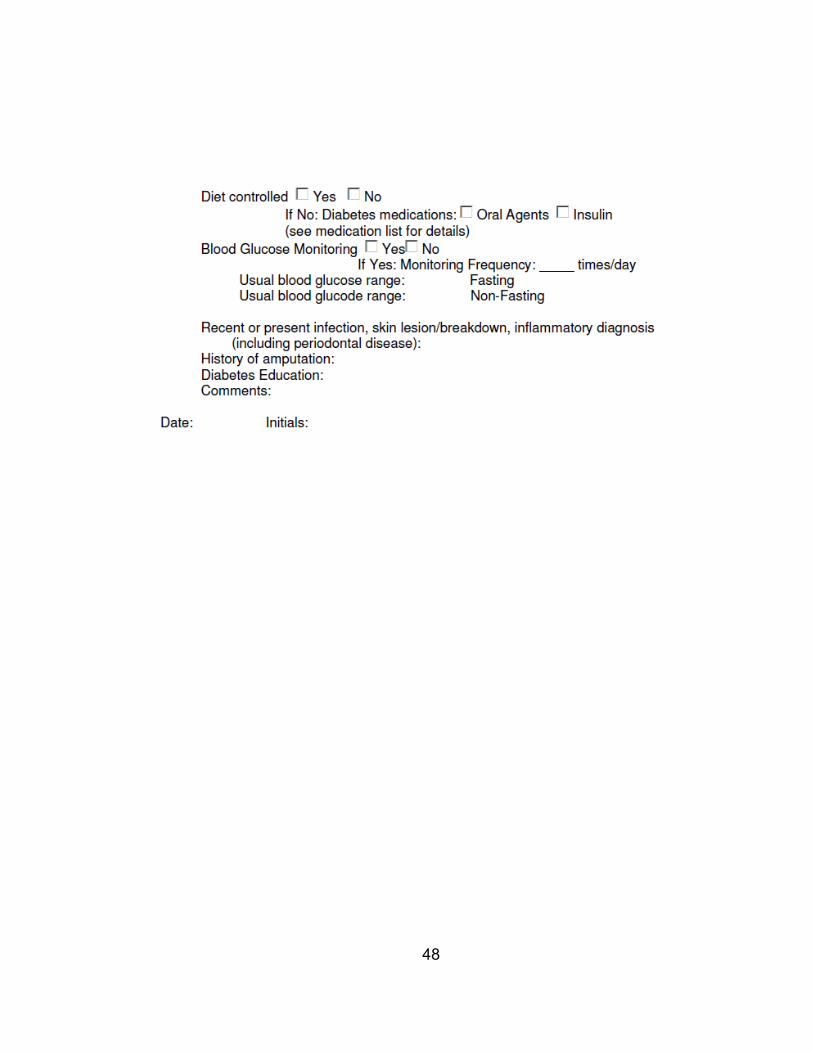
48
‘

49
APPENDIX B:
Nutrition Status Criteria

50
Nutrition Status Criteria
Malnutrition of
Mild Degree Malnutrition of
Moderate Degree
Unspecified Severe Protein Calorie
Malnutrition Albumin 3-3.4 g/dL <2.9 g/dL <2.5 g/dL
Edema N/A N/A May be present % IBW/UBW or
BMI <95% <92% <90%
And/or BMI <17 % Weight loss 3-5% in 1 month
or 5.5-7.5% in 3
months or 8-10% in 6
months
>5% in 1 month or >7.5% in 3 months or
>10% in 6 months
> 15%
Muscle Mass N/A N/A Wasting Poor PO Yes Yes Possible
Criteria needed 2 of the above 2 of the above All of the Above