the contribution of entropy, enthalpy, and hydrophobic...
TRANSCRIPT

Structure
Article
The Contribution of Entropy, Enthalpy,and Hydrophobic Desolvation to Cooperativityin Repeat-Protein FoldingTural Aksel,1,2 Ananya Majumdar,3 and Doug Barrick2,*1Institute for Multiscale Modeling of Biomolecular Interactions2T.C. Jenkins Department of Biophysics3The Johns Hopkins University Biomolecular NMR CenterJohns Hopkins University, Baltimore, MD 21218, USA
*Correspondence: [email protected]
DOI 10.1016/j.str.2010.12.018
SUMMARY
Cooperativity is a defining feature of protein folding,but its thermodynamic and structural origins are notcompletely understood. By constructing consensusankyrin repeat protein arrays that have nearlyidentical sequences, we quantify cooperativity byresolving stability into intrinsic and interfacialcomponents. Heteronuclear NMR and CD spectros-copy show that these constructs adopt ankyrinrepeat structures. Applying a one-dimensional Isingmodel to a series of constructs chosen to maximizeinformation content in unfolding transitions, wequantify stabilities of the terminal capping repeats,and resolve the effects of denaturant into intrinsicand interfacial components. Reversible thermaldenaturation resolves interfacial and intrinsic freeenergies into enthalpic, entropic, and heat capacityterms. Intrinsic folding is entropically disfavored,whereas interfacial interaction is entropically favoredand attends a decrease in heat capacity. Theseresults suggest that helix formation and backboneordering occurs upon intrinsic folding, whereashydrophobic desolvation occurs upon interfacialinteraction, contributing to cooperativity.
INTRODUCTION
Cooperativity is a hallmark of protein folding, involving energetic
coupling of elements that are distant in sequence and structure.
Despite a long-standing appreciation of the significance of coop-
erativity in protein folding (Lumry and Biltonen, 1966), experi-
mental studies of cooperativity are typically restricted to
a ‘‘yes’’ (the transition is all-or-none) or ‘‘no’’ (the transition has
populated intermediates) description. Equilibrium unfolding
transitions, induced most often by chemical denaturants or
temperature increase, are tested for: (1) a single, sigmoidal tran-
sition that can be fittedwith a two-statemodel; (2) coincidence of
transitionsmeasured by different probes; and (3) sensitivity coef-
ficients (m-values for chemical denaturation; DCp andDH values
Structure 19,
for thermal denaturation) that match empirical relations (Myers
et al., 1995; Robertson and Murphy, 1997). In favorable cases,
van’t Hoff (two-state model-dependent) enthalpies can be
compared to calorimetric enthalpies. These approaches have
shown all-or-none cooperativity to be common in folding of
both globular proteins and inmany elongated proteins. However,
the underlying structural and thermodynamic mechanisms of
cooperativity (i.e., quantitative coupling energies and entropies)
have remained elusive.
Substantial insight into the cooperativity of the folding transi-
tion has come from a marriage of statistical thermodynamics
and simplified structural models and energy functions. Lattice
models with native-centric energy functions (Go, 1983; Taketomi
et al., 1975) show some features of cooperative folding, suggest-
ing that a mismatch between entropy and enthalpy decreases
may contribute to a free-energy barrier separating the native
and denatured states, a suggestion supported using off-lattice
models (Oliveberg and Wolynes, 2005; Onuchic et al., 2000;
Thirumalai and Hyeon, 2005; Weinkam et al., 2005). These
simplified models suggest plausible sources of cooperativity
but cannot quantitatively resolve cooperativity into its energetic
and structural components.
Quantitative dissection of protein folding cooperativity
requires statistical thermodynamic models that can be used to
analyze data directly. Nearest-neighbor or ‘‘Ising’’ models (Ising,
1925; Poland and Scheraga, 1970) have been a staple for
analyzing cooperativity in simple linear systems, including the
helix-coil transition (Doig, 2002; Poland and Scheraga, 1970;
Zimm, 1960), and magnetization in arrays of spins systems
(Ising, 1925; Onsager, 1944). These models represent structure
with repeating units, and give conformational energy as a sum
of intrinsic stabilities of the units and coupling energies between
neighboring units. The magnitude of the interfacial coupling
energy, along with the instability of individual units, determines
the extent of cooperativity of the system as a whole. Although
there has been interest in applying these models to globular
proteins (Munoz, 2001), the heterogeneity of globular proteins
precludes representation in terms of structural units and their
intrinsic and interactions energies.
In the last decade, proteins with regular, repetitive structure
have become increasingly popular for studies of protein folding
(Kloss et al., 2008) and for application of Ising models (Aksel
and Barrick, 2009; Kajander et al., 2005; Mello and Barrick,
349–360, March 9, 2011 ª2011 Elsevier Ltd All rights reserved 349

Table 1. Ankyrin Consensus Sequence and Variants Used in This
Study
1 6 11 16 21 26 31
d d d d d d d
Secondary
StructureaeeeeeeHHHHHHHeeeHHHHHHHHHeeeeeeee
N-terminal
cap (N)
SKDGNTPLHNAAKNGHAEEVKKLLSKGADVNAR
Consensus
repeat (R)
SKDGNTPLHLAAKNGHAEIVKLLLAKGADVNAR
Consensus
trp-substituted
repeat (W)
SKDGWTPLHLAAKNGHAEIVKLLLAKGADVNAR
C-terminal
cap (C)
SKDGNTPEHLAKKNGHHEIVKLLDAKGADVNAR
d d d d d d d
1 6 10 16 21 26 31
Sequence substitutions to capping repeats (N and C) and to introduce
a tryptophan at position five (N5W) are shown in bold.a The secondary structure, as determined by TALOS+ (Shen et al., 2009)
for the central repeat (R) of NRC, is shown along with the numbering
scheme used here (H, helix; e, extended). See Figure S5 for cloning
procedures.
Structure
Entropy and Enthalpy of Repeat Protein Folding
2004; Wetzel et al., 2008). Analysis of folding energies of a series
of overlapping ankyrin repeat constructs (33 residues each) from
the Drosophila Notch receptor indicates that cooperativity
results from stabilizing nearest-neighbor interactions that offset
intrinsically unstable repeats, although sequence variation
among repeats prevents analysis at the single-repeat level.
Recently, several groups have built and analyzed repeat
proteins with greatly reduced sequence variation, thereby
enablingmore exact thermodynamicmodels of folding (Kajander
et al., 2005;Mosavi et al., 2002;Wetzel et al., 2008). Here, we use
a series ankyrin constructs that have nearly identical repeats to
give a complete description of folding thermodynamics. The
structure of a three-repeat construct matches the target ankyrin
fold. Guanidine hydrochloride (GdnHCl) and thermal denatur-
ation of this series are resolved into intrinsic and interfacial ener-
gies, providing a quantitative representation of folding coopera-
tivity. Intrinsic and interfacial energies are further resolved into
enthalpic and entropic components, as well as GdnHCl sensi-
tivity and heat capacity terms. Both chain entropy decrease
and hydrophobic desolvation play a major role in folding cooper-
ativity, which is enhanced by GdnHCl.
RESULTS
Sequence DesignSeveral laboratories have shown that identical consensusankyrin
repeat proteins (CARPs) require modification of the terminal
repeats for high solubility. Pluckthun and coworkers (Wetzel
et al., 2008) built soluble, folded CARPs using N- and C-terminal
caps from GABP-b, a naturally occurring ankyrin repeat protein,
(18 and 17 sequence differences between N- and C-terminal
caps and internal repeats). We obtained soluble CARPs by
embedding a different consensus sequence within the ankyrin
domain of the Drosophila Notch receptor (Tripp and Barrick,
2007). Here, we sought to maintain solubility of this consensus
sequence using single-repeat ‘‘caps’’ that closely match the
consensus sequence. This capping strategy resembles that of
Mosavi and Peng (2003), which targeted nonpolar residues on
the solvent-exposed face of the terminal repeats.We substituted
four nonpolar residues each on the N- and C-terminal repeats
with charged or polar residues (Table 1).
To further minimize sequence differences, we characterized
constructs with a single capping repeat, either at the N or
C terminus. These constructs are essential for resolving stability
differences between capping and internal repeats (Aksel and
Barrick, 2009). Feasibility of this single-cap approach was sug-
gested from studies of singly capped consensus TPR arrays
(Main et al., 2003) and by studies of Notch-consensus fusions
(Tripp and Barrick, 2007). To monitor unfolding using fluores-
cence, we replaced an asn at position five with a trp (Table 1,
repeat W). In the hidden Markov model on which the ankyrin
consensus sequence is based (Finn et al., 2008), this is the
most common position for trp.
Solution Structure of CARPsCARPs containing single capping repeats at either the N
terminus or the C terminus expressed to high levels in E. coli,
as did doubly capped constructs. Although CARPs partitioned
largely to the cell pellet, they could be solubilized, purified, and
350 Structure 19, 349–360, March 9, 2011 ª2011 Elsevier Ltd All righ
highly concentrated. All constructs have a-helical secondary
structure, as judged by far-UV CD spectroscopy (Figure 1A).
For constructs lacking trp at consensus position five, we find
only minor differences in molar residue ellipticity from construct
to construct. These differences are no larger than prep-to-prep
variation and are likely to result from uncertainties in concentra-
tion determination, rather than differences in structure. To
compare shapes of CD spectra of different constructs, we
scaled spectra from 206 to 222 nm (Figure 1A). For constructs
lacking trp substitutions, spectral shapes are nearly identical,
indicating a similar secondary structure content. Constructs
with trp at position five show a positive CD feature around
230 nm, likely a result of exciton coupling of the trp side chains.
Velocity sedimentation studies indicate that constructs contain-
ing N-caps are monomeric to concentrations above 100 mM
(see Figure S1 available online). For R4C, we find a weak
tendency toward self-association, although at concentrations
used here for unfolding studies, only monomeric protein would
be populated.
To probe whether these constructs adopt an ankyrin fold, we
used NMR to determine the structure of NRC. Although the three
repeats have high sequence similarity, the 1H-15N-HSQC spec-
trum of NRC shows high dispersion. A total of 126 cross-peaks
can be detected, and almost all are baseline resolved (Figure 2A).
This is close to the 135 potential cross-peaks expected from
primary sequence (113 non-prolyl backbone NHs, two trp side
chain NHs, ten asn side chain NH2s).
Using standard 3D NMR methods (Figure S2), we assigned
backbone and side chain 15N, 13C, and 1H resonances, and
measured 1H-1H NOE intensities. We could assign 104 back-
bone NH resonances, including all NHs in the ankyrin repeats.
Consistent with known ankyrin repeat structures, we find two
stretches with measurable H(N),H(N)(i,i+1) and Ha,HN(i,i+3)
ts reserved

Figure 1. Far UV CD Spectra and GdnHCl-Unfolding Transitions
of CARPsTo compare shape (A), spectra are scaled to the same average intensity asNR2
from 206 to 222 nm. Spectra have similar shapes, except for constructs with
trp substitution at position five. (B) GdnHCl titration of CARPs. Constructs
are as indicated in the legend. Lines result from global fits of an Ising model
to the transitions shown here and to two replicate transitions for each
construct (data not shown). Curves are normalized after fitting by subtracting
the fitted baselines. Transitions are independent of concentration over the
range studied here (see text and Figure S1). Conditions: 150 mM NaCl,
25 mM Tris-HCl (pH 8.0), 20�C.
Structure
Entropy and Enthalpy of Repeat Protein Folding
NOEs, positive 13Ca and 13CO chemical shift deviation, and
negative 1Ha chemical shift deviation in each repeat (Figure 2B).
Inputting chemical shifts into TALOS+ (Shen et al., 2009), two
helices are predicted in the same position of each repeat, match-
ing helix locations in known ankyrin repeat proteins.
To determine the structure and relative orientations of the an-
kyrin repeats of NRC, we generated and refined 20 structural
models using short- and long-range 1H-1H NOEs (Table 2). To
help define relative orientations of the helices with respect to
the molecular axis, we included residual dipolar couplings
(RDCs) from a partly aligned NRC sample at a late stage of struc-
tural refinement. Resulting structures superpose well over the
helical regions of the three repeats, with an average backbone
rmsd of 1.0 A (Table 2 and Figure 3) (PDB ID 2L6B). Residues
on the N and C termini with significantly higher rmsd are not
part of the consensus ankyrin sequence but correspond to
cloning sites and the his6-tag, respectively (Figure 2B).
Structure 19,
Measured RDC values, which vary significantly throughout the
sequence (but show regular periodicity among repeats)
(Figure 2B), are consistent with the resulting structures (Fig-
ure 3D). The solution structure of NRC is very similar to other
ankyrin repeat proteins (Figures 3A and 3B). As designed, the
substitutions in the N- and C-terminal caps are solvent exposed
and point away from the central repeat (Figure 3D). Thus, these
substitutions are not expected to perturb interaction with neigh-
boring repeats.
To assess dynamic flexibility, we measured R1 and R2 values
for backbone 15N nuclei, and quantified 15N-1H NOE intensities.
Data were analyzed using ModelFree, and local (residue by
residue) motional models were selected based on comparison
of c2 values, assuming an F distribution (Mandel et al., 1995).
We find uniformly low dynamic motion (high-order parameter,
S2) extending from the start of the first helix of the N-cap through
the last helix of the C-cap (Figure 4). This includes the two
extended recognition loops that connect adjacent repeats
(N to R and R to C). The observation that these loops are well
ordered in an unbound state (and in a construct defined only
by consensus information) suggests that this important recogni-
tion element can be rigid on the ps-ns timescale, as was
observed in p19INK4d (five repeats) (Renner et al., 1998). The
increased motion seen in the binding loops of IkBa (six repeats)
(Cervantes et al., 2009) may reflect the greater overall dynamics
seen in the unbound state of that particular protein. Not surpris-
ingly, the terminal regions of NRC, which show higher backbone
rmsd values, show significantly lower S2 values, i.e., significantly
higher conformational dynamics on the ps-ns timescale.
GdnHCl-Induced Unfolding Transitions of CARPsTo measure CARP stability, the effects of the N- and C-terminal
capping substitution, and to resolve stability into intrinsic and
nearest-neighbor interaction energies using an Ising model, we
monitored GdnHCl-induced unfolding using CD spectroscopy.
We have measured unfolding curves on four different series of
CARPS of different lengths. One series includes only N-terminal
caps (NR to NR4; two to five repeats, respectively), a second
includes only C-terminal caps (R2C to R4C, three to five repeats),
and a third includes both N- and C-terminal caps (NRC to NR3C,
three to five repeats). In addition a fourth series includes one or
more trp-substituted consensus repeats with different capping
configurations (NW, NW2, W2C, NWC). For R4C, which shows
weak self-association by AUC, unfolding transitions are indepen-
dent of concentration from 0.6 to 12 mM (Figure S1).
Several general trends emerge from the GdnHCl-unfolding
transitions (Figure 1B): (1) all constructs unfold with a single sig-
moidal transition; (2) within each series, stability increases with
repeat number, as seen by increases in the GdnHCl-unfolding
midpoint; (3) the steepness of the transition increases with
increasing repeat number; (4) comparing constructs of the
same length but different end repeats shows capping repeats
to contribute less to stability than internal consensus repeats;
(5) of the two caps, the C-terminal caps are least stabilizing, as
was seen by Yu et al. (2006); and (6) trp substitution at position
five is stabilizing; this unexpected stability enhancement permits
a full unfolding transition to be observed for a two-repeat
construct (NW), which strongly constrains the fitted values of
349–360, March 9, 2011 ª2011 Elsevier Ltd All rights reserved 351
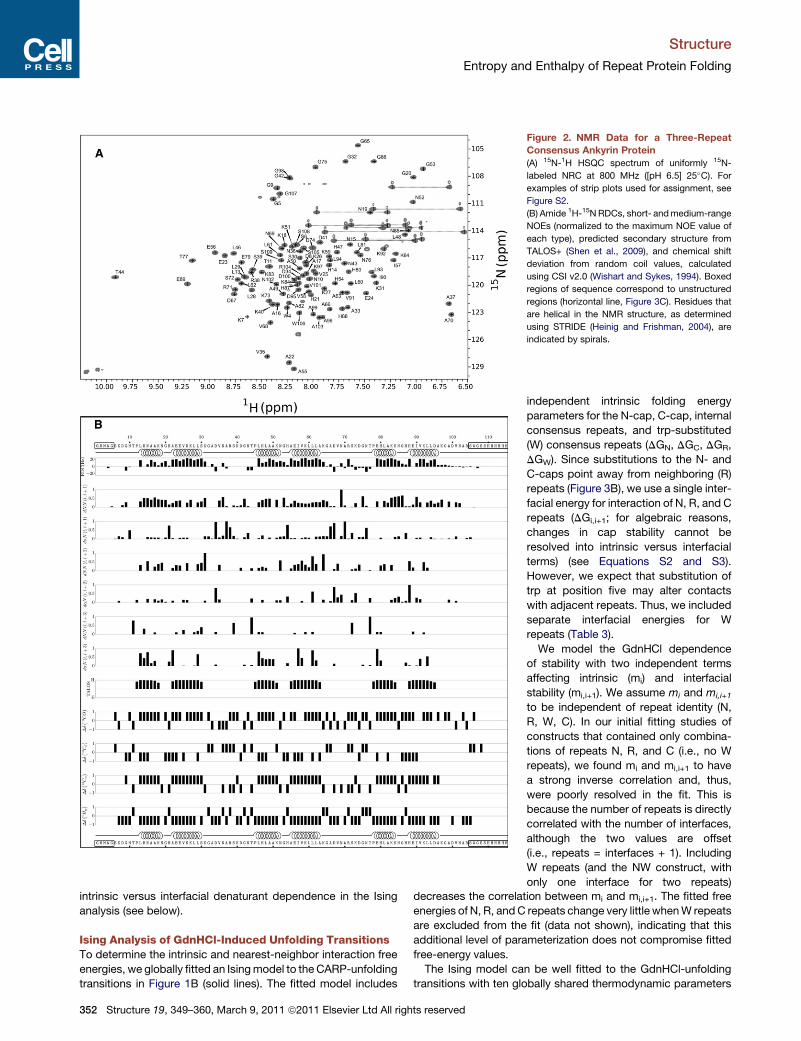
Figure 2. NMR Data for a Three-Repeat
Consensus Ankyrin Protein
(A) 15N-1H HSQC spectrum of uniformly 15N-
labeled NRC at 800 MHz ([pH 6.5] 25�C). For
examples of strip plots used for assignment, see
Figure S2.
(B) Amide 1H-15N RDCs, short- andmedium-range
NOEs (normalized to the maximum NOE value of
each type), predicted secondary structure from
TALOS+ (Shen et al., 2009), and chemical shift
deviation from random coil values, calculated
using CSI v2.0 (Wishart and Sykes, 1994). Boxed
regions of sequence correspond to unstructured
regions (horizontal line, Figure 3C). Residues that
are helical in the NMR structure, as determined
using STRIDE (Heinig and Frishman, 2004), are
indicated by spirals.
Structure
Entropy and Enthalpy of Repeat Protein Folding
intrinsic versus interfacial denaturant dependence in the Ising
analysis (see below).
Ising Analysis of GdnHCl-Induced Unfolding TransitionsTo determine the intrinsic and nearest-neighbor interaction free
energies, we globally fitted an Isingmodel to theCARP-unfolding
transitions in Figure 1B (solid lines). The fitted model includes
352 Structure 19, 349–360, March 9, 2011 ª2011 Elsevier Ltd All rights reserved
independent intrinsic folding energy
parameters for the N-cap, C-cap, internal
consensus repeats, and trp-substituted
(W) consensus repeats (DGN, DGC, DGR,
DGW). Since substitutions to the N- and
C-caps point away from neighboring (R)
repeats (Figure 3B), we use a single inter-
facial energy for interaction of N, R, and C
repeats (DGi,i+1; for algebraic reasons,
changes in cap stability cannot be
resolved into intrinsic versus interfacial
terms) (see Equations S2 and S3).
However, we expect that substitution of
trp at position five may alter contacts
with adjacent repeats. Thus, we included
separate interfacial energies for W
repeats (Table 3).
We model the GdnHCl dependence
of stability with two independent terms
affecting intrinsic (mi) and interfacial
stability (mi,i+1). We assume mi and mi,i+1
to be independent of repeat identity (N,
R, W, C). In our initial fitting studies of
constructs that contained only combina-
tions of repeats N, R, and C (i.e., no W
repeats), we found mi and mi,i+1 to have
a strong inverse correlation and, thus,
were poorly resolved in the fit. This is
because the number of repeats is directly
correlated with the number of interfaces,
although the two values are offset
(i.e., repeats = interfaces + 1). Including
W repeats (and the NW construct, with
only one interface for two repeats)
decreases the correlation between mi and mi,i+1. The fitted free
energies of N, R, andC repeats change very little whenW repeats
are excluded from the fit (data not shown), indicating that this
additional level of parameterization does not compromise fitted
free-energy values.
The Ising model can be well fitted to the GdnHCl-unfolding
transitions with ten globally shared thermodynamic parameters
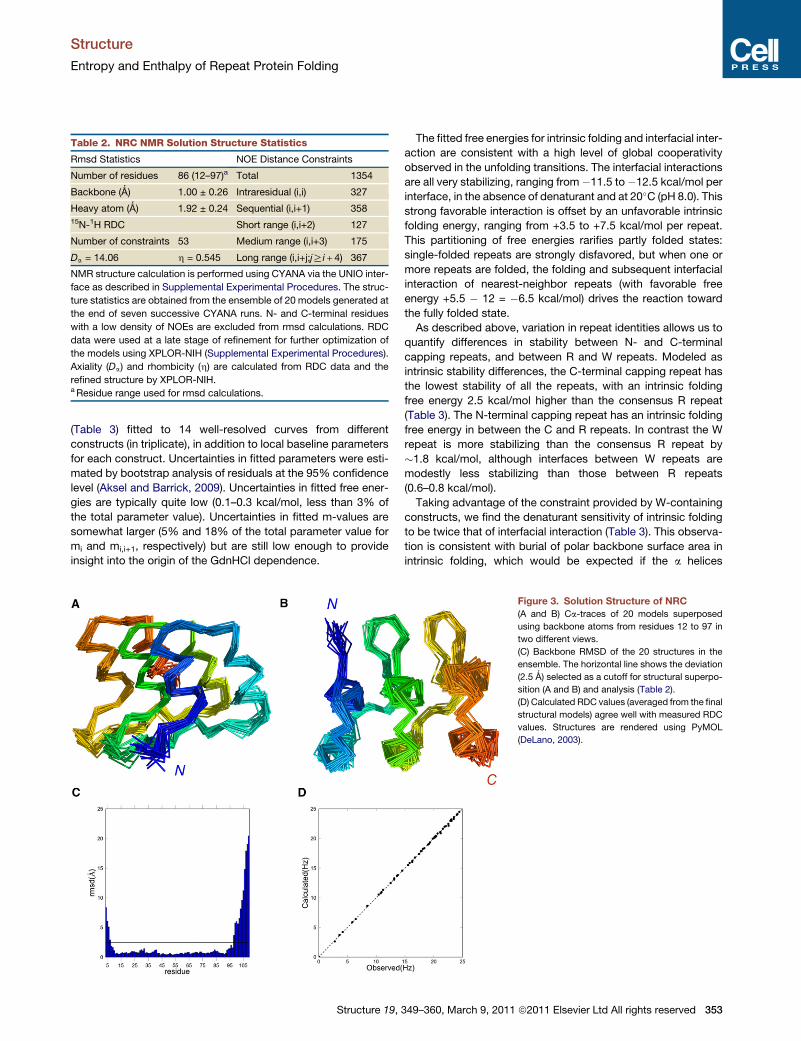
Table 2. NRC NMR Solution Structure Statistics
Rmsd Statistics NOE Distance Constraints
Number of residues 86 (12–97)a Total 1354
Backbone (Ǻ) 1.00 ± 0.26 Intraresidual (i,i) 327
Heavy atom (Ǻ) 1.92 ± 0.24 Sequential (i,i+1) 35815N-1H RDC Short range (i,i+2) 127
Number of constraints 53 Medium range (i,i+3) 175
Da = 14.06 h = 0.545 Long range (i,i+j;jRi + 4) 367
NMR structure calculation is performed using CYANA via the UNIO inter-
face as described in Supplemental Experimental Procedures. The struc-
ture statistics are obtained from the ensemble of 20 models generated at
the end of seven successive CYANA runs. N- and C-terminal residues
with a low density of NOEs are excluded from rmsd calculations. RDC
data were used at a late stage of refinement for further optimization of
the models using XPLOR-NIH (Supplemental Experimental Procedures).
Axiality (Da) and rhombicity (h) are calculated from RDC data and the
refined structure by XPLOR-NIH.aResidue range used for rmsd calculations.
Structure
Entropy and Enthalpy of Repeat Protein Folding
(Table 3) fitted to 14 well-resolved curves from different
constructs (in triplicate), in addition to local baseline parameters
for each construct. Uncertainties in fitted parameters were esti-
mated by bootstrap analysis of residuals at the 95% confidence
level (Aksel and Barrick, 2009). Uncertainties in fitted free ener-
gies are typically quite low (0.1–0.3 kcal/mol, less than 3% of
the total parameter value). Uncertainties in fitted m-values are
somewhat larger (5% and 18% of the total parameter value for
mi and mi,i+1, respectively) but are still low enough to provide
insight into the origin of the GdnHCl dependence.
Structure 19,
The fitted free energies for intrinsic folding and interfacial inter-
action are consistent with a high level of global cooperativity
observed in the unfolding transitions. The interfacial interactions
are all very stabilizing, ranging from�11.5 to�12.5 kcal/mol per
interface, in the absence of denaturant and at 20�C (pH 8.0). This
strong favorable interaction is offset by an unfavorable intrinsic
folding energy, ranging from +3.5 to +7.5 kcal/mol per repeat.
This partitioning of free energies rarifies partly folded states:
single-folded repeats are strongly disfavored, but when one or
more repeats are folded, the folding and subsequent interfacial
interaction of nearest-neighbor repeats (with favorable free
energy +5.5 � 12 = �6.5 kcal/mol) drives the reaction toward
the fully folded state.
As described above, variation in repeat identities allows us to
quantify differences in stability between N- and C-terminal
capping repeats, and between R and W repeats. Modeled as
intrinsic stability differences, the C-terminal capping repeat has
the lowest stability of all the repeats, with an intrinsic folding
free energy 2.5 kcal/mol higher than the consensus R repeat
(Table 3). The N-terminal capping repeat has an intrinsic folding
free energy in between the C and R repeats. In contrast the W
repeat is more stabilizing than the consensus R repeat by
�1.8 kcal/mol, although interfaces between W repeats are
modestly less stabilizing than those between R repeats
(0.6–0.8 kcal/mol).
Taking advantage of the constraint provided by W-containing
constructs, we find the denaturant sensitivity of intrinsic folding
to be twice that of interfacial interaction (Table 3). This observa-
tion is consistent with burial of polar backbone surface area in
intrinsic folding, which would be expected if the a helices
Figure 3. Solution Structure of NRC(A and B) Ca-traces of 20 models superposed
using backbone atoms from residues 12 to 97 in
two different views.
(C) Backbone RMSD of the 20 structures in the
ensemble. The horizontal line shows the deviation
(2.5 Ǻ) selected as a cutoff for structural superpo-
sition (A and B) and analysis (Table 2).
(D) Calculated RDC values (averaged from the final
structural models) agree well with measured RDC
values. Structures are rendered using PyMOL
(DeLano, 2003).
349–360, March 9, 2011 ª2011 Elsevier Ltd All rights reserved 353

Figure 4. Backbone Dynamics of NRC
(A) Residues in a representative ribbon structure (Figure 3)
are coded according to an order parameter S2 (see text
and Table S1). White regions correspond to prolyl residues
or to residues that could not be assigned to any local
model by the ModelFree approach (Mandel et al., 1995).
(B) S2 values as a function of sequence. Gray horizontal
bars correspond to a helices.
(C) Apolar surface area burial upon formation of interfaces
between repeats. For clarity, side chains are represented
by spheres centered at Cb. N-cap, R and C-cap repeats
are colored by green, blue, and red, respectively. Degree
of burial is depicted by color intensity. Burial of interfacial
surface area is calculated by subtracting the SASA of the
NRCNMR structures fromN-cap, R, and C-cap fragments
(excised from NRC). Values represent the average from all
20 structures in our ensemble.
Structure
Entropy and Enthalpy of Repeat Protein Folding
became ordered in this step. The nonzero interfacial m-value
may result from a solubilizing effect of GdnHCl on the interfaces
but also likely results from the fact that not all 33 residues of each
terminal repeat are folded (Figure 3). Adding a new repeat to the
N or C terminus of a folded cluster of repeats would promote
folding of the last few residues at the old end of the cluster; the
denaturant sensitivity of this coupled folding would show up in
the nearest-neighbor term (mi,i+1).
Thermal Unfolding of CARPsWith the goal of resolving the free energies of intrinsic folding and
interfacial interaction into enthalpy, entropy, and heat capacity
changes, we sought conditions in which we could measure
complete, reversible thermal-unfolding transitions. Although
thermal transitions were neither complete nor fully reversible at
pH 8.0, we found that we could obtain full reversibility at pH 5,
and by adding low concentrations of GdnHCl (<1.2 M), we could
obtain complete unfolding transitions (Figure S3).
Because of the variable amounts of GdnHCl at pH 5.0, Ising
analysis of CARP thermal unfolding required both thermal un-
folding parameters (DH, DS, and DCp; parameters of primary
354 Structure 19, 349–360, March 9, 2011 ª2011 Elsevier Ltd All rights reserved
interest here) and GdnHCl sensitivities, both
for interfacial and intrinsic interactions. In addi-
tion, cross-terms are needed to describe the
effect of GdnHCl on thermal denaturation.
We modeled this coupling as a linear depen-
dence of free energy, entropy, and heat
capacity on GdnHCl (Nicholson and Scholtz,
1996). A linear urea dependence for heat
capacity of unfolding of the Notch ankyrin
domain has been observed (Zweifel and Bar-
rick, 2002). To better determine the effects of
GdnHCl on thermal-unfolding parameters, we
supplemented the pH 5.0 thermal transitions
(Figure 5A) with GdnHCl-unfolding transitions
at different temperatures (Figure 5B). Both the
thermal- and GdnHCl-induced unfolding transi-
tionswere fitted globally (64 curves total) with an
Ising model (Figure 5 and Table 4). To further
constrain the cross-terms, we fixed the relative
GdnHCl sensitivities of intrinsic folding and
interfacial interaction to the value found at pH 8.0, 20�C (mi,i+1/
mi = 0.5), and also at extreme values ranging from an entirely
intrinsic to a largely interfacial GdnHCl effect. We find slightly
better fits when the GdnHCl effect is intrinsic, but for the most
part the data are well fitted for all ratios explored.
For all mi,i+1/mi ratios explored, we find the entropy/enthalpy
decomposition of the intrinsic folding energy to be opposite to
that of the interfacial interaction energy (Table 4). Folding of
individual repeats is enthalpically favorable but entropically
unfavorable, with entropy making the larger contribution, result-
ing in an unfavorable intrinsic folding free energy. In contrast the
interfacial interaction is enthalpically unfavorable at 20�C, but it ishighly stabilized entropically. The heat capacity decrement (DCp,
which is negative for protein folding) is partitioned entirely into
the interfacial interaction: within the bootstrap error, intrinsic
folding of a single repeat has no heat capacity change (Table 4).
DISCUSSION
The motivations of the present study are to better understand
cooperativity in protein folding. We measure local and

Table 3. Parameters Obtained from GdnHCl Titration Data at pH 8, 20�C
DGN DGR DGW DGC mi
6.13 ± 0.17 5.24 ± 0.17 3.40 ± 0.12 7.75 ± 0.19 0.58 ± 0.03
DGR-R DGW-W DGN-W DGW-C mi,i+1
�12.54 ± 0.27 �11.77 ± 0.20 �11.89 ± 0.23 �11.81 ± 0.24 0.27 ± 0.05
Free energies andm-values are in kcal.mol�1 and kcal.mol�1M�1, respectively. Confidence intervals (at the 95% level) are obtained by bootstrap anal-
ysis (1000 iterations), assuming parameter uncertainties to be normally distributed. The intrinsic free energy is represented as DGX, where X indicates
the type of repeat (N, R, W, C; see Figure 1 legend). The free energy of the interface between the repeats X-Y is represented as DGX-Y. Denaturant
effects are modeled with a single intrinsic m-value (mi), and a single interfacial m-value (mi,i+1), regardless of the repeat sequence (N, R, W, C).
Structure
Entropy and Enthalpy of Repeat Protein Folding
long-range coupling free energy, and decompose each term into
enthalpy, entropy, heat capacity, and denaturant sensitivity.
These parameters provide insight into bonding (DH), configura-
tional restriction (DS), hydrophobic solvation (DCp, along with
DH and DS compensation) (Prabhu and Sharp, 2005), and burial
of surface area (m-value).
Owing to their linear, repetitive architecture, the stability of
repeat proteins and their high folding cooperativity can be
described using a one-dimensional nearest-neighbor Ising model
(Kajander et al., 2005;Mello andBarrick, 2004;Wetzel et al., 2008).
In contrast to the simple systems traditionally analyzed with the
Ising formalism, repeat proteins comprise all of the structural
elements found in globular proteins, including hydrogen-bonded
secondary structure (helix, turn, and sheet, depending on the
type of repeat), burial and packing of nonpolar side chains, and
charge interactions among surface groups (Kloss et al., 2008),
and thus have direct relevance to nonrepeat (globular) proteins.
In contrast to natural sequence-variable repeat proteins, synthetic
repeat proteins with identical repeats can be represented with
a limited set of parameters, decreasing the number of unknowns
that must be extracted from experimental data. For a ‘‘homopol-
ymer’’ with identical repeats, just two sets of parameters are
needed (DGi and DGi,i+1, along with associated denaturant and
thermal parameters). Because a repeat protein array of n repeats
has n-1 interfaces, DGi and DGi,i+1 can be resolved by comparing
the stabilities of a small number of constructs of different length
(in principal, as few as two). However, the need to substitute polar
residues on the termini to provide solubility introduces additional
parameters, and thus, additional unknowns. Experimental resolu-
tion of these additional unknowns is facilitated by inclusion of
constructs that lack one or the other capping repeat. This can be
seen by representing constructs of different lengths as a system
of linear equations (Equation S1) (Aksel and Barrick [2009]).
Free Energies of Intrinsic Folding, InterfacialInteraction, and Global CooperativityComparing the free energies of intrinsic folding and interfacial
interaction provides a unique means to quantify cooperativity
in protein folding. High cooperativity should result from both
favorable interfacial interactions and unfavorable intrinsic
folding. We find both of these conditions to be met: at pH 8.0
and 5.0, interfacial interaction free energies to be stabilizing by
11–12.5 kcal/mol, whereas intrinsic folding free energies are +4
to +8 kcal/mol, depending on pH and repeat identity.
One way to represent these two components of cooperativity
is as a difference, or ‘‘mismatch.’’ The energy mismatch here
(intrinsic minus interfacial) is around 15–17 kcal/mol per repeat,
Structure 19,
which is reasonably close to the mismatch determined by Pluck-
thun et al. for an array of capped consensus ankyrin repeats
(17.5–13.7 kcal/mol) (Wetzel et al., 2008). This mismatch is
consistent with the high level of cooperativity observed experi-
mentally. This mismatch is significantly larger than that observed
in an experimental study of consensus TPR unfolding (Kajander
et al., 2005). Like ankyrin repeats, TPR repeats have two antipar-
allel helices, although the sequence, helix lengths, turn struc-
tures, and interhelical geometries differ considerably. On
a single-helix level, the intrinsic/interfacial energy mismatch is
only 6.8 kcal/mol (+2.3 and �4.5 kcal/mol for intrinsic folding
and interfacial interaction, respectively) (Kajander et al., 2005).
Effects of Sequence and pH Variation on Intrinsicand Interfacial StabilityBoth at pH 8 and pH 5, DGR < DGN < DGC, spanning a range of
2.5 kcal/mol (Tables 3 and 4). Thus, our cap substitution
decreases stability. Althoughwecannot analytically resolve these
capping effects into intrinsic versus interfacial terms (Equations
S2 and S3), we can resolve the intrinsic versus interfacial effects
of trp substitution at position five. The stabilization seen by W
repeats results from a decrease in intrinsic folding free energy
by �1.8 kcal/mol per repeat, which is modestly offset by a slight
increase in interfacial interaction energy (0.7 kcal/mol) (Table 3).
The decrease in stability seen as the pH is lowered from 8 to 5
results primarily from an increase in the interfacial interaction
energy (+1.9 kcal/mol) (Tables 3 and 4). There is a smaller,
uniform increase in the intrinsic folding free energy (0.73, 0.78,
and 0.77 kcal/mol for the N, R, and C repeats). Because the
effect of pH in this range is likely to be linked to histidine ioniza-
tion (two per N, R repeat; three in the C repeat), we expect the
charged form of one or both histidines to weaken interactions
between repeats, perhaps through electrostatic repulsion
among these basic repeats (predicted pI of 9.52 for R).
Resolution of Cooperativity into Entropy, Enthalpy,and Heat Capacity TermsThe observation that intrinsic folding is entropically unfavorable
(Table 4) suggests a loss of backbone configurational degrees
of freedom. Along with a compensating favorable enthalpy
change (Table 4), a significant unfavorable GdnHCl term (Table 3)
suggests formation of native a-helical structure in the intrinsic
folding step. Thermodynamic studies of monomeric a helices
have shown helix formation to be enthalpically favorable, entro-
pically unfavorable (Scholtz et al., 1991), and destabilized by
GdnHCl (Smith and Scholtz, 1996).
The observation that interfacial interaction is entropically
favorable but enthalpically unfavorable at low temperature
349–360, March 9, 2011 ª2011 Elsevier Ltd All rights reserved 355

Figure 5. Temperature Dependence of Consensus Ankyrin Repeat
Unfolding
(A) Thermal denaturation of CARPs in varying amounts of GdnHCl (see legend).
(B) GdnHCl titrations at different temperatures. Lines result from global fits,
with mi,i+1/mi = 0.5. For each construct (legend) there are eight GdnHCl titra-
tions performed at 5�C, 10�C, 15�C, 20�C, 25�C, 30�C, 35�C, and 40�C(increasing color from 5�C to 40�C).(C) Three-dimensional representation of the temperature and GdnHCl depen-
dence of CARP folding.
Curves in (A) and (B) and surfaces in (C) result from global Ising analysis as
a function of temperature and GdnHCl, with mi,i+1/mi = 0.5. Surfaces in (C)
are, from left to right, NR2, NR2C, R3C, NR3, NR3C, R4C, and NR4. Conditions:
150 mM NaCl, 25 mM NaOAc (pH 5.0). To compare reversibility and structure
at pH 8.0 and 5.0, see Figure S3.
Structure
Entropy and Enthalpy of Repeat Protein Folding
(20�C) suggests a decrease in solvation of nonpolar groups.
Hydrophobic desolvation at low temperature is favored by a large
entropy increase that is partly offset by an enthalpy increase
356 Structure 19, 349–360, March 9, 2011 ª2011 Elsevier Ltd All righ
(Baldwin, 1986; Privalov and Gill, 1988). A hallmark of the hydro-
phobic effect is a large decrease in heat capacity upon desolva-
tion. The observation that the DCp decrease seen for CARP
folding is partitioned entirely into interfacial interaction suggests
that hydrophobic groups are desolvated in this second step. The
NMR structure of NRC shows substantial burial of nonpolar
surface area between adjacent repeats (Figure 4C).
The interfacial interaction parameter provides long-range
coupling and is critical for cooperative folding. The experimentally
observed partitioning of hydrophobic desolvation into the interfa-
cial interactionstep indicates thathydrophobicitymakesan impor-
tant contribution to cooperativity in protein folding. However, we
expect the interface formation to involve close packing, in addition
to hydrophobic desolvation. Like nonpolar desolvation, interfacial
packing is likely to involve long-range contacts distributed over
many residues, consistent with cooperativity. In molten globule
states of proteins, in which nonpolar surfaces are desolvated in
the absence of rigid packing interactions, folding cooperativity is
decreased. Simulation suggests that both hydrophobic desolva-
tion and packing may contribute to cooperativity in folding (Kaya
and Chan, 2003; Liu and Chan, 2005).
Using the NMR structure of NRC as a template, we generated
structural models for longer constructs, and used these models
to estimate solvent-accessible surface area (SASA)-based DH,
DS, and DCp values for unfolding (Hilser et al., 2006). Assuming
linear additivity of intrinsic and interfacial terms, we resolved
these energy terms into intrinsic and interfacial components
(Table 4). The resulting SASA-based terms agree surprisingly
well with experimental values. Most notably, intrinsic folding is
entropically unfavorable, due in large part to conformational
entropy decrease, whereas interfacial interaction is entropically
driven, due largely to favorable desolvation. Also consistent
with our findings, the heat capacity decrement is largely interfa-
cial (Table 4).
Free-Energy Landscapes with Entropic and EnthalpicResolutionUsing the fitted energy terms from Ising analysis (Table 3), folding
free-energy landscapes can be depicted in quantitative detail
(Mello and Barrick, 2004; Tripp and Barrick, 2008; Wetzel
et al., 2008). The free-energy landscape for NR3C is shown in
Figure 6A. Because the N- and C-terminal caps are less stable
than the internal consensus repeats, partly folded conformations
involving the central repeats have lower energy than conforma-
tions with structured termini, imparting a slightly concave shape
from left to right. As with other repeat proteins analyzed in this
way (Kloss et al., 2008; Mello and Barrick, 2004), favorable inter-
facial interactions tip the landscape toward the native state, once
folding advances from a high energy point involving a single-
folded repeat.
Decomposition of the intrinsic and interfacial terms into
entropy, enthalpy, and heat capacity provides a more funda-
mental description of the progress of folding (Figures 6B and
6C). At 20�C, the folding enthalpy decreases (becomes more
negative, relative to the unfolded state) as folding progresses
(Figure 6B). This enthalpy decrease is substantial in the first
step (folding a single repeat) but is smaller in subsequent steps
of folding (folding paired with interaction with a structured
neighbor). Overall, the reaction is enthalpy driven, but this drive
ts reserved

Table 4. Parameters from Temperature-Dependence Studies of Consensus Ankyrins at pH 5, 20�C
mi,i+1/mi = 0 mi,i+1/mi = 0.5a mi,i+1/mi = 1 mi,i+1/mi = 10
SASA-Based Energiesb
Desolvation Conformational
DGN 6.86 ± 0.06 7.33 ± 0.06 7.59 ± 0.06 8.35 ± 0.07 8.4 ± 0.1
DGR 6.02 ± 0.05 6.50 ± 0.05 6.76 ± 0.06 7.52 ± 0.07 10.9 ± 0.1
DGC 8.52 ± 0.06 9.00 ± 0.07 9.27 ± 0.07 10.05 ± 0.11 10.7 ± 0.1
DGi,i+1 �10.66 ± 0.11 �11.28 ± 0.10 �11.64 ± 0.11 �12.65 ± 0.12 �12.1 ± 0.1
DSi �41.6 ± 4.9 �41.0 ± 5.2 �40.2 ± 5.4 �38.8 ± 5.9 54 ± 0.6 �121 ± 0.3
DSi,i+1 56.0 ± 7.1 55.1 ± 7.4 53.9 ± 7.7 51.9 ± 8.4 125 ± 0.6 �67 ± 0.3
DCp; i �51 ± 71 23 ± 73 60 ± 82 191 ± 95 �113 ± 5.6
DCp; i,i+1 �330 ± 102 �420 ± 104 �470 ± 117 �640 ± 135 �379 ± 5.6
mi 1.01 ± 0.01 0.73 ± 0.01 0.57 ± 0.00 0.12 ± 0.00 NA
miS 2.1 ± 0.5 1.6 ± 0.3 1.3 ± 0.3 0.3 ± 0.1 NA
miC �50 ± 8 �38 ± 6 �30 ± 5 �6 ± 1 NA
c2 8.11 3 10�5 8.75 3 10�5 9.31 3 10�5 11.70 3 10�5 NA
Free energies are in kcal$mol�1; entropies and heat capacities are in cal$mol�1$K�1; m-values are in kcal$mol�1$M�1; miS and mi
C are in
cal$mol�1$M�1$K.
In each column, themi,i+1/mi ratio has been fixed to the indicated value to better constrain the fit. Confidence intervals are the results of 5000 iterations
of bootstrap analysis, as described in Table 3. For population plots based on fitted parameters, see Figure S4.aThe mi,i+1/mi ratio obtained from GdnHCl titration experiments at pH 8.0, 20�C.bSASA-based DH, DSconf, DSsolv, and DCp values were calculated from SASAs using parameters described in Hilser et al. (2006), using the NRC NMR
structure determined here to calculate native-state SASA values for models of NRx, NRyC, and RyC (x = 1–4; y = 2–4). Intrinsic and interfacial values
were obtained by least squares fitting, assuming additivity (Aksel & Barrick, 2009). Uncertainties are least squares estimates.
Structure
Entropy and Enthalpy of Repeat Protein Folding
comes largely from the first step (at 20�C, the last steps are
enthalpically opposed as a result of cap substitutions). With
the exception of the first step, where entropy strongly opposes
folding, entropy increases with each folding/interface formation
step. Thus, although there is an early entropy bottleneck at low
temperature, folding is driven by entropy increase (Figure 6B)
from solvent displacement from the interface.
Because of the large heat capacity decrease upon folding, this
picture changes at higher temperatures. At 84�C, the Tm for
NR3C (Figure 6C), entropy and enthalpy compensate one
another. In the first step in folding, a destabilizing entropy
decrease exceeds a stabilizing enthalpy decrease. As before,
folding of a single repeat is disfavored. In subsequent steps
the enthalpy decrease is greater (more stabilizing) than the
entropy decrease, decreasing the overall free energy. This higher
temperature picture is equivalent to analysis of funneled models
for folding at Tf, and as predicted, imperfect enthalpy-entropy
compensation gives rise to a cooperative two-state folding as
a result of an entropy barrier (Go, 1983; Oliveberg and Wolynes,
2005; Onuchic et al., 2000; Taketomi et al., 1975; Thirumalai and
Hyeon, 2005).
Although the current study is, to our knowledge, the first
experimental decomposition of intrinsic and interfacial DH,
DS, and DCp values for repeat protein folding, a simulation
using a Go model of consensus TPR unfolding has been
analyzed using an Ising-type framework (Ferreiro et al., 2008).
Like the present study at high temperature, this simulation sug-
gested intrinsic folding to be entropically opposed but enthalpi-
cally favored, although the lack of solvent in the simulation
precludes detailed comparison. The interfacial interaction
energy was only modeled to involve an enthalpic component
(Ferreiro et al., 2008); whether the large interfacial entropy
change identified here is specific to ankyrin versus TPR repeats,
Structure 19,
or simply reflects the lack of solvent in the simulations, remains
to be seen.
The Effect of Denaturant on CooperativityAlthough the free-energy mismatch described above is consis-
tent with high cooperativity in the absence of denaturant,
GdnHCl could diminish cooperativity if its effect was interfacial.
In contrast we find that the fitted mi-value is to be twice the
mi,i+1-value (Table 3), suggesting a further enhancement of coop-
erativity by GdnHCl in the transition region. GdnHCl preferen-
tially destabilizes isolated folded repeats and, to a lesser extent,
small clusters of folded repeats, which have higher repeat/inter-
face ratios than fully folded CARPs.
To further explore the extent of cooperativity through the
GdnHCl-unfolding transition, we used fitted Ising parameters
to calculate the populations of partly folded states as a function
of GdnHCl concentration (Figure S4). Although similar plots have
been made for denaturant-induced unfolding of other repeat
protein arrays (Mello and Barrick, 2004; Wetzel et al., 2008),
the analysis here is based on an experimentally determined par-
titioning of the denaturant dependence into intrinsic and interfa-
cial stability. We find that for short constructs (three to five
repeats), fully folded and unfolded conformations dominate,
with populations of partly folded states remaining below 20%
(Figure S4). However, for longer constructs, partly folded states
populate significantly through the transition and are dominated
by species with one or both caps unfolded (in particular, the
C-terminal cap) (Figure S4). These partly folded states are
formed, in part, as a result of the higher intrinsic instability of
the capping repeats (Table 3), as is seen in the highly destabi-
lized C-terminal cap of Pluckthun et al. (Yu et al., 2006).
Because of this end fraying, the unfolding transitions of longer
constructs are predicted to show a broad pretransition around
349–360, March 9, 2011 ª2011 Elsevier Ltd All rights reserved 357

Figure 6. Folding Free-Energy Landscape of NR3C
(A) Colored squares correspond to partially folded microstates. Folded and
unfolded repeats are indicated using upper and lowercase letters, respectively
(e.g., nrRRC has the N-cap and first R repeat unfolded, the last three repeats
folded). Energies are calculated at 20�C in the absence of GdnHCl.
(B and C) Free energy, entropy, and enthalpy versus extent of folding (vertical).
At low temperature (20�C; B), structuring the first repeat is unfavorable
because it is entropically costly. When subsequent repeats are added, the
array becomes stabilized, largely as a result of a favorable energy increase
from interfacial pairing, but also because of a modest enthalpy decrease. At
high temperature (Tm = 84�C; C), enthalpy and entropy compensate one
another. This compensation is imperfect, such that the first repeats to fold
are entropically destabilized more than they are enthalpically stabilized, rari-
fying partly folded states.
Structure
Entropy and Enthalpy of Repeat Protein Folding
358 Structure 19, 349–360, March 9, 2011 ª2011 Elsevier Ltd All righ
5–6 M GdnHCl, followed by a sharp transition at higher GdnHCl.
To test this prediction we made CARPs containing nine and ten
repeats (NR7C and NR8C) and monitored unfolding by GdnHCl
titration. These longer constructs unfold extremely slowly,
making equilibration difficult. By equilibrating samples for
2 days (Experimental Procedures), we were able to obtain
unfolding curves quite close to equilibrium (Figure S4). As pre-
dicted from the Ising model, these curves show a pretransition
from 5 to 6M, followed by a sharp transition of greater amplitude.
The minor differences (�0.2 M) between the midpoints of the
major predicted and observed transitions may result from small
errors in the fitted parameters, although we suspect incomplete
equilibration to be a more likely contributor.
Although themethods used here to quantify the local and long-
range interactions cannot be directly applied to globular
proteins, the parameters determined here provide insight into
globular protein stability. Partly folded structures of globular
proteins that retain a subset of local interactions (e.g., secondary
structures) will lose a disproportionate number of long-range
interactions, even more than for the CARP substructures
described here. Given the strong stabilizing long-range interac-
tions found here, this would disproportionately destabilize partly
folded structures. Native-state hydrogen exchange (NSHX) on
globular proteins identifies such a stability gap between the
native and partly unfolded states (intercepts in Figure 5 of
Englander et al., 2002). This gap is critical for the observation,
based on NSHX studies, that unfolding is highly cooperative
through the GdnHCl transition despite a manifold of partly folded
states with lower free energy than the denatured state (Eng-
lander et al., 2002).
EXPERIMENTAL PROCEDURES
Cloning, Expression, and Purification
CARP arrays were cloned as described in Supplemental Experimental Proce-
dures and Figure S5. CARPS were expressed in BL21(DE3), and were purified
as described in Supplemental Experimental Procedures.
Circular Dichroism Spectroscopy
All CDmeasurements were done using AVIVModel 400 CD spectrometer (Aviv
Associates, Lakewood, NJ, USA). Far UV CD spectra were collected using
a 1 mm path length quartz cuvette; protein concentrations ranged from
20 to 60 mM depending on construct size. At least three wavelength scans
with 1 nm step size and 5 s averaging time were combined.
GdnHCl-Induced Unfolding Transitions at pH 8.0
GdnHCl-induced unfolding titrations were obtained using a Hamilton
500 titrator (Reno, NV, USA), and were monitored by CD at 222 nm. Protein
concentrations ranged from 2 to 6 mM.Measurementsweremade in a silanized
1 cm quartz cuvette. Signal was averaged for 30 s at each step. To ensure full
equilibration, a delay of several times the relaxation time (or aminimumof 180 s
to ensure mixing) was introduced between GdnHCl injection and data acquisi-
tion. For NR7C and NR8C, relaxation times were too long for automated titra-
tion. Instead, individual samples were equilibrated at 20�C for 2 days prior to
measurement.
To determine DGi, DGi,i+1, mi, and mi,i+1, unfolding transitions of CARPS of
different length and sequence composition were fitted globally to a heteropol-
ymer Ising model using Isingbul, an in-house program for nearest neighbor
analysis of protein denaturation data (unpublished data). Confidence intervals
were determined at the 95% level by bootstrapping the residuals (see Aksel
and Barrick, 2009).
ts reserved

Structure
Entropy and Enthalpy of Repeat Protein Folding
Thermal and GdnHCl-Induced Unfolding Transitions at pH 5.0
Simple thermal denaturation experiments were performed in 1�C steps. For
combined thermal/GdnHCl denaturation experiments, a single automated
GdnHCl titration was generated in which the temperature was scanned (5�Cincrements) at each GdnHCl step. Equilibration times were decreased to mini-
mize diffusion from the titrator tubing. Thermal melts were jointly fitted with
GdnHCl melts at different temperatures using Isingbul, with a model that
assumes that DG, DS, and DCp vary linearly with GdnHCl (see Supplemental
Experimental Procedures).
NMR Spectroscopy15N- and 15N,13C-labeled NRC was expressed and purified as described
above, using M9 minimal media supplemented with 15NH4Cl and13C-labeled
glucose (Cambridge Isotope Laboratories, Andover, MA, USA). Unless other-
wise noted, NMR samples contained 2 mM NRC, 25 mM NaCl, 25 mM
Na2HPO4, and 5% D2O (pH 6.5). This pH maximized the number of well-
resolved peaks in the 1H,15N-HSQC spectrum, presumably by decreasing
exchange broadening of labile amide protons. For 13C-edited 3D NOESY-
HSQC experiments, 15N,13C-labeled NRC was lyophilized and redissolved in
buffered D2O (Cambridge Isotope Laboratories) at least three times to remove
exchangeable amide protons. For RDC experiments, 0.5mMNRCwas aligned
using a liquid crystalline medium containing 5% (by weight, relative to
H2O/D2O) C12E6, with 1-hexanol (Sigma-Aldrich, St. Louis, MO, USA) at
a mole ratio (to C12E6) of r = 0.64 (Ruckertt and Otting, 2000).
Double- and triple-resonance spectra used tomake resonance assignments
are listed in Supplemental Experimental Procedures along with assignment
methods, RDC measurement, structure determination, and 15N-backbone
dynamics.
ACCESSION NUMBERS
Assignments have been deposited in the BMRB (accession number 17306).
Structural coordinates have been deposited in the PDB (accession number
2L6B).
SUPPLEMENTAL INFORMATION
Supplemental Information includes Supplemental Experimental Procedures,
five figures, and one table and can be found with this article online at doi:10.
1016/j.str.2010.12.018.
ACKNOWLEDGMENTS
We thank Dr. Vincent Hilser for providing code for SASA-based energy calcu-
lations, and Dr. Evangelos Moudrianakis for assistance with AUC. We thank
the JHU Biomolecular NMR Center for facilities and resources. This research
was supported by NIH grant GM068462 to D.B.
Received: July 6, 2010
Revised: November 23, 2010
Accepted: December 10, 2010
Published: March 8, 2011
REFERENCES
Aksel, T., and Barrick, D. (2009). Analysis of repeat-protein folding using near-
est-neighbor statistical mechanical models. Methods Enzymol. 455, 95–125.
Baldwin, R.L. (1986). Temperature dependence of the hydrophobic interaction
in protein folding. Proc. Natl. Acad. Sci. USA 83, 8069–8072.
Cervantes, C.F., Markwick, P.R., Sue, S.C., McCammon, J.A., Dyson, H.J.,
and Komives, E.A. (2009). Functional dynamics of the folded ankyrin repeats
of I kappa B alpha revealed by nuclear magnetic resonance. Biochemistry
48, 8023–8031.
DeLano, W.L. (2003). MacPyMOL: PyMOL Enhanced for Mac OS X (Palo Alto,
CA: DeLano Scientific).
Doig, A.J. (2002). Recent advances in helix-coil theory. Biophys. Chem. 101-
102, 281–293.
Structure 19,
Englander, S.W., Mayne, L., and Rumbley, J.N. (2002). Submolecular cooper-
ativity produces multi-state protein unfolding and refolding. Biophys. Chem.
101-102, 57–65.
Ferreiro, D.U., Walczak, A.M., Komives, E.A., and Wolynes, P.G. (2008). The
energy landscapes of repeat-containing proteins: topology, cooperativity,
and the folding funnels of one-dimensional architectures. PLoS Comput.
Biol. 4, e1000070.
Finn, R.D., Tate, J., Mistry, J., Coggill, P.C., Sammut, S.J., Hotz, H.R., Ceric,
G., Forslund, K., Eddy, S.R., Sonnhammer, E.L., and Bateman, A. (2008).
The Pfam protein families database. Nucleic Acids Res. 36, D281–D288.
Go, N. (1983). Theoretical studies of protein folding. Annu. Rev. Biophys.
Bioeng. 12, 183–210.
Heinig, M., and Frishman, D. (2004). STRIDE: a web server for secondary
structure assignment from known atomic coordinates of proteins. Nucleic
Acids Res. 32, W500–W502.
Hilser, V.J., Garcia-Moreno, E.B., Oas, T.G., Kapp, G., and Whitten, S.T.
(2006). A statistical thermodynamic model of the protein ensemble. Chem.
Rev. 106, 1545–1558.
Ising, E. (1925). Beitrag zur Theorie des Ferromagnetismus. Z. Phys. A At. Nucl.
31, 253–258.
Kajander, T., Cortajarena, A.L., Main, E.R., Mochrie, S.G., and Regan, L.
(2005). A new folding paradigm for repeat proteins. J. Am. Chem. Soc. 127,
10188–10190.
Kaya, H., and Chan, H.S. (2003). Simple two-state protein folding kinetics
requires near-levinthal thermodynamic cooperativity. Proteins 52, 510–523.
Kloss, E., Courtemanche, N., and Barrick, D. (2008). Repeat-protein folding:
new insights into origins of cooperativity, stability, and topology. Arch.
Biochem. Biophys. 469, 83–99.
Liu, Z., and Chan, H.S. (2005). Solvation and desolvation effects in protein
folding: native flexibility, kinetic cooperativity and enthalpic barriers under iso-
stability conditions. Phys. Biol. 2, S75–S85.
Lumry, R., and Biltonen, R. (1966). Validity of the ‘‘two-state’’ hypothesis for
conformational transitions of proteins. Biopolymers 4, 917–944.
Main, E.R., Xiong, Y., Cocco, M.J., D’Andrea, L., and Regan, L. (2003). Design
of stable a-helical arrays from an idealized TPR motif. Structure 11, 497–508.
Mandel, A.M., Akke, M., and Palmer, A.G., 3rd. (1995). Backbone dynamics of
Escherichia coli ribonuclease HI: correlations with structure and function in an
active enzyme. J. Mol. Biol. 246, 144–163.
Mello, C.C., and Barrick, D. (2004). An experimentally determined protein
folding energy landscape. Proc. Natl. Acad. Sci. USA 101, 14102–14107.
Mosavi, L.K., and Peng, Z.Y. (2003). Structure-based substitutions for
increased solubility of a designed protein. Protein Eng. 16, 739–745.
Mosavi, L.K., Minor, D.L., Jr., and Peng, Z.Y. (2002). Consensus-derived struc-
tural determinants of the ankyrin repeat motif. Proc. Natl. Acad. Sci. USA 99,
16029–16034.
Munoz, V. (2001). What can we learn about protein folding from Ising-like
models? Curr. Opin. Struct. Biol. 11, 212–216.
Myers, J.K., Pace, C.N., and Scholtz, J.M. (1995). Denaturant m values and
heat capacity changes: relation to changes in accessible surface areas of
protein unfolding. Protein Sci. 4, 2138–2148.
Nicholson, E.M., and Scholtz, J.M. (1996). Conformational stability of the
Escherichia coliHPr protein: test of the linear extrapolation method and a ther-
modynamic characterization of cold denaturation. Biochemistry 35, 11369–
11378.
Oliveberg, M., and Wolynes, P.G. (2005). The experimental survey of protein-
folding energy landscapes. Q. Rev. Biophys. 38, 245–288.
Onsager, L. (1944). Crystal statistics. I. A two-dimensional model with an
order-disorder transition. Phys. Rev. 65, 117–149.
Onuchic, J.N., Nymeyer, H., Garcia, A.E., Chahine, J., and Socci, N.D. (2000).
The energy landscape theory of protein folding: insights into folding mecha-
nisms and scenarios. Adv. Protein Chem. 53, 87–152.
Poland, D., and Scheraga, H.A. (1970). Theory of Helix-Coil Transitions in
Biopolymers (New York: Academic Press).
349–360, March 9, 2011 ª2011 Elsevier Ltd All rights reserved 359

Structure
Entropy and Enthalpy of Repeat Protein Folding
Prabhu, N.V., and Sharp, K.A. (2005). Heat capacity in proteins. Annu. Rev.
Phys. Chem. 56, 521–548.
Privalov, P.L., and Gill, S.J. (1988). Stability of protein structure and hydro-
phobic interaction. Adv. Protein Chem. 39, 191–234.
Renner, C., Baumgartner, R., Noegel, A.A., and Holak, T.A. (1998). Backbone
dynamics of the CDK inhibitor p19(INK4d) studied by 15N NMR relaxation
experiments at two field strengths. J. Mol. Biol. 283, 221–229.
Robertson, A.D., andMurphy, K.P. (1997). Protein structure and the energetics
of protein stability. Chem. Rev. 97, 1251–1268.
Ruckertt, M., and Otting, G. (2000). Alignment of biological macromolecules in
novel nonionic liquid crystalline media for NMR experiments. J. Am. Chem.
Soc. 122, 7793–7797.
Scholtz, J.M., Qian, H., York, E.J., Stewart, J.M., and Baldwin, R.L. (1991).
Parameters of helix-coil transition theory for alanine-based peptides of varying
chain lengths in water. Biopolymers 31, 1463–1470.
Shen, Y., Delaglio, F., Cornilescu, G., and Bax, A. (2009). TALOS+: a hybrid
method for predicting protein backbone torsion angles from NMR chemical
shifts. J. Biomol. NMR 44, 213–223.
Smith, J.S., and Scholtz, J.M. (1996). Guanidine hydrochloride unfolding of
peptide helices: separation of denaturant and salt effects. Biochemistry 35,
7292–7297.
Taketomi, H., Ueda, Y., and Go, N. (1975). Studies on protein folding, unfolding
and fluctuations by computer simulation. I. The effect of specific amino acid
sequence represented by specific inter-unit interactions. Int. J. Pept. Protein
Res. 7, 445–459.
360 Structure 19, 349–360, March 9, 2011 ª2011 Elsevier Ltd All righ
Thirumalai, D., and Hyeon, C. (2005). RNA and protein folding: common
themes and variations. Biochemistry 44, 4957–4970.
Tripp, K.W., and Barrick, D. (2007). Enhancing the stability and folding rate of
a repeat protein through the addition of consensus repeats. J. Mol. Biol. 365,
1187–1200.
Tripp, K.W., and Barrick, D. (2008). Rerouting the folding pathway of the Notch
ankyrin domain by reshaping the energy landscape. J. Am. Chem. Soc. 130,
5681–5688.
Weinkam, P., Zong, C., and Wolynes, P.G. (2005). A funneled energy land-
scape for cytochrome c directly predicts the sequential folding route inferred
from hydrogen exchange experiments. Proc. Natl. Acad. Sci. USA 102,
12401–12406.
Wetzel, S.K., Settanni, G., Kenig, M., Binz, H.K., and Pluckthun, A. (2008).
Folding and unfolding mechanism of highly stable full-consensus ankyrin
repeat proteins. J. Mol. Biol. 376, 241–257.
Wishart, D.S., and Sykes, B.D. (1994). The 13C chemical-shift index: a simple
method for the identification of protein secondary structure using 13C chem-
ical-shift data. J. Biomol. NMR 4, 171–180.
Yu, H., Kohl, A., Binz, H.K., Pluckthun, A., Grutter, M.G., and van Gunsteren,
W.F. (2006). Molecular dynamics study of the stabilities of consensus
designed ankyrin repeat proteins. Proteins 65, 285–295.
Zimm, B.H. (1960). Theory of ‘‘Melting’’ of the helical form in double chains of
the DNA type. J. Chem. Phys. 33, 1349–1356.
Zweifel, M.E., and Barrick, D. (2002). Relationships between the temperature
dependence of solvent denaturation and the denaturant dependence of
protein stability curves. Biophys. Chem. 101-102, 221–237.
ts reserved

1
Structure 19
Supplemental Information
The Contribution of Entropy, Enthalpy,
and Hydrophobic Desolvation to Cooperativity
in Repeat-Protein Folding
Tural Aksel, Ananya Majumdar, and Doug Barrick
Table S1, related to Figure 4. The statistics of the local models assigned in
modelfree analysis
Model definitiona Number of Spins assignedb
Model 1 (Ss2) 60
Model 2 (Ss2, e) 2 (19,24)
Model 3 (Ss2, Rex) 8 (11, 17, 26, 39, 59, 61, 62, 94)
Model 4 (Ss2, e, Rex) 3 (6, 29, 92)
Model 5 (Ss2, Sf
2, e) 12 (7, 8, 9, 10, 32, 33, 96, 97, 99, 100, 101, 102) aEach of five models evaluated for each NH includes, in addition to the global parameters in Table 2, a set of local parameters that are optimized individually (in parentheses) for each residue: Ss, order parameter on a slow time scale; Sf, order parameter on a fast time scale; e, internal correlation time; Rex, chemical exchange rate. bThe identities of 15N-1H spins analyzed using a particular model are given in parenthesis.

2
Figure S1, related to Figure 1. Concentration dependence of sedimentation and GdnHCl unfolding transitions of CARPs (A) g(s*) plots from sedimentation velocity AUC at four different concentrations (see legend). (B) dc/dt data at the concentrations indicated in (A). Solid lines correspond to fits with a monomer or homodimer model. Only the first (filled circles) and last (stars) dc/dt curves are shown. NR1C and NR4 data are adequately described by the monomer model, whereas R4C is best described by a homodimerization model. Both g(s*) and dc/dt analysis were performed using SEDANAL (Stafford and Sherwood, 2004). (C) Fitted parameters from dc/dt analysis. Errors were estimated from bootstrapping. Conditions: 150 mM NaCl, 25 mM Tris-Cl, pH 8.0, 20oC for NR1C and NR4; 1.2 M GdnHCl 150 mM NaCl, 25 mM Tris-Cl, pH 8.0, 20oC for R4C. Samples were dialyzed extensively and were spun at 50,000 rpm in meniscus-matching cells (Spin Analytical, Durham NH), against the dialysis buffer. Concentration profiles were determined using interference optics. (D) GdnHCl unfolding transitions of R4C are independent of concentration. Unfolding transitions were measured as described in the text, at protein concentrations given in the legend. Due to the slow unfolding kinetics around the midpoint of this large construct, equilibration times of 45 minutes were used in the transition region. Conditions: 150 mM NaCl, 25 mM Tris HCl, pH 8.0, 20°C.

3
Figure S2, related to Figure 2. Representative strip plots from (A) 13C-edited 1H-1H NOESY and (B) 15N-edited 1H-1H NOESY spectra Samples contained 2 mM 13C- and 15N-labelled NRC (A and B, respectively) at 600 MHz (pH 6.5, 25°C).

4
Figure S3, related to Figure 5. Reversibility of thermal denaturation of NR3 at (A) pH 8.0 and (B) pH 5.0, and CD spectra at (C) pH 5.0 Reversibility is checked by measuring the recovery of native state CD signal observed at 222 nm following a jump to low temperature after a thermal denaturation experiment, and comparison of the shape of initial and subsequent unfolding transitions (circles and squares, respectively). Spectra are scaled as described in Figure 1. Conditions are (A) 4.2 M Gdn-HCl 150 mM NaCl, 25 mM Tris-HCl pH 8.0, 20 oC; (B) 1.18 M Gdn-HCl 150mM NaCl, 25 mM NaAc, pH 5.0; 150mM NaCl, 25 mM NaOAc, pH 5.0, 20 oC.

5
Figure S4, related to Table 4. Populations of folded, unfolded, and partly folded states in GdnHCl-induced unfolding transitions (A) Simulated unfolding curves (solid lines) for constructs containing three (left, NRC) to ten repeats (right, NR8C), and the total population of partly folded states (dashed lines, same color scheme as for the simulated unfolding curves). (B) Composition of partly folded species of NR8C. The solid line gives the simulated unfolding curve. Dashed lines show the partly folded states that are most populated, along with the fully folded and fully unfolded states (see legend; upper and lower case represent folded and unfolded repeats respectively, “the rest” accounts for the remaining partly folded states not listed in the legend). (C) Manual GdnHCl titrations of NR7C and NR8C (circles and squares, respectively), and predicted unfolding transitions using fitted intrinsic and interfacial energies (solid and dashed lines, respectively). Conditions: 150 mM NaCl, 25 mM Tris•HCl, pH 8.0, 20°C.

6
Figure S5, related to Table 1. Cloning scheme used to create CARP arrays from single repeats (or arrays) Red and blue colored regions represent the ORFs encoding two different CARP arrays. The two plasmids were digested by different sets of restriction enzymes (red: BamHI and HindIII; blue: BglII and HindIII). Ligation of fragments containing the red and blue CARP-encoding segments expands the CARP array, retaining the flanking BamHI and BglII sites while eliminating the internal site.

7
Supplemental Experimental Procedures
Cloning of consensus ankyrin repeat proteins. To clone capped arrays of CARPS-encoding genes, oligonucleotides (IDT; Coralville, IA) encoding single consensus repeats were kinased and ligated into the BamHI and BglII sites of a modified pET15b expression vector (Novagen; Darmstadt, Germany) in which the BglII site was removed, a new BglII site was introduced adjacent to the BamH1 site, and the N-terminal his6 sequence was replaced with a C-terminal his6-tag. Inserts encoding single repeats were then multimerized by ligating DNAs cut with a 3’ (with respect to coding) BglII site to a 5’ BamHI site, along with a distal HindIII site (Figure S5). The overhangs generated by BamHI and BglII digestion are cohesive, but their ligation eliminates both sites (Carrion-Vazquez et al., 1999). Repeating this second joining step results in geometric expansion of the CARP array, and also provides a means to add capping terminal capping repeats. Constructs were confirmed by restriction digestion and by DNA sequencing from both directions.
E. coli BL21(DE3) cells were transformed with plasmids containing CARP genes, and were grown in Terrific Broth (Tartoff and Hobbs, 1987) at 37oC to an OD600 of 1.0. Expression was induced by addition of 1 mM IPTG. After further growth for 10 hours at 37°C, cells were collected by centrifugation and were frozen at -80°. Cells were resuspended in 300 mM NaCl, 50 mM Tris-HCl, pH 8.0, and were lysed with a french press. Lysate pellets were resuspended in 8M urea, 0.02% PEI, 200 mM NaCl, 50 mM Tris-HCl solution at pH 8.0, and were re-centrifuged to remove precipitated DNA. The supernatant was loaded onto a nickel column (QIAGEN; Valencia, CA). After washing with same denaturing solution, bound protein was refolded on the column by washing with 200 mM NaCl, 50 mM Tris-Cl, pH 8.0, and was eluted with 0.5 M imidazole, 200 mM NaCl, 50 mM Tris-Cl, pH 8.0. Protein-containing fractions were concentrated to ~5 mg/ml.
NMR spectroscopy, assignments, and structure determination. Double-
(15N-H and 13C-H HSQC) and triple-resonance spectra (HNN, CBCA(CO)NH, HBHA(CO)NH, HNCACB, (H)CC(CO)NH, H(CC)(CO)NH, 15N-edited HSQC-NOESY, 15N-edited HMQC-NOESY-HSQC, 13C-edited HSQC-NOESY, and 13C-edited HMQC-NOESY-HSQC) used for backbone and side-chain assignments and for measurement of 1H,1H NOE’s were obtained on a Bruker Avance II 600 MHz spectrometer equipped with a cryoprobe. Two sets of IPAP spectra in alignment media and in isotropic solution on a Varian Inova 800 MHz spectrometer equipped with a cryoprobe to obtain RDC values. Relaxation studies to determine values for R1, R2, and 1H-15N NOE’s were performed at 600 MHz.
Data were processed using NMRPipe (Delaglio et al., 1995). Assignments and peak intensities were determined using CARA (Masse and Keller, 2005). NOE distance restraint determinations and structure calculations were performed using CYANA (Guntert, 2004) interfaced with UNIO (Herrmann et al., 2002). Structural models were further optimized against RDC data using XPLOR-NIH (Schwieters et al., 2003).
To explore backbone dynamics, 15N-1H correlation spectra were collected at 600 MHz; R1, R2 and 1H-15N NOE relaxation parameters were extracted using in-house scripts. The FASTModelFree interface (Cole and Loria, 2003) to modelfree (Mandel et al., 1995) was used to perform Lipari and Szabo’s modelfree analysis. A global rotational correlation time (m) of 7.86±0.02 ns, and a ratio of the axial and perpendicular rotational diffusion constants (DP
D ) of 1.42±0.03, were estimated from

8
the analysis. The statistical test described in (Mandel et al., 1995) was used to select the best dynamic model for each spin (see Table S1).
Analysis of CARP thermal unfolding transitions. To obtain the intrinsic and
interfacial entropy, enthalpy and heat capacity changes (Si, Si,i+1, Hi, Hi,i+1 Cp; i, Cp; i,i+1), Gi, Gi,i+1 are expressed as follows:
Gi (T ) Gi (Tr ) (T Tr )Cp; i (T Tr )Si T Cp; i lnT
Tr
Gi ,i 1(T ) Gi ,i 1(Tr ) (T Tr )Cp; i ,i 1 (T Tr )Si ,i 1 T Cp; i ,i 1 lnT
Tr
(2)
Tr, a constant of integration, serves as a reference temperature. Equation 2 assumes that the Cp terms are independent of temperature.
The temperature dependences of the intrinsic and interfacial m-values are expressed in a form similar to Equation 2:
mi (T ) mi (Tr ) (T Tr )dCp; i
dX (T Tr )
dSi
dXT
dCp; i
dXln
T
Tr
mi (Tr ) (T Tr )miC (T Tr )mi
S TmiC ln
T
Tr
mi ,i 1(T ) mi ,i 1(Tr ) (T Tr )dCp; i ,i 1
dX (T Tr )
dSi ,i 1
dXT
dCp; i ,i 1
dXln
T
Tr
mi ,i 1(Tr ) (T Tr )mi ,i 1C (T Tr )mi ,i 1
S Tmi ,i 1C ln
T
Tr
(3)
where X is the molar GdnHCl concentration. Equation 3 is obtained by partial differentiation of Equation 2 with respect to denaturant concentration (e.g., mi Gi X T for the intrinsic interaction). In the second line of each equality in
Equation 3, mS and mC are shorthand for the denaturant derivatives of entropy and heat capacity. For simplicity, we assume Cp and S° to have a linear GdnHCl dependence, making mS and mC constant. This is justified in part by the often-observed linearity of G with denaturant concentration, and in part by the linear dependence of Cp on denaturant concentration for the ankyrin domain of the Notch receptor (Zweifel and Barrick, 2002).
Equations 2 and 3 can be combined to give expressions for Gi and Gi,i+1 as a function of denaturant concentration:

9
Gi (T ,X ) Gi (T ,X 0) mi (T )X
Gi ,i 1(T ,X ) Gi ,i 1(T ,X 0) mi ,i 1(T )X (4)
Equations 2-4 were globally fitted to thermal and GdnHCl unfolding transitions, in triplicate, for constructs of different length and composition (64 curves total), using bootstrap analysis of residuals to estimate 95 percent confidence intervals on fitted parameters (Table 4).
Matrix representation of nearest-neighbor models for repeat protein folding. Because the linear Ising model represents the free energy of folded repeat proteins additively, a system of repeat proteins and their measured free energies of unfolding can be regarded as a set of linear equations. These equations can be expressed compactly in matrix form, is shown in Equation S1:
1 1 0 11 2 0 21 3 0 31 4 0 40 2 1 20 3 1 30 4 1 41 1 1 21 2 1 31 3 1 4
GoN
GoR
GoC
Goi ,i 1
GoNR1
GoNR2
GoNR3
GoNR4
GoR2C
GoR3C
GoR4C
GoNR1C
GoNR2C
GoNR3C
(1)
These equations describe stabilities of ten constructs including N- and C- caps and internal repeats R (but no W-substituted repeats). The vector on the right-hand-side of Equation (S1) represents the (observable) folding free energies of each construct, relative to the denatured state. The vector on the left-hand side represents the intrinsic and interfacial free energy terms (unknowns), and the coefficient matrix gives the number of repeats of each type and the total number of interfaces for each construct. Inspection of the coefficient matrix on the left-hand side shows each column to be independent of the other three: no column can be obtained by linear combination of any of the other three columns (i.e., the matrix has full column rank, r=4). Thus, within the framework of this four-parameter model, these equations (S1) may be expected to have a unique solution (at least in the least-squares limit, allowing for errors in the measured free energy vector).

10
Although we obtain optimized parameters by fitting the full partition function to unfolding transitions, the representation illustrated by Equation (S1) provides a simple way to test whether the unknown parameters of a particular energy model can be extracted from a given set of constructs. For example, matrix representation of a model that includes separate terms for the interfaces between the capping (N and C) repeats and the internal (R) repeats can be written as
1 1 0 0 1 01 2 0 1 1 01 3 0 2 1 01 4 0 3 1 00 2 1 1 0 10 3 1 2 0 10 4 1 3 0 11 1 1 0 1 11 2 1 1 1 11 3 1 2 1 1
GoN
GoR
GoC
GoR,R
GoN ,R
GoR,C
GoNR1
GoNR2
GoNR3
GoNR4
GoR2C
GoR3C
GoR4C
GoNR1C
GoNR2C
GoNR3C
(S2)
This system can easily be seen to lack a unique solution. The new columns introduced to the coefficient matrix would be identical to columns 1 and 3 above; thus, Gaussian elimination knocks out the six bottom equations from the system in Equation S2:
1 1 0 0 1 00 1 0 1 0 00 0 1 1 0 10 0 0 1 0 00 0 0 0 0 00 0 0 0 0 00 0 0 0 0 00 0 0 0 0 00 0 0 0 0 00 0 0 0 0 0
(S3)

11
Thus, there are only four unique equations (and thus a column rank of four; this is the same as the rank in Equation S1, which is to be expected since it describes same set of constructs). All of the models used here to describe CARP unfolding have a unique solution when cast using this matrix formalism.
Supplemental References Carrion-Vazquez, M., Oberhauser, A.F., Fowler, S.B., Marszalek, P.E., Broedel, S.E., Clarke, J., and Fernandez, J.M. (1999). Mechanical and chemical unfolding of a single protein: a comparison. Proceedings of the National Academy of Sciences of the United States of America 96, 3694-3699. Cole, R., and Loria, J.P. (2003). FAST-Modelfree: a program for rapid automated analysis of solution NMR spin-relaxation data. Journal of biomolecular NMR 26, 203-213. Delaglio, F., Grzesiek, S., Vuister, G.W., Zhu, G., Pfeifer, J., and Bax, A. (1995). NMRPipe: a multidimensional spectral processing system based on UNIX pipes. Journal of biomolecular NMR 6, 277-293. Guntert, P. (2004). Automated NMR structure calculation with CYANA. Methods in molecular biology (Clifton, N.J 278, 353-378. Herrmann, T., Guntert, P., and Wuthrich, K. (2002). Protein NMR structure determination with automated NOE assignment using the new software CANDID and the torsion angle dynamics algorithm DYANA. Journal of molecular biology 319, 209-227. Mandel, A.M., Akke, M., and Palmer, A.G., 3rd (1995). Backbone dynamics of Escherichia coli ribonuclease HI: correlations with structure and function in an active enzyme. Journal of molecular biology 246, 144-163. Masse, J.E., and Keller, R. (2005). AutoLink: automated sequential resonance assignment of biopolymers from NMR data by relative-hypothesis-prioritization-based simulated logic. J Magn Reson 174, 133-151. Schwieters, C.D., Kuszewski, J.J., Tjandra, N., and Clore, G.M. (2003). The Xplor-NIH NMR molecular structure determination package. J Magn Reson 160, 65-73. Stafford, W.F., and Sherwood, P.J. (2004). Analysis of heterologous interacting systems by sedimentation velocity: curve fitting algorithms for estimation of sedimentation coefficients, equilibrium and kinetic constants. Biophysical chemistry 108, 231-243. Tartoff, K.D., and Hobbs, C.A. (1987). Improved media for growing plasmid and cosmid clones. Bethesda Research Laboratories Focus 9. Zweifel, M.E., and Barrick, D. (2002). Relationships between the temperature dependence of solvent denaturation and the denaturant dependence of protein stability curves. Biophysical chemistry 101-102, 221-237.