the continuous stirred tank reactor (cstr)978-1-4471-0421-6/1.pdfappendix a the continuous stirred...
TRANSCRIPT
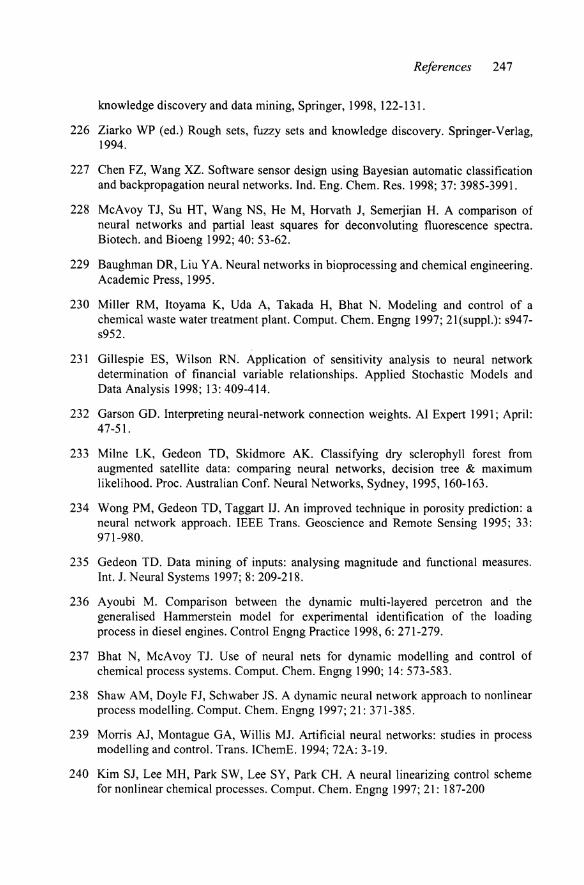
APPENDIX A THE CONTINUOUS STIRRED TANK REACTOR (CSTR)
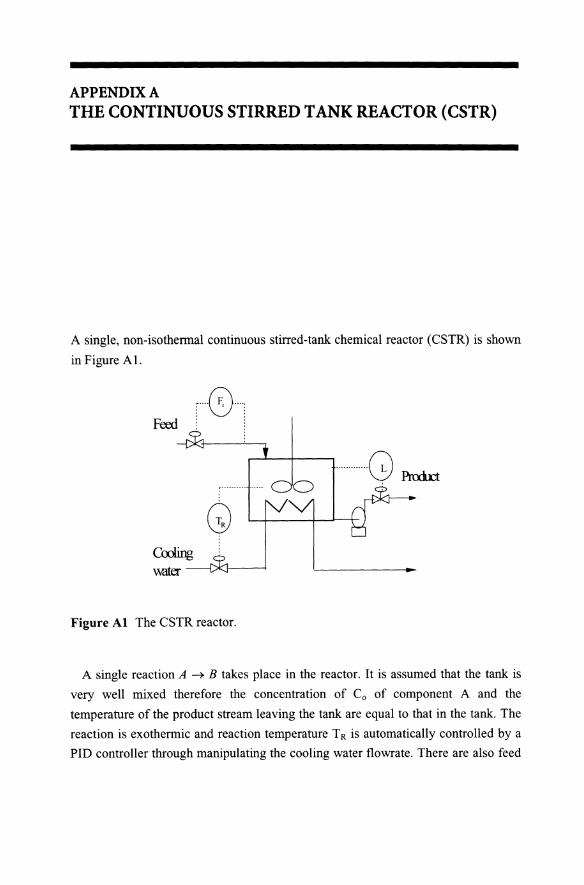
A single, non-isothennal continuous stirred-tank chemical reactor (CSTR) is shown
in Figure AI.
..... (0; ..... · . · . · . · . Feed · . · . · . · .
.. ........... Q ......... -_ ..... .
o Cooling ! Wdter~
Figure Al The CSTR reactor.
A single reaction A ~ B takes place in the reactor. It is assumed that the tank is
very well mixed therefore the concentration of Co of component A and the
temperature of the product stream leaving the tank are equal to that in the tank. The
reaction is exothermic and reaction temperature T R is automatically controlled by a
PID controller through manipulating the cooling water flowrate. There are also feed
218 Data Mining and Knowledge Discovery for Process Monitoring and Control
flowrate and liquid level controllers as shown in Figure AI. Apart from the three
controllers, the dynamic behaviour of the process is described by the following
equations:
Component mass balance
V d Co V -EIRT ----;;t=FiC;-FoCo- Koe RCa
Energy balance
dTR VPCp----;;t = PCpFi Ti - PCpFo TR
Total mass balance
dV -=F-F dt I a
V - holdup of the reaction mixture, m3. The volume of the tank is 1 m3.
L - Liquid level in the tank, 0 - 100.
Co - Concentration of component A in the product stream leaving the tank,
kmol/m3, which is equal to that in the tank.
Ci - Concentration of component A in the inlet feed stream, kmol/m3•
Fi - Feed flowrate, m3/min.
Fa - Product stream flowrate, m3/min.
Fe - Cooling water flowrate, m3/min.
Ko - Reaction coefficient, Ko = 1.0 x 10¹⁰ min· l .
EIR - 8330.1 K"I.
. f .. 106 I 3 P - DenSIty 0 reactIOn mIxture, P = g m .
Pc - Density of cooling water, Pc = 106 glm3•
Cp - Specific heat capacity of the reaction mixture, Cp = 1 cal/m3.
Cpc - Specific heat capacity of cooling water, Cp = 1 cal/m3.
-!J.Hrxn = 130 x 106 (cal/kmol)
(AI)
(A2)
(A3)

Appendix A The Continuous Stirred Tank Reactor (CSTR) 219
a - Constant, a = 1.678 x 10⁶ (cal/min)/K.
b - Constant, b = 0.5
1';- Temperature of the inlet feed, K.
TR - Temperature of the reaction mixture, K.
Tcin - Inlet temperature of cooling water, K.
More detailed description of the process can be found in [8]. A dynamic simulator
was developed for the CSTR which has included three controllers as shown in
Figure AI. The simulator has a MS Windows based graphical interface which
allows users to make any changes and faults and disturbances can be easily
introduced. To generate a data set or data case, run the simulator at steady state and
introduce a disturbance or fault and at the same time start to record the dynamic
responses. Eighty five data sets were generated which are summarised in Table AI.
For each data set, eight variables were recorded, including F;, T;, C;, Tw;, Fw, TR, Co
and L. In each data set, each variable was recorded as a dynamic trend consisting of
150 sampling points. Therefore for each variable the data size is a matrix 85 (the
number of data sets) x 150 (the number data points representing a dynamic trend).
Table At Data cases generated. Data sets Data detail 1-11 All control loops are at AUTO mode and S.P. ofT R = 350K. Change Ti (K)
from 343 ~ 333, 343 ~ 323, 323 ~ 343, 343 ~ 353, 353 ~ 343, 343 ~ 363, 363 ~ 343, 310 ~ 303, 303 ~ 313, 310 ~ 293, 293 ~ 313
12-15 AIl control loops are at AUTO mode and S.P. ofTR = 350K. Change Ci (kmolfm3 ) from 2.0 ~ 1.6, 1.6 ~ 2.0, 2.0 ~ 1.2, 1.2 ~ 2.0
16-20 AIl control loops are at AUTO mode and S.P. ofT R = 350K. Change Fi (m3
fmin) from 1.00 ~ 1.06, 1.06 ~ 1.02, 1.02 ~ 0.94, 1.00 ~ 0.62, 0.62 ~ 1.00
21-24 All control loops are at AUTO mode and S.P. ofT R = 350K. Change L ( % ) from 50.0 ~ 60.0, 60.0 ~ 50.0, 50.0 ~ 40.0, 40.0 ~ 50.0
25-31 AIl control loops are at AUTO mode and S.P. ofT R = 405 K. Change Ti (K) from 343 ~ 333, 333 ~ 323, 323 ~ 333, 343 ~ 353, 353 ~ 343, 343 ~ 363, 363 ~ 343
32-36 All control loops are at AUTO mode and S.P. ofT R = 405 K. Change Twi (K) from 310 ~ 303, 310 ~ 293, 293 ~ 313, 3 13 ~ 323, 323 ~ 313
220 Data Mining and Knowledge Discovery for Process Monitoring and Control
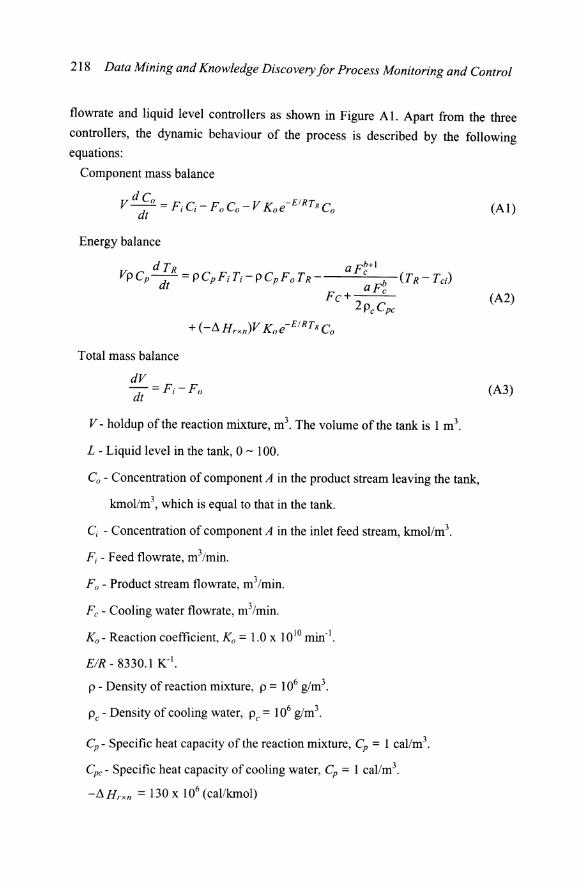
Table Al Data cases generated (continued). Data sets Data detail
37-39 All control loops are at AUTO mode and S.P. ofT R = 40S K. Change Ci (lanol/m3) from 2.0 ~ 1.6, 1.6 ~ 2.0, 2.0 ~ 1.2
40-43 All control loops are at AUTO mode and S.P. of T R = 40S K. Change Fi (m3
/min) from I.OO~ 1.06, 1.06~ 0.98, 0.98~ 0.86, 0.86~ 1.02 44-46 All control loops are at AUTO mode and S.P. ofT R = 40S K. Change L (%)
from SO.O~ 60.0, 60.0~ SO.O, SO.O~ 40.0 46-52 All control loops are at AUTO mode and S.P. ofT R = 380 K. Change Ti (K)
from 343~333, 333 ~ 323, 323 ~ 333, 333 ~ 343, 343 ~ 3S3, 3S3 ~ 343 53-56 All control loops are at AUTO mode and S.P. of T R = 380 K. Change Twi (K)
from 310 ~ 303, 303 ~ 313, 310 ~ 323, 323 ~ 313 57-60 All control loops are at AUTO mode and S.P. ofT R = 380 K. Change Ci
(kmollm3) from 2.0 ~ 1.6, 1.6 ~ 2.0, 2.0 ~ 1.2, 1.2 ~ 2.0 61-66 All control loops are at AUTO mode and S.P. of T R = 380 K. Change Fi (m3
/min) from 1.00~ 1.06, 1.06~ 1.00, 1.00~ 1.10, 1.I0~ 1.00, 1.00~ 0.90, 0.90~ 1.00
67-70 All control loops are at AUTO mode and S.P. of T R = 380 K. Change the S.P. of L ( % ) from SO.O~ 40.0, 40.0~ SO.O, SO.O~ 60.0, 60.0~ SO.O
71-80 All control loops are at AUTO mode and S.P. ofT R = 380 K. Change the output of the CSTR level controller from (S) SO.O~ 1 0.0, SO.O~ 8.0, SO.O~ 6.0, SO.O~ 12.0, SO.O~ 14.0, SO.O~IS.O, SO.O~ S.O, SO.O~ 2.0, SO.O~ 3.0, SO.O~ 0.0
81-85 All control loops are at AUTO mode. Change the output of the controller T R
from (%) 71.4~ 20.0, 71.4~ 21.0, 71.4~ 22.0, 71.4~ 19.0, 71.4~18.0
APPENDIXB THE RESDIUE FLUID CATALYTIC CRACKING (R-FCC) PROCESS
Fluid catalytic cracking process (FCC) is a dominant feature of most refmery
operations, representing the order of thirty percent in product value. FCC is also a
very complicated process featured by highly non-linear dynamics due to the strong
interactions between the riser tube reactor and fluidised bed regenerator through
heat, mass and pressure balances.
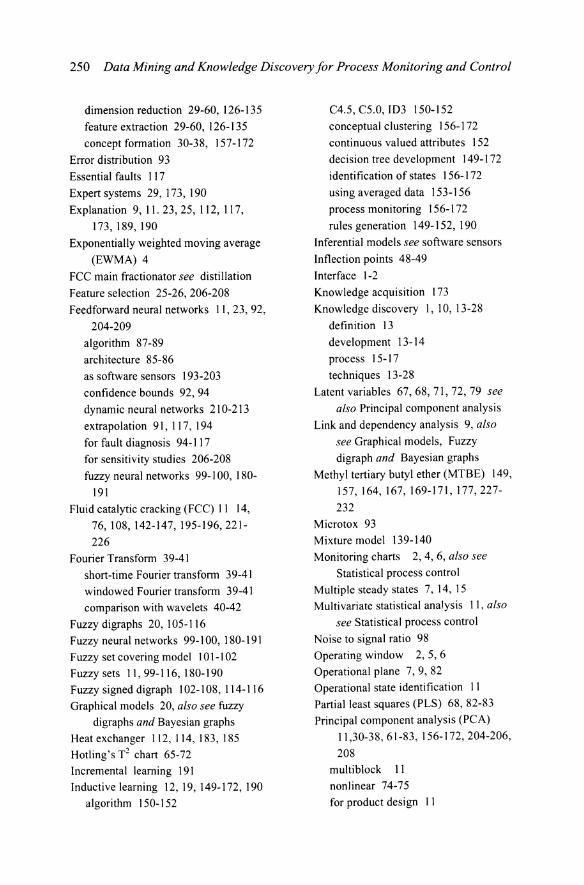
The residual fluid catalytic cracking (R-FCC), as shown in Figure B 1 is used as
case studies in Chapters 5 and 6. It converts heavy bottoms of the crude and vacuum
distillation columns into more valuable gasoline and lighter products. Preheated
feed is mixed with high temperature slurry recycle, which comes from the bottom of
the main fractionator, and injected into the riser tube reactor, where it is mixed with
high temperature regenerated catalyst and totally vaporises. The high temperature
regenerated catalyst provides the sensible heat, heat of vaporisation and heat of
reaction necessary for the endothermic cracking reactions which complete in a few
seconds. As a result of the cracking reactions, a carbonaceous material - coke is
deposited on the surface of the catalyst. As a result continuous regeneration is
required.
Separation of catalyst and gas occurs in the disengaging zone of the reactor.
Entrained catalyst is stopped by the cyclones. Catalyst is returned to the stripping
section of the reactor where steam is injected to remove entrained hydrocarbons.
Reactor product gas is channelled to the main fractionator for heat recovery and
separation into various product streams. Wet gas from the overheads of the main

222 Data Mining and Knowledge Discovery for Process Monitoring and Control
fractionator (C6 and lighter) is compressed for further separation in downstream fractionators.
Spent catalyst is transported from the reactor to the regenerator through the spent
catalyst pipe. Air is injected into the bottom of the regenerator lift pipe to assist the
circulation of catalyst.
Catalyst in the regenerator is fluidised with air which is provided by the lift and
combustion air blowers. Carbon and hydrogen on the catalyst react with oxygen to
produce carbon monoxide, carbon dioxide and water. While most of the reactions
occur in the fluidised bed, some reaction does occur in the disengaging section
above the bed, where some catalyst is still present. Gas travels up the regenerator
into the cyclones where entrained catalyst is removed and returned to the bed.
The regenerator is run at a high temperature and an excess of oxygen to ensure
that virtually all carbon monoxide produced in the bed is converted to carbon
dioxide before entering the cyclones. Because this is a residual FCC process
processing heavy feed, the amount of heat generated through burning coke in the
regenerator is more than that required by the endorthemic cracking reactions.
Therefore it has internal and external heat exchangers to remove the excess heat.
Regenerated catalyst flows over a weir into the regenerator standpipe. The head
produced by catalyst in the standpipe provides the driving force for catalyst through
the regenerated catalyst pipe to the riser tube reactor.
The major control loops for the process are summarised in Table Bl. They
include reaction temperature, pressures of the two reactor vessels as well as
flowrates of feed, air and steam as well as catalyst hold-up. A very important feature
of the process is the very complicated and dynamic interactions between the heat,
mass and pressure balances between the two reactor vessels, and fluidisation
conditions. On top of the control loops, safety guard systems playa critical role in
preventing disastrous situations. There are four major safety guard systems as shown
in Table Bl. They all need the authorisation of operators by pressing one or two
buttons to prevent system over reactions. When a safety guard system is activated,
in total fourteen valves will act to close, open or maintain at the original position
according to predefined logic.
A dynamic simulator for training operators was developed in 1992 by one of the
author, Wang for the refinery. The simulator has a number of features compared
with some other FCC simulators. First, it is able to simulate continuously and
smoothly the start-up and shutdown procedures and normal operation. In addition, it
has a very good operability. All the operating variables and equipment units are

Appendix B The Residue Fluid Catalytic Cracking (R-FCC) Process 223
operable within a wide range, including conditions regarded as abnonnal.
Furthennore apart from. faults that can be initiated randomly, there are also extra
twenty faults that are common to FCC processes. More importantly, it has high
fidelity: the simulator has been tested in the refinery for operator training for several
years and during the process the simulator has been continuously improved. There
are other features including intelligent on-line support, scoring and snapshot.
In this study, sixty four data patterns generated from the simulator was used which
are summarised in Table B2. We limit our discussion to 64 data patterns in order to
simplify the discussion and result presentation. The data sets include faults or
disturbances:
• fresh flow rate increased and decreased
• preheat temperature of mixed feed increased and decreased
• recycle slurry flow rate increased and decreased
• opening rate of hand valve V20 increased and decreased
• air flow rate increased and decreased
• valve 401-ST opening from 100% decreased
• cooling water pump failure
• compressor failure
• double faults
The sixty four data patterns were first generated by the customised dynamic
training simulator, then random noises were added to the data using a noise
generator ofMATLAB®, before it is fed to the system.

Flu
e ga
s
~----T
LC30
2
Wat
er
-_J
~ E
~ G) ~
G) ::t::
air
feed
com
bust
ion
oil
: ..... ~ ....
... .
furn
ace
Figu
re B
l T
he s
impl
ifie
d fl
ow sh
eet
of t
he R
-FC
C p
roce
ss.
8-
401-
ST
P132
1
Ste
am
I-< £ '" ~ S o (,
)
fres
h
feed
fj
~ ~ ~ ~ ~.
§ !:l.. ~
<::l ~ ~
~
~ b ~. ~ ~ ""'C
'"tl
~ r)
~ '" ~ ;:s
~.
~.
I:l ;:s
!:l.. ~
;:s ~ -.
Appendix B The Residue Fluid Catalytic Cracking (R-FCC) Process 225
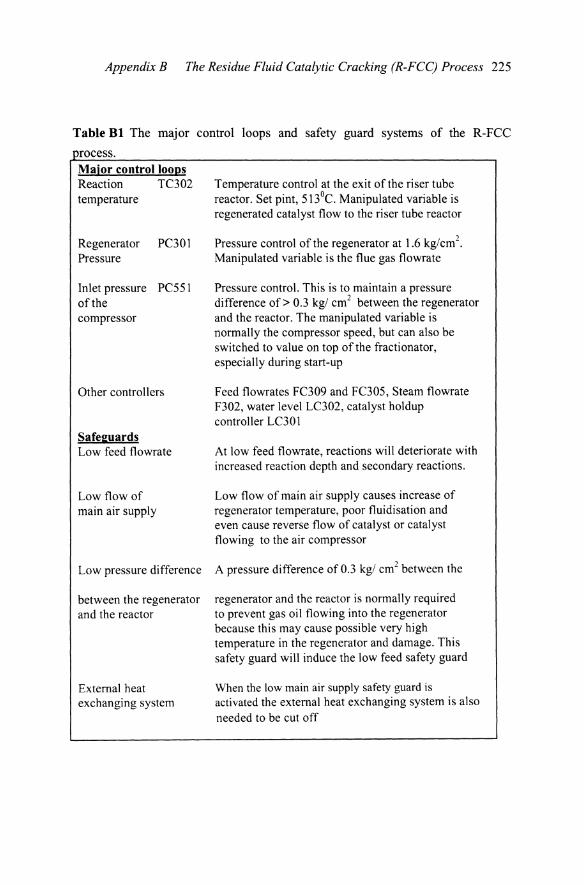
Table Bl The major control loops and safety guard systems of the R-FCC
rocess. Major control loops Reaction TC302 temperature
Regenerator PC30 I Pressure
Inlet pressure PC551 of the compressor
Other controllers
Safeguards Low feed flowrate
Low flow of main air supply
Low pressure difference
between the regenerator and the reactor
External heat exchanging system
Temperature control at the exit of the riser tube reactor. Set pint, 5 \30c. Manipulated variable is regenerated catalyst flow to the riser tube reactor
Pressure control of the regenerator at 1.6 kg/cm2•
Manipulated variable is the flue gas flowrate
Pressure control. This is to maintain a pressure difference of> 0.3 kg/ cm2 between the regenerator and the reactor. The manipulated variable is normally the compressor speed, but can also be switched to value on top ofthe fractionator, especially during start-up
Feed flowrates FC309 and FC305, Steam flowrate F302, water level LC302, catalyst holdup controller LC301
At low feed flowrate, reactions will deteriorate with increased reaction depth and secondary reactions.
Low flow of main air supply causes increase of regenerator temperature, poor fluidisation and even cause reverse flow of catalyst or catalyst flowing to the air compressor
A pressure difference of 0.3 kg/ cm2 between the
regenerator and the reactor is normally required to prevent gas oil flowing into the regenerator because this may cause possible very high temperature in the regenerator and damage. This safety guard will induce the low feed safety guard
When the low main air supply safety guard is activated the external heat exchanging system is also needed to be cut off

226 Data Mining and Knowledge Discovery for Process Monitoring and Control
Table B2 Summary of the data patterns studied.
Data Fault when time t < 0 operation is patterns mode at steady state, at t = 0 make
the following step change
1-9 1 Fresh feed increased by 10 20 30 40 50 60 70 80 90%
10-18 2 Fresh feed decreased by 10 20 30 40 50 60 70 80 90%
19-22 3 Preheat Temperature T of mixed feed increased by 5 10 15 20 Q C
23-24 4 Preheat Temperature of mixed feed decreased by 15 10 Q C
25-26 5 Recycle oil Flow rate F increased 70 90% 27-28 6 Recycle oil Flow rate F decreased 70 90% 29-32 7 Opening ratio of hand-valve V20
increased by 5 10 15 24% 33-37 8 Opening ratio of hand-valve V20
decreased by 15253555 10% 38 9 Cooling water pump P-02 failure 39-43 10 Air flow rate increased by 6.5 11.5 15
31.540.5% 44-49 11 Air flow rate decreased by 3.5 8.5 28.5
38.5 48.5 53.5% 50 12 Compressor failure 51-57 13 Valve 401-ST opening from 100%
decreased by 10 20 40 45 60 80 90% 58 1 Fresh feed Flow rate F increased by 65% 59 2 Fresh feed Flow rate F decreased by 85% 60 1&8 Fresh feed Flow rate F increased 65%
and V20 opening rate decreased 55% 61 1&9 Air flow rate increased 9.5% and
compressor failure 62 2&9 Air flow rate increased 9.5% and valve
401-ST opening decreased 35% 63 10&12 Pump P-02 failure and compressor failure 64 10&13 Fresh feed decreased 70% and valve
40 I-ST opening decreased 20%
APPENDIXC THE METHYL TERTIARY BUTYL ETHER (MTBE) PROCESS
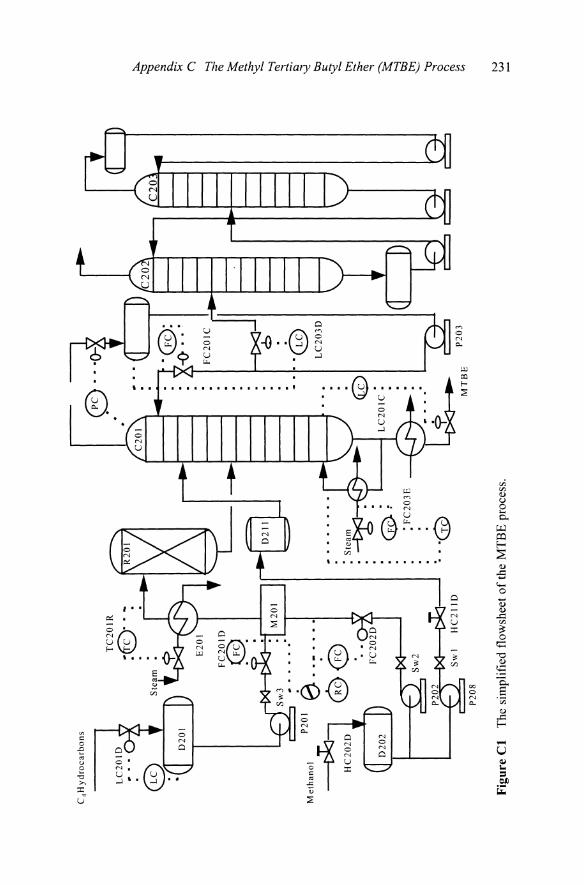
The refinery methyl tertiary butyl ether (MTBE) process, shown in Figure Cl is
used in Chapter 7 as a case study of applying conceptual clustering to developing
process monitoring systems. MTBE is an important industrial chemical because
large quantities of MTBE are now required as an octane booster in gasoline to
replace tetra ethyl lead. MTBE is produced from the reaction between isobutene and
methanol in a reactor and a catalytic distillation column packed with catalysts. The
reaction takes place at a temperature of 35-750C and a pressure of 0.7-0.9 MPa.
The main chemical reaction is:
methanol + isobutene === methy tertiary butyl ether
CH30H + (CH3hC=CH2 === (CH3)3COCH3
The reaction occurs in the liquid phase and is reversible and exothermic. Proper
selection of the reaction pressure allows part of the reaction product to be
vaporised, absorbing part of the heat of reaction. Thus the temperature in the reactor
could be controlled.
An unavoidable side reaction is:
isobutene + isobutene === diisobutene
(CH3hC=CH2 + (CH3hC=CH2 === {(CH3hC=CH2h However, the selectivity of the primary reaction is about 98-99%. Since the product
of the side of reaction is very limited it can be ignored.
MTBE is mostly produced in the reactor, and a small amount is produced in the
catalytic distillation column which combines reaction and distillation. The rest of
the isobutene and methanol from the reactor passes to the catalytic distillation
228 Data Mining and Knowledge Discovery for Process Monitoring and Control
column and is reacted. The MTBE produced is then separated simultaneously,
which ensures a high conversion level of isobutene in the catalytic distillation
column.
The rest of methanol after the reaction is recovered from the distillate of the top of
the column by water extraction and a conventional column. The solvability of
methanol in C4 hydrocarbon and in water is quite different so C4 hydrocarbon can be
easily separated from methanol water solution. The recovered methanol and C4
hydrocarbon are then recycled.
The process used in this study comprises a catalytic reactor R201, catalytic
distillation column C20 1, water extraction column C202, methanol distillation
column C203 and several other vessels together with pumps. The overview of the
flowsheet of the process is shown in Figure C 1. Methanol from D202 and C4 from
D201 are mixed in M201 and then pass to the reactor R201. An on-line analyser
measures the ratio of isobutene and methanol and the inlet temperature of the
reactor is controlled by means of the heat exchanger E20 1. Maintaining the pressure
in the reactor is important so as to control the amount of product vaporised to
absorb the heat of reaction. To achieve a high conversion level of isobutene an
additional methanol feed stream is introduced into the catalytic distillation column
at the top of the column. The vessel D211 is filled with catalysts and is used to filter
methanol before it enters the column. The MTBE is taken from the bottom of the
column and the distillate is the mixture of methanol and the C4 hydrocarbon. The
pressure controller at the top of the column is also used to control the pressure of
the upstream reactor. Part of the methanol and C4 hydrocarbon is returned to he
catalytic distillation column as reflux. The rest of the mixture passes to the water
extraction column C202 to be separated into unreacted C4 hydrocarbon which is
taken off from the top and the methanol water solution from the bottom.
The case study is based on data generated from a customised dynamic simulator
used for training operators in start-up and shutdown procedures, emergency
management as well as normal operation monitoring and control of a commercial
MTBE process. This simulator has also been used to study the start-up procedures
and has been validated over several years of usage for various normal and abnormal
conditions. Disturbances as well as faults concerned with various equipment items
can be easily introduced to the simulator and corresponding responses of variables
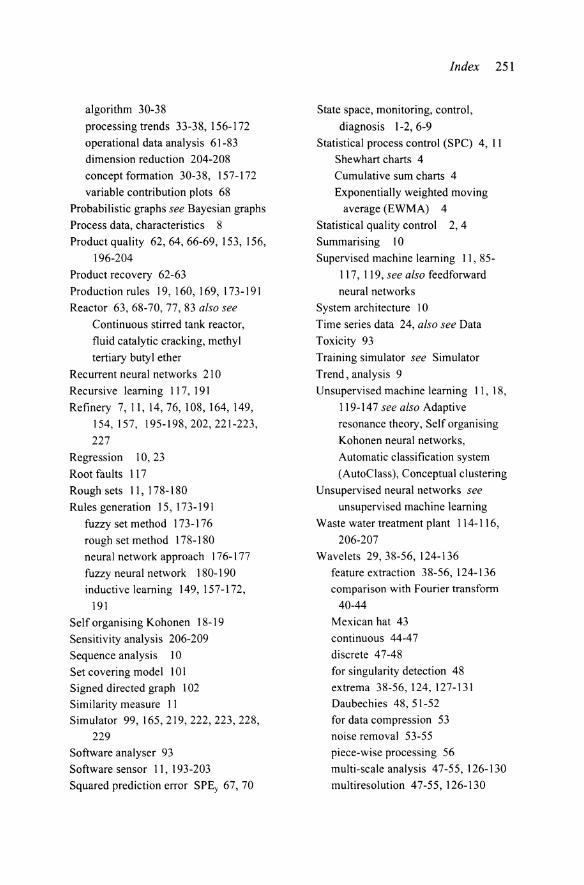
displayed in trend groups. This study comprises 100 tests, 64 of which are normal or
with small disturbances and 36 have significant upsets or faults, as summarised in
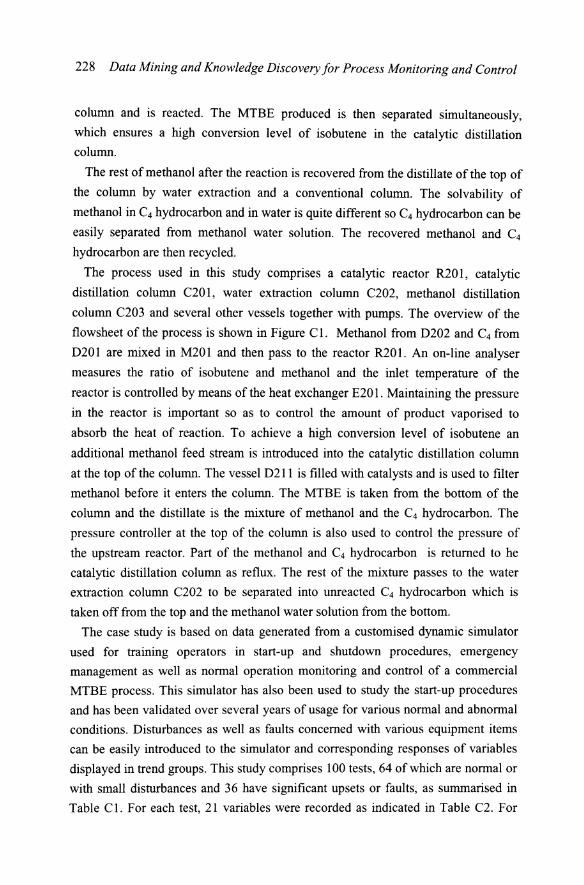
Table Cl. For each test, 21 variables were recorded as indicated in Table C2. For
Appendix C The Methyl Tertiary Butyl Ether (MTBE) Process 229
each variable, 256 data points are recorded following a disturbance or fault. So the
data has a dimension of 21 x 256. Random noise was added to the data. Figure C2
shows such an example.
Only the sections of feed, reactor and reactive distillation column of the process
have been considered, which means that columns C202 and C203 have not been
included in the study apart from the fact that there is a small recycle stream of the
recovered methanol which affects the feed tank D202. This recycle stream was fixed
at the design flowrate.
Table C2 The variables recorded as dynamic responses.
No. Variable Description 1 F_D201_in Inlet Flow ofD201 2 F_D20Lout Outlet Flow ofD201 3 L_D201 Liquid Level of D20 1 4 LD202_in1 Adding methanol Flow of D202 5 F_D202_out1 Methanol flow from D202 to R201 6 F _D202_out2 Methanol flow from D202 to D211 7 L_D202 Liquid Level of D202 8 T_E201_out Outlet Temperature ofE201 9 F _E20 I_steam Steam flow through E201 10 T_R201_top Top Temperature of reactor R201 11 T_R201_mid Middle Temperature of reactor R201 12 T_R201_bot Bottom Temperature of reactor R201 13 F_C20Lref Reflex flow ofC201 14 F_C201_out Product Flow ofMTBE 15 T_C20Ltop Top Temperature ofC201 16 T_C20Lmid Middle Temperature ofC201 17 T_C201_bot Bottom Temperature ofC201 18 T_MTBE MTBE Temperature 19 L_C201 Liquid Level ofC201 20 LD203_out Liquid Flow from D203 to C202 21 L D203 Liquid Level ofD203
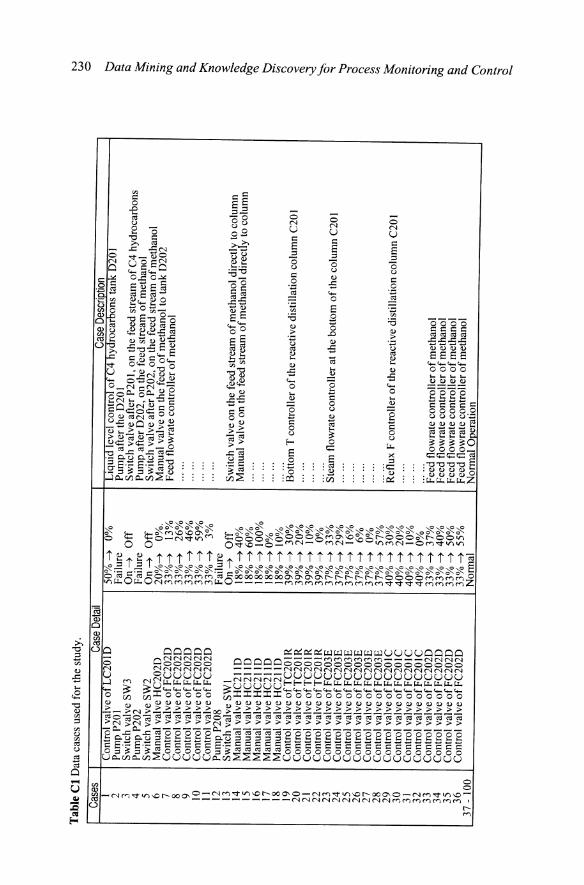
Tab
le C
l Dat
a ca
ses
used
for
the
stu
dy,
Case
s Ca
se D
etail
I
Con
trol
val
ve o
f LC
20 I
0 50%~
0%
2 Pu
mp
P201
Fa
ilur
e 3
Switc
h va
lve
SW3
On~
Off
4
Pum
p P2
02
Fail
ure
5 Sw
itch
valv
e SW
2 On~
Off
6
Man
ual
valv
e H
C20
20
20%~
0%,
7 C
ontr
ol v
alve
of F
C20
20
33%~
13%
8
Con
trol
val
ve o
f FC
2020
33%~
26%
9
Con
trol
val
ve o
f FC
202D
33%~
46%
10
C
ontr
ol v
alve
of F
C20
20
33%~
59%
II
C
ontr
ol v
alve
of F
C20
20
33%~
3%
12
Pum
p P2
08
Failu
re
13
Switc
h va
lve
SWI
On~
Off
14
M
anua
l va
lve
HC
211D
18%~40%
15
Man
ual
valv
e H
C21
1D
18%~60%
16
Man
ual
valv
e H
C21
10
18%~ 1
00%
17
M
anua
l va
lve
HC
211D
18%~0%
18
Man
ual
valv
e H
C21
10
18%~ 1
0%
19
Con
trol
val
ve o
fTC
20
lR
39%
~
30%
20
C
ontr
ol v
alve
of T
C20
I R
39%
~
20%
21
C
ontr
ol v
alve
of T
C20
I R
39%~
10%
22
C
ontr
ol v
alve
ofT
C2
0lR
39%~
0%
23
Con
trol
val
ve o
f FC
203E
37
% ~
33%
24
C
ontr
ol v
alve
ofF
C20
3E
37%
~
29%
25
C
ontr
ol v
alve
ofF
C20
3E
37%
~
16%
26
C
ontr
ol v
alve
of F
C20
3E
37%~
6%
27
Con
trol
val
ve o
fFC
203E
37%~
0%
28
Con
trol
val
ve o
fFC
203E
37
% ~
57%
29
C
ontr
ol v
alve
ofF
C2
0lC
40
% ~
30%
30
C
ontr
ol v
alve
ofF
C2
0lC
40%~
20%
31
C
ontr
ol v
alve
ofF
C2
0lC
40
% ~
10%
32
C
ontr
ol v
alve
ofF
C2
0lC
40%~
0%
33
Con
trol
val
ve o
f FC
2020
33
% ~
37%
34
C
ontr
ol v
alve
of F
C20
20
33%~
40%
35
C
ontr
ol v
alve
of F
C20
20
33%
~
50%
36
C
ontr
ol v
alve
of F
C20
20
33%~
55%
37
-10
0 N
onna
l
Case
Des
crio
tion
Liq
uid
leve
l co
ntro
l o
f C4
hydr
ocar
bons
tan
k 0
20
I P
ump
afte
r th
e 0
20
I Sw
itch
val
ve a
fter
P20
1, o
n th
e fe
ed s
trea
m o
fC4
hyd
roca
rbon
s P
ump
afte
r 02
02,
on t
he f
eed
stre
am o
f met
hano
l S
wit
ch v
alve
aft
er P
202,
on
the
feed
str
eam
of m
etha
nol
Man
ual
valv
e on
the
feed
of m
etha
nol
to t
ank
02
02
F
eed
flow
rate
con
trol
ler
of m
etha
nol
...
'"
....
..
....
..
.. ,
, ..
Swit
ch v
alve
on
the
feed
str
eam
of m
etha
nol
dire
ctlJ
, to
colu
mn
Man
ual
valv
e on
the
feed
str
eam
of m
etha
nol
dire
ct y
to c
olum
n ..
....
•••
,0
'
-...
..
Bot
tom
T c
ontr
olle
r o
f the
rea
ctiv
e di
stil
lati
on c
olum
n C
201
....
..
-.. '
"
Ste~m
flow
rate
con
trol
ler
at th
e bo
ttom
of t
he c
olum
n C
201
...
,-,
....
..
...
, ..
...
...
Re'f
lux
F co
ntro
ller
of t
he r
eact
ive
dist
illa
tion
col
umn
C20
I •••• 0
.
...
,.,
F~~d
flo
wra
te c
ontr
olle
r o
f met
hano
l F
eed
flow
rate
con
trol
ler
of m
etha
nol
Fee
d fl
owra
te c
ontr
olle
r o
f met
hano
l F
eed
flow
rate
con
trol
ler o
f met
hano
l N
onna
l O
pe@
tioll
I
tv
W
o ~ l:) ~ ~'
I:l
~
I:l.. ~ a ~ 0%-
(1) i::1
1;
;' ~ a j ~
.... ~ ~ ~ ~ ~ ~.
.... ~'
I:l
~
I:l.. g ;::; ~ -...
C4H
yd
roca
rbo
ns
Met
han
ol
P201
~
e .. :-
....
@@
P20
8
_ .
• •
. •
• •
r-J.-
--.-
-...
r
• S
team
.~
<$).;
:
FC
20
3E
... ·cw
Figu
re C
l T
he s
impl
ifie
d fl
owsh
eet
of t
he M
TB
E p
roce
ss.
FC
20
I C
1
-'1
''-I
~~t-
I ---f
6
: .1
··6
\.!
:9
LC
203D
@
MT
BE
P
203
~
~ § l:l...
~.
()
:j ~ ~ ~ - ~ :::t
5·
~
b::I
l:: ~ ~ ~ ~
~ ~ ~ n ~ tv
w

232 Data Mining and Knowledge Discovery for Process Monitoring and Control
o ;::s
<;j
>
5
4
3
2
o
4
3
o 31 61 91 121 151
Data point
Figure C2 Two dynamic trends with and without noise.
181 211 241

REFERENCES
Lukas MP. Distributed control systems: their evaluation and design. Van Nostrand Reinhold Company, New York Wokingham, 1986.
2 Yamanaka F and Nishiya T. Application of the intelligent alarm system for the plant operation. Comput Chern Engng 1997; 21: s625-s630.
3 Howat CS. Analysis of plant performance. In: Perry RH, Green DW (eds.) Perry's chemical engineers' handbook, Section 30. McGraw-Hill, 1997,30-1 - 30-36.
4 Saraiva PM and Stephanopoulos G. Continuous process improvement through inductive and analogical learning. AIChE 1. 1992; 38: 161-183.
5 Saraiva, PM. Inductive and analogical learning: data-driven improvement of process operations. In: Stephanopoulos G and Han C (Eds) Intelligent Systems in Process Engineering: Paradigms from Design and Operations. Academic Press, Inc., San Diego, California, 1996,377-435.
6 Taylor W. What every engineer should know about artificial intelligence. MIT Press, Cambridge, MA, 1989.
7 Shewhart WA. Economic control of quality of manufactured product. Van Nostrand, Princeton, N.J., 1931.
8 Marlin TE. Process control - designing processes and control systems for dynamic performance. McGraw-Hill, 1995.
9 Oakland JS. Statistical process control: a practical guide. Heinemann, London, 1986.
10 Woodward RH, Goldsmith PL. Cumulative sum techniques. Oliver and Boyd" London, 1964.
II Roberts SW. Control charts tests based on geometric moving averages. Technometrics 1959; I: 239-250.
12 Hunter JS. The exponentially weighted moving average. J of Quality Technology 1986; 18:203-210.

234 Data Mining and Knowledge Discovery for Process Monitoring and Control
13 Stephanopoulos G. Chemical process control: an introduction to theory and practice. Prentice-Hall, Inc., New Jersey, 1984.
14 Bekiaris N, Morari M. Multiple steady states in distillation: infinity/infinity predictions, extensions, and implications for design, synthesis, and simulation. Ind. Eng. Chern. Res. 1996; 35: 4264-4280.
15 Schrans S, DeWolfS, Baur R. Dynamic simulation of reactive distillation: an MTBE case study. Comput. Chern Engng, 1996; 20: S1619- S1624.
16 Arandes JM, Delasa HI. Simulation and multiplicity of steady-states in fluidised FCCUs. Chern. Eng. Sci., 1992; 47: 2535- 2540.
17 Hangos KM, Perkins JD. Structural stability of chemical process plants. AIChE 1., 1997; 43: 1511-1518.
18 Quinlan JR. C4.5: programs for machine learning. Morgan Kauffman, 1993.
19 Quinlan JR. Induction of decision trees. Machine learning 1986; 1: 81-106.
20 Quinlan JR. http://www.rulequest.com/. 1999
21 Chen FZ, Wang XZ. An integrated data mining system and its application to process operational data analysis. Comput. Chern. Engng 1999; 23(suppl.): s777-s780.
22 Clarke-Pringle T, MacGregor JF. Product quality control in reduced dimensional spaces. Ind. Eng. Chern. Res. 1998; 37:3992-4002.
23 Fayyad UM, Simoudis E. Data mining and knowledge discovery. Tutorial Notes at PADD'97 - 1st Int. Conf. Prac. App. KDD & Data Mining, London, 1997.
24 Massey J, Newing R. Trouble in mind. Computing 1994; May: 44-45.
25 Fayyad UM, Piatetsky-Shapiro G, Smyth P. From data mining to knowledge discovery: an overview. In: Fayyad UM, Piatetsky-Shapiro G, Smyth P, Uthurusamy R (eds.) Advances in Knowledge Discovery and Data Mining. AAAI Press/MIT Press, 1996, 1-36.
26 Glymour C, Madigan D, Pregibon D, Smyth P. Statistical themes and lessons for data mining. Data Mining and Knowledge Discovery 1997; 1: 11-28.
27 Elder IV J, Pregibon D, A statistical perspective on knowledge discovery in databases. In: Fayyad UM, Piatetsky-Shapiro G, Smyth P, Uthurusamy R (eds.) Advances in Knowledge Discovery and Data Mining. AAAI Press/MIT Press, 1996, 83-116.
28 Chen MS, Han JW, Yu PS. Data mining: an overview from a database perspective. IEEE Trans. Know. Data Eng. 1996,8: 866-883.
29 Imielinski T, Mannila H. A database perspective on knowledge discovery. Comm. of ACM 1996; 39(11): 58-64.
References 235
30 Inmon WHo The data warehouse and data mining. Comm. of the ACM 1996; 39( II): 49-50.
31 Shortland R, Scarfe R. Data mining applications in BT. BT Technology J. 1994; 12(4): 17-22.
32 Brachman RJ, Khabaza T, Kloesgen W, Piatesky-shapiro G, Simoudis E. Mining business databases. Comm. of ACM 1996; 39(11 ):42-48.
33 Fayyad U, Piatetsky-Shapiro G, Smyth P. The KDD process for extracting useful knowledge from volumes of data. Comm. of the ACM 1996; 39(11): 27-34.
34 Meggs G, Fagan M. Knowledge discovery - practical methodology and case studies. Tutorial Notes in PADD98 - 2nd Int. Conf. Prac. App!. Know!. Disc. Data Mining. London, 1998.
35 Fayyad U, Haussler D, Stolorz P. Mining scientific data. Comm. of the ACM 1996; 39(11): 51-57.
36 Kohonen T. Self-organisation and associative memory. Springer-Verlag, Berlin, 1988.
37 Apte, C. Data Mining: an industrial research perspective. IEEE Computational Sci. & Eng. 1997; 4(2): 6-9.
38 Kohonen T. Self-organising maps. Springer-Verlag, Berlin, 1995.
39 Cheeseman P and Stutz J. Bayesian classification (AutoClass): theory and results. In: Fayyad UM, Piatetsky-Shapiro G, Smyth P, Uthurusamy R (eds.) Advances in Knowledge Discovery and Data Mining. AAAI Press/MIT Press, 1996, 153-180.
http://fi-www.arc.nasa.gov/fi/projects/bayes-group/group/autoclass/autoclass-cprogram.html
40 Cheeseman P, Freeman D, Kelly J, SelfM, Stutz, J, Taylor W. AutoClass: a Bayesian classification system. In: Proc Fifth Inter Conf Machine Learning, 1988.
41 Cheeseman P, Stutz J, Self M, Taylor W, Goebel J, Volk K, Walker H. Automatic classification of spectrum from the infrared astronomical satellite (IRAS), NASA reference publication # 1217, National technical Information Service, Springfield, Virginia, 1989.
42 Hanson R, Stutz J, Cheeseman P. Bayesian classification theory, hup://fiwww.arc.nasa.gov/fi/projects/bayes-group/group/autoclass/autoclass-c-program.html. 1997.
43 Carpenter GA and Grossberg S. ART2: self-organisation of stable category recognition codes for analogue input patterns. Appl Opt 1987b; 26: 4919-4930.
44 Duran BS and Odell PL. Cluster analysis: a survey. Springer-Verlag, 1974.
45 Everitt BS and Dunn G. Applied multivariate data analysis. Edward Arnold. 1991.
236 Data Mining and Knowledge Discovery for Process Monitoring and Control
46 Everitt BS. Cluster analysis. 3rd edition, Edward Arnold, London, 1993.
47 Grossberg S. Adaptive pattern classification and universal recording: I. parallel development and coding of neural feature detector. Bio Cybernet 1976; 23: 121-134.
48 Grossberg S. Adaptive pattern classification and universal recording: II feedback, expectation, olfaction, illusions. Cybernet 1976; 23: 187-202.
49 Carpenter GA and Grossberg S. A massive parallel architecture for a self-organising neural pattern recognition machine. Computer Vision Graphics and Image Processing 1987; 37: 54-115.
50 Carpenter GA and Grossberg S. ART3: hierarchical search using chemical transmitters in self-organising pattern recognition architectures. Neural Networks 1990; 3: 129-152.
51 Carpenter GA and Grossberg S. The ART of adaptive pattern recognition by a selforganising neural network. Computer 1988; 21:77-88.
52 Buntine W. A guide to the literature on learning probabilistic networks from data. IEEE Trans. Know!. Data Engng 1996; 8(2): 195-21 O.
53 Buntine W. Graphical models for discovering knowledge. In: Fayyad UM, PiatetskyShapiro G, Smyth P, Uthurusamy R (eds.) Advances in Knowledge Discovery and Data Mining. AAAI Press/MIT Press, 1996, 59-82.
54 Cooper GF and Herskovits E. A Bayesian method for the induction of probabilistic networks from data. Machine Learning 1992; 9: 309-347.
55 Bouckaert RB. Properties of Bayesian network learning algorithms. In: Lopez R, Poole, D (Eds.), Uncertainty in Artificial Intelligence: Proc. Ninth Conf., de Mantaras, 1993, 102.
56 Bouckaert RB. Belief network construction using the minimum description length principle. Proc. ECSQARU 1993; 41.
57 Wang XZ, Chen BH, McGreavy C. Data mining for failure diagnosis of process units by learning probabilistic networks. Trans. IChemE 1997; 75B: 210-216.
58 Jensen FV. An introduction to Bayesian networks. UCL Press, 1996.
59 Wang XZ, Yang SA, Veloso E, Lu ML, McGreavy C. Qualitative process modelling - a fuzzy signed directed graph method. Comput. & Chern. Engng 1995; 19(suppl.): s735-s740.
60 Wang XZ, Yang SA, Yang SH, McGreavy C. Fuzzy qualitative simulation in safety and operability studies of process plants. Comput. & Chern. Engng 1996; 20: s671-s676.
61 Agrawal R, Imielinski T, Swami A. Mining association rules between sets of items in large databases. In: Proc. ACM SIG-MOD Conf. on Management of Data, Washington, D.C., 1993,207-216.

References 237
62 Agrawal R, Mannila H, Srikant R, Toivonen H, Verkamo AI. Fast discovery of association rules. In: Fayyad UM, Piatetsky-Shapiro G, Smyth P, Uthurusamy R (eds.) Advances in Knowledge Discovery and Data Mining. AAAI Press/MIT Press, 1996,307-328.
63 Kolodner JL. An introduction to case-based reasoning. Artificial Intelligence 1992; 6: 3-34.
64 Watson I, Marir F. Case-based reasoning: a review. The Knowl. Engng Review 1994; 9: 327-354.
65 Caruana CM. Case-based reasoning gets CPI foothold. Chern. Eng. Progr 1999; 95(4): 9-10.
66 Jefferson M, Chung PW, Kletz TA. Learning the lessons from past accidents. Hazards XIII process safety - the future, symposium series No. 141, The Institution of Chemical Engineers, Manchester, 1997,217-226.
67 Kraslawski A, Koiranen T, Nystrom L. Case-based reasoning system for mixing equipment selection. Comput. Chern. Engng 1995; 19(suppl.): s821-s826.
68 Graco W, Cooksey RW. Feature selection with data mining. Proc. PADD98 - The second int. conf. on the practical application of knowl. discovery and data mining, London, March 1998, 111-130.
69 Gnanadesikian R, Kettenring JR, Tsao SL. Weighting and selection of variables for cluster analysis. J. of Classification 1995; 12: 113-136.
70 Milligan GW. Clustering validation: results and implications for applied analysis. In: Arabie P, Hubert LJ, De Sote G (eds.), clustering and classification. River Edge NJ: World Scientific, 1996,341-375.
71 Fayyad UM, Piatetsky-Shapiro G, Smyth P, Uthurusamy R (eds.) Advances in Knowledge Discovery and Data Mining. AAAI Press/MIT Press, 1996.
72 Wu, X. Knowledge acquisition from databases. Ablex, USA, 1995.
73 Simoudis E, Han, J, Fayyad UM (eds.) KDD-96: proceedings-second international conference on knowledge discovery & data mining. AAAI Press, 1996.
74 Wu X, Kotagiri R, Korb K (eds.) Research and development in knowledge discovery and data mining: proceedings of the second Pacific-Asia conference, PAKDD-98. Springer, 1998.
75 Pyle D. Data preparation for data mining. Morgan Kaufmand Publishers, 1999.
76 Moore RL, Kramer MA. Expert systems in on-line process control. Proc. third int. conf. chemical process control, in Chemical Process Control - CPCIII (Edited by Morari M and McAvoy TJ), Asilomar, California, January 1986, Elsevier Amsterdam. p.839.
77 Janusz ME and Venkatasubramanian V. Automatic generation of qualitative

238 Data Mining and Knowledge Discovery for Process Monitoring and Control
descriptions of process trends for fault detection and diagnosis. Engng Applic. Artif. Intel!., 1991; 4: 329-339.
78 Cheung lTY and Stephanopoulos G. Representation of process trends - I. a formal representation framework. Comput. & Chern Engng 1990; 14: 495-510.
79 Cheung lTY and Stephanopoulos G. Representation of process trends - 2. the problem of scale and qualitative scaling. Comput. & Chern Engng 1990; 14: 511-539.
80 Whiteley JR and Davis JF. Knowledge-based interpretation of sensor patterns. Com put. Chern. Engng 1992; 16: 329-346.
81 Bakshi BR and Stephanopoulos G. Representation of process trends. Part III. Multiscale extraction of trends from process data. Comput. & Chern Engng 1994; 18: 267-320.
82 Chen BH, Wang XZ, Yang SH, McGreavy C. Application of wavelets and neural networks to diagnostic system development - I. feature extraction. Comput. Chern. Engng. 1999; 23: 899-906.
83 Wang XZ, Li RF. Combining conceptual clustering and principal component analysis for state space based process monitoring. Internal report, University of Leeds, 1999.
84 Pearson K. On lines and planes of closest fit to systems of points in space. Phi.1 Mag. 1901; 2: 559-572.
85 Hotelling H. Analysis of a complex of statistical variables into principal components. J Educ. Psycho!. 1933; 24: 417-441,498-520.
86 Misiti M, Misiti Y, Oppenheim G, Poggi, JM. Wavelet toolbox User's Guide, Version I. The Math Works Inc.1997.
87 Chan YT. Wavelet basics. Kluwer Academic Publishers, Boston London, 1995.
88 Daubechies I. Ten lectures on wavelets. Society of Industrial and Applied mathematics, Philadelphia, Pennsylvania, 1992.
89 Mallat S. A theory for multiresolution signal decomposition: the wavelet representation. IEEE Pattern Ana!. and Machine Intel!. 1989; 11: 674-693.
90 Bakshi BR and Stephanopoulos G. Reasoning in time: modelling, analysis, and pattern recognition of temporal process trends. In: Stephanopoulos G, Han C (eds.) Intelligent systems in process engineering - paradigms from design to operations, Academic Press, 1996,487-549.
91 Bakshi BR and Stephanopoulos G. Representation of process trends. Part IV. Induction of real-time patterns from operating data for diagnosis and supervisory contro!. Comput. & Chern Engng 1994; 18: 303-332.
92 Mallat S, Hwang WL. Singularity detection and processing with wavelets. IEEE Trans. on Inf. Theory 1992; 38: 617-643.

References 239
93 Mallat S, Zhong S. Characterisation of signals from multi-scale edges. IEEE Trans. Pattern Analysis and Machine Intelligence 1992; 14,710-732.
94 Berman Z, Baras JS. Properties of the multi-scale maxima and zero-crossing representations. IEEE Trans. Signal Processing 1993; 41: 3216-3231.
95 Cvetkovic Z, Vetterli M. Discrete-time wavelet extrema representation: design and consistent reconstruction. IEEE Trans. Signal Processing 1995; 43: 681-693.
96 William Be. Doing time: putting qualitative reasoning on firmer ground. National conf. on artif. intell., Philadelphia, 1986.
97 Mallat S. Zero-crossing of a wavelet transform. IEEE Trans. on Information Theory 1991; 37: 1019-1033.
98 Carrier JF, Stephanopoulos G. Wavelet-based modulation in control-relevant process identification. AIChE J. 1998; 44: 341-360.
99 Dai X, Joseph B, Motard RL. Introduction to wavelet transformation and time frequency analysis. In: Motard RL, Joseph B (eds.) Wavelet applications in chemical engineering. Kluwer Academic Publishers, 1994, 1-32.
100 Joshi A, Kumar A, Motard RL. Trend analysis using the Frazier-Jawerth transform. In: Motard RL, Joseph B (eds.) Wavelet applications in chemical engineering. Kluwer Academic Publishers, 1994, 85-113.
101 Dai X, Joseph B, Motard RL. Process signal feature analysis. In: Motard RL, Joseph B (eds.) Wavelet applications in chemical engineering. Kluwer Academic Publishers, 1994, 115-137.
102 Ramesh TS, Shum SK, Davis JF. A structured framework for efficient problemsolving in diagnostic expert systems. Comput. Chern. Engng 1988; 12: 891-902
103 MacGregor JF, Kourti T. Multivariate statistical treatment of historical data for productivity and quality improvements. In: Pekny J, Blau G. (eds.) Foundation of computer aided process operations, University of Michigan, Ann Arbor Press , 1998, in print.
104 Kresta JV, MacGregor JF, Marlin TE. Multivariate statistical monitoring of process operating performance. Cana. 1. Chern. Eng. 1991; 69: 35-47.
105 Kourti T, MacGregor JF. Process analysis, monitoring and diagnosis, using projection methods - a tutorial. Chemometrics and Intell. Lab. Systems 1995; 28:3-21.
106 Jobson JD. Applied multivariate data analysis. Vol II: categorical and multivariate methods. Springer-Verlag New York, Inc., 1992.
107 Hotelling H. Multivariate quality control, illustrated by the air testing of sample bombsights. In: Eisenhart C, Hastay MW, Wallis WA (eds.) Techniques of Statistical Analysis, McGraw-Hill, New York, 1947, 113-184 ..
240 Data Mining and Knowledge Discovery for Process Monitoring and Control
108 Alt FB, Smith ND. Multivariate process control. In: Krishnaiah PR, Rao CR (eds.) Handbook of statistics, Vol. 7, North-Holland, Amsterdam, 1988,333-351.
109 Ryan TP. Statistical methods for quality improvement. Wiley, New York, 1989.
110 Jackson lE. A user's guide to principal components. John Wiley and Sons, Inc., New York,1991.
I II Tracy ND, Young JC, Mason RL. Multivariate control charts for individual observations. 1. Quality Tech. 1992; 24: 88-95.
112 MacGregor JF, Kourti T. Statistical process control of multi variable processes. Control Engng Practice 1995; 3: 403-414.
I I3 MacGregor JF, Jaeckle C, Kiparissides C, Koutoudi M. Process monitoring and diagnosis by multiblock PLS methods. AIChE J. 1994; 40: 826-838.
114 Martin EB, Morris J, Papazoglou MC. Confidence bounds for multivariate process performance monitoring charts. Preprints of the IF AC workshop on on-line fault detection and supervision in the chemical process industries, Newcastle, June 1995; 33-42.
115 Wold S, Geladi P, Esbensen K, Ohman J. Multi-way principal components- and PLSanalysis. 1. Chemometrics 1987; 1:41-56.
116 Nomikos P, MacGregor JF. Monitoring batch process using multi way principal component analysis. AIChE 1. 1994; 401361-1375.
117 Palus M, Dvorak I. Singular-value decomposition in attractor reconstruction: pitfalls and precautions. PhysicaD 1992; 55: 221-234.
118 Xu L, Oja E, Suen CY. Modified hebbian learning for curve and surface fitting. Neural Networks 1992; 5: 441-457.
119 Dong D, McAvoy TJ. Nonlinear principal component analysis - based on principal curves and neural networks. Comput Chern Engng 1996; 20: 65-78.
120 Gnanadesikian R. Methods for statistical data analysis of multivariate observations. Wiley, New York, 1977.
121 Etezadi-Amoli J, McDonald RP. A second generation nonlinear factor analysis. Psychometrika 1983; 48(3): 315-327.
122 Kramer MA. Nonlinear principal component analysis using autoassociative neural networks. AIChE J 1991; 37: 233-243.
123 Sammon JW. A nonlinear mapping for data structure analysis. IEEE Trans. Comput. 1969; C18: 401.
124 Yuan B, Wang XZ, Chen FZ, Morris T. Software analyser design using data mining technology for toxicity prediction of aqueous effluents. Proc. 2nd Conf. on Process Integration, Modelling and Optimisation for Energy Saving and Pollution Reduction

References 241
(Pres'99). Budapest, Hungary, May 31 - June 2,1999.
125 Bakshi BR. Multiscale PCA with application to multivariate statistical process monitoring. AIChE J. 1998; 44:1596-1610.
126 Tabe H, Chow KC, Tan KJ, Zhang J, Thornhill N. Dynamic principal component analysis using integral transforms. AIChE Annual Meeting, November 1998.
127 Biehl M, Schlosser E. The dynamics of on-line principal component analysis. J Phys. A: Math. Gen. 1998; 31: L97-Ll03.
128 Neogi D, Schlags CEo Multivariate statistical analysis of an emulsion batch process. Ind. Eng. Chern. Res. 1998; 37: 3971-3979.
129 Jaeckle CM, MacGregor JF. Product design through multivariate statistical analysis of process data. AIChE J. 1998; 44: 1105-1118.
130 Kresta JV, Marlin TE, MacGregor JF. Development of inferential process models using PLS. Comput. Chern. Engng. 1994; 18: 597-611.
131 Santen A, Koot GLM and Zullo LC. Statistical data analysis of a chemical plant. Comput Chern Engng 1997; 21(suppl.): sI123-s1129.
132 Zhang J, Martin EB, Morris AJ. Fault detection and diagnosis using multivariate statistical techniques. Trans. IChemE 1996; 74A: 89-96.
133 Dunia R, Qin SJ, Edgar TF, McAvoy T1. Identification of faulty sensors using principal component analysis. AIChE 1. 1996; 42: 2797-2812.
134 Qin SJ, Vue HY, Dunia R. Self-validating inferential sensors with application to air emission monitoring. Ind. Eng. Chern. Res. 1997; 36: 1675-1685.
135 Chen FZ, Wang xz. Knowledge discovery using PCA for operational strategy development and product design. Submitted to Trans. IChemE Part A, 1999.
136 Chen JG, Bandoni JA, Romagnoli JA. Robust PCA and normal region in multivariate statistical process monitoring. AIChE J. 1996; 42: 3563-3566.
137 Negiz A, Cinar A. Statistical monitoring of multivariable dynamic processes with state space models. AIChE J. 1997; 43: 2002-2020.
138 Leonard J, Kramer MA. Improvement of the backpropagation algorithm for training neural networks. Comput Chern Engng 1990; 14: 337-341.
139 Brent RP. Fast training algorithms for multilayer neural nets. IEEE Trans. Neural Nets 1991; 2:346-354.
140 Chen S, Billings SA. Neural networks for nonlinear dynamic system modelling and identification. Int. J. Control 1992; 56: 319-346.
141 Peel C, Willis MJ, Tham MT. A fast procedure for the training of neural networks. J. Proc. Cont. 1992; 2: 205-211.

242 Data Mining and Knowledge Discovery for Process Monitoring and Control
142 Powell MJD. Some global convergence properties of a variable metric algorithm for minimisation without exact line searches. In: Cottle R, Lemke CE (eds.) SIAM-AMS Proc. Symposium on non-linear programming, 1975, IX: 53-72.
143 Press WH, Flannery, BP, Teukolsky, SA, Vetterling, WT. Numerical recipes, the art of scientific computing (Fortran version). Cambridge University Press, Cambridge, 1989.
144 Lorentz, GG. The 13th problem of Hilbert. In: Browder FE (Ed.) Mathematical developments from Hilbert problems. America Mathematical Society, Providence, R.I., 1976.
145 Crowe ER, Vassiliadis CA. Artificial intelligence: staring to realise its practical promise. Chern. Eng. Progr. 1995; 91(1): 22-31.
146 Knight K. Connectionist ideas and algorithms. Comm. of the ACM 1990; 33 (II): 59-74.
147 Chitra SP. Use of neural networks for problem solving. Chern. Eng. Progr. 1993; 89(4): 44-52.
148 Kramer MA, Leonard, JA. Diagnosis using backpropagation neural networks -analysis and criticism. Comput. Chern. Engng 1990; 14: 1323-1338.
149 Shao R, Martin EB, Zhang J, Morris AJ. Confidence bounds for neural network representations. Comput. Chern Engng 1997; 21: sI173-s1178.
150 Zhang J, Martin EB, Morris AJ, Kiparissides C. Inferential estimation of polymer quality using stacked neural networks. Comput. Chern. Engng 1997; 21: s I 025-s1030.
151 Wang XZ, Lu ML, McGreavy C. Learning dynamic fault models based on a fuzzy set covering method. Comput. Chern Engng 1997; 21: 621-630.
152 Kramer MA. Malfunction diagnosis using quantitative models with non-Boolean reasoning in expert systems. AIChE J. 1987; 33: 130-140.
153 Venkatasubramanian V, Vaidyanathan R, Yamamoto Y. Process fault-detection and diagnosis using neural networks, 1. steady-state processes. Comput. Chern. Engng 1990,14: 699-712.
154 Zhang J, Morris J. Process modelling and fault diagnosis using fuzzy neural networks. Fuzzy Sets and Systems 1996; 79: 127-140.
155 Wang XZ, Chen BH, Yang SH, McGreavy C. Neural nets, fuzzy sets and digraphs in safety and operability studies of refinery reaction processes. Chern Engng Sci 1996; 51: 2169-2178.
156 Buckley JJ, Hayashi Y. Fuzzy neural networks: a survey. Fuzzy Sets and Systems 1994; 66: 1-13.
157 Reggia JA, Nau DS, Wang PY. Diagnostic expert system based on a set covering
References 243
model. Int J Man-machine Studies 1983; 19: 437-460.
158 Penalva JM, Coudouneau L, Leyval L, Montmain J. A supervision support system for industrial processes. IEEE Expert 1993; 8(5): 57-65.
159 Iri M, Aoki E, O'Shima E, Matsuyama H. An algorithm for diagnosis of system failures in the chemical process. Comput. Chern. Engng 1979; 3: 489-493.
160 Oyeleye 00, Kramer MA. Qualitative simulation of chemical process systems: steady-state analysis. AIChE J. 1988; 34: 1441-1454.
161 Yu CC, Lee C. Fault diagnosis based on qualitative/quantitative process knowledge. AIChE J. 1991; 37: 617-628.
162 Gujima F, Shibata B, Tsuge Y, Shiozaki J, Matsuyama H, O'shima E. Improvements of the accuracy of fault diagnosis systems, using signed directed graphs. Int. Chern. Engng. 1993; 33: 671-679.
163 Mohindra S, Clark P A. A distributed fault diagnosis method based on graph models: steady-state analysis. Comput. Chern. Engng 1993; 17: 193-209.
164 Wilcox NA, Himmelblau DM. The possible cause-effect graph (PCEG) model for fault diagnosis. Comput. Chern. Engng 1994; 18: 103-127.
165 Ouassir M, Melin C. Causal graphs and rule generation: application to fault diagnosis of dynamic processes. Proceedings of the 3rd IF AC symposium on fault detection, supervision and safety for technical processes 1997 (SAFEPROCESS 97), Kingston Hull, England, Aug. 1997,1087-1092.
167 Vedam H, Venkatasubramanian V. Signed digraph based multiple fault diagnosis. Comput. Chern. Engng 1997; 21: s655-s660.
168 Umeda T, Kuriyama T, O'shima E. Matsuyama H. A graphical approach to cause and effect analysis of. chemical processing systems. Chern. Eng. Sci. 1980; 35: 2379-2388.
169 Vaidhyanathan R, Venkatasubramanian V. Digraph-based models for automated HAZOP analysis. Reliability Engineering and System Safety 1995; 50: 33-49.
170 Srinivasan R, Venkatasubramanian V. Petri Net-Digraph models for automating HAZOP analysis of batch process plants. Comput. Chern. Engng 1996; 20: s719-s725.
171 Kuo DH, Hsu DS, Chang CT, Chen DH. Prototype for integrated hazard analysis. AIChE J. 1997; 43: 1494-1510.
172 Han CC, Shih RF, Lee LS. Quantifying signed directed-graphs with the fuzzy set for fault diagnosis resolution improvement. Ind. Eng. Chern. Res. 1994; 33: 1943-1954.
173 Shih RF, Lee LS. Use of fuzzy cause-effect digraph for resolution fault diagnosis for process plants. Ind. Eng. Chern. Res. 1995; 34: 1688-1717.
244 Data Mining and Knowledge Discovery for Process Monitoring and Control
174 Wang XZ, Chen BH, Yang SH, McGreavy C. Fuzzy rule generation from data for process operational decision support. Comput. Chern. Engng 1997; 21: s661-s666.
175 Huang YC, Wang XZ. Application of fuzzy causal networks to wastewater treatment plants. Chern. Eng. Sci. 1999; 54: 2731-2738.
176 Chen CL, Jong MJ. Fuzzy predictive control for the time-delay system. Proc. 2nd IEEE into conf. fuzzy systems 1993; 236-240.
177 Becraft WR, Lee PL. An integrated neural network/expert system approach for fault diagnosis. Comput. Chern. Engng 1993; 17: 1001-1014.
178 Dubois D, Prade H. Fuzzy sets and systems: theory and applications. Academic Press, 1980
179 Rosenfield A. Fuzzy graphs. In: Zadeh LA, Fu KS, Tanaka K, Shimura M (eds.) Fuzzy sets and their applications to cognitive and decision processes. Academic Press, New York, 1975,77-95.
180 Zhang J, Morris AJ, Martin EB, Kiparissides C. Prediction of polymer quality in batch polymerisation reactors using robust neural networks. Chern. Eng. J. 1998; 69: 135-143.
181 Caudil M. Neural network primer, Part VIII, AI Expert 1989.
182 Wasserman PD. Neural computing: theory and practice. Van Nostrand Reinhold, New York, 1989.
183 Whiteley JR, Davis JF. A similarity-based approach to interpretation of sensor data using adaptive resonance theory. Comput. & Chern. Engng 1994; 18: 637-661.
184 Whiteley JR, Davis JF Mehrotra A and Ahalt SC. Observations and problems applying ART2 for dynamic sensor pattern interpretation. IEEE Trans. on Sys. Man Cybernetics Part A: Sys. and Humans 1996; 26: 423-437.
185 Wang XZ, Chen BH, Yang SH, McGreavy C. Application of wavelets and neural networks to diagnostic system development - 2. an integrated framework and its application. Comput. Chern. Engng. 1999; 23: 945-954.
186 Pao YH. Adaptive pattern recognition and neural networks. Addison-Wesley, 1989.
187 Looney CG. Pattern recognition using neural networks: theory and algorithms for engineers and scientists. Oxford University Press, 1997.
188 Everitt BS, Hand DJ. Finite mixture distributions. London Chapman & Hall, 1981.
189 Titterington DM, Smith AFM, Makov UE. Statistical analysis of finite mixture distributions. John Wiley & Sons, New York, 1985.
190 Dempster AP, Laird NM, Rubin DB. Maximum likelihood from incomplete data via the EM algorithm. Journal of the Royal Statistical Society 1977; 39 (series B), No. 1: 1.

References 245
191 Ayoubi M, Leonhardt S. Methods of fault diagnosis. Control Eng. Practice 1977; 5: 683.
192 Wolfe JH. Pattern clustering by multivariate mixture analysis. Multivariate behavioural research 1970; 5: 329-350.
193 Wang XZ, McGreavy C. Automatic classification for mining process operational data. Ind. Eng. Chern. Res. 1998; 37: 2215-2222.
194 Nam DS, Han C, Jeong CW, Yoon ES. Automatic construction of extended symptom-fault associations from the signed digraph. Comput. Chern. Engng. 1996; 20(supp\.): s605-s610.
195 Wang XZ, Chen BH. Clustering of infrared spectra of lubricating base oils using adaptive resonance theory. 1. Chern. Inf. Comput. Sci. 1998; 38: 457-462.
196 Michalski, R.S. and Larson, J.B. Selection of most representative training examples and incremental generation of VLI hypotheses: the underlying method and desc. of prog. ESEL and AQll, 867, Computer Science Department, University of Illinois, 1978.
197 Mitchell, T.M. Version Spaces: a candidate elimination approach to rule learning, in Proc. ofIJCAI-87, Cambridge, Mass., 1977
198 Quinlan JR. Improved use of continuous attributes in C4.5. J. Artif. Intel\. Res. 1996; 4: 77-90.
199 Wu, X. A Bayesian discretiser for real-valued attributes. The Comput 1., 1996; 39: 688-69l.
200 Daniel C, Wood FS. Fitting equations to data, 2nd Edition. John Wiley & Sons, Inc., 1980.
201 Raich A, Cinar A. Statistical process monitoring and disturbance diagnosis in muItivariable continuous processes. AIChE J. 1996; 42: 995-1009.
202 Shi ZZ. Principles of machine learning. International Academic Publishers, Beijing, 1992.
203 Dutton DM, Conroy GV. A review of machine learning. The Know\. Engng Review 1996; 12: 341-367.
204 Kocabas S. A review oflearning. The Know\. Engng Review 1991; 6: 195-222.
205 Wang LX, Mendel JM. Generating fuzzy rules by learning from examples. IEEE Trans. on Systems, Man, and Cybernetics 1992; 22: 1414-1427.
206 Wang LX, Mendel 1M. Fuzzy basis functions, universal approximation, and orthogonal least-squares learning. IEEE Trans. on Neural Networks 1992; 3: 807-814.
207 Wang LX. Adaptive fuzzy systems and control: design and stability analysis.
246 Data Mining and Knowledge Discovery for Process Monitoring and Control
Prentice-Hall, Inc., 1994.
208 Wang LX. Fuzzy systems are universal approximators. Proc. IEEE Int. Conf. on Fuzzy Systems, San Diego, 1992, 1163-1170.
209 Quafafou M. and Chan CC. An incremental approach for learning fuzzy rules from examples. EUFIT' 95, Aachen, Germany, 1995,520-523.
210 Srinivasan ACB, Chan CC. Using inductive learning to determine fuzzy rules for dynamic system. Engng Applic. of Artif. Intell. 1993; 6: 257-264.
211 Abe S, Lan MS. A method for fuzzy rules extraction directly from numerical data and its application to pattern classification. IEEE Trans. on Fuzzy Systems 1995; 3: 18-28.
212 Foulloy L, Galichet S, Nakoula Y. Learning a fuzzy symbolic rulebase. EUFIT'95, Aachen, Germany, 1995,594-598.
213 Schretter N, Hollatz J. Consistency and completeness in fuzzy rulebases generated from numerical data. EUFIT '95, Aachen, Germany, 1995,599-604.
214 Levrat E, Rondeau L, Ruelas R, Lamotte M. Fuzzy rules learning method. EUFIT '95, Aachen, Germany, 1995,515-519.
215 Sudkamp T, Hammell RJ. Interpolation, completion, and learning fuzzy rules. IEEE Trans. on Systems, Man, and Cybernetics 1994; 24: 332-342.
216 Kosko, B. Neural networks and fuzzy systems: a dynamic systems approach to machine intelligence. Prentice Hall, Englewood Cliffts, NJ, 1992.
217 Fu LM. Rule generation from neural networks. IEEE Trans. on Systems, Man, and Cybernetics 1994; 24: 1114-1124.
218 Gallant SI. Connectionist expert systems. Comm. of The ACM 1988; 31(2): 152-169.
219 Chan CC. Incremental learning of production rules from examples under uncertainty: a rough set approach. Int. J. of Software Engng and Know!. Engng 1991; I: 439-461.
220 Chmielewski MR, Grzymala-Busse JW, Peterson NW, Than S. The rule induction system LERS - a version for personal computers. Foundations of Computing and Decision Sciences 1993; 18: 181-212.
221 Pawlak Z. Rough sets. Int. J. Computer and Information Sci. 1982; 11: 341-356.
222 Pawlak Z. Rough classification. Int. 1. man-machine Studies 1984; 20: 469-483.
223 Pawlak Z. Rough sets and fuzzy sets. Fuzzy Sets and Systems 1985; 17: 99-102.
224 Fusillo RH, Powers GJ. Operating procedure synthesis using local models and distributed goals. Comput. Chern Engng 1988; 12: 1023-1034.
225 Frayman Y, Wang L. Data mining using dynamically constructed recurrent fuzzy neural networks. In: Wu X, Kotagiri R, Korb KB (eds.) Research and development in
References 247
knowledge discovery and data mining, Springer, 1998, 122-13\.
226 Ziarko WP (ed.) Rough sets, fuzzy sets and knowledge discovery. Springer-Verlag, 1994.
227 Chen FZ, Wang XZ. Software sensor design using Bayesian automatic classification and backpropagation neural networks. Ind. Eng. Chern. Res. 1998; 37: 3985-399\.
228 McAvoy TJ, Su HT, Wang NS, He M, Horvath J, Semerjian H. A comparison of neural networks and partial least squares for deconvoluting fluorescence spectra. Biotech. and Bioeng 1992; 40: 53-62.
229 Baughman DR, Liu Y A. Neural networks in bioprocessing and chemical engineering. Academic Press, 1995.
230 Miller RM, Itoyama K, Uda A, Takada H, Bhat N. Modeling and control of a chemical waste water treatment plant. Comput. Chern. Engng 1997; 21(suppl.): s947-s952.
231 Gillespie ES, Wilson RN. Application of sensitivity analysis to neural network determination of financial variable relationships. Applied Stochastic Models and Data Analysis 1998; 13: 409-414.
232 Garson GD. Interpreting neural-network connection weights. AI Expert 1991; April: 47-5\.
233 Milne LK, Gedeon TD, Skidmore AK. Classifying dry sclerophyll forest from augmented satellite data: comparing neural networks, decision tree & maximum likelihood. Proc. Australian Conf. Neural Networks, Sydney, 1995, 160-163.
234 Wong PM, Gedeon TD, Taggart 11. An improved technique in porosity prediction: a neural network approach. IEEE Trans. Geoscience and Remote Sensing 1995; 33: 971-980.
235 Gedeon TD. Data mining of inputs: analysing magnitude and functional measures. Int. J. Neural Systems 1997; 8: 209-218.
236 Ayoubi M. Comparison between the dynamic multi-layered percetron and the generalised Hammerstein model for experimental identification of the loading process in diesel engines. Control Engng Practice 1998,6: 271-279.
237 Bhat N, McAvoy TJ. Use of neural nets for dynamic modelling and control of chemical process systems. Comput. Chern. Engng 1990; 14: 573-583.
238 Shaw AM, Doyle FJ, Schwaber JS. A dynamic neural network approach to nonlinear process modelling. Comput. Chern. Engng 1997; 21: 371-385.
239 Morris AJ, Montague GA, Willis MJ. Artificial neural networks: studies in process modelling and control. Trans. IChemE. 1994; 72A: 3-19.
240 Kim SJ, Lee MH, Park SW, Lee SY, Park CH. A neural linearizing control scheme for nonlinear chemical processes. Comput. Chern. Engng 1997; 21: 187-200

248 Data Mining and Knowledge Discovery for Process Monitoring and Control
241 Martinez EC, Pulley RA, Wilson JA. Learning to control the performance of batch processes. Trans IChemE 1998; 76A: 711-722.
INDEX
Adaptive resonance theory (ART2) 11,
18-19,34,120-125 ARTnet 11,120,126-135
comparison with ART2 134-136 Association rules 22-23 Autoassociative neural networks 74-75 Automatic classification system
(AutoClass) 11,18,136-147,195,
197,200,202 Backpropagation neural networks see
Feedforward neural networks Batch process 72-73, 216 Bayesian graphs 20, Case-based learning 23 Causal explanation see explanation and
Cause-effect links Cause-effect links 1,4, II, 12, 15,25,
112, 183, 185, 190 Classification 11,16-19,33,34,82,91,
120,136-150,165,168,173,179, 196,198-201,212
Clustering 11, 12, 16-19, 78, 92, 120, 124, 129, 130, 134, 136, 144, 149-172, 195, 200
Concept formation 29-37, 153 Conceptual clustering 11, 19,37, 149-
172 Continuous stirred tank reactor (CSTR)
7,14,37-38,96-98,156-164,168, 210-212,217-220
Data dynamic trends 24, 11,29, 153-172 multivariate 25 pre-processing 24, 8-11, univariate 25 categorical 25 characteristics 8
Data mining 1, 10, 13-28 definition 13 development 13-14 preprocessing 15-17, techniques 13-28 dimension reduction 29 noise removal 29
Decision trees 19,149-172 Dependency modelling see graphical
models Diagnosis 2,13,33,35,61,85,94-117,
123,153,177-179 Display hierarchy 2,3 Distance measure II, 18 Distillation 76, 196-197 Distributed control systems (DCS) 2,4,
14,33,38 Dynamic multilayer percetron 210 Dynamic simulation see Simulator Dynamic trend signals 2,8-12,24,29-
60,124-135 qualitative representation 57-59 episode 49,57-59
250 Data Mining and Knowledge Discovery for Process Monitoring and Control
dimension reduction 29-60,126-135
feature extraction 29-60,126-135
concept formation 30-38, 157-172
Error distribution 93 Essential faults 117
Expert systems 29, 173, 190
Explanation 9, II. 23, 25, 112, 117,
173,189,190
Exponentially weighted moving average
(EWMA) 4
FCC main fractionator see distillation
Feature selection 25-26, 206-208
Feedforward neural networks II, 23, 92,
204-209
algorithm 87-89
architecture 85-86
as software sensors 193-203
confidence bounds 92, 94
dynamic neural networks 210-213
extrapolation 91,117,194
for fault diagnosis 94-117 for sensitivity studies 206-208
fuzzy neural networks 99-100, 180-191
Fluid catalytic cracking (FCC) II 14,
76,108,142-147,195-196,221-
226 Fourier Transform 39-41
short-time Fourier transform 39-41 windowed Fourier transform 39-41 comparison with wavelets 40-42
Fuzzy digraphs 20, 105-116 Fuzzy neural networks 99-100, 180-191
Fuzzy set covering model 10 I-I 02 Fuzzy sets 11,99-116,180-190 Fuzzy signed digraph 102-108, 114-116 Graphical models 20, also see fuzzy
digraphs and Bayesian graphs Heat exchanger 112, 114, 183, 185 Hotling's T2 chart 65-72
Incremental learning 191 Inductive learning 12,19,149-172,190
algorithm 150-152
C4.5, C5.0, 103 150-152
conceptual clustering 156-172 continuous valued attributes 152
decision tree development 149-172 identification of states 156-172
using averaged data 153-156
process monitoring 156-172 rules generation 149-152, 190
Inferential models see software sensors Inflection points 48-49
Interface 1-2
Knowledge acquisition 173
Knowledge discovery I, 10, 13-28
definition 13
development 13-14
process 15-17
techniques 13-28 Latent variables 67,68,71,72,79 see
also Principal component analysis
Link and dependency analysis 9, also see Graphical models, Fuzzy
digraph and Bayesian graphs Methyl tertiary butyl ether (MTBE) 149,
157,164,167,169-171,177,227-
232 Microtox 93 Mixture model 139-140 Monitoring charts 2, 4, 6, also see
Statistical process control Multiple steady states 7,14,15 Multivariate statistical analysis 11, also
see Statistical process control
Noise to signal ratio 98 Operating window 2, 5, 6 Operational plane 7,9,82 Operational state identification 11 Partial least squares (PLS) 68, 82-83 Principal component analysis (PCA)
11,30-38,61-83,156-172,204-206,
208 multiblock II nonlinear 74-75 for product design II
algorithm 30-38
processing trends 33-38, 156-172 operational data analysis 61-83 dimension reduction 204-208 concept formation 30-38, 157-172 variable contribution plots 68
Probabilistic graphs see Bayesian graphs Process data, characteristics 8 Product quality 62, 64, 66-69, 153, 156,
196-204 Product recovery 62-63 Production rules 19,160,169,173-191 Reactor 63,68-70, 77, 83 also see
Continuous stirred tank reactor, fluid catalytic cracking, methyl tertiary butyl ether
Recurrent neural networks 2 \0 Recursive learning 117,191 Refinery 7, II, 14,76, \08, 164, 149,
154, 157, 195-198, 202, 221-223,
227 Regression 10, 23 Root faults 117 Rough sets 11, 178-180 Rulesgeneration 15,173-191
fuzzy set method 173-176 rough set method 178-180 neural network approach 176-177 fuzzy neural network 180-190 inductive learning 149,157-172,
191 Self organising Kohonen 18-19 Sensitivity analysis 206-209 Sequence analysis \0 Set covering model \01 Signed directed graph 102 Similarity measure II Simulator 99, 165, 219, 222, 223, 228,
229 Software analyser 93 Software sensor II, 193-203 Squared prediction error SPEy 67, 70
Index 251
State space, monitoring, control,
diagnosis 1-2, 6-9 Statistical process control (SPC) 4, II
Shewhart charts 4 Cumulative sum charts 4 Exponentially weighted moving
average (EWMA) 4 Statistical quality control 2, 4 Summarising 10 Supervised machine learning II, 85-
II 7, 119, see also feedforward neural networks
System architecture 10 Time series data 24, also see Data Toxicity 93 Training simulator see Simulator Trend, analysis 9 Unsupervised machine learning II, 18,
II 9-147 see also Adaptive resonance theory, Self organising Kohonen neural networks, Automatic classification system (AutoClass), Conceptual clustering
Unsupervised neural networks see unsupervised machine learning
Waste water treatment plant 114-116, 206-207
Wavelets 29, 38-56, 124-136 feature extraction 38-56, 124-136 comparison with Fourier transform
40-44 Mexican hat 43 continuous 44-47 discrete 47-48 for singularity detection 48 extrema 38-56, 124, 127-131 Daubechies 48, 51-52 for data compression 53 noise removal 53-55 piece-wise processing 56 multi-scale analysis 47-55, 126-130 multiresolution 47-55, 126-130