steady state simulation of continuous stirred tank reactor...
TRANSCRIPT

A
Project Report
On
Steady state simulation of continuous stirred tank
reactor (CSTR) system using Aspen Plus
Submitted by
Telagam Setty Maayedukondalu
(Roll No: 111CH0504)
In partial fulfillment of the requirements for the degree in
Bachelor of Technology in Chemical Engineering
Under the guidance of
Dr. Pradip Chowdhury
Department of Chemical Engineering
National Institute of Technology Rourkela
May 2015
CERTIFICATE
This is certified that the work contained in the thesis entitled “Steady state simulation of
continuous stirred tank reactor (CSTR) system using Aspen Plus” submitted by Telagam
Setty Maayedukondalu(111CH0504), has been carried out under my supervision and this work
has not been submitted elsewhere for a degree.
__________________
Date:
Place: (Thesis Supervisor)
Dr. Pradip Chowdhury
Assistant Professor,
Department of Chemical Engineering
NIT Rourkela 769008

Acknowledgements
First and the foremost, I would like to offer my sincere gratitude to my thesis supervisor, Dr.
Pradip Chowdhury for his immense interest and enthusiasm on the project. His technical
prowess and vast knowledge on diverse fields left quite an impression on me. He was always
accessible and worked for hours with me. Although the journey was beset with complexities but
I always found his helping hand. He has been a constant source of inspiration for me.
I am also thankful to all faculties and support staff of Department of Chemical
Engineering, National Institute of Technology Rourkela, for their constant help and extending
the departmental facilities for carrying out my project work.
I would like to extend my sincere thanks to my friends and colleagues. Last but not the least, I
wish to profoundly acknowledge my parents for their constant support.
____________________
(Telagam Setty Maayedukondalu)
111CH0504

ABSTRACT
This project work reports steady state simulation results of a continuous stirred tank reactor
(CSTR) system using Aspen-plus simulation. The reaction, investigated in this work was
production of ethyl benzene using ethylene and benzene as the reactants. Ethyl benzene, being
one of the important raw materials in production of several industrially important chemicals, is
often produced alongside with diethyl benzene as an undesired side product. In our simulation,
this particular aspect has been examined to maximize the conversion of ethyl benzene from its
reactants. Here, we have studied the effect of feed flow rate on steady state behaviour of CSTR
and also obtained the optimum feed flow rate in order to maximize the conversion and yield with
special consideration of consecutive reactions where one product was desired and another one
was undesired. Since the effect of reactor temperature was always going to be crucial in this
exothermic reaction mechanism, optimum values were evaluated. The optimum reactor volume
was also found out from the simulation results. The optimum temperature was predicted to be
430 K and the optimum reactor volume was found to be 100 m3. The optimum feed flow rates
were 0.4 kmol/sec w.r.t benzene and 0.2 kmol/sec w.r.t ethylene. The maximum yield of ethyl
benzene was predicted to be 49.75% w.r.t benzene and 99.9% w.r.t ethylene.

CONTENTS
PAGE NO.
Abstract III
List of Tables VI
List of Graphs VII
Notations and Abbreviations VIII
CHAPTER 1: Introduction 1
1.1 Prelude 1
1.2 Chemical Reactors 1
1.3 Aspen plus 2
1.4 Ethyl benzene 3
1.5 Background of present research work 3
1.6 Research Objectives 4
CHAPTER 2: Literature Review 5
2.1 Introduction 5
2.2 Classification of Chemical Reactions 5
2.3 General Description and Reaction types 6
2.4 Different types of Chemical Reactors 7

CHAPTER 3: Simulation Work 13
3.1 Aspen plus Software 13
3.2 Aspen plus Reactor Model 13
3.3 Property Method 13
3.4 Steady State Simulation 13
3.5 Simulation Setup 14
CHAPTER 4: Results and Discussion 16
4.1 Optimization of feed flow rate 19
4.2 Optimization of reactor temperature 19
4.3 Optimization of reactor volume 22
4.4 Steady state simulation for CSTRs in series 26
4.5 Simulation for optimum size ratio 26
CHAPTER 5: Conclusion and Future Work 37
References 44

List of Tables
Table 4.1: Comparison between the feed flow rate and product flow rate 16
Table 4.2: Comparison between the feed flow rate and product mole fraction 16
Table 4.3: Comparison between benzene flow rate and concentration of di-ethyl benzene (ppm)
18
Table 4.4: Comparison between reactor temperature and product flow rate 19
Table 4.5: Comparison between reactor temperature and product mole fraction 20
Table 4.6: Comparison between reactor temperature and concentration of di-ethyl benzene (ppm)
21
Table 4.7: Comparison between reactor volume and product flow rate 22
Table 4.8: Comparison between reactor volume and product mole fraction 22
Table 4.9: Comparison of reactor volume with di-ethyl benzene flow rate 23
Table 4.10: Stream results for steady state simulation 25
Table 4.11: Comparison between reactor volumes and product flow rate 27
Table 4.12: Comparison between reactor volumes and product mole from R1 &R2 27
Table 4.13: Comparison between R1 vol (cum) & formation of DEB (ppm) in R1 & R2 29
Table 4.14: Comparison between R2 vol (cum) & formation of DEB (ppm) in R1 & R2 30
Table 4.15: Stream results for CSTRs in series 31
Table 4.16: Comparison between reactor temperature vs conversion & yield 32
Table 4.17: Comparison between reactor volume and conversion & yield 32
Table 4.18: Comparison between feed flow rate vs conversion & yield 33

List of Figures
Figure 3.1: Schematic representation of the continuous stirred tank reactor (CSTR) 14
Figure 4.1: Feed flow rate vs product flow rate 17
Figure 4.2: Flow rate vs product mole fraction 17
Figure 4.3: Benzene flow rate (kmol/s) vs concentration of DEB (ppm) 18
Figure 4.4: Reactor temperature vs product flow rate 20
Figure 4.5: Reactor temperature vs product mole fraction (DEB) 21
Figure 4.6: Reactor volume vs product flow rate 23
Figure 4.7: Reactor volume vs DEB (ppm) 24
Figure 4.8: schematic flow sheet for series CSTR 26
Figure 4.9: R1 and product flow rate curves 28
Figure 4.10: R2 and product flow rate curves 28
Figure 4.11: Plot between reactor volume R1 vs DEB (ppm) 29
Figure 4.12: Plot between reactor volumes R2 vs DEB (ppm) 30
Figure 4.13: Plot between reactor temperature vs conversion of B & E 32
Figure 4.14: Plot between reactor volume vs Yield of B & E 33
Figure 4.15: Plot between feed flow rate vs conversion & yield 34

NOTATIONS AND ABBREVIATIONS
B Benzene
CA Concentration of component A (kmol/m3)
CB Concentration of component B (kmol/m3)
CC Concentration of component C (kmol/m3)
CD Concentration of component D (kmol/m3)
CSTR Continuous stirred tank reactor
CUM Cubic meter
DEB Di-ethyl benzene
E Ethylene
EB Ethyl benzene
E1 & E2 Activation energy of reaction 1& 2, J/Kmol
F Feed flow rate (kmol/s)
K1 & K2 Reaction rate constants, Kmol/s.m3
P Product flow rate (kmole/s)
PPM Parts for million
TR Reactor temperature, K
X (B) Conversion of benzene
X (E) Conversion of ethylene
Y (EB/B) Yield of ethyl benzene with respected to benzene
Y (EB/E) Yield of ethyl benzene with respected to ethylene

1 | P a g e
CHAPTER 1
INTRODUCTION
This chapter highlights the importance of chemical reactors and also application of aspen plus in
reactor design. It focuses on the uses of ethyl benzene which plays main role in
the petrochemical industry as halfway in the production of styrene, the raw material for the production of
polystyrene, a common plastic material. The background of the present thesis work is summarized
along with the objectives.
1.1 PRELUDE
Reactions are usually the core of chemical processes in which comparatively low-cost raw
materials are transformed into important products, useful to mankind in various forms [1-3].
Understanding the basics of chemical kinetics and thermodynamics are key before designing
chemical reactors. Basically, kinetics and thermodynamics help in understanding how fast or
slow the reaction is progressing and to what extent the reaction will progress. Designing
chemical reactors is a tedious process and it requires plenty of expertise, starting from
conceptualization to validation of data. Aspen-plus provides a platform in executing methods and
predicts the effect of various parameters and variables reminiscent of a real-time system.
1.2 CHEMICAL REACTORS
The application of chemical reactors is very large and it is not only confined within the ambit of
chemical industries but also petrochemical industries and any other process plants. Chemical
kinetics and reactor design is the core to the understanding of the production of almost all
chemicals. As mentioned in the aforesaid paragraph that designing chemical reactors is a tedious
process and it requires plenty of expertise, starting from conceptualization to validation of data.
Optimization of the best possible combination is in designing is the key. One particular route
may yield a low reactor price but the handling of the chemicals; post production might be very
expensive. The economics of the whole plant must be studied in great detail.

2 | P a g e
1.3 ASPEN PLUS
It is a process demonstrating instrument for steady-state simulation, design, performance,
optimization and planning for chemicals, specialty chemicals, petrochemicals and metallurgy
industries.
1.3.1 The Challenges
Understanding and Predicting Process Behavior [2]
The chemical process industries are beset with cases over fluctuating market conditions,
government guidelines w.r.t environmental issues etc. However, there is no scope for any
sluggishness and there has always been an effort to increase productivity with efficient
mechanisms in place with improved economics of the plant and the country. When confronted
with complicated situations like this, process engineers have little choice but to resort to strong
and powerful software tools to answer them.
1.3.2 The Opportunity:
Maximizing Plant Performance and Enhancing Profitability [2]
Steady-state simulation is a prevailing process engineering tool that empowers engineers to
simulate plant performance and examine their results quickly – exploiting the modern software
and engineering technology to optimize plant performance and effectiveness.
1.3.3 The Solution:
Modeling and simulation involves deep understanding of the process starting from
conceptualization to model development to its solution. It basically gives an idea to figure out
what actually makes the process tick. Understanding the process and troubleshooting it as and
when required makes process simulation such an attractive area to venture into. Aspen Plus is
strong software, paving the way for giving ready-made solution to many challenging issues
related to any process industry in a quick and legible way.

3 | P a g e
1.3.4 Benefits Offered by Aspen Plus [2]
Aspen Plus provides chemical process industries with considerable assistance throughout the
manufacturing of a process starting from R&D through to engineering and into production.
Using Aspen Plus, engineers can design, simulate and troubleshoot the process as and when the
need arises.
1.4 ETHYL BENZENE
Ethylbenzene is a colorless liquid with a syrupy, gasoline odor. It is a small aromatic
hydrocarbon. Ethylbenzene is manufactured through an alkylation of benzene. The alkylation
can happen in vapor or in liquid phase and both alkylations use a zeolite or an aluminium
chloride catalyst.
Uses of ethyl benzene:
As dissolvable: in inks, elastic cements, varnishes, and paints.
As an anti-knock agent: Ethylbenzene is supplementary to gas as an against thump specialists,
significance it reduces motor thumping and acceleration the octane rating.
As recuperation of regular gas: Ethylbenzene may be infused into the ground.
Ethylbenzene: assumes critical part in the petrochemical business as a most of the way in the
creation of styrene, the precursor to polystyrene, a typical plastic material. In 2012, more than
99% of ethylbenzene created was devoured in the generation of styrene.
Ethylbenzene is much of the time found in other made items, including pesticides, cellulose
acetic acid derivation, and manufactured elastic.
.
1.5 BACKGROUND OF PRESENT RESEARCH WORK
Ethylbenzene is an important raw material for the production of various other industrially
important chemicals. Its industrial importance has attracted various researchers across the globe

4 | P a g e
to study their chemical synthesis using CSTR configuration. During synthesis it is almost
imperative that some by-products will get produced from the stoichiometry. In production of
ethylbenzene, di-ethylbenzene is produced as a by-product which is undesirable. The reactions
involved are basically consecutive reactions. Presence of small amount of di-ethyl benzene
generally leads to cross polymerization and requires to be avoided. In cases like this, reactor
design becomes challenging simply because both yield and conversions need to be considered.
These are the facts which prompted us to venture into studying ethylbenzene production in a
continuous stirred tank reactor (CSTR) ensemble.
1.6 RESEARCH OBJECTIVES
To study the effect of feed flow rate on steady state behavior of CSTR and also obtain
optimum feed flow rate in order to maximize the conversion and yield (with special
consideration of consecutive reactions) where one product is desired and another one is
undesired.
To study the effect of temperature on steady state behavior of CSTR and also obtain the
optimum reactor temperature in order to maximize the conversion and yield with special
consideration of exothermic reactions like preparation of ethyl benzene.
To study effect of volume on steady state behavior of CSTR and also to obtain the
optimum reactor volume in order to maximize the conversion and yield.
To study steady state behavior of CSTRs especially when they are connected in series for
the same reaction.

5 | P a g e
CHAPTER 2
LITERATURE REVIEW
2.1 INTRODUCTION
A synthetic reactor is a device utilized as a part of a substance procedure (plant) where
concoction changes (responses) happen to deliver a particular item at an unequivocal generation
rate, utilizing certain science. The reactor arrangement and its working conditions are chosen to
accomplish certain destinations, for example, expanding the income of the methodology, and
decreasing the era of contaminations, while fulfilling a few outlines and working constraints
(security, controllability, accessibility of crude materials, and so forth.). For the most part, the
execution of the compound reactor demonstrates a critical part in the operation and financial
matters of the complete methodology since its operation bothers most different units all the while
(partition units, utilities, and so on.) [1, 3].
2.2 ORGANIZATION OF CHEMICAL REACTIONS
Mainly chemical reactions are classified into two types; they are homogeneous reaction and
heterogeneous reaction. Heterogeneous reactions further classified into four different types; they
are fluid- fluid reactions, Non-catalytic gas-solid reactions, catalytic gas-solid reactions and
catalytic gas-liquid-solid reactions.
The reactions occur between two immiscible phases i.e. Gas-liquid or liquid-liquid is called as
fluid –fluid reactions. These types of reactions generally take place at the interface. The overall
reaction rate depends on the miscibility of the reactant, available interface area and mass transfer
rates.
The reactions like combustion, gasification of coal, and roasting of pyrites; which generally take
place on the solid surface are called non-catalytic gas solid reactions. The reaction occurs when
the gaseous reactants are transported to the interface, where it reacts with the solid reactant. The
reaction rate depends on surface area and the mass transfer rate of the gaseous reactants.
The reactions in which both reactant and products are gaseous are called catalytic gas-solid
reactions. Reactions occur at special catalytic sites present on the solid surface. Porous particles
are generally used to provide large surface area to facilitate the reaction. The reaction rate
depends on diffusion rate of reactant into the interior of the catalyst pore and diffusion of product
out of the catalyst pore.

6 | P a g e
The reactions in which three states are involved i.e (solid, liquid and gases) are called catalytic
gas –liquid-solid reaction. Here solid surface act as catalyst has a special reacting sites. Solid
surface normally covered with liquid reactants and gaseous reactants are diffusion onto the
catalytic site.
2.3 GENERAL DESCRIPTION AND REACTION TYPES
Chemical reactions relating to the chemical, petrochemical and oil industries are executed in
distinct apparatus so-called reactors. There are distinct types of reactors projected to face
exceptionally diverse operating circumstances, both in relationships of the nature of the chemical
species involved(reactants and products of the reaction) and of the physical circumstances under
which they operate.
In general, a chemical reactor needs to be able to carry out at least three functions:
Offer the essential residence time for the reactants to complete the chemical reaction;
Permit the needed heat exchange;
To enable the chemical reaction, it brings all the phases into near contact.
Consequently, reactor categories range from huge measurement ceaseless reactors, similar to
those embraced for synergist breaking responses, particularly for oil refineries, to gadgets of
unobtrusive measurements, as spasmodic mixed reactors in which fine and optional science
responses are performed. Additionally, there are reactors for advanced microelectronic
applications and reactors of minuscule measurements (small scale reactors), intended for
biomedical establishments or for in situ generation of greatly dangerous or perilous mixes.
Converters and burners, reactant or generally, embraced for vitality generation can likewise be
recorded among the reactors [3].
To classify a reactor, the quantity of stages in the reactor itself, whether there are unsettling
frameworks and the method of operation (constant reactor, semi-nonstop or intermittent) crucial
to be contemplated. It ought to additionally be noticed that most synthetic reactors are furnished
with warmth trade mechanical assembly as outer coats or inward curls with a liquid coursing
through them to go about as a warm vector to permit both warmth supply and evacuation [3-4].

7 | P a g e
2.4 DIFFERENT TYPE OF CHEMICAL REACTORS
2.4.1 BATCH REACTOR
The established bunch reactor is a splendidly blended vessel in which reactants are changed over
to items throughout a clump cycle. All variables change rapidly with time. The reactants are
charged into the vessel. Heat and/or impetus is added to launch response. Reactant fixations
lessening and item focuses increment with time. Temperature or weight is controlled by coveted
time direction. Bunch time is likewise an outline and working variable, which has a solid effect
on profitability [1].
Temperature profiles are made so that change and yield targets are accomplished while not
surpassing warmth exchange limit impediments. These ideal temperature profiles rely on upon
the science. For instance, if the response is reversible and exothermic, the temperature profile
may increase to a high temperature to get the responses going and afterward drop off with time
to keep away from the decline in the compound balance consistent at high temperature. On the
off chance that the response is reversible and endothermic, the temperature profile would ascend
to the most elevated conceivable temperature as fast as could be allowed on the grounds that the
synthetic harmony steady increments with temperature [1].
On the off chance that all the reactants are charged to the reactor, the reactant focuses are at first
expansive, which implies that the response rate is high and the warmth exchange burden is high
toward the start of the bunch cycle unless the temperature is kept low. The beginning high
reactant fixation issue can be evaded by utilizing a "bolstered bunch reactor." Some material is at
first charged to the reactor, yet the majority of the reactant is sustained over the span of the
cluster cycle. This causes the volume of the fluid in the reactor to increment with time, so
volume and in addition arrangements and temperatures are untouched fluctuating [1].
2.4.2 TUBULAR PLUG FLOW REACTOR
The real recognizing normal for tubular reactors is their conveyed parameter nature, that is,
variables change with physical measurements and in addition with time. The traditional
attachment stream reactor expect that the reactor vessel is tube shaped, that liquid streams down

8 | P a g e
the length of the reactor with a level speed profile, that no pivotal blending happens, and that no
spiral angles exist in temperature or syntheses [1, 3].
The tubular reactor can be an unfilled vessel if no impetus is utilized. On the off chance that a
strong impetus is needed, the vessel is pressed with impetus, either in a bed or inside tubes. The
dynamic conduct of the reactor is fundamentally influenced by the vicinity of impetus in the
reactor in light of the fact that the warm capacitance of the impetus is generally more prominent
than that of the methodology liquid, especially if the framework is gas-stage. The temperatures
of both the procedure liquid and the impetus change with time. Obviously, under unfaltering
state conditions, the two temperatures are approach at any pivotal position [1, 4].
2.4.3 CONTINUOUS STIRRED-TANK REACTOR
The fluid in the reactor is thought to be flawlessly blended, that is, with no spiral, hub, or precise
slopes in properties (temperature and arrangement). The item stream has a piece and a
temperature that are precisely the same as the substance of the fluid all through the vessel. This is
constantly genuine, both under consistent state conditions and progressively anytime [1].
This normal for a CSTR instantly creates a characteristic shortcoming of the CSTR kind of
reactor, that is, the convergence of reactant in the vessel is the same as the amassing of reactant
in the item. The amassing of reactant is contrarily identified with transformation [1].
2.4.3.1 There are several features of a CSTR that impact controllability:
1. A mixture of strategies and designs can be utilized for warmth exchange. Since warmth
exchange is one of the important matters in reactor regulator, the CSTR is generally additional
effortlessly organized than a tubular reactor. It is substantially hard to change the warmth
evacuation down the length of a tubular reactor [1].
2. The temperature of the food has some impact on controllability; however it is a great deal less
imperative in a CSTR than in a tubular reactor. In the event that warmth is being expelled from

9 | P a g e
the reactor, a bolster that is at a lower temperature than the temperature in the reactor will lessen
the warmth exchange necessities [1, 3].
3. Change is the part of a reactant that is nourished to the reactor that responds in the reactor. The
level of transformation in a CSTR has an exceptionally critical effect on its solidness and
controllability. A high transformation implies a little reactant fixation in the reactor vessel, so
there is little "fuel" accessible to allow a reactor runaway [1].
Then again, a low transformation implies that there is a lot of reactant accessible to respond. In
the event that the response is exothermic and irreversible, a reactor temperature runaway can all
the more effortlessly happen in a CSTR working with low reactant change than in one working
with high reactant transformation. Notwithstanding influencing reactant focus, the outline change
influences reactor size. Low transformation implies a littler reactor. This little reactor has less
warmth exchange zone if an outer coat or an inside curl is utilized, which has a negative effect
on controllability [1, 4].
2.4.3.2 Characteristics of Continuous stirred tank
Run at unfaltering express, the stream rate in must equivalent the mass stream rates out,
generally the tank will flood or go unfilled (transient state).
The feed accept a uniform organization all through the reactor; way out stream has the same
concentration as in the tank.
The reaction rate associated with the final (yield) concentration.
Reactor outfitted with an impeller to guarantee fitting blending.
Dividing the volume of the tank by the normal volumetric stream rate through the tank gives the
living arrangement time, or the normal measure of time a discrete amount of reagent spends
inside

10 | P a g e
2.4.4 DESIGN EQUATION FOR CONTINUOUS STIRRED TANK REACTOR (CSTR)
CONSECUTIVE REACTIONS
Reactor configuration gets to be all the more fortifying when yield and in addition change must
be considered. One normal circumstance in which this emerges is when there are successive
irreversible responses, for example, the accompanying:
A + B → C → (2.1)
C + B → D → (2.2)
The wanted item is C. The undesired item is D. There are numerous critical mechanical
illustrations of this sort: chlorination, oxidation, and nitration of an assortment of hydrocarbons.
The particular response rates for the first and second responses are K1 and K2, separately [1, 3].
The “conversion” of reactant A is defined as
Conversion of A
= (moles A fed - moles A leaving reactor)/ (moles A fed) → (2.3)
There are several ways to define “yield” (or “selectivity”) of the desired product C. One is on the
basis of the amount of A fed. The other is on the basis of the amount of A that has reacted.
Yield 1 = (moles C produced) / (moles A fed) → (2.4)
Yield 2 = (moles C produced) / (moles A reacted) → (2.5)
The desirable product C is produced by the first reaction whose rate depends on the
concentrations of A and B in the reactor. But C is consumed by the second reaction whose rate
depends on the concentrations of C and B in the reactor [1][8].
RC = -K1CACB+K2CCCB
= -CACBK01e-(E
1/RTR) +CCCBK02e-(E
2/RTR) → (2.6)

11 | P a g e
RD = -K2CCCB
= -CCCBK02e-(E
2/RT
R) → (2.7)
Where the reaction rates RC and RD are rates of consumption.
It is evident that the best approach to outline this reactor is to keep the concentration of C and B
little to keep the second response rate little. This infers that a vast abundance of reactant A ought
to be utilized as a part of the reactor, which will weaken the C and B concentration. It will
likewise help to drive the first response in view of the huge estimation of CA regardless of the
little estimation of CB. With this plan, the every pass transformation of A will be little, however
the yield of C every mole of A responded will be huge.
The drawback of this configuration is that the overabundance A absolute necessity be
recuperated and reused, which implies high capital and vitality costs. Be that as it may, the
subsequent change in the yield of C is regularly definitely justified even despite the included
expense. This is especially genuine when the undesirable item D is lethal, destructive, and
unstable or an ecological toxin that is hard to discard. Natural and wellbeing concerns have
pushed the outlines of numerous compound courses of action to incorporate a few expansive
reuse streams so that the yields of alluring items are expanded and the yields of undesirable items
are diminished. These reuse streams build the trouble of the plant wide control issue [1].
There are four components, so four component balances can be written.
Component A balance (kmol A/s):
FA0CA0 = FCA+VRK1CACB → (2.8)
Components B balance (kmol B/s):
FB0CB0 = FCB+VR (K1CACB+K2CCCB) → (2.9)
Components C balance (kmol C/s):
0 = FCC +VR (-K1CACB+K2CCCB) → (2.10)
Component D balance (kmol D/s):
0 = FCD -VRK2CCCB → (2.11)

12 | P a g e
The assumption of constant liquid densities means the volumetric flowrate of the reactor effluent
F is the sum of the two volumetric feed flowrates [1, 7].
13 | P a g e
CHAPTER 3
SIMULATION WORK
In this chapter the simulation methodology is discussed.
3.1 Aspen plus software
Aspen plus v 8.4 was used for the simulation work.
3.2 ASPEN PLUS REACTOR MODEL
RCSTR simulator was used for this work.
3.3 PROPERTY METHOD
CHAO-SEADER thermodynamic model was used as the property method.
3.4 STEADY STATE SIMULATION
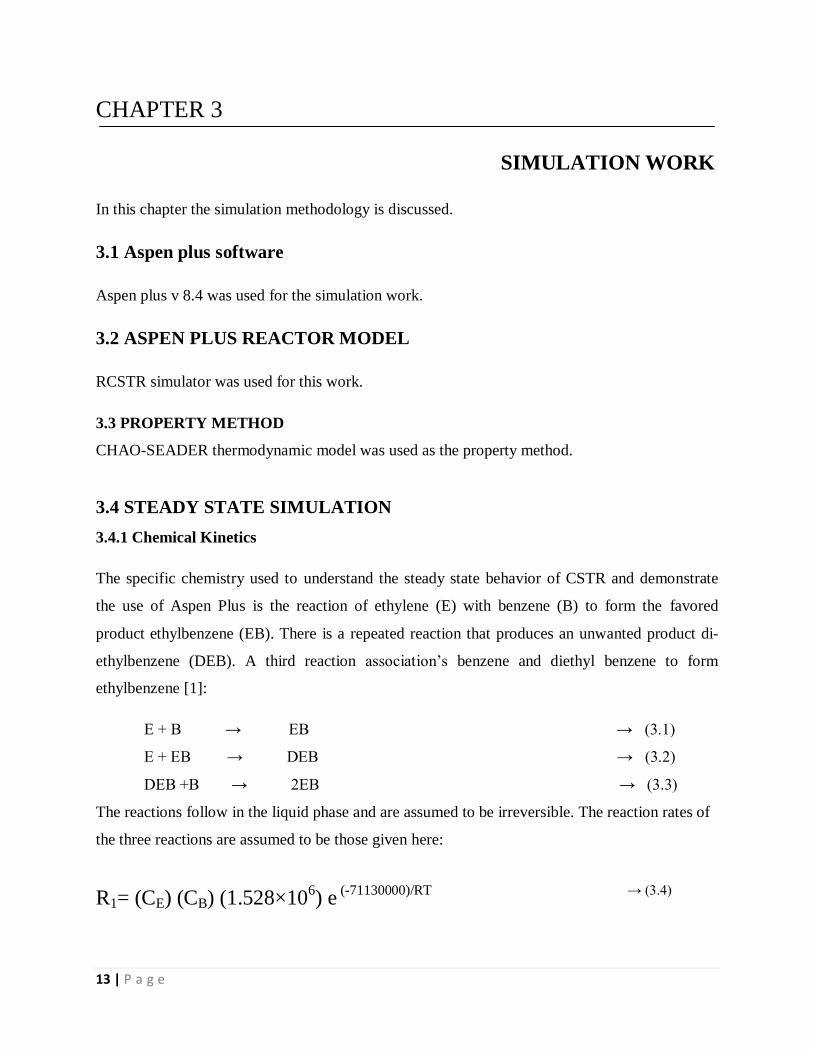
3.4.1 Chemical Kinetics
The specific chemistry used to understand the steady state behavior of CSTR and demonstrate
the use of Aspen Plus is the reaction of ethylene (E) with benzene (B) to form the favored
product ethylbenzene (EB). There is a repeated reaction that produces an unwanted product di-
ethylbenzene (DEB). A third reaction association’s benzene and diethyl benzene to form
ethylbenzene [1]:
E + B → EB → (3.1)
E + EB → DEB → (3.2)
DEB +B → 2EB → (3.3)
The reactions follow in the liquid phase and are assumed to be irreversible. The reaction rates of
the three reactions are assumed to be those given here:
R1= (CE) (CB) (1.528×10⁶) e
(-71130000)/RT → (3.4)

14 | P a g e
R2= (CE)(CEB)(2.778×10³)e
(-83680000)/RT → (3.5)
R3=(CDEB)(CB)(0.4167)e(-62760000)/RT → (3.6)
The units of R are kmol s-1
m-3
. Concentrations have units of kmol/m3. Activation energies have
units of J/kmol. Temperature is in degrees Kelvin [1].
CEis the concentration of ethylene; CB is the concentration of benzene,
CEB is the concentration of ethyl benzene; CDEB is the concentration of di-ethylbenzene.
3.5 SIMULATION SETUP
Figure 3.1 Schematic representation of the continuous stirred tank reactor (CSTR)
R1
V1
V2
V3
PUMP
FB
V1-OUT
PUMP-OUT
P
FE
V2-OUT
R1-OUT

15 | P a g e
By carefully analyzing the above chemical reactions and rate kinetics we would have the
following conclusion about feed flow rate, reactor temperature and reactor volume.
3.4.1 Effect of feed flow rate
The feed flow rate of benzene must be greater than the feed flow rate of ethylene in order to
lower formation of undesired product i.e. di-ethyl benzene. Increasing the feed flow rate of
benzene also has negative impacts such as increasing separation cost which is added to the
production cost i.e. minimizing the profit margin.
The solution for above problem is optimizing the feed flow rate by using the aspen plus by
keeping the one of the feed flowrate constant and varying the other one.
3.4.2Effect of reactor temperature
By comparing the enthalpies of above reaction, the enthalpy of undesired product is greater than
the enthalpy of desired product which mean, that the increasing the reactor temperature favors
the formation of undesired product more than the desired product. So it is necessary to maintain
the optimum reactor temperature in order to maximize the performances.
3.4.3 Effect of reactor volume
Reactor provides sufficient residence time to the reactants where the reactants are converted into
products. In case of exothermic reaction heat removal is necessary in that case reactor provides
sufficient reactor area for jacketed cooling. Increasing the reactor volume provides better cooling
but aggregate the residence time and capital cost. Decreasing the reactor volume may lead to the
process become uncontrollable and it lead to the formation of undesired product.

16 | P a g e
CHAPTER 4
RESULTS AND DISCUSSION
4.1 OPTIMIZATION OF FEED FLOW RATE
First we do the optimization of feed flow, for this we need to fix other quantities like reaction
temperature and reactor volume. From the literature review we have a good idea about reactor
temperature and reactor volume which may or may not be optimum values.
Let’s take the feed flow rate of ethylene is F (E) = 0.2 kmol/s, Reactor temperature T (K) = 430
K
And the Reactor volume V = 100 (cum)
By varying the benzene flow rate F (B) = 0.1, 0.2, 0.3, 0.4, 0.5, and 0.6 (kmol/s), run the
simulation and obtained stream results was tabulated as follows.
Table 4.1: Comparison between the feed flow rate and product flow rate
Feed flow rate (kmol/s) Product flow rate (kmol/s)
Benzene(F) Ethylene(F) Benzene(P) Ethylene(P) Ethyl benzene Di-ethylbenzene
0.1 0.2 0.002 0.098 0.095 0.003
0.2 0.2 0.022 0.021 0.178 0.001
0.3 0.2 0.108 0.008 0.192 <0.001
0.4 0.2 0.207 0.007 0.193 <0.001
0.5 0.2 0.307 0.007 0.193 <0.001
0.6 0.2 0.407 0.007 0.193 <0.001
Table 4.2: Comparison between the feed flow rate and product mole fraction
Feed flow rate (kmol/s) Product mole fraction
Benzene(F) Ethylene(F) Benzene(P) Ethylene(P) Ethyl benzene Di-ethylbenzene
0.1 0.2 0.008 0.496 0.48 0.016
0.2 0.2 0.098 0.095 0.804 0.004
0.3 0.2 0.351 0.026 0.622 0.000598
0.4 0.2 0.509 0.017 0.474 0.00024
0.5 0.2 0.606 0.014 0.381 0.00013
0.6 0.2 0.671 0.012 0.318 0.000082

17 | P a g e
Figure 4.1: Feed flow rate vs product flow rate
Figure 4.2: Flow rate vs product mole fraction
0
0.05
0.1
0.15
0.2
0.25
0.3
0.35
0.4
0.45
0 0.2 0.4 0.6 0.8
pro
du
ct fl
ow
ra
te (
kmo
le/s
)
Benzene(F) flowrate (kmole/s)
benzene(P)
ethylene(P)
ethylbenzene
0
0.1
0.2
0.3
0.4
0.5
0.6
0.7
0.8
0.9
0.1 0.2 0.3 0.4 0.5 0.6
pro
du
ct m
ole
fra
ctio
n
Benzene flowrate (kmole/s)
benzene(P)
ethylene(P)
ethylbenzene

18 | P a g e
Table 4.3: Comparison between benzene flow rate and concentration of di-ethyl benzene (ppm)
Benzene(F)
Flow rate (kmol/s)
Di-ethyl benzene
Mole fraction(ppm)
0.1 160000
0.2 4000
0.3 598
0.4 240
0.5 130
0.6 82
Figure 4.3: Benzene flow rate (kmol/s) vs concentration of DEB (ppm)
0
2000
4000
6000
8000
10000
12000
14000
16000
18000
0 0.1 0.2 0.3 0.4 0.5 0.6 0.7
pro
du
ct m
ole
fra
ctio
n (p
pm
)
Benzene folw rate(kmole/s)

19 | P a g e
4.1.1 Inferences from the tables and graphs
By carefully analyzing the tables and graphs we would have the following conclusions.
Increasing the benzene feed flow rate up to 0.4 kmol/s lead to the maximization of product
formation then after further increasing the feed flow have no effect on product formation instead
increasing the separation cost. So optimum combination of feed flow benzene is F (B) = 0.4
kmol/s and ethylene is F (E) = 0.2 kmol/s.
4.2 OPTIMIZATION OF REACTOR TEMPERATURE
Similarly like above here we fixing the feed flow rate of benzene F (B) =0.4 and ethylene
F (E) =0.2 kmol/s, reactor volume V (cum) = 100.
By varying the reactor temperature T (k) = 410,420,430,440,450,460,470 and 480, run the
simulation and obtained stream results were tabulated as follows.
Table 4.4: Comparison between reactor temperature and product flow rate
Temperature Product flow rate (kmol/sec)
T(K) benzene(P) ethylene(P) ethylbenzene di-ethylbenzene
410 0.216 0.016 0.184 <0.001
420 0.211 0.01 0.189 <0.001
430 0.207 0.007 0.193 <0.001
440 0.205 0.005 0.195 <0.001
450 0.203 0.003 0.197 <0.001
460 0.202 0.002 0.198 <0.001
470 0.202 0.002 0.198 <0.001
480 0.201 0.001 0.199 <0.001

20 | P a g e
Table: 4.5 Comparison between reactor temperature and product mole fraction
Temperature
T(K)
Product mole fraction
benzene(P) ethylene(P) ethylbenzene DEB(ppm)
410 0.519 0.038 0.442 173
420 0.513 0.025 0.452 208
430 0.509 0.017 0.474 240
440 0.506 0.011 0.482 271
450 0.504 0.008 0.488 300
460 0.503 0.005 0.491 328
470 0.502 0.004 0.494 355
480 0.502 0.003 0.495 383
Figure 4.4: Reactor temperature vs product flow rate
0.001
0.051
0.101
0.151
0.201
410 420 430 440 450 460 470 480
pro
du
ct fl
ow
rat
e (k
mo
le/s
ec)
Temperature(k)
benzene(P)
ethylene(P)
ethylbenzene

21 | P a g e
Table: 4.6 Comparison between reactor temperature and concentration of di-ethyl benzene (ppm)
Reactor Temperature
T(K)
Di-ethyl benzene mole
fraction (ppm)
410 173
420 208
430 240
440 271
450 300
460 328
470 355
480 383
Figure 4.5: Reactor temperature vs product mole fraction (DEB)
0
50
100
150
200
250
300
350
400
450
400 410 420 430 440 450 460 470 480 490
pro
du
ct m
ole
fra
ctio
n in
(p
pm
)
Reactor Temperature(k)

22 | P a g e
4.2.1 Inferences from the graphs and tables
By carefully analyzing tables and graphs we would have following conclusions.
By increasing the reactor temperature favours the product formation i.e ethyl benzene and further
increasing the temperature may also favours formation of undesired product i.e di-ethyl benzene.
So the optimum temperature of the reactor is T (k) = 430.
4.3 OPTIMIZATION OF REACTOR VOLUME
Similarly like above here we fixing the feed flow rate of benzene F (B) =0.4 and
Ethylene F (E) =0.2 kmol/s, reactor temperature T (K) = 100.
By varying the reactor volume V = 60, 80, 100, 120 and 140, run the simulation and obtained
stream result were tabulated as follows.
Table 4.7: Comparison between reactor volume and product flow rate
Table 4.8: Comparison between reactor volume and product mole fraction
Reactor volume
(cum)
Product mole fraction
benzene(P) ethylene(P) ethylbenzene
60 0.514 0.027 0.4519
80 0.511 0.021 0.468
100 0.509 0.017 0.474
120 0.507 0.014 0.478
140 0.506 0.012 0.481
Reactor volume
(cum)
Product flow rate (kmol/sec)
benzene(P) ethylene(P) ethylbenzene di-ethylbenzene
60 0.211 0.011 0.189 <0.001
80 0.209 0.009 0.191 <0.001
100 0.207 0.007 0.193 <0.001
120 0.206 0.006 0.194 <0.001
140 0.205 0.005 0.195 <0.001

23 | P a g e
Figure 4.6: Reactor volume vs product flow rate
Table 4.9: Comparison of reactor volume with di-ethyl benzene flow rate
Reactor volume
(cum)
Di-ethylbenzene flow rate
(kmol/s)
60 223
80 233
100 240
120 245
140 248
0
0.1
0.2
0.3
0.4
0.5
0.6
50 70 90 110 130 150
pro
du
ct fl
ow
ra
te (
kmo
le/s
ec)
Reactor volume (cum)
benzene(P)
ethylene(P)
ethylbenzene

24 | P a g e
Figure 4.7: Reactor volume vs DEB (ppm)
4.3.1 Inferences from graphs and tables
By carefully analyzing tables and graphs we would have following conclusions.
Increasing the reactor volume favours the formation of both the desired product and undesired
product simultaneously. Increasing the reactor volume is not also economically feasible. Since it
is exothermic reaction we need to maintain minimum reactor volume for jacketed cooling so
optimum reactor temperature is T (K) = 430.
From the above date we would have the optimum values for feed flow, reactor temperature and
reactor volume. Putting this optimum values in aspen plus and run the simulation and obtain the
stream table which is show below.
220
225
230
235
240
245
250
0 20 40 60 80 100 120 140 160
DEB
(p
pm
)
Reactor Volume (cum)

25 | P a g e
Table: 4.10 Stream results for steady state simulation
preparation of ethylbenzene
Stream ID FB FE P PUMP-OUT R1-OUT V1-OUT V2-OUT
Temperature K 298.0 298.0 430.4 430.3 430.0 298.2 372.2
Pressure N/sqm 1.51988E+6 1.51988E+6 1.21590E+6 1.51988E+6 1.01325E+6 1.01325E+6 1.01325E+6
Vapor Frac 0.000 1.000 0.000 0.000 0.000 0.000 0.000
Mole Flow kmol/sec 0.400 0.200 0.407 0.407 0.407 0.400 0.200
Mass Flow kg/sec 31.245 5.611 36.856 36.856 36.856 31.245 5.611
Volume Flow cum/sec 0.036 0.296 0.051 0.051 0.051 0.036 0.026
Enthalpy MMkcal/hr 17.029 8.902 15.241 15.241 15.211 17.029 8.902
Mole Flow kmol/sec
B 0.400 0.207 0.207 0.207 0.400
E 0.200 0.007 0.007 0.007 0.200
EB 0.193 0.193 0.193
DEB < 0.001 < 0.001 < 0.001
Mole Frac
B 1.000 0.509 0.509 0.509 1.000
E 1.000 0.017 0.017 0.017 1.000
EB 0.474 0.474 0.474
DEB 240 PPM 240 PPM 240 PPM

26 | P a g e
4.4 STEADY STATE SIMULATION FOR CSTRs in SERIES
4.1 Flow sheet for CSTRs in series
Figure 4.8: schematic flow sheet for series CSTR
The optimum size ratio of two CSTRs in series is found to be dependent on the reaction kinetics
and on the level of the conversion.
For reactions with first order kinetics, equal-size CSTRs are the best. For reactions with order
greater than one, the smaller size CSTR should be followed by the large one and for reactions
with order less than one the larger size CSTR should be followed by one with the smaller size.
4.5 SIMULATION FOR OPTIMUM SIZE RATIO
Here we are taking two reactors instead of single reactor having combined volume equal to
volume of single reactor. Use the same optimum values like feed flow, reactor temperature are
used in previous case. Run the simulation for various combination of reactor volume like
( (10,90) ,(20,80) , (30,70) , (40, 60) , (50,50) , (60,40) , (70,30) , (80,20) , (90,10) ) and obtained
stream results tableted as follows.
R1
V1
V2
V4
PUMP-2
FB
V1-OUT
P2-OUT
P
FE
V2-OUT R2
R2-OUT
PUMP-1
R1-OUT
V3
P1-OUT
V3-OUT

27 | P a g e
Table 4.11: Comparison between reactor volumes and product flow rate
Reactor volume (cum) Flow rare (kmol/s) from R1 & R2
R1 R2 R1(B) R1(E) R1(EB) R2(B) R2(E) R2(EB)
10 90 0.249 0.049 0.151 0.202 0.002 0.198
20 80 0.229 0.029 0.171 0.201 0.001 0.199
30 70 0.221 0.021 0.179 0.201 0.001 0.199
40 60 0.216 0.016 0.184 0.201 0.001 0.199
50 50 0.213 0.013 0.187 0.201 0.001 0.199
60 40 0.211 0.011 0.189 0.201 0.001 0.199
70 30 0.21 0.01 0.19 0.201 0.001 0.199
80 20 0.209 0.009 0.191 0.201 0.001 0.198
90 10 0.208 0.008 0.192 0.202 0.002 0.198
Table 4.12: Comparison between reactor volumes and product mole from R1 &R2
Reactor vol
(cum)
Mole fraction from R1 & R2 and DEB in PPM (parts per million)
R1 R2 R1(B) R1(E) R1(EB) R1(DEB) R2(B) R2(E) R2(EB) R2(DEB)
10 90 0.554 0.109 0.337 111 0.503 0.005 0.493 186
20 80 0.534 0.067 0.399 162 0.502 0.003 0.495 210
30 70 0.525 0.049 0.426 188 0.501 0.003 0.496 224
40 60 0.519 0.038 0.442 204 0.501 0.002 0.496 232
50 50 0.516 0.032 0.452 215 0.501 0.002 0.496 238
60 40 0.514 0.027 0.459 223 0.501 0.002 0.496 242
70 30 0.512 0.024 0.464 229 0.502 0.003 0.496 245
80 20 0.511 0.021 0.468 233 0.502 0.003 0.495 247
90 10 0.51 0.019 0.472 237 0.503 0.005 0.492 248

28 | P a g e
Figure 4.9: R1 and product flow rate curves
Figure 4.10: R2 and product flow rate curves
0
0.025
0.05
0.075
0.1
0.125
0.15
0.175
0.2
0.225
0.25
0.275
0 20 40 60 80 100
Flo
w r
ate
fro
m R
1&R
2 (k
mo
l/s)
R1 reactor volume(cum)
R1(B)
R1(E)
R1(EB)
R2(B)
R2(E)
R2(EB)
0
0.025
0.05
0.075
0.1
0.125
0.15
0.175
0.2
0.225
0.25
0.275
0 20 40 60 80 100
Flo
w r
ate
fro
m R
1&R
2 (k
mo
l/s)
R2 reactor volume(cum)
R1(B)
R1(E)
R1(EB)
R2(B)
R2(E)
R2(EB)

29 | P a g e
Table 4.13: Comparison between R1 vol (cum) & formation of DEB (ppm) in R1 & R2
R1 Vol (cum) R1(DEB)(ppm) R2(DEB)(ppm)
10 111 186
20 162 210
30 188 224
40 204 232
50 215 238
60 223 242
70 229 245
80 233 247
90 237 248
Figure 4.11: Plot between reactor volume R1 vs DEB (ppm)
0
25
50
75
100
125
150
175
200
225
250
275
0 20 40 60 80 100
DEB
(P
PM
)
reactor volume R1(cum)
R1(DEB)
R2(DEB)
30 | P a g e
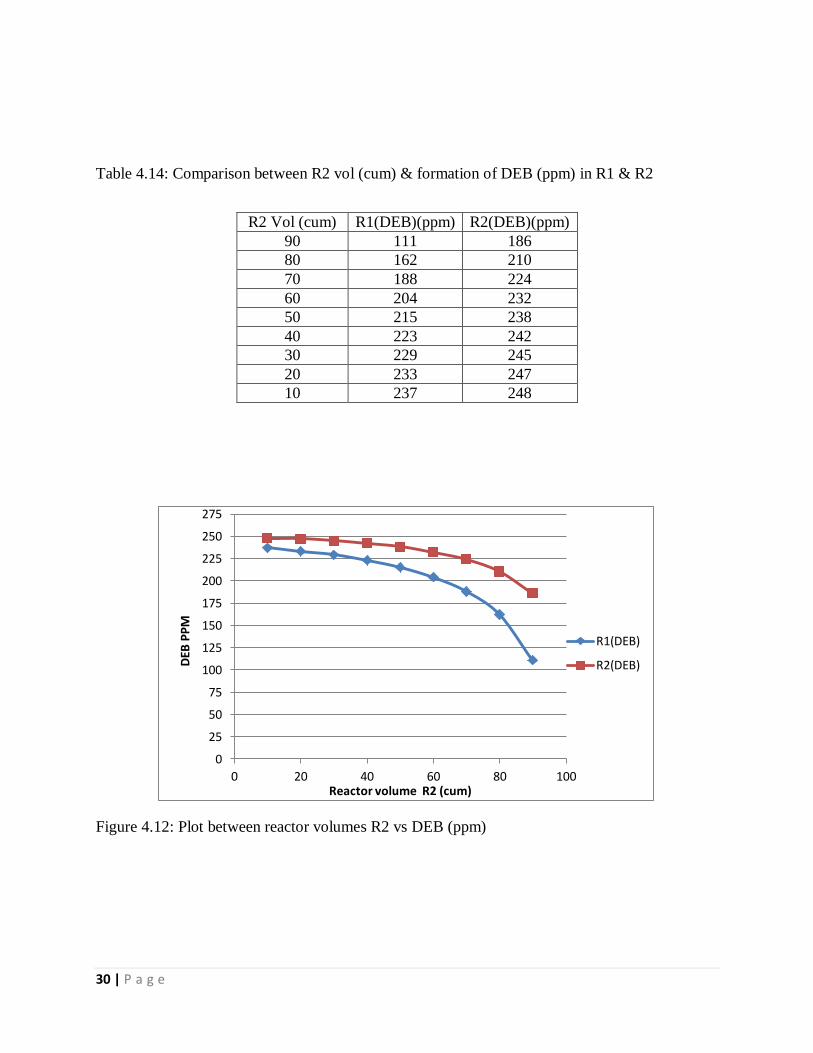
Table 4.14: Comparison between R2 vol (cum) & formation of DEB (ppm) in R1 & R2
Figure 4.12: Plot between reactor volumes R2 vs DEB (ppm)
0
25
50
75
100
125
150
175
200
225
250
275
0 20 40 60 80 100
DEB
PP
M
Reactor volume R2 (cum)
R1(DEB)
R2(DEB)
R2 Vol (cum) R1(DEB)(ppm) R2(DEB)(ppm)
90 111 186
80 162 210
70 188 224
60 204 232
50 215 238
40 223 242
30 229 245
20 233 247
10 237 248

31 | P a g e
4.5.1 Inferences from plots and graphs
By carefully analyzing the data tables and graphs we would have following conclusions.
Initially we are started simulation with the reactor volume R1 =10 & R2=90 and with increasing
reactor volume R1 we can observe increasing of production formation. Further increasing the
reactor volume beyond certain limit i.e R1=40(cum), it favours the formation of undesired
product i.e di-ethyl benzene. So optimum reactor volume combination is R1 = 40 & R2 =60.
Put all this values and the run simulation we will get following stream table.
Table 4.15: Stream results for CSTRs in series
preparat ion of ethylbenzene
Stream ID FB FE P P1-OUT P2-OUT R1-OUT R2-OUT V1-OUT V2-OUT V3-OUT
Temperature K 298.0 298.0 430.4 431.0 430.3 430.0 430.0 298.2 372.2 212.8
Pressure N/sqm 1.51988E+6 1.51988E+6 1.21590E+6 2.53313E+6 1.51988E+6 1.01325E+6 1.01325E+6 1.01325E+6 1.01325E+6 10.000
Vapor Frac 0.000 1.000 0.000 0.000 0.000 0.000 0.000 0.000 0.000 0.874
Mole Flow kmol/sec 0.400 0.200 0.401 0.416 0.401 0.416 0.401 0.400 0.200 0.416
Mass Flow kg/sec 31.245 5.611 36.856 36.856 36.856 36.856 36.856 31.245 5.611 36.856
Volume Flow cum/sec 0.036 0.296 0.051 0.051 0.051 0.051 0.051 0.036 0.026 64337.983
Enthalpy MMkcal/hr 17.029 8.902 14.683 16.151 14.683 16.062 14.654 17.029 8.902 16.151
Mole Flow kmol/sec
B 0.400 0.201 0.216 0.201 0.216 0.201 0.400 0.216
E 0.200 0.001 0.016 0.001 0.016 0.001 0.200 0.016
EB 0.199 0.184 0.199 0.184 0.199 0.184
DEB < 0.001 < 0.001 < 0.001 < 0.001 < 0.001 < 0.001
Mole Frac
B 1.000 0.501 0.519 0.501 0.519 0.501 1.000 0.519
E 1.000 0.002 0.038 0.002 0.038 0.002 1.000 0.038
EB 0.496 0.442 0.496 0.442 0.496 0.442
DEB 232 PPM 204 PPM 232 PPM 204 PPM 232 PPM 204 PPM

32 | P a g e
Table 4.16: Comparison between reactor temperature vs conversion & yield
T(k) X(B) X(E) Y(EB/B) Y(EB/E)
410 0.46 0.92 0.46 0.92
420 0.4725 0.95 0.4725 0.945
430 0.4825 0.965 0.4825 0.965
440 0.4875 0.975 0.4875 0.975
450 0.4925 0.985 0.4925 0.985
460 0.495 0.99 0.495 0.99
470 0.495 0.99 0.495 0.99
480 0.4975 0.995 0.4975 0.995
Figure 4.13: Plot between reactor temperature vs conversion of B & E
Table 4.17: Comparison between reactor volume and conversion & yield
Reactor volume(cum) X(B) X(E) Y(EB/B) Y(EB/E)
60 0.4725 0.945 0.4725 0.945
80 0.4775 0.955 0.4775 0.955
100 0.4825 0.965 0.4825 0.965
120 0.485 0.97 0.485 0.97
140 0.4875 0.975 0.4875 0.975
0
0.2
0.4
0.6
0.8
1
1.2
410 420 430 440 450 460 470 480
Pro
du
ct c
on
vers
ion
of
B &
E
Reactor Temperature
X(B)
X(E)

33 | P a g e
Figure 4.14: Plot between reactor volume vs Yield of B & E
Table 4.18: Comparison between feed flow rate vs conversion & yield
Benzene(F)(kmol/s) X(B) X(E) Y(EB/B) Y(EB/E)
0.1 0.98 0.51 0.98 0.9312
0.2 0.89 0.895 0.89 0.9944
0.3 0.64 0.96 0.64 0.999
0.4 0.4825 0.965 0.4825 0.999
0.5 0.386 0.965 0.386 0.999
0.6 0.322 0.965 0.322 0.999
0
0.2
0.4
0.6
0.8
1
1.2
0 50 100 150
Y-y
ield
of
B &
E
Reactor volume (cum)
Y(EB/B)
Y(EB/E)

34 | P a g e
Figure 4.15: Plot between feed flow rate vs conversion & yield
Inferences:
By carefully analyzing the above table and graphs we would have the following conclusions.
At optimum reactor temperature (T = 430K), reactor volume (V = 100) and feed flow rate
(kmol/s) (F (B) =0.4, F (E) =0.2) the reaction has maximum conversion and yield.
Conversion and yield values for single tank reactor are
Conversion of benzene X (B) = 48.5%
Conversion of ethylene X (E) = 96.5%
Yield of ethyl benzene Y (EB/B) = 48.25%
Yield of ethyl benzene Y (EB/E) = 99.9%
Conversion and yield values for series CSTR reactor are
Conversion of benzene X (B) = 49.75%
Conversion of ethylene X (E) = 99.5%
Yield of ethyl benzene Y (EB/B) = 49.75%
0
0.2
0.4
0.6
0.8
1
1.2
0 0.2 0.4 0.6 0.8
X-c
on
vers
ion
& Y
-Yie
ld
Benzene (F) flow rate (kmol/s)
X(B)
X(E)
Y(EB/B)
Y(EB/E)

35 | P a g e
Yield of ethyl benzene Y (EB/E) = 99.99%
By comparing the two models we have following results
Conversion of benzene is X (B) increased by 2.58%
Conversion of ethylene is X (E) increased by 3.1%
Yield of ethyl benzene Y (EB/B) is increased by 3.1%
Yield of ethyl benzene Y (EB/E) is increased by 3.61 %
DISCUSSION
For single tank reactor at optimum reactor temperature T=430(k), reactor volume V=100 (cum)
And feed flow rate i.e benzene F (B) =0.4 & ethylene F (E) 0.2 kmol/s, the conversion of
benzene and ethylene were found to be 48.5% and 96.5%. The yield of ethyl benzene Y (EB/B)
And Y (EB/E) was found to be 48.25% & 96.5%.
By replacing single reactor with series reactors whose sum of the volumes is equal to the
volume of the single reactor, the performance of the reaction can be enhanced.
For series CSTR at the same reaction conditions i.e temperature and feed flow the conversion of
benzene and ethylene were found to be 49.75% and 99.5%. The yield of ethyl benzene Y (EB/B)
and Y (EB/E) was found to be 49.75% & 99.9%.
By comparing the two reactor models i.e single tank vs series reactor system we would have
following conclusion.
The conversion of benzene is increased by 2.58% and ethylene is increased by 3.1%.
The yield of ethyl benzene Y (EB/B) is increased by 3.1% and yield of ethyl benzene Y (EB/E)
is increased by 3.61%.

36 | P a g e
CHAPTER 5
CONCLUSION AND FUTURE WORK
This project work reports steady state simulation results of a continuous stirred tank reactor
(CSTR) system using Aspen-plus simulation. The reaction, investigated in this work was
production of ethyl benzene using ethylene and benzene as the reactants. Ethyl benzene, being
one of the important raw materials in production of several industrially important chemicals, is
often produced alongside with diethyl benzene as an undesired side product.
In our simulation, this particular aspect has been examined to maximize the conversion of ethyl
benzene from its reactants. Here, we have studied the effect of feed flow rate on steady state
behaviour of CSTR and also obtained the optimum feed flow rate in order to maximize the
conversion and yield with special consideration of consecutive reactions where one product was
desired and another one was undesired.
Since the effect of reactor temperature was always going to be crucial in this exothermic reaction
mechanism, optimum values were evaluated. The optimum reactor volume was also found out
from the simulation results.
The optimum temperature was predicted to be 430 K and the optimum reactor volume was found
to be 100 m3. The optimum feed flow rates were 0.4 kmol/sec w.r.t benzene and 0.2 kmol/sec
w.r.t ethylene.
The maximum yield of ethyl benzene was predicted to be 49.75% w.r.t benzene and 99.9% w.r.t
ethylene.
As a continuation of this work, it can be extended in studying the dynamic simulation aspects
with various controlling mechanisms in place and to figure out controller parameters and
settings. Similarly, different reactor volumes (variable hold-ups) may also be used in series to
study their affect in overall conversion of this reaction and optimize the variables.

37 | P a g e
REFERENCES
[1] Luyben, W. L., “Chemical reactor design and control”, Wiley, 1-103, (2007)
[2] Jana, A.K., “Process simulation and control using Aspen”, 72-213,
[3] Levenspiel, O., “Chemical reaction engineering”, Wiley, 1-206, (2004)
[4] Fogler, H.S., “Elements of chemical reaction engineering”, Pearson, 305-356, (2004)
[5] Rase, H.F., “Chemical reactor design for process plants”, Wiley, 30-67, (1977)
[6] Westerterp, K.R., Van swaaiji, W.P.M., and Beenackers, A.A.C.M., “Chemical reactor
design and operation”, Wiley, 45-87, (1984)
[7] Vincent A.Welch, Kevin J. Fallon, Heinz-Peter Gelbke “Ethylbenzene” Ullman’s
Encyclopedia of Industrial Chemistry, Wiley-VCH, Weinheim, (2005)
[8] Dimian A. C., Integrated Design and Simulation of Chemical Processes, Elsevier (2003).
[9] Douglas JM. Conceptual Design of Chemical Processes. New York: McGraw-Hill, (1988).
[10] Luyben W. L., Distillation Design and Control Using Aspen Simulation, Wiley, New York
(2006).
[11] Luyben W. L., Design and control of the ethyl benzene process, Wiley, AIChE
JournalVolume 57, Issue 3, pages 655–670, (2010).