the consolidation behaviour of alluvial … consolidation behaviour of alluvial soft clay in...
TRANSCRIPT
Australian Geomechanics Vol 48 No 1 March 2013 133
THE CONSOLIDATION BEHAVIOUR OF ALLUVIAL SOFT CLAY IN GLADSTONE, CENTRAL QUEENSLAND
Adam Kemp1, Barry Wai-Choo Kok2, James Davis3 and Paul Menton4
1Lead Geotechnical Engineer, Aurecon Hatch QLD, 2Principal Geotechnical Engineer, Geoinventions Consulting Service, 3Senior Geotechnical Engineer, Aurecon Hatch QLD, 4Geotechnical Engineer, Aurecon Hatch
ABSTRACT Infrastructure, port facilities and road embankments built on existing soft clay sediments impose various geotechnical challenges. A trial embankment has been constructed at the Wiggins Island Coal Export Terminal (WICET), Gladstone, Queensland to investigate the consolidation behaviour of soft, quaternary alluvial sediments. Large settlement associated with prolonged consolidation time is of particular interest. To predict the magnitude and rate of settlement to allow the design to meet often tight construction schedules, consolidation parameters such as compression and recompression indices, pre-consolidation pressure, coefficients of primary and secondary consolidation need to be reliably estimated. In this paper the consolidation properties of soft clay at WICET were evaluated using three approaches, which are: i) laboratory testing (oedometer); ii) field testing (CPTU with pore pressure dissipation); and iii) back analysis of field monitoring results from an instrumented trial embankment. Derivation of the parameters from the above approaches are discussed, with the results compared and assessed. The benefits of back-analysing instrumentation data to improve the construction programme are also discussed.
1 PROJECT INTRODUCTION
1.1 PROJECT OVERVIEW The Wiggins Island Coal Export Terminal (WICET) project involves the construction of a new coal export terminal at Golding Point, to the west of the existing RG Tanna Coal Terminal in Gladstone Harbour. This important coal transport infrastructure will form part of the existing Port of Gladstone. Construction for Stage One of the terminal will include:
• A rail receival facility designed to handle 7600 tonnes per hour • A 5.5 km long overland conveyor • Stockyard area for 1.9 million tonnes of coal • Materials handling and sampling systems feeding the 2km long jetty conveyor • Single berth with a travelling ship loader to fill ships at 8250 tonnes per hour • Channels and wharf to accept a range of vessels from 40,000 dwt to 220,000 dwt • 132kV substation, access roads, workshops, administration offices and amenities.
The proximity of WICET to the mouth of the Calliope River and Port Curtis means that there is a need to build over recently deposited sediments which are often still very soft. Construction in and around these marine environments can raise significant challenges for engineers and contractors alike.
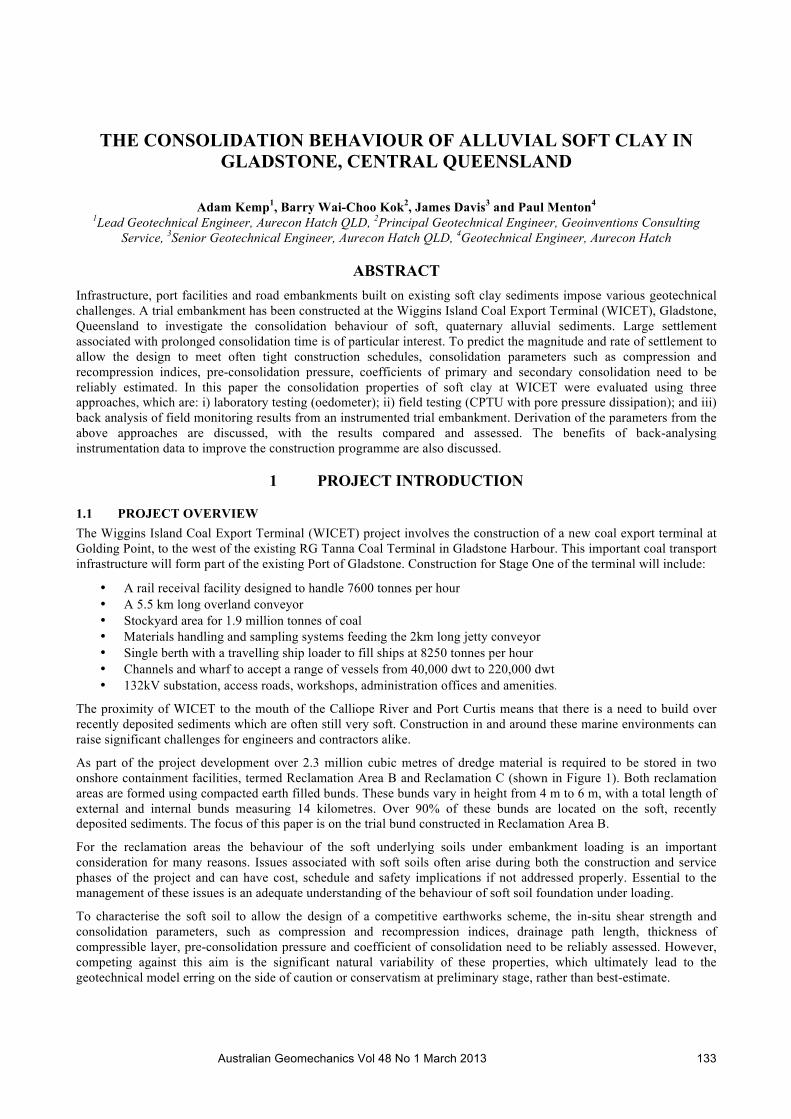
As part of the project development over 2.3 million cubic metres of dredge material is required to be stored in two onshore containment facilities, termed Reclamation Area B and Reclamation C (shown in Figure 1). Both reclamation areas are formed using compacted earth filled bunds. These bunds vary in height from 4 m to 6 m, with a total length of external and internal bunds measuring 14 kilometres. Over 90% of these bunds are located on the soft, recently deposited sediments. The focus of this paper is on the trial bund constructed in Reclamation Area B.
For the reclamation areas the behaviour of the soft underlying soils under embankment loading is an important consideration for many reasons. Issues associated with soft soils often arise during both the construction and service phases of the project and can have cost, schedule and safety implications if not addressed properly. Essential to the management of these issues is an adequate understanding of the behaviour of soft soil foundation under loading.
To characterise the soft soil to allow the design of a competitive earthworks scheme, the in-situ shear strength and consolidation parameters, such as compression and recompression indices, drainage path length, thickness of compressible layer, pre-consolidation pressure and coefficient of consolidation need to be reliably assessed. However, competing against this aim is the significant natural variability of these properties, which ultimately lead to the geotechnical model erring on the side of caution or conservatism at preliminary stage, rather than best-estimate.
THE CONSOLIDATION BEHAVIOUR OF ALLUVIAL SOFT CLAY IN GLADSTONE, CENTRAL QUEENSLAND KEMP et al.
Australian Geomechanics Vol 48 No 1 March 2013 134
Figure 1: Project Overview
The aim of this paper is to examine the natural variability of these soft soils and understand how well we are able to model the magnitude and rate of consolidation settlement through comparison with field monitoring data collected at an instrumented trial bund. The paper examines the soil properties calculated from field and laboratory testing and compares them against those determined from back-analysis methods. The back-analysis has been undertaken using two methods; Asaoka (1979) and Hyperbolic (Tan, 1995), in conjunction with a simple curve fitting approach based on 1-D consolidation theory. The results determined by each of these methods is compared and appraised. Finally, the project benefits associated with the implementation of the trial bund, refinement of the geotechnical model and subsequent field monitoring programme, are discussed.
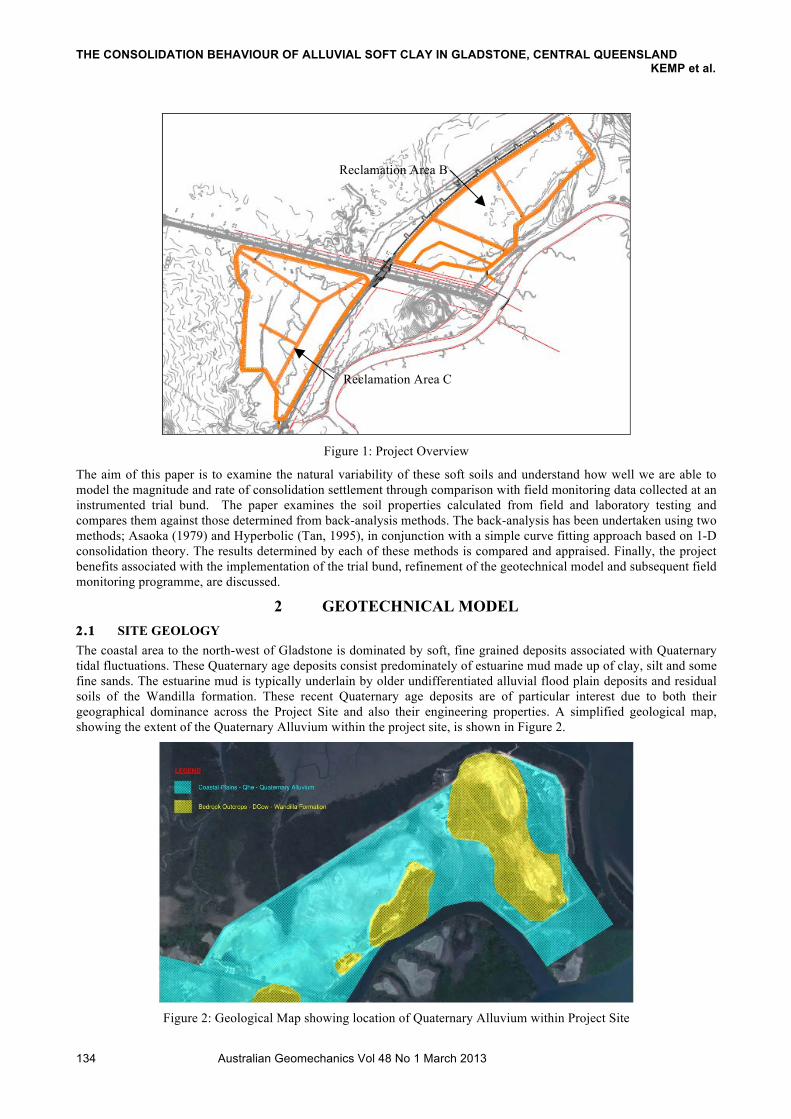
2 GEOTECHNICAL MODEL 2.1 SITE GEOLOGY The coastal area to the north-west of Gladstone is dominated by soft, fine grained deposits associated with Quaternary tidal fluctuations. These Quaternary age deposits consist predominately of estuarine mud made up of clay, silt and some fine sands. The estuarine mud is typically underlain by older undifferentiated alluvial flood plain deposits and residual soils of the Wandilla formation. These recent Quaternary age deposits are of particular interest due to both their geographical dominance across the Project Site and also their engineering properties. A simplified geological map, showing the extent of the Quaternary Alluvium within the project site, is shown in Figure 2.
Figure 2: Geological Map showing location of Quaternary Alluvium within Project Site
Reclamation Area B
Reclamation Area C
THE CONSOLIDATION BEHAVIOUR OF ALLUVIAL SOFT CLAY IN GLADSTONE, CENTRAL QUEENSLAND KEMP et al.
Australian Geomechanics Vol 48 No 1 March 2013 135
2.2 SITE INVESTIGATION A number of extensive site investigations were undertaken across the tidal mudflats between 2006 and 2011. One of the primary purposes of the investigations was to gather information which would then be used to develop a series of geotechnical models to help characterise these soft soils. A number of different in situ sampling and testing methods were used to assess the engineering properties of the ground.
A total of 34 boreholes, 60 Cone Penetration Test’s (CPT’s), dissipation tests and 4 kilometres of seismic survey lines (Multi-channel Analysis of Surface Waves – MASW) were undertaken to define the thickness, strength, stress history, compressibility and permeability of the soft soils across Reclamation Area B. Sampling and testing methods were utilised to provide specific information required to develop the geotechnical model.
Borehole drilling was a combination of tungsten-carbide bit auguring and washboring with in situ testing and sampling undertaken at 1 m or 1.5 m intervals. Given the fine grained nature of the soil, sampling typically consisted of 50 mm thin-walled undisturbed tube (U50) samples. U50 samples where then sent to a soil testing laboratory for a combination of classification, strength and compressibility testing.
CPT’s were undertaken primarily to define the characteristics of soft soils across the Project Site. Data from the CPT was used to classify the soft soils and estimate undrained shear strength, drainage path length and stress history. CPT data was also used to accurately identify the interface between the soft soils and the stiff material below, effectively defining the thickness of the soft layer. More than 50 dissipation tests were undertaken in the soft soil layer to estimate the coefficient of consolidation.
Over 4 kilometres of MASW survey was completed, at a later date, to further define the thickness of soft soil. In conjunction with the discrete borehole and CPT information, the MASW data was used to create contour plans showing the interface between soft soil and stiff soil.
2.3 KEY DESIGN PROPERTIES Using data gathered from the aforementioned investigations a geotechnical model for the design of the reclamation bunds on the soft ground areas was developed.
The initial undrained shear strength is a critical property for the design of the bunds on soft clay. For this project the distribution of undrained shear strength was examined with various zones demarcated across the reclamation area. However, once construction has commenced, the rate of strength gain in the soft clay becomes critical and this is dictated primarily by the rate of consolidation. The design lift rate was found to be highly sensitive to the rate of consolidation and the following parameters were found to have the greatest effect on the variability of estimates:
• Thickness of Quaternary Alluvium
• Compressibility characteristics including o Compression, swell ratio and coefficient of secondary compression o Coefficient of vertical consolidation
An essential component of geotechnical engineering design is the ability to estimate reasonable parameters based on sometimes limited datasets and/or correlations with index testing. In order to provide a best-estimate of the bund performance it is important to understand the trend and variation in a given dataset.
The following sections describe each of these parameters and the variability determined from the site investigations and/or laboratory testing. The variability in these sections is described by the coefficient of variation, which has been determined from the standard deviation calculated using the graphical “Three-Sigma Rule” described in Duncan (1999). In this method the most likely variation line is plotted alongside the lowest and highest conceivable bounds for the data. The calculated coefficient of variation is also compared to published values from Duncan (1999) as a verification exercise. The impact of this variability on the design estimates is also investigated and compared against the monitoring data in subsequent sections of this paper.
2.3.1 Thickness of Quaternary Alluvium Based on historical investigations within the WICET precinct, the clays and silts of the Quaternary Alluvium are typically limited in thickness with some localised areas of greater thickness, usually associated with ancient paleo-channels.
The interface between the Quaternary and Undifferentiated Alluvium is distinct due to the large difference in shear strength. The interface was therefore easily identified using a combination of the boreholes, CPTs and MASW. The MASW results were calibrated against the CPT data where the cone resistance was greater than 0.5 MPa.

THE CONSOLIDATION BEHAVIOUR OF ALLUVIAL SOFT CLAY IN GLADSTONE, CENTRAL QUEENSLAND KEMP et al.
Australian Geomechanics Vol 48 No 1 March 2013 136
Using this methodology, the reduced level of this interface was determined at each testing location and therefore the thickness of the Quaternary Alluvium. A 3D surface was then developed using Surfer 3DTM and is shown in Figure 3. A cumulative distribution plot of the thickness determined from the field testing is also presented in Figure 4.
The thickness of Quaternary Alluvium typically varies from 1.0 m to 2.0 m thick with several localised in-filled channels. A statistical analysis of the thickness reveals an average thickness of 1.5 m and a standard deviation, using the “Three-Sigma Rule”, of 0.67 m. The coefficient of variation of the thickness of Quaternary Alluvium, across Reclamation Area B, is 44%. Although this variation is noted, the soft clay thickness is a systematic parameter (easily measured and lacks random variability) and for the purposes of design a best-estimate of the thickness is typically adopted. Testing at the trial bund location gave a thickness of approximately 1.2 m and this estimate is used in subsequent sections of this paper.
Based on observations from the CPT testing the maximum drainage path length is assumed to be half the thickness of the Quaternary Alluvium.
Figure 3: Thickness of Quaternary Alluvium across Project Site
THE CONSOLIDATION BEHAVIOUR OF ALLUVIAL SOFT CLAY IN GLADSTONE, CENTRAL QUEENSLAND KEMP et al.
Australian Geomechanics Vol 48 No 1 March 2013 137
Figure 4: Cumulative Frequency Plot for Thickness of Quaternary Alluvium
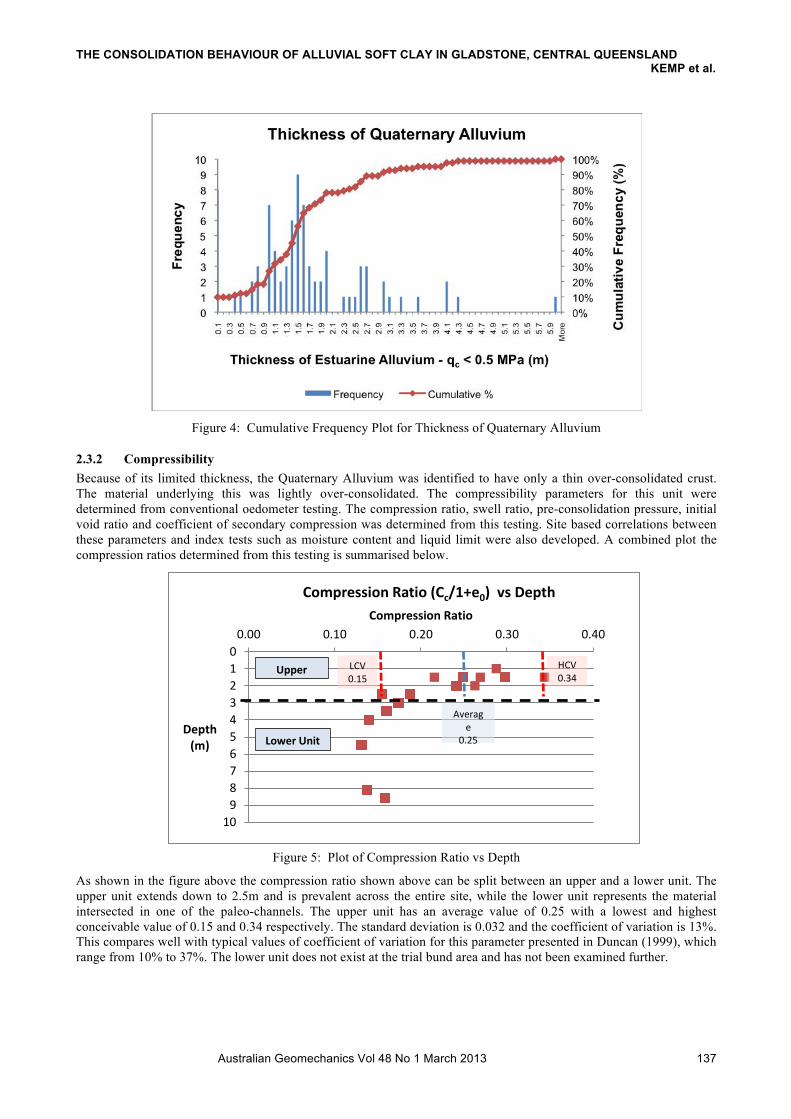
2.3.2 Compressibility Because of its limited thickness, the Quaternary Alluvium was identified to have only a thin over-consolidated crust. The material underlying this was lightly over-consolidated. The compressibility parameters for this unit were determined from conventional oedometer testing. The compression ratio, swell ratio, pre-consolidation pressure, initial void ratio and coefficient of secondary compression was determined from this testing. Site based correlations between these parameters and index tests such as moisture content and liquid limit were also developed. A combined plot the compression ratios determined from this testing is summarised below.
Figure 5: Plot of Compression Ratio vs Depth
As shown in the figure above the compression ratio shown above can be split between an upper and a lower unit. The upper unit extends down to 2.5m and is prevalent across the entire site, while the lower unit represents the material intersected in one of the paleo-channels. The upper unit has an average value of 0.25 with a lowest and highest conceivable value of 0.15 and 0.34 respectively. The standard deviation is 0.032 and the coefficient of variation is 13%. This compares well with typical values of coefficient of variation for this parameter presented in Duncan (1999), which range from 10% to 37%. The lower unit does not exist at the trial bund area and has not been examined further.
STUDY ON THE CONSOLIDATION BEHAVIOUR OF ALLUVIAL SOFT CLAY IN GLADSTONE, CENTRAL QUEENSLAND !
6 Australian Geomechanics Vol 44 No 3 September 2009
"#$#"# %&'()*++,-,.,/0!
Because of its limited thickness, the Quaternary Alluvium was identified to have only a thin over-consolidated crust. The material underlying this was lightly over-consolidated. The compressibility parameters for this unit were determined from conventional oedometer testing. The compression ratio, swell ratio, pre-consolidation pressure, initial void ratio and coefficient of secondary compression was determined from this testing. Site based correlations between these parameters and index tests such as moisture content and liquid limit were also developed. A combined plot the compression ratios determined from this testing is summarised below.
Figure 5: Plot of Compression Ratio vs Depth
As shown in the figure above the compression ratio shown above can be split between an upper and a lower unit. The upper unit extends down to 2.5m and is prevalent across the entire site, while the lower unit represents the material intersected in one of the paleo-channels. The upper unit has an average value of 0.25 with a lowest and highest conceivable value of 0.15 and 0.34 respectively. The standard deviation is 0.032 and the coefficient of variation is 13%. This compares well with typical values of coefficient of variation for this parameter presented in Duncan (1999), which range from 10% to 37%. The lower unit does not exist at the trial bund area and has not been examined further.
"#$#$# %&*11,%,*2/!&1!3*)/,%4.!%&2+&.,54/,&2!
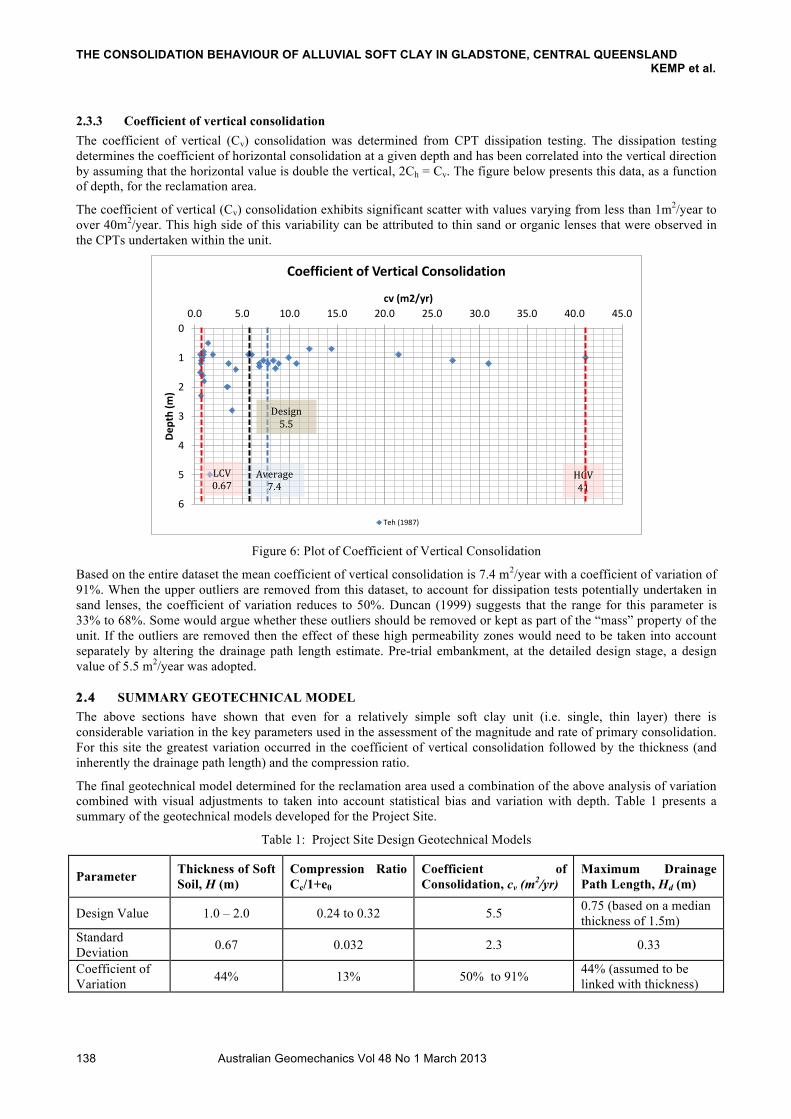
The coefficient of vertical (Cv) consolidation was determined from CPT dissipation testing. The dissipation testing determines the coefficient of horizontal consolidation at a given depth and has been correlated into the vertical direction by assuming that the horizontal value is double the vertical, 2Ch = Cv. The figure below presents this data, as a function of depth, for the reclamation area.
The coefficient of vertical (Cv) consolidation exhibits significant scatter with values varying from less than 1m2/year to over 40m2/year. This high side of this variability can be attributed to thin sand or organic lenses that were observed in the CPTs undertaken within the unit.
!"#$%&'()*
"!
!+!! !+"! !+#! !+$! !+%!
!"#$%&'()&
*+(#,"--.+/&01$.+&
*+(#,"--.+/&01$.+&'*2345"6)&&7-&!"#$%&
8##",&
9+:",&8/.$,
-./012/,
!+#&,
345,!+"&,
645,!+$%,
THE CONSOLIDATION BEHAVIOUR OF ALLUVIAL SOFT CLAY IN GLADSTONE, CENTRAL QUEENSLAND KEMP et al.
Australian Geomechanics Vol 48 No 1 March 2013 138
2.3.3 Coefficient of vertical consolidation The coefficient of vertical (Cv) consolidation was determined from CPT dissipation testing. The dissipation testing determines the coefficient of horizontal consolidation at a given depth and has been correlated into the vertical direction by assuming that the horizontal value is double the vertical, 2Ch = Cv. The figure below presents this data, as a function of depth, for the reclamation area.
The coefficient of vertical (Cv) consolidation exhibits significant scatter with values varying from less than 1m2/year to over 40m2/year. This high side of this variability can be attributed to thin sand or organic lenses that were observed in the CPTs undertaken within the unit.
0
1
2
3
4
5
6
0.0 5.0 10.0 15.0 20.0 25.0 30.0 35.0 40.0 45.0
Depth (m
)
cv (m2/yr)
Coefficient of Vertical Consolidation
Teh (1987)
Figure 6: Plot of Coefficient of Vertical Consolidation
Based on the entire dataset the mean coefficient of vertical consolidation is 7.4 m2/year with a coefficient of variation of 91%. When the upper outliers are removed from this dataset, to account for dissipation tests potentially undertaken in sand lenses, the coefficient of variation reduces to 50%. Duncan (1999) suggests that the range for this parameter is 33% to 68%. Some would argue whether these outliers should be removed or kept as part of the “mass” property of the unit. If the outliers are removed then the effect of these high permeability zones would need to be taken into account separately by altering the drainage path length estimate. Pre-trial embankment, at the detailed design stage, a design value of 5.5 m2/year was adopted.
2.4 SUMMARY GEOTECHNICAL MODEL The above sections have shown that even for a relatively simple soft clay unit (i.e. single, thin layer) there is considerable variation in the key parameters used in the assessment of the magnitude and rate of primary consolidation. For this site the greatest variation occurred in the coefficient of vertical consolidation followed by the thickness (and inherently the drainage path length) and the compression ratio.
The final geotechnical model determined for the reclamation area used a combination of the above analysis of variation combined with visual adjustments to taken into account statistical bias and variation with depth. Table 1 presents a summary of the geotechnical models developed for the Project Site.
Table 1: Project Site Design Geotechnical Models
Parameter Thickness of Soft Soil, H (m)
Compression Ratio Cc/1+e0
Coefficient of Consolidation, cv (m2/yr)
Maximum Drainage Path Length, Hd (m)
Design Value 1.0 – 2.0 0.24 to 0.32 5.5 0.75 (based on a median thickness of 1.5m)
Standard Deviation 0.67 0.032 2.3 0.33
Coefficient of Variation 44% 13% 50% to 91% 44% (assumed to be
linked with thickness)
HCV 41
Average 7.4
LCV 0.67
Design 5.5
THE CONSOLIDATION BEHAVIOUR OF ALLUVIAL SOFT CLAY IN GLADSTONE, CENTRAL QUEENSLAND KEMP et al.
Australian Geomechanics Vol 48 No 1 March 2013 139
Using the values presented above a most-likely estimate of primary consolidation of 330 mm can be calculated. By using the standard deviations calculated for the thickness of soft soil and compression ratio and the Taylor Series technique (US Army Corps of Engineers, 1997, 1998) a standard deviation of 130 mm and a coefficient of variation of 40% has been calculated for the primary consolidation in Reclamation Area B. The envelope of values plus and minus one standard deviation of the most likely value was 196 mm to 459 mm.
2.5 DESIGN FOR RECLAMATION AREA The final bund design for the reclamation area used the geotechnical model described above. A staged construction methodology was judged as the most economical means of building the reclamation within the project’s timeframes. High strength structural geotextile was also incorporated in areas of lower than normal undrained shear strength.
A staged construction methodology relies on the gain in shear strength due to the consolidation process. The rate of consolidation, which is controlled by the coefficient of consolidation and the drainage path length, is of vital importance to this technique. Using the parameters described above, a construction rate of 0.5 m per week with a 2 week pause after every 1 m height of fill was adopted for the bund design. Under this design methodology, an allowable percent consolidation, for a particular height of lift is established and then compared with actual pore water pressure readings.
For comparative purposes, using the proposed construction rate, time rate parameters and Olson’s (1977) solution for average degree of consolidation under ramp loading, it was estimated that 90% consolidation would occur after 5 months, several weeks after the completion of construction. The coefficient of variation for this estimate was 15%. The envelope of values plus and minus one standard deviation of the most likely value was 4.3 months to 5.7 months. The highest conceivable estimate for this dataset was 7.2 months.
3 TRIAL BUND
3.1 OBJECTIVE OF TRIAL BUND Design of the earthworks was based on the geotechnical model described above, and whilst a detailed ground investigation had allowed a refining of that model, it does not provide direct assessment of major geotechnical risks, such as bund instability during construction and the magnitude and rate of consolidation settlement, both critical for a staged construction programme.
In order to ensure an adequate reliability, the selection of parameters presented above adopts a moderately conservative approach for the design, to account for variability, both in inherent soil property and in measurement and transformation (e.g. correlation between parameters). This necessary conservatism translates primarily to increased schedule constraints.
Initially the staged construction programme did not impact the project’s schedule, however, due to requirements for schedule acceleration, the approach needed to be re-examined. The consequence of the bunds not being completed on time was severe. Therefore, to ensure that the reclamation bunds were completed on time for receipt of dredge spoil the project team considered it imperative to examine ways to accelerate the construction rate and at the same time reduce the schedule risk that may be caused by latent ground conditions, in particular a lower than estimated rate of consolidation/strength gain.
To reduce this apparent uncertainty and refine the design, a fully-instrumented trial bund was proposed, which would provide direct results and would allow construction rates and surcharge times to be re-examined. The primary objective to build a geotechnical test pad or trial bund in this project was to refine the design parameters based on observed field instrumentation monitoring data. Because the extensive nature of the earthworks (over 14 km of bunds) additional monitoring instrumentation was also installed, away from the trial area, to act as verification tools for the final, and revised design.
3.2 INSTRUMENTATION AND MONITORING PLAN A 100 m section of the Reclamation Area B bund was identified as a suitable location for a trial bund. The location was within the permanent works but could be accessed at an earlier time than other areas, allowing a larger volume of data to be collected and used elsewhere in the project area.
As shown in the figure below, the monitoring instrumentation installed within the trial bund included, eight (8) settlement plates, two (2) vibrating wire piezometers (VWPs) and six (6) inclinometers. Stability poles, or horizontal movement points, were also installed in between the inclinometers to act as a visual reference of instability for site staff. CPT and borehole investigations were undertaken within the trial bund area and revealed a soft clay thickness of 1.2 m. The properties of the soft clay determined from these investigations were consistent with the results presented in the previous section of this paper.
THE CONSOLIDATION BEHAVIOUR OF ALLUVIAL SOFT CLAY IN GLADSTONE, CENTRAL QUEENSLAND KEMP et al.
Australian Geomechanics Vol 48 No 1 March 2013 140
Figure 7: Trial Bund Instrumentation Plan
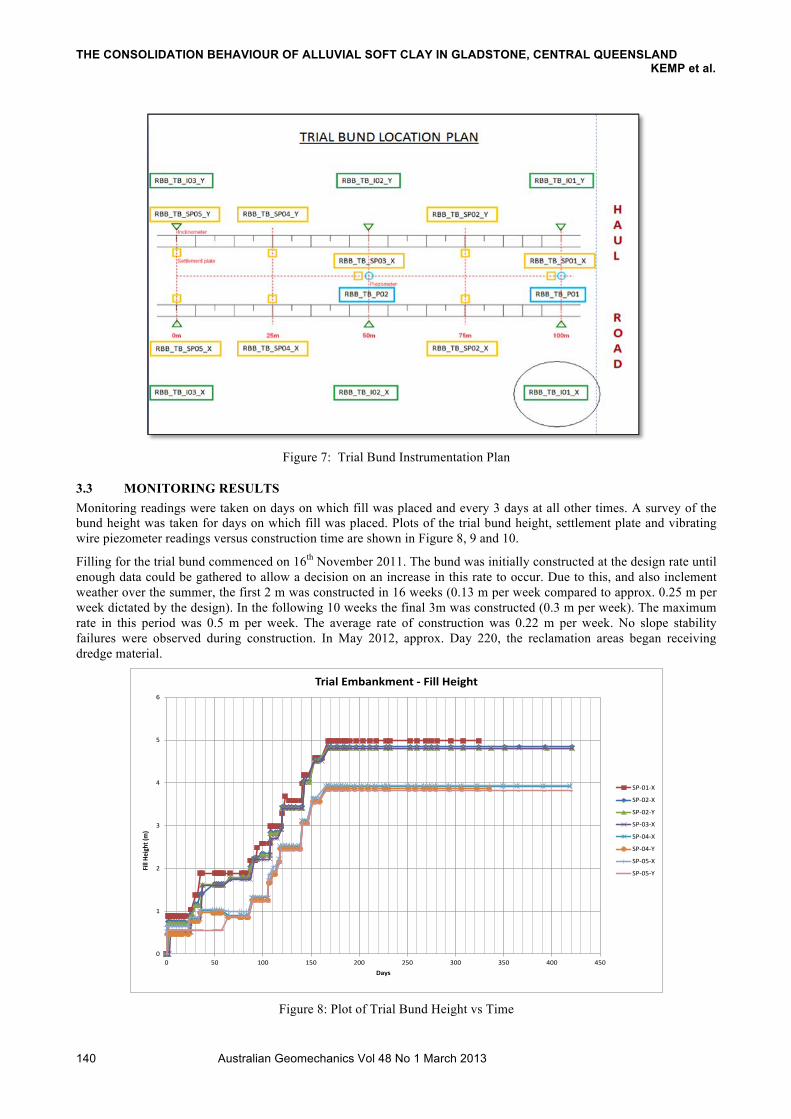
3.3 MONITORING RESULTS Monitoring readings were taken on days on which fill was placed and every 3 days at all other times. A survey of the bund height was taken for days on which fill was placed. Plots of the trial bund height, settlement plate and vibrating wire piezometer readings versus construction time are shown in Figure 8, 9 and 10.
Filling for the trial bund commenced on 16th November 2011. The bund was initially constructed at the design rate until enough data could be gathered to allow a decision on an increase in this rate to occur. Due to this, and also inclement weather over the summer, the first 2 m was constructed in 16 weeks (0.13 m per week compared to approx. 0.25 m per week dictated by the design). In the following 10 weeks the final 3m was constructed (0.3 m per week). The maximum rate in this period was 0.5 m per week. The average rate of construction was 0.22 m per week. No slope stability failures were observed during construction. In May 2012, approx. Day 220, the reclamation areas began receiving dredge material.
0
1
2
3
4
5
6
0 50 100 150 200 250 300 350 400 450
Fill He
ight (m
)
Days
Trial Embankment -‐ Fill Height
SP-‐01-‐X
SP-‐02-‐X
SP-‐02-‐Y
SP-‐03-‐X
SP-‐04-‐X
SP-‐04-‐Y
SP-‐05-‐X
SP-‐05-‐Y
Figure 8: Plot of Trial Bund Height vs Time

THE CONSOLIDATION BEHAVIOUR OF ALLUVIAL SOFT CLAY IN GLADSTONE, CENTRAL QUEENSLAND KEMP et al.
Australian Geomechanics Vol 48 No 1 March 2013 141
0
0.05
0.1
0.15
0.2
0.25
0 50 100 150 200 250 300 350 400 450
Settlemen
t (m)
Days
Trial Embankment Settlement Plate Data
SP-‐01-‐X
SP-‐02-‐X
SP-‐02-‐Y
SP-‐03-‐X
SP-‐04-‐X
SP-‐04-‐Y
SP-‐05-‐X
SP-‐05-‐Y
Figure 9: Plot of Trial Bund Settlement Plate Readings
0.00
5.00
10.00
15.00
20.00
25.00
0.00
5.00
10.00
15.00
20.00
25.00
30.00
35.00
40.00
45.00
50.00
0.00 50.00 100.00 150.00 200.00 250.00 300.00 350.00
Fill H
eight (m)
VWP P
orew
ater Pr
essure (kPa)
Days
Trial Bund -‐ Porewater Pressures
P01 P02 P01 Fill Height P02 Fill Height Figure 10: Plot of Trial Embankment VWP Readings
4 BACK ANALYSIS OF CONSOLIDATION PARAMETERS
4.1 OVERVIEW Utilising the settlement plate and vibrating wire piezometer data from the trial bund the magnitude of settlement at the end of consolidation, sc, and the rate of consolidation, can be predicted. There are four commonly used methods for back-analysis:
• Curve fitting method using 1-D consolidation theory • Estimation of percent consolidation using VWP data • Asaoka Method (Asaoka, 1979) and • Hyperbolic Method (Tan, 1995)
Each of these methods has been used to back-analyse the settlement plate data. During the construction period, the curve fitting method in conjunction with the VWP data were used as the primary back-analysis methods. The Asaoka and Hyperbolic methods are only suitable once 60% consolidation has been reached and therefore were only used once the final bund height had been reached and the preload period started.
For this paper the back-analysis results from two instrument clusters at the trial bund are presented. Both of these clusters combine a settlement plate and VWP at the one location, i.e. VWP-P01 combined with SP-01-X and VWP-P02 combined with SP-03-X. The following sections discuss the back-analysis methodology and the results for each of these clusters.
THE CONSOLIDATION BEHAVIOUR OF ALLUVIAL SOFT CLAY IN GLADSTONE, CENTRAL QUEENSLAND KEMP et al.
Australian Geomechanics Vol 48 No 1 March 2013 142
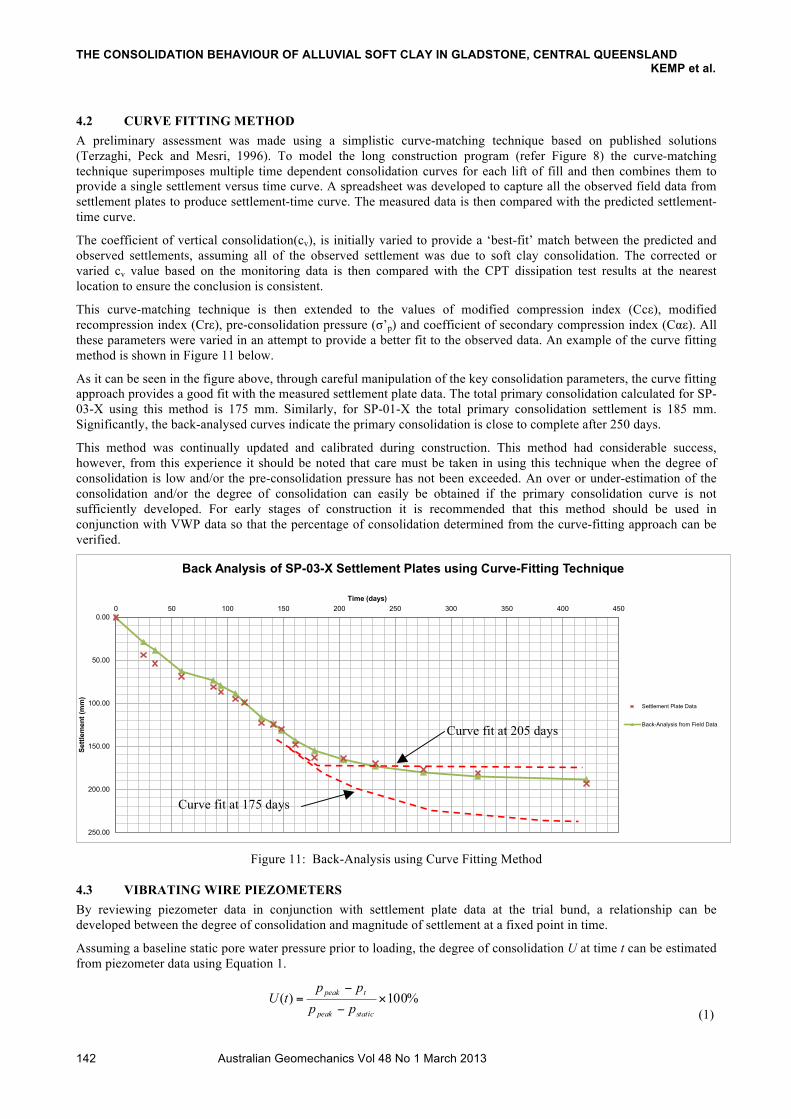
4.2 CURVE FITTING METHOD A preliminary assessment was made using a simplistic curve-matching technique based on published solutions (Terzaghi, Peck and Mesri, 1996). To model the long construction program (refer Figure 8) the curve-matching technique superimposes multiple time dependent consolidation curves for each lift of fill and then combines them to provide a single settlement versus time curve. A spreadsheet was developed to capture all the observed field data from settlement plates to produce settlement-time curve. The measured data is then compared with the predicted settlement-time curve.
The coefficient of vertical consolidation(cv), is initially varied to provide a ‘best-fit’ match between the predicted and observed settlements, assuming all of the observed settlement was due to soft clay consolidation. The corrected or varied cv value based on the monitoring data is then compared with the CPT dissipation test results at the nearest location to ensure the conclusion is consistent.
This curve-matching technique is then extended to the values of modified compression index (Ccε), modified recompression index (Crε), pre-consolidation pressure (σ’p) and coefficient of secondary compression index (Cαε). All these parameters were varied in an attempt to provide a better fit to the observed data. An example of the curve fitting method is shown in Figure 11 below.
As it can be seen in the figure above, through careful manipulation of the key consolidation parameters, the curve fitting approach provides a good fit with the measured settlement plate data. The total primary consolidation calculated for SP-03-X using this method is 175 mm. Similarly, for SP-01-X the total primary consolidation settlement is 185 mm. Significantly, the back-analysed curves indicate the primary consolidation is close to complete after 250 days.
This method was continually updated and calibrated during construction. This method had considerable success, however, from this experience it should be noted that care must be taken in using this technique when the degree of consolidation is low and/or the pre-consolidation pressure has not been exceeded. An over or under-estimation of the consolidation and/or the degree of consolidation can easily be obtained if the primary consolidation curve is not sufficiently developed. For early stages of construction it is recommended that this method should be used in conjunction with VWP data so that the percentage of consolidation determined from the curve-fitting approach can be verified.
0.00
50.00
100.00
150.00
200.00
250.00
0 50 100 150 200 250 300 350 400 450
Settl
emen
t (m
m)
Time (days)
Back Analysis of SP-03-X Settlement Plates using Curve-Fitting Technique
Settlement Plate Data
Back-Analysis from Field Data
Figure 11: Back-Analysis using Curve Fitting Method
4.3 VIBRATING WIRE PIEZOMETERS By reviewing piezometer data in conjunction with settlement plate data at the trial bund, a relationship can be developed between the degree of consolidation and magnitude of settlement at a fixed point in time.
Assuming a baseline static pore water pressure prior to loading, the degree of consolidation U at time t can be estimated from piezometer data using Equation 1.
%100)( ×
−
−=
staticpeak
tpeak
pppp
tU (1)
Curve fit at 205 days
Curve fit at 175 days
THE CONSOLIDATION BEHAVIOUR OF ALLUVIAL SOFT CLAY IN GLADSTONE, CENTRAL QUEENSLAND KEMP et al.
Australian Geomechanics Vol 48 No 1 March 2013 143
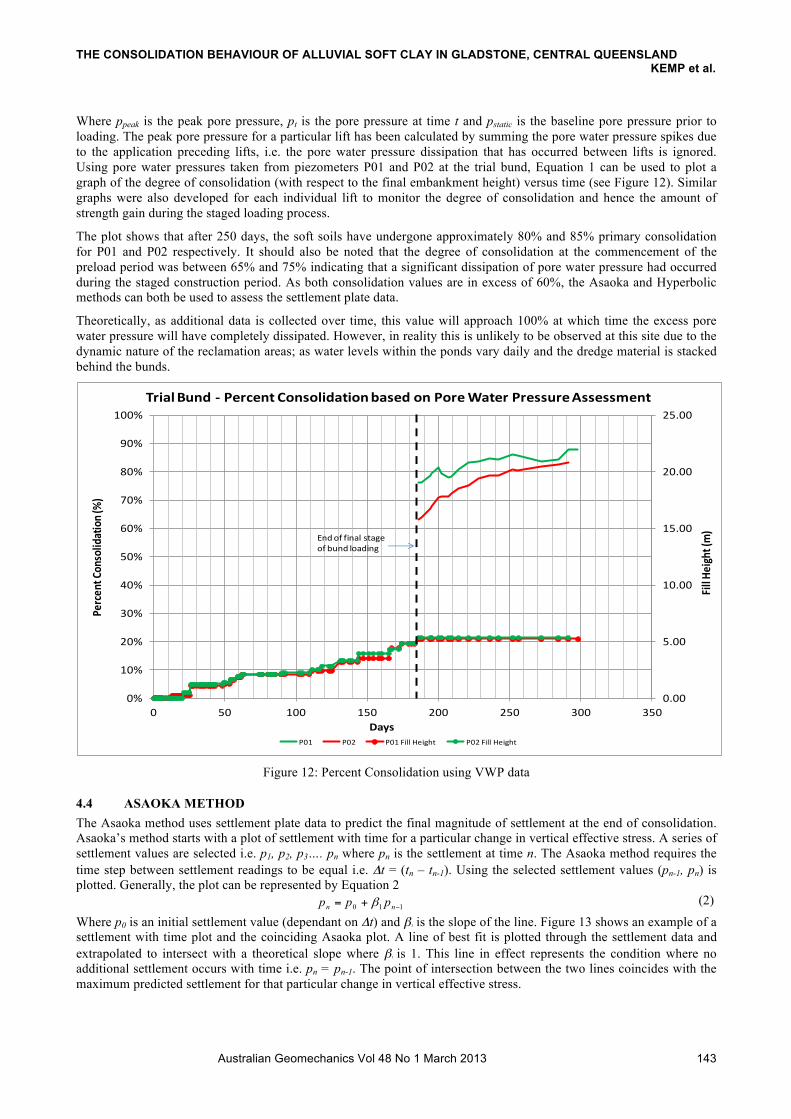
Where ppeak is the peak pore pressure, pt is the pore pressure at time t and pstatic is the baseline pore pressure prior to loading. The peak pore pressure for a particular lift has been calculated by summing the pore water pressure spikes due to the application preceding lifts, i.e. the pore water pressure dissipation that has occurred between lifts is ignored. Using pore water pressures taken from piezometers P01 and P02 at the trial bund, Equation 1 can be used to plot a graph of the degree of consolidation (with respect to the final embankment height) versus time (see Figure 12). Similar graphs were also developed for each individual lift to monitor the degree of consolidation and hence the amount of strength gain during the staged loading process.
The plot shows that after 250 days, the soft soils have undergone approximately 80% and 85% primary consolidation for P01 and P02 respectively. It should also be noted that the degree of consolidation at the commencement of the preload period was between 65% and 75% indicating that a significant dissipation of pore water pressure had occurred during the staged construction period. As both consolidation values are in excess of 60%, the Asaoka and Hyperbolic methods can both be used to assess the settlement plate data.
Theoretically, as additional data is collected over time, this value will approach 100% at which time the excess pore water pressure will have completely dissipated. However, in reality this is unlikely to be observed at this site due to the dynamic nature of the reclamation areas; as water levels within the ponds vary daily and the dredge material is stacked behind the bunds.
0.00
5.00
10.00
15.00
20.00
25.00
0%
10%
20%
30%
40%
50%
60%
70%
80%
90%
100%
0 50 100 150 200 250 300 350Fill H
eight (m)
Percen
t Con
solid
ation (%)
Days
Trial Bund -‐ Percent Consolidation based on Pore Water Pressure Assessment
P01 P02 P01 Fill Height P02 Fill Height
Endof final stage of bund loading
Figure 12: Percent Consolidation using VWP data
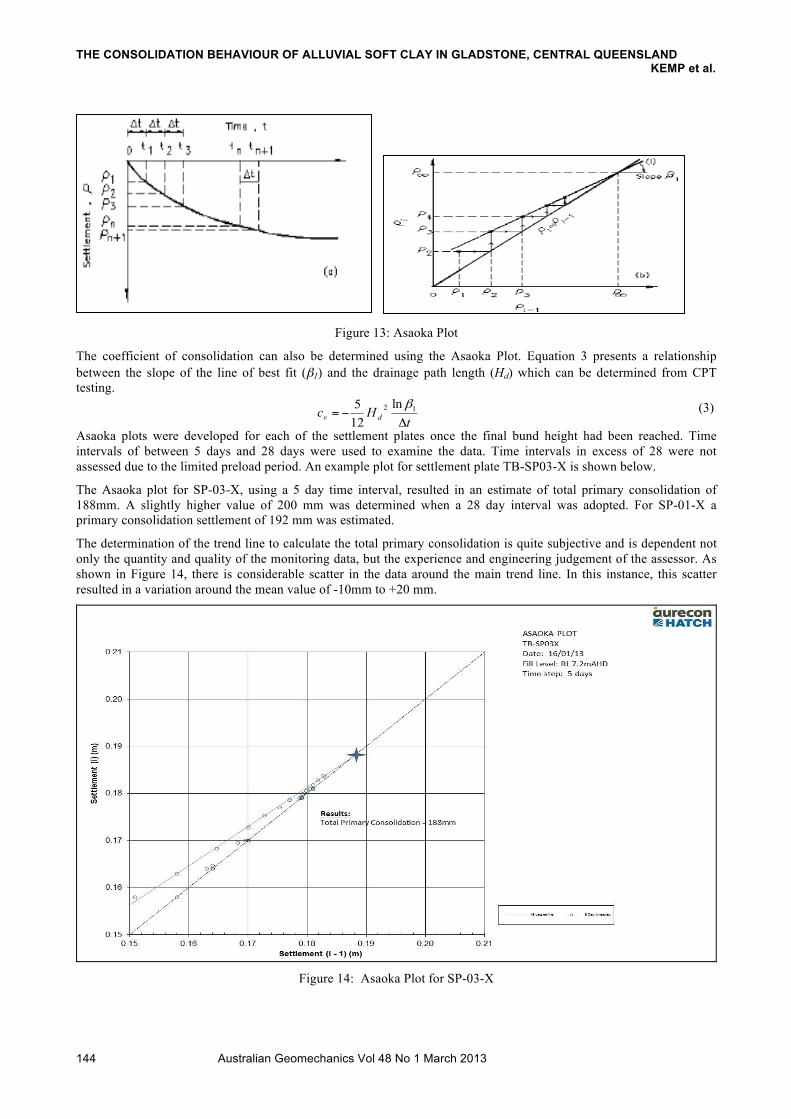
4.4 ASAOKA METHOD The Asaoka method uses settlement plate data to predict the final magnitude of settlement at the end of consolidation. Asaoka’s method starts with a plot of settlement with time for a particular change in vertical effective stress. A series of settlement values are selected i.e. p1, p2, p3…. pn where pn is the settlement at time n. The Asaoka method requires the time step between settlement readings to be equal i.e. Δt = (tn – tn-1). Using the selected settlement values (pn-1, pn) is plotted. Generally, the plot can be represented by Equation 2
110 −+= nn ppp β (2)
Where p0 is an initial settlement value (dependant on Δt) and β1 is the slope of the line. Figure 13 shows an example of a settlement with time plot and the coinciding Asaoka plot. A line of best fit is plotted through the settlement data and extrapolated to intersect with a theoretical slope where β1 is 1. This line in effect represents the condition where no additional settlement occurs with time i.e. pn = pn-1. The point of intersection between the two lines coincides with the maximum predicted settlement for that particular change in vertical effective stress.
THE CONSOLIDATION BEHAVIOUR OF ALLUVIAL SOFT CLAY IN GLADSTONE, CENTRAL QUEENSLAND KEMP et al.
Australian Geomechanics Vol 48 No 1 March 2013 144
Figure 13: Asaoka Plot
The coefficient of consolidation can also be determined using the Asaoka Plot. Equation 3 presents a relationship between the slope of the line of best fit (β1) and the drainage path length (Hd) which can be determined from CPT testing.
tHc dv Δ
−= 12 ln125 β (3)
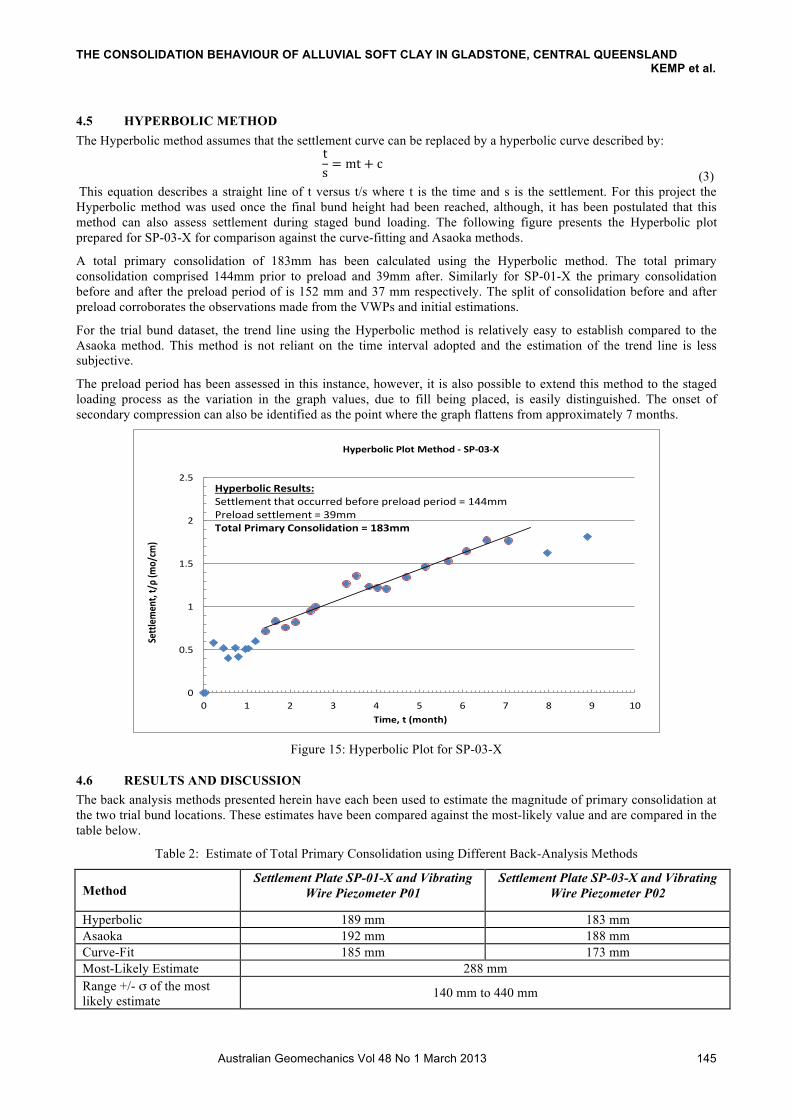
Asaoka plots were developed for each of the settlement plates once the final bund height had been reached. Time intervals of between 5 days and 28 days were used to examine the data. Time intervals in excess of 28 were not assessed due to the limited preload period. An example plot for settlement plate TB-SP03-X is shown below.
The Asaoka plot for SP-03-X, using a 5 day time interval, resulted in an estimate of total primary consolidation of 188mm. A slightly higher value of 200 mm was determined when a 28 day interval was adopted. For SP-01-X a primary consolidation settlement of 192 mm was estimated.
The determination of the trend line to calculate the total primary consolidation is quite subjective and is dependent not only the quantity and quality of the monitoring data, but the experience and engineering judgement of the assessor. As shown in Figure 14, there is considerable scatter in the data around the main trend line. In this instance, this scatter resulted in a variation around the mean value of -10mm to +20 mm.
Figure 14: Asaoka Plot for SP-03-X
THE CONSOLIDATION BEHAVIOUR OF ALLUVIAL SOFT CLAY IN GLADSTONE, CENTRAL QUEENSLAND KEMP et al.
Australian Geomechanics Vol 48 No 1 March 2013 145
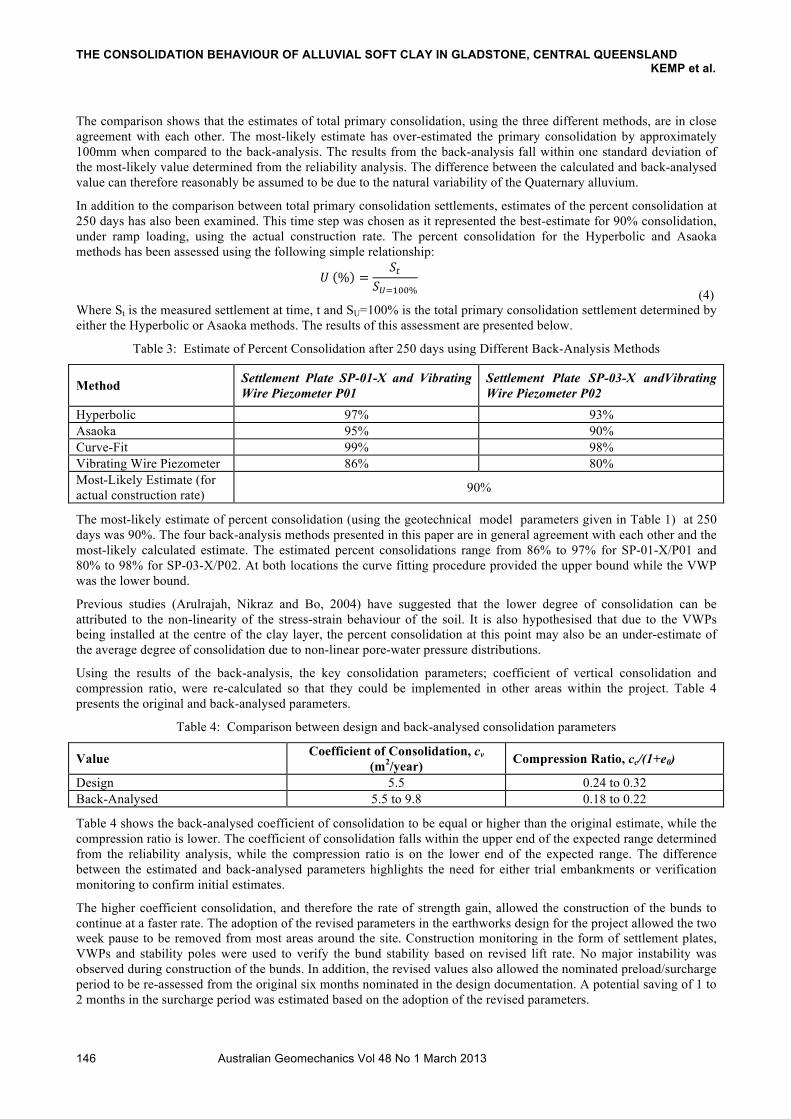
4.5 HYPERBOLIC METHOD The Hyperbolic method assumes that the settlement curve can be replaced by a hyperbolic curve described by:
STUDY ON THE CONSOLIDATION BEHAVIOUR OF ALLUVIAL SOFT CLAY IN GLADSTONE, CENTRAL QUEENSLAND !
14 Australian Geomechanics Vol 44 No 3 September 2009
Asaoka plots were developed for each of the settlement plates once the final bund height had been reached. Time intervals of between 5 days and 28 days were used to examine the data. Time intervals in excess of 28 were not assessed due to the limited preload period. An example plot for settlement plate TB-SP03-X is shown below.
The Asaoka plot for SP-03-X, using a 5 day time interval, resulted in an estimate of total primary consolidation of 188mm. A slightly higher value of 200mm was determined when a 28 day interval was adopted. For SP-01-X a primary consolidation settlement of 192mm was estimated.
The determination of the trend line to calculate the total primary consolidation is quite subjective and is dependent not only the quantity and quality of the monitoring data, but the experience and engineering judgement of the assessor. As shown in Figure 12, there is considerable scatter in the data around the main trend line. In this instance, this scatter resulted in a variation around the mean value of -10mm to +20mm.
Figure 14: Asaoka Plot for SP-03-X
4.5. H YPE RB O L I C M E T H O D
The Hyperbolic method assumes that the settlement curve can be replaced by a hyperbolic curve described by:
�� � �� � �
This equation describes a straight line of t versus t/s. Where t is the time and s is the settlement. For this project the Hyperbolic method was used once the final bund height had been reached, although, it has been postulated that this method can also assess settlement during staged bund loading. The following figure presents the Hyperbolic plot prepared for SP-03-X for comparison against the curve-fitting and Asaoka methods.
A total primary consolidation of 183mm has been calculated using the Hyperbolic method. The total primary consolidation comprised 144mm prior to preload and 39mm after. Similarly for SP-01-X the primary consolidation before and after the preload period of is 152mm and 37mm respectively. The split of consolidation before and after preload corroborates the observations made from the VWPs and initial estimations.
For the trial bund dataset, the trend line using the Hyperbolic method is relatively easy to establish compared to the Asaoka method. This method is not reliant on the time interval adopted and the estimation of the trend line is less subjective.
(3) This equation describes a straight line of t versus t/s where t is the time and s is the settlement. For this project the Hyperbolic method was used once the final bund height had been reached, although, it has been postulated that this method can also assess settlement during staged bund loading. The following figure presents the Hyperbolic plot prepared for SP-03-X for comparison against the curve-fitting and Asaoka methods.
A total primary consolidation of 183mm has been calculated using the Hyperbolic method. The total primary consolidation comprised 144mm prior to preload and 39mm after. Similarly for SP-01-X the primary consolidation before and after the preload period of is 152 mm and 37 mm respectively. The split of consolidation before and after preload corroborates the observations made from the VWPs and initial estimations.
For the trial bund dataset, the trend line using the Hyperbolic method is relatively easy to establish compared to the Asaoka method. This method is not reliant on the time interval adopted and the estimation of the trend line is less subjective.
The preload period has been assessed in this instance, however, it is also possible to extend this method to the staged loading process as the variation in the graph values, due to fill being placed, is easily distinguished. The onset of secondary compression can also be identified as the point where the graph flattens from approximately 7 months.
0
0.5
1
1.5
2
2.5
0 1 2 3 4 5 6 7 8 9 10
Settlem
ent, t/ρ(m
o/cm
)
Time, t (month)
Hyperbolic Plot Method -‐ SP-‐03-‐X
Hyperbolic Results:Settlement that occurred before preload period = 144mmPreload settlement = 39mmTotal Primary Consolidation = 183mm
Figure 15: Hyperbolic Plot for SP-03-X
4.6 RESULTS AND DISCUSSION The back analysis methods presented herein have each been used to estimate the magnitude of primary consolidation at the two trial bund locations. These estimates have been compared against the most-likely value and are compared in the table below.
Table 2: Estimate of Total Primary Consolidation using Different Back-Analysis Methods
Method Settlement Plate SP-01-X and Vibrating
Wire Piezometer P01 Settlement Plate SP-03-X and Vibrating
Wire Piezometer P02
Hyperbolic 189 mm 183 mm Asaoka 192 mm 188 mm Curve-Fit 185 mm 173 mm Most-Likely Estimate 288 mm Range +/- σ of the most likely estimate 140 mm to 440 mm
THE CONSOLIDATION BEHAVIOUR OF ALLUVIAL SOFT CLAY IN GLADSTONE, CENTRAL QUEENSLAND KEMP et al.
Australian Geomechanics Vol 48 No 1 March 2013 146
The comparison shows that the estimates of total primary consolidation, using the three different methods, are in close agreement with each other. The most-likely estimate has over-estimated the primary consolidation by approximately 100mm when compared to the back-analysis. The results from the back-analysis fall within one standard deviation of the most-likely value determined from the reliability analysis. The difference between the calculated and back-analysed value can therefore reasonably be assumed to be due to the natural variability of the Quaternary alluvium.
In addition to the comparison between total primary consolidation settlements, estimates of the percent consolidation at 250 days has also been examined. This time step was chosen as it represented the best-estimate for 90% consolidation, under ramp loading, using the actual construction rate. The percent consolidation for the Hyperbolic and Asaoka methods has been assessed using the following simple relationship:
STUDY ON THE CONSOLIDATION BEHAVIOUR OF ALLUVIAL SOFT CLAY IN GLADSTONE, CENTRAL QUEENSLAND
Australian Geomechanics Vol 48 No 1 March 2013 15
The preload period has been assessed in this instance, however, it is also possible to extend this method to the staged loading process as the variation in the graph values, due to fill being placed, is easily distinguished. The onset of secondary compression can also be identified as the point where the graph flattens from approximately 7 months.
Figure 15: Hyperbolic Plot for SP-03-X
4.6. R ESU L TS A ND DISC USSI O N
The back analysis methods presented herein have each been used to estimate the magnitude of primary consolidation at the two trial bund locations. These estimates have been compared against the most-likely value and are compared in the table below.
M ethod Settlement Plate SP-01-X and Vibrating Wire Piezometer P01
Settlement Plate SP-03-X and Vibrating Wire Piezometer P02
Hyperbolic 189mm 183mm Asaoka 192mm 188mm Curve-Fit 185mm 173mm Most-Likely Estimate 288mm Range +/- ��of the most likely estimate 140mm to 440mm
Table 2: Estimate of Total Primary Consolidation using Different Back-Analysis Methods
The comparison shows that the estimates of total primary consolidation, using the three different methods, are in close agreement with each other. The most-likely estimate has over-estimated the primary consolidation by approximately 100mm when compared to the back-analysis. The results from the back-analysis fall within one standard deviation of the most-likely value determined from the reliability analysis. The difference between the calculated and back-analysed value can therefore reasonably be assumed to be due to the natural variability of the Quaternary alluvium.
In addition to the comparison between total primary consolidation settlements, estimates of the percent consolidation at 250 days has also been examined. This time step was chosen as it represented the best-estimate for 90% consolidation, under ramp loading, using the actual construction rate. The percent consolidation for the Hyperbolic and Asaoka methods has been assessed using the following simple relationship:
����� ��������
Where St is the measured settlement at time, t and SU=100% is the total primary consolidation settlement determined by either the Hyperbolic or Asaoka methods. The results of this assessment are presented below.
!
!"#
$
$"#
%
%"#
! $ % & ' # ( ) * + $!
!"##$"%
"&#'(#)�*%
+),%
-
./%"'(#(*%+�-
123"45+$/,(6$+#(7"#0+8(9 !69:;9<
123"45+$/, =">?$#>@,-../-0-1. .23.4566788-94:-;58-4<8-/5394<-8=594>4$''00?8-/5394@-../-0-1.4>4&+00.+#A$(64/%A42(B+&>+$/8A#/+&(C(DE;%%
(4) Where St is the measured settlement at time, t and SU=100% is the total primary consolidation settlement determined by either the Hyperbolic or Asaoka methods. The results of this assessment are presented below.
Table 3: Estimate of Percent Consolidation after 250 days using Different Back-Analysis Methods
Method Settlement Plate SP-01-X and Vibrating Wire Piezometer P01
Settlement Plate SP-03-X andVibrating Wire Piezometer P02
Hyperbolic 97% 93% Asaoka 95% 90% Curve-Fit 99% 98% Vibrating Wire Piezometer 86% 80% Most-Likely Estimate (for actual construction rate) 90%
The most-likely estimate of percent consolidation (using the geotechnical model parameters given in Table 1) at 250 days was 90%. The four back-analysis methods presented in this paper are in general agreement with each other and the most-likely calculated estimate. The estimated percent consolidations range from 86% to 97% for SP-01-X/P01 and 80% to 98% for SP-03-X/P02. At both locations the curve fitting procedure provided the upper bound while the VWP was the lower bound.
Previous studies (Arulrajah, Nikraz and Bo, 2004) have suggested that the lower degree of consolidation can be attributed to the non-linearity of the stress-strain behaviour of the soil. It is also hypothesised that due to the VWPs being installed at the centre of the clay layer, the percent consolidation at this point may also be an under-estimate of the average degree of consolidation due to non-linear pore-water pressure distributions.
Using the results of the back-analysis, the key consolidation parameters; coefficient of vertical consolidation and compression ratio, were re-calculated so that they could be implemented in other areas within the project. Table 4 presents the original and back-analysed parameters.
Table 4: Comparison between design and back-analysed consolidation parameters
Value Coefficient of Consolidation, cv (m2/year) Compression Ratio, cc/(1+e0)
Design 5.5 0.24 to 0.32 Back-Analysed 5.5 to 9.8 0.18 to 0.22
Table 4 shows the back-analysed coefficient of consolidation to be equal or higher than the original estimate, while the compression ratio is lower. The coefficient of consolidation falls within the upper end of the expected range determined from the reliability analysis, while the compression ratio is on the lower end of the expected range. The difference between the estimated and back-analysed parameters highlights the need for either trial embankments or verification monitoring to confirm initial estimates.
The higher coefficient consolidation, and therefore the rate of strength gain, allowed the construction of the bunds to continue at a faster rate. The adoption of the revised parameters in the earthworks design for the project allowed the two week pause to be removed from most areas around the site. Construction monitoring in the form of settlement plates, VWPs and stability poles were used to verify the bund stability based on revised lift rate. No major instability was observed during construction of the bunds. In addition, the revised values also allowed the nominated preload/surcharge period to be re-assessed from the original six months nominated in the design documentation. A potential saving of 1 to 2 months in the surcharge period was estimated based on the adoption of the revised parameters.

THE CONSOLIDATION BEHAVIOUR OF ALLUVIAL SOFT CLAY IN GLADSTONE, CENTRAL QUEENSLAND KEMP et al.
Australian Geomechanics Vol 48 No 1 March 2013 147
Conclusions A staged loading design was adopted for the construction of the reclamation bunds at WICET. These bunds were constructed over soft, Quaternary Alluvium and the staged loading technique was used to control failure of the soft soil foundation and protect adjacent permanent works. The restriction limited construction to a maximum height of 0.5 m per week with a two week pause period after every 1 m lift. Through the construction of a fully monitored trial bund on this project, the soft soil parameters were able to be revised (via back-analysis methods) and the lift rate restrictions were able to be relaxed, including the removal of the two week pause period after every 1 m lift. The removal of the pause period alone had the potential to double the initial construction rate (subject to equipment production rates), resulting in a significant time and cost savings to the project. The increase construction verification instrumentation (VWPs and Settlements) installed elsewhere on the project also allowed the back-analysis from the trial bund to be confidently applied.
Elsewhere on the site where preload or surcharge times were just as important as the construction rate, the trial bund data, in particular the long-term settlement monitoring, has allowed the expected hold periods to be revised down from 6 months to 4 to 5 months, allowing for significant schedule savings and/or delay mitigation
The trial bund and subsequent instrumentation and monitoring programme provided a number of clear benefits for the WICET project’s schedule, in particular for the delivery of the reclamation bunds. The use of a trial bund, supported by verification monitoring, allowed less conservative parameters to be adopted whilst still maintaining an adequate margin of safety.
This study has shown that even with a reasonable amount of good quality, in situ and laboratory testing, the behaviour of soft soils under bund loading can be difficult to predict. Reliability analyses are a useful tool in understanding the variability of each parameter and its effect on the estimation of the magnitude and rate of primary consolidation. However, to account for this variability it is recommended that a monitoring and back-analysis programme be adopted to provide an increased level of certainty and control of the bund performance. Field observations made using instrumentation data often provide the best insight into soft soil behaviour and well established analytical and empirical relationships exist that allow back-analysis of key geotechnical parameters using monitoring data.
5 ACKNOWLEDGEMENTS The authors thank WICET, Worley Parsons, Abigroup-Golding Joint Venture for providing technical assistance and permission in completing this paper. The authors would like to personally thank Dr Bindu Madhava for his support and advice throughout construction and for his review comments. The work presented in this paper was carried out while the authors were supported by Wiggins Island Coal Export Terminal team. Their support and encouragement is greatly appreciated.
6 REFERENCES Arulrajah, A, Nikraz, H and Bo, M.W (2004). Observational method of assessing improvement of marine clay. Ground
Improvement, No. 4, pp151-169 Asaoka A. (1978). Observational procedure of settlement prediction. Soils and Foundations, 18, No. 4, 87–101. AURECON-HATCH QLD, Wiggins Island Coal Terminal – Geotechnical Investigation and Foundation Assessment
Report. 2009 November, Australia. BUTLER AND PARTNERS, Geotechnical Investigation: Onshore Geotechnical Survey, Wiggins Island Coal
Terminal, Gladstone. 2009 May, Australia. DOUGLAS PARTNERS, Report on Stage 2 Onshore Geotechnical Investigation, Wiggins Island Coal Terminal,
Gladstone. 2007 April, Australia. DOUGLAS PARTNERS, Report on Preliminary Onshore Geotechnical and Acid Sulphate Soil Evaluation, Wiggins
Island Coal Terminal, Gladstone. 2006 June, Australia. Duncan, J.M. (1999). Factors of Safety and Reliability in Geotechnical Engineering, The Seventh Spencer J Buchanan
Lecture, College Station, Texas, USA B. Kok, and R. Gong, Study on Consolidation of Estuarine Clay in Northern Queensland. International Symposium on
Geotechnical Engineering, Ground Improvement, and Geosynthetics for Sustainable Mitigation and Adaption to Climate Change including Global Warming, 2009 December, AIT Bangkok, Thailand.
Tan S.-A. (1995). Validation of hyperbolic method for settlement in clays with vertical drains. Soils and Foundations, 35, No. 1, 101–113.
Terzaghi, K., Peck, R.B. (1967). Soil Mechanics in Engineering Practice, 2nd Edition, John Wiley and Sons, New York, USA.
Terzaghi, K., Peck, R.B., Mesri, G. (1996). Soil Mechanics in Engineering Practice, 3rd Edition, John Wiley and Sons, New York, USA.