the connecticut personal income tax - c g a tax panel/20151117... · the connecticut personal...
TRANSCRIPT
`
The Connecticut Personal Income Tax
Joseph Cordes, Ph.D. Professor of Economics, Public Policy and Public Administration,
and International Affairs
Trachtenberg School of Public Policy and Public Administration The George Washington University
Draft for Tax Panel Discussion
November 17, 2015 The views expressed here are those of the author and not of the George Washington University
1
Table of Contents List of Tables and Figures 2 Executive Summary 3
I. Introduction 8 . II: Main Features of the Connecticut Income Tax 8
II.1Base of the Connecticut Income Tax 8 II.2 Exemptions and Tax Rates 10 II.3 Tax Credits 11
. III: Revenue Adequacy 13 III.1 Breadth and Size of Connecticut AGE 13 III.2 Long-Term Trends in Connecticut AG 13 III.3 Volatility in Income Tax Revenues 13 IV: Fairness in Distribution of the Tax Burden 17 IV.1 Horizontal Equity 17 IV.2 Vertical Equity 20 IV.3 Earned Income Tax Credit 24 V: Administration and Collection Costs. 27 V.1 Conforming to Federal Taxable Income Instead of AGI 31 V.2 Adopting a Flat Tax 32 V.3 Exemption Phase-Outs and Low Tax Rate Recapture 34 VI: Economic Incentives 36 VI.1 Incentives to Work and to Save 38 VI.2 Work Incentives of the EITC 38 VI.2 Tax Treatment of Capital Gains 38 VI.3 Tax Competitiveness with Other States 39 VII: Conclusion 41 VIII. References 42
IX. Endnotes
2
List of Tables Table 1: Federal Adjusted Gross Income and Connecticut Adjusted Gross Income: Tax Year 2013: 9 Table 2: Connecticut PIT Tax Brackets: Effective 2015: 11 Table 3: Tax Credits for Taxes Paid to Jurisdictions Other
Than Connecticut and Property Tax Credits 12
Table 4: Connecticut Subtractions from AGI 18 Table 5: Connecticut Personal Income Tax Expenditures 19 Table 6: Average Effective Tax Rates by Filing Class 21 Table 7: Comparing the Progressivity of the Connecticut Income Tax 23 Table 8: Conformity of State Personal Income Tax Bases to Federal Income Tax Base 29 Table 9: State Individual Income Tax Structures 40 Table 10: Comparative Personal Income Tax Burdens: 2014 40 List of Figures Figure 1; Trends in Connecticut Personal Income and in Connecticut AGI 15 Figure 2: Net Capital Gains as a Share of AGI: 2007 and 2013: 16 Figure 3: Capital Gains and Revenue Forecast Volatility 16 Figure 4: Progressivity of the Connecticut Income Tax 23 Figure 5: Share of Family Income Paid in Connecticut Personal Income Tax Including EITC 26 Figure 6: Difference between Connecticut Federal AGI And Connecticut Federal Taxable Income 30 Figure 7: Effect of Exemption Phase-Outs and Low Tax Rate Recapture 35

3
Executive Summary Connecticut is a relative latecomer to the ranks of states with a personal income tax. Since its enactment in 1991, however, the Connecticut PIT has steadily grown in importance as a source of state revenue to the point where Connecticut ranks 2nd among the states in its reliance on the PIT as a source of state revenue. This study has evaluated the Connecticut PIT along four dimensions that are frequently used to evaluate the performance of particular taxes.
1) The adequacy of the CPIT as a source of state tax revenue, where adequacy is defined not only in terms of the size of the personal income tax base relative to Connecticut’s financing needs, but also in terms of the buoyancy, or ability of the CPIT to meet changing financing needs over time.
2) The fairness of the CPIT, where fairness is defined in terms of the distribution of the CPIT tax burden among Connecticut citizens of varying abilities to pay tax.
3) The collectability of the CPIT defined in terms of the degree of complexity that confronts both the government and taxpayers in imposing, collecting, and payment of taxes.
4) The economic efficiency and competiveness of the CPIT defined in terms of the incentives created by the tax for workers, business owners, and investors, as well as the tax burden of the CPIT as compared with the tax burdens nationally, and in neighboring states.
Summary Assessment Overall, the Connecticut PIT performs reasonably well along each of the above dimensions. Revenue Adequacy The Connecticut PIT is imposed on a fairly broad base of Connecticut income, which has the potential to grow apace with Connecticut personal income over time (Wallace, 2015); and estimates of the PIT’s buoyancy suggest that it has been among the most buoyant of the state income taxes. There are, however, some potential limitations on the ability to rely on a growing Connecticut PIT base: (1) aging of the Connecticut population combined with exclusion of all or a portion of Social Security benefits and 100% of military retirement benefits from Connecticut AGI; (2) the fact that recent tax increases have reduced the “competitive space” between Connecticut tax rates and the Connecticut income tax burden and those of its neighboring states; and (3) the fact that a significant portion of earnings of Connecticut residents is earned in and taxed by jurisdictions other than Connecticut.
4
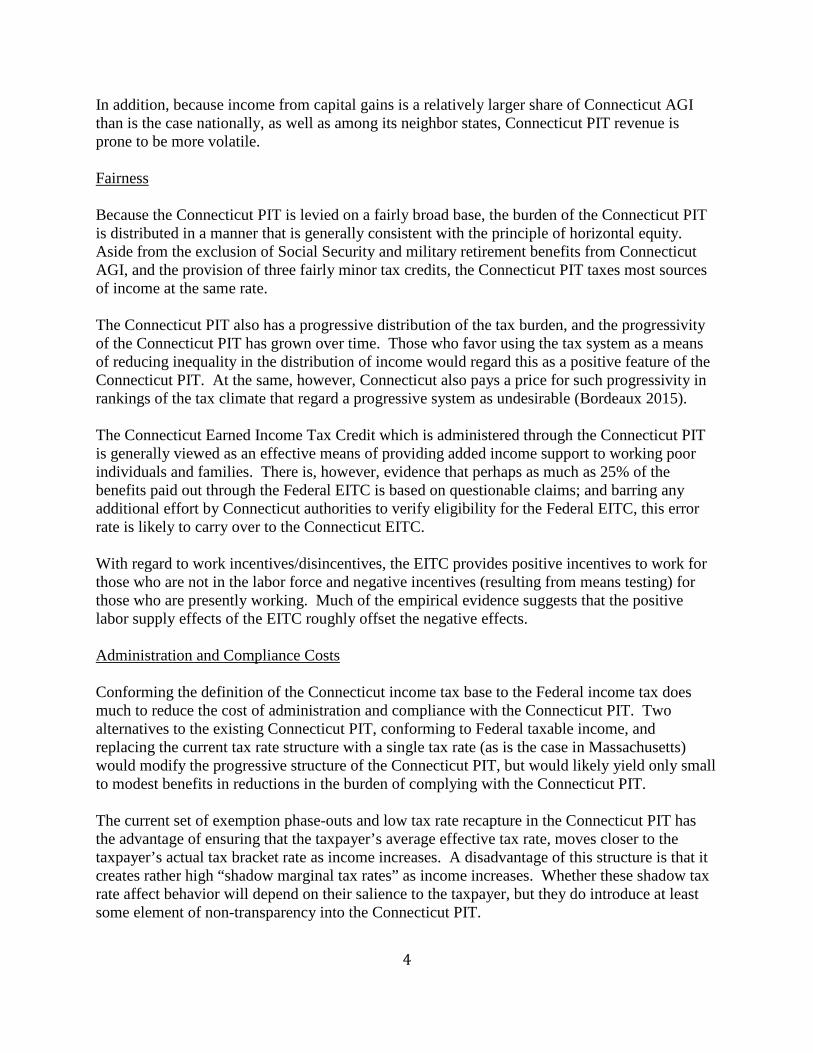
In addition, because income from capital gains is a relatively larger share of Connecticut AGI than is the case nationally, as well as among its neighbor states, Connecticut PIT revenue is prone to be more volatile. Fairness Because the Connecticut PIT is levied on a fairly broad base, the burden of the Connecticut PIT is distributed in a manner that is generally consistent with the principle of horizontal equity. Aside from the exclusion of Social Security and military retirement benefits from Connecticut AGI, and the provision of three fairly minor tax credits, the Connecticut PIT taxes most sources of income at the same rate. The Connecticut PIT also has a progressive distribution of the tax burden, and the progressivity of the Connecticut PIT has grown over time. Those who favor using the tax system as a means of reducing inequality in the distribution of income would regard this as a positive feature of the Connecticut PIT. At the same, however, Connecticut also pays a price for such progressivity in rankings of the tax climate that regard a progressive system as undesirable (Bordeaux 2015). The Connecticut Earned Income Tax Credit which is administered through the Connecticut PIT is generally viewed as an effective means of providing added income support to working poor individuals and families. There is, however, evidence that perhaps as much as 25% of the benefits paid out through the Federal EITC is based on questionable claims; and barring any additional effort by Connecticut authorities to verify eligibility for the Federal EITC, this error rate is likely to carry over to the Connecticut EITC. With regard to work incentives/disincentives, the EITC provides positive incentives to work for those who are not in the labor force and negative incentives (resulting from means testing) for those who are presently working. Much of the empirical evidence suggests that the positive labor supply effects of the EITC roughly offset the negative effects. Administration and Compliance Costs Conforming the definition of the Connecticut income tax base to the Federal income tax does much to reduce the cost of administration and compliance with the Connecticut PIT. Two alternatives to the existing Connecticut PIT, conforming to Federal taxable income, and replacing the current tax rate structure with a single tax rate (as is the case in Massachusetts) would modify the progressive structure of the Connecticut PIT, but would likely yield only small to modest benefits in reductions in the burden of complying with the Connecticut PIT. The current set of exemption phase-outs and low tax rate recapture in the Connecticut PIT has the advantage of ensuring that the taxpayer’s average effective tax rate, moves closer to the taxpayer’s actual tax bracket rate as income increases. A disadvantage of this structure is that it creates rather high “shadow marginal tax rates” as income increases. Whether these shadow tax rate affect behavior will depend on their salience to the taxpayer, but they do introduce at least some element of non-transparency into the Connecticut PIT.

5
Economic Effects and Competitiveness Like any other state personal income tax, the Connecticut PIT adds to the disincentives to work and to save resulting from the Federal income tax. The best empirical evidence on the magnitude of such disincentives, however, suggests that the impact of taxing income at the state level is likely to be small in the case of work incentives, and uncertain in the case of saving incentives. Like all of its neighbors, except for Massachusetts (which actually taxes capital gains at higher rates than ordinary income) income from capital gains is fully included in taxable income, and is taxed at the same rate as other income. Some stakeholders have suggested that consideration be given to taxing capital gains at lower rates than apply to other income, as is done under the Federal income tax. While there is agreement that taxing capital gains at preferential rates favors the receipt of income that takes the form of capital gains, there is considerably less agreement, and no strong evidence that lower tax rates on capital gains significantly encourage risk-taking and entrepreneurship As for tax competitiveness, by a variety of measures, Connecticut’s PIT is generally competitive with that of its neighbors. Recent changes which have increased Connecticut tax rates, however, may have weakened Connecticut’s competitive position and may pose constraints to future efforts to raising Connecticut PIT revenue by raising tax rates. Possible Options for Change The report also identifies and discusses a number of policy options identified in the course of the analysis. 1. Dealing with Income Tax Volatility Like other states in which income from capital gains is an important component of the personal income tax base, the Connecticut PIT is exposed to significant volatility especially during periods of significant economic downturn. There is no “easy fix” for this problem within the PIT itself. However, the presence of such volatility points to the need for maintaining and strengthening the existing Connecticut budget stabilization fund. 2. Dealing with an Aging Population of Taxpayers An aging population in and of itself imposes a constraint on future growth in the tax base. The revenue impact of this constraint can be further exacerbated if states grant preferential tax treatment to income received by senior citizens. Unlike some states, Connecticut does not contain provisions that, for example, exempt entire portions of income from individual income taxation. However, Connecticut does make adjustments in computing Connecticut AGI that exempt Social Security benefits received by some taxpayers, and military retirement benefits from taxation. Presently the revenue effects of these exemptions are relatively small. However, as the Connecticut population ages, these provisions, especially the Social Security exemption,

6
could become more significant; and consideration should be given to treating these forms of income in the same way as they are treated under the federal income tax. 3. Substitute Federal Taxable Income for Federal AGI as the Starting Point for Computing
Connecticut AGI While “full conformity” by using Federal Taxable Income as the starting point for determining Connecticut taxable income might seem like a means for further simplifying compliance with the Connecticut PIT, the disadvantages of doing so would seem to outweigh the advantages. Most notably, using Federal taxable income would narrow the base of the Connecticut PIT, requiring the enactment of higher statutory tax bracket rates in order to raise the same amount of revenue as from taxing a broader base linked to Federal AGI. Any benefits from less time required to compute Connecticut tax liability would be small to nonexistent, since it is likely that additions to and subtractions from Federal taxable income would still be necessary in order to arrive at Connecticut AGI. 4. Replace the Current Connecticut Income Tax With a Flat Tax Tax experts agree that while a single-rate income tax would have a simpler structure than an income tax with multiple rates, the practical saving in compliance burdens from having a single rate would be quite small. Any complexity introduced by multiple tax rates can be dramatically reduced by providing clear and easy to use tax “look-up” tables and tax calculators, both of which are provided by the DRS. The main effect of moving to a flat tax (assuming equal revenue yield) would be lower the marginal tax rate faced by higher income taxpayers, while raising it for lower income taxpayers. Estimates presented below suggest that the effect of such changes would be to reduce the current progressivity of the Connecticut PIT by roughly ½. 5. Retain the Connecticut EITC and Restore the Percentage of Federal EITC to 30% To the extent that Connecticut citizens wish to supplement the efforts of the federal government by providing income support to working poor Connecticut residents, the state EITC, despite its error rate, is still the most proven effective means of delivering the benefit. These considerations would support retaining the EITC in its present form --- state budgetary circumstances permitting – and returning the percentage supplement to the Federal EITC to 30%. 6. Tax Capital Gains at Preferential Rates In light of the uncertain evidence about the effects of preferentially taxing capital gains on risk-taking and entrepreneurship, the case for taxing capital gains at a lower rate under the Connecticut PIT is not a strong one. This conclusion is further buttressed by the fact that none of Connecticut’s neighboring states tax capital gains preferentially. Moreover, since there is no compelling evidence that cutting the tax rate on capital gains is “self-financing,” a capital gains cut would need to be made up by increasing tax rates applied to other sources of income.

7
Maintain the Competitiveness of Connecticut’s Income Tax with Those of Its Neighbors Connecticut’s PIT is presently broadly competitive with the PIT’s of its neighboring states. One of the best ways of maintaining this position in terms of tax rates is to strive to continue to tax a relatively broad income base, at relatively low rates.
8
I. Introduction The state of Connecticut is a relative latecomer among the 50 states in adopting a comprehensive personal income tax as a revenue source. However, since its enactment in 1991, the Connecticut Personal Income Tax (CPIT) has grown to become the most important source of Connecticut own-tax revenue; and Connecticut now ranks 1st among the states in the share of revenue from own sources that is raised from the individual income tax (PIT).
After summarizing the principle features of the CPIT, this report examines its performance along four dimensions that are commonly used to evaluate the performance of taxes and other revenue sources. Specifically, this report examines:
1) The adequacy of the CPIT as a source of state tax revenue, where adequacy is defined not only in terms of the size of the personal income tax base relative to Connecticut’s financing needs, but also in terms of the buoyancy, or ability of the CPIT to meet changing financing needs over time.
2) The fairness of the CPIT, where fairness is defined in terms of the distribution of the
CPIT tax burden among Connecticut citizens of varying abilities to pay tax. 3) The economic efficiency and competiveness of the CPIT defined in terms of the
incentives created by the tax for workers, business owners, and investors, as well as the tax burden of the CPIT as compared with the tax burdens nationally, and in neighboring states.
4) The costs of administration of the CPIT defined in terms of the degree of complexity
that confronts both the government and taxpayers in imposing, collecting, and payment of taxes.
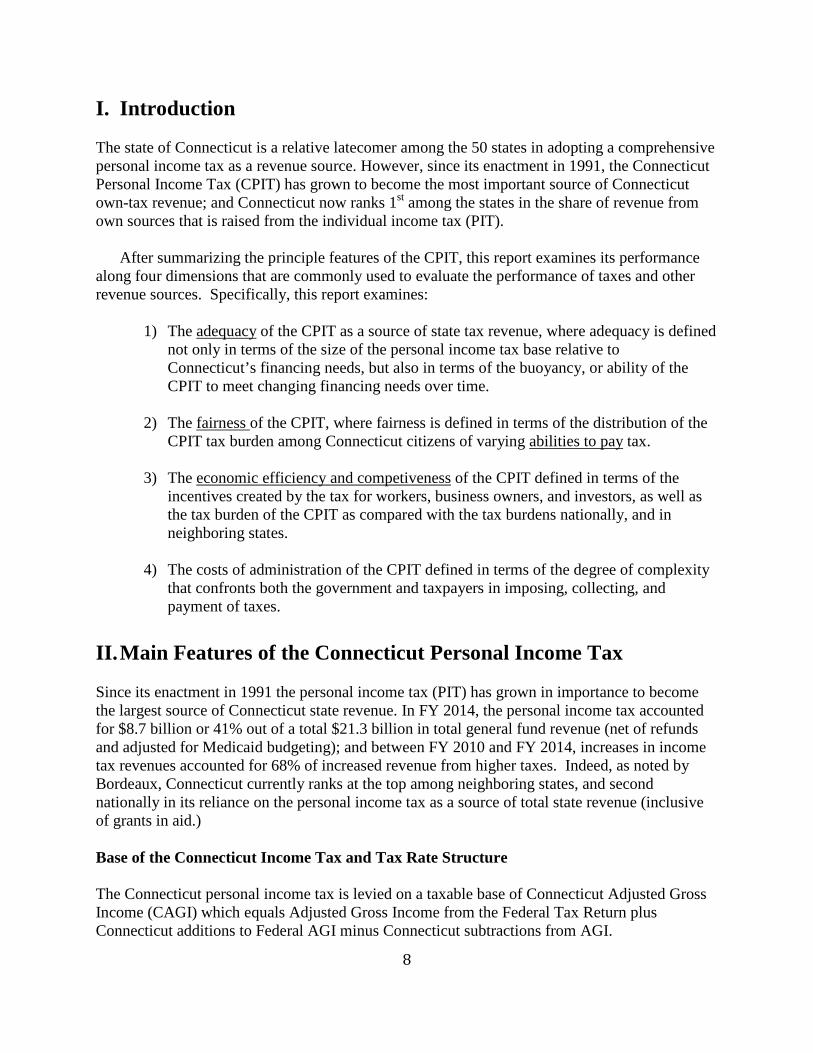
II. Main Features of the Connecticut Personal Income Tax Since its enactment in 1991 the personal income tax (PIT) has grown in importance to become the largest source of Connecticut state revenue. In FY 2014, the personal income tax accounted for $8.7 billion or 41% out of a total $21.3 billion in total general fund revenue (net of refunds and adjusted for Medicaid budgeting); and between FY 2010 and FY 2014, increases in income tax revenues accounted for 68% of increased revenue from higher taxes. Indeed, as noted by Bordeaux, Connecticut currently ranks at the top among neighboring states, and second nationally in its reliance on the personal income tax as a source of total state revenue (inclusive of grants in aid.) Base of the Connecticut Income Tax and Tax Rate Structure The Connecticut personal income tax is levied on a taxable base of Connecticut Adjusted Gross Income (CAGI) which equals Adjusted Gross Income from the Federal Tax Return plus Connecticut additions to Federal AGI minus Connecticut subtractions from AGI.
9
Table 1: Federal Adjusted Gross Income and Connecticut Adjusted Gross Income Tax Year 2013
No.
Returns
Federal Agi Additions To Federal Agi
Subtract From Federal Agi
Connecticut AGI
Fed AGI-CtAGI
Diff. per Return
Connecticut AGI (1) (2) (3) (4) (5) (6) (6)÷(1) Less than $50,000 844,294 $20,109,219,611 $42,296,405 $899,081,076 $19,252,434,940 ($856,784,671) ($1,015) $50,000 to $100,000 384,210 $28,688,808,609 $64,392,637 $1,262,538,733 $27,490,662,513 ($1,198,146,096) ($3,118) $100,000 to $250,000 273,655 $41,068,365,698 $140,427,105 $927,653,502 $40,281,139,301 ($787,226,397) ($2,877) $250,000 to $500,000 47,075 $16,022,936,650 $125,253,681 $228,771,046 $15,919,419,285 ($103,517,365) ($2,199) $500,000 and over 25,621 $47,472,651,506 $617,503,879 $519,392,926 $47,570,762,459 $98,110,953 $3,829 Total 1,574,855 $153,361,982,074 $989,873,707 $3,837,437,283 $150,514,418,498 ($2,847,563,576) ($1,808)

10
• Additions include items such as: interest and dividends from obligations (such as bonds) from other states or subdivisions of other states unless federal law exempts them from state income taxes; the taxable amount of lump-sum distributions from qualified plans not included in Federal AGI; and loss on sale of Connecticut state and local government bonds.
• Subtractions include items such as: (1) income included in adjusted gross income that federal law exempts from state taxation, (2) refunds or credits for overpayments of income tax, (3) exempt dividends paid by a regulated investment company; (3) all or part of social security income received by taxpayers, depending on their federal AGI; (4) tier one and tier two railroad retirement benefits; and beginning tax year 2015, 100% of military retirement pay.
As may be seen from Table 1, the effect of Connecticut adjustments to income is to reduce
the base of income that is subject to the CPIT relative to Federal AGI. For taxpayers with Federal AGI less than $500,000 the reduction in Federal AGI that is subject Connecticut PIT ranges from a per-return amount of just over $1,000 to just under $2,200. For taxpayers with Federal AGI greater than $500,000 the net impact of Connecticut adjustments to Federal AGI is to increase the amount of income that is subject to tax by just over $3,800 per return.
Special rules are established for determining whether the income of the following taxpayer types is derived from sources within the state and how income gains, losses, and deductions are allocated: (1) a non-resident or a part-year resident, (2) a partner's distributive share of partnership income, (3) a shareholder's pro rata share of S corporation or limited liability company (PA 93-267, effective 10/1/93) income and (3) a beneficiary's share of trust or estate income.
The tax imposed on income earned by resident and nonresident trusts and estates is similar to
the one applied to individuals except that the trusts and estates do not receive the exemptions and credits that individuals receive. The tax must be paid by the fiduciary. Special rules are established for determining what income is derived from sources within the state for nonresident and part-year resident estates, trusts and beneficiaries and how income, gains, losses, and deductions are allocated.
Exemptions and Tax Rates The tax is levied on Connecticut AGI above basic personal exemption levels that vary according to taxpayer status and which phase out at higher income levels. Income below the personal exemption threshold is excluded from the tax base based on the rationale that income needed for bare sustenance should be free from tax.
Table 2 displays the tax rates applied to taxable income for 2015 based on the budget bill passed in June 2015. The bill increased the marginal income tax rate for individuals with annual taxable incomes over $250,000 (or $500,000 for couples) from 6.7% to 6.9%. It also added a 6.99% marginal tax bracket applicable to individuals with annual taxable incomes over $500,000 (or $1,000,000 for couples).

11
Table 2: Connecticut Personal Income Tax Brackets: 2015 Single Filers Joint Filers
Taxable Income Taxable Income
From To Rate From To Rate $0 $10,000 3.0% $0 $20,000 3.0%
$10,000 $50,000 5.0% $20,000 $100,000 5.0% $50,000 $100,000 5.5% $100,000 $200,000 5.5%
$100,000 $200,000 6.0% $200,000 $400,000 6.0% $200,000 $250,000 6.5% $400,000 $500,000 6.5% $250,000 $500,000 6.9% $500,000 $1,000,000 6.9% $500,000 & Over 6.99% $1,000,000 & Over 6.99%
Personal exemptions ranging from $12,000 to $24,000, as well as personal tax credits ranging from 1% to 75% of a taxpayer’s Connecticut tax liability are available to taxpayers, depending on factors such as filing status and Connecticut AGI. Both the exemptions and tax credits are phased out at higher income levels. In addition, lower tax rates are phased out or “recaptured” for high income earners. Minimum Tax
In some cases taxpayers are required to pay the higher of their liability under the state Personal Income Tax or the Connecticut Minimum Tax. The Connecticut Minimum Tax is the lesser amount of 19.0% of adjusted federal tentative minimum tax or 5.0% of adjusted federal alternative minimum taxable income.
Tax Credits Connecticut taxpayers are eligible to claim a number of tax credits which further reduce their actual tax liability. These include: (1) a personal tax credit that all taxpayers up to certain income levels can claim; (2) a Connecticut earned income tax credit for lower income taxpayers based on the federal earned income tax credit; (3) a credit that offsets income taxes paid to other states and jurisdictions; and (4) tax credits for property taxes paid to municipalities and special taxing districts. Three additional credits are available for the following business activities: an angel investor tax credit for taxpayers who invest in eligible start-up companies; a tax credit for investors in Insurance Reinvestment Funds; and tax credit for businesses that create new jobs and hire certain Connecticut residents to fill them.i
Table 3 below presents information from 2013 on the two largest tax credits (excluding the earned income tax credit which is discussed more fully below). Tax credits for income taxes paid to other jurisdictions reduce Connecticut income tax liability by 16% overall, with the bulk of the credits for taxes paid to other jurisdictions accruing to taxpayers with Connecticut AGI in excess of $500,000. As noted in the report on Connecticut’s Fiscal Architecture (Wallace, 2015), concern

12
has been expressed about the significant portion of the income earned by Connecticut residents that is effectively excluded from the Connecticut income tax base.

13
Table 3: Tax Credits for Taxes Paid to Jurisdictions Other Than Connecticut and Property Tax Credit: 2013
No. Returns Ct Agi Income Tax
Credit For Tax Paid To Jur. Other
Than CT. Property Tax Credit-Count
Credit For Property Tax Ct Income Tax
CT-1040 (1) (2) (3) (4) (5) (6) (7)
Less than $50,000 844,294 $19,252,434,940 $319,196,821 $9,962,958 381,792 $97,720,315 $244,164,096
$50,000 to $100,000 384,210 $27,490,662,513 $1,163,282,566 $48,853,129 328,680 $86,553,290 $1,021,143,456
$100,000 to $250,000 273,655 $40,281,139,301 $2,073,871,820 $169,139,755 162,888 $24,617,983 $1,877,717,554
$250,000 to $500,000 47,075 $15,919,419,285 $910,260,534 $165,514,354 $0 $0 $743,179,809
$500,000 and over 25,621 $47,570,762,459 $3,173,242,622 $826,514,393 $0 $0 $2,343,626,938
Total 1,574,855 $150,514,418,498 $7,639,854,363 $1,219,984,589 873,360 $208,891,588 $6,229,831,853

14
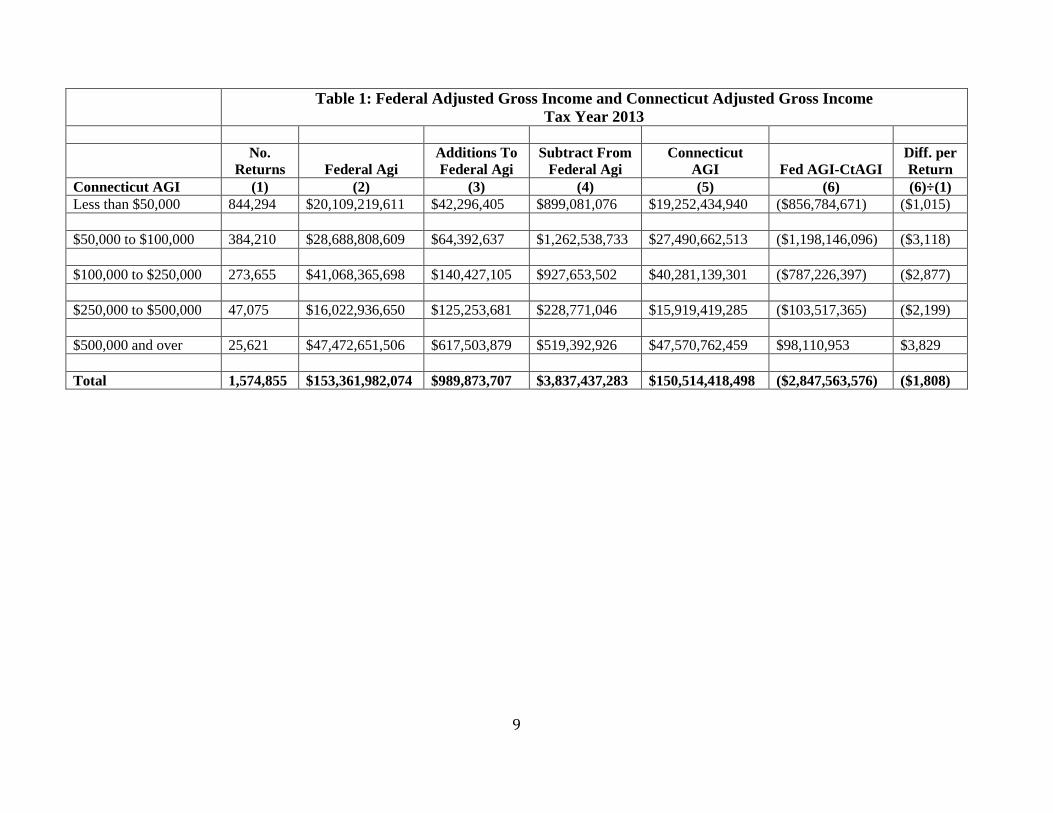
III. Revenue Adequacy This section discusses the extent to which the personal income tax is adequate to meet the changing needs for state revenue. We focus on three dimensions of adequacy: (1) breadth and size of the tax base; (2) long term trends in the tax base over time; and (3) the volatility of the tax base from year to year. Breadth and Size of CT AGI Connecticut AGI is defined as equal to Federal AGI + Connecticut Additions - Connecticut Subtractions. The net impact of the Connecticut adjustments has been to reduce total Connecticut AGI relative to Federal AGI so that in 2013 Connecticut AGI equaled 98% of Federal AGI. This relationship between Connecticut and Federal AGI has remained quite stable over the past 10 years. Since Connecticut ranks first among the states in personal income per capita, the above numbers imply that CT AGI provides a broad base for raising revenue. This optimistic assessment should, however, be tempered by the fact that, as indicated by the magnitude of credits for taxes paid to other jurisdictions, a significant share of income received by Connecticut taxpayers is subject to tax in other jurisdictions. Long Term Trends in Connecticut AGI Figure 1 plots the trends in both Connecticut Personal Income and Connecticut AGI since 1992. Two features of the behavior of Connecticut AGI are noteworthy. First, over the long-run, Connecticut AGI has grown apace with Connecticut Personal Income. Indeed, estimates of the long-run elasticity of CT AGI with respect to CT Personal Income yields a point estimate of 1.15, with a standard error of ± .08, indicating that CT AGI has grown slightly more proportionately than CT PI over the period from 1992 to 2013. Second, CT AGI has exhibited a fair degree of volatility from year to year (see below). The above result implies that over the long run, one can expect the base of the Connecticut income tax to grow with Connecticut personal income. This assessment, however, needs to be balanced by several trends identified in Wallace (2015). These include: (1) slower income growth due to an aging population; (2) reduced tax handles for the income tax due to growth in the service sectors with lower wages; and (3) increased difference in ability to pay between high and low earners leading to more resistance to tax increases at the top. These trends may, however, be offset by growth in income due to potential growth in the knowledge sectors of the Connecticut economy. Volatility in Income Tax Revenues Reliance on the personal income tax as the primary source of state tax revenue is a two-edged sword. On one hand, revenue from the income can keep pace with growing needs for financing public spending. At the same, income tax revenues are also more sensitive to economic fluctuations.

15
This latter feature of the Connecticut income tax is depicted in Figure 1. The line in Figure 1 that is labeled “CT PI” shows that, while Connecticut Personal Income has grown fairly steadily over time, there also have been long-run fluctuations about its longer run trend of growth. The same is true for the line labeled “CT AGI” which exhibits even greater fluctuations about its trend. The line labeled “CT AGI as % of AGI” charts the behavior of the Connecticut AGI as a percent of Personal Income, and indicates that Connecticut AGI is more cyclically sensitive than is Personal Income per Capita.
Especially noteworthy are both the movements of CT AGI on the upside, when Connecticut Personal Income is growing, and on the downside, when Connecticut Personal Income per capita is contracting. This cyclical sensitivity creates a “boom and bust” cycle for Connecticut personal income tax revenue in which income tax revenue growth is strong when the Connecticut economy is doing well, accompanied by a marked income tax revenue decline when the Connecticut economy falters.
Revenue Buoyancy
Another concept relevant to assessing the volatility of the Connecticut personal income tax
is that of revenue buoyancy. Revenue buoyancy measures the relationship between changes in individual income and individual tax revenue including the effects of changes in the tax structure over time.
The revenue buoyancy of the Connecticut income tax is estimated using an approach
described in Bruce, Tuttle and Fox (2006). Using data on Connecticut income tax revenue, and Connecticut personal income, I use data from 1992-2013 to estimate a regression of the form:
(1) 𝑅𝑅𝑡𝑡 = 𝛽𝛽0 + 𝛽𝛽1𝑌𝑌𝑡𝑡 + 𝛽𝛽2∆𝑌𝑌𝑡𝑡−1 + 𝜀𝜀𝑡𝑡
where Rt and Yt are the log of real income, tax revenue, and real personal income, respectively. The point estimate of the coefficient �̂�𝛽1 equals the long-run elasticity of revenue with respect to income, and equals 2.37 with a standard error of ± .19. The interpretation is that over time, an increase in Connecticut personal income of $1 has yielded an additional $2.37 in revenue. Conversely a drop in Connecticut personal income of $1 has yielded a drop in revenue of $2.37. The Role of Capital Gains Income The estimated income tax revenue elasticity for Connecticut is higher than the average estimated long-run income elasticity of 1.83 reported in the Bruce, et. al. paper. An important reason for the difference, as well as for the greater volatility of Connecticut AGI compared with Connecticut PI, is that capital gains income is a relatively large component of the Connecticut income tax base, as is illustrated in Figure 2. Figure 3, which is reproduced from Pellowski (2015) shows the importance of capital gains income as a source of error in reconciling projected vs. actual tax revenue.
16
0.00%
10.00%
20.00%
30.00%
40.00%
50.00%
60.00%
70.00%
80.00%
90.00%
$0
$50,000,000
$100,000,000
$150,000,000
$200,000,000
$250,000,000
1990 1995 2000 2005 2010 2015Year
CT A
GI a
s %
of o
f CT
PI
$ 10
00's
Figure 1: Trends in Connecticut Personal
Income and in Connecticut AGI
CT PI Ct. AGI CtAGI % of AGI Linear (CT PI) Linear (Ct. AGI)

17
Figure 3: Capital Gains and Revenue Forecast Volatility
8.9%
10.7%
13.3% 13.5%
4.7%
6.7% 7.7%
9.4%
0.0%
2.0%
4.0%
6.0%
8.0%
10.0%
12.0%
14.0%
16.0%
U.S. Cal Conn NY
CG a
s Pe
rcen
tage
of A
GI
Figure 2: Net Capital Gains as a Share of AGI
2007
2013
93.0% 40% 100%
27.7% 30%
80% 40.0%
21.9% 22.8% 46.0% 21.9% 60%
20% 19.0% 19.4%
17.9% 13.0% 40%
-9.0% 10% 0.3% 20%
-10.0% -20% -10% -6.6%
-40%
-20% -14.7% Estimates & Final -60%
-21.3%
-30% -23.5% -52.0%
'01 '02
CT Capital Gains -80%
'03 '04 '07 -27.3%
'08 '09 Fiscal Year
'10 '11 '12 '13 '14
Note: Capital Gains are for the immediately preceding calendar year.

18
IV. Fairness in Distribution of the Tax Burden A critical element in assessing the performance of a tax is whether it distributes the tax burden fairly among taxpayers. In the case of the personal income tax, there are two dimensions of fairness that are relevant. The principle of horizontal equity applies to the fair treatment of taxpayers with the same ability to pay. The principle of vertical equity applies to taxpayers with unequal abilities to pay. Horizontal Equity of the Connecticut Personal Income Tax Horizontal equity requires that taxpayers with the same ability to pay tax should face the same tax burden. Ability-to-pay is normally defined in terms of income, and in principle should be based on the broadest possible definition of income. In applying the principle in practice, it is recognized that certain items of income may be excluded from the tax base for administrative reasons so that the benchmark for assessing horizontal equity is typically a measure such as Federal Adjusted Gross Income which is adjusted upward to include items such as employer provided fringe benefits. In the case of state income taxes, many of which use Federal Adjusted Gross Income as a starting point, it is the case that certain sources of horizontal inequity, such as the exclusion of tax-exempt fringe benefits from taxation, are “inherited” from the Federal definition of income, and can be taken as a given for purposes of this analysis. Aside from the exclusion of certain items of income in determining Federal AGI, Federal AGI is itself a reasonably broad base because it includes items such as Federal itemized deductions that are often described as “tax loopholes” in discussions of federal income tax base broadening. The question then becomes whether the exclusion of certain additional items from the definition of Connecticut AGI, violates the principle of horizontal inequity. Aside from the exclusion of Connecticut income tax refunds from Federal AGI, the certain subtractions from Federal AGI represents items of income that should, in principle, be fully taxable but which instead are either only partially taxable, or are exempt from Connecticut income taxation: These items, which are listed below in Tables 4 and 5 are classified as tax expenditures in the 2014 Connecticut Tax Expenditure Report.
Among the exclusions from Connecticut AGI, the most significant is the Social Security Benefit Adjustment. In computing Federal AGI, single taxpayers with income exceeding $34,000, and married taxpayers filing jointly with income exceeding $44,000 are required to include up to 85% of their Social Security Benefits in Federal AGI. Depending on the taxpayer’s AGI, either 100% or 75% of the amount of Social Security benefits included in Federal AGI is subtracted from Federal AGI in arriving at Connecticut AGI so that the portion of Social Security benefits that are taxed at the federal level is either entirely or partially excluded from Connecticut Income Taxation.2
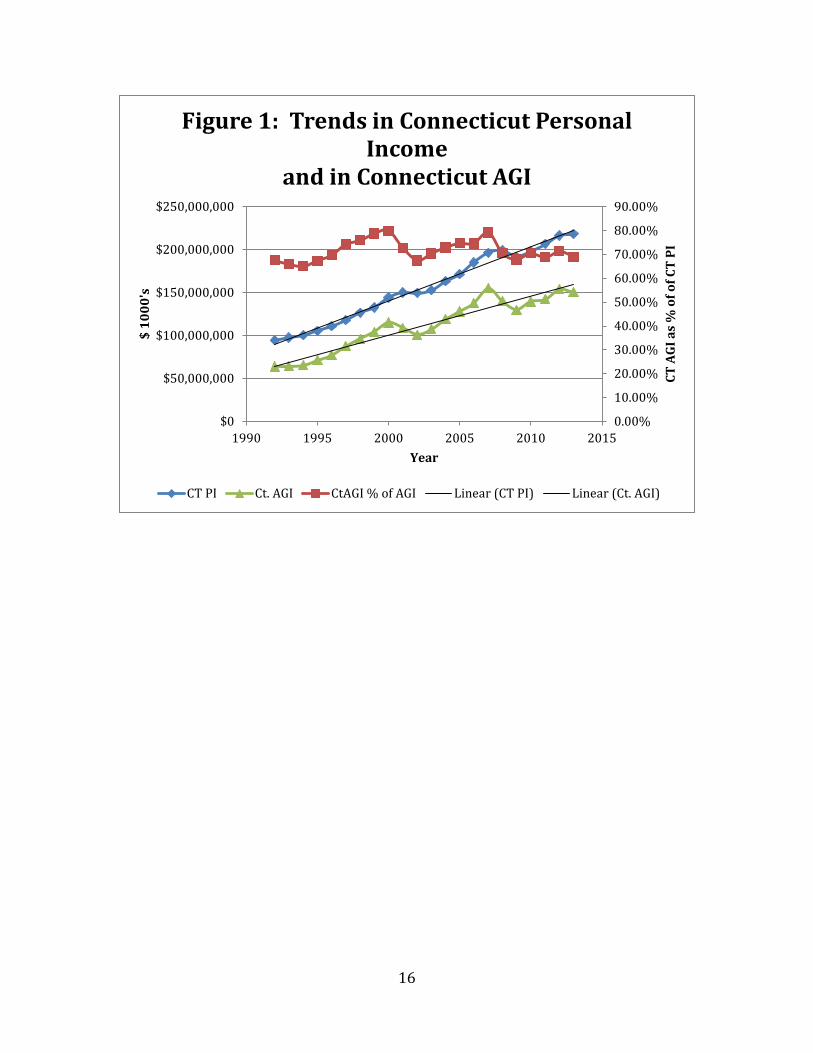
As may be seen from Table 4, the remaining subtractions from Federal AGI add
up to just under $1.3 billion overall. Table 5 shows estimates of the estimated tax revenue that would be gained by eliminating each of the current subtractions from

19
Table 4: Subtractions from Federal AGI in Determining Connecticut AGI: 2013
CT-1040 Subtractions
Number of Returns
Int. On Govt. Obligations
Mutual Fund Dividends
Soc. Security Benefit Adj.
Railroad Retirement Benefits
50% Military Retirement
Beneficiary's Share CT Fid.
Ct Bond Gain On Sale
CHET Contributions
Other
Less than $50,000 844,294 48,789,726 1,379,567 735,590,538 16,365,098 29,384,005 1,073,562 867,375 4,672,674 39,772,179 50,000 to 100,000 384,210 25,576,441 1,322,754 1,073,439,598 5,782,492 33,195,125 467,139 825,315 17,929,375 10,413,988 100,000 to 250,000 273,655 26,636,488 1,452,068 657,117,929 2,420,514 31,749,597 599,128 1,711,938 79,200,304 14,024,047 250,000 to 500,000 47,075 6,886,577 761,026 122,726,281 44,124 3,361,612 227,505 1,498,382 43,563,969 6,061,254 Greater than $500,000 25,621 82,848,453 1,650,723 63,386,361 64,045 667,918 289,968 5,263,832 27,335,059 22,351,797 Total 1,574,855 190,737,685 6,566,138 2,652,260,707 24,676,273 98,358,257 2,657,302 10,166,842 172,701,381 92,623,265
20
Table 5: Connecticut Personal Income Tax Expenditures
Item
FY 14
Estimates
FY 15
Estimates
Revenue Gain in FY
15 if Repealed
Personal Income Tax Exemptions and Deductions Interest on US Obligations 29.6 29.6 29.6 Dividends from Mutual Funds Derived from US Government Obligations
1.0 1.0 1.0
Tier I Railroad Retirement Benefits 0.5 0.5 0.5 Beneficiary’s share of Connecticut fiduciary adjustment
0.2 0.2 0.2
Gain on sale of Connecticut Bonds 0.8 0.8 0.8 Social Security Benefits 100.0 102.2 102.2 Military Retirement Income 3.9 4.0 4.0 Contributions to CHET 7.3 7.5 7.5 Other Deductions 12.3 12.3 12.3 Credits Credit for Property Taxes Paid 213.1 214.3 214.3 Earned Income Tax Credit 104.5 120.7 120.7 Angel Investor Tax Credit 6.0 3.0 3.0 Insurance Reinvestment 1.6 1.6 1.6 Job Expansion Tax Credit 6.0 6.0 6.0
Total Personal Income Tax 486.8 503.7 503.7
Federal AGI. The greatest estimated revenue gain would obtain if the present 100% exclusion of social security benefits were eliminated which effectively would subject Connecticut social security benefits to the same tax treatment as under the federal income tax. Tax Credits Table 5 also lists tax credits available to eligible taxpayers. Although these credits are classified as tax expenditures, the two most significant tax credits – property tax and the earned income tax credit – should not be viewed as violating the principle of horizontal equity in the usual sense. Rather, each is best viewed as making use of the Connecticut income tax as a convenient administrative vehicle for achieving other objectives of state fiscal policies. In the case of the property tax, the intent is to provide income conditioned relief from the burden of local property taxes. In the case of the earned income tax credit, the intent is to supplement the Federal earned income tax credit which is the principal means of income support for low income workers.
21
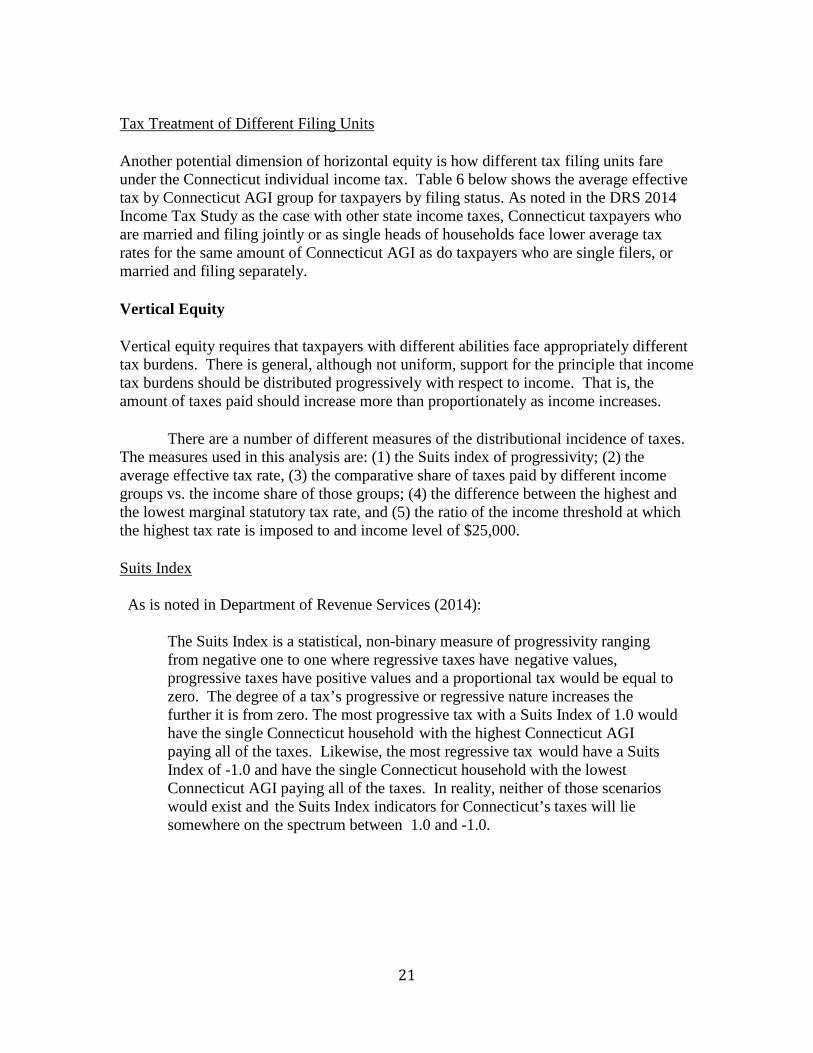
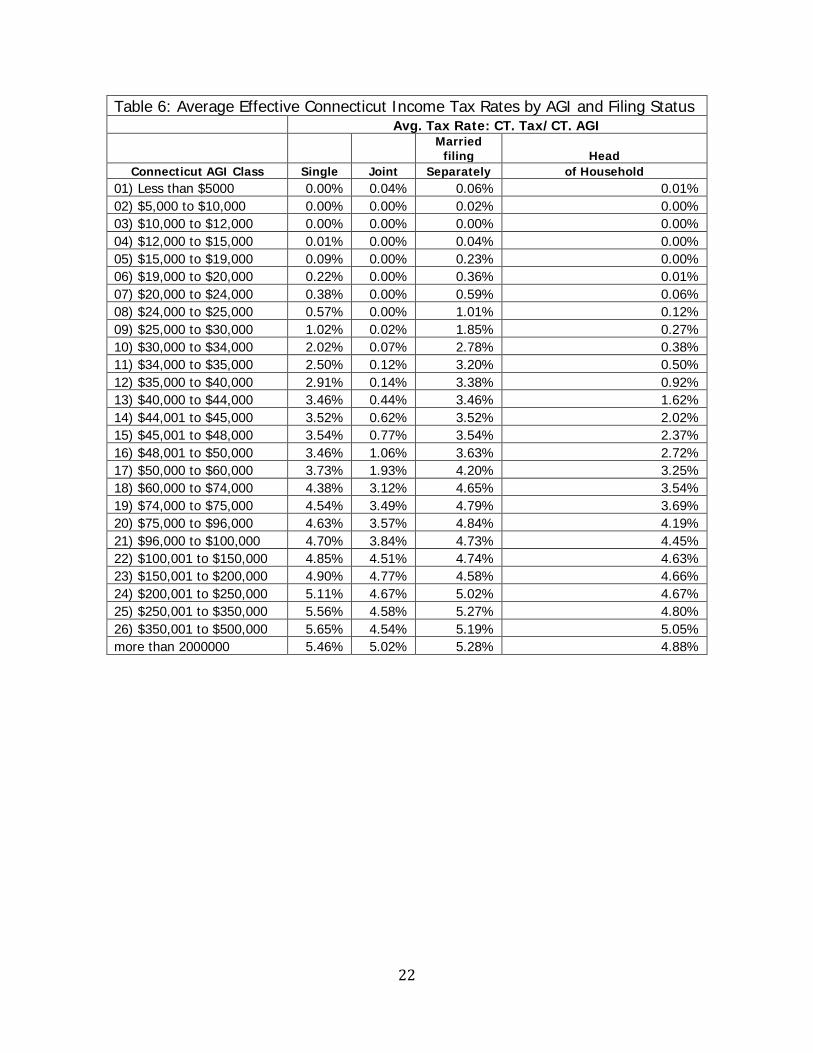
Tax Treatment of Different Filing Units Another potential dimension of horizontal equity is how different tax filing units fare under the Connecticut individual income tax. Table 6 below shows the average effective tax by Connecticut AGI group for taxpayers by filing status. As noted in the DRS 2014 Income Tax Study as the case with other state income taxes, Connecticut taxpayers who are married and filing jointly or as single heads of households face lower average tax rates for the same amount of Connecticut AGI as do taxpayers who are single filers, or married and filing separately. Vertical Equity Vertical equity requires that taxpayers with different abilities face appropriately different tax burdens. There is general, although not uniform, support for the principle that income tax burdens should be distributed progressively with respect to income. That is, the amount of taxes paid should increase more than proportionately as income increases. There are a number of different measures of the distributional incidence of taxes. The measures used in this analysis are: (1) the Suits index of progressivity; (2) the average effective tax rate, (3) the comparative share of taxes paid by different income groups vs. the income share of those groups; (4) the difference between the highest and the lowest marginal statutory tax rate, and (5) the ratio of the income threshold at which the highest tax rate is imposed to and income level of $25,000. Suits Index As is noted in Department of Revenue Services (2014):
The Suits Index is a statistical, non-binary measure of progressivity ranging from negative one to one where regressive taxes have negative values, progressive taxes have positive values and a proportional tax would be equal to zero. The degree of a tax’s progressive or regressive nature increases the further it is from zero. The most progressive tax with a Suits Index of 1.0 would have the single Connecticut household with the highest Connecticut AGI paying all of the taxes. Likewise, the most regressive tax would have a Suits Index of -1.0 and have the single Connecticut household with the lowest Connecticut AGI paying all of the taxes. In reality, neither of those scenarios would exist and the Suits Index indicators for Connecticut’s taxes will lie somewhere on the spectrum between 1.0 and -1.0.
22
Table 6: Average Effective Connecticut Income Tax Rates by AGI and Filing Status
Avg. Tax Rate: CT. Tax/CT. AGI
Married filing Head
Connecticut AGI Class Single Joint Separately of Household 01) Less than $5000 0.00% 0.04% 0.06% 0.01% 02) $5,000 to $10,000 0.00% 0.00% 0.02% 0.00% 03) $10,000 to $12,000 0.00% 0.00% 0.00% 0.00% 04) $12,000 to $15,000 0.01% 0.00% 0.04% 0.00% 05) $15,000 to $19,000 0.09% 0.00% 0.23% 0.00% 06) $19,000 to $20,000 0.22% 0.00% 0.36% 0.01% 07) $20,000 to $24,000 0.38% 0.00% 0.59% 0.06% 08) $24,000 to $25,000 0.57% 0.00% 1.01% 0.12% 09) $25,000 to $30,000 1.02% 0.02% 1.85% 0.27% 10) $30,000 to $34,000 2.02% 0.07% 2.78% 0.38% 11) $34,000 to $35,000 2.50% 0.12% 3.20% 0.50% 12) $35,000 to $40,000 2.91% 0.14% 3.38% 0.92% 13) $40,000 to $44,000 3.46% 0.44% 3.46% 1.62% 14) $44,001 to $45,000 3.52% 0.62% 3.52% 2.02% 15) $45,001 to $48,000 3.54% 0.77% 3.54% 2.37% 16) $48,001 to $50,000 3.46% 1.06% 3.63% 2.72% 17) $50,000 to $60,000 3.73% 1.93% 4.20% 3.25% 18) $60,000 to $74,000 4.38% 3.12% 4.65% 3.54% 19) $74,000 to $75,000 4.54% 3.49% 4.79% 3.69% 20) $75,000 to $96,000 4.63% 3.57% 4.84% 4.19% 21) $96,000 to $100,000 4.70% 3.84% 4.73% 4.45% 22) $100,001 to $150,000 4.85% 4.51% 4.74% 4.63% 23) $150,001 to $200,000 4.90% 4.77% 4.58% 4.66% 24) $200,001 to $250,000 5.11% 4.67% 5.02% 4.67% 25) $250,001 to $350,000 5.56% 4.58% 5.27% 4.80% 26) $350,001 to $500,000 5.65% 4.54% 5.19% 5.05% more than 2000000 5.46% 5.02% 5.28% 4.88%
23
The Suits index can be calculated with individual tax data, as was done in the 2014 DRS incidence study. It can also be calculated using data grouped by AGI class as are the data made available annually by the Connecticut DRS. We use these data to calculate the Suits index for the years 2007, 2010, and 2013 using the formula for a discrete approximation for the Suits index found in Suits (1977):
(2) 𝑆𝑆𝑋𝑋 = 1 − 𝐿𝐿𝑋𝑋𝐾𝐾
Where Sx = the Suits index for tax x, Lx = the area under the Lorenz curve for tax x, and K = .5. The discrete approximation for Lx is further defined as:
(3) 𝐿𝐿𝑥𝑥 = �[(𝑇𝑇𝑋𝑋(𝑌𝑌𝑖𝑖) + 𝑇𝑇𝑥𝑥(𝑌𝑌𝑖𝑖−1)] ∙ (𝑌𝑌𝑖𝑖
𝑁𝑁
1=1
− 𝑌𝑌𝑖𝑖−1)
Where Tx(Yi) is the cumulative share of tax x paid by those in income group Yi, where the group index i increases to N as income increases.
The value of Sx that is calculated using individual data in the 2014 analysis of the incidence of Connecticut taxes is 0.11. As noted in that study (DRS, 2014), the income tax along with the estate tax, is the only Connecticut state tax with a progressive distribution of the tax burden Together the progressive distributional incidence of these two taxes is enough to offset the regressive incidence of other taxes so that overall, the Connecticut state taxes are distributed in a mildly progressive manner. Using (2) and (3) to calculate the Suits index from grouped data, yields values of 0.138, 0.139, and 0.146 respectively for the tax years 2010, 2011, and 2014. Although Suits indexes calculated with grouped data are not directly comparable with Suits indexes calculated with individual data, the Suits index values for 2010, 2011, and 2013 do indicate that the 2011 changes enacted in the income tax made it more progressive.1 Although data are not yet available, the most recent changes enacted in June 2015 should further increase the progressivity of the tax. Average Tax Rates and Shares of Tax Burden by AGI Class
Two other common measures of progressivity are: (1) the relationship between
the average tax rate, and (2) the relationship between the shares of taxes paid in different income classes compared with the share of income reported in each income class. In Figure 4, the average tax rate in tax year 2013 – the percentage of Connecticut AGI paid in Connecticut income tax – is shown to increase with income. (The same general relationship is also observed for each type of filing status in Table 6. The relationship between income shares and taxes paid, which is also shown in Figure 4 displays a pattern
1 The value of the Suits index calculated using grouped data will overstate the degree of progressivity so that the Suits index value of 0.146 calculated from grouped data is likely to overstate the actual progressivity of the Connecticut income tax in 2013. Nonetheless the change in the value of the index calculated from grouped data indicates an increase in its value between 2010 and 2013 of about 6%.

24
Figure 4: Progressivity of the Connecticut Income Tax
Table 7: Comparison of the Progressivity of the Connecticut Income Tax State Progressivity
Index 1 Rank
Progressivity Index 2
Rank EITC Percent
Rank
Connecticut 4.85 8 1.7 15 27.5 3 Delaware 1.28 20 1.4 17 20.0 Massachusetts 0.08 37 0.0 23 15.0 6 New Hampshire 0.05 39 0.0 23 New Jersey 9.49 4 7.2 2 20.0 5 New York 19.00 1 2.4 9 30.0 2 Rhode Island 3.02 14 2.2 10 10.0 8 Vermont 9.42 5 5.4
Progressivity Index 1 = multiple of average earnings at which the top income tax rate applies; Progressivity Index 2 = difference between the top income tax rate and the marginal rate on $25,000 of taxable income.

25
consistent with progressivity. For example, note that the share of Connecticut income tax paid by taxpayers in the bottom income class equals 3.9% compared with their income share of 12.8%; while at the top of the income distribution the share of Connecticut income tax paid by taxpayers with Federal AGI of more than $500,000 is 37.6% compared with this group’s income share of 31.6%.
Table 7 uses yet another set of indicators to compare the progressivity of the Connecticut
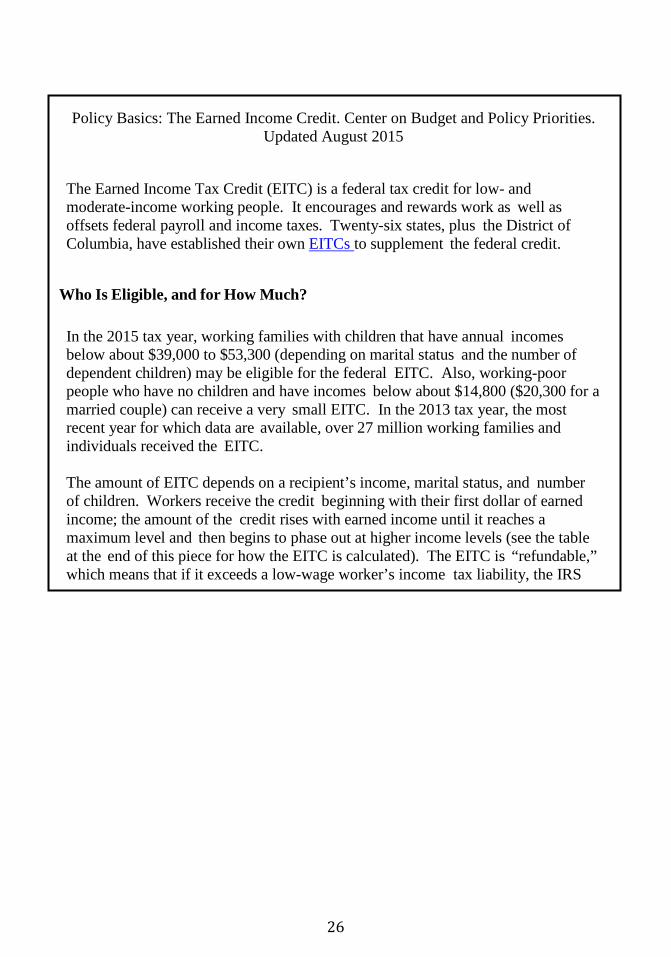
income tax with that of the income taxes in neighboring states. The two measures used are: the multiple of average earnings at which the top income tax rate applies; and the difference between the top income tax rate and the marginal tax rate on $25,000 of taxable income. The data are for the year 2014. If one were to assume that the tax structures of other states remained constant for 2015 – the year in which Connecticut increased its top rate, and raised the threshold at which the top rate applies, Connecticut’s rankings in terms of relative progressivity would increase from those reported in Table 7. Earned Income Tax Credit Connecticut is one of 26 states that have enacted a state-level earned income tax credit (EITC) to supplement the Federal EITC. The general structure of the Federal EITC is described in the text box on the next page. Like other states with an EITC, Connecticut provides its own EITC equals to a percentage of the amount a taxpayer receives from the Federal EITC. The Connecticut EITC is also refundable. Namely, when the EITC claimed exceeds a taxpayer’s tax liability, the excess amount is refunded to the taxpayer.
The legislation which established the Connecticut EITC in 2011 set the percentage initially at 30%. The credit was temporarily cut to 25% of the Federal EITC for budgetary reasons in 2012. It was scheduled to be increased to 27.5% of the Federal credit in 2014 and to 30% in 2015. The increase to 27.5% scheduled for 2014 did take place. However, the increase to 30% was postponed again in 2015 to take effect in 2017. DRS data from 2013 on the receipt of the Connecticut EITC at the town and city level indicates that just under 190,000 Connecticut residents received total EITC payments of $95.8 million, or an average payment of $504. The average amount received ranged from $284 in Weston to a high of $589 in Hartford.
The Connecticut state EITC can be viewed from two perspectives. It can be treated as part of the overall structure of the Connecticut income tax. In this case, as illustrated in Figure 5, inclusion of the EITC increases the progressivity of the income tax because taxpaying families in the bottom income quintile actually pay a negative tax – e.g. receive a subsidy – by virtue of receiving a tax rebate. Alternatively, the EITC can be viewed as a social transfer program that uses the income tax as the administrative vehicle for providing the transfer. Seen from this perspective, supporters of using the EITC as an income support program for low-income working families give the EITC good marks both for its relative administrative
26
Policy Basics: The Earned Income Credit. Center on Budget and Policy Priorities. Updated August 2015
The Earned Income Tax Credit (EITC) is a federal tax credit for low- and moderate-income working people. It encourages and rewards work as well as offsets federal payroll and income taxes. Twenty-six states, plus the District of Columbia, have established their own EITCs to supplement the federal credit.
Who Is Eligible, and for How Much? In the 2015 tax year, working families with children that have annual incomes below about $39,000 to $53,300 (depending on marital status and the number of dependent children) may be eligible for the federal EITC. Also, working-poor people who have no children and have incomes below about $14,800 ($20,300 for a married couple) can receive a very small EITC. In the 2013 tax year, the most recent year for which data are available, over 27 million working families and individuals received the EITC. The amount of EITC depends on a recipient’s income, marital status, and number of children. Workers receive the credit beginning with their first dollar of earned income; the amount of the credit rises with earned income until it reaches a maximum level and then begins to phase out at higher income levels (see the table at the end of this piece for how the EITC is calculated). The EITC is “refundable,” which means that if it exceeds a low-wage worker’s income tax liability, the IRS

27
-1.2%
1.0%
3.1%
3.9%
4.5%
5.2% 5.4%
-2.0%
-1.0%
0.0%
1.0%
2.0%
3.0%
4.0%
5.0%
6.0%
Lowest20%
2nd20%
Middle20%
4th20%
Next15%
Next4%
Top 1%
Family Income Quintiles
Figure 5 : Share of Family Income Paid in CT. Personal Income Tax Including EITC
Ct. Tax Share of Family Income

28
simplicity, and for its positive incentive effects: (1) in principle, basing receipt of the credit on the filing of federal tax returns offers a relatively simple way of means-testing receipt of the credit; and basing the state EITC on a percentage of the federal EITC is a simple and transparent way of determining the additional state supplement; and (2) unlike other social support programs, conditioning receipt of the credit on earned income provides positive rather than negative work incentives for some recipients (see next section).
Critics of expanding the EITC, however, counter that despite the
apparent ease of administration, true eligibility for refundable tax credits is difficult to verify, creating possibilities for fraudulent claims. The estimated amount of such claims in the case of the EITC in Federal fiscal year 2013 was $14.5 billion or 24% of the total amount of credits claimed. Applying a similar error rate to the Connecticut EITC would result in an estimated amount of false credits claimed in 2013 of approximately $23 million. Moreover, overall there is mixed evidence that the EITC has a positive effect overall on the labor supply of its recipients. V. Collectability
The tasks of collecting revenue and monitoring and enforcing compliance with taxes require the use of time and money on the part of both the government and of private parties. Other things equal, it is desirable to minimize such costs. As a revenue source, the individual income tax is widely viewed as imposing low to modest collection costs on the government, and relatively high costs of compliance on private parties. Estimates of the government collection cost per dollar of revenue are on the order of 1% or less of revenue collected, whereas estimates of the total private compliance burden may be on the order of 15% of revenue raised. Recent analyses of the private burden of complying with the income tax have identified the following types of activities that contribute to total time spent on income tax compliance: (1) recordkeeping, (2) tax planning, and (3) form completion and submission, with an average total cost of $200 per return. Recordkeeping and tax planning account for the lion’s share of total costs, and form completion and submission account for the remaining amount.
29
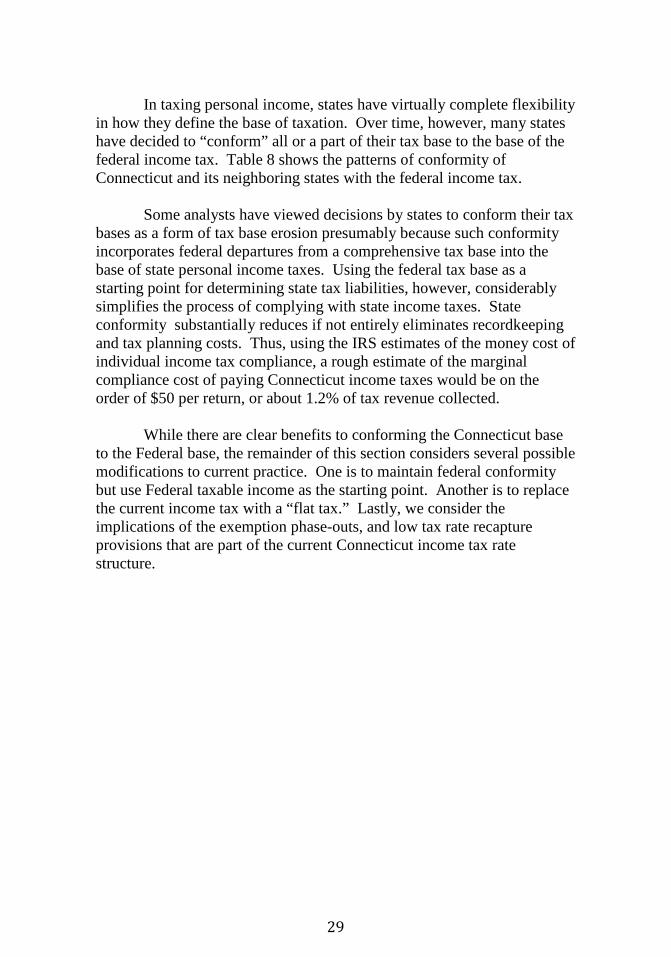
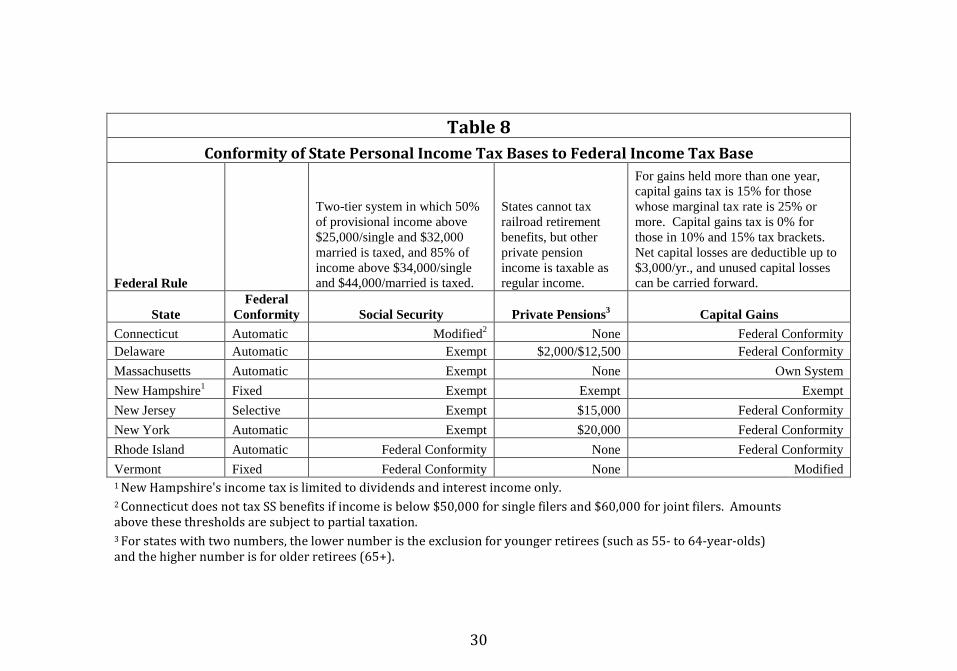
In taxing personal income, states have virtually complete flexibility in how they define the base of taxation. Over time, however, many states have decided to “conform” all or a part of their tax base to the base of the federal income tax. Table 8 shows the patterns of conformity of Connecticut and its neighboring states with the federal income tax. Some analysts have viewed decisions by states to conform their tax bases as a form of tax base erosion presumably because such conformity incorporates federal departures from a comprehensive tax base into the base of state personal income taxes. Using the federal tax base as a starting point for determining state tax liabilities, however, considerably simplifies the process of complying with state income taxes. State conformity substantially reduces if not entirely eliminates recordkeeping and tax planning costs. Thus, using the IRS estimates of the money cost of individual income tax compliance, a rough estimate of the marginal compliance cost of paying Connecticut income taxes would be on the order of $50 per return, or about 1.2% of tax revenue collected. While there are clear benefits to conforming the Connecticut base to the Federal base, the remainder of this section considers several possible modifications to current practice. One is to maintain federal conformity but use Federal taxable income as the starting point. Another is to replace the current income tax with a “flat tax.” Lastly, we consider the implications of the exemption phase-outs, and low tax rate recapture provisions that are part of the current Connecticut income tax rate structure.
30
Table 8
Conformity of State Personal Income Tax Bases to Federal Income Tax Base Federal Rule
Two-tier system in which 50% of provisional income above $25,000/single and $32,000 married is taxed, and 85% of income above $34,000/single and $44,000/married is taxed.
States cannot tax railroad retirement benefits, but other private pension income is taxable as regular income.
For gains held more than one year, capital gains tax is 15% for those whose marginal tax rate is 25% or more. Capital gains tax is 0% for those in 10% and 15% tax brackets. Net capital losses are deductible up to $3,000/yr., and unused capital losses can be carried forward.
State Federal
Conformity Social Security Private Pensions3 Capital Gains Connecticut Automatic Modified2 None Federal Conformity Delaware Automatic Exempt $2,000/$12,500 Federal Conformity Massachusetts Automatic Exempt None Own System New Hampshire1 Fixed Exempt Exempt Exempt New Jersey Selective Exempt $15,000 Federal Conformity New York Automatic Exempt $20,000 Federal Conformity Rhode Island Automatic Federal Conformity None Federal Conformity Vermont Fixed Federal Conformity None Modified 1 New Hampshire's income tax is limited to dividends and interest income only. 2 Connecticut does not tax SS benefits if income is below $50,000 for single filers and $60,000 for joint filers. Amounts above these thresholds are subject to partial taxation. 3 For states with two numbers, the lower number is the exclusion for younger retirees (such as 55- to 64-year-olds) and the higher number is for older retirees (65+).

31
Figure 6: Conforming to Federal Taxable Income Instead of to Federal AGI
32
Conforming to Federal Taxable Income Instead of Federal AGI Although 27 of the 37 states that conform to the Federal income tax use Federal AGI as the starting base, some stakeholders have raised the possibility of conforming to Federal taxable income rather than Federal AGI. Using Federal taxable income as the starting point for determining Connecticut income tax liability would narrow the base for computing Connecticut taxable income by including: (1) Federal dependent exemptions, and (2) the amount of the Federal standard deduction or Federal itemized deductions. As a result, the starting point for determining Connecticut taxable income would be reduced by a total of $38.9 billion, or 25%. The relative absolute and percentage reductions by Federal AGI class are shown in Figure 6.
The net benefits of conforming to Federal taxable income rather than Federal AGI
are mixed. First, because adopting Federal taxable income as the starting point involves narrowing the Connecticut income tax base, Connecticut tax rates would need to increase in order to yield the same amount of revenue. The precise amount of the required increase in tax rates would depend on factors such as whether Connecticut substituted the Federal structure of personal exemptions for its current structure, as well as net additions (subtractions) that would be made to Federal taxable income.
The magnitude of the size of tax rate increases that would be required can be
gauged by grossing current rates up by a factor of (1-.25). Using this factor, the current rate schedule of 3.0%, 5.0% 5.5%, 6.0%, 6.5%, 6.9%, and 6.99% would increase to 4.0, 6.7%, 7.3%, 8.0%, 8.7%, and 9.3%, respectively. Although the average effective tax burden would, by definition, not change, Connecticut would nonetheless be perceived as having higher marginal tax rates as a result of such a change.
Another consequence of starting with a narrower base is that a number of federal
tax preferences enjoyed by federal itemizers would become available implicitly if not explicitly in the Connecticut income tax, which would weaken the horizontal equity of the Connecticut income tax base. Moreover, adopting “full conformity” by using Federal taxable income would not necessarily further simplify compliance.
On the one hand, substituting Federal personal exemptions in place of state-level
personal exemptions might simplify matters somewhat if Connecticut followed the practice of states that conform to Federal taxable income of substituting Federal exemptions for state exemptions. As noted by Duncan (2006), however, state additions to the federal tax base typically involve including items that are tax-exempt at the federal but not the state level, such as tax-exempt state and local debt, while state subtractions from the federal tax base involve removing items, such as interest on federal debt, that are not constitutionally taxable by the states. If Connecticut continued to make these additions and subtractions, plus exempt all or a portion of Social Security benefits and railroad and military retirement income, Connecticut taxpayers would need to continue make the same adjustments to Federal taxable income as they currently make to Federal AGI.

33
Adopting a “Flat Tax” Connecticut, like many other states, including neighbors such as New York and New Jersey, has an income tax with multiple tax rates that increase with the taxpayer’s taxable income. Would it simplify matters if Connecticut enacted an income tax with a flat rate? Type of Flat Tax
In addressing this question, it is first useful to distinguish between two
different types of flat taxes. As noted by Burman and Slemrod, one version is what most public finance economists regard as the flat tax first proposed by Hall and Rabushka. The Hall-Rabushka flat tax and other proposals like it do involve taxing an income-like base at a single rate. However this version is not actually an income tax, but instead taxes consumption by taxing only wage income on the individual side, and coupling this with a value-added-tax like levy on all business income. The main features of this type of flat tax are described in more detail in the text box on the next page.
The proposals to introduce a Hall-Rabushka-type flat tax have figured
prominently in presidential campaign proposals at the national level. However, for a number of reasons that are beyond the scope of this report, it would neither be feasible, nor necessarily desirable for a state to introduce this type of flat tax in a world in which the Federal government continued to tax income.
Another version of a flat tax, which is administered by several states,
including Massachusetts, would be to tax income in excess of some basic exemption, but at a single instead of multiple rates. Using DRS data, it is possible to estimate the approximate impact of substituting a single rate income tax for the current Connecticut income tax under the following simplifying assumptions: (1) the Connecticut income tax would continue to conform to Federal AGI with the same additions and subtractions from Federal AGI as currently; (2) all Connecticut AGI at or below $15,000 for single filers and at or below $30,000 married taxpayers filing jointly would be exempt from taxation; and (3) all Connecticut AGI above these thresholds would be subject to the same tax rate designed to raise the same amount of revenue as the current Connecticut income tax.
Under these assumptions, the single tax rate that would apply to Connecticut
AGI is approximately 5.4%. Compared to existing rates, the estimated single rate would be approximately equal to the 5.5% applied to single filers with Connecticut AGI between $50,000 and $100,000 and to joint filers with Connecticut AGI between $100,000 to $200,000. It would higher than the statutory tax rates currently applied to taxpayers with CT AGI below these thresholds (3.0% and 5.0%), and lower than the statutory rates currently applied

34
The Hall-Rabushka Flat Tax The original concept of a (consumption-based) flat tax was proposed by Stanford economists Robert Hall and Alvin Rabushka. Under the proposal, the current system for taxing business income, which features a separate tax on corporate profits combined with personal income taxes collected on profits from partnerships and unincorporated businesses, would be replaced by a single business tax levied at a flat rate on a tax base equal to Sales minus Wage and Salary Payments minus Purchases of Goods and Services from Other Businesses minus Investment Spending on New Plant and Equipment.
A separate tax would be levied on individuals at a flat tax rate on wages, salaries,
and/or pensions above a basic exemption. Dividends, interest, and capital gains would not be taxable at the personal level. The single tax rate on businesses and individuals would be the same, and its value would depend on the amount of revenue needed.
Proponents of the flat tax argue that it would have several advantages. First, it would be simpler than current federal corporate and individual income taxes with their hosts of forms and accompanying schedules. Life would be particularly simple for taxpayers whose income was less than the combined amount of the basic exemption and dependent allowances. They would pay no tax at all. Moreover, because the flat tax would effectively exempt income that is saved until withdrawn for consumption, f l a t t a x p r o p o n e n t s contend it would not only greatly simplify tax administration and compliance by eliminating the need to keep track of capital income until withdrawn, but it would also boost private saving.

35
to taxpayers with Connecticut AGI above these thresholds (6.0%, 6.5%, 6.9%, and 6.99%). Mainly because of the income exemptions, the incidence of the flat tax would still be progressive. However, it would be less progressive than the current tax, with a calculated Suits progressivity index of 0.078 compare with 0.17.
Although a tax with a single rate would appear to be simpler than one with
multiple rates, there is a consensus among public finance scholars that the main sources of tax complexity reside in the rules for determining the tax base rather than the structure of tax rates. Although having multiple rates does involve some complexity, the burden of determining tax liability in a multiple tax rate structure is virtually eliminated through the use of tax software and/or the provision of easy-to-use tax look-up tables such as those available on the DRS website.
Exemption Phase-Outs and Low Tax Rate Recapture The Connecticut PIT includes a phase-out of personal exemptions and personal tax credits for taxpayers with Connecticut AGI above certain income thresholds, as well as a recapture of the benefit received by higher income taxpayers of having their income initially taxed at lower tax rates. The intent of these provisions is to ensure that higher income taxpayers pay average effective tax rates that are equal to their tax bracket. (The effect of those provisions may be seen in Figure 7 which illustrates the effect of both exemption phase-outs, and low tax recapture on the marginal and average tax rates faced by a single filer. (Although not shown here, a similar pattern would be observed in the case of taxpayers with different filing statuses). In Figure 7, the top line with the triangle markers shows the marginal effective tax rates that result from the withdrawal of exemption amounts and/or low tax rate recapture. The dotted middle line with the square markers shows the statutory tax brackets; and the bottom line with the dots shows how the average effective tax rate changes as income increases. As may be seen, the exemption phase-outs and low-tax-rate recapture cause the average effective tax rate to move closer to the statutory tax brackets as income rises until the average effective tax rate is the same as the statutory bracket at income levels above $250,000. As noted in an e-mail from the Connecticut Office of Policy and Management, the effect of the various recapture provisions is to add roughly $230 million or about 3% of revenue collected from the income without increasing the statutory bracket rates. This outcome is, however, achieved at the cost of creating higher “shadow” marginal tax rates which can rise as high as into the 8 to 10% range. Whether such high implicit marginal tax rates are perceived as such depends on their salience to taxpayers. To the extent that they are salient, however, the statutory tax brackets will understate the incentive effects at the margin for taxpayers facing the shadow marginal rates.

36
Figure 7: Marginal Tax Rates under Phase-out’s of Exemptions, Personal Tax Credits
And Low Tax Rate Recapture

37
VI. Economic Incentives
A side effect of income taxation is that it has the potential to affect the economic decisions of taxpayers. In this section we examine the incentive effects of the Connecticut income tax in the following dimensions: (1) general incentives to work and to save; (2) overall work incentives of the Connecticut EITC; (3) the current tax treatment of capital and the case for and against taxing capital gains preferentially; and (4) the competitiveness of Connecticut’s income vis a vis its neighboring states. Incentives to Work and to Save Income taxes potentially affect both incentives to work and incentives to save. Namely, if W and r are the wage and the return to saving respectively, an income tax reduces the take-home wage to W(1-T) and the after-tax return to saving to r(1-T) where T is the taxpayer’s marginal tax rate. State taxation increases the work and saving disincentives of the Federal income tax by a magnitude that is determined by the taxpayer’s marginal state income tax rates. For example, for taxpayers at the top of the income scale, the Connecticut income would increase the top marginal tax on earnings and savings from the federal rate of 39.6% to 43.7% (assuming deductibility of state taxes against federal) for those with Connecticut AGIs greater than$500,000, and from 39.6% to 43.8% for those with Connecticut AGI of $1,000, 000 or more. The text box on the next page summarizes the assessment of two prominent public finance scholars about the effects of income taxation on the incentive to work and the incentive to save. In addition to affecting work and savings incentives, higher marginal income tax rates “may encourage taxpayers to seek compensation in the form of tax free fringe benefits rather than taxable compensation and to engage in other tax avoidance activities, including deductible expenses or deductible consumption, or even illegal tax evasion. Such distortions in consumption represent an efficiency loss to the economy” (IRS Taxpayer Advocate, 2012). The creation of work and saving disincentives is an unavoidable side-effect of taxing income. Moreover, it can be shown that the economic cost of such disincentives increases with the square of the tax rate. There is, therefore, a sound policy rationale for striving to keep marginal rates of income taxation as low as possible consistent with raising needed revenue. The best way of accomplishing this objective is to tax income broadly at low rates instead of narrowly at higher rates.

38
Burman and Slemrod on the Work and Saving Effects of Income Taxes
Incentives to Work Two decades ago, the conventional wisdom was that the labor supply of prime-age males hardly budges when tax rates changed; these men, often family bread-earners, have to work regardless of what their labor brought in. Some recent research has found a greater responsiveness, suggesting that a tax cut from 30 to 25% might raise labor supply by as much as 2 percent, still fairly small but enough to suggest significant economic costs from sharp increases in taxation. Most economists believe that the labor supply decisions of women are much more sensitive than men are to the after0tax wage, especially with regard to the decision to be in the labor force at all. Incentives to Save We know much less about the responsiveness of saving to the real after-tax rate of return….Over time there seems to be no clear correlation between this rate of return and aggregate personal saving rates. This doesn’t necessarily mean that there is no relationship, as it could be that so many other factors affect savings that it is not possible to identify the effect of taxation alone. Thus, the economic argument against taxing the return to saving as a pure income tax, but a consumption tax does not, rests on a theoretical, not empirical, argument that any such effect is especially harmful to the long-run growth prospects of the economy.

39
Work Incentive Effects of the Earned Income Tax Credit As was discussed in the section on the Connecticut state EITC, supporters of the EITC also give it high marks because of its effects on the incentive to work of at least some recipients. Specifically, EITC recipients who are on the so-called extensive margin – e.g. who before receiving the EITC are not in the work force --- face an unambiguous positive incentive to enter the labor force and to increase their hours worked. Other recipients, who are described as being on the intensive margin – e.g. who are already working --- face the conventional implicit tax rates on additional earnings that are characteristic of means-tested income support programs. There is considerable evidence that workers who are on the extensive margin increase their hours worked in the formal labor market in response to the EITC. Moreover, there is additional evidence that the positive effect on hours worked at the extensive margin offsets (or even more than offsets) the negative work effect for those on the intensive margin. As one website has noted, “(t)hat the EITC generates limited work disincentives is important, as such labor market distortions are one of the principal downfalls of safety net programs and tax policy alike." (The Century Foundation, 2015).
Taxing Capital Gains3
By using Federal AGI as its starting point, the Connecticut income tax includes capital gains in its tax base. Although long-term capital gains are taxed at preferential rates under the Federal income tax, they are taxed at the same rate as all other income in the Connecticut income tax.
There has been a long-running debate in the tax policy literature concerning whether capital gains should be taxed at lower rates than other income sources. Although supporters and critics of cutting taxes on capital gains agree that lower taxes on capital gains would favor investments that pay out a large share of the total return in the form of capital gains. They disagree about whether such investments should be favored.
Supporters of cutting capital gains taxes point out that it will reduce the
double tax on income from corporate equity and also make capital gains assets more attractive compared to assets such as housing, which are taxed very lightly or not at all. Reducing the differential between the taxation of corporate and noncorporate capital, and between housing and other assets tends to allocate capital more efficiently. In addition, supporters of lower capital gains taxes argue that current limitations on deductions for capital losses discourage risk-taking because the government shares fully in the rewards but not the potential losses of risky investments, particularly for entrepreneurs who are not likely to have diversified portfolios. Although the problem is addressed more directly by easing loss limitations rather than by lowering the tax rate, this may not be possible as long as capital gains are taxed on a realization basis. From this point of view, lower taxes on capital gains will encourage savers to

40
provide venture capital to risky start-up companies rather than to more established businesses.
Opponents respond that lower capital gains taxes encourage investors to prefer investments simply because they pay off in capital gains and to seek out ways of converting ordinary income into capital gains. A capital gains differential also encourages corporations to retain earnings rather than pay dividends, which may result in a less efficient allocation of investment. In addition, a capital gains preference would increase existing incentives to engage in interest-related tax arbitrage as discussed in Steuerle (1985) and U.S. Treasury (1985). Tax-motivated changes in behavior of this type tend to allocate capital less efficiently (U.S. Treasury, 1984).
Opponents doubt that cutting capital gains taxes would significantly encourage risk-taking. They point out that allowing capital losses to be deducted fully against capital gains may provide adequate risk-sharing for those investors with diversified portfolios. Moreover, if risky investments tend to pay off in capital gains, current tax treatment of capital gains already benefits such investments by deferring the tax until the gain is realized. In addition, opponents of cutting capital gains taxes cite data presented by the Treasury (1985) and Poterba (1989) that show a large share of the formally organized funds for venture capital comes from sources who do not pay individual capital gains taxes. Poterba's data suggest that only about 20 percent of organized venture capital comes from individuals, while another 30 percent comes from corporations sensitive to corporate tax rates on capital gains.
Less is known about how the tax system affects ventures in the earliest stages before outside funding is sought, such as when a potential entrepreneur considers starting a new firm rather than continuing to work for an established company. Supporters of lower capital gains tax rates argue that would-be entrepreneurs are deterred by the full taxation of nominal capital gains and limited loss offsets. There is some evidence that tax-sensitive investors may play an important role in bankrolling new enterprises before they seek financing in the organized venture capital market (Treasury, 1985; JACA, 1985). Opponents argue that other factors are more important, such as the unique opportunities presented by technological change, the personal desire to be one's own boss, or the preferential tax treatment of the foregone wage and salary earnings on the entrepreneur's human capital.
Tax Competition with Other States A final issue has to do with the competitive position of the Connecticut personal income tax vis a vis income taxes in other states, especially neighboring states. Bourdeaux (2015) has provided a thorough discussion of the different ways in which Connecticut taxes compare with other states’ taxes

41
along several dimensions; and Wasylenko (2015) provides a thorough review of the available evidence on the extent to which taxes “matter” in location decisions made by businesses and individuals.
Evidence on the state-by-state competitive effects of taxes can be grouped into three categories: (1) the effects of state level taxation on economic growth in general; (2) the effects of state level taxation on the location decisions of businesses; and (3) the effects of state level taxation on the location decisions of individuals. Two recent papers by Gale, et. al. (2015) and Wasylenko (2015) offer somewhat conflicting evidence on the relationship between state personal income taxes and state Gross Domestic Product (state GDP). Although both studies find that greater reliance on property taxes (as a means of financing basic government services) has a negative effective on the growth rate of state GDP, the studies split on the effect of state income taxes: Gale, et. al. find no statistically significant relationship between more reliance on state personal income taxes, while Wasylenko finds an effect of state income taxes comparable to that of property taxes.
In the case of taxes and business location decisions, the general scholarly
consensus is that taxes affect location decisions mainly in an “other things held constant” context. That is, businesses are more apt to consider economic fundamentals, such as availability of labor, transportations costs, and gains from agglomerating with other related businesses, than they are to focus on tax treatment. However, once broad locational decisions have been made --- e.g. to locate in New England, or the Northeastern U.S. --- taxes do become more relevant for choosing where to locate within a regions.
Despite widely publicized stories about individuals choosing to move to
states with low taxes, there is little statistical evidence that such behavior occurs on a large scale across states. For example, Bruce, et. al. (2010) finds no statistically significant evidence of an inverse relationship between a states’ personal income tax base and their personal income tax rate. As in the case of business location decisions, there is, however, one cannot rule out the possibility that differential tax treatment may affect individual location decisions along state borders. Tax Foundation State Business Tax Climate Index In the case of the income tax, the Tax Foundation’s State Business Tax Climate Index breaks out the income tax as one of its several components, allowing comparisons to be made between Connecticut’s income tax, and the income taxes of other states. As noted by Bourdeaux (2015)
The (SBTI) individual income tax rate sub-index is constructed by using the top marginal tax rate, the top tax bracket threshold, the number of brackets, width of brackets, income recapture, and the standard deductions and personal exemptions
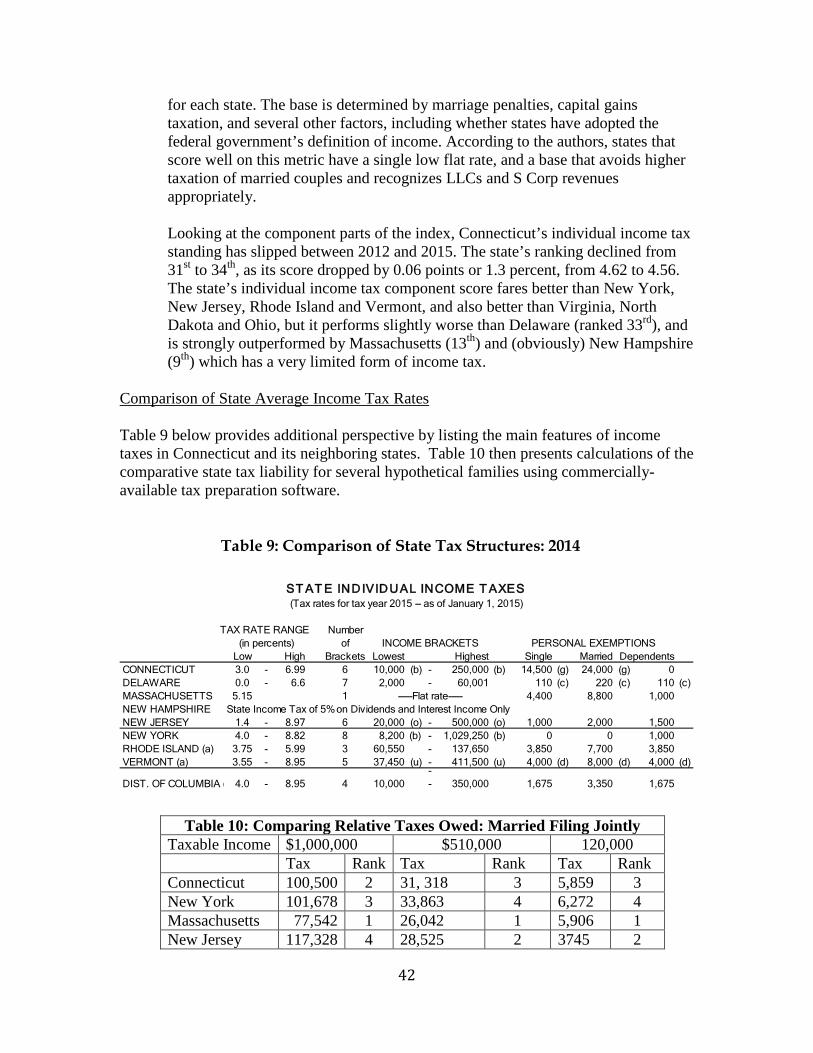
42
for each state. The base is determined by marriage penalties, capital gains taxation, and several other factors, including whether states have adopted the federal government’s definition of income. According to the authors, states that score well on this metric have a single low flat rate, and a base that avoids higher taxation of married couples and recognizes LLCs and S Corp revenues appropriately. Looking at the component parts of the index, Connecticut’s individual income tax standing has slipped between 2012 and 2015. The state’s ranking declined from 31st to 34th, as its score dropped by 0.06 points or 1.3 percent, from 4.62 to 4.56. The state’s individual income tax component score fares better than New York, New Jersey, Rhode Island and Vermont, and also better than Virginia, North Dakota and Ohio, but it performs slightly worse than Delaware (ranked 33rd), and is strongly outperformed by Massachusetts (13th) and (obviously) New Hampshire (9th) which has a very limited form of income tax.
Comparison of State Average Income Tax Rates Table 9 below provides additional perspective by listing the main features of income taxes in Connecticut and its neighboring states. Table 10 then presents calculations of the comparative state tax liability for several hypothetical families using commercially-available tax preparation software.
Table 9: Comparison of State Tax Structures: 2014
Table 10: Comparing Relative Taxes Owed: Married Filing Jointly Taxable Income $1,000,000 $510,000 120,000 Tax Rank Tax Rank Tax Rank Connecticut 100,500 2 31, 318 3 5,859 3 New York 101,678 3 33,863 4 6,272 4 Massachusetts 77,542 1 26,042 1 5,906 1 New Jersey 117,328 4 28,525 2 3745 2
ST AT E INDIVIDUAL INCOME T AXES(Tax rates for tax year 2015 -- as of January 1, 2015)
TAX RATE RANGE Number(in percents) of INCOME BRACKETS PERSONAL EXEMPTIONS
Low High Brackets Lowest Highest Single Married DependentsCONNECTICUT 3.0 - 6.99 6 10,000 (b) - 250,000 (b) 14,500 (g) 24,000 (g) 0DELAWARE 0.0 - 6.6 7 2,000 - 60,001 110 (c) 220 (c) 110 (c)MASSACHUSETTS 5.15 1 -----Flat rate----- 4,400 8,800 1,000NEW HAMPSHIRE State Income Tax of 5% on Dividends and Interest Income OnlyNEW JERSEY 1.4 - 8.97 6 20,000 (o) - 500,000 (o) 1,000 2,000 1,500NEW YORK 4.0 - 8.82 8 8,200 (b) - 1,029,250 (b) 0 0 1,000RHODE ISLAND (a) 3.75 - 5.99 3 60,550 - 137,650 3,850 7,700 3,850VERMONT (a) 3.55 - 8.95 5 37,450 (u) - 411,500 (u) 4,000 (d) 8,000 (d) 4,000 (d)
-DIST. OF COLUMBIA ( 4.0 - 8.95 4 10,000 - 350,000 1,675 3,350 1,675
43
VII. Conclusion The personal income tax is the most important source of own-source state revenue in Connecticut. The taxable income base is Connecticut AGI which equals [Federal AGI + Connecticut Additions to AGI – Connecticut Subtractions from AGI]. The additions to Federal AGI mainly consist of income (such interest on tax-exempt debt issued by jurisdictions other than Connecticut) which is exempt from federal tax, but taxable in Connecticut. The subtractions from Federal AGI include items of income that Connecticut is constitutionally prohibited from taxing, (e.g. interest and/or dividends on debt issued by the federal government) as well as all or a portion of Social Security benefits, and all of Military Retirement Benefits. The Connecticut PIT was assessed against four criteria that are widely used to evaluate the performance of particular taxes: (1) revenue adequacy, (2) tax fairness, (3) ease of administration and compliance, and (4) competitiveness with other jurisdictions. Because Connecticut currently taxes a relatively broad income base, with relatively few individual tax preferences, the Connecticut PIT performs reasonably well against each of the above criteria. Thus, there are no specific changes that would lead to a major improvement in performance. There are, however, a number of areas in which modifications of current practices could yield modest improvements, some of which might prove more significant at time goes on.

44
VIII. References Anderson, John. 2012. "State Tax Rankings: What Do they and Don't They Tell Us?"
National Tax Journal 65 (4):985-1010. Auten, Gerald and Cordes, Joseph. 1991. "Cutting Capital Gains Taxes." Journal of
Economic Perspectives 5(1) 181-192. Berman and Slemrod. 2013. Taxes in America. Oxford University Press. Bordeaux, Carolyn. 2015. Connecticut Fiscal Comparisons. Connecticut State Tax Panel.
Draft for Panel Discussion. Bruce, Donald, Fox, William, and Yang, Zhou. "Base Mobility and State Personal
Income Taxes." National Tax Journal. 63(4) 945-966. Bruce, Donald, Fox, William, and Tuttle, M.H. 2006. "Tax Base Elasticities: A Multi-
State Analysis of Long-Run and Short-Run Dynamics." National Tax Journal 73(2).
Center on Budget and Policy Priorities. 2015. http://www.cbpp.org/research/federal-tax/policy-basics-the-earned-income-tax-credit
Connecticut Department of Revenue Services. 2014. Personal Income Tax Study. _____. 2015. Connecticut Tax Incidence. _____. 2015. http://www.ct.gov/drs/cwp/view.asp?a=1450&q=529592#stats Connecticut Office of Fiscal Analysis. 2014. Connecticut Tax Expenditure Report. Cordes, Joseph, and Holen, Arlene. 2010 Should the Government Prepare Individual
Income Tax Returns? Technology Policy Institute Drenkard, Scott, and Joseph Henchman. 2015. 2015 State Busines Tax Climate Index.
Washington, D.C.: The Tax Foundation. Fisher, P. 2005. Grading Places: What do the Business Climate Rankings Really Tell
Us?: Economic Policy Institute. Gale, William G., Aaron Krupkin, and Kim Rueben. 2015. “The Relationship between
Taxes and Growth at the State Level: New Evidence.” Brookings Institution and Urban-Brooking Tax Policy Center and Urban Institute working paper April 2015.
Guyton, John, O'Hare John F., and Stavrianoa, Michael P. 2003. Estimating the Compliance Cost of the Individual Income Tax. 55 (3).
Malm, Liz, and Kyle Pomerleu. 2015. Comments on Who Pays? A Distributional Analysis of the Tax System in All 50 States. In Fiscal Fact No. 447. Washington, D.C.: Tax Foundation.
Pellowski, Matthew. 2015. Overview of Connecticut State Revenue System. Office of Policy and Management.
Statistics of Income Division, Internal Revenue Service, 2015. State Tax Statistics. https://www.irs.gov/uac/SOI-Tax-Stats-Historic-Table-2
Taxpayer Advocate Service, Internal Revenue Service. 2012. 2012 Annual Report to Congress.
Tax Foundation. 2014. Which States Have the Most Progressive Income Taxes? Wallace, Sally, 2015. Fiscal Architecture of Connecticut. Connecticut Tax Panel. Wasylenko, Michael. 2015. Competitiveness: Factors that Contribute to Economic
Growth in States with Special Reference to State and Local Spending and Taxes. Connecticut Tax Panel. Draft for Discussion.

45
Notes 1 See Connecticut Department of Revenue Services (2014). 2 Single filers with a federal AGI of $50,000 or less, and joint filers with federal AGI of $60,000 or less subtract 100% of social security benefits included in Federal AGI. Single and joint filers with incomes above these thresholds subtract 75% of Social Security benefits included in federal AGI. 3 This section is drawn from Auten and Cordes (1991).