the comprehensive school climate inventory
TRANSCRIPT

The Comprehensive School Climate Inventory
Measuring the Climate for Learning
The CSCI has been developed by the National School Climate Center (NSCC)schoolclimate.org
Prepared for Whately Elementary School, December 2015

schoolclimate.org | page 2
• Togetafullerpictureoftherange of perceptionswithineachschoolgroupabouteachdimension,lookatthescoredistributionsinGroup Rating and Rankings on pages 15-18.
• Examinehowdifferentsub-groupswithineachschoolgroupviewedthevariousdimensionsbeginningonpage .Thisshowsdifferent perceptionsbasedongender,grade,race/ethnicity,and(forschoolpersonnel)yearsofexperience.
Note:thisdatawillonlybeshownwhentherearesufficientnumberstoguaranteeanonymityforrespondents.
• Reviewtheoverviewinformationintheleft-handcolumn,andthein-depthinformationinthecentercolumn.
• Readcarefullythroughtheentirereport—thereareadditionalgraphsthatarenotidentifiedintheothertwocolumns.Detailedexplanationsandguidingquestionsareincludednexttoeachgraph.
• Onpages - , you’llfindadetailed breakdownofhoweachgrouprespondedtoeach individual survey item.Thesearegroupedbyschoolclimatedimension,soyoucanseeexactlywhichsurveyitemsmadeupeachdimension.Thefull text of the itemisincluded,aswellasachartshowingthepercentageofrespondentsfromthatgroupwhogaveeachofthefivepotentialresponses,ordidnotrespondatall.
Note:Thesurveywasdevelopedtobemost reliableatthelevelofclimatedimensions,ratherthanitem-by-item.Therefore,NSCCdoesnotrecommendmakingdecisionsbasedonthisdataalone.
If you need an in-depth look at your survey results:
If you need to see a simple overview of your survey results:
If you need a detailed examination of your survey results:
Adapt this school climate report to meet your needs:
121112
52
77 111
• Reviewtheresponse ratesforyourschoolonpages 11-12.Alsolookatthedemographic graphs on pages - .
• Identifyanyunder-representedpopulationsordemographicgroups,andkeepthisinmindasyouread.
• Besureyouunderstandthedimensions of school climate,asmeasuredbytheCSCI.Seepage 5foranexplanation.
• Lookatthesummary graphsonpages 13-20toseehoweachgroupperceivesthedimensionsofclimateinyourschool.
• Lookattherelative rankingsforeachschoolgrouponpages 21-23, andseehowtheycompareacrossgroups.
• Lookforareas rated negativelybyoneormoregroups,aswellasdimensions that are ranked very differentlybydifferentgroups.Thesecouldsignalareasthatneedattention.Reviewtheguidelines for improvementonpages - tobeginworkingtowardschoolclimatechange.
• Reviewtheoverviewinformationintheleft-handcolumn.
122 124

schoolclimate.org | page 3
Report Contents
The Comprehensive School Climate Inventory (CSCI). Copyright © 2013 by the National School Climate Center (NSCC).
I. Introduction. . . . . . . . . . . . . . . . . . . . . . . . . . . . . . . . . . . . . . . . . . . . . . . . . . . . . . . . . . 4The Dimensions of School Climate . . . . . . . . . . . . . . . . . . . . . . . . . . . . . 5
II. School Climate Overview . . . . . . . . . . . . . . . . . . . . . . . . . . . . . . . . . . . . . . . . . . . .10School Voice: Response Rates . . . . . . . . . . . . . . . . . . . . . . . . . . . . . . . . . 11Group Ratings and Rankings . . . . . . . . . . . . . . . . . . . . . . . . . . . . . . . . . . 15
III. In-Depth Profiles . . . . . . . . . . . . . . . . . . . . . . . . . . . . . . . . . . . . . . . . . . . . . . . . . . . .24
School Climate DimensionsSafety—Rules and Norms . . . . . . . . . . . . . . . . . . . . . . . . . . . . . . . . . . . . . 28Sense of Physical Security . . . . . . . . . . . . . . . . . . . . . . . . . . . . . . . . . . . . 30Sense of Social-Emotional Security . . . . . . . . . . . . . . . . . . . . . . . . . . . . 32Support for Learning. . . . . . . . . . . . . . . . . . . . . . . . . . . . . . . . . . . . . . . . . . 34Social and Civic Learning. . . . . . . . . . . . . . . . . . . . . . . . . . . . . . . . . . . . . . 36Respect for Diversity . . . . . . . . . . . . . . . . . . . . . . . . . . . . . . . . . . . . . . . . . . 38Social Support—Adults . . . . . . . . . . . . . . . . . . . . . . . . . . . . . . . . . . . . . . . 40Social Support—Students . . . . . . . . . . . . . . . . . . . . . . . . . . . . . . . . . . . . 42School Connectedness/Engagement . . . . . . . . . . . . . . . . . . . . . . . . . . 44Physical Surroundings . . . . . . . . . . . . . . . . . . . . . . . . . . . . . . . . . . . . . . . . 46Social Media. . . . . . . . . . . . . . . . . . . . . . . . . . . . . . . . . . . . . . . . . . . . . . . . . . 48Leadership (School Personnel) . . . . . . . . . . . . . . . . . . . . . . . . . . . . . . . . 50Professional Relationships (School Personnel) . . . . . . . . . . . . . . . . . 51
Sub-group RatingsStudents . . . . . . . . . . . . . . . . . . . . . . . . . . . . . . . . . . . . . . . . . . . . . . . . . . . .School Personnel . . . . . . . . . . . . . . . . . . . . . . . . . . . . . . . . . . . . . . . . . . . .Parents . . . . . . . . . . . . . . . . . . . . . . . . . . . . . . . . . . . . . . . . . . . . . . . . . . . . . .
IV. Detailed Findings . . . . . . . . . . . . . . . . . . . . . . . . . . . . . . . . . . . . . . . . . . . . . . . . .Scale Scores by Group . . . . . . . . . . . . . . . . . . . . . . . . . . . . . . . . . . . . . . .Survey Responses . . . . . . . . . . . . . . . . . . . . . . . . . . . . . . . . . . . . . . . . . . .Demographic Profiles . . . . . . . . . . . . . . . . . . . . . . . . . . . . . . . . . . . . . . .
V. Recommended Guidelines and Resources . . . . . . . . . . . . . . . . . . . . . . . .Process Recommendations: How to Do It and Where to Start. . . . . . . . . . . . . . . . . . . . . . . . . . . . . .
VI. Action Charts. . . . . . . . . . . . . . . . . . . . . . . . . . . . . . . . . . . . . . . . . . . . . . . . . . . . . . .Physical Safety . . . . . . . . . . . . . . . . . . . . . . . . . . . . . . . . . . . . . . . . . . . . . .Social-Emotional Safety . . . . . . . . . . . . . . . . . . . . . . . . . . . . . . . . . . . . . .Support for Learning. . . . . . . . . . . . . . . . . . . . . . . . . . . . . . . . . . . . . . . . .Social and Civic Learning. . . . . . . . . . . . . . . . . . . . . . . . . . . . . . . . . . . . .Respect for Diversity . . . . . . . . . . . . . . . . . . . . . . . . . . . . . . . . . . . . . . . . .Social Support—Adults & Students. . . . . . . . . . . . . . . . . . . . . . . . . . .School Connectedness/Engagement . . . . . . . . . . . .Physical Surroundings . . . . . . . . . . . . . . . . . . . . . . . . . . . . . . . . . . . . . . .Leadership and Professional Relationships. . . . . . . . . . . . . . . . . . . .Social Media. . . . . . . . . . . . . . . . . . . . . . . . . . . . . . . . . . . . . . . . . . . . . . . . .
Appendix A: Further Details on the CSCI Measure . . . . . . . . . . . . . . . . . . . . .
5953
68
122
123
125126128130132134136138140142
7677
112
144
143
75
schoolclimate.org | page 4
What is school climate?
• Schoolclimatereferstothequalityofschoollifeasitrelatestonormsandvalues,interpersonalrelationsandsocialinteractions,andorganizationalprocessesandstructures.
• Theschoolclimatesetsthetoneforallthelearningandteachingdoneintheschoolenvironment,andispredictiveofstudents’abilitytolearnanddevelopinhealthyways.
• Allschools,likeallpeople,havearangeofstrengthsandweaknesses,aswellasadistinctivevisionforthekindofschooltheyaspiretobe.
Measuring school climate: the CSCI
• TheCSCI(ComprehensiveSchoolClimateInventory)isascientificallydevelopedsurveybasedonresearchandtheorydefiningwhatcontributestopositiveclimatesforlearning.
• TheCSCImeasuresthesharedperceptionsoftheschoolcommunityandrevealshowthepopulationswhoseperceptionsweremeasured(e.g.students,schoolpersonnel,andparents)feelabouttheschoolenvironment.
Who developed the CSCI?
• TheCSCIwasdevelopedbytheNationalSchoolClimateCenter(NSCC),anon-profitorganizationdedicatedtomeasuringandimprovingtheclimateforlearninginschools.NSCC’smissionistohelpschoolsintegratecrucialsocial,emotional,andethicallearningwithacademicinstructiontoenhancestudentperformance,preventdropouts,reduceviolence,anddevelophealthyandpositivelyengagedadults.
I. Introduction

schoolclimate.org | page 5
I. IntroductionThe 13 Dimensions of School Climate Measured by the CSCI
Dimensions Major Indicators
Safety
1 Rules and Norms Clearlycommunicatedrulesaboutphysicalviolence;clearlycommunicatedrulesaboutverbalabuse,harassment,andteasing;clearandconsistentenforcementandnormsforadultintervention.
2 Sense of Physical Security Sensethatstudentsandadultsfeelsafefromphysicalharmintheschool.
3 Sense of Social-Emotional Security Sensethatstudentsfeelsafefromverbalabuse,teasing,andexclusion.
Teaching and Learning
4 Support for Learning Useofsupportiveteachingpractices,suchas:encouragementandconstructivefeedback;variedopportunitiestodemonstrateknowledgeandskills;supportforrisk-takingandindependentthinking;atmosphereconducivetodialogandquestioning;academicchallenge;andindividualattention.
5 Social and Civic Learning Supportforthedevelopmentofsocialandcivicknowledge,skills,anddispositionsincluding:effectivelistening,conflictresolution,self-reflectionandemotionalregulation,empathy,personalresponsibility,andethicaldecisionmaking.
Interpersonal Relationships
6 Respect for Diversity Mutualrespectforindividualdifferences(e.g.gender,race,culture,etc.)atalllevelsoftheschool—student-student;adult-student;adult-adultandoverallnormsfortolerance.
7 Social Support—Adults Patternofsupportiveandcaringadultrelationshipsforstudents,includinghighexpectationsforstudents’success,willingnesstolistentostudentsandtogettoknowthemasindividuals,andpersonalconcernforstudents’problems.
8 Social Support—Students Patternofsupportivepeerrelationshipsforstudents,including:friendshipsforsocializing,forproblems,foracademichelp,andfornewstudents.
Institutional Environment
9 School Connectedness/Engagement Positiveidentificationwiththeschoolandnormsforbroadparticipationinschoollifeforstudents,staff,andfamilies.
10 Physical Surroundings Cleanliness,order,andappealoffacilitiesandadequateresourcesandmaterials.
Social Media
11 Social Media Sensethatstudentsfeelsafefromphysicalharm,verbalabuse/teasing,gossip,andexclusionwhenonlineoronelectronicdevices(forexample,facebook,twitter,andothersocialmediaplatforms,byanemail,textmessaging,postingphoto/video,etc.).
Staff Only
12 Leadership Administrationthatcreatesandcommunicatesaclearvision,andisaccessibletoandsupportiveofschoolstaffandstaffdevelopment.
13 Professional Relationships Positiveattitudesandrelationshipsamongschoolstaffthatsupporteffectivelyworkingandlearningtogether.

schoolclimate.org | page 6
I. IntroductionThe 13 Dimensions of School Climate Measured by the CSCI
Safety: Rules and NormsThisscalefocusesontheclarityoftheschool’srulesformaintainingsafety,bothphysicalsafetyandsocial-emotionalsafety,andtheconsistencyandfairnesswithwhichrulesareenforced.Forexample,isitclearthattherearerulesaboutphysicalandsocialbullying?Aretheyfairlyenforcedbyadultsintheschool?
Safety: Sense of Physical SecurityThisscalefocusesonthedegreetowhichpeoplefeelphysicallysafeintheschoolbuildingandintheareasurroundingtheschool.Forexample,haveindividualsthemselvesexperiencedphysicalabuseandtowhatextenthavetheyseenothersbeingsubjectedtophysicalharmsuchaspushing,slappingorpunching?
Safety: Sense of Social-Emotional SecurityThisscalefocusesonthedegreetowhichpeoplefeelsafeinsocial-emotionalterms.Questionsonthisscaleprobeexperienceandwitnessingofverbalabuse,harassment,andexclusion.
SAFETYSafetyisabasicneed.Feelingunsafenaturallyundermineslearningandhealthydevelopment.Safeschoolspromotestudentachievementandschoolsuccess.Historically,schoolshaveconcentratedonphysicalsafety,showinglesssensitivitytoemotionalsafety.Inrecentyears,schoolshavebecomemoreattunedtohowsocialsafetyandtheproblemofsocialbullyingshapeslearninganddevelopment.Thissurveylooksatthreeaspectsofsafety:rulesandnorms(institutionalsafety)andactualsenseofsecurity—bothphysicalandsocial-emotional.
Teaching and Learning: Support for LearningThisscalehighlightsadults’andstudents’interactionsinthelearningprocess.Forexample,dostudentsfeelthatteachersletthemknowwhentheydoagoodjobandofferthemconstructivefeedback?Isschoolworkchallenging?Istheresupportforlearningfrommistakes?Isthereanopportunitytodemonstrateknowledgeandskillsinavarietyofways?
Teaching and Learning: Social and Civic LearningThisscaledescribestheextenttowhichsocialandcivicknowledgeandskillsareactivelyincorporatedintoschoollearningandhowethicaldispositionsarerecognizedandvalued.Forexample,dostudentslearntolistenandcooperatewithothers?Aretheyencouragedtothinkabout“right”and“wrong”?Aretheysupportedinthedevelopmentofskillsforreflectionandself-control?Dotheylearnhowtoresolveconflictseffectivelyandamicably?
TEACHING AND LEARNINGThegoalofschoolingistofosterlearninganddevelopment.Educationalresearchhasidentifiedfactorsthatinfluenceschoolsuccess,includingtheuseofvariedandcustomizedinstructionalstrategiesandthepromotionofstudents’reflective,self-monitoring,anddecision-makingskills.Studentsarealsomoreablelearnerswhentheyaremadecomfortabletakingrisks,whentheyfeelsafe“notknowing”,andcangenuinelyaskforhelpinunderstanding.Adults’expectationsforstudents—andtheabilitytocommunicatethis—alsopowerfullyshapelearningandschoolengagement.Teachingandlearningisalwayssocial,emotionalandethicalaswellascognitiveinnature.Activeandpurposefulsocial,emotional,andethicalteachingandmodelingalsosupportsstudents’academicachievementandschoolsuccess,aswellastheirdevelopmentintoresponsibleandproductivecitizens.

schoolclimate.org | page 7
INTERPERSONAL RELATIONSHIPSSchoolexperiencesarebasedonrelationships.Theextenttowhichadultsandstudentslistento,respectandtrustoneanothershapestheschoolcommunity.Howdostudentstreatoneanotheranddotheyhaveanetworkoffriendstheycancountonforsupport?Whatisthequalityofsupporttheyfeeltheycanexpectfromadultsintheschool?Dotheyfeelthereareadultswhocareaboutthemasindividualsandtowhomtheycanturnforhelp?Finally,howwelldoadultscommunicateandcollaboratewithoneanotherandwhattonedoesthatsetforstudents?Howallofthisisperceivedbystudentsprofoundlyaffectstheirexpectationsforappropriatebehaviorandthequalityoftheirschoolexperience.
I. IntroductionThe 13 Dimensions of School Climate Measured by the CSCI
Interpersonal Relationships: Respect for DiversityThisscalefocusesontheextenttowhichadultsandstudentsintheschoolrespecteachothers’differenceswithregardtosuchfactorsasgender,race/ethnicity,orphysicaldifferences.Itfocusesonpeerrelationshipsamongstudentsandamongadultsandontherelationshipsbetweenadultsandstudents.
Interpersonal Relationships: Social Support—AdultsThisscaledealswithqualityofsocialrelationshipsamongadultsandstudents.Istheremutualtrustandsupport?Doadultsappeartoworkwellwiththeirpeers?Dostudentsfeelthatadultsintheschoolshowaninterestinthemandlistentowhattheyhavetosay?
Interpersonal Relationships: Social Support—StudentsThisscaledealswithqualityofsocialsupportamongstudents.Dostudentshaveanetworkoffriendsthatsustainthemacademicallyandsocially?
INSTITUTIONAL ENVIRONMENT Theinstitutionalenvironmentintheschoolisdefinedinbothphysicalandsocialterms.Socially,thisentailsstudents’positivesenseofconnectednesstoandengagementinthelifeoftheschoolasaninstitution.Dotheyidentifypositivelywiththeschoolandhaveasensethatboththeyandtheirfamiliesbelongthereandarewelcome.Thisisanimportantaspectofastudent’sschoolexperienceandcontributessubstantiallytoschoolsuccess.Thephysicalenvironment—facilitiesandresources—isalsoimportant.Naturally,howclean,caredfor,orderlyandattractivetheschoolisaffectsteaching,learning,schoolengagementandoverallmorale.
Institutional Environment: School Connectedness/EngagementThisscalefocusesonhowpositivelystudentsfeelabouttheirschoolandthedegreetowhichtheyandtheirfamiliesareencouragedtoparticipateinschoollife.Dostudentsfeelgoodabouttheirschoolandwhattheyaccomplishthere?Dotheyfeelthattheyareencouragedtobecomeinvolvedinschoollifebeyondacademics?Doestheschoolreachouttofamilies,bykeepingtheminformedandmakingthemfeelcomfortablespeakingwithteachersorattendingschoolevents?
Institutional Environment: Physical SurroundingsThisscalefocusesontheschool’sphysicalplant.Thisincludestherangeofschoolfacilities,theirattractiveness,cleanlinessandcondition,andtheadequacyofthespaceandresourcesforpositiveschoollife.

schoolclimate.org | page 8
I. IntroductionThe 13 Dimensions of School Climate Measured by the CSCI
STAFF ONLY DIMENSIONSAschool'sleadershipteam,aswellasprofessionalrelationshipsbetweenstaffmembers,areimportantwhenevaluatingaschool'soverallworkenvironment.Whetherornottheleadershipteamhasdefinedaclearvisionandwhatdecisionstheymaketofulfillthatvisiontremendouslyaffectsnotonlytheworkenvironment,buttheschoolclimateaswell.
Staff Only: LeadershipThisscalefocusesontheleadershipcharacteristicsanddecisionmakingstyleoftheschool’sadministration.Doschoolleadersestablishandcommunicateaclearvision?Aretheyaccessibleandopen?Aretheysupportiveandappreciativeofschoolstaff?Dotheyinvolvestaffinkeydecisions?
Staff Only: Professional RelationshipsThisscalefocusesonthequalityofworkingrelationshipsamongschoolstaff.Dostaffworkwelltogetherandlearnfromoneanother?Istheremutualtrustandconstructivecollaboration?Arestaffsupportiveofoneanotherandgenerouswiththeirhelp?
Social MediaThisscalefocusesonthedegreetowhichpeoplefeelsafeinsocial-emotionaltermsonsocialmedia.Questionsonthisscaleprobeexperienceandexposuretoverbalabuse,harassment,andexclusiononsocialmedia.
SOCIAL MEDIASafetyisabasicneed.Feelingunsafenaturallyundermineslearningandhealthydevelopment.Safeschoolspromotestudentachievementandschoolsuccess.Historically,schoolshaveconcentratedonhowtheproblemofsocial-emotionalbullyinginschoolshapeslearninganddevelopment.Inrecentyears,astechnologyhasbecomemorepervasiveinstudents’lives,schoolshavebecomemoreattunedtosocial-emotionalbullyingthatoccursonlineandthroughthephoneduetoitseffectonstudents’experiencewithpeerswithintheschool.

schoolclimate.org | page 9
Goals for this Report
The report will show you:
• Howsurveyedmembersofyourschoolcommunity—students, school personnelandparents—rateeachdimensionofschoolclimate.
• Whichdimensionsofschoolclimateareperceivedbyeachgroupasgenerallypositive, negative,orneutral.
• Whichdimensionsareratedhighestandlowestforeachgroupasawhole.
• Thedistribution of rating patternsforindividualswithineachgroupforeverydimensionsothatyoucanseetherange of responsesfromnegativetopositive.
• Where perceptions are consistentacrossthethreeschoolgroups—students,schoolpersonnelandparents—andwhere they diverge.
In reading through this report:
1. Youwillseethatsimilar information is presented in a variety of ways. Ifonegraphorchartdoesnotseemtocapturetheinformationyoufeelismostimportant,adifferentpartofthereportmayprovidewhatyouneed.
2. Lookingatresultsisoftenaquestionofpeelingbacklayersofinformation.Itisimportanttoprogress from overall summary to more detailed resultsinordertogetafullpicture.Lookingatresultsatonlyonelevelmaybemisleading.
3. Itisimportanttounderstandthattherealvalueinthedataisthedegreetowhichtheinformationbecomesacatalystfordiscussion,deeperinquiry,andaction.Thereportwillpresentthefindingsforyourschoolandtrytohelpyouunderstandhowtoexamineandinterpretthemtoaid the process of inquiry and discussion.
I. Introduction

schoolclimate.org | page 10
Thisoverviewsectionwillgiveyouasnapshot of who responded to the survey, as well as feedback on the way each school group perceives your school climate in the broadest terms—based on median scale scores for each dimension of school climate. Itwillalsogiveyouanoverview of the amount of variation within each group’s perceptions of these ten dimensions.
To help you interpret this feedback, results are presented:
1. asscoresthatcanbeconsideredpositive, negativeandneutral
2. in rank orderfromthehighesttolowestrateddimensions
3. ascomparative profilestohelpyouunderstandhoweach groupperceivestherangeofdimensionsandhoweach dimensionisperceivedacrossthedifferentgroups
II. School Climate Overview

schoolclimate.org | page 11
Why is this important?
• Oneofthemostimportantattributesofthissurveyisitsabilitytoreflecttheperceptionsofthedistinctpopulationswhoweresurveyed—students,schoolpersonnelandparents.Therefore,itisimportanttoknowhowmanymembersofeachgroupresponded.
How to look at this data:
• Itisnot unusual to see the lowest response rates for parents,astheyarefurtherremovedfromschoollifethanstudentsorschoolpersonnel.
• Thesurveyresultsaremostvaluablewhentheycapturetheperceptionsofallschoolcommunitymembers,andlow response rates should be addressed.
• IntheDetailedResultssection,thereisademographic profileofrespondentsinallthreegroups.Inadditiontoconsideringtheoverallresponserate,itisrecommendedthatyoulookattheprofileofrespondentscomparedtoyourschoolprofile.Totheextentthatrespondentsforeachgroupdonotmirrortheschool’scomposition, the voice you are hearing may be skewed.Youshouldkeepthisinmindandmakeanefforttoreachouttogroupsthatappeartohavebeenunder-represented.
• Thisisespeciallyimportantifthesurveyresultsindicatethatdifferentsub-groupsexperiencetheschoolinverydifferentways,whichyoucanseeinSectionIII.
School Voice: Response Rates
II. School Climate Overview

schoolclimate.org | page 12
Group Population Size # Respondents % of Population RepresentedStudents 74* 73 98.65%
School Personnel 44* 40 90.91%
Parents 103* 75 72.82%
*Figures received from school to represent potential number of respondents.
School Voice: Response Rates
II. School Climate Overview

schoolclimate.org | page 13
Why is this important?
• Thischartallowsyoutolookatacomparativeprofileoftheoverall(median)ratingstohelpyouunderstandtwoimportantrelationships:1.howratingsfordifferentdimensionscompareforthesameschoolgroup;and2.howratingsforsimilardimensionscompareacrossschoolgroups.
How to look at this data:
• Thebarsarecolor-codedtohelpyouseeataglancethedimensionsthateachgroupratesaspositive(higherthan3.5),negative(lowerthan2.5),orneutral(between2.5and3.5).
• Lookforeachgroup’srelativeperceptionsaboutthevariousaspectsofschoolclimatebylookingacrossthechart.
• Lookattheconvergenceofopinionacrossgroupsbylookingatthecolumnsthatcorrespondtoeachdimension.
Important Note:
Whenyoucompareresultsacrossgroups,rememberthatwhilethesurveysaredesignedtomeasuresimilardimensions,theydosoinslightlydifferentwaysandwithdifferentpopulations.Therefore,somelevelofdifferenceistobeexpected,simplybecauseofthedifferencesinherentinthegroupsthemselves.(Forexample,adultsmaybelesslikelytogiveextremeanswersthanstudentsasaresultofage.)Werecommendthatyouconcentratemostonmajordifferences,andpayspecialattentiontotherelativerankingsofthedimensionsbyeachgroup.Forexample,iftheschoolpersonnelratedtheenvironmenthigherthananyotherdimension(regardlessoftheactualnumericalscore),whilethestudentsrateditnearthebottom,thatwouldbeworthexploring.
For more detailed informationabouteachgroup’sperceptions,besuretolookatthedetailedresponsepatterns(inSectionIIIofthisreport).Themedianisonlyamidpoint—thereareasmanyscoresbelowthatnumberasabove.
School Climate Ratings—Positives, Negatives and Neutrals
II. School Climate Overview

schoolclimate.org | page 14
School Climate Ratings—Positives, Negatives and Neutrals
II. School Climate Overview
= median rating in the negative range (scores lower than 2.5 on a 5-point scale)
= median rating in the neutral range (scores between 2.5 and 3.5 on a 5-point scale)
= median rating in the positive range (scores above 3.5 on a 5-point scale)

schoolclimate.org | page 15
Why is this important?
• Thesechartsallowyoutoseehoweachgroupratesthedimensionsofschoolclimate,aswellasthevariabilityofopinionwithineachgroup.
How to look at this data:
• Inthecentercolumn,you’llseethemedianscalescoreforeachoftherelevantdimensionsthatcontributetooverallschoolclimate.
• Themedian score is the midpointofthedistributionofscalescoresfortheindividualsinthisgroup.Itshouldgiveyouanunderstandingofhowthegroupas a wholeperceiveseachdimension.
• You’llalsoseethateachbariscolorcodedintothreesectionsfromdarkesttolightest.Inlookingattheresults,itisimportanttounderstandnotjusthowthegroupasawholeperceivesthisdimension,butalsotherangeanddistributionofopinionwithineachgroup.
• Thecolorcodingrepresentsthepercentageofindividualsineachgroupwhosescalescoresfallintothreeranges:negative(<2.5),positive(>3.5)andneutral(2.5-3.5).
Note:
How were these dimension scores obtained from the survey responses, and how were “negative,” “neutral,” and “positive” scores identified?
Asyoumayrememberfromthesurveyitself,possibleresponsesrangedfrom1(themostnegative)to5(themostpositive).Eachofthesurveyitemsislinkedtooneparticulardimensionofschoolclimate.Foreachdimension,wegiveeachindividualrespondenta“scalescore”basedonanaverageofhisorherresponsestothoseparticularitems.Inordertoobtainanoverallsenseofthegroup’sperceptionofaparticulardimension,wefoundthemedianofalltheindividualscalescores.The median is a midpoint—there are equal numbers of scores below and above the median. Tohelpyouinterpretthescores,we’vegroupedthemaccordingtothe5-pointscalefromtheoriginalsurvey.Anyindividualdimensionscoresbelow2.5wereconsiderednegative,anyscoresabove3.5wereconsideredpositive,andanyscoresbetween2.5and3.5wereconsideredneutral.
Group Ratings and Rankings
II. School Climate Overview

schoolclimate.org | page 16
Median Scores and Rating Patterns — StudentsDimension Median Score DistributionSafety 33.3% 33.3% 33.3%
Rules and Norms 4.60 1% 8% 90%
Physical Security 4.00 6% 34% 61%
Social - Emotional Security 3.50 5% 49% 45%
Teaching and Learning
Support for Learning 4.25 1% 16% 82%
Social and Civic Learning 4.20 19% 81%
Interpersonal Relationships
Respect for Diversity 4.33 1% 8% 90%
Social Support - Adults 4.29 1% 5% 93%
Social Support - Students 4.00 15% 85%
Institutional Environment School Connectedness Engagement
4.29 16% 84%
Physical Surroundings 4.33 1% 12% 86%
Social Media Social Media 3.50 7% 48% 45%
= % of individual ratings in the negative range (scores lower than 2.5 on a 5 - point scale)
= % of individual ratings in the neutral range (scores between 2.5 and 3.5 on a 5 - point scale)
= % of individual ratings in the positive range (scores above 3.5 on a 5 - point scale)
Group Ratings and Rankings
II. School Climate Overview

schoolclimate.org | page 17
Median Scores and Rating Patterns — School PersonnelDimension Median Score DistributionSafety 33.3% 33.3% 33.3%
Rules and Norms 4.40 11% 89%
Physical Security 4.25 19% 81%
Social - Emotional Security 3.58 5% 45% 50%
Teaching and Learning
Support for Learning 4.17 16% 84%
Social and Civic Learning 4.20 10% 90%
Interpersonal Relationships
Respect for Diversity 4.00 25% 75%
Social Support - Adults 4.33 11% 89%
Social Support - Students 4.00 11% 89%
Institutional Environment School Connectedness Engagement
4.14 14% 86%
Physical Surroundings 4.50 8% 92%
Social Media Social Media 3.60 48% 52%
Working Environment
Leadership 4.10 8% 16% 76%
Professional Relationships 4.13 20% 80%
= % of individual ratings in the negative range (scores lower than 2.5 on a 5 - point scale)
= % of individual ratings in the neutral range (scores between 2.5 and 3.5 on a 5 - point scale)
= % of individual ratings in the positive range (scores above 3.5 on a 5 - point scale)
Group Ratings and Rankings
II. School Climate Overview

schoolclimate.org | page 18
Median Scores and Rating Patterns — ParentsDimension Median Score DistributionSafety 33.3% 33.3% 33.3%
Rules and Norms 4.00 3% 14% 84%
Physical Security 3.75 4% 38% 58%
Social - Emotional Security 3.58 8% 42% 50%
Teaching and Learning
Support for Learning 3.88 1% 22% 77%
Social and Civic Learning 3.80 3% 21% 76%
Interpersonal Relationships
Respect for Diversity 4.00 3% 23% 74%
Social Support - Adults 4.00 1% 15% 84%
Social Support - Students 3.80 4% 19% 76%
Institutional Environment School Connectedness Engagement
4.00 1% 12% 86%
Physical Surroundings 4.17 1% 3% 96%
Social Media Social Media 3.33 2% 71% 27%
= % of individual ratings in the negative range (scores lower than 2.5 on a 5 - point scale)
= % of individual ratings in the neutral range (scores between 2.5 and 3.5 on a 5 - point scale)
= % of individual ratings in the positive range (scores above 3.5 on a 5 - point scale)
Group Ratings and Rankings
II. School Climate Overview
schoolclimate.org | page 19
Comparative Ratings—Another View
Why is this important?
• Asacompaniontothepreviouschart,thischartpresentsthepositive,negativeandneutralratingsinslightlydifferentform.
How to look at this data:
• Youwillseeeachschoolclimatedimensionlistedintheleftcolumn,withthesurveyedschoolgroupsacrossthetop.Foreachgroupthechartindicateswhetherthemedianscalescorewaspositive,negativeorneutralasshowninthecolor-codedkey.
• Werecommendthatyoukeepinmindtheconsiderationsdiscussedearlieraboutgroupdifferences,althoughmajordiscrepanciesbetweenschoolgroupsshouldcertainlybeexploredfurther.
• Dimensionsthatareratednegatively,especiallyifthenegativeratingsareconsistentacrossgroups,indicateareasthatshouldbeaddressed.Becausesafety is such a foundational dimension,specialattentionshouldbepaidtolowratingsinthisarea.
• Weencourageyoutoexamine these findings in the contextofthemoredetailedprofilesthatfollow.Inallcases,itisimportanttoconsideranddiscussnotjustwhetherdimensionsareratedpositivelyornegatively,butalsotouse the results to think about why—whatyouasaschoolmayhavedonetopromotedimensionsthatarestrong,andhowweakerdimensionsmayhavebeenneglectedoreveninadvertentlyundermined.
• NSCCalsorecommendsthattheanswerstothesequestionsleadyoutoconsider more questions and ideas for data-gatheringinyourschool,eithernoworinthefuture.
II. School Climate Overview

schoolclimate.org | page 20
Comparative Ratings — Another ViewStudents School Personnel Parents
Safety Rules & Norms
Sense of Physical Security
Sense of Social-Emotional Security
Support for Learning
Social and Civic Learning
Respect for Diversity
Social Support/ Adults
Social Support/ Students
Connectedness/ Engagement
Physical Surroundings
Social Media
Leadership --- N/A --- --- N/A ---
Professional Relationships --- N/A --- --- N/A ---
= median rating in the negative range (scores lower than 2.5 on a 5 - point scale)
= median rating in the neutral range (scores between 2.5 and 3.5 on a 5 - point scale)
= median rating in the positive range (scores above 3.5 on a 5 - point scale)
Comparative Ratings—Another View
II. School Climate Overview

schoolclimate.org | page 21
Why is this important?
• Thischartallowsyoutolookatscale scores in relative termsforeachschoolgroup.Italsoallowsyoutolookattheorderinwhicheachgroupratesthedimensionsincomparisonwiththeothertwogroups.Thisshouldgiveyouasenseofthewaythoseindifferentgroupsperceivetheschool’srelativestrengthsandweaknesses.
How to look at this data:
• Thischartshowsyouagraphicrepresentationofeach school group’s median dimension ratings, in rank orderfromhighest-ratedtolowest-rated.Youcanusethischarttocompare the relative perceptionsofthedifferentgroups—forexample,aparticulardimensionmayberatedatthetopforonegroup,butnearthebottomforanother.Thisshouldgiveyouasenseofhowthedifferentgroupsperceivetheschool’srelativestrengthsandweaknesses.
• Resultsarepresentedasaseriesofside-by-sidegraphs,oneforeachschoolgroup.Thelengthofthebarindicatesthevalueofthemedianrating(whichisalsoshownnumericallyattheendofthebaritself ).
• Thedimensions are color-coded, soyoucaneasilylookacrossgroupstoseehowthedifferentgroupsperceivedaparticulardimensionofschoolclimate.
• NSCCencouragesyoutofocus on relative rankings rather than numerical ratings.Inotherwords,ifstudentsrateEnvironmenthigherthananyothercategory,whileteachersrateitoneofthelowest,youmightobtaina better understandingofthedifferenceinperceptionsthanifyousimplycomparethemedianratingforeachgrouponthatdimension.Somakeuseofthisgraphtoexaminetherelativerankings,andhowtheperceptionsofthedifferentgroupscomparetooneanother.
The chart on the following pageisacompaniontothisandpresentstherelativerankingsforeachgroupinanumeric(ratherthangraphic)format.
Relative Strengths and Weaknesses
II. School Climate Overview

schoolclimate.org | page 22
II. School Climate Overview

schoolclimate.org | page 23
Comparative Rankings for Shared School Climate Dimensions
School Climate Dimensions Students School Personnel Parents
Safety Rules & Norms 1 2 2
Respect for Diversity 2 8 2
Physical Surroundings 2 1 1
Social Support / Adults 4 3 2
School Connectedness /Engagement 4 7 2
Support for Learning 6 6 6
Social and Civic Learning 7 5 7
Sense of Physical Security 8 4 9
Social Support / Students 8 8 7
Sense of Social-Emotional Security 10 11 10
Social Media 10 10 11
Note: If two or more dimensions have the same median score, they are given the same (higher) rank. Forexample, if two dimensions score a 4.0 and that is the highest score, they will both be ranked "1" and the nexthighest score will be ranked "3."
Group Differences
II. School Climate Overview

schoolclimate.org | page 24
ThisIn-DepthProfilesectionwillprovideyouwithadeeper and more focused pictureofperceptionsaboutsafety,teachingandlearning,relationships,andtheinstitutionalenvironmentforeachoftheschoolgroupsandforselected sub-groupsofstudents,schoolpersonnelandparents.
TheSchool Climate Dimensions and Comparative Rating Patternssectionswillprovideinformationontheratingpatternsofeachgroupforeachdimension,lookingatconsistencyofresponseforeachschoolgroupacrossschooldimensionsandalsocomparingthepatternsacrossthesurveyedschoolgroups.
IntheOverviewsectionatthebeginningofthisreport,theemphasiswasonoverall group response, basedonmedian,ormid-pointscores,whichisagoodindicatorofoverallopinion.However,one overall measure can never fully capture everything thatyouwanttoknow.Thissectionofthereportwillhelpyoudig deepertounderstandthedistributionofresponsesandactaccordingly.
TheSub-GroupProfilessectionfocusesoncomparative ratings for key sub-groups. This includes students(e.g.grade,gender,race/ethnicity,languagestatus);school personnel(e.g.gradeandexperience);andparents(e.g.grade,race/ethnicity).Thisshouldhelpyouseewhetherthereareidentifiablegroupsthatperceiveschoolclimatedimensionsinconsistentlydifferentwaysandwhichdimensionsmightbemostsensitivetodifferentpopulationcharacteristics.
• Introduction
• SchoolClimateDimensions:– Safety—Rules & Norms– Sense of Physical Security– Sense of Social-Emotional Security– Support for Learning– Social & Civic Learning– Respect for Diversity– Social Support—Adults– Social Support—Students– School Connectedness/Engagement– Physical Surroundings– Leadership– Professional Relationships– Social Media
• Sub-GroupProfiles:– Students– School Personnel– Parents
III. In-Depth Profiles

schoolclimate.org | page 25
• ThefindingsintheSchoolClimateDimensionssectionareorganizedaroundthethirteen(SchoolPersonnel)oreleven(StudentsandParents)measureddimensionsofschoolclimateorganizedunderthefourmajorareasthatcontributetoschoolclimate:safety,teachingandlearning,relationshipsandtheenvironment.
• Becausethereareasmanyscoresbelowthemedianasabove,itisimportanttolooknotjustatthemedianratings,butalsotounderstandthedistributionofresponsesbydiggingmoredeeply.Forexampleamedianratingof3.0onthe5pointscalemightmeanthatalmostallofthoserespondinghadscoresbetween2.5and3.5,oritcouldmeanthathalfhadhighlynegativescores(closeto1)andhalfhadhighlypositivescores(closeto5).Howyouinterpretandactonthisinformationwouldbeverydifferentinthesetwoinstances.
• Thegraphsinthissectionillustratethepatternofresponsesforeachschoolgroup,showingthepercentageofstudents,schoolpersonnelandparentswhosescalescoresforeachdimensionfallintoeachrangefromverynegativetoverypositive.Inlookingatanddiscussingtheresponsepatternsforeachdimension,youshouldthinkaboutthedegreetowhichrespondentsclusteraroundcertainjudgmentsorvaryacrossthespectrum.Ifthepatternindicatesmultipleclusters,thismaysuggestthattherearesub-groupsthatcouldbeexperiencingthisdimensionofschoolclimateverydifferently.
• Sub-group ratings can be further exploredintheSub-GroupProfilessection,whichreportsresultsforsomeofthesub-groupsthatmightbeexpectedtoexperiencevariousaspectsofschoolclimatedifferently.Yourschoolshouldidentifywhetherthereareadditionalsub-groupsthatmightbeimportantforfutureanalysis.
• Forfulldetailsonhowthesurveyedgroupsrespondedtoeachindividualsurveyitemthatcompriseseachschooldimensionscale,youcanrefertotheDetailedResultssectionattheendofthisReport.
Why is this important?
• Thesechartswillallowyoutoseeingreaterdetailthedistributionofscalescoresforindividualswithineachgroup.Thisenablesyoutounderstandhowmuchindividuals’perceptionswithineachgroupconvergearoundthegroupmedianscoreandthepercentagewhosescalescoresfallintodifferentrangesfromhighlynegativetohighlypositive.
• Thefirstsetofgraphsisorganizedaroundtheelevendimensionsofschoolclimate,whichallowsyoutoseetherangeofperceptionsforthethreesurveyedpopulationsinrelationtoeachdimension.Thesecondsetisorganizedbysurveygroup(e.gallstudentgraphstogether,allparentgraphstogether,etc).Thisallowsyoutoseeeachgroup’sresponsesacrossalldimensions,andidentifyanypatterns.
Introduction
III. In-Depth Profiles

schoolclimate.org | page 26
Introduction
III. In-Depth Profiles
How to look at this data:
• Thesechartsshowthepercentageofindividualswithineachofthethreegroupswhosescoresfallintodifferentrangesfromverynegative(1.0to1.5)toverypositive(4.5-5.0)onthefive-pointscale.The scores are grouped in increments of 0.5 to provide you with more detail about the distribution of scores within each school group.
• Ashasbeenshowninpreviouscharts,thereisanotationgivingthepercentageofrespondentswhosescorescanbeconsiderednegative(lessthan2.5),positive(greaterthan3.5)andneutral(between2.5and3.5).Themedianscoreisalsonotedoneachchart.
• Youshouldstartbylookingattheresponsepatternsforeachgroupandconsider:
- Thepercentageofeachpopulationsurveyed(e.gstudents,schoolpersonnel,andparents)whoperceiveeachdimensioninapositive,negativeorneutrallightinyourschool,aswellashowconsistentthepatternsofopinionappeartobewithineachgroup.
- Whetherthereareotherindicatorsinyourschoolthatdovetailwiththesepatterns,andanytheoriesyouhavethatmayaccountforsomeofthevariation.
• Inthenextsectionyoucanexplorethesetheoriesbylookingatoverallratingpatternsforspecificsub-groupsthatmayexperienceschooldifferently.Forexample,dogirlsreportadifferentsenseofphysicalsecurityvs.boys?Doschoolpersonnelwithmoreexperienceseesupportforlearningdifferentlyfromnewerstaff?
• Youshouldalsolookatthesepatternsincomparativeterms:
- Isthereanyonegroupwhoseopinionsappearmoreconsistent?Forexample,istheremoreconvergenceofopinionamongschoolstaffthanamongstudentsorparents?Forwhichdimensionsdoyouseethismostclearly?Howmuchdothepatternsvary?
- Whataretheshiftingpatternsbetweennegative,positiveandneutral?
- Ifonegroupratesrespectfordiversityhigherthananother,isthisprimarilybecausemoreindividualsseeitinaverypositiveway,orfewerseeitinaverynegativelight?Whatmightbeaffectingtheseratings?
schoolclimate.org | page 27
- Whatdoesitmeanforyourschoolifmostopinionsconvergetowardthecentervs.arangeofopinionsthatarebothverypositiveandverynegative?Whatdifferencemightitmakeinwhatactionsyouconsiderappropriateforimprovement?
Introduction
III. In-Depth Profiles

schoolclimate.org | page 28
SAFETY
Safetyisabasicneed.Feelingunsafenaturallyundermineslearningandhealthydevelopment.Safeschoolspromotestudentachievementandschoolsuccess.Historically,schoolshaveconcentratedonphysicalsafety,showinglesssensitivitytoemotionalsafety.Inrecentyears,schoolshavebecomemoreattunedtohowsocialsafetyandtheproblemofsocialbullyingshapeslearninganddevelopment.Thissurveylooksatthreeaspectsofsafety:rulesandnorms(institutionalsafety)andactualsenseofsecurity-bothphysicalandsocial-emotional.
Safety: Rules and Norms
Thisscalefocusesontheclarityoftheschool’srulesformaintainingsafety,bothphysicalsafetyandsocial-emotionalsafety,andtheconsistencyandfairnesswithwhichrulesareenforced.Forexample,isitclearthattherearerulesaboutphysicalandsocialbullying?Aretheyfairlyenforcedbyadultsintheschool?
School Climate Dimensions: Safety—Rules & Norms
III. In-Depth Profiles
Forcompletedetailsontheitemsthatcompriseallofthesescales,pleaserefertoSectionIV.Asaresultofrounding,percentagesmaydifferslightlyfromthoseonpages16-18.

schoolclimate.org | page 29
School Climate Dimensions: Safety—Rules & Norms
III. In-Depth Profiles

schoolclimate.org | page 30
Safety: Sense of Physical Security
Thisscalefocusesonthedegreetowhichpeoplefeelphysicallysafeintheschoolbuildingandintheareasurroundingtheschool.Forexample,haveindividualsthemselvesexperiencedphysicalabuseandtowhatextenthavetheyseenothersbeingsubjectedtophysicalharmsuchaspushing,slappingorpunching?
School Climate Dimensions: Safety—Sense of Physical Security
III. In-Depth Profiles
Forcompletedetailsontheitemsthatcompriseallofthesescales,pleaserefertoSectionIV.Asaresultofrounding,percentagesmaydifferslightlyfromthoseonpages16-18.

schoolclimate.org | page 31
School Climate Dimensions: Safety—Sense of Physical Security
III. In-Depth Profiles

schoolclimate.org | page 32
Safety: Sense of Social-Emotional Security
Thisscalefocusesonthedegreetowhichpeoplefeelsafeinsocial-emotionalterms.Questionsonthisscaleprobeexperienceandwitnessingofverbalabuse,harassment,andexclusion.
School Climate Dimensions: Safety—Sense of Social-Emotional Security
III. In-Depth Profiles
Forcompletedetailsontheitemsthatcompriseallofthesescales,pleaserefertoSectionIV.Asaresultofrounding,percentagesmaydifferslightlyfromthoseonpages16-18.

schoolclimate.org | page 33
School Climate Dimensions: Safety—Sense of Social-Emotional Security
III. In-Depth Profiles

schoolclimate.org | page 34
TEACHING AND LEARNING
Thegoalofschoolingistofosterlearninganddevelopment.Educationalresearchhasidentifiedfactorsthatinfluenceschoolsuccess,includingtheuseofvariedandcustomizedinstructionalstrategiesandthepromotionofstudents’reflective,self-monitoring,anddecision-makingskills.Studentsarealsomoreablelearnerswhentheyaremadecomfortabletakingrisks,whentheyfeelsafe“notknowing”,andcangenuinelyaskforhelpinunderstanding.Adults’expectationsforstudents—andtheabilitytocommunicatethis—alsopowerfullyshapelearningandschoolengagement.Teachingandlearningisalwayssocial,emotionalandethicalaswellascognitiveinnature.Activeandpurposefulsocial,emotional,andethicalteachingandmodelingalsosupportsstudents’academicachievementandschoolsuccess,aswellastheirdevelopmentintoresponsibleandproductivecitizens.
Teaching and Learning: Support for Learning
Thisscalehighlightsadults’andstudents’interactionsinthelearningprocess.Forexample,dostudentsfeelthatteachersletthemknowwhentheydoagoodjobandofferthemconstructivefeedback?Isschoolworkchallenging?Istheresupportforlearningfrommistakes?Isthereanopportunitytodemonstrateknowledgeandskillsinavarietyofways?
School Climate Dimensions: Support for Learning
III. In-Depth Profiles
Forcompletedetailsontheitemsthatcompriseallofthesescales,pleaserefertoSectionIV.Asaresultofrounding,percentagesmaydifferslightlyfromthoseonpages16-18.

schoolclimate.org | page 35
School Climate Dimensions: Support for Learning
III. In-Depth Profiles

schoolclimate.org | page 36
Teaching and Learning: Social and Civic Learning
Thisscaledescribestheextenttowhichsocialandcivicknowledgeandskillsareactivelyincorporatedintoschoollearningandhowethicaldispositionsarerecognizedandvalued.Forexample,dostudentslearntolistenandcooperatewithothers?Aretheyencouragedtothinkabout“right”and“wrong”?Aretheysupportedinthedevelopmentofskillsforreflectionandself-control?Dotheylearnhowtoresolveconflictseffectivelyandamicably?
School Climate Dimensions: Social and Civic Learning
III. In-Depth Profiles
Forcompletedetailsontheitemsthatcompriseallofthesescales,pleaserefertoSectionIV.Asaresultofrounding,percentagesmaydifferslightlyfromthoseonpages16-18.

schoolclimate.org | page 37
School Climate Dimensions: Social and Civic Learning
III. In-Depth Profiles

schoolclimate.org | page 38
INTERPERSONAL RELATIONSHIPS
Schoolexperiencesarebasedonrelationships.Theextenttowhichadultsandstudentslistento,respectandtrustoneanothershapestheschoolcommunity.Howdostudentstreatoneanotheranddotheyhaveanetworkoffriendstheycancountonforsupport?Whatisthequalityofsupporttheyfeeltheycanexpectfromadultsintheschool?Dotheyfeelthereareadultswhocareaboutthemasindividualsandtowhomtheycanturnforhelp?Finally,howwelldoadultscommunicateandcollaboratewithoneanotherandwhattonedoesthatsetforstudents?Howallofthisisperceivedbystudentsprofoundlyaffectstheirexpectationsforappropriatebehaviorandthequalityoftheirschoolexperience.
Interpersonal Relationships: Respect for Diversity
Thisscalefocusesontheextenttowhichadultsandstudentsintheschoolrespecteachothers’differenceswithregardtosuchfactorsasgender,race/ethnicity,orphysicaldifferences.Itfocusesonpeerrelationshipsamongstudentsandamongadultsandontherelationshipsbetweenadultsandstudents.
School Climate Dimensions: Respect for Diversity
III. In-Depth Profiles
Forcompletedetailsontheitemsthatcompriseallofthesescales,pleaserefertoSectionIV.Asaresultofrounding,percentagesmaydifferslightlyfromthoseonpages16-18.

schoolclimate.org | page 39
School Climate Dimensions: Respect for Diversity
III. In-Depth Profiles

schoolclimate.org | page 40
Interpersonal Relationships: Social Support—Adults
Thisscaledealswithqualityofsocialrelationshipsamongadultsandstudents.Istheremutualtrustandsupport?Doadultsappeartoworkwellwiththeirpeers?Dostudentsfeelthatadultsintheschoolshowaninterestinthemandlistentowhattheyhavetosay?
School Climate Dimensions: Social Support—Adults
III. In-Depth Profiles
Forcompletedetailsontheitemsthatcompriseallofthesescales,pleaserefertoSectionIV.Asaresultofrounding,percentagesmaydifferslightlyfromthoseonpages16-18.

schoolclimate.org | page 41
School Climate Dimensions: Social Support—Adults
III. In-Depth Profiles

schoolclimate.org | page 42
Interpersonal Relationships: Social Support—Students
Thisscaledealswithqualityofsocialsupportamongstudents.Dostudentshaveanetworkoffriendsthatsustainthemacademicallyandsocially?
School Climate Dimensions: Social Support—Students
III. In-Depth Profiles
Forcompletedetailsontheitemsthatcompriseallofthesescales,pleaserefertoSectionIV.Asaresultofrounding,percentagesmaydifferslightlyfromthoseonpages16-18.

schoolclimate.org | page 43
School Climate Dimensions: Social Support—Students
III. In-Depth Profiles

schoolclimate.org | page 44
INSTITUTIONAL ENVIRONMENT
Theinstitutionalenvironmentintheschoolisdefinedinbothphysicalandsocialterms.Socially,thisentailsstudents’positivesenseofconnectednesstoandengagementinthelifeoftheschoolasaninstitution.Dotheyidentifypositivelywiththeschoolandhaveasensethatboththeyandtheirfamiliesbelongthereandarewelcome.Thisisanimportantaspectofastudent’sschoolexperienceandcontributessubstantiallytoschoolsuccess.Thephysicalenvironment-facilitiesandresources-isalsoimportant.Naturally,howclean,caredfor,orderlyandattractivetheschoolisaffectsteaching,learning,schoolengagementandoverallmorale.
Institutional Environment: School Connectedness/Engagement
Thisscalefocusesonhowpositivelystudentsfeelabouttheirschoolandthedegreetowhichtheyandtheirfamiliesareencouragedtoparticipateinschoollife.Dostudentsfeelgoodabouttheirschoolandwhattheyaccomplishthere?Dotheyfeelthattheyareencouragedtobecomeinvolvedinschoollifebeyondacademics?Doestheschoolreachouttofamilies,bykeepingtheminformedandmakingthemfeelcomfortablespeakingwithteachersorattendingschoolevents?
School Climate Dimensions: School Connectedness/Engagement
III. In-Depth Profiles
Forcompletedetailsontheitemsthatcompriseallofthesescales,pleaserefertoSectionIV.Asaresultofrounding,percentagesmaydifferslightlyfromthoseonpages16-18.

schoolclimate.org | page 45
School Climate Dimensions: School Connectedness/Engagement
III. In-Depth Profiles
schoolclimate.org | page 46
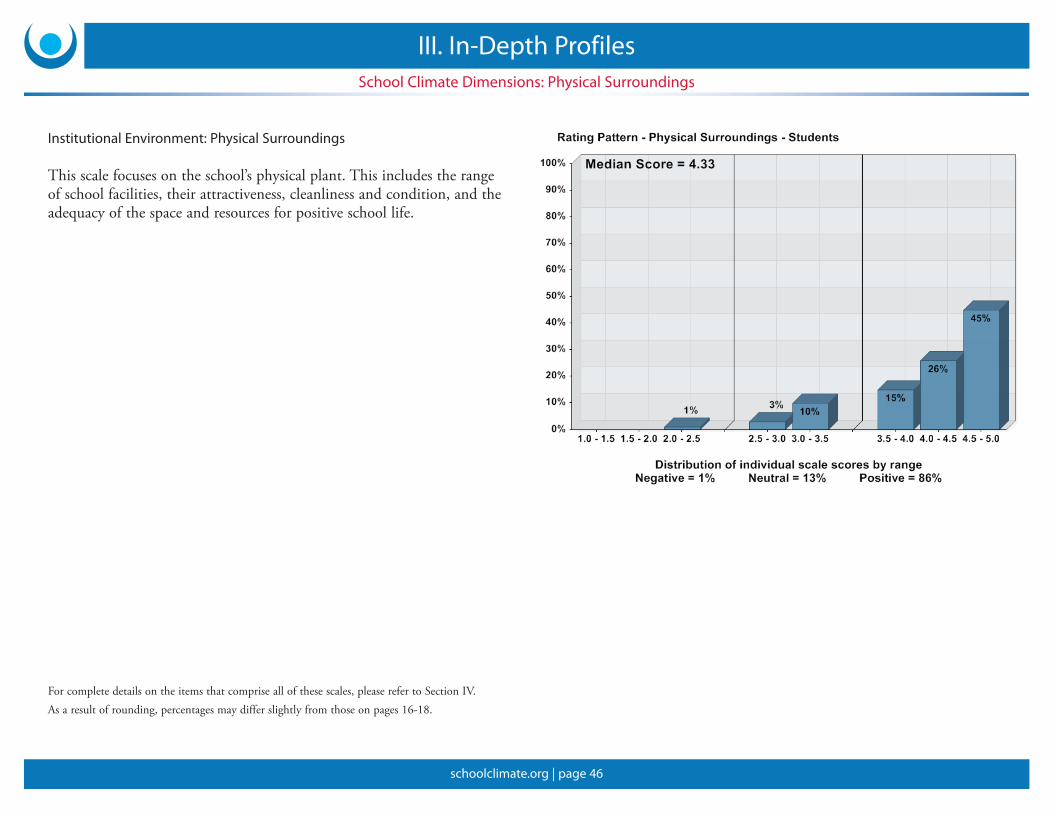
Institutional Environment: Physical Surroundings
Thisscalefocusesontheschool’sphysicalplant.Thisincludestherangeofschoolfacilities,theirattractiveness,cleanlinessandcondition,andtheadequacyofthespaceandresourcesforpositiveschoollife.
School Climate Dimensions: Physical Surroundings
III. In-Depth Profiles
Forcompletedetailsontheitemsthatcompriseallofthesescales,pleaserefertoSectionIV.Asaresultofrounding,percentagesmaydifferslightlyfromthoseonpages16-18.

schoolclimate.org | page 47
School Climate Dimensions: Physical Surroundings
III. In-Depth Profiles

schoolclimate.org | page 48
Institutional Environment: Social Media
Thisscalefocusesonthedegreetowhichpeoplefeelsafeinsocial-emotionaltermsonsocialmedia.Questionsonthisscaleprobeexperienceandexposuretoverbalabuse,harassment,andexclusiononsocialmedia.
School Climate Dimensions: Social Media
III. In-Depth Profiles
Forcompletedetailsontheitemsthatcompriseallofthesescales,pleaserefertoSectionIV.Asaresultofrounding,percentagesmaydifferslightlyfromthoseonpages16-18.

schoolclimate.org | page 49
School Climate Dimensions: Social Media
III. In-Depth Profiles

schoolclimate.org | page 50
Staff Only: Leadership
Thisscalefocusesontheleadershipcharacteristicsanddecisionmakingstyleoftheschool’sadministration.Doschoolleadersestablishandcommunicateaclearvision?Aretheyaccessibleandopen?Aretheysupportiveandappreciativeofschoolstaff?Dotheyinvolvestaffinkeydecisions?
School Climate Dimensions: Professional Leadership (School Personnel Only)
III. In-Depth Profiles
Forcompletedetailsontheitemsthatcompriseallofthesescales,pleaserefertoSectionIV.Asaresultofrounding,percentagesmaydifferslightlyfromthoseonpages16-18.

schoolclimate.org | page 51
Staff Only: Professional Relationships
Thisscalefocusesonthequalityofworkingrelationshipsamongschoolstaff.Dostaffworkwelltogetherandlearnfromoneanother?Istheremutualtrustandconstructivecollaboration?Arestaffsupportiveofoneanotherandgenerouswiththeirhelp?
School Climate Dimensions: Professional Relationships (School Personnel Only)
III. In-Depth Profiles
Forcompletedetailsontheitemsthatcompriseallofthesescales,pleaserefertoSectionIV.Asaresultofrounding,percentagesmaydifferslightlyfromthoseonpages16-18.

schoolclimate.org | page 52
Why is this important?
• Thischartallowsyoutoseehowsub-groups of the surveyed populationsexperienceeachdimensionofschoolclimate.
How to look at this data:
• Thesechartscanfacilitatesomeinterestingcomparisons.Takenoteof:
- Howscoresforasingle dimensioncomparefordifferent sub-groups(vertically).
- Howscoresacross dimensionscompareformembersofthesame sub-group(horizontally).
• Consider the following kinds of questions,whenlookingatthesecomparisons:
- Domembersofonesub-grouptendtoproducescaleratingsthatareconsistentlyhigher,orlower,thantheothers?
- Mightsomeofthesepatternshelpexplainclustersofopinionthatwereonthehigh,orlow,endoftheresponsedistributionsforadimensioninthepriorsection?
- Towhatextentmightdifferentpatternsbeattributabletodevelopmentaldifferencesand/orpatternsofadjustment?
- Towhatextentmightdifferentpatternsbeattributabletoschoolpoliciesthataffectthesegroupsindifferentways?
IMPORTANT NOTE: Anysub-groupsthataretoosmalltoguaranteeprivacytotherespondentswillnotbeincluded.Therefore, some of the charts in this section may be missing.Thisisnotanerror—itmeansthatfewerthan10peoplefromthatparticularsub-group(forexample,males)inthatpopulation(forexample,schoolpersonnel)respondedtotheCSCIsurvey.
Sub-Group Ratings
III. In-Depth Profiles

schoolclimate.org | page 53
Details on sub-group sizes can be seen in the Demographic Profiles starting in Section IV. on page
= median rating in the negative range (scores lower than 2.5 on a 5-point scale)
= median rating in the neutral range (scores between 2.5 and 3.5 on a 5-point scale)
= median rating in the positive range (scores above 3.5 on a 5-point scale)
III. In-Depth ProfilesSub-Group Ratings: Students

schoolclimate.org | page 54
Details on sub-group sizes can be seen in the Demographic Profiles starting in Section IV.
= median rating in the negative range (scores lower than 2.5 on a 5-point scale)
= median rating in the neutral range (scores between 2.5 and 3.5 on a 5-point scale)
= median rating in the positive range (scores above 3.5 on a 5-point scale)
Sub-Group Ratings: Students
III. In-Depth Profiles

schoolclimate.org | page 55
Details on sub-group sizes can be seen in the Demographic Profiles starting in Section IV.
= median rating in the negative range (scores lower than 2.5 on a 5-point scale)
= median rating in the neutral range (scores between 2.5 and 3.5 on a 5-point scale)
= median rating in the positive range (scores above 3.5 on a 5-point scale)
III. In-Depth ProfilesSub-Group Ratings: Students

schoolclimate.org | page 56
Details on sub-group sizes can be seen in the Demographic Profiles starting in Section IV.
= median rating in the negative range (scores lower than 2.5 on a 5-point scale)
= median rating in the neutral range (scores between 2.5 and 3.5 on a 5-point scale)
= median rating in the positive range (scores above 3.5 on a 5-point scale)
III. In-Depth ProfilesSub-Group Ratings: Students
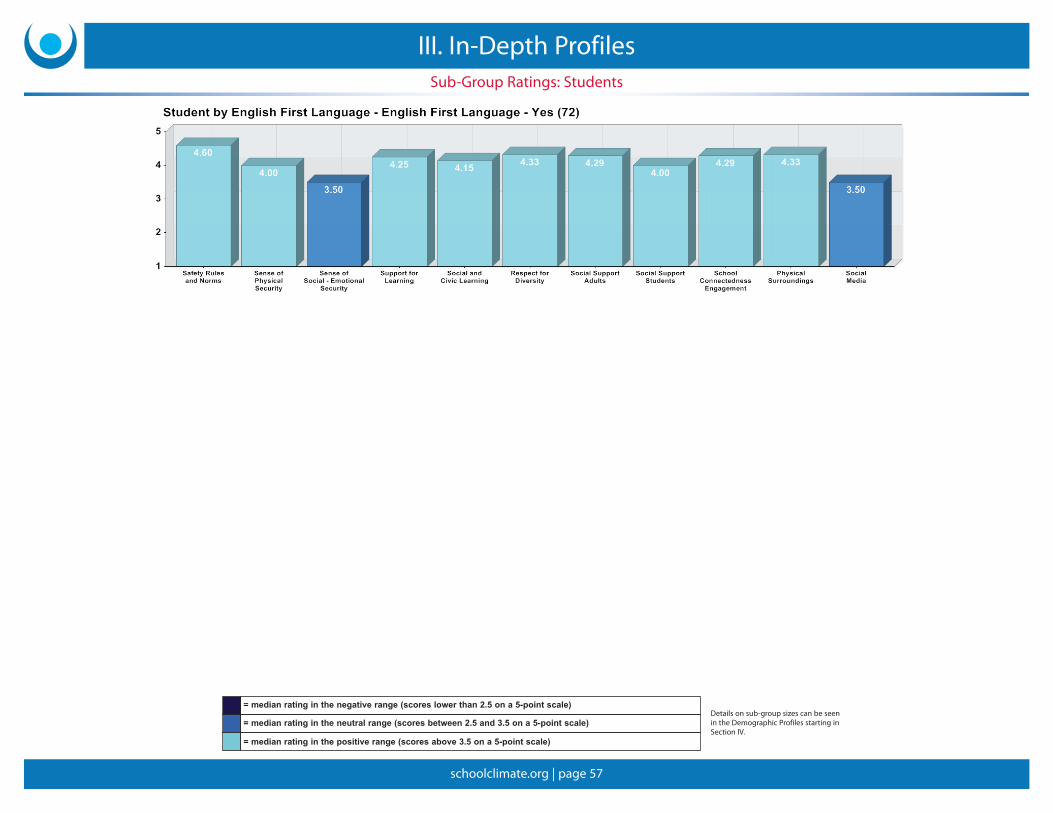
schoolclimate.org | page 57
Details on sub-group sizes can be seen in the Demographic Profiles starting in Section IV.
= median rating in the negative range (scores lower than 2.5 on a 5-point scale)
= median rating in the neutral range (scores between 2.5 and 3.5 on a 5-point scale)
= median rating in the positive range (scores above 3.5 on a 5-point scale)
III. In-Depth ProfilesSub-Group Ratings: Students

schoolclimate.org | page 58
Details on sub-group sizes can be seen in the Demographic Profiles starting in Section IV.
= median rating in the negative range (scores lower than 2.5 on a 5-point scale)
= median rating in the neutral range (scores between 2.5 and 3.5 on a 5-point scale)
= median rating in the positive range (scores above 3.5 on a 5-point scale)
III. In-Depth ProfilesSub-Group Ratings: Students

schoolclimate.org | page 59
Details on sub-group sizes can be seen in the Demographic Profiles starting in Section IV.
= median rating in the negative range (scores lower than 2.5 on a 5-point scale)
= median rating in the neutral range (scores between 2.5 and 3.5 on a 5-point scale)
= median rating in the positive range (scores above 3.5 on a 5-point scale)
III. In-Depth ProfilesSub-Group Ratings: School Personnel

schoolclimate.org | page 60
III. In-Depth ProfilesSub-Group Ratings: School Personnel
Details on sub-group sizes can be seen in the Demographic Profiles starting in Section IV.
= median rating in the negative range (scores lower than 2.5 on a 5-point scale)
= median rating in the neutral range (scores between 2.5 and 3.5 on a 5-point scale)
= median rating in the positive range (scores above 3.5 on a 5-point scale)

schoolclimate.org | page 61
Details on sub-group sizes can be seen in the Demographic Profiles starting in Section IV.
III. In-Depth ProfilesSub-Group Ratings: School Personnel
= median rating in the negative range (scores lower than 2.5 on a 5-point scale)
= median rating in the neutral range (scores between 2.5 and 3.5 on a 5-point scale)
= median rating in the positive range (scores above 3.5 on a 5-point scale)

schoolclimate.org | page 62
Details on sub-group sizes can be seen in the Demographic Profiles starting in Section IV.
= median rating in the negative range (scores lower than 2.5 on a 5-point scale)
= median rating in the neutral range (scores between 2.5 and 3.5 on a 5-point scale)
= median rating in the positive range (scores above 3.5 on a 5-point scale)
III. In-Depth ProfilesSub-Group Ratings: School Personnel

schoolclimate.org | page 63
Details on sub-group sizes can be seen in the Demographic Profiles starting in Section IV.
= median rating in the negative range (scores lower than 2.5 on a 5-point scale)
= median rating in the neutral range (scores between 2.5 and 3.5 on a 5-point scale)
= median rating in the positive range (scores above 3.5 on a 5-point scale)
III. In-Depth ProfilesSub-Group Ratings: School Personnel

schoolclimate.org | page 64
Details on sub-group sizes can be seen in the Demographic Profiles starting in Section IV.
= median rating in the negative range (scores lower than 2.5 on a 5-point scale)
= median rating in the neutral range (scores between 2.5 and 3.5 on a 5-point scale)
= median rating in the positive range (scores above 3.5 on a 5-point scale)
III. In-Depth ProfilesSub-Group Ratings: School Personnel

schoolclimate.org | page 65
Details on sub-group sizes can be seen in the Demographic Profiles starting in Section IV.
= median rating in the negative range (scores lower than 2.5 on a 5-point scale)
= median rating in the neutral range (scores between 2.5 and 3.5 on a 5-point scale)
= median rating in the positive range (scores above 3.5 on a 5-point scale)
III. In-Depth ProfilesSub-Group Ratings: School Personnel

schoolclimate.org | page 66
Details on sub-group sizes can be seen in the Demographic Profiles starting in Section IV.
= median rating in the negative range (scores lower than 2.5 on a 5-point scale)
= median rating in the neutral range (scores between 2.5 and 3.5 on a 5-point scale)
= median rating in the positive range (scores above 3.5 on a 5-point scale)
III. In-Depth ProfilesSub-Group Ratings: School Personnel

schoolclimate.org | page 67
III. In-Depth ProfilesSub-Group Ratings: School Personnel
= median rating in the negative range (scores lower than 2.5 on a 5-point scale)
= median rating in the neutral range (scores between 2.5 and 3.5 on a 5-point scale)
= median rating in the positive range (scores above 3.5 on a 5-point scale)
Details on sub-group sizes can be seen in the Demographic Profiles starting in Section IV.

schoolclimate.org | page 68
Details on sub-group sizes can be seen in the Demographic Profiles starting in Section IV.
III. In-Depth ProfilesSub-Group Ratings: Parents
= median rating in the negative range (scores lower than 2.5 on a 5-point scale)
= median rating in the neutral range (scores between 2.5 and 3.5 on a 5-point scale)
= median rating in the positive range (scores above 3.5 on a 5-point scale)

schoolclimate.org | page 69
Details on sub-group sizes can be seen in the Demographic Profiles starting in Section IV.
III. In-Depth ProfilesSub-Group Ratings: Parents
= median rating in the negative range (scores lower than 2.5 on a 5-point scale)
= median rating in the neutral range (scores between 2.5 and 3.5 on a 5-point scale)
= median rating in the positive range (scores above 3.5 on a 5-point scale)

schoolclimate.org | page 70
Details on sub-group sizes can be seen in the Demographic Profiles starting in Section IV.
III. In-Depth ProfilesSub-Group Ratings: Parents
= median rating in the negative range (scores lower than 2.5 on a 5-point scale)
= median rating in the neutral range (scores between 2.5 and 3.5 on a 5-point scale)
= median rating in the positive range (scores above 3.5 on a 5-point scale)

schoolclimate.org | page 71
Details on sub-group sizes can be seen in the Demographic Profiles starting in Section IV.
III. In-Depth ProfilesSub-Group Ratings: Parents
= median rating in the negative range (scores lower than 2.5 on a 5-point scale)
= median rating in the neutral range (scores between 2.5 and 3.5 on a 5-point scale)
= median rating in the positive range (scores above 3.5 on a 5-point scale)

schoolclimate.org | page 72
Details on sub-group sizes can be seen in the Demographic Profiles starting in Section IV.
= median rating in the negative range (scores lower than 2.5 on a 5-point scale)
= median rating in the neutral range (scores between 2.5 and 3.5 on a 5-point scale)
= median rating in the positive range (scores above 3.5 on a 5-point scale)
III. In-Depth ProfilesSub-Group Ratings: Parents

schoolclimate.org | page 73
Details on sub-group sizes can be seen in the Demographic Profiles starting in Section IV.
= median rating in the negative range (scores lower than 2.5 on a 5-point scale)
= median rating in the neutral range (scores between 2.5 and 3.5 on a 5-point scale)
= median rating in the positive range (scores above 3.5 on a 5-point scale)
III. In-Depth ProfilesSub-Group Ratings: Parents

schoolclimate.org | page 74
Details on sub-group sizes can be seen in the Demographic Profiles starting in Section IV.
= median rating in the negative range (scores lower than 2.5 on a 5-point scale)
= median rating in the neutral range (scores between 2.5 and 3.5 on a 5-point scale)
= median rating in the positive range (scores above 3.5 on a 5-point scale)
III. In-Depth ProfilesSub-Group Ratings: Parents

schoolclimate.org | page 75
Thissectionprovidesvery specific information on how each group responded to the individual CSCI survey items.Itispresentedbysurveyedpopulation(e.g.students,schoolpersonnel,andparents)foreachdimension.
You’llalsofinddemographic profiles of respondents for each group.Demographicinformationwasenteredbyeachrespondent,onthelastpageofthesurvey.Thesedemographicgroupscorrespondtothesub-groupgraphsintheIn-DepthProfilesectionofthereport.Ifthisdemographicinformationdoesnotmatchcloselywithyourschoolpopulationasawhole,somegroupsmayhavebeenunder-representedinthesurveyedpopulation.
Formorespecificinformationonunderstanding the CSCI Measureandthewayresultsarepresented,seeAppendixA.
Note: Thesurveywasdesignedtobeinterpretedattheleveloftheschoolclimatedimensions,andthereforeNSCCdoesnotrecommendmakingdecisionsbasedontheitem-by-itemdataalone.
• ScalescoresbyGroup
• Item-by-ItemSurveyResponses (Students, School Personnel & Parents)
• DemographicProfiles (Students, School Personnel & Parents)
IV. Detailed Findings

schoolclimate.org | page 76
Scale Scores by Group
Comparative Ratings for Shared School Climate DimensionsStudents School Personnel Parents
School Climate Dimension Med. Min. Max. Med. Min. Max. Med. Min. Max.
Safety Rules & Norms 4.60 2.00 5.00 4.40 3.00 5.00 4.00 1.80 5.00
Sense of Physical Security 4.00 1.25 5.00 4.25 2.75 5.00 3.75 1.00 5.00
Sense of Social-Emotional Security 3.50 1.67 5.00 3.58 2.17 5.00 3.58 1.00 5.00
Support for Learning 4.25 1.25 5.00 4.17 3.00 5.00 3.88 2.13 5.00
Social and Civic Learning 4.20 2.50 5.00 4.20 2.90 5.00 3.80 1.40 5.00
Respect for Diversity 4.33 2.17 5.00 4.00 2.67 5.00 4.00 2.00 5.00
Social Support/ Adults 4.29 2.29 5.00 4.33 3.00 5.00 4.00 2.14 5.00
Social Support/ Students 4.00 2.60 5.00 4.00 3.00 5.00 3.80 1.60 5.00
Connectedness/ Engagement 4.29 2.57 5.00 4.14 2.86 5.00 4.00 1.29 5.00
Physical Surroundings 4.33 2.33 5.00 4.50 3.00 5.00 4.17 1.33 5.00
Social Media 3.50 2.17 4.83 3.60 2.60 5.00 3.33 1.67 4.67
Leadership N/A N/A N/A 4.10 1.40 5.00 N/A N/A N/A
Professional Relationships N/A N/A N/A 4.13 2.50 5.00 N/A N/A N/A
IV. Detailed Findings

schoolclimate.org | page 77
Safety Rules & Norms Rating ResponseGiven
RatingResponseNot Given
Survey Item MedianRating Min/Max Strongly
Disagree Disagree Neutral Agree StronglyAgree
MissingResponse
In my school, there are clear rules about not hurting other people (for example,hitting, pushing, tripping, etc.). 5.00 1 / 5 0.01
(1)0.03
(2)0.07
(5)0.18(13)
0.71(52)
0.00(0)
Adults in my school are fair about making sure that all students follow the rules. 4.00 1 / 5 0.03(2)
0.05(4)
0.16(12)
0.38(28)
0.37(27)
0.00(0)
Adults in my school will stop students if they see them hurting each other (forexample, pushing, slapping, beating each other up, etc.). 5.00 2 / 5 0.00
(0)0.04
(3)0.01
(1)0.25(18)
0.70(51)
0.00(0)
In my school, there are clear rules against name-calling, teasing, and making funof others. 5.00 1 / 5 0.03
(2)0.03
(2)0.10
(7)0.26(19)
0.59(43)
0.00(0)
Adults in my school stop students if they see them name-calling, teasing, andmaking fun of others. 5.00 1 / 5 0.01
(1)0.04
(3)0.08
(6)0.33(24)
0.53(39)
0.00(0)
Copyright © 2013 by the National School Climate Center (NSCC).
Item-by-Item Survey Responses: Students
IV. Detailed Findings

schoolclimate.org | page 78
Sense of Physical Security Rating ResponseGiven
RatingResponseNot Given
Survey Item MedianRating Min/Max Strongly
Disagree Disagree Neutral Agree StronglyAgree
MissingResponse
In my school, students have been hurt more than once by other students (forexample, pushed, slapped, beaten up, etc.).* 3.00 1 / 5 0.23
(17)0.22(16)
0.23(17)
0.12(9)
0.19(14)
0.00(0)
I feel safe in the area outside the school (for example, schoolyard, on the bus,walking to and from school, etc.). 5.00 1 / 5 0.04
(3)0.03
(2)0.08
(6)0.25(18)
0.60(43)
0.01(1)
I have been hurt at school more than once (for example, pushed, slapped, beatenup, etc.).* 2.00 1 / 5 0.40
(29)0.11
(8)0.17(12)
0.18(13)
0.14(10)
0.01(1)
I feel safe in all parts of the school (for example, classrooms, hallways, cafeteria,restrooms, etc.). 5.00 1 / 5 0.04
(3)0.04
(3)0.05
(4)0.30(22)
0.56(41)
0.00(0)
* For this item, a higher score indicates a negative perception rather than a positive one. This has been taken into account in analyzing survey results and creating scale scores for other parts of the report.
Item-by-Item Survey Responses: Students
IV. Detailed Findings
Copyright © 2013 by the National School Climate Center (NSCC).

schoolclimate.org | page 79
Sense of Social-Emotional Security Rating ResponseGiven
RatingResponseNot Given
Survey Item MedianRating Min/Max Strongly
Disagree Disagree Neutral Agree StronglyAgree
MissingResponse
I have been called names, teased, or made fun of more than once in my school.* 3.00 1 / 5 0.33(24)
0.11(8)
0.16(12)
0.22(16)
0.18(13)
0.00(0)
Students at my school will try to stop students from making fun of others. 4.00 2 / 5 0.00(0)
0.07(5)
0.23(17)
0.33(24)
0.37(27)
0.00(0)
Very few students in my school make fun of other students. 4.00 1 / 5 0.05(4)
0.04(3)
0.18(13)
0.37(27)
0.36(26)
0.00(0)
There are groups of students who make others feel left out.* 3.00 1 / 5 0.16(12)
0.22(16)
0.26(19)
0.21(15)
0.15(11)
0.00(0)
I have seen other students called names, teased, or made fun of more than oncein my school.* 4.00 1 / 5 0.07
(5)0.15(11)
0.26(19)
0.34(25)
0.18(13)
0.00(0)
Most students are nice to other students. 4.00 2 / 5 0.00(0)
0.03(2)
0.15(11)
0.37(27)
0.45(33)
0.00(0)
* For this item, a higher score indicates a negative perception rather than a positive one. This has been taken into account in analyzing survey results and creating scale scores for other parts of the report.
Copyright © 2013 by the National School Climate Center (NSCC).
Item-by-Item Survey Responses: Students
IV. Detailed Findings

schoolclimate.org | page 80
Support for Learning Rating ResponseGiven
RatingResponseNot Given
Survey Item MedianRating Min/Max Strongly
Disagree Disagree Neutral Agree StronglyAgree
MissingResponse
My teachers help me to try out my own ideas. 4.00 2 / 5 0.00(0)
0.08(6)
0.15(11)
0.37(27)
0.40(29)
0.00(0)
My teachers let me know when I do a good job. 5.00 1 / 5 0.01(1)
0.03(2)
0.14(10)
0.30(22)
0.52(38)
0.00(0)
If I do not understand something in class, I feel comfortable letting my teacherknow. 4.00 1 / 5 0.07
(5)0.05
(4)0.15(11)
0.29(21)
0.44(32)
0.00(0)
Teachers give me many different ways to show them what I know (for example,projects, tests, collages, etc.). 4.00 1 / 5 0.01
(1)0.03
(2)0.12
(9)0.41(30)
0.42(31)
0.00(0)
Teachers help me to do more than I think I can. 5.00 2 / 5 0.00(0)
0.03(2)
0.12(9)
0.29(21)
0.56(41)
0.00(0)
My teachers let me know how I am doing in school. 4.00 1 / 5 0.03(2)
0.03(2)
0.21(15)
0.34(25)
0.40(29)
0.00(0)
My teachers show me how to learn from my mistakes. 4.00 1 / 5 0.01(1)
0.07(5)
0.12(9)
0.30(22)
0.49(36)
0.00(0)
My teachers help me figure out how I learn best. 4.00 1 / 5 0.03(2)
0.04(3)
0.11(8)
0.41(30)
0.41(30)
0.00(0)
Item-by-Item Survey Responses: Students
IV. Detailed Findings
Copyright © 2013 by the National School Climate Center (NSCC).
schoolclimate.org | page 81
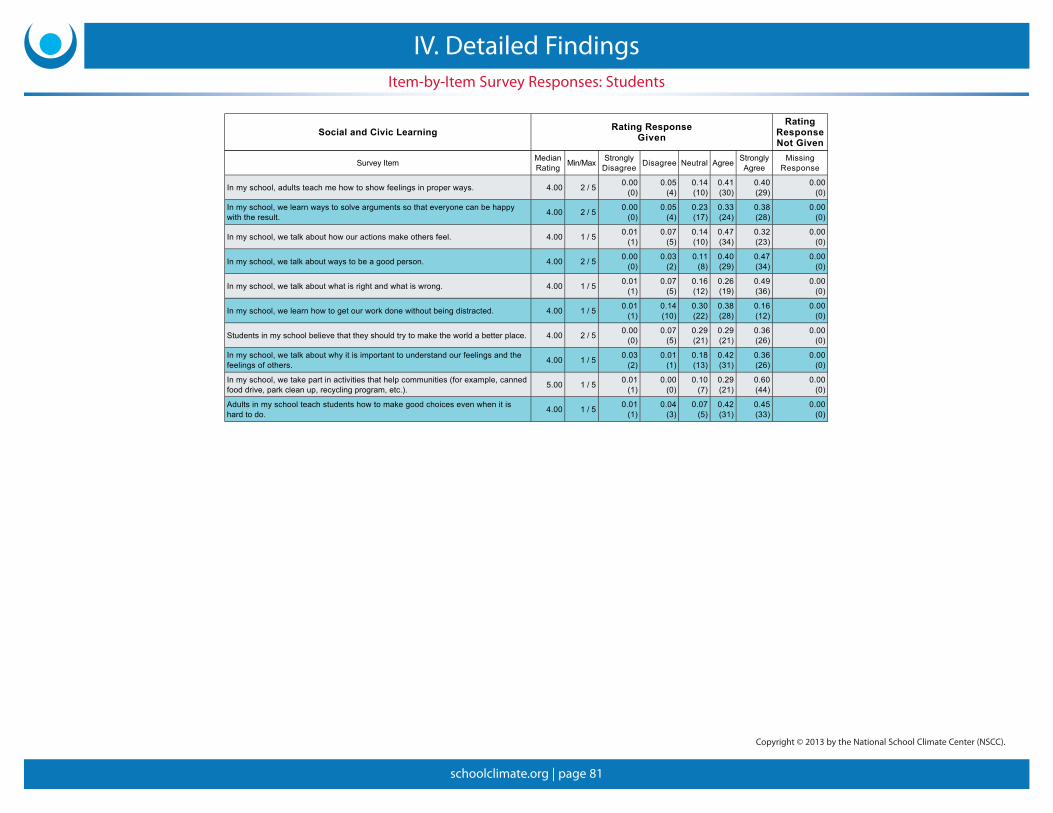
Item-by-Item Survey Responses: Students
IV. Detailed Findings
Social and Civic Learning Rating ResponseGiven
RatingResponseNot Given
Survey Item MedianRating Min/Max Strongly
Disagree Disagree Neutral Agree StronglyAgree
MissingResponse
In my school, adults teach me how to show feelings in proper ways. 4.00 2 / 5 0.00(0)
0.05(4)
0.14(10)
0.41(30)
0.40(29)
0.00(0)
In my school, we learn ways to solve arguments so that everyone can be happywith the result. 4.00 2 / 5 0.00
(0)0.05
(4)0.23(17)
0.33(24)
0.38(28)
0.00(0)
In my school, we talk about how our actions make others feel. 4.00 1 / 5 0.01(1)
0.07(5)
0.14(10)
0.47(34)
0.32(23)
0.00(0)
In my school, we talk about ways to be a good person. 4.00 2 / 5 0.00(0)
0.03(2)
0.11(8)
0.40(29)
0.47(34)
0.00(0)
In my school, we talk about what is right and what is wrong. 4.00 1 / 5 0.01(1)
0.07(5)
0.16(12)
0.26(19)
0.49(36)
0.00(0)
In my school, we learn how to get our work done without being distracted. 4.00 1 / 5 0.01(1)
0.14(10)
0.30(22)
0.38(28)
0.16(12)
0.00(0)
Students in my school believe that they should try to make the world a better place. 4.00 2 / 5 0.00(0)
0.07(5)
0.29(21)
0.29(21)
0.36(26)
0.00(0)
In my school, we talk about why it is important to understand our feelings and thefeelings of others. 4.00 1 / 5 0.03
(2)0.01
(1)0.18(13)
0.42(31)
0.36(26)
0.00(0)
In my school, we take part in activities that help communities (for example, cannedfood drive, park clean up, recycling program, etc.). 5.00 1 / 5 0.01
(1)0.00
(0)0.10
(7)0.29(21)
0.60(44)
0.00(0)
Adults in my school teach students how to make good choices even when it ishard to do. 4.00 1 / 5 0.01
(1)0.04
(3)0.07
(5)0.42(31)
0.45(33)
0.00(0)
Copyright © 2013 by the National School Climate Center (NSCC).

schoolclimate.org | page 82
Respect for Diversity Rating ResponseGiven
RatingResponseNot Given
Survey Item MedianRating Min/Max Strongly
Disagree Disagree Neutral Agree StronglyAgree
MissingResponse
Students in my school respect differences in other students (for example, wherethey come from, what they look like, if they are a boy or girl, etc.). 4.00 1 / 5 0.03
(2)0.08
(6)0.18(13)
0.40(29)
0.32(23)
0.00(0)
My school welcomes and accepts people from many different backgrounds. 5.00 1 / 5 0.01(1)
0.03(2)
0.10(7)
0.27(20)
0.59(43)
0.00(0)
I like working with someone who is different than me (for example, where theycome from, what they look like, if they are a boy or girl, etc.). 4.00 1 / 5 0.04
(3)0.03
(2)0.23(17)
0.34(25)
0.36(26)
0.00(0)
Students in my school respect differences in adults (for example, where they comefrom, what they look like, if they are a man or woman, etc.). 4.00 1 / 5 0.01
(1)0.00
(0)0.16(12)
0.34(25)
0.48(35)
0.00(0)
Adults in my school respect differences in students (for example, where they comefrom, what they look like, if they are a boy or girl, etc.). 5.00 2 / 5 0.00
(0)0.01
(1)0.07
(5)0.32(23)
0.60(44)
0.00(0)
Adults in my school respect differences in other adults (for example, where theycome from, what they look like, if they are a man or woman, etc.). 5.00 2 / 5 0.00
(0)0.01
(1)0.07
(5)0.29(21)
0.63(46)
0.00(0)
Item-by-Item Survey Responses: Students
IV. Detailed Findings
Copyright © 2013 by the National School Climate Center (NSCC).
schoolclimate.org | page 83
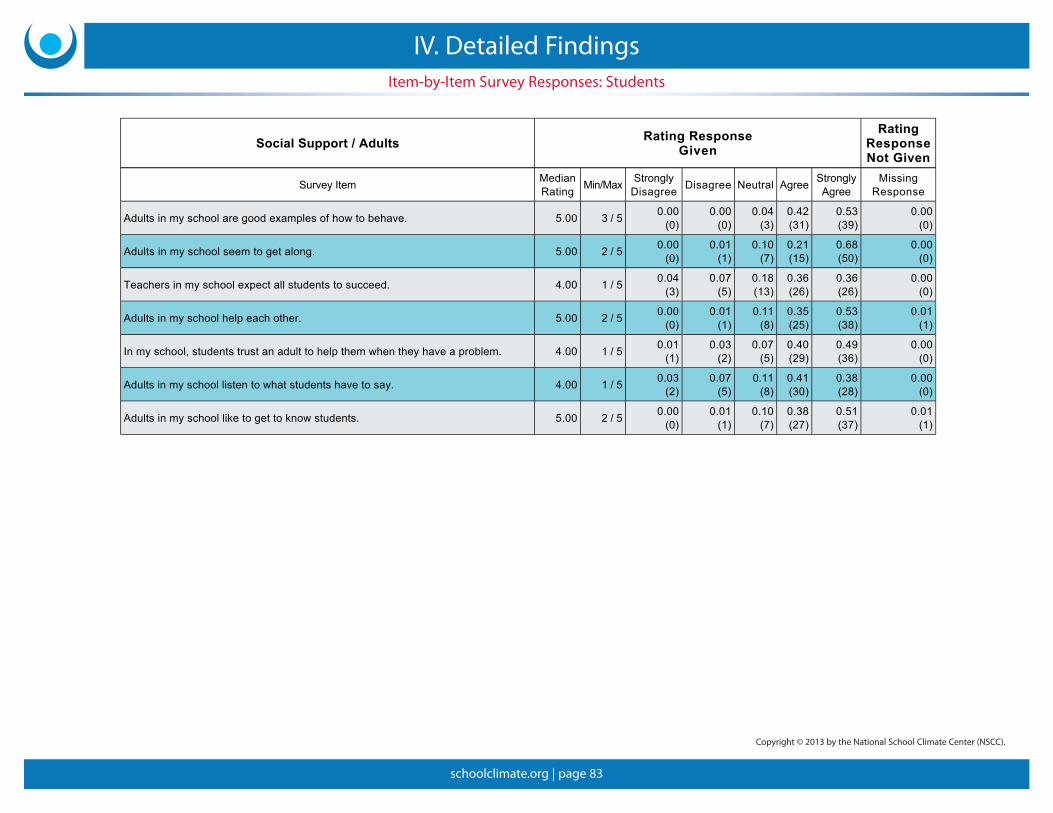
Social Support / Adults Rating ResponseGiven
RatingResponseNot Given
Survey Item MedianRating Min/Max Strongly
Disagree Disagree Neutral Agree StronglyAgree
MissingResponse
Adults in my school are good examples of how to behave. 5.00 3 / 5 0.00(0)
0.00(0)
0.04(3)
0.42(31)
0.53(39)
0.00(0)
Adults in my school seem to get along. 5.00 2 / 5 0.00(0)
0.01(1)
0.10(7)
0.21(15)
0.68(50)
0.00(0)
Teachers in my school expect all students to succeed. 4.00 1 / 5 0.04(3)
0.07(5)
0.18(13)
0.36(26)
0.36(26)
0.00(0)
Adults in my school help each other. 5.00 2 / 5 0.00(0)
0.01(1)
0.11(8)
0.35(25)
0.53(38)
0.01(1)
In my school, students trust an adult to help them when they have a problem. 4.00 1 / 5 0.01(1)
0.03(2)
0.07(5)
0.40(29)
0.49(36)
0.00(0)
Adults in my school listen to what students have to say. 4.00 1 / 5 0.03(2)
0.07(5)
0.11(8)
0.41(30)
0.38(28)
0.00(0)
Adults in my school like to get to know students. 5.00 2 / 5 0.00(0)
0.01(1)
0.10(7)
0.38(27)
0.51(37)
0.01(1)
Copyright © 2013 by the National School Climate Center (NSCC).
Item-by-Item Survey Responses: Students
IV. Detailed Findings

schoolclimate.org | page 84
Social Support / Students Rating ResponseGiven
RatingResponseNot Given
Survey Item MedianRating Min/Max Strongly
Disagree Disagree Neutral Agree StronglyAgree
MissingResponse
Students have friends who will help them if they have questions about homework. 4.00 1 / 5 0.01(1)
0.04(3)
0.18(13)
0.40(29)
0.37(27)
0.00(0)
Students have friends they trust and talk to when they have problems. 4.00 1 / 5 0.03(2)
0.01(1)
0.18(13)
0.39(28)
0.39(28)
0.01(1)
Students work well with other students in class even if they are not friends. 4.00 1 / 5 0.01(1)
0.12(9)
0.23(17)
0.37(27)
0.26(19)
0.00(0)
Students have friends to eat lunch with. 4.00 1 / 5 0.04(3)
0.08(6)
0.21(15)
0.19(14)
0.48(35)
0.00(0)
Students try to make new students feel welcome in the school. 5.00 3 / 5 0.00(0)
0.00(0)
0.11(8)
0.38(28)
0.51(37)
0.00(0)
Item-by-Item Survey Responses: Students
IV. Detailed Findings
Copyright © 2013 by the National School Climate Center (NSCC).

schoolclimate.org | page 85
School Connectedness / Engagement Rating ResponseGiven
RatingResponseNot Given
Survey Item MedianRating Min/Max Strongly
Disagree Disagree Neutral Agree StronglyAgree
MissingResponse
My school tries to get students to join after school activities. 4.00 1 / 5 0.01(1)
0.05(4)
0.41(30)
0.37(27)
0.15(11)
0.00(0)
My school tries to get my family to be part of school events. 4.00 1 / 5 0.04(3)
0.07(5)
0.27(20)
0.33(24)
0.29(21)
0.00(0)
I feel like I belong at my school. 5.00 1 / 5 0.05(4)
0.04(3)
0.14(10)
0.19(14)
0.58(42)
0.00(0)
My school tries to let my family know about what's going on in school. 5.00 1 / 5 0.01(1)
0.05(4)
0.10(7)
0.33(24)
0.51(37)
0.00(0)
I feel good about what I do in school. 4.00 1 / 5 0.05(4)
0.04(3)
0.11(8)
0.36(26)
0.44(32)
0.00(0)
My family feels comfortable talking to my teachers. 5.00 2 / 5 0.00(0)
0.03(2)
0.07(5)
0.27(20)
0.63(46)
0.00(0)
My family feels welcome at my school. 5.00 1 / 5 0.01(1)
0.01(1)
0.07(5)
0.29(21)
0.62(45)
0.00(0)
Copyright © 2013 by the National School Climate Center (NSCC).
Item-by-Item Survey Responses: Students
IV. Detailed Findings
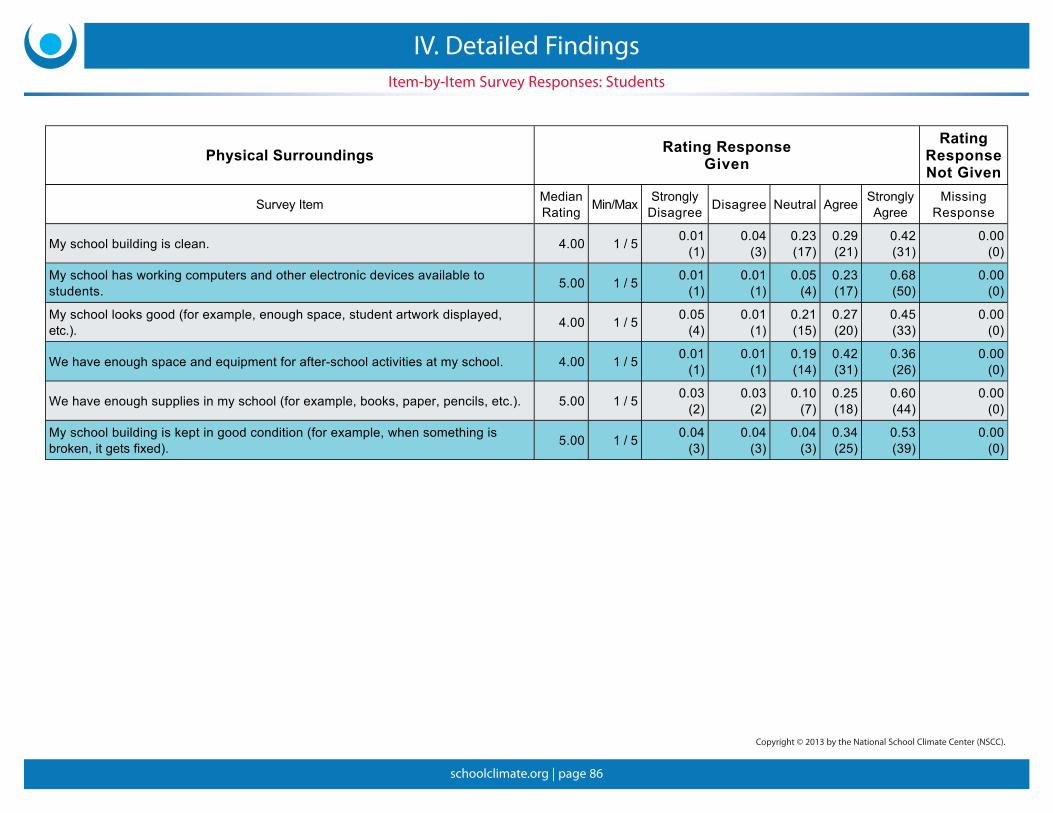
schoolclimate.org | page 86
Physical Surroundings Rating ResponseGiven
RatingResponseNot Given
Survey Item MedianRating Min/Max Strongly
Disagree Disagree Neutral Agree StronglyAgree
MissingResponse
My school building is clean. 4.00 1 / 5 0.01(1)
0.04(3)
0.23(17)
0.29(21)
0.42(31)
0.00(0)
My school has working computers and other electronic devices available tostudents. 5.00 1 / 5 0.01
(1)0.01
(1)0.05
(4)0.23(17)
0.68(50)
0.00(0)
My school looks good (for example, enough space, student artwork displayed,etc.). 4.00 1 / 5 0.05
(4)0.01
(1)0.21(15)
0.27(20)
0.45(33)
0.00(0)
We have enough space and equipment for after-school activities at my school. 4.00 1 / 5 0.01(1)
0.01(1)
0.19(14)
0.42(31)
0.36(26)
0.00(0)
We have enough supplies in my school (for example, books, paper, pencils, etc.). 5.00 1 / 5 0.03(2)
0.03(2)
0.10(7)
0.25(18)
0.60(44)
0.00(0)
My school building is kept in good condition (for example, when something isbroken, it gets fixed). 5.00 1 / 5 0.04
(3)0.04
(3)0.04
(3)0.34(25)
0.53(39)
0.00(0)
Item-by-Item Survey Responses: Students
IV. Detailed Findings
Copyright © 2013 by the National School Climate Center (NSCC).

schoolclimate.org | page 87
Item-by-Item Survey Responses: Students
IV. Detailed Findings
Social Media Rating ResponseGiven
RatingResponseNot Given
Survey Item MedianRating Min/Max Strongly
Disagree Disagree Neutral Agree StronglyAgree
MissingResponse
Many students in my school will try to stop other students from saying mean thingsto others online or through the phone. 3.00 1 / 5 0.10
(7)0.12
(9)0.30(22)
0.27(20)
0.21(15)
0.00(0)
Most students in my school do not share personal information online or throughthe phone (for e.g., home address, last name, etc.) 3.00 1 / 5 0.07
(5)0.10
(7)0.37(27)
0.27(20)
0.19(14)
0.00(0)
Most students in my school use the internet or the phone in ways that make eachother feel better. 3.00 1 / 5 0.19
(14)0.14(10)
0.37(27)
0.18(13)
0.12(9)
0.00(0)
In this school, students will ask an adult for help if someone says mean thingsonline or through the phone. 3.00 1 / 5 0.07
(5)0.12
(9)0.40(29)
0.18(13)
0.23(17)
0.00(0)
I use the internet or the phone without being teased or made fun of by otherstudents. 4.00 2 / 5 0.00
(0)0.04
(3)0.22(16)
0.30(22)
0.44(32)
0.00(0)
A student in my school has said mean things to me online or through the phonemore than once.* 2.00 1 / 5 0.49
(36)0.15(11)
0.21(15)
0.07(5)
0.08(6)
0.00(0)
* For this item, a higher score indicates a negative perception rather than a positive one. This has been taken into account in analyzing survey results and creating scale scores for other parts of the report.
Copyright © 2013 by the National School Climate Center (NSCC).

schoolclimate.org | page 88
Safety Rules & Norms Rating ResponseGiven
RatingResponseNot Given
Survey Item MedianRating Min/Max Strongly
Disagree Disagree Neutral Agree StronglyAgree N/A Missing
Response
In this school, there are clear rules against physically hurting other people (forexample, hitting, pushing, tripping, etc.). 5.00 2 / 5 0.00
(0)0.03
(1)0.13
(5)0.32(12)
0.53(20)
0.00(0)
0.05(2)
Adults in this school will stop students if they see them physically hurting eachother (for example, pushing, slapping, beating each other up, etc.). 5.00 3 / 5 0.00
(0)0.00
(0)0.05
(2)0.26(10)
0.69(27)
0.00(0)
0.03(1)
In this school, there are clear rules against insults, teasing, harassment, andother verbal abuse. 4.00 2 / 5 0.00
(0)0.08
(3)0.26(10)
0.36(14)
0.31(12)
0.00(0)
0.03(1)
Adults in the school fairly enforce rules against physical and verbal harassment. 4.00 2 / 5 0.00(0)
0.03(1)
0.16(6)
0.34(13)
0.47(18)
0.00(0)
0.05(2)
Adults in the school stop students if they see them insulting, teasing, harassing,or otherwise verbally abusing other students. 5.00 3 / 5 0.00
(0)0.00
(0)0.03
(1)0.36(14)
0.62(24)
0.00(0)
0.03(1)
Copyright © 2013 by the National School Climate Center (NSCC).
Item-by-Item Survey Responses: School Personnel
IV. Detailed Findings

schoolclimate.org | page 89
Sense of Physical Security Rating ResponseGiven
RatingResponseNot Given
Survey Item MedianRating Min/Max Strongly
Disagree Disagree Neutral Agree StronglyAgree N/A Missing
Response
There are areas of this school where adults do not feel physically safe.* 1.00 1 / 4 0.63(25)
0.23(9)
0.10(4)
0.03(1)
0.00(0)
0.03(1)
0.00(0)
I have seen or heard about students pushing, slapping, or beating up otherstudents more than once in this school.* 2.00 1 / 4 0.40
(16)0.23
(9)0.08
(3)0.28(11)
0.00(0)
0.03(1)
0.00(0)
Most students feel physically safe in the area outside the school (for example,schoolyard, on the bus, walking to and from school, etc.). 4.00 2 / 5 0.00
(0)0.03
(1)0.24
(9)0.37(14)
0.37(14)
0.00(0)
0.05(2)
Most students feel physically safe in all areas of the school building (for example,classrooms, hallways, cafeteria, restrooms, etc.). 5.00 3 / 5 0.00
(0)0.00
(0)0.13
(5)0.31(12)
0.56(22)
0.00(0)
0.03(1)
* For this item, a higher score indicates a negative perception rather than a positive one. This has been taken into account in analyzing survey results and creating scale scores for other parts of the report.
Item-by-Item Survey Responses: School Personnel
IV. Detailed Findings
Copyright © 2013 by the National School Climate Center (NSCC).

schoolclimate.org | page 90
Sense of Social-Emotional Security Rating ResponseGiven
RatingResponseNot Given
Survey Item MedianRating Min/Max Strongly
Disagree Disagree Neutral Agree StronglyAgree N/A Missing
Response
It is common for students to tease and insult one another.* 2.00 1 / 4 0.18(7)
0.48(19)
0.18(7)
0.18(7)
0.00(0)
0.00(0)
0.00(0)
Students at this school will try to stop students from insulting or making fun ofothers. 4.00 2 / 5 0.00
(0)0.03
(1)0.36(14)
0.41(16)
0.21(8)
0.00(0)
0.03(1)
Very few students in this school make fun of other students. 4.00 1 / 5 0.03(1)
0.08(3)
0.26(10)
0.38(15)
0.26(10)
0.00(0)
0.03(1)
There are groups of students in the school who exclude others and make themfeel bad for not being a part of the group.* 3.00 1 / 5 0.13
(5)0.31(12)
0.31(12)
0.21(8)
0.03(1)
0.03(1)
0.03(1)
I have seen students insult, tease, harass or otherwise verbally abuse otherstudents more than once in this school.* 2.00 1 / 5 0.23
(9)0.35(14)
0.13(5)
0.25(10)
0.05(2)
0.00(0)
0.00(0)
Most students in this school try to treat other students the way they'd want to betreated. 4.00 3 / 5 0.00
(0)0.00
(0)0.18
(7)0.45(18)
0.38(15)
0.00(0)
0.00(0)
* For this item, a higher score indicates a negative perception rather than a positive one. This has been taken into account in analyzing survey results and creating scale scores for other parts of the report.
Copyright © 2013 by the National School Climate Center (NSCC).
Item-by-Item Survey Responses: School Personnel
IV. Detailed Findings

schoolclimate.org | page 91
Support for Learning Rating ResponseGiven
RatingResponseNot Given
Survey Item MedianRating Min/Max Strongly
Disagree Disagree Neutral Agree StronglyAgree N/A Missing
Response
Teachers encourage students to try out their own ideas. 4.00 3 / 5 0.00(0)
0.00(0)
0.15(6)
0.59(23)
0.23(9)
0.03(1)
0.03(1)
Teachers let students know when they do a good job. 4.00 3 / 5 0.00(0)
0.00(0)
0.08(3)
0.42(16)
0.50(19)
0.00(0)
0.05(2)
Students feel comfortable letting their teachers know when they are confused. 4.00 2 / 5 0.00(0)
0.03(1)
0.08(3)
0.67(26)
0.21(8)
0.03(1)
0.03(1)
Students can get extra help if they need it. 4.00 2 / 5 0.00(0)
0.03(1)
0.08(3)
0.51(20)
0.36(14)
0.03(1)
0.03(1)
Teachers give their students opportunities to show what they know and can do in avariety of ways (for example, papers, presentations, projects, tests, etc.). 4.00 2 / 5 0.00
(0)0.05
(2)0.18
(7)0.33(13)
0.41(16)
0.03(1)
0.03(1)
Teachers give their students useful feedback on their work. 4.00 3 / 5 0.00(0)
0.00(0)
0.15(6)
0.51(20)
0.33(13)
0.00(0)
0.03(1)
All students are given appropriately challenging work. 4.00 2 / 5 0.00(0)
0.05(2)
0.13(5)
0.49(19)
0.28(11)
0.05(2)
0.03(1)
Teachers show their students how to learn from their own mistakes. 4.00 3 / 5 0.00(0)
0.00(0)
0.18(7)
0.44(17)
0.38(15)
0.00(0)
0.03(1)
Teachers help their students figure out how they learn best. 4.00 2 / 5 0.00(0)
0.05(2)
0.18(7)
0.49(19)
0.26(10)
0.03(1)
0.03(1)
Item-by-Item Survey Responses: School Personnel
IV. Detailed Findings
Copyright © 2013 by the National School Climate Center (NSCC).

schoolclimate.org | page 92
Social and Civic Learning Rating ResponseGiven
RatingResponseNot Given
Survey Item MedianRating Min/Max Strongly
Disagree Disagree Neutral Agree StronglyAgree N/A Missing
Response
In this school, adults teach students to express emotions in proper ways. 5.00 2 / 5 0.00(0)
0.03(1)
0.05(2)
0.36(14)
0.56(22)
0.00(0)
0.03(1)
In this school, we teach ways to resolve disagreements so that everyone can besatisfied with the outcome. 4.00 2 / 5 0.00
(0)0.05
(2)0.08
(3)0.51(20)
0.36(14)
0.00(0)
0.03(1)
Adults in this school help students think about how their actions will affect others. 5.00 3 / 5 0.00(0)
0.00(0)
0.08(3)
0.41(16)
0.51(20)
0.00(0)
0.03(1)
Adults in this school discuss issues that help students think about how to be agood person. 4.00 3 / 5 0.00
(0)0.00
(0)0.10
(4)0.46(18)
0.44(17)
0.00(0)
0.03(1)
Adults in this school help students think about how best to handle difficultsituations. 5.00 2 / 5 0.00
(0)0.05
(2)0.05
(2)0.36(14)
0.54(21)
0.00(0)
0.03(1)
Students in this school believe it is their responsibility to make the world a betterplace. 4.00 3 / 5 0.00
(0)0.00
(0)0.38(15)
0.49(19)
0.13(5)
0.00(0)
0.03(1)
In this school, we discuss issues that help students think about what is right andwrong. 4.00 3 / 5 0.00
(0)0.00
(0)0.08
(3)0.44(17)
0.49(19)
0.00(0)
0.03(1)
In this school, we teach skills that help students plan their time so they can gettheir work done and still do other things they enjoy. 4.00 2 / 5 0.00
(0)0.05
(2)0.26(10)
0.49(19)
0.21(8)
0.00(0)
0.03(1)
Adults in this school encourage students to understand the importance of theirfeelings and those of others. 4.00 3 / 5 0.00
(0)0.00
(0)0.10
(4)0.51(20)
0.38(15)
0.00(0)
0.03(1)
In this school, students participate in activities that help communities (forexample, canned food drive, coat-drive, recycling program, etc.). 4.00 3 / 5 0.00
(0)0.00
(0)0.08
(3)0.55(22)
0.35(14)
0.03(1)
0.00(0)
Copyright © 2013 by the National School Climate Center (NSCC).
Item-by-Item Survey Responses: School Personnel
IV. Detailed Findings

schoolclimate.org | page 93
Respect for Diversity Rating ResponseGiven
RatingResponseNot Given
Survey Item MedianRating Min/Max Strongly
Disagree Disagree Neutral Agree StronglyAgree N/A Missing
Response
Students in this school respect each other's differences (for example, gender,race, culture, disability, sexual orientation, learning differences, etc.). 4.00 2 / 5 0.00
(0)0.05
(2)0.15
(6)0.45(18)
0.30(12)
0.05(2)
0.00(0)
This school welcomes and accepts people from diverse backgrounds. 4.00 3 / 5 0.00(0)
0.00(0)
0.10(4)
0.54(21)
0.36(14)
0.00(0)
0.03(1)
Students like working with someone who is different than them (for example,another gender, race, culture, disability, sexual orientation, learning differences,etc.).
3.00 2 / 5 0.00(0)
0.10(4)
0.46(18)
0.28(11)
0.15(6)
0.00(0)
0.03(1)
Students in this school respect differences in adults (for example, gender, race,culture, disability, sexual orientation, learning differences, etc.). 4.00 2 / 5 0.00
(0)0.03
(1)0.30(12)
0.40(16)
0.28(11)
0.00(0)
0.00(0)
Adults in this school respect differences in students (for example, gender, race,culture, disability, sexual orientation, learning differences, etc.). 4.00 2 / 5 0.00
(0)0.05
(2)0.08
(3)0.43(17)
0.45(18)
0.00(0)
0.00(0)
Adults in this school respect each other's differences (for example gender, race,culture, disability, sexual orientation, learning differences, etc.). 4.00 2 / 5 0.00
(0)0.03
(1)0.08
(3)0.50(20)
0.40(16)
0.00(0)
0.00(0)
Item-by-Item Survey Responses: School Personnel
IV. Detailed Findings
Copyright © 2013 by the National School Climate Center (NSCC).

schoolclimate.org | page 94
Social Support / Adults Rating ResponseGiven
RatingResponseNot Given
Survey Item MedianRating Min/Max Strongly
Disagree Disagree Neutral Agree StronglyAgree N/A Missing
Response
Adults in this school are good examples of the values the school teaches (likerespect, responsibility, and fairness). 4.00 2 / 5 0.00
(0)0.03
(1)0.08
(3)0.55(22)
0.35(14)
0.00(0)
0.00(0)
Teachers in this school have high expectations for students' success. 5.00 3 / 5 0.00(0)
0.00(0)
0.10(4)
0.38(15)
0.53(21)
0.00(0)
0.00(0)
Adults in this school generally act with student's best interests in mind. 4.00 3 / 5 0.00(0)
0.00(0)
0.08(3)
0.43(17)
0.50(20)
0.00(0)
0.00(0)
If students need to talk to an adult in school about a problem, there is someonethey trust who they could talk to. 4.00 3 / 5 0.00
(0)0.00
(0)0.15
(6)0.38(15)
0.46(18)
0.00(0)
0.03(1)
Adults in this school listen to what students have to say. 4.00 2 / 5 0.00(0)
0.03(1)
0.13(5)
0.41(16)
0.41(16)
0.03(1)
0.03(1)
Adults in this school are interested in getting to know students. 4.00 2 / 5 0.00(0)
0.03(1)
0.05(2)
0.43(17)
0.48(19)
0.03(1)
0.00(0)
Copyright © 2013 by the National School Climate Center (NSCC).
Item-by-Item Survey Responses: School Personnel
IV. Detailed Findings

schoolclimate.org | page 95
Social Support / Students Rating ResponseGiven
RatingResponseNot Given
Survey Item MedianRating Min/Max Strongly
Disagree Disagree Neutral Agree StronglyAgree N/A Missing
Response
Students have friends at school they can turn to if they have questions abouthomework. 4.00 3 / 5 0.00
(0)0.00
(0)0.18
(7)0.49(19)
0.26(10)
0.08(3)
0.03(1)
Students have friends at school they trust and talk to when they have problems. 4.00 3 / 5 0.00(0)
0.00(0)
0.18(7)
0.54(21)
0.28(11)
0.00(0)
0.03(1)
Students in this school seem to work well with one another even if they're not inthe same group of friends. 4.00 2 / 5 0.00
(0)0.03
(1)0.28(11)
0.45(18)
0.23(9)
0.03(1)
0.00(0)
Students have friends at school to eat lunch with. 4.00 2 / 5 0.00(0)
0.03(1)
0.13(5)
0.41(16)
0.41(16)
0.03(1)
0.03(1)
Students try to make new students feel welcome in the school. 4.00 2 / 5 0.00(0)
0.03(1)
0.08(3)
0.59(23)
0.28(11)
0.03(1)
0.03(1)
Item-by-Item Survey Responses: School Personnel
IV. Detailed Findings
Copyright © 2013 by the National School Climate Center (NSCC).
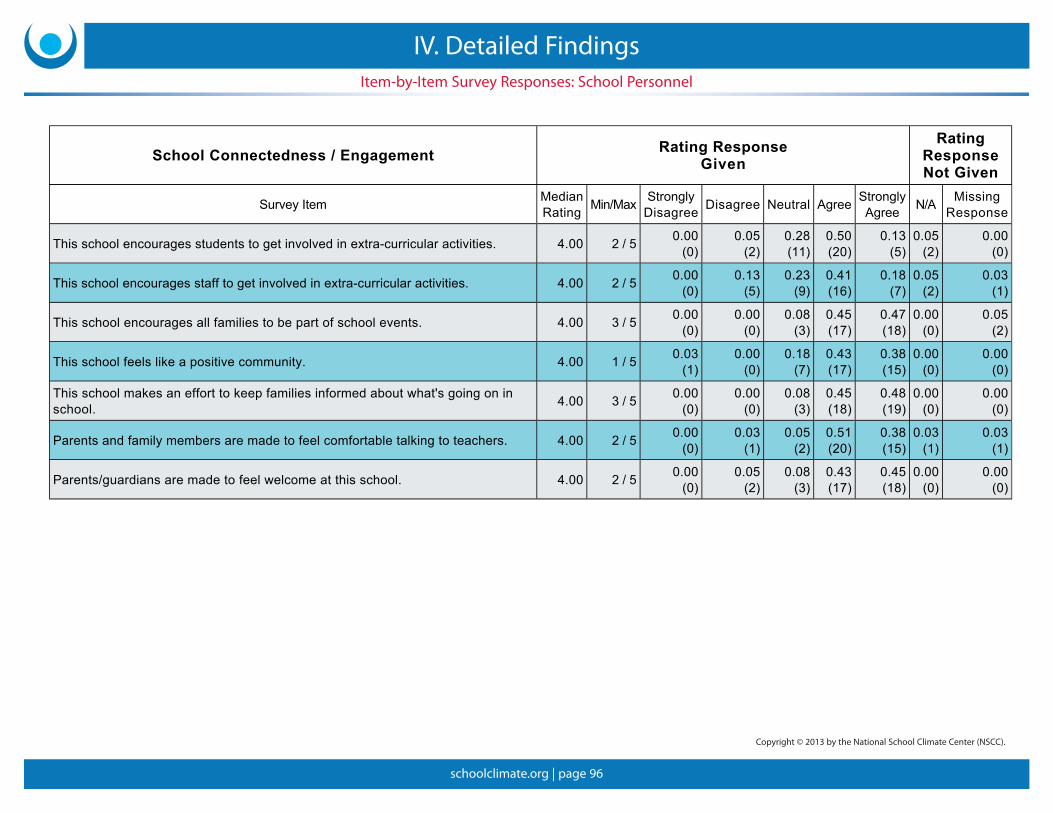
schoolclimate.org | page 96
School Connectedness / Engagement Rating ResponseGiven
RatingResponseNot Given
Survey Item MedianRating Min/Max Strongly
Disagree Disagree Neutral Agree StronglyAgree N/A Missing
Response
This school encourages students to get involved in extra-curricular activities. 4.00 2 / 5 0.00(0)
0.05(2)
0.28(11)
0.50(20)
0.13(5)
0.05(2)
0.00(0)
This school encourages staff to get involved in extra-curricular activities. 4.00 2 / 5 0.00(0)
0.13(5)
0.23(9)
0.41(16)
0.18(7)
0.05(2)
0.03(1)
This school encourages all families to be part of school events. 4.00 3 / 5 0.00(0)
0.00(0)
0.08(3)
0.45(17)
0.47(18)
0.00(0)
0.05(2)
This school feels like a positive community. 4.00 1 / 5 0.03(1)
0.00(0)
0.18(7)
0.43(17)
0.38(15)
0.00(0)
0.00(0)
This school makes an effort to keep families informed about what's going on inschool. 4.00 3 / 5 0.00
(0)0.00
(0)0.08
(3)0.45(18)
0.48(19)
0.00(0)
0.00(0)
Parents and family members are made to feel comfortable talking to teachers. 4.00 2 / 5 0.00(0)
0.03(1)
0.05(2)
0.51(20)
0.38(15)
0.03(1)
0.03(1)
Parents/guardians are made to feel welcome at this school. 4.00 2 / 5 0.00(0)
0.05(2)
0.08(3)
0.43(17)
0.45(18)
0.00(0)
0.00(0)
Copyright © 2013 by the National School Climate Center (NSCC).
Item-by-Item Survey Responses: School Personnel
IV. Detailed Findings

schoolclimate.org | page 97
Physical Surroundings Rating ResponseGiven
RatingResponseNot Given
Survey Item MedianRating Min/Max Strongly
Disagree Disagree Neutral Agree StronglyAgree N/A Missing
Response
This school building is clean. 5.00 3 / 5 0.00(0)
0.00(0)
0.08(3)
0.31(12)
0.62(24)
0.00(0)
0.03(1)
This school has up-to-date computers and other electronic devices available tostudents. 5.00 2 / 5 0.00
(0)0.03
(1)0.05
(2)0.33(13)
0.59(23)
0.00(0)
0.03(1)
This school looks good (enough space, nicely decorated with student artwork,etc.). 4.00 3 / 5 0.00
(0)0.00
(0)0.08
(3)0.48(19)
0.45(18)
0.00(0)
0.00(0)
We have enough space and facilities for extra-curricular activities at this school. 4.00 2 / 5 0.00(0)
0.13(5)
0.08(3)
0.48(19)
0.30(12)
0.03(1)
0.00(0)
We have enough basic supplies in school (for example, books, paper, pencils,etc.). 5.00 3 / 5 0.00
(0)0.00
(0)0.05
(2)0.38(15)
0.55(22)
0.03(1)
0.00(0)
This school building is kept in good condition (for example, when something isbroken, it gets fixed). 5.00 2 / 5 0.00
(0)0.03
(1)0.05
(2)0.33(13)
0.60(24)
0.00(0)
0.00(0)
Item-by-Item Survey Responses: School Personnel
IV. Detailed Findings
Copyright © 2013 by the National School Climate Center (NSCC).

schoolclimate.org | page 98
Social Media Rating ResponseGiven
RatingResponseNot Given
Survey Item MedianRating Min/Max Strongly
Disagree Disagree Neutral Agree StronglyAgree N/A Missing
Response
Many students in this school will try to stop other students from threatening orharassing others using social media. 3.00 2 / 5 0.00
(0)0.03
(1)0.37(14)
0.24(9)
0.11(4)
0.26(10)
0.05(2)
Most students in this school do not share inappropriate information (includingpersonal information) on social media. 4.00 2 / 5 0.00
(0)0.03
(1)0.35(13)
0.27(10)
0.19(7)
0.16(6)
0.08(3)
Most students in this school use social media in ways that support one another(for e.g., emotionally, academically, etc.). 3.00 3 / 5 0.00
(0)0.00
(0)0.53(19)
0.17(6)
0.08(3)
0.22(8)
0.11(4)
In this school, students will seek help from an adult in the school if they have beenharassed on social media. 4.00 3 / 5 0.00
(0)0.00
(0)0.32(12)
0.37(14)
0.08(3)
0.24(9)
0.05(2)
Students in this school can use social media without being harassed by anotherstudent. 3.00 3 / 5 0.00
(0)0.00
(0)0.41(15)
0.19(7)
0.16(6)
0.24(9)
0.08(3)
Copyright © 2013 by the National School Climate Center (NSCC).
Item-by-Item Survey Responses: School Personnel
IV. Detailed Findings

schoolclimate.org | page 99
Leadership Rating ResponseGiven
RatingResponseNot Given
Survey Item MedianRating Min/Max Strongly
Disagree Disagree Neutral Agree StronglyAgree N/A Missing
Response
The administration at this school is fair in the way they allocate resources. 4.00 1 / 5 0.03(1)
0.03(1)
0.18(7)
0.35(14)
0.43(17)
0.00(0)
0.00(0)
The administration at this school provides teachers with opportunities to worktogether collaboratively. 4.00 1 / 5 0.03
(1)0.10
(4)0.08
(3)0.41(16)
0.36(14)
0.03(1)
0.03(1)
Most teachers at this school feel comfortable asking for help from theadministration. 4.00 1 / 5 0.08
(3)0.10
(4)0.18
(7)0.41(16)
0.23(9)
0.00(0)
0.03(1)
The administration at this school puts enough resources (for example, funds,time, etc.) into curriculum and instructional development. 4.00 1 / 5 0.03
(1)0.00
(0)0.18
(7)0.33(13)
0.44(17)
0.03(1)
0.03(1)
The administration involves teachers in planning professional developmentactivities. 4.00 2 / 5 0.00
(0)0.10
(4)0.20
(8)0.53(21)
0.15(6)
0.03(1)
0.00(0)
The work I do at this school is appreciated by the administration. 4.00 1 / 5 0.03(1)
0.10(4)
0.10(4)
0.40(16)
0.38(15)
0.00(0)
0.00(0)
The administration at this school communicates openly with teachers and staff. 4.00 1 / 5 0.03(1)
0.08(3)
0.20(8)
0.40(16)
0.30(12)
0.00(0)
0.00(0)
The administration at this school uses staff voice in decision making (instruction,discipline policy, etc.). 4.00 1 / 5 0.03
(1)0.15
(6)0.18
(7)0.41(16)
0.23(9)
0.00(0)
0.03(1)
The administration at this school effectively communicates a strong andcompelling vision for what they want the school to be. 4.00 1 / 5 0.03
(1)0.15
(6)0.15
(6)0.45(18)
0.23(9)
0.00(0)
0.00(0)
The administration at this school allocates resources to develop staff expertise. 4.00 2 / 5 0.00(0)
0.03(1)
0.21(8)
0.41(16)
0.36(14)
0.00(0)
0.03(1)
Item-by-Item Survey Responses: School Personnel
IV. Detailed Findings
Copyright © 2013 by the National School Climate Center (NSCC).

schoolclimate.org | page 100
Item-by-Item Survey Responses: School Personnel
IV. Detailed Findings
Professional Relationships Rating ResponseGiven
RatingResponseNot Given
Survey Item MedianRating Min/Max Strongly
Disagree Disagree Neutral Agree StronglyAgree N/A Missing
Response
Most staff in this school are generous about helping others with instructionalissues. 5.00 2 / 5 0.00
(0)0.05
(2)0.08
(3)0.30(12)
0.58(23)
0.00(0)
0.00(0)
I have seen or heard staff exclude, insult or gossip about other staff.* 3.00 1 / 5 0.15(6)
0.18(7)
0.31(12)
0.28(11)
0.05(2)
0.03(1)
0.03(1)
Most staff in the school are comfortable asking for help from their colleagues. 4.00 3 / 5 0.00(0)
0.00(0)
0.13(5)
0.46(18)
0.41(16)
0.00(0)
0.03(1)
Staff in the school are comfortable sharing ideas at staff/faculty meetings. 4.00 1 / 5 0.03(1)
0.10(4)
0.13(5)
0.49(19)
0.26(10)
0.00(0)
0.03(1)
I feel good about what I accomplish as a staff member at this school. 4.00 2 / 5 0.00(0)
0.03(1)
0.05(2)
0.48(19)
0.45(18)
0.00(0)
0.00(0)
Staff in this school generally trust each other professionally regardless ofpersonal differences. 4.00 2 / 5 0.00
(0)0.05
(2)0.10
(4)0.45(18)
0.38(15)
0.03(1)
0.00(0)
Working relationships among staff in this school make it easier to try new things. 4.00 2 / 5 0.00(0)
0.03(1)
0.18(7)
0.49(19)
0.31(12)
0.00(0)
0.03(1)
Most staff in this school are good at the work they do. 5.00 3 / 5 0.00(0)
0.00(0)
0.08(3)
0.41(16)
0.51(20)
0.00(0)
0.03(1)
* For this item, a higher score indicates a negative perception rather than a positive one. This has been taken into account in analyzing survey results and creating scale scores for other parts of the report.
Copyright © 2013 by the National School Climate Center (NSCC).

schoolclimate.org | page 101
Safety Rules & Norms Rating ResponseGiven
RatingResponseNot Given
Survey Item MedianRating Min/Max Strongly
Disagree Disagree Neutral Agree StronglyAgree
MissingResponse
In my child's school, there are clear rules against physically hurting other people(for example, hitting, pushing, tripping, etc.). 4.00 1 / 5 0.01
(1)0.05
(4)0.07
(5)0.52(39)
0.35(26)
0.00(0)
Adults in my child's school are fair about making sure that all students follow therules against physical and verbal harassment. 4.00 1 / 5 0.01
(1)0.09
(7)0.21(16)
0.53(40)
0.15(11)
0.00(0)
Adults in my child's school will stop students if they see them physically hurtingeach other (for example, pushing, slapping, beating each other up, etc.). 4.00 1 / 5 0.01
(1)0.01
(1)0.03
(2)0.59(44)
0.35(26)
0.01(1)
In my child's school, there are clear rules against insults, teasing, harassment,and other verbal abuse. 4.00 1 / 5 0.01
(1)0.07
(5)0.08
(6)0.57(43)
0.27(20)
0.00(0)
Adults in my child's school stop students if they see them insulting, teasing,harassing, or otherwise verbally abusing other students. 4.00 1 / 5 0.01
(1)0.01
(1)0.20(15)
0.56(42)
0.21(16)
0.00(0)
Copyright © 2013 by the National School Climate Center (NSCC).
Item-by-Item Survey Responses: Parents
IV. Detailed Findings

schoolclimate.org | page 102
Sense of Physical Security Rating ResponseGiven
RatingResponseNot Given
Survey Item MedianRating Min/Max Strongly
Disagree Disagree Neutral Agree StronglyAgree
MissingResponse
In my child's school, there are students who have been physically hurt at schoolmore than once by other students (for example, pushed, slapped, beaten up, etc.).*
3.00 1 / 5 0.10(7)
0.26(19)
0.29(21)
0.18(13)
0.17(12)
0.04(3)
My child feels physically safe in the area outside the school (for example,schoolyard, on the bus, walking to and from school, etc.). 4.00 1 / 5 0.01
(1)0.05
(4)0.04
(3)0.59(44)
0.31(23)
0.00(0)
My child has been physically hurt at school more than once by other students (forexample, pushed, slapped, beaten up, etc.).* 2.00 1 / 5 0.36
(27)0.36(27)
0.14(10)
0.07(5)
0.07(5)
0.01(1)
My child feels physically safe in all areas of the school building (for example,classrooms, hallways, cafeteria, restrooms, etc.). 4.00 1 / 5 0.01
(1)0.03
(2)0.01
(1)0.61(46)
0.33(25)
0.00(0)
* For this item, a higher score indicates a negative perception rather than a positive one. This has been taken into account in analyzing survey results and creating scale scores for other parts of the report.
Item-by-Item Survey Responses: Parents
IV. Detailed Findings
Copyright © 2013 by the National School Climate Center (NSCC).

schoolclimate.org | page 103
Sense of Social-Emotional Security Rating ResponseGiven
RatingResponseNot Given
Survey Item MedianRating Min/Max Strongly
Disagree Disagree Neutral Agree StronglyAgree
MissingResponse
My child has been insulted, teased, harassed or otherwise verbally abused morethan once at this school.* 2.00 1 / 5 0.24
(18)0.30(22)
0.14(10)
0.20(15)
0.12(9)
0.01(1)
Students at my child's school will try to stop students from insulting or making funof others. 4.00 1 / 5 0.04
(3)0.08
(6)0.33(24)
0.46(33)
0.08(6)
0.04(3)
Very few students in my child's school make fun of other students. 3.00 1 / 5 0.07(5)
0.16(12)
0.34(25)
0.36(27)
0.07(5)
0.01(1)
There are groups of students in the school who exclude others and make themfeel bad for not being a part of the group.* 3.00 1 / 5 0.08
(6)0.25(18)
0.37(27)
0.22(16)
0.08(6)
0.03(2)
It is common to see students in my child's school insulted, teased, harassed orotherwise verbally abused by other students.* 2.00 1 / 5 0.32
(24)0.33(25)
0.25(19)
0.08(6)
0.01(1)
0.00(0)
Most students in my child's school try to treat other students the way they'd want tobe treated. 4.00 1 / 5 0.01
(1)0.01
(1)0.11
(8)0.67(50)
0.20(15)
0.00(0)
* For this item, a higher score indicates a negative perception rather than a positive one. This has been taken into account in analyzing survey results and creating scale scores for other parts of the report.
Copyright © 2013 by the National School Climate Center (NSCC).
Item-by-Item Survey Responses: Parents
IV. Detailed Findings
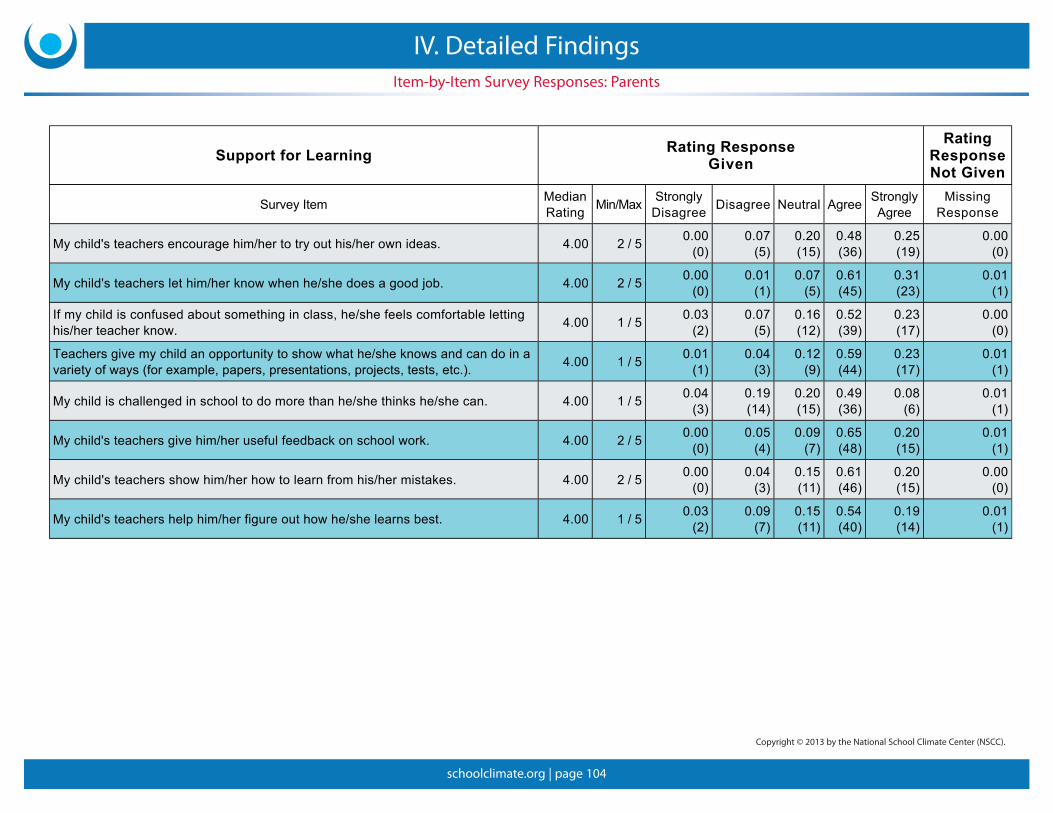
schoolclimate.org | page 104
Support for Learning Rating ResponseGiven
RatingResponseNot Given
Survey Item MedianRating Min/Max Strongly
Disagree Disagree Neutral Agree StronglyAgree
MissingResponse
My child's teachers encourage him/her to try out his/her own ideas. 4.00 2 / 5 0.00(0)
0.07(5)
0.20(15)
0.48(36)
0.25(19)
0.00(0)
My child's teachers let him/her know when he/she does a good job. 4.00 2 / 5 0.00(0)
0.01(1)
0.07(5)
0.61(45)
0.31(23)
0.01(1)
If my child is confused about something in class, he/she feels comfortable lettinghis/her teacher know. 4.00 1 / 5 0.03
(2)0.07
(5)0.16(12)
0.52(39)
0.23(17)
0.00(0)
Teachers give my child an opportunity to show what he/she knows and can do in avariety of ways (for example, papers, presentations, projects, tests, etc.). 4.00 1 / 5 0.01
(1)0.04
(3)0.12
(9)0.59(44)
0.23(17)
0.01(1)
My child is challenged in school to do more than he/she thinks he/she can. 4.00 1 / 5 0.04(3)
0.19(14)
0.20(15)
0.49(36)
0.08(6)
0.01(1)
My child's teachers give him/her useful feedback on school work. 4.00 2 / 5 0.00(0)
0.05(4)
0.09(7)
0.65(48)
0.20(15)
0.01(1)
My child's teachers show him/her how to learn from his/her mistakes. 4.00 2 / 5 0.00(0)
0.04(3)
0.15(11)
0.61(46)
0.20(15)
0.00(0)
My child's teachers help him/her figure out how he/she learns best. 4.00 1 / 5 0.03(2)
0.09(7)
0.15(11)
0.54(40)
0.19(14)
0.01(1)
Item-by-Item Survey Responses: Parents
IV. Detailed Findings
Copyright © 2013 by the National School Climate Center (NSCC).

schoolclimate.org | page 105
Social and Civic Learning Rating ResponseGiven
RatingResponseNot Given
Survey Item MedianRating Min/Max Strongly
Disagree Disagree Neutral Agree StronglyAgree
MissingResponse
In my child's school, adults teach him/her how to express emotions in properways. 4.00 2 / 5 0.00
(0)0.05
(4)0.15(11)
0.64(48)
0.16(12)
0.00(0)
In my child's school, students learn ways to resolve disagreements so thateveryone can be satisfied with the outcome. 4.00 1 / 5 0.01
(1)0.11
(8)0.24(18)
0.52(39)
0.12(9)
0.00(0)
In my child's school, he/she talks about the way his/her actions will affect others. 4.00 1 / 5 0.01(1)
0.07(5)
0.24(18)
0.59(44)
0.09(7)
0.00(0)
In my child's school, he/she discusses issues that help him/her think about how tobe a good person. 4.00 1 / 5 0.01
(1)0.04
(3)0.14(10)
0.68(50)
0.14(10)
0.01(1)
In my child's school, he/she discusses issues that help him/her think about whatis right and wrong. 4.00 1 / 5 0.01
(1)0.03
(2)0.19(14)
0.65(48)
0.12(9)
0.01(1)
My child learns skills that help him/her plan time effectively to get work done andstill do other things he/she enjoys. 4.00 1 / 5 0.01
(1)0.14(10)
0.20(15)
0.55(41)
0.09(7)
0.01(1)
Students in my child's school believe it is their responsibility to make the world abetter place. 4.00 1 / 5 0.01
(1)0.03
(2)0.42(31)
0.47(34)
0.07(5)
0.03(2)
In my child's school, he/she talks about the importance of understanding his/herfeelings and the feelings of others. 4.00 1 / 5 0.01
(1)0.04
(3)0.16(12)
0.68(50)
0.10(7)
0.03(2)
In my child's school, students participate in activities that help communities (forexample, canned food drive, coat-drive, recycling program, etc.). 4.00 2 / 5 0.00
(0)0.07
(5)0.12
(9)0.58(42)
0.23(17)
0.03(2)
Adults in my child's school help students think about how best to handle difficultsituations. 4.00 1 / 5 0.03
(2)0.05
(4)0.11
(8)0.63(47)
0.19(14)
0.00(0)
Copyright © 2013 by the National School Climate Center (NSCC).
Item-by-Item Survey Responses: Parents
IV. Detailed Findings

schoolclimate.org | page 106
Respect for Diversity Rating ResponseGiven
RatingResponseNot Given
Survey Item MedianRating Min/Max Strongly
Disagree Disagree Neutral Agree StronglyAgree
MissingResponse
Students in my child's school respect each other's differences (for example,gender, race, culture, disability, sexual orientation, learning differences, etc.). 4.00 1 / 5 0.01
(1)0.07
(5)0.16(12)
0.62(45)
0.14(10)
0.03(2)
My child's school welcomes and accepts people from diverse backgrounds. 4.00 2 / 5 0.00(0)
0.05(4)
0.19(14)
0.55(41)
0.21(16)
0.00(0)
My child likes working with someone who is different than him/her (for example,another gender, race, culture, disability, sexual orientation, learning differences,etc.).
4.00 1 / 5 0.01(1)
0.05(4)
0.22(16)
0.52(38)
0.19(14)
0.03(2)
Students in my child's school respect differences in adults (for example, gender,race, culture, disability, sexual orientation, learning differences, etc.). 4.00 1 / 5 0.01
(1)0.01
(1)0.22(16)
0.57(42)
0.19(14)
0.01(1)
Adults in my child's school respect differences in students (for example, gender,race, culture, disability, sexual orientation, learning differences, etc.). 4.00 2 / 5 0.00
(0)0.04
(3)0.19(14)
0.50(37)
0.27(20)
0.01(1)
Adults in my child's school respect each other's differences (for example gender,race, culture, disability, sexual orientation, learning differences, etc.). 4.00 2 / 5 0.00
(0)0.05
(4)0.21(15)
0.51(37)
0.23(17)
0.03(2)
Item-by-Item Survey Responses: Parents
IV. Detailed Findings
Copyright © 2013 by the National School Climate Center (NSCC).

schoolclimate.org | page 107
Social Support / Adults Rating ResponseGiven
RatingResponseNot Given
Survey Item MedianRating Min/Max Strongly
Disagree Disagree Neutral Agree StronglyAgree
MissingResponse
Adults in this school are good examples of the values the school teaches (likerespect, responsibility, and fairness). 4.00 2 / 5 0.00
(0)0.03
(2)0.08
(6)0.65(49)
0.24(18)
0.00(0)
Adults in my child's school seem to work well with one another. 4.00 1 / 5 0.01(1)
0.09(7)
0.09(7)
0.59(44)
0.21(16)
0.00(0)
Teachers in my child's school have high expectations for student's success. 4.00 2 / 5 0.00(0)
0.07(5)
0.13(10)
0.56(42)
0.24(18)
0.00(0)
Adults in my child's school help one another. 4.00 1 / 5 0.01(1)
0.04(3)
0.18(13)
0.57(41)
0.19(14)
0.04(3)
If students need to talk to an adult in school about a problem, there is someonethey trust who they could talk to. 4.00 2 / 5 0.00
(0)0.03
(2)0.19(14)
0.56(41)
0.22(16)
0.03(2)
Adults in my child's school listen to what students have to say. 4.00 1 / 5 0.01(1)
0.04(3)
0.13(10)
0.59(44)
0.23(17)
0.00(0)
Adults in my child's school are interested in getting to know students. 4.00 2 / 5 0.00(0)
0.01(1)
0.09(7)
0.64(48)
0.25(19)
0.00(0)
Copyright © 2013 by the National School Climate Center (NSCC).
Item-by-Item Survey Responses: Parents
IV. Detailed Findings

schoolclimate.org | page 108
Social Support / Students Rating ResponseGiven
RatingResponseNot Given
Survey Item MedianRating Min/Max Strongly
Disagree Disagree Neutral Agree StronglyAgree
MissingResponse
Students have friends at school they can turn to if they have questions abouthomework. 4.00 1 / 5 0.01
(1)0.11
(8)0.33(24)
0.48(35)
0.07(5)
0.03(2)
Students have friends at school they trust and talk to when they have problems. 4.00 1 / 5 0.03(2)
0.03(2)
0.23(17)
0.63(47)
0.09(7)
0.00(0)
Students in my child's school work well with each other even if they're not in thesame group of friends. 4.00 1 / 5 0.01
(1)0.11
(8)0.16(12)
0.62(46)
0.09(7)
0.01(1)
Students have friends at school to eat lunch with. 4.00 1 / 5 0.01(1)
0.03(2)
0.14(10)
0.62(46)
0.20(15)
0.01(1)
Students try to make new students feel welcome in the school. 4.00 1 / 5 0.03(2)
0.04(3)
0.16(12)
0.55(41)
0.22(16)
0.01(1)
Item-by-Item Survey Responses: Parents
IV. Detailed Findings
Copyright © 2013 by the National School Climate Center (NSCC).

schoolclimate.org | page 109
School Connectedness / Engagement Rating ResponseGiven
RatingResponseNot Given
Survey Item MedianRating Min/Max Strongly
Disagree Disagree Neutral Agree StronglyAgree
MissingResponse
My child's school tries to get students to join after school activities. 4.00 1 / 5 0.01(1)
0.17(13)
0.25(19)
0.45(34)
0.11(8)
0.00(0)
My child's school tries to get all families to be part of school events. 4.00 1 / 5 0.03(2)
0.05(4)
0.07(5)
0.52(39)
0.33(25)
0.00(0)
My child feels like he/she belongs at this school. 4.00 1 / 5 0.03(2)
0.04(3)
0.05(4)
0.59(44)
0.29(22)
0.00(0)
My child's school makes an effort to keep me and my family informed about what'sgoing on in school. 4.00 1 / 5 0.03
(2)0.07
(5)0.04
(3)0.52(39)
0.35(26)
0.00(0)
My child feels good about what he/she accomplishes in school. 4.00 1 / 5 0.01(1)
0.04(3)
0.07(5)
0.58(43)
0.30(22)
0.01(1)
Parents and family members feel comfortable talking to teachers. 4.00 1 / 5 0.01(1)
0.04(3)
0.09(7)
0.58(43)
0.27(20)
0.01(1)
Parents/guardians feel welcome at my child's school. 4.00 2 / 5 0.00(0)
0.04(3)
0.15(11)
0.51(38)
0.31(23)
0.00(0)
Copyright © 2013 by the National School Climate Center (NSCC).
Item-by-Item Survey Responses: Parents
IV. Detailed Findings

schoolclimate.org | page 110
Physical Surroundings Rating ResponseGiven
RatingResponseNot Given
Survey Item MedianRating Min/Max Strongly
Disagree Disagree Neutral Agree StronglyAgree
MissingResponse
My child's school building is clean. 5.00 1 / 5 0.01(1)
0.00(0)
0.00(0)
0.48(36)
0.51(38)
0.00(0)
My child's school has up-to-date computers and other electronic devices availableto students. 4.00 1 / 5 0.03
(2)0.01
(1)0.08
(6)0.61(45)
0.27(20)
0.01(1)
My child's school looks good (for example, enough space, nicely decorated withstudent artwork, etc.). 4.00 1 / 5 0.01
(1)0.00
(0)0.03
(2)0.52(39)
0.44(33)
0.00(0)
My child's school has enough space and facilities for extra-curricular activities. 4.00 1 / 5 0.01(1)
0.07(5)
0.05(4)
0.64(48)
0.23(17)
0.00(0)
My child's school has enough supplies (for example, books, paper, pencils, etc.). 4.00 3 / 5 0.00(0)
0.00(0)
0.04(3)
0.57(42)
0.39(29)
0.01(1)
My child's school building is kept in good condition (for example, when somethingis broken, it gets fixed). 4.00 1 / 5 0.01
(1)0.07
(5)0.03
(2)0.64(47)
0.26(19)
0.01(1)
Item-by-Item Survey Responses: Parents
IV. Detailed Findings
Copyright © 2013 by the National School Climate Center (NSCC).

schoolclimate.org | page 111
Item-by-Item Survey Responses: Parents
IV. Detailed Findings
Social Media Rating ResponseGiven
RatingResponseNot Given
Survey Item MedianRating Min/Max Strongly
Disagree Disagree Neutral Agree StronglyAgree
MissingResponse
Many students in my child's school will try to stop other students from threateningor harassing others using social media. 3.00 1 / 5 0.03
(2)0.14(10)
0.63(45)
0.18(13)
0.01(1)
0.06(4)
Most students in my child's school do not share inappropriate information(including personal information) on social media. 3.00 1 / 5 0.01
(1)0.03
(2)0.51(36)
0.35(25)
0.10(7)
0.06(4)
Most students in my child's school use social media in ways that support oneanother (e.g., emotionally, academically, etc.). 3.00 1 / 5 0.03
(2)0.07
(5)0.62(42)
0.26(18)
0.01(1)
0.10(7)
In my child's school, students will seek help from an adult in the school if they havebeen harassed on social media. 3.00 1 / 5 0.01
(1)0.06
(4)0.56(39)
0.31(22)
0.06(4)
0.07(5)
My child can use social media without being harassed by another student. 3.00 2 / 5 0.00(0)
0.03(2)
0.62(43)
0.29(20)
0.06(4)
0.09(6)
My child has been threatened or harassed on social media more than once by astudent in this school.* 2.00 1 / 4 0.31
(22)0.45(32)
0.23(16)
0.01(1)
0.00(0)
0.06(4)
* For this item, a higher score indicates a negative perception rather than a positive one. This has been taken into account in analyzing survey results and creating scale scores for other parts of the report.
Copyright © 2013 by the National School Climate Center (NSCC).

schoolclimate.org | page 112
Demographic Profiles
IV. Detailed Findings

schoolclimate.org | page 113
Demographic Profiles
IV. Detailed Findings

schoolclimate.org | page 114
Demographic Profiles
IV. Detailed Findings

schoolclimate.org | page 115
Demographic Profiles
IV. Detailed Findings

schoolclimate.org | page 116
Demographic Profiles
IV. Detailed Findings

schoolclimate.org | page 117
Demographic Profiles
IV. Detailed Findings
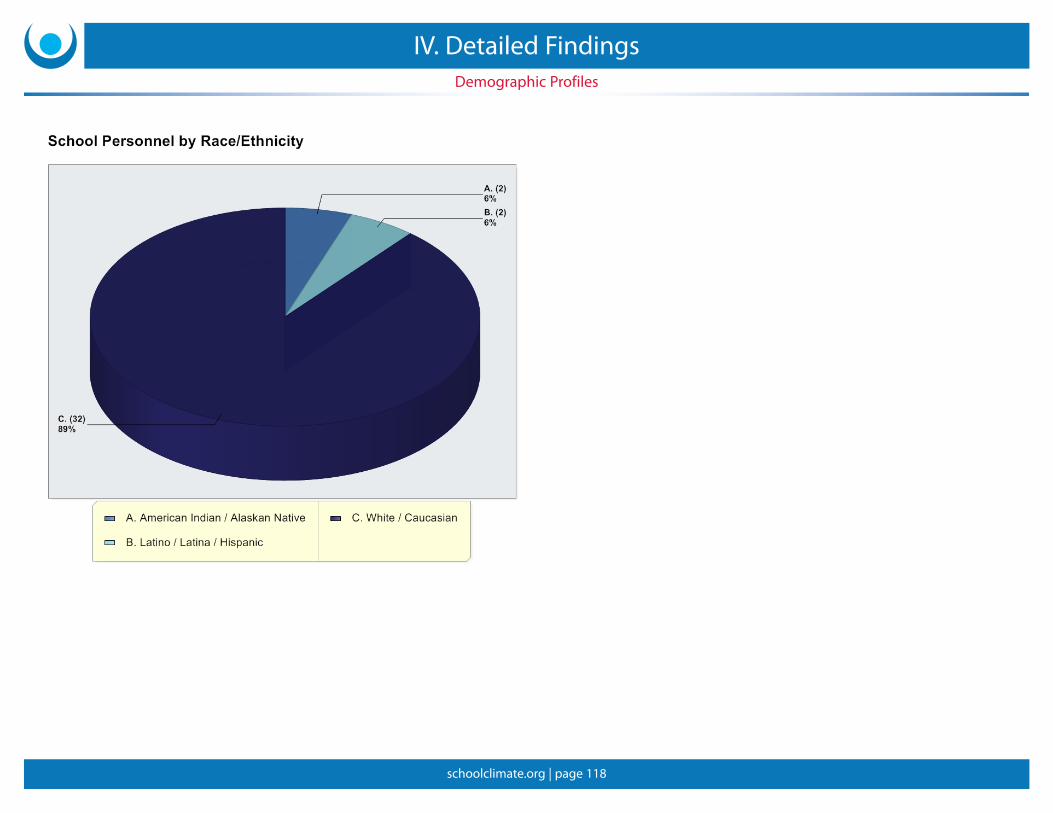
schoolclimate.org | page 118
Demographic Profiles
IV. Detailed Findings
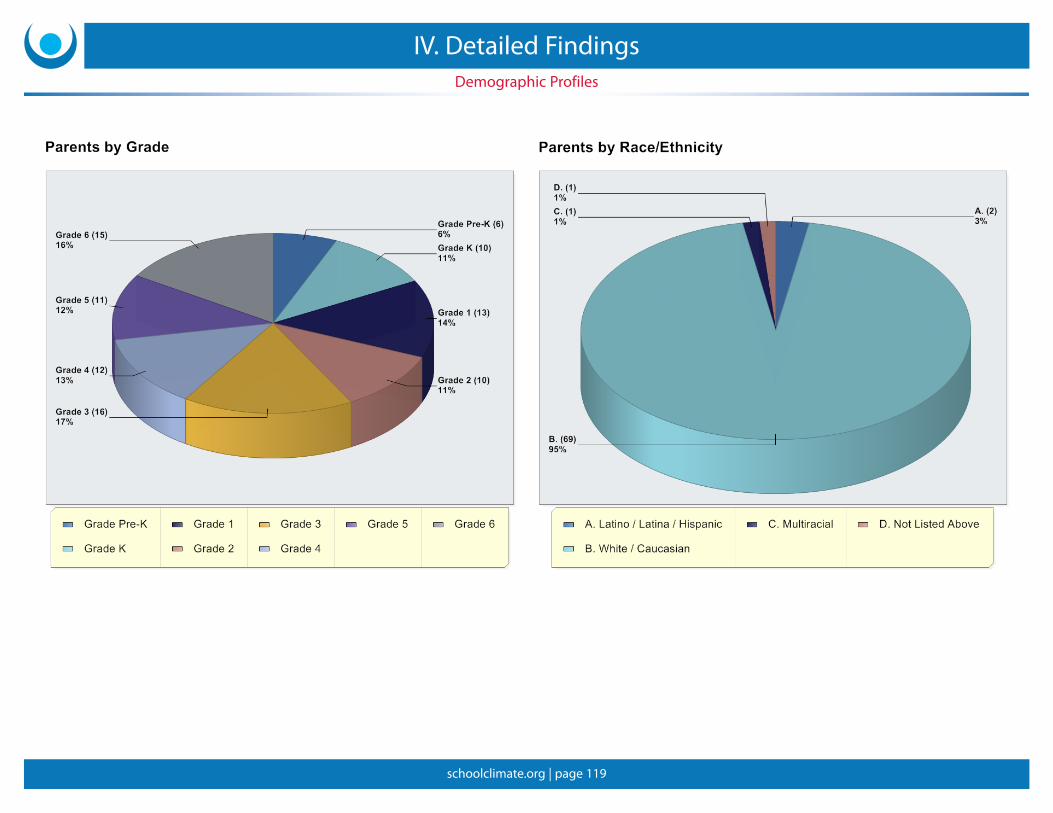
schoolclimate.org | page 119
Demographic Profiles
IV. Detailed Findings

schoolclimate.org | page 120
Demographic Profiles
IV. Detailed Findings

schoolclimate.org | page 121
Demographic Profiles
IV. Detailed Findings
schoolclimate.org | page 122
ThisRecommendedGuidelinesandResourcessectionshouldhelpyouunderstandhowtoapproachtheprocessofchangeandwheretostartbasedonthefeedbackinthisreport.Therearetworecommendationssectionsinthisreport.
Startingonthenextpage,you’llfindtheProcess Recommendations, whichwillprovideyouwithafewideasonbeginningtheprocessoftranslatingtheCSCIresultsintousefulactiontoimproveyourschoolclimate.You’llalsofindtheAction Charts. Thereisonechartforeachoftheschoolclimatedimensions.Eachoneoutlinesaprocessformovingfromexaminingyourschool’ssurveyresultstounderstandingthereasonsforanyperceivedproblems,andfromtheretodevelopingspecificsolutions.
ForMoreInformation,Visitourwebsite[www.schoolclimate.org].AtNSCC’swebsiteyou’llfindmorecomprehensiveinformationandextensiveresources,includingalistofprofessionaldevelopmentworkshopsandotherservicesthatcanhelpyouinyourschoolclimateimprovementwork.
WeencourageyouandyourschooltousetheCSCIfindingspresentedheretobringtheschoolcommunitytogether.Therecommendationsectionsinthisreportsuggestaseriesofspecificstepsandstrategiestosupporttheprocess.Asyoudecidewhichschoolclimate-relatedspheresyouwanttofocuson,wehopeyouwilldrawonNSCC’sresourcestosupportprogrammaticplanningandimplementation.
• ProcessRecommendations:HowToDoItand Where to Start
V. Recommended Guidelines and Resources

schoolclimate.org | page 123
Process Recommendations: How To Do It and Where to Start
Allschoolslookforspecificprogrammaticrecommendationswhenplanningimprovementstotheirschoolclimate.However,how we go about facilitating school improvementisasimportant,ifnotmoreimportant,thanthespecificcurriculum,techniquesorinterventionsthatweuseinagivenphaseofschoolimprovement.Weallknow,forexample,thatanexcellentacademiccurriculumwillbeuselessiftheenvironmentdoesnotsupportit.Theteachermustunderstandhowtouseitandbeinvestedinitssuccess;thestudentsmustbepreparedforthematerial,andsoon.Inordertoseeresults,youmustcreate a school environment that supports any initiatives you introduce.Otherwise,theyarelikelytobeundermined.
Belowaretenprocessguidelinesthatcurrentliteratureandpracticehaveshowntobeeffectiveinsupportingschoolclimateimprovementefforts.MoredetailedinformationcanbefoundonNSCC’sWebsite,www.schoolclimate.org,includingtools,templatesandcasehistoriesthatillustratepotentialbarriers.
1) Form a representative and inclusive leadership team. Ifithasnotbeendonealready,itisstronglyrecommendedthatyouformarepresentativeandinclusiveleadershipteamtoshepherdyourschoolclimateimprovementinitiative.Whenallmembersoftheschoolcommunityarerepresented,schoolimprovementplanshaveagreaterlikelihoodofsuccess.Thereareavarietyofwaysthatleadershipteamscanconveneforumswherestudents,staff,administrators,teachers,communitymembersandparentshaveanopportunitytosharetheirperceptions,prioritizegoals,anddevelopandimplementactionplans.
2) Designate a coordinator for the school climate improvement process.Sustainedschoolclimateimprovementeffortsdependonawell-developedplananda skilled coordinator who is visible to the school community.Ideally,theschoolprincipalisinvolvedintheinitiative,butmostoftheday-to-dayworkishandledbythecoordinator.Thisfreesuptheprincipaltocontinuehisorhertasks,andalsoensuresthattheprocessisoverseenbysomeonewhocandevotethenecessarytimeandattention.Theskills you look for in a coordinator will depend on your school climate improvement plan.Forexample,aplanthatisfocusedaroundintegratingtheteachingofsocialandemotionalskillsintoregularclassroominstructionmayrequireadifferentcoordinatorthanaplanthatbeginswithafocusonstudentsafetyinterventions.It’salsoimportantnottooverlooksocialandemotionalskilldevelopmentinadultswhendevelopingaplanandhiringacoordinator.
3) Educators, students, parents, and mental health professionals must work together.Substantiveschoolreformeffortsmustinvolveongoingandvitalpartnershipsbetweenmembersoftheschoolcommunity.Howcanyoupromoteparentaswellasstudentparticipation?Howcaneducatorsandmentalhealthprofessionalsworktogethertoanticipatebarrierstolearningandhealthydevelopment?
4) Adult Learning: How teachers and parents act is often more important than what they say.EffectiveK-12social,emotional,ethicalandacademiclearningnecessitatesthatadults be involved with social, emotional and ethical learning themselves.Howwillyoumakethisprocessmeaningfulforadultsinyourschoolcommunity?
V. Recommended Guidelines and Resources

schoolclimate.org | page 124
5) Promoting authentic learning communities. Thisisagoalforvirtuallyallschoolreformefforts.Alloftheseprocessrecommendationswillpromotelearningcommunities.Howcanyoumakethisanexplicitgoal?Whatarethespecificwaysthateducatorsrevealthattheyare“learners”?
6) Time frame: Substantive school improvement is, at a minimum, a three to five year process.Schoolimprovementeffortsthataredesignedto“bearfruit”withinayearortwotendtofail.Often,thereispressuretoincreasereadingandmathscoresthisyear.Howcanyourcommunitydevelopthreetofiveyearplansthathavethepotentialtoresultinsubstantiveschoolclimateimprovementandalso“staythecourse”?
7) Be sure your school climate improvement plan is well-designed and realistic.Itiseasytobeoverlyenthusiasticandattempttodotoomuchtoosoon.Itcanalsobetemptingtodevelopaplanquicklyandfinalizeitwithoutmuchseriousdiscussionaboutwhetheritwillbeeffective.Theplanmustbeintegratedintoschoollife,anditmustbesupportedbyeverymemberoftheschoolcommunity.Ifyouhavenotdevelopedtheseaspectsofyourplan,itislikelythatyoureffortswillnotbesuccessful.
8) Research and use evidence-based curricula to support change in your school.Naturally,itisimportantthattheprocessofschoolimprovementbuildoninstructionalandprogrammaticeffortsthatwork.Asyourschoolbeginstodefinegoals,whatevidence-basedcurriculummightbestservelearnersandteachers?
9) Continuous evaluation is an essential part of effective school improvement efforts.Howcanyourcommunitydevelopmethodsofevaluationaboutwhatisandisnotworking?Howcanevaluationbecomethebasisforauthenticlearningratherthananotheradministrativeburden?Whenyoudevelopactionplans,trytobuildinspecificmeasuresofyourcurrentstatusandsetbenchmarksforhowyou’dliketoseethosemeasuresimproveovertimesothatyoucanmonitoryourprogressasyougo.
10) Setting Goals: Focus on areas of strength and weakness.Schoolclimateimprovementefforts—naturally—tendtofocusonareasofrelativeneedorweakness.However,itisoftenbesttobegingoalsettingaroundareasofrelativestrength.When the school community focuses on change projects that yield results, it becomes significantly easier to address major areas of challenge in ways that result in systemic change. Thisstrategyof“small wins”canbeveryeffective.Changeisdifficult.Wesuggestthatyourinitialimplementationeffortsbuild on spheres of strength and/or represent areas where you—realistically—believe you will be able to make an impact in the first year. Whenschoolselecttoaddresstheirmostchallengingareasfirst,therecanbelittleornochangeinthefirstyearand,thiscanbedemoralizingtotheschoolcommunity.Ifyourschooldoesdecidetodothis,youshouldtakecaretosetuprealisticexpectations.
Onelastpointongoalsettingistostressthefundamentalimportanceoffeelingsafeinschools.To the extent that members of the school community do not feel safe in your school, we suggest that this become a focus for initial action.
Process Recommendations: How To Do It and Where to Start
V. Recommended Guidelines and Resources
124

schoolclimate.org | page 125
Onthepagesthatfollow,youwillfindachartforeachdimensionofschoolclimate.Ifyoursurveydatasuggestthatoneormoreschoolgroupsperceivechallengeswithagivendimension,thechartsaredesignedtohelpyoudevelopaplantomakeimprovements.Thedimensionsdooverlapwithoneanother,andyouwillseesimilaritiesinsomecharts,especiallyforclosely-relateddimensionssuchasphysicalandsocial-emotionalsafety.
The first columnmakessuggestionsaboutdigging deeperintotheproblem.Youcan’tdesignaneffectiveplanuntilyouunderstandmoreabouttheproblemandthenegativeperceptions—wheretheyare,whattheyconsistof,andhowtheyrelatetootherperceptions.
The second columnidentifiessomeoftheunderlyingfactorsthatcanleadtolowscoresineachofthethreeschoolpopulations.Thisisnotintendedasareplacementforyourownresearch,butasastartingpointtohelpyouthinkaboutpotentialareasonwhichtofocus.Yourinterventionsmustbebasedonyourowninvestigations.
The third columnincludessomespecific stepsyoucantaketoaddressproblemswiththisdimension,aswellasprogramsorpoliciesthathavebeensuccessfulinotherschools.AdditionalprogrammaticideasandawidevarietyofresourcesareavailableatyourschoolportalandonNSCC’swebsite(www.schoolclimate.org),includingbooks,articles,organizations,andprofessionaldevelopmentofferings.
Bothhereandonthewebwe’veidentifiedapproachesandprogramsthathavebeensuccessfulinthepast,butweencourageyoutoconduct your own evaluationsanddeterminewhichprogramswillbemosteffectiveinyourschool.Alsoconsiderwhere your efforts will have the greatest impact—someearlysuccesseswillhelpbuildgreatersupportforlong-termchange.
• PhysicalSafety
• Social-EmotionalSafety
• SupportforLearning
• Social&CivicLearning
• RespectforDiversity
• SocialSupport—Adults&Students
• SchoolConnectedness/Engagement
• PhysicalSurroundings
• LeadershipandProfessionalRelationships
• SocialMedia
What can I do about problem areas in my school?
VI. Action Charts

schoolclimate.org | page 126
Physical Safety: When Physical Safety is perceived as a problem in your school, here are some steps you can take:
School Group
Developing a Deeper Understanding of the Problem Identifying Some Common Sources of the Problem
Approaches/Programs that Schools and Research Have Found to Be Successful
Students Look at the two scales—Rules & Norms for Safety and Sense of Physical Security.Arethereissueswithschoolpolicy(Rules&Norms)orwithpeoples’experienceofsafety(SenseofPhysicalSecurity)orboth?
How do student responses to these dimensions compare to other information about safetythatyoucollectinyourschool,suchasIncidentReportsorstudentcomplaints?
Are there sub-groups of students who feel particularly unsafe? • LookatSectionIIICtoseeiftherearedifferencesbygender,
gradeorrace/ethnicity.
Are there particular aspects of safety that students perceive to be a problem?• LookatSectionVfordetailsonhowstudentsrespondedtoeach
itemthatmakesupthescalesforSafety—Rules&NormsandSenseofPhysicalSecurity.
Can you dig deeper through focus groups, follow-up surveys, or more informal forums for conversations with specific groups about particular issues?• Forexample,iftheyoungeststudentsintheschoolarefeelingpar-
ticularlythreatened,canyoufindoutmoreabouthowandwhy,viaadditionalresearchand/orbydiscussionswithschoolcounsel-orsand/orteachers?
Rules, Systems and Norms:• Notclearlydefined• Notfairlyorstronglyenforced;
difficulttoenforce• Notwell-alignedwith
consequences• Notinformedbytheexperiences
ofstudentsandschoolpersonnel
Supervision:• Insufficientadultpresence• Adultsinsufficientlytrainedincri-
sismanagementand/orinsocially&emotionallyinformeddiscipline
Review your student code of conduct. Make sure that it is developmentally appro-priate and aligns with your school’s core values. Involve staff in the process and students as appropriate by age.
Map problems by area and time. Have students and staff mark school diagrams indicating where they experience or witness problem behaviors and when. If pos-sible, institute a computerized program that will track physical incidents in school.Thiswillallowyoutousecurrentdatatoidentifyproblemlocationsinthebuilding(moresupervisioncanbeprovided)aswellasanalyzedatabytypeofinfraction,date,frequency,andconsequencesimposed.
Make it easy and safe to report safety concerns. Alladultsshouldbepreparedtoreceivereports(writtenororal)fromstudentsinasensitivemannerandtoconveythemtotheappropriateperson.Itmayalsohelptoprovideboxeswherestudentscanreportproblemsanonymously.Trytoprovideeachstudentwithanadultinwhomtheycanconfide.
Be sure your school has a crisis planandthatstudents,schoolpersonnel,andpar-entsallfeelconfidentaboutwhattodo.Considerspeakingtoyourlocalpoliceorfiredepartmentifyouneedguidanceindevelopinganeffectiveplan.
Increase visibility and availability of adults in unstructured or “problem” areas oftheschool.Thiswillhelpstudentsfeelsaferandleadtomorestudent-adultconversa-tions,increasingtheprobabilitythatadultswillhearaboutstudentconcerns.
Educate all or key school personnel—including School Safety Agents—in how to deal effectively with children in crisis.Manyoftheseprogramsprovideexcellenttrain-ingfordevelopingsocial-emotionalskillsandethicaldispositionsinschoolpersonnel,aswellasawarenessofthewaysinwhichconflictscanescalateunnecessarilyandhowtodefusethem.
Address the issue of bullying.Establishandcommunicatetheschool’santi-bullyingcommitment.Createacommonlanguageandestablishpoliciesandproceduresforaddressingbullyingincidentswhenandwheretheyoccur.
Continued on next page
Physical Safety
VI. Action Charts

schoolclimate.org | page 127
Physical Safety: When Physical Safety is perceived as a problem in your school, here are some steps you can take:
School Group Developing a Deeper Understanding of the Problem Identifying Some Common Sources of the Problem
Approaches/Programs that Schools and Research Have Found to Be Successful
School Personnel
How do school personnel responses to this dimension comparetootherinformationrelatedtothewayschoolpersonnelperceivestudentsafety?Theirownsafety?
Are there sub-groups of school personnel who perceive the school to be particularly unsafe?• LookatSectionIIICtoseeiftherearedifferencesbygrade,
roleorexperience.• Howdoesthiscomparetootherinformation&teacherreports?• Howdoesthiscomparetostudentpatternsbygrade?
Are there particular aspects of safety that school personnel per-ceive to be a problem?• LookatSectionVfordetails.
Can you dig deeperthroughstaffmeetingsormoreformalmeanssuchasfollow-upsurveysorfocusgroups?
Individual Competencies:• Students’lackofdevelopmentin
social&emotionalskills,suchasself-regulation,communication,andconflictresolution
• Roomforadultstoimprovecapac-ityforself-reflectionandabilitytomodelpositivebehaviors
Peer/School Culture:• Unhealthynormsforbehavior
amongstudentsand/orschoolpersonnel
• Insufficientmodelingofsupportivebehavior,includingup-standernorms
• Lowlevelsofgroupsupport&trust
School-wide efforts to teachcopingwithstress,problem-solving,communication,conflictresolution,andotherimportantsocial-emotionalskills.
Coordinate health-promotion and risk-prevention efforts.Trainschoolpersonneltorec-ognizestudentbehaviorthatmayindicateproblems.Providetargetedservicestostudentswhoneedthem.Thisrequirescollaborationwithmentalhealthprofessionals.
Promote students’ development of civic skills and behaviors in academic classes. Ratherthanrelyingprimarilyonexternalcontrolsandcompliance,providestudentswithopportunitiestointernalizevaluesandlearnandpracticestrategiesthatpromoteindividualandgroupresponsibility.
Find evidence-based programs that will be effective in your school.Lookforprogramsthathavebeenstudiedandshowntobesuccessful.It’shelpfulifthedevelopersareavail-abletosupportyouandanswerquestions,andbesureyouunderstandtheprogram’sgoals,targetpopulation,expectedoutcomes,andessentialelementsofeffectiveimplementation.Spendsometimefindingaprogramyouhavefaithin—theextraeffortwillpayoff.Hereareafewexcellentsitesthatprovideinformationonprogramsrelatedtosafetythathavebeenrigorouslytestedforeffectiveness:
Blueprints for Violence Preventionhttp://www.colorado.edu/cspv/blueprints/index.html
SAMHSA Model Programshttp://nrepp.samhsa.gov/index.asp
Promising Practices Network—Programs That Workhttp://www.promisingpractices.net/programs.asp
NSCC can help—SeetheResourcesectionofyourSchoolPortal.AlsovisitNSCC’sweb-site(www.schoolclimate.org)foragrowingbodyofprofessionaldevelopmentandtraininginareasrelatedtophysicalsafety,including“BreakingtheBully-Victim-BystanderCycle”and“ConflictResolution”.
Parents How do parent responses to this dimension comparetopriorparentfeedbackaboutsafety?
Are parent respondents representative of your school body as a whole?Ifnot,canyoureachoutmoretounder-representedgroups?
Are there sub-groups of parents who feel that their children may be unsafe in and around school?• LookatSectionIIICtoseeiftherearedifferencesbygrade,
genderorrace/ethnicity.• Howdoesthiscomparetootherinformationfromparents,
suchascallsandcomments?• Howdoesthiscomparetothestudentpatternsbygrade,gen-
derorrace/ethnicity?
Are there particular aspects of safety that parents perceive to be a problem?• LookatSectionVfordetails.
Physical Safety
VI. Action Charts

schoolclimate.org | page 128
Social-Emotional Safety: When Social-Emotional Safety is perceived as a problem in your school, here are some steps you can take:
School Group
Developing a Deeper Understanding of the Problem Identifying Some Common Sources of the Problem
Approaches/Programs that Schools and Research Have Found to Be Successful
Students Are there issues with school policy (Rules & Norms) or with the experience of safety (Sense of Social-Emotional Security), or both?
How do student responses to these dimensions comparetootherindicatorsofsocial-emotionalsafetyinyourschool?Howdoesthisrelatetotheexperienceofphysicalsafety?
Are there sub-groups of students who feel particularly vulnerable to social-emotional threats? LookatSectionIIICtoseeiftherearedifferencesbygender,gradeorrace/ethnicity.• Howdoesthiscomparetoreportsfromguidancecounselor/teach-
ers,parentconcerns?• Arepatternssimilartophysicalsafety,ordodifferentgroupsfeel
moreat-riskfromonevs.theother?
Are there particular aspects of social-emotional safety that stu-dents perceive to be a problem?• LookatSectionVfordetailsonhowstudentsrespondedtoeach
itemthatmakesuptheSenseofSocial-EmotionalSecurityscaleaswellasthescaleforSafety—Rules&Norms.
• HowdoesthisrelatetoRespectforDiversity?
Can you dig deeperthroughfocusgroups,follow-upsurveys,ormoreinformal,butstructuredconversationswithspecificgroupsaboutparticularissues?• Forexample,ifnamecallingisaparticularproblem,canyoufind
outmoreaboutwhenthisoccurs?Arethereissuesrelatedtoonlinemedia?
• Canyouprobemoretoidentifywhetherthreateningbehavioristiedtocertaingroups,orwhetherthreateningbehavioristiedtointoleranceforcertaingroups?
Note:physicalandsocial-emotionalsafe-tyarecloselylinked.Therefore,youwillseesimilaritiesinthe“commonsources”and“successfulapproaches”columnsforthesetwodimensions.
Rules, Systems & Norms (especiallythoserelatedtosocialbullying,teasing,andrespectfulbehavior):• Notclearlydefined• Notfairlyenforced• Notstronglyenforced• Notwellalignedwithconsequences
Supervision:• Insufficientadultpresence• Adultsinsufficientlytrainedinsocially
&emotionallyinformeddiscipline• Moredifficulttomonitorvs.infrac-
tionsforphysicalsafety• Adultsdon’trealizetheseproblems
requireintervention
Review your student code of conduct with an eye toward social-emotional safety as well as physical safety. Howwelldoesitsupportsocial-emotionaleducationandsharedvaluesandcommunicatethiscommitment?Involvestaffintheprocessandstudentsasappropriatebyage.
Map problem areas and times for social safety in line with the process outlined ear-lier for physical safety.
Make it easy and safe to report problems.Alladultsshouldbepreparedtoreceivereports(writtenororal)fromstudentsinasensitivemannerandconveythemtotheappropriateperson.Itmayalsohelptoprovidewaysforstudentstoreportanony-mously.
Increase visibility and availability of adults in unstructured or “problem” areas of the school. Thiswillhelpstudentsfeelsaferandalsoleadtomorestudent-adultcon-versations,increasingtheprobabilitythatadultswillhearaboutstudentconcernsandunderstandwhereproblemsarecomingfrom.
Educate school personnel in dealing effectively with children in trauma and in strategies to help prevent problems from escalating into school-wide crises.
Address the issue of bullying.Establishandcommunicatetheschool’santi-bullyingcommitment.Createacommonlanguageandestablishpoliciesandproceduresforaddressingbullyingincidentswhenandwheretheyoccur.
Fosterrespectfordiversitythroughprogramsthatteachtoleranceandappreciationfordifferences.
Continued on next page
Social-Emotional Safety
VI. Action Charts

schoolclimate.org | page 129
Social-Emotional Safety: When Social-Emotional Safety is perceived as a problem in your school, here are some steps you can take:
School Group Developing a Deeper Understanding of the Problem Identifying Some Common Sources of the Problem
Approaches/Programs that Schools and Research Have Found to Be Successful
School Personnel
How do school personnel responses to this dimension com-paretootherinformationaboutsocial-emotionalsafetyasitisperceivedbyand/oraffectsteachers?
Are there sub-groups of school personnel who perceive the problem to be particularly serious?• LookatSectionIIICtoseeiftherearedifferencesbygrade,
roleorexperience.• HowdoesthisrelatetoRespectforDiversity?
Are there particular aspects of social-emotional safety that school personnel perceive to be a problem?• LookatSectionVfordetails.• Areproblemscenteredoncertainkindsofbehaviors?
Can you dig deeperinstaffmeetingsorthroughmoreformalmeanssuchasfollow-upsurveysorfocusgroups?
Individual Competencies:• Students’under-developedsocial
&emotionalknowldegeskills,anddispositions(self-awareness,self-regulation,flexibleproblemsolv-ing,responsibility,andcooperativecapacities)
• Needforadultstoenhancetheirownsocial-emotionalcapacitiesandtheirabilitytopromoteandmodelthesebehaviors
Peer/School Culture:• Unhealthynormsforbehavior(social
bullyingandotherproblemsarecommon)
• Inconsistentmodelingofsupport-ivebehavior,includingup-standernorms
• Lowlevelsofgroupsupport&trust• Aculturethatisinsufficientlytoler-
antofdifferences.Oftensocialbully-ingisassociatedwithlackofrespectforothersbasedoncharacteristicssuchasgender,race/ethnicityorsexualorientation.
Initiate or reinforce school-wide efforts to integrate direct instruction and practice of social-emotional skills,includingrecognizingandregulatingemotions,problem-solving,effectivecommunication,andconflictresolution.
Coordinate health-promotion and risk-prevention efforts.Educateschoolpersonneltorecognizestudentbehaviorthatmayindicateproblems.Providetargetedservicestostu-dentswhoneedthem.Thisrequirescollaborationwithmentalhealthprofessionals.
Promote students’ development of civic skills and behaviors in academic classes. Ratherthanrelyingprimarilyonexternalcontrolsandcompliance,providestudentswithopportunitiestointernalizevaluesandlearnandpracticestrategiesthatpromoteindi-vidualandgroupresponsibility.Find evidence-based programs that will be effective in your school.Lookforprogramsthathavebeenstudiedandshowntobesuccessful.It’shelpfulifthedevelopersareavail-abletosupportyouandanswerquestions.Besureyouunderstandtheprogram’sgoals,targetpopulation,expectedoutcomes,andessentialelementsofeffectiveimplementation.Spendsometimefindingaprogramyouhavefaithin—theextraeffortwillpayoff.Belowaresitesthatprovidesinformationonprogramsrelatedtosocialandemotionalsafetythathavebeenrigorouslytestedforeffectivenessinaddressingawiderangeofissues:
Promising Practices Network—Programs That Workhttp://www.promisingpractices.net/programs.asp
Blueprints for Violence Preventionhttp://www.colorado.edu/cspv/blueprints/index.html
CASEL - Meta-analysis of SEL Programshttp://www.casel.org/sel/meta.php
SAMHSA Model Programshttp://nrepp.samhsa.gov/index.asp
NSCC can help—SeetheResourcesectionofyourSchoolPortal.AlsovisitNSCC’sweb-site(www.schoolclimate.org)foragrowingbodyofprofessionaldevelopmentandtraininginareasrelatedtosocial-emotionalsafety,including‘BreakingtheBully-Victim-BystanderCycle”,“ConflictResolution”and“InfusingSELintotheCurriculum”.
Parents How does this comparetopriorfeedbackfromparentsingen-eralaboutsocial-emotionalsafety?
Are there sub-groups of parents who feel that their children may be unsafe in and around school?• LookatSectionIIICtoseeiftherearedifferencesbygrade,
genderorrace/ethnicity.• Howdoesthiscomparetootherinformationfromparents,
suchascallsandcomments?• Howdoesthiscomparetothestudentpatternsbygrade,gen-
derorrace/ethnicity?• Howdoesthiscomparetopatternsforphysicalsafety?
Are there particular aspects of social-emotional safety that parents perceive to be a problem?• LookatSectionVfordetails.
Can you dig deeperthroughparentoutreach?
Social-Emotional Safety
VI. Action Charts
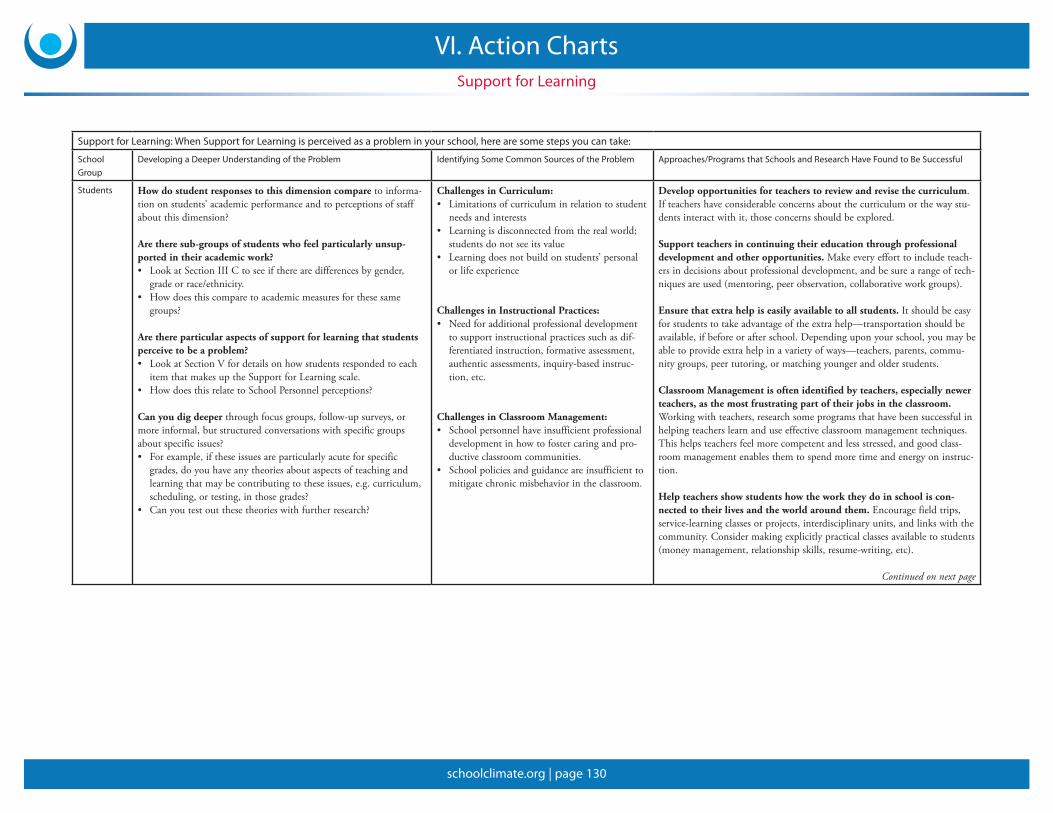
schoolclimate.org | page 130
Support for Learning: When Support for Learning is perceived as a problem in your school, here are some steps you can take:
School Group
Developing a Deeper Understanding of the Problem Identifying Some Common Sources of the Problem Approaches/Programs that Schools and Research Have Found to Be Successful
Students How do student responses to this dimension comparetoinforma-tiononstudents’academicperformanceandtoperceptionsofstaffaboutthisdimension?
Are there sub-groups of students who feel particularly unsup-ported in their academic work?• LookatSectionIIICtoseeiftherearedifferencesbygender,
gradeorrace/ethnicity.• Howdoesthiscomparetoacademicmeasuresforthesesame
groups?
Are there particular aspects of support for learning that students perceive to be a problem?• LookatSectionVfordetailsonhowstudentsrespondedtoeach
itemthatmakesuptheSupportforLearningscale.• HowdoesthisrelatetoSchoolPersonnelperceptions?
Can you dig deeperthroughfocusgroups,follow-upsurveys,ormoreinformal,butstructuredconversationswithspecificgroupsaboutspecificissues?• Forexample,iftheseissuesareparticularlyacuteforspecific
grades,doyouhaveanytheoriesaboutaspectsofteachingandlearningthatmaybecontributingtotheseissues,e.g.curriculum,scheduling,ortesting,inthosegrades?
• Canyoutestoutthesetheorieswithfurtherresearch?
Challenges in Curriculum:• Limitationsofcurriculuminrelationtostudent
needsandinterests• Learningisdisconnectedfromtherealworld;
studentsdonotseeitsvalue• Learningdoesnotbuildonstudents’personal
orlifeexperience
Challenges in Instructional Practices:• Needforadditionalprofessionaldevelopment
tosupportinstructionalpracticessuchasdif-ferentiatedinstruction,formativeassessment,authenticassessments,inquiry-basedinstruc-tion,etc.
Challenges in Classroom Management:• Schoolpersonnelhaveinsufficientprofessional
developmentinhowtofostercaringandpro-ductiveclassroomcommunities.
• Schoolpoliciesandguidanceareinsufficienttomitigatechronicmisbehaviorintheclassroom.
Develop opportunities for teachers to review and revise the curriculum.Ifteachershaveconsiderableconcernsaboutthecurriculumorthewaystu-dentsinteractwithit,thoseconcernsshouldbeexplored.
Support teachers in continuing their education through professional development and other opportunities.Makeeveryefforttoincludeteach-ersindecisionsaboutprofessionaldevelopment,andbesurearangeoftech-niquesareused(mentoring,peerobservation,collaborativeworkgroups).
Ensure that extra help is easily available to all students. Itshouldbeeasyforstudentstotakeadvantageoftheextrahelp—transportationshouldbeavailable,ifbeforeorafterschool.Dependinguponyourschool,youmaybeabletoprovideextrahelpinavarietyofways—teachers,parents,commu-nitygroups,peertutoring,ormatchingyoungerandolderstudents.
Classroom Management is often identified by teachers, especially newer teachers, as the most frustrating part of their jobs in the classroom.Workingwithteachers,researchsomeprogramsthathavebeensuccessfulinhelpingteacherslearnanduseeffectiveclassroommanagementtechniques.Thishelpsteachersfeelmorecompetentandlessstressed,andgoodclass-roommanagementenablesthemtospendmoretimeandenergyoninstruc-tion.
Help teachers show students how the work they do in school is con-nected to their lives and the world around them. Encouragefieldtrips,service-learningclassesorprojects,interdisciplinaryunits,andlinkswiththecommunity.Considermakingexplicitlypracticalclassesavailabletostudents(moneymanagement,relationshipskills,resume-writing,etc).
Continued on next page
Support for Learning
VI. Action Charts

schoolclimate.org | page 131
Support for Learning: When Support for Learning is perceived as a problem in your school, here are some steps you can take:
School Group Developing a Deeper Understanding of the Problem Identifying Some Common Sources of the Problem
Approaches/Programs that Schools and Research Have Found to Be Successful
School Personnel
How do the school personnel responses to this dimension com-paretootherinformationaboutteachers’feelingsofsuccessintheclassroom?
Are there sub-groups of school personnel who rate this dimen-sion less positively than others?• LookatSectionIIICtoseeiftherearedifferencesbygrade,
roleorexperience.
Are there particular aspects of quality of instruction that school personnel rate poorly?• LookatSectionVfordetails.• Areproblemsalignedwithstudentperceptions?
Can you dig deeperthroughstaffmeetingsormoreformalmeanssuchasfollow-upsurveysorfocusgroups?
Structural Barriers/Resource Constraints:• Problematicstudent/teacherratios• Pacingofcurriculum• Schedulingconstraints• Lengthofschoolday/schoolyear• Testingpressure
Behavioral/Attitudinal Barriers:• Behavioralpatternsandattitudesthat
impedeabilityofstudentstoconstructivelyaskfororreceivehelp
• Behavioralpatternsorattitudesthatimpedeabilityofteacherstoconstructivelygivehelptoallstudents
Consider how adult attitudes related to learning impact the school experience for students. Beclearabouttheschoolenvironmentyou’dliketosee.Taketimetodefineyourgoalsasspecificallyaspossible,andthinkaboutwhatkindofexpe-rienceandqualitiesstaffwouldneedtohavetorealizethisvision.Forexample,doschoolpersonnelmakeitclearthatrisk-takingandmistakesarepartofthelearningprocess?Dotheysupportindependentstudentinquiry?Bespecificaboutthisinrecruitingpotentialnewstaffmembers,aswellaswithcurrentstaff.
All schools deal with structural barriers, including budget, physical space, and state or federal education/testing requirements. Oftenaschoolleaderhasminimalpowertochangethosecircumstances.Evaluateyourownstructuralbarriersandhowtheyinfluenceyourschoolcommunity.Thismightincludestu-dent/teacherratios,classroomspace,requiredcurriculum,mandatedtesting,andprofessionalcontracts.Considerhowstudents,parents,andschoolpersonnelareaffectedbytheseaspectsofschoollife.Thinkaboutwhatlatitudeyoumayhavetochangesomeofthesefactorsand/orwhatactionyoucantaketomitigatetheirimpactwithinexistingconstraints.
There is a wide array of resources for the development of supportive envi-ronments for learning.Belowarejustafewwebsitesthatcanconnectyoutorelevantresearchandhelpidentifyevidence-basedprogramstoaddressarangeofissuesrelatedtosupportforlearning.
ERIC - Education Resources Information Centerhttp://www.eric.ed.gov
Center for Comprehensive School Reform & Improvement—Database http://www.centerforcsri.org/research/improvement.cgi
What Works Clearinghouse—Institute of Education Scienceshttp://ies.ed.gov/ncee/wwc/
Promising Practices Network—Programs That Workhttp://www.promisingpractices.net/programs.asp
NSCC can help—SeetheResourcesectionofyourSchoolPortal.AlsovisitNSCC’swebsite(www.schoolclimate.org)foragrowingbodyofprofessionaldevelopmentandtraininginareasrelatedtoinstructionalsupport,including“EffectiveClassroomManagement”.
Parents How do the parent responses to this dimension comparetoongoingfeedbackfromparentsaboutteachingandinstruction?
Are there sub-groups of parents who feel that their children are less well-supported academically?• LookatSectionIIICtoseeiftherearedifferencesbygrade,
genderorrace/ethnicity.• Howdoesthiscomparetootherinformationfromparents,
suchascallsandcomments?• Howdoesthiscomparetothestudentpatternsbygrade,gen-
derorrace/ethnicity?
Are there particular aspects of quality of instruction that par-ents perceive to be a problem?• LookatSectionVfordetails.
Can you dig deeperthroughparentoutreach?Mightthisbeasubjectforfurtherdiscussionand/orresearchonCurriculumorTeacher-ConferenceNights?
Support for Learning
VI. Action Charts

schoolclimate.org | page 132
Social and Civic Learning: When Social and Civic Learning is perceived as a problem in your school, here are some steps you can take:
School Group
Developing a Deeper Understanding of the Problem Identifying Some Common Sources of the Problem
Approaches/Programs that Schools and Research Have Found to Be Successful
Students How do student responses to this dimension comparetootherinformationaboutwhetherstudentsarelearningusefulsocialandcivicskillsinschool?Howdoesitcomparetostaffperceptions?
Do social-emotional and civic education appear to be lacking for all students,orforparticularsub-groupsofstudents?Conversely,doesitappeartobeparticularlystrongforcertaingroupsofstudents?• LookatSectionIIICtoseeiftherearedifferences,particularlyby
grade.
Are there particular aspects of social-emotional & civic education that are missing?• LookatSectionVfordetailsonhowstudentsrespondedtoeach
itemthatmakesuptheSocial&CivicLearningscale• Howdoesthisrelatetoperceptionsofschoolpersonnel?
Can you dig deeperthroughfocusgroups,follow-upsurveys,ormoreinformal,butstructuredconversationswithspecificgroupsaboutspecificissues?
Structural:• Pressuresrelatedtotimeandtesting• Inadequatepersonneltosupportthese
efforts• Piecemealanddisjointedinterventions
thatarenotsufficentlyintegratedintobehavioralnormsfortheschool
Instructional:• Nodedicatedcurriculumcovering
social-emotionallearning,ethicaldispo-sitionsandciviccompetencies
• Noembeddedinstructiononthesesub-jectswithinacademiclessons
• Unevenimplementationwithinandacrossclassrooms
• Socialandcivicinstructionthatstaffthinkofasembeddedorimplicitmaynotbepickedupbystudents
Review what your school is already doingtoteachsocialandemotionalskillstostudentsandcivicdispositions,andconsiderhowitmaybestandardized,adaptedorexpandedinordertobemoreeffective.Remember,wearealwaysmodellingwaysofhandlingsocial,emotionalandethicalchallenges,whetherconsciously,helpfully,ornot.Social-emotionalandciviceducationcoversabroadarrayofimportantskillsthatcanbesuccessfullylearnedinavarietyofways.Schoolpro-gramscanencompassstand-aloneclasses,e.g.mediationorethicsandschool-wideservicelearningprojects.
Appoint a Social-Emotional/Civic Education Coordinator toberesponsiblefororganizingandimplementingtheseinitiatives,aswellassupportingschoolperson-nelintheirefforts.Also,develop a committee or task forcemadeupofadminis-tratorsandteachersfromallgradelevelstoreviewmaterialsandcurricula.Theycanberesponsibleforoverseeingtheimplementationofsocialandemotional,and/orcivicandcharactereducationintheschool.Researchsomesuccessfulprogramsandchooseonethatseemstobeagoodfitforyourschool.Therearemanyexcellentcurriculaavailablethatprovideguidelinesandlessonplansforteachingsocial-emo-tionalskillsandethicaldispositions.Determinewhatoutcomesyou’relookingforandfindawaytoevaluatethesuccessoftheprogramaftersometimehaspassed.
Observe your own behavior, and consider the ways in which you could become more socially and emotionally skilled and a more positive role model.Findopportunitiesforpersonalandcollegialreflection.
Work to educate students, parents and school personnel on the value of social and emotional skills, ethical dispositions and civic behaviors.Thereareanum-berofresearchstudiessupportingtheimportanceoftheseskillswhichmaybehelp-fultoyouinmakingyourcaseforchange.Reinforcethevalueoftheseskills.Askpeopletodescribeapersontheyadmire.Mostlikely,thequalitiestheynamewillbesocial,emotionalandethicalstrengths.
Institute a student peer mediation program. Thiscanhelpresolvestudentcon-flictswhilealsoteachingimportantskillsindealingwithdisagreements.
Continued on next page
Social and Civic Learning
VI. Action Charts
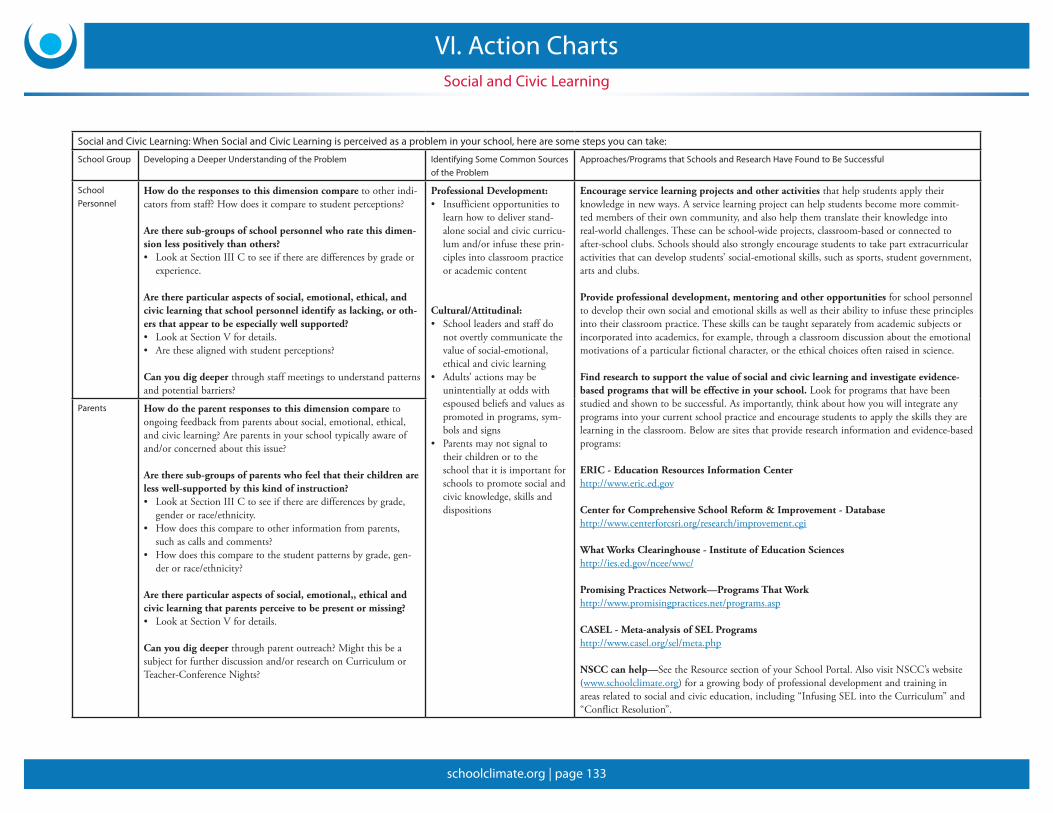
schoolclimate.org | page 133
Social and Civic Learning: When Social and Civic Learning is perceived as a problem in your school, here are some steps you can take:
School Group Developing a Deeper Understanding of the Problem Identifying Some Common Sources of the Problem
Approaches/Programs that Schools and Research Have Found to Be Successful
School Personnel
How do the responses to this dimension comparetootherindi-catorsfromstaff?Howdoesitcomparetostudentperceptions?
Are there sub-groups of school personnel who rate this dimen-sion less positively than others?• LookatSectionIIICtoseeiftherearedifferencesbygradeor
experience.
Are there particular aspects of social, emotional, ethical, and civic learning that school personnel identify as lacking, or oth-ers that appear to be especially well supported?• LookatSectionVfordetails.• Arethesealignedwithstudentperceptions?
Can you dig deeperthroughstaffmeetingstounderstandpatternsandpotentialbarriers?
Professional Development:• Insufficientopportunitiesto
learnhowtodeliverstand-alonesocialandciviccurricu-lumand/orinfusetheseprin-ciplesintoclassroompracticeoracademiccontent
Cultural/Attitudinal:• Schoolleadersandstaffdo
notovertlycommunicatethevalueofsocial-emotional,ethicalandciviclearning
• Adults’actionsmaybeunintentiallyatoddswithespousedbeliefsandvaluesaspromotedinprograms,sym-bolsandsigns
• Parentsmaynotsignaltotheirchildrenortotheschoolthatitisimportantforschoolstopromotesocialandcivicknowledge,skillsanddispositions
Encourage service learning projects and other activitiesthathelpstudentsapplytheirknowledgeinnewways.Aservicelearningprojectcanhelpstudentsbecomemorecommit-tedmembersoftheirowncommunity,andalsohelpthemtranslatetheirknowledgeintoreal-worldchallenges.Thesecanbeschool-wideprojects,classroom-basedorconnectedtoafter-schoolclubs.Schoolsshouldalsostronglyencouragestudentstotakepartextracurricularactivitiesthatcandevelopstudents’social-emotionalskills,suchassports,studentgovernment,artsandclubs.
Provide professional development, mentoring and other opportunitiesforschoolpersonneltodeveloptheirownsocialandemotionalskillsaswellastheirabilitytoinfusetheseprinciplesintotheirclassroompractice.Theseskillscanbetaughtseparatelyfromacademicsubjectsorincorporatedintoacademics,forexample,throughaclassroomdiscussionabouttheemotionalmotivationsofaparticularfictionalcharacter,ortheethicalchoicesoftenraisedinscience.
Find research to support the value of social and civic learning and investigate evidence-based programs that will be effective in your school.Lookforprogramsthathavebeenstudiedandshowntobesuccessful.Asimportantly,thinkabouthowyouwillintegrateanyprogramsintoyourcurrentschoolpracticeandencouragestudentstoapplytheskillstheyarelearningintheclassroom.Belowaresitesthatprovideresearchinformationandevidence-basedprograms:
ERIC - Education Resources Information Centerhttp://www.eric.ed.gov
Center for Comprehensive School Reform & Improvement - Database http://www.centerforcsri.org/research/improvement.cgi
What Works Clearinghouse - Institute of Education Scienceshttp://ies.ed.gov/ncee/wwc/
Promising Practices Network—Programs That Workhttp://www.promisingpractices.net/programs.asp
CASEL - Meta-analysis of SEL Programshttp://www.casel.org/sel/meta.php
NSCC can help—SeetheResourcesectionofyourSchoolPortal.AlsovisitNSCC’swebsite(www.schoolclimate.org)foragrowingbodyofprofessionaldevelopmentandtraininginareasrelatedtosocialandciviceducation,including“InfusingSELintotheCurriculum”and“ConflictResolution”.
Parents How do the parent responses to this dimension comparetoongoingfeedbackfromparentsaboutsocial,emotional,ethical,andciviclearning?Areparentsinyourschooltypicallyawareofand/orconcernedaboutthisissue?
Are there sub-groups of parents who feel that their children are less well-supported by this kind of instruction?• LookatSectionIIICtoseeiftherearedifferencesbygrade,
genderorrace/ethnicity.• Howdoesthiscomparetootherinformationfromparents,
suchascallsandcomments?• Howdoesthiscomparetothestudentpatternsbygrade,gen-
derorrace/ethnicity?
Are there particular aspects of social, emotional,, ethical and civic learning that parents perceive to be present or missing?• LookatSectionVfordetails.
Can you dig deeperthroughparentoutreach?Mightthisbeasubjectforfurtherdiscussionand/orresearchonCurriculumorTeacher-ConferenceNights?
Social and Civic Learning
VI. Action Charts

schoolclimate.org | page 134
Respect for Diversity: When Respect for Diversity is perceived as a problem in your school, here are some steps you can take:
School Group
Developing a Deeper Understanding of the Problem Identifying Some Common Sources of the Problem
Approaches/Programs that Schools and Research Have Found to Be Successful
Students How do the student responses to this dimension comparetootherinformationaboutrespectfordiversitythatyoumaymonitorinyourschool?Howdoesthisrelatetoissuesofsafety?
Are there sub-groups of students who feel particularly sensi-tive about the level of tolerance and support for diversity in the school?• LookatSectionIIICtoseeiftherearedifferencesbygender,
gradeorrace/ethnicity.• Howdoesthiscomparetoreportsfromguidancecounselors,
teachersandparents?• Arepatternssimilartothoseforsafety?
Are there particular aspects of respect for diversity that are per-ceived to be a problem?• LookatSectionVfordetailsonhowstudentsrespondedtoeach
itemthatcontributetoRespectforDiversity.• Isthereanysuggestionthatproblemsrelatemoretopeerinterac-
tionamongstudentsoradult/adultoradult/studentrelations?
Can you dig deeperthroughfocusgroups,follow-upsurveys,ormoreinformal,butstructuredconversationswithspecificgroupsaboutspecificissues?• Canyouprobemoretoidentifywhethertherearespecificissues
relatedtodiversitythatareespeciallyproblematic?Gender?Race/ethnicity?Forolderstudents,sexualorientation?
Peer/School Culture:• Insufficientexposuretodiversity• Weakorineffectivenormsfor
mutualrespectandtolerance• Schoolculturethatsonarrowly
definessuccessthatitinhibitstheappreciationofdiversityandthepotentialcontributionofallcom-munitymembers
• Insufficientmodelingofsupport-iveattitudesandbehavior
• Lowlevelsoftrustfordiscussionofdifferences
• Diversityissuesnotregardedasaproblem
• Overtsignsofrespectfordiver-sity(posters,missionstatements)atoddswithschoolexperience
Develop a school-wide vision for Respect for Diversity. WhatdoesRespectforDiversitymeantomembersoftheschoolcommunityandhowwouldtheyliketoseeitembodiedinschoollife?
You can help develop this shared vision by facilitating discussions with students and staff about what Respect for Diversity means to them.Whattypesofdiversitydotheywanttopromote?Whatarethecurrentchallenges?
Provide structured opportunities (e.g. Challenge Day, School Retreats, Service Learning) for students and staff to develop an awareness of personal and group biasesthatinhibitcommunitybuildingandtodevelopanappreciationofcommongroundandinterconnectedness.
Bring in community groups that deal with issues of discrimination and rights related to race, gender, sexual orientation, and other differences.Identifylocalgroupswhohelpsupporttheseeffortsinschools.Therearealsosomewell-respectednationalorganiza-tionswhichmayhavelocalchaptersinyourareaorcanhelpconnectyoutolocalorga-nizationsthataddresssimilarissues.Considercontacting:theAnti-DefamationLeague,NationalOrganizationforWomen,theNAACP,theGayandLesbianAssociationAgainstDefamation,theCongressonRacialEquality,andothers.
Make it easy and safe for both students and school personnel to report incidents of mistreatment that target specific groups.
Provide easy and safe opportunities for community members to offer suggestions for promoting increased respect for diversity in the school.
Provide training in mediation or conflict resolutiontohelpheadoffpotentialincidents.
Continued on next page
Respect for Diversity
VI. Action Charts

schoolclimate.org | page 135
Respect for Diversity: When Respect for Diversity is perceived as a problem in your school, here are some steps you can take:
School Group
Developing a Deeper Understanding of the Problem Identifying Some Common Sources of the Problem
Approaches/Programs that Schools and Research Have Found to Be Successful
School Personnel
How do the school personnel responses to this dimension comparetootherinforma-tionaboutrespectfordiversityasitisperceivedbyand/oraffectsteachers?
Are there sub-groups of school personnel who perceive the problem to be particu-larly severe?• LookatSectionIIICtoseeiftherearedifferencesbygrade,roleorexperience.• Howdoesthisrelatetoperceptionsofsafety?
Are there particular aspects of respect for diversity that school personnel perceive to be a problem?• LookatSectionVfordetails.• Areproblemscenteredonspecificrelationships—students,adults,adult-student
interactions?
Can you dig deeperinstaffmeetingsorthroughmoreformalmeanssuchasfollow-upsurveysorfocusgroups?
Individual Attitudes/Dispositions:• Students’needfordevelop-
mentinsocial&emotionalskillsandethicaldispositionssuchasempathy&fairness
• Roomforadultstoimproveself-reflectivecapacityandabil-itytomodelpositivebehaviors
Professional Development:• Schoolstaffmayneedaddi-
tionallearningopportunitiestofeelcomfortableinterveninginthesesituations
• Schoolstaffmayneedtodevel-opgreaterawarenessofhowlackofrespectmaybenega-tivelyaffectingtheirstudents
Use any incidents as learning opportunities.Ratherthancondemningtheperpetrators,attempttocreateanopendialogueaboutthesourceoftheproblemanddifferentperspectivesontheincident.Harshlycon-demningthebehaviorwithoutmediationcansquelchdialogueandgivestudentstheideathattheseissuesshouldnotbediscussed.
Provide training to school personnel on diversity-related issues. (Alsoattendthesetrainingsyourself—thissetsapositivetonefortheschool.)Besureschoolpersonnelunderstandhowproblemscanaffectfeelingsofsafetyintheschoolaswellasthestudents’abilitytolearn.Encourageteacherstoraisetheseissuesintheirclassrooms.
Provide learning opportunities for students to become more com-fortable with all groups within your school community. Rememberthatadultsmusttaketheleadonthisissue—studentswillbepayingattentiontotheadultattitudesandtheexamplethatisset.Well-designedinterventionscanmakeadifferenceinyourschool,aswellasauthenticcelebrationsofholidaysorotheroccasionsdesignedtohonorindividualgroupsofpeople.
Encourage any interested students to form a club focused on bias awareness and respect for diversity. Letthemtaketheleadontheirchosenactivities.Studentsmightalsotakeonthetaskofresearchingaschoolclimateproblemontheirown—choosingthetopic,gatheringinformationandproposingsolutions.
Following are just some of the organizations that focus on this work:Anti-DefamationLeague—http://www.adl.orgTeachingTolerance—http://www.teachingtolerance.orgFacingHistoryandOurselves—http://www.facinghistory.org/
NSCC can help—SeetheResourcesectionofyourSchoolPortal.AlsovisitNSCC’swebsite(www.schoolclimate.org)foragrowingbodyofprofessionaldevelopmentandtraininginareasrelatedtoinstructionalsupport,including“DiversityTraining”and“ConflictResolution”.
Parents How do the parent responses to this dimension comparetopriorfeedbackfrompar-entsingeneralaboutrespectfordiversity?Howdoesthisrelatetoparents’perceptionsaboutSchoolCommunity&Collaboration?
Are the views of all parents represented in the data(seeResponseRatesatthebegin-ningofthereport)?
Are there sub-groups of parents who perceive this to be a particularly severe prob-lem?• LookatSectionIIICtoseeiftherearedifferencesbygrade,genderorrace/ethnicity.• Howdoesthiscomparetootherinformationfromparents,suchascallsand
comments?• Howdoesthiscomparetothestudentpatternsbygrade,genderorrace/ethnicity?• Howdoesthiscomparetopatternsforsafety?
Are there particular aspects of respect for diversity that parents perceive to be a prob-lem?• LookatSectionVfordetails.• Areproblemscenteredonspecificrelationships—students,adults,adult-student
interactions?
Can you dig deeperthroughparentoutreach?
Respect for Diversity
VI. Action Charts

schoolclimate.org | page 136
Social Support: When Social Support from adults or students is perceived as a problem in your school, here are some steps you can take:
School Group
Developing a Deeper Understanding of the Problem Identifying Some Common Sources of the Problem Approaches/Programs that Schools and Research Have Found to Be Successful
Students Howdoesthiscomparetootherinformation,ingeneral,aboutthequalityofrelationshipsandsocialsupportinyourschool?
Are there sub-groups of students who do not feel that they have sustaining friendships with peers or the social support of the adults in the school?• LookatSectionIIICtoseeiftherearedifferencesbygender,
gradeorrace/ethnicity.• Howdoesthiscomparetoreportsfromguidancecounselors/
teachers,parentconcerns?• Arepatternssimilartothoseformorale?Aretheyrelatedtorespect
fordiversity?
Are there particular aspects of Social Support that are stronger than ohters?• LookatSectionVfordetailsonhowstudentsrespondedtoeach
itemthatcontributetothesetwoscales—SocialSupport—AdultsandSocialSupport—Students
Can you dig deeper through focus groups, follow-up surveys, or more informal, but structured conversations with specific groups about specific issues?• Canyouprobemoretoidentifywhethertherearespecificgroups
thatmayfeelespeciallydisaffected?
School Culture and Norms:• Schoolenvironmentinsufficientlysupportiveor
inclusive• Impedimentstoschoolpersonneldeveloping
strongrelationshipswithoneanother• Impedimentstoschoolpersonnelbuilding
strongrelationshipsorconnectingwithstudentsindividually;couldberelatedtoschedulingand/ortoclasssize
• Studentshaveinsufficientopportunitytointeractwithawideanddiversegroupofpeersbecauseofstructure,schedulingorsocialnorms.
Encourage supportive relationships between school personnel and stu-dents by instituting an advisory period and/or class meetings, duringwhichstudentswouldmeetinsmallgroupswithanadult.Thishasbeenshowntoimprovethequalityofindividualrelationshipsbetweenadultsandstudents,whichhasasalutaryeffectonstudents’healthandtheirsuc-cessinschool.Thiscanencourageanexchangeofideasnotonlybetweenadultsandstudents,butalsopromoteconnectionsandfriendshipsamongstudents.
Provide opportunities for professional learningaboutconnectingwithandengagingstudentsthroughworkshops,conferences,reciprocalclassroomobservationsandprofessionallearningcommunities.
Develop a school-wide service learning program or project.Iftheentireschoolisworkingtowardacommongoal,andtryingtomakeadifferenceinthecommunity,studentsmaybegintofeelmorecloselyconnectedtothosearoundthem—bothpeersandadults.
Encourage students to become involved in extra-curricular activitieswheretheycandevelopadditionalfriendshipsandpositiverelationshipswithadultadvisors.
Encourage adults to become advisors for extra-curricular activitiessothattheycanconnectwithstudentsoutsideoftheclassroomandgettoknowstudents’non-academicinterestsandtalents.
Consider developing other non-academic opportunities for team-build-ing and socializing for studentssuchasclasstrips,outdooreducationorstudentretreats.
Investigate the benefits of peer counseling programs and student mentor programsforoldertoyoungerstudents.
Continued on next page
Social Support—Adults and Students
VI. Action Charts

schoolclimate.org | page 137
Social Support: When Social Support from adults or students is perceived as a problem in your school, here are some steps you can take:
School Group Developing a Deeper Understanding of the Problem Identifying Some Common Sources of the Problem
Approaches/Programs that Schools and Research Have Found to Be Successful
School Personnel
How do the school personnel responses to this dimension comparetoongoingfeedbackaboutrelationshipsintheschoolfromschoolstaff?Howdoesthiscomparetoindicatorssuchasstaffturnover?
Are there sub-groups of school personnel who perceive the problem most?• LookatSectionIIICtoseeiftherearedifferencesbygrade,roleor
experience.
Are there particular aspects of social support that are problematic?• LookatSectionVfordetails.• Dostaffpercieveproblemsinpeersupportamongstudents?Dotheirper-
ceptionsalignwithstudentperceptions?Aresub-groupsofstaffmoresensi-tivetoissuesthanothers?
• Dostaffpercieveproblemsinthesupportthatstudentsrecievefromadultsintheschool?Dotheirperceptionsalignwithstudentperceptions?Aresub-groupsofstaffmoresensitivetotheseissues?
Can you dig deeperthroughstaffmeetingsormoreformalmeanssuchasfollow-upsurveysorfocusgroups?
Find research to support the value of relationships and mutual trust in schools and investigate evidence-based programs that may effectively support the development of higher quality relationships in your school.Belowaresitesthatprovideresearchinformationandevidence-basedprograms:
ERIC—Education Resources Information Centerhttp://www.eric.ed.gov
Center for Comprehensive School Reform & Improvement—Database http://www.centerforcsri.org/research/improvement.cgi
What Works Clearinghouse—Institute of Education Scienceshttp://ies.ed.gov/ncee/wwc/
Promising Practices Network—Programs That Workhttp://www.promisingpractices.net/programs.asp
ForAdult/AdultProfessionalRelationshipsasperceivedbyschoolstaff,seeActionChartsforLeadershipandProfessionalRelationships
NSCC can help—SeetheResourcesectionofyourSchoolPortal.AlsovisitNSCC'swebsite(www.schoolclimate.org)foragrowingbodyofprofessionaldevelopmentandtraininginareasrelatedtothequalityofrelationships.Thisincludesresourcesfromarangeoforganiza-tions,includingNSCC(whichofferstrainingsin‘TeamBuilding’and‘DevelopingaMiddleSchoolAdvisoryProgram,’amongothers).
Parents How do parent responses to this dimension comparetopriorparentfeed-backaboutthesocialadjustmentoftheirchildren?Doparentsfeelthatthereareadultsintheschoolthattheirchildcanturnto?
Are there sub-groups of parents who feel that their children may not be socially supported in the school?• LookatSectionIIICtoseeiftherearedifferencesbygrade,genderorrace/
ethnicity.• Howdoesthiscomparetootherinformationfromparents,suchascallsand
comments?• Howdoesthiscomparetothestudentpatternsbygrade,genderorrace/
ethnicity?
Are there particular aspects that parents perceive to be a problem?• LookatSectionVIfordetails.
Social Support—Adults and Students
VI. Action Charts

schoolclimate.org | page 138
School Connectedness/Engagement: When School Connectedness/Engagement is perceived as a problem in your school, here are some steps you can take:
School Group
Developing a Deeper Understanding of the Problem Identifying Some Common Sources of the Problem Approaches/Programs that Schools and Research Have Found to Be Successful
Students How do the student responses to this dimension comparetootherinformationaboutstudentconnectedness/engagement?Whichotherscalesseemtobealignedwiththesepatterns?Dotheyrelatemoretoqualityofrelationships,teaching&learning,orsafetyandsecurity?
Are there sub-groups of students who appear to be particularly disengaged?• LookatSectionIIICtoseeiftherearedifferencesbygender,
gradeorrace/ethnicity.• Howdoesthiscomparetoreportsfromguidancecounselors,
teachers,andparents?
Are there particular aspects of this dimension that are perceived as particularly inadequate?• LookatSectionVfordetails.
Can you dig deeper through focus groups, follow-up surveys, or more informal, but structured conversations with specific groups about specific issues?• Canyouprobemoretoidentifywhethertherearespecificgroups
thatmayfeelespeciallydisconnected?
According to research, there are several factors that are associated with weak school ties:• Perceivingthatteachersareunsupportiveand
uncaring• Ostracismfrompeersandteachers• Beingdisengagedincurrentandfutureacademic
programs• Believingthatdisciplineisunfairandineffective• Notparticipatinginextracurricularactivities
Address other issues that students have identified as problems. Asyoucansee,thefactorsinthesecondcolumnarerelatedtoseveralotherdimensionsofschoolclimatemeasuredbytheCSCIsurvey.Closelyexamineyoursurveyresultsandtakenoteofthedimensionsthatarerankedlowestoftheten(oreight)bythethreedifferentgroups.Thinkaboutwaysinwhichissuesintheseotherareasmightbeunderminingschoolconnectednessandpositiveengagement.Alsothinkaboutthewaysinwhichhigherrateddimensionsmightpresentopportunitiesthatcanbeleveragedtosupportstrongerconnectedness/engagement.
Develop a new school tradition designed to build cohesion in the school community.Includestudentsintheplanningofthisnewtradi-tion,andensureitissomethingtheentireschoolcommunitycangetexcitedabout.
Consider instituting a suggestion box for activities that interest students and partner with community groups that can support pro-grams extra-curricular activities and enrichment programs.
Offer incentives for involvement in extracurricular activities.Thismaybeassimpleasremovingbarrierstoinvolvementintheseactivities.Besuretransportationisavailable,andconsiderprovidingfoodinthecafeteriaafterschoolhours,orkeepingtheschoollibrarystaffedandopenafterschool.Encouragestaffaswellasstudentstoparticipateandconsiderwaystosupporttheirinvolvement.Publiclyrecognizethehardworkandaccomplishmentsofextracurriculargroups/activities.
Continued on next page
School Connectedness/Engagement
VI. Action Charts
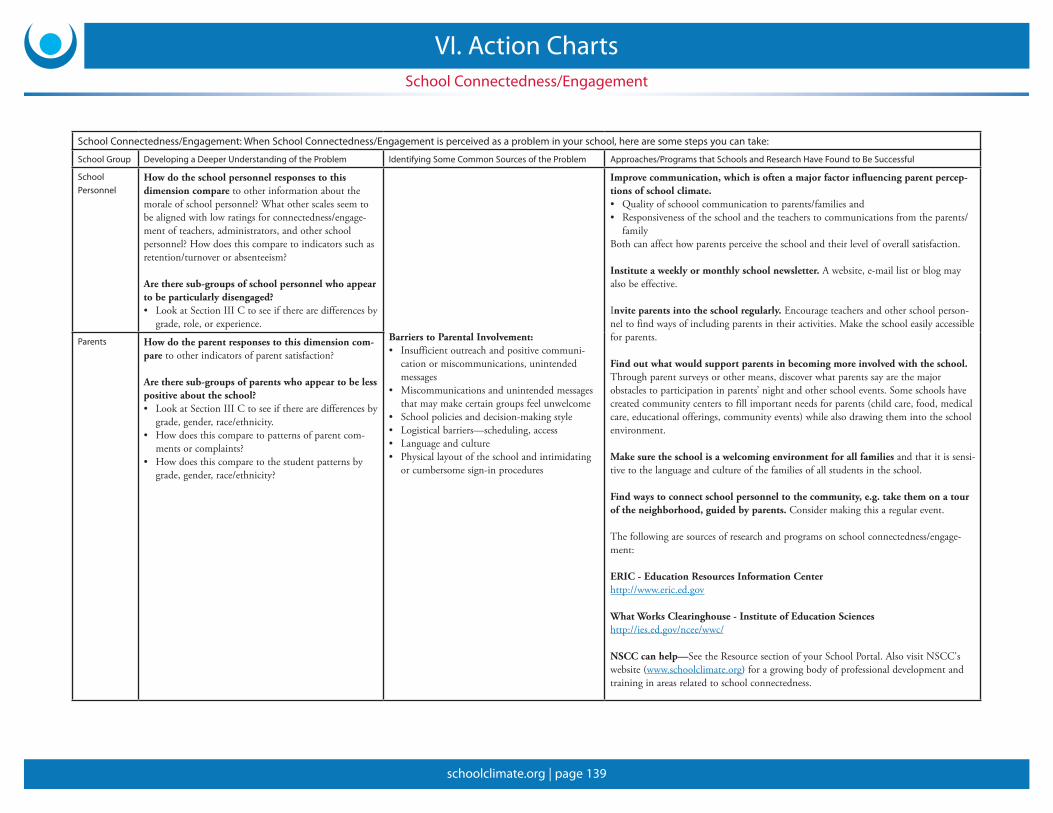
schoolclimate.org | page 139
School Connectedness/Engagement: When School Connectedness/Engagement is perceived as a problem in your school, here are some steps you can take:
School Group Developing a Deeper Understanding of the Problem Identifying Some Common Sources of the Problem Approaches/Programs that Schools and Research Have Found to Be Successful
School Personnel
How do the school personnel responses to this dimension comparetootherinformationaboutthemoraleofschoolpersonnel?Whatotherscalesseemtobealignedwithlowratingsforconnectedness/engage-mentofteachers,administrators,andotherschoolpersonnel?Howdoesthiscomparetoindicatorssuchasretention/turnoverorabsenteeism?
Are there sub-groups of school personnel who appear to be particularly disengaged?• LookatSectionIIICtoseeiftherearedifferencesby
grade,role,orexperience.Barriers to Parental Involvement:• Insufficientoutreachandpositivecommuni-
cationormiscommunications,unintendedmessages
• Miscommunicationsandunintendedmessagesthatmaymakecertaingroupsfeelunwelcome
• Schoolpoliciesanddecision-makingstyle• Logisticalbarriers—scheduling,access• Languageandculture• Physicallayoutoftheschoolandintimidating
orcumbersomesign-inprocedures
Improve communication, which is often a major factor influencing parent percep-tions of school climate.• Qualityofschooolcommunicationtoparents/familiesand• Responsivenessoftheschoolandtheteacherstocommunicationsfromtheparents/
familyBothcanaffecthowparentsperceivetheschoolandtheirlevelofoverallsatisfaction.
Institute a weekly or monthly school newsletter.Awebsite,e-maillistorblogmayalsobeeffective.
Invite parents into the school regularly.Encourageteachersandotherschoolperson-neltofindwaysofincludingparentsintheiractivities.Maketheschooleasilyaccessibleforparents.
Find out what would support parents in becoming more involved with the school.Throughparentsurveysorothermeans,discoverwhatparentssayarethemajorobstaclestoparticipationinparents’nightandotherschoolevents.Someschoolshavecreatedcommunitycenterstofillimportantneedsforparents(childcare,food,medicalcare,educationalofferings,communityevents)whilealsodrawingthemintotheschoolenvironment.
Make sure the school is a welcoming environment for all familiesandthatitissensi-tivetothelanguageandcultureofthefamiliesofallstudentsintheschool.
Find ways to connect school personnel to the community, e.g. take them on a tour of the neighborhood, guided by parents.Considermakingthisaregularevent.
Thefollowingaresourcesofresearchandprogramsonschoolconnectedness/engage-ment:
ERIC - Education Resources Information Centerhttp://www.eric.ed.gov
What Works Clearinghouse - Institute of Education Scienceshttp://ies.ed.gov/ncee/wwc/
NSCC can help—SeetheResourcesectionofyourSchoolPortal.AlsovisitNSCC'swebsite(www.schoolclimate.org)foragrowingbodyofprofessionaldevelopmentandtraininginareasrelatedtoschoolconnectedness.
Parents How do the parent responses to this dimension com-paretootherindicatorsofparentsatisfaction?
Are there sub-groups of parents who appear to be less positive about the school?• LookatSectionIIICtoseeiftherearedifferencesby
grade,gender,race/ethnicity.• Howdoesthiscomparetopatternsofparentcom-
mentsorcomplaints?• Howdoesthiscomparetothestudentpatternsby
grade,gender,race/ethnicity?
School Connectedness/Engagement
VI. Action Charts

schoolclimate.org | page 140
Physical Surroundings: When Physical Surroundings is perceived as a problem in your school, here are some steps you can take:
School Group
Developing a Deeper Understanding of the Problem Identifying Some Common Sources of the Problem Approaches/Programs that Schools and Research Have Found to Be Successful
Students How do the student responses to this dimension compare tootherindicatorsthattheschoolhasaboutthephysicalenvironment?Isthisperceivedconsistentlybyallmembersoftheschoolcommunity?
Are there sub-groups of students who perceive the environment to be particularly problematic?• LookatSectionIIICtoseeiftherearedifferencesbygender,
gradeorrace/ethnicity.• Arefacilities/suppliesdifferentforanygroupsofstudents(for
example,bygrade)?
Are there particular aspects of the environment perceived as par-ticularly inadequate?• LookatSectionVfordetails.• Areproblemscenteredonfacilities,maintenanceorsupplies?
Inadequate facilities:• Olderschoolswithstructuralproblems• Inadequatespaceforthesizeofthestudent
body• Poormaintenance• Lackingadequatelunchrooms,gyms,libraries,
labs
Structural limitations:• Supplies• Insufficientoroutdatedtechnology
Once you’ve done the follow-up work to find out what aspects of the school environment are most troubling, solicit ideas on what can be done about the problem(s).
Consider a community meeting to discuss solutions for the problem.Examineallideasthatcomefromthecommunity,eveniftheyseemimplau-sibleatfirst.• Here’s one way to structure such a meetingthathasbeeneffective
forothers:first,askeveryonepresenttobrainstormalltheproblemstheywouldliketobefixed.Writedowneverysingleone.Beginatthetopofthelist,andstartadiscussiononwhichofthefirsttwoitemsismoreimportant.Whenyou’vedecidedonone,comparethatitemtothenextitemonthelistanddiscusswhichofthetwoismostimportant,andsoon.Thistechniqueismosteffectivewithaskilledandimpartialmoderator.
Find a way to upgrade the school environment yourself.• Perhapsalargegroupofparents,schoolpersonnel,andstudentscan
work together one dayonatasksuchaspaintingtheschool,repairingtheplayground,orcleaninguptrash.
• You can also look for community memberswithspecificskillsintheseareasthattheymightbewillingtocontribute.
• Physical improvements of this kind can also improve school moraleandshowtheschoolcommunitythatchangesarebeingmade.Evensmall,visiblechangescanhelpbuildexcitementandcommitmenttotheschoolclimateimprovementprocess.Aimforsome“smalltriumphs”thatwillhavethiseffect.
• Involving students in these effortscanhelpthemtounderstandtheworkinvolved,andencouragethemtotakebettercareoftheschool.Itcanalsobuildcommunityandcommonpurpose.
• Workfromthe“brokenwindows”philosophypopularizedbytheNYPD.Takingcareofevensmallenvironmentalissuescanhelpimproveotheraspectsofschoolclimate.
Continued on next page
Physical Surroundings
VI. Action Charts

schoolclimate.org | page 141
Physical Surroundings: When Physical Surroundings is perceived as a problem in your school, here are some steps you can take:
School Group Developing a Deeper Understanding of the Problem Identifying Some Common Sources of the Problem Approaches/Programs that Schools and Research Have Found to Be Successful
School Personnel
How do the school personnel responses to this dimension comparetootherindicatorsthattheschoolhasaboutthephysicalenvironment?Isthisperceivedconsistentlybyallmembersoftheschoolcommunity?
Are there sub-groups of school personnel who perceive the environment to be particularly problematic?• LookatSectionIIICtoseeiftherearedifferencesbyrole,
experience,grade.• Arefacilities/suppliesdifferentforanygroupsofschoolperson-
nel—byrole,subjectarea,grade?
Are there aspects of the environment that are perceived as par-ticularly inadequate?• LookatSectionVfordetails.• Areproblemscenteredonfacilities,supplies,time?
Develop fund-raising ideas to support changes and updates in the school. Thereareseveralresourcesavailabletoassistwithfund-raisingideas,andliter-allythousandsofcreativeideascanbefoundinbooksandonwebsites.• Besuretoassign responsibility for this tasktoapersonorgroupof
people.Fund-raisingcanbeanexcellentjobforaparentorparent-teachergrouptotakeon.Olderstudentsoftentakeanactiveroleaswell.
• The people benefiting from or requesting the changes may be willing to contribute tothiseffortinsomeway.Thiscouldmeanfinancialcontri-butionsoracommitmentoflaborortime.
• Therearemanyfundingsourcesnowonline,includingwebsitesthatallowschoolpersonneltopostitemsorfundstheyneedforspecificpur-poses(afieldtrip,newbooks,amicroscope).Individualdonorscanviewtherequestsandchoosetofundoneormore.
• Don’t forget the usual financial channelswhenseekingfundsforschoolimprovements.Evenbudgetrequeststhathavebeenpreviouslydeniedmightbereconsiderediftheschoolcommunityiswillingtocontributeaspecificamountoftime,money,orlabortogettheworkdone.
If nothing can immediately be doneaboutaproblemintheschoolenviron-ment(forexample,overcrowdingoradesignflawinthebuilding),youcanstilllookforwaystomaketheissueeasiertodealwith.Solicitideasfromtheschoolcommunity.
NSCC can help—SeetheResourcesectionofyourSchoolPortal.AlsovisitNSCC'swebsite(www.schoolclimate.org)foragrowingbodyofprofessionaldevelopmentandtraininginrelatedareas.
Parents How do the parent responses to this dimension comparetootherindicatorsthattheschoolhasaboutthephysicalenviron-ment?Isthisperceivedconsistentlybyallmembersoftheschoolcommunity?
Are there sub-groups of parents who perceive the environment to be particularly problematic?• LookatSectionIIICtoseeiftherearedifferencesbygender,
race/ethnicity,grade.
Are there aspects of the environment that are perceived as par-ticularly inadequate?• LookatSectionVfordetails.• Areproblemscenteredonfacilities,supplies,time?
Physical Surroundings
VI. Action Charts

schoolclimate.org | page 142
Dimensions Related to Working Conditions for School Personnel: If one or both of these are perceived to be problems in your school, here are some steps you can take:
Dimension Developing a Deeper Understanding of the Problem Identifying Some Common Sources of the Problem
Approaches/Programs that Schools and Research Have Found to Be Successful
School Personnel: Leadership
How does this compare to other scales and indicatorsrelatedtotheexperienceofschoolpersonnel?Howdoesthiscomparetoothermeasuresofprofessionalsatisfactionandretention?
Are there sub-groups of school personnel who perceive school leadership to be weaker and less supportive?• LookatSectionIIICtoseeiftherearedifferencesbygrade,role,
orexperience.
Are there particular aspects of leadership that are perceived as inadequate?• LookatSectionVfordetails.• Areproblemsperceivedtocenteronvision,accessibilityand
support?
Canyoudigdeeperthroughfocusgroups,follow-upsurveys,ormoreinformal,butstructuredconversationswithspecificgroupsaboutspecificissues?
Vision:• Lackofclarity• Lackofconsistency• Lackofcommunicationregarding
theschool’svisionandmission
Support:• Insuffficientaccesstoschool
leaders• Insufficientorineffectivecommu-
nicationfromschoolleaders• Schoolpersonneldoesnot
feelsupported/appreciatedbyadministration
Decision Making Style:• Limitedinvolvementofstaffin
decisionsaffectinginstruction,professionallearningand/ordiscipline
Workplace structure & norms:• Insufficientopportunitiesforcol-
laborationwithcolleagues(e.g.betweenteachers)
• Insufficientcommunicationandcooperationacrossdifferentgroups(e.g.,teachers,supportstaff,andadministration)
• Ineffectivenormsthatdonotpro-motemutualtrustandsupport
• Nostructuresorencouragementforsharingprofessionalpracticeandlearningfromoneanother
• Schedulingpressuresthatprohibitcollaboration
Learn more about your leadership and decision-making styles and your approach to conflict resolution. Self-assessmentinventories,personalandcollegialreflectioncanbehelpful.Usethisknowledgetoinformyourworkingrelationshipsatschool.
Think about your vision for the school.Hasitbeendevelopedasasharedvisionacrosstheschoolcommunity.Isitrevisitedovertimetoreflectnewvoices,goalsandchallenges.
Consider ways in which you could improve communication with teachers and staff.Askfortheirinputinguidingyourefforts.Developmorecollaborativedecisionmakingstylesandnormsfordistributedlead-ership.
Make a special effort to involve teachers in decisions about professional devel-opment and provide teachers with opportunities related to social-emotional issues,e.g.socially&emotionallyinformedclassroommanagement,self-reflectionanddiversity.
NSCC can help—SeetheResourcesectionofyourSchoolPortal.AlsovisitNSCC'swebsite(www.schoolclimate.org)forsupportsandresources.
Structure opportunities for staff to work togetherwithinandacrosspositions,disciplinesandgradelevels.
Develop Professional Learning Communitiesforexaminingandsharinginstruc-tionalpractice.
Develop norms for observing classrooms, sharing feedback, and developing principles for best practice.
Ask teachers to present successful techniques or programs at staff meetings.Thiscanbeahelpfulwayofpassingonknowledgeaswellasrecognizingtheaccomplishmentsofteachersandstaffmembers.
Consider implementing a mentoring program or group discussionsforteachersaboutclassroomexperiences.
Adopt team-building activities.Thereareavarietyoftheseavailable,andtheycanhelpbuildafoundationforbettercommunicationandimprovedrelationships.
School Personnel: Professional Relationships
How does the response to this dimension comparetootherscalesandindicatorsrelatedtothequalityofteachingandlearning?Howdoesthiscomparetoretentionorothermeasuresofsatisfaction?
Are there sub-groups of school personnel who appear perceive less support in the way of professional development?• LookatSectionIIICtoseeiftherearedifferencesbygrade,role,
orexperience.
Are there particular aspects of professional development that are perceived as inadequate?• LookatSectionVfordetails.• Areproblemsperceivedtocenteroncontent,methods,degreeof
input?• ExaminetheresponsetoquestionsaboutspecificPDexperience
inDetailedResultssection.Haveteachershadthistraining?
Canyoudigdeeperthroughfollowupconversations?
Professional Development and Leadership
VI. Action Charts

schoolclimate.org | page 143
Social Media
VI. Action Charts
Dimensions Related to Social Media: If Social Media is perceived to be a problem in your school, here are some steps you can take:
School Group
Developing a Deeper Understanding of the Problem Identifying Some Common Sources of the Problem Approaches/Programs that Schools and Research Have Found to Be Successful
Students Aretheresubgroupsofstudentswhoarereportingbeingvictimizedthroughsocialmedia?
Howdoesstudents’socialemotionalsecurityinyourschooldifferfromtheirsocialemotionalsecurityonline?
Howdoreportsfromdifferentpopulations(students,parents,schoolpersonnel)differonexperi-enceorknowledgeofsocialmediabullying?
Arethereparticulartypesofaggressionoccurringonsocialmedia?
Arethereparticularsocialmediaplatformswherebullyingismorecommon?
Canyoudigdeeperthroughfollowupsurveys,focusgroups,orinformal,structuredconversa-tionsaboutparticularissues,suchashoweffectiveandfairstaffareindiscipliningstudentsinregardstosocialmediabullying?
Supervision:• Insufficientadultpresenceonline(fromadultsathomeoratschool)• Adultsinsufficientlytrainedinsociallyandemotionallyinformed
discipline• Difficultymonitoringonlineinfractions• Lackofadultunderstandingthattheseproblemsrequireintervention
Rules and Norms:• Notclearlydefinedrulesandconsequencesregardingtheschool’splace
intheseinfractions• Unclearorunidentifiedwaytoreportbullyingoccurringonline
Technology• Difficultyascertainingperpetratorandprovidingconsequencesbecause
ofanonymousposts/texts• Difficultykeepingabreastofconstantlychangingmediawithwhich
perpetratorscantargetsomeone
Education• Lackofeducationregardingsocialresponsibilityonline• Lackofeducationregardinghowandwhentokeepinformationprivate
andhowtoprotectoneselfonline
Individual Competencies• Students’under-developedsocialandemotionalskillsanddispositions
(self-awareness,self-regulation,flexibleproblemsolving,responsibility,andcooperativecapacities)
• Needforadultstomodelsocial-emotionalskills• Needforstudentstolearntothinkoftheramificationsoftheiractions
beforeacting,especiallyregardingpermanentonlinebehaviors• Needforstudentstolearneffectivecopingstrategies(ratherthanposta
picture/statusetc.toseeksupportoraselfesteemboost)
Peer/School Culture• Unhealthynormsforbehavior(studentsbelievesocialbullyingand
otherproblemsarecommononline)• Inconsistentmodelingofsupportivebehavioronline,including
Upstandernorms• Lowlevelsofgroupsupportandtrust• Aculturethatisinsufficientlytolerantofdifferences• Unhealthynormsregardingonlinepresence(socialmediauseisfre-
quentandwidespread)
Ensure school has well thought out rules and consequences regarding social media bullying.
Identify problem areas, platforms, and timesforsocialmediasafety(whatmeth-odsstudentsareusingmostoftentotargetothers,whenvictimizationisoccurring,etc.).
Make it easy and safe to report prob-lems. Alladultsshouldbepreparedtoreceivereports(writtenororal)fromstudentsinasensitivemannerandconveythemtotheappropriateperson.Itmayalsohelptoprovidewaysforstudentstoreportanonymously.
Educate parents in social media bully-ing. Teachthemwaystalktotheirchildabouttheironlinebehaviorandwaystorecognizethattheirchildisbeingtargetedonlineaswellaseffectivewaystomonitortheirchild’sonlinebehavior.Suggestionscouldincludelimitingcomputer/tabletusetooneroomofhouse,limitingdataaccessonphones,andknowingchild’spasswords.
Educate school personnelindealingeffectivelywithchildrenintraumaandinstrategiestohelppreventproblemsfromescalatingintoschool-widecrises.
Address the issue of bullying(includingphysical,verbal,andsocialmediabully-ing).
Establish and communicate the school’s anti-bullying commitment. Createacommonlanguageandestablishpoliciesandproceduresforaddressingbullyingincidentswhenandwheretheyoccur.
School Personnel
Howdostaffreportsofstudents’socialemotionalsecurityinyourschooldifferfromtheirreportsofstudents’socialemotionalsecurityonline?
Aretheresubgroupsofschoolpersonnelwhoperceivehigherincidencesofsocialmediabullying?
Doschoolpersonnelreporthigherincidencesofatypeofaggressiononline?
Canyoudigdeeperinstaffmeetingsorthroughmoreformalmeanssuchasfollow-upsurveysorfocusgroups?
Parents Howdoparentreportsofstudents’socialemotionalsecurityinyourschooldifferfromtheirreportsofstudents’socialemotionalsecurityonline?
Aretheresubgroupsofparentswhoperceivehigherincidencesofsocialmediabullying?
Howdoparents’reportsofsocialmediabullyinginthissurveycomparetotheirreportsofsocialmediabullyingtotheschool?
Doparentsreporthigherincidencesofatypeofaggressiononline?
Canyoudigdeeperthroughparentoutreach?

schoolclimate.org | page 144
TheCSCIasameasureisintendedtoprovideinformationaboutschoolclimateasspecificallymeasuredbytenscalescorrespondingtotenimportantdimensionsofschoolclimate—Safety-Rules&Norms,SenseofPhysicalSecurity,SenseofSocial-EmotionalSecurity,SupportforLearning,Social&CivicLearning,RespectforDiversity,SocialSupport—Adults,SocialSupport—Students,SchoolConnectedness/Engagement,andPhysicalSurroundings.Forschoolpersonneltherearetwoadditionalscalesthatarerelevanttoschoolclimate—LeadershipandProfessionalRelationships.Eachofthesescalesconsistsofaparticularsubsetofindividualsurveyitems.
Althoughthelastsectionofthereportprovidesfulldetailsonhoweachgrouprespondedtotheindividualsurveyitems,thesurveywasdevelopedtobemostreliableatthescalelevel.Thescalescoresdependonanindividual’sresponsetoanumberofitemsthattogetherrevealtheperceptionsofagivenaspectofschoolclimate.
Informationontheindividualsurveyitemsisincludedinordertoshowyouwhatkindsofindicatorsareusedtomeasureeachdimension.However,responsetoanindividualitemislessreliable,andNSCCdoesnotrecommendmakingpolicydecisionsbasedonthesenumbersalone.Therefore,thefindingsarediscussedonthescalelevelthroughoutthereport,anditisrecommendedthatyouconcentrateonthescalescoresfordiscussionandplanning.
Thescaleordimensionscoresforeachrespondentarecalculatedastheaveragescoreacrosstheseitems.Averagesratherthantotalscoresareusedtopromoteunderstandingandusability.Withaveragescores,allscalescoresarecomparabletooneanotherregardlessofthenumberofitemsthatcontributetothatscore.Scoresrangefrom1to5asdotheratingsforindividualitems.However,sincethe
scalescoresarecalculatedasaverageratingsacrossallofthesurveyitemsthatarepartofthatscale,individualrespondents’scalescoreswillnolongerbeinthefiveoriginalneatcategoriescorrespondingtotheresponsecategoriesfrom1to5,butwillvaryfrom1to5infractionalterms;forexampleifanindividualrespondentrated5itemsona10-itemscaleas“3”or“neutral”and5as“4”orpositive,thescalescorefortherespondentwouldbe3.5.)Thisalsohelpsintheinterpretabilityofthescalescores.Indevelopingthescalescores,anyrespondentswhodidnotrespondtoallitemsinthescalewerenotgivenascalescore.Thisensuresthatthescalescoreswerebasedonthesameitemsforeachperson.
Tounderstandthemeaningofscalescores,scorescanbeconsideredashighlynegativetohighlypositiveaccordingtowheretheyfallonthecontinuumfrom1to5,withscoresbelow2.5indicatingarelativelynegativerating,scoresabove3.5relativelypositiveandthoseinthemiddleneutral—thelowerthescoreinthenegativerange,thestrongerthenegativejudgment;converselythehigherthescoreinthepositiverange,thestrongerthepositivejudgment.
Forschoolgroups,theoverallmeasurethatisreportedisthemedianscore,whichisthemidpointoftherangeofscoresacrossallindividualrespondentsinthegroup.Forexample,amedianscoreof3.0forstudentsonSupportforLearningwouldindicatethattheoverallratingisfairlyneutral,asmeasuredbythemidpointofrespondentswhereanequalnumberrateSupportforLearningaslowerandhigher.
Continued on next page
Further Details on the CSCI Measure
Appendix A

schoolclimate.org | page 145
Whilethisisslightlydifferentthanameanoraverage,itisoneofthecommonlyusedindicatorsofcentraltendencyoroverallgroupperformance.Medianvaluesaretypicallyequivalenttomeanvalues,exceptwherethereareasmallnumberofextremeratingswhichwouldskewthemeanmorethanthemedian.
Foraquestionnairethatusesafivepointratingscale,whileitisclearthatmostrespondentsinterprettheorderofthescalethesameway,i.e.5ishigherthan4,andsooninthewaythattheyrespond,itisnotclearthattheintervalsbetweenratingsmeanthesamethingstoallrespondents.
Forthisreason,usingmedianvaluesacrossrespondentswhichtakesintoaccountrankingbutnotactualratings,isconsideredamoreappropriatemeasure.Inadditiontothemedianscores,thereportcontainsresponsedistributionsforeachschoolclimatedimensions,whichshowthepercentageofrespondentsineachschoolgroupwhosescoresfallintoeachcategoryorrange.
Theseshouldhelpyouunderstandtheconsistencyand/orvariabilityofperceptionsandthestrengthofopinionwithinschoolgroups.Forexample,iftheoverallormedianscoreforSupportforLearningforstudentsisneutral,isthatbecausemostrespondentsareneutralorisitbecausethereareanevennumberwithpositiveandnegativeviews;ifthelatter,arepositiveandnegativeopinionssymmetricalorarethepositivesconcentratedaroundhighlypositive,whilenegativesarejustmildlyso,orviceversa.
Eachofthesepatternsprovidesvaluableinsightintotheperceptionsheldbystudents,staffandparents,anddifferentpatternswillsuggestdifferentcoursesofaction.
Further Details on the CSCI Measure
Appendix A

341 West 38th Street, 9th Floor, New York, NY 10018 | 212.707.8799 | www.schoolclimate.org