the cognitive style indicator: development of … · the cognitive style indicator: development of...
TRANSCRIPT

D/2006/6482/10
Vlerick Leuven Gent Working Paper Series 2006/10
THE COGNITIVE STYLE INDICATOR:
DEVELOPMENT OF A NEW MEASUREMENT INSTRUMENT
EVA COOLS
HERMAN VAN DEN BROECK
DAVE BOUCKENOOGHE

2
THE COGNITIVE STYLE INDICATOR:
DEVELOPMENT OF A NEW MEASUREMENT INSTRUMENT
EVA COOLS
Vlerick Leuven Gent Management School
HERMAN VAN DEN BROECK
Vlerick Leuven Gent Management School
DAVE BOUCKENOOGHE
Vlerick Leuven Gent Management School
Contact:
Eva Cools
Vlerick Leuven Gent Management School
Tel: +32 09 210 97 78
Fax: +32 09 210 97 57
Email: [email protected]
3
ABSTRACT
This paper describes the development and validation of a cognitive style measure, the
Cognitive Style Indicator (CoSI). Three studies were conducted to validate the CoSI. The
first study consisted of 5924 employees who took part in a large-scale research with
regard to career decisions. In the second study, 1580 people completed the CoSI as part
of a ‘Competence Indicator’ tool on the Internet. Finally, the third study comprised 635
MBA students who completed the CoSI in the context of a ‘Management and
Organization’ course. Reliability, item, and factor analyses demonstrated the internal
consistency and homogeneity of three cognitive styles (knowing, planning, and creating
style). In addition, substantial support was found for the instrument’s construct validity
by including other cognitive style instruments, and personality and ability measures in the
validation process. Criterion-related validity was confirmed by examination of the
relationship between these cognitive styles and work-related characteristics. The main
contributions of our research lie in (a) the development of a valid and reliable cognitive
style instrument for use in organizations, and in (b) the further refinement of the analytic–
intuitive cognitive style dimension by splitting the analytic pole in a knowing and a
planning style.

4
INTRODUCTION
Cognitive styles have been extensively studied in diverse research domains
(Grigorenko & Sternberg, 1995; Rayner & Riding, 1997). Given the increased attention
for cognitive approaches in industrial, work, and organizational psychology (Hodgkinson,
2003), cognitive styles have gained prominence in organizational behavior (OB) and
management literature (Hayes & Allinson, 1994; Hodgkinson & Sadler-Smith, 2003;
Sadler-Smith & Badger, 1998). However, there is a lack of established measures of
cognitive style that can be used in organizational settings (Allinson & Hayes, 1996).
Therefore, our aim was to develop a psychometrically sound instrument for use in
organizations.
Cognitive style is defined by Witkin, Moore, Goodenough, and Cox (1977) as the
individual way in which a person perceives, thinks, learns, solves problems, and relates to
others. Hunt, Krzystofiak, Meindl, and Yousry (1989) define cognitive style as the way in
which people process and organize information, and arrive at judgments or conclusions
based on their observations. In an early attempt to bring clarity in the diverse field of
cognitive style research, Messick (1984) concludes that all these different conceptions
one way or another imply that cognitive styles are consistent individual differences in
ways of organizing and processing information and experience. Building further on this
stream of conceptualizations, we define a cognitive style as the way in which people
perceive environmental stimuli, and how they organize and use this information for
guiding their actions.
Theoretical and empirical interest in cognitive styles
Kirton and De Ciantis (1994) argue that people’s cognitive style is increasingly
seen as a critical intervening variable in work performance. According to Hayes and
Allinson (1994), cognitive styles can be used in organizations in the context of
recruitment, task and learning performance, internal communication, career guidance and
counseling, team composition and team building, conflict management, and training and
development. Sadler-Smith and Badger (1998) also investigated the human resource
implications of cognitive styles. They concluded that human resource practitioners play a

5
crucial role in fostering individual versatility and in facilitating innovation through the
effective management of cognitive style differences. Identifying and understanding each
employee’s cognitive style provides an excellent opportunity to enhance individual and
team performance and productivity (Volkema & Gorman, 1998). Consequently, gaining
insight into cognitive styles is of high significance for organizations. In particular, the
turbulent business environment characterized by an ever-increasing pace of change and
adaptation (Burke & Trahant, 2000; Cascio, 1995; Conner, 1992) requires the ability and
flexibility of organizational members to work together (Armstrong & Priola, 2001;
Jarzabkowski & Searle, 2004). Moreover, attention for cognitive style differences is
highly relevant in the context of decision making (Leonard, Scholl, & Kowalski, 1999),
as people prefer decision-making processes that are compatible with their cognitive style
(Gardner & Martinko, 1996; Hunt et al., 1989). In a wider context, cognitive styles do not
only influence information processing and strategic decision making (Gallen, 1997;
Hough & ogilvie, 2005; Kirton, 2003), but also person–organization fit (Chan, 1996), or
selection and turnover of employees (Sadler-Smith, 1998). Furthermore, people’s
cognitive styles are claimed to be an excellent indicator for entrepreneurial attitudes
(Allinson, Chell, & Hayes, 2000; Bouckenooghe, Cools, Vanderheyden, & Van den
Broeck, 2005; Sadler-Smith, 2004).
Pluralism in the field of cognitive styles
Over the years, a large variety of cognitive style dimensions has been identified
by researchers (Hodgkinson & Sadler-Smith, 2003), ranging from the well-known ‘field
dependent’ versus ‘field independent’ (Witkin, 1962), and ‘serialist’ versus ‘holist’
constructs (Pask & Scott, 1972), through ‘levellers’ versus ‘sharpeners’ (Gardner,
Holzman, Klein, Linton, & Spence, 1959), and ‘reflection’ versus ‘impulsivity’ (Kagan,
1965) to ‘convergers’ versus ‘divergers (Guilford, 1967), and ‘adaptors’ versus
‘innovators’ (Kirton, 1976). Additionally, many diagnostic tools and questionnaires have
been developed to identify cognitive style differences. Allinson and Hayes (1996) made
an extensive summary of problems with existing cognitive style measures for use in
organizations. Besides the dissatisfaction with psychometric unsoundness (validity and

6
reliability issues), other points of critique on current instruments concern the time-
consuming character pertaining the administration in organizations, and the need for
well-trained raters to interpret the results produced by these tools.
Consequently, the myriad of cognitive style dimensions and the growing number
of cognitive style measures have resulted in a complex and confusing field of study
(Grigorenko & Sternberg, 1995; Hayes & Allinson, 1994; Rayner & Riding, 1997),
which undermines the viability of the concept for academics and practitioners
(Hodgkinson & Sadler-Smith, 2003). Accordingly, several attempts have been made to
create order in the cognitive style field by integrating and categorizing different theories
(e.g., Cassidy, 2004; Coffield, Moseley, Hall, & Ecclestone, 2004; Desmedt & Valcke,
2004). Some authors suggest that various cognitive styles are different conceptualizations
of the same underlying dimension (Allinson & Hayes, 1996; Riding, 1997; Sadler-Smith
& Badger, 1998). Miller (1991, p. 201) suggests that “the idea that (cognitive) processes
depend on the interaction of two opposing principles – destructive and constructive, …
diversifying and unifying …, is hardly new. In one form or another, we can find this
motion appearing repeatedly over many centuries in Western thought.” The dual nature of
human consciousness has intrigued people for hundreds of years (Taggart & Robey,
1981). Two qualitatively different cognitive styles are evident among many studies. The
first cognitive style is commonly described by the terms analytical, deductive, rigorous,
constrained, convergent, formal, and critical. The second cognitive style is commonly
described as synthetic, inductive, expansive, unconstrained, divergent, informal, diffuse,
and creative (Nickerson, Perkins, & Smith, 1985). Allinson and Hayes (1996) call this the
analysis–intuition dimension. Similar conceptualizations exist to refer to the same
dimension, like analytic–nonanalytic (Kemler-Nelson, 1984), analytic–holistic (Beyler &
Schmeck, 1992), or logical–nonlogical (Barnard, 1938). This distinction between
cognitive narrowness and broadness, or rational and intuitive thinking, continues to
dominate current research on cognitive differences (Hodgkinson & Sadler-Smith, 2003).
Based on an extensive literature review of the cognitive style field, we came to a
description of the two poles of the so-called analytic–intuitive dimension (Table 1).
7
Insert Table 1 about here
However, after this comprehensive literature review, we questioned the empirical
and theoretical viability of a bipolar analytic–intuitive cognitive style dimension. This
concern is acknowledged by other authors as they provide alternative multidimensional
cognitive style models (e.g., Herrmann, 1994; Riding & Cheema, 1991; Sternberg, 1997).
Recently, Hodgkinson and Sadler-Smith (2003, p. 245) stated that these multidimensional
theories “undoubtedly made a major contribution to the fields of management and
organizational behavior (and beyond) by enriching understanding of the nature and
significance of individual differences in the processing of information”.
In addition, when the myriad of bipolar unidimensional models were analyzed,
differences in conceptualization and operationalization became apparent. For instance,
Allinson and Hayes (1996) define analysis–intuition mainly as a difference between
rational and intuitive reasoning, stemming from left brain/right brain theories. Kirton
(2003) defines his adaption–innovation dimension as a difference in the way people
prefer to deal with cognitive structure. Since the early stage of theoretical development,
Kirton put a central focus on cognitive structure (Mudd, 1995). However, the departure
from different theoretical perspectives in defining bipolar cognitive style models suggests
the existence of more than one style on each of the poles of the analytic–intuitive
dimension, as several theorists have developed their own instrument to measure their
bipolar cognitive style dimension. In an early review of the cognitive style field, Shipman
and Shipman (1985) already concluded that diverse cognitive style dimensions are
exceedingly heterogeneous and lack a common definition. Leonard et al. (1999) did not
find simple, strong interrelationships between different cognitive style measures,
although many of the measures seem to overlap conceptually.
Continuous debate also exists with regard to bipolar unidimensional cognitive
style models whether they are not better served by treating the two poles as separate
unipolar scales. Taylor (1989) calls for research to further refine the KAI methodology by
using orthogonal scales, treating adaption and innovation as multidimensional. On the
contrary, Foxall and Hackett (1992) and Mudd (1996) defend the unidimensionality of
Kirton’s theory. Recently, a series of articles discussed the unidimensional nature of
8
Allinson and Hayes’ theory. Hodgkinson and Sadler-Smith (2003), and Coffield et al.
(2004) propose that analysis and intuition are better conceived as separate dimensions.
Hayes, Allinson, Hudson, and Keasey (2003) defend the unitarist conception of their
theory. Moreover, although bipolar unidimensional models are considered to form a
continuum – indicating that people can vary in the extent to which they show certain
cognitive styles – the two poles of the continuum are often treated like a dichotomy. This
bipolarity excludes the possibility that people can simultaneously show a strong (weak)
preference for both poles of the dimension (Sadler-Smith, 2004).
Furthermore, recent theoretical work of Epstein and colleagues (Denes-Raj &
Epstein, 1994; Epstein, 1990; Epstein, Pacini, Denes-Raj, & Heier, 1996) asserts that the
rational-analytic and the experiential-intuitive systems operate independently from each
other in the processing of information. Accordingly, this theory also questions the
bipolarity of the cognitive style continuum, raising the possibility that analytic and
intuitive processing are served by independent cognitive systems.
Taken together, (a) the existence of valuable multidimensional cognitive style
models; (b) the different conceptualizations of the bipolar analytic–intuitive cognitive
style dimension; (c) the debate with regard to the bipolarity of unidimensional cognitive
style models; and (d) the recent theorizing on independent cognitive systems made us dig
deeper in the cognitive style field so that we could better map the underlying structure of
the analytic–intuitive cognitive style dimension. We combined a two-stage inductive–
deductive approach in our search for further evidence and justification of our
assumptions. In summary, the aim of this project was twofold. Firstly, we wanted to
develop a reliable, valid, and convenient instrument, labeled the Cognitive Style Indicator
(CoSI), to measure cognitive styles in organizations. Secondly, through the development
of the CoSI, we wanted to find out whether reducing the large field of cognitive style
theories to one bipolar cognitive style dimension is still warranted.

9
METHOD
Item generation process and pilot study
The process of item generation combined an inductive and a deductive phase. In
the inductive phase, the critical incidents methodology was used to capture existing
cognitive style differences. A group of 133 MBA students was invited to write a paper on
how they typically process information and make decisions. They were given a list of
concrete and open questions with regard to their organizational behavior, performance,
and skills. In the deductive phase, we consulted other cognitive style instruments and
extensively reviewed the cognitive style field. Based on our literature review, existing
cognitive style measures, and content analysis of the student papers, 97 items were
constructed initially on how people perceive, process, and use information. To ensure
content validity, other people were involved in the judgmental process (Haynes, Richard,
& Kubany, 1995; Most & Zeidner, 1995). Our initial pool of items was judged with
regard to content and relevance by three experts in the cognitive style domain.
Additionally, they were asked to categorize the items in different cognitive style clusters.
Sixty items were retained on which these experts agreed they are part of the cognitive
style field and that were categorized as belonging to the same cognitive style cluster.
Next, the remaining 60 items were presented to the OB scholars at our department for the
evaluation of the wording and the content of these items. Subsequently, we conducted a
pilot study. A final pool of 40 items was included in a large-scale study on values (N =
15616). The response format used was a 5-point Likert scale of totally disagree, rather
disagree, neutral, rather agree, and totally agree. Statistical analysis of these data
indicated the existence of three main factors in our item pool. The pilot study yielded 30
psychometrically sound items, which are used in subsequent validation studies.
10
Validation studies
Three diverse studies were included in our validation project.
Study 1. Data from a large-scale career decisions survey were used to conduct our
first validation study. A total of 6358 people participated in this study, yielding 5924
useful questionnaires. Fifty-eight per cent of the respondents were men, and 42 per cent
were women. The majority of the respondents were aged between 26 and 35 years (42 per
cent) and between 36 and 45 years (24 per cent). Ninety-three per cent worked full time,
and 33 per cent had a management job. Respondents had a wide range of careers and
educational backgrounds.
Study 2. In the second study, which aimed to assess the competences of working
people, 4 batches (from 4 different time periods) of 400 respondents were randomly
selected from the total database. After cleaning the dataset for missing values and
response patterns, 1580 useful questionnaires remained. As in the first study, respondents
displayed a wide variety of careers and educational backgrounds. Sixty-one per cent were
men, and 39 per cent were women. Sixty-eight per cent of respondents were aged
between 21 and 35 years, and 21 per cent between 36 and 45 years.
Study 3. In the third study, 635 MBA students (from 4 successive years, starting
in 2002 till 2005) of a leading Belgian business school completed the CoSI as part of a
‘Management and Organization’ course. Twenty-two per cent had several years of
working experience. Their age ranged from 21 to 58 years, with a mean age of 24.73 (SD
= 4.39). Sixty-eight per cent were men, and 32 per cent were women. Twenty-three per
cent held an engineering degree, while 41 per cent had a university degree with a
background in economics. The remaining third of this sample had a medical background
or studied social sciences, exact sciences, law, or arts. For construct validation purposes,
we included other cognitive style, several personality, and ability measures in this study.

11
Table 2 summarizes the main aspects of our research design. We used the first
two studies mainly for scale development and criterion-related validity, while the third
study was additionally used for convergent and discriminant validation purposes.
Insert Table 2 about here
Measures
To be valid, a test has to be related to conceptually similar measures (convergent
validity) and unrelated to conceptually dissimilar constructs (discriminant validity)
(Campbell & Fiske, 1959). In this regard, the relationship with two existing cognitive
style measures was examined. The field of cognitive styles is conceptually situated on the
crossroad of personality and cognition (Furnham, 1995; Sternberg & Grigorenko, 1997).
Hence, the inclusion of personality and ability measures seemed to be a reasonable choice
to further check the construct validity of the CoSI.
Cognitive style measures
Two diverse instruments were used that measure differences in how people
perceive, process, and structure information. We chose Kirton’s questionnaire (KAI) and
the questionnaire based on Epstein’s work (REI) to assess the construct validity of the
CoSI.
Kirton Adaption-Innovation Inventory (KAI). KAI is a 32-item questionnaire,
which gauges the tendency of people to adapt or innovate when approaching a problem
situation (Kirton, 1976). KAI was originally developed as a single dimension of cognitive
style, with higher scores referring to higher innovativeness. Cronbach’s alpha of the
overall scale in our research is 0.85. Sometimes, three subscales are derived from KAI
subscores.

12
Rational-Experiential Inventory (REI). REI is a 40-item questionnaire that
purports to measure individual differences with regard to analytical-rational and intuitive-
experiential thinking styles (Epstein et al., 1996; Pacini & Epstein, 1999). Twenty items
constitute a Rationality scale (α = 0.79). Pacini and Epstein (1999) distinguish between
Rational Ability (α = 0.73) and Rational Engagement (α = 0.70). The other 20 items
constitute an Experientiality scale (α = 0.88), distinguished in an Experiential Ability (α
= 0.83) and an Experiential Engagement scale (α = 0.80).
Personality measures
Three personality-related measures were included in our study: one measure of a
dispositional personality factor (i.e., optimism (LOT-R)), one related to personality trait
theories (SIMP), and one situated in the field of personality type theories (MBTI).
Revised Life Orientation Test (LOT-R). LOT-R is a 10-item scale developed to
measure dispositional optimism, defined as the extent to which individuals possess
favorable expectations regarding life outcomes (Scheier & Carver, 1985; Scheier, Carver,
& Bridges, 1994). Four items are filler items and are not used for scoring. Cronbach’s
alpha for this scale is 0.64.
Single-Item Measures of Personality (SIMP). SIMP is a new instrument to
measure the Big Five personality model, using five bipolar single items (Woods &
Hampson, 2005). Each item consists of two opposing descriptions, each representing the
poles of one of the Big Five factors (i.e., Extraversion, Agreeableness, Emotional
Stability, Conscientiousness, and Openness to Experience). Woods and Hampson (2005)
report acceptable psychometric qualities for the SIMP for research purposes.
Myers-Briggs Type Indicator (MBTI). MBTI measures personality on four
dimensions: Extraversion–Introversion, Sensing–Intuiting, Thinking–Feeling, and
Judging–Perceiving. We administered MBTI form M, containing 93 forced-choice items
(Myers & Myers, 1998). Gardner and Martinko (1996) conclude from their review article
on the MBTI that the instrument is a reliable and valid tool for research into relationships
among managerial personalities, cognition, behaviors, effectiveness, and situational
variables.

13
Ability measures
Academic performance. Several indicators for overall academic performance were
used to measure ability. Overall academic achievement was determined by collecting the
final, overall grades of MBA students from a leading Belgian business school. This was
considered to be an accurate representation of students’ overall ability as this final grade
is a weighted aggregation of scores on a wide variety of business-related subjects.
Additionally, for each student the results on the admission procedure were extracted from
the business school’s database. This final grade is a weighted aggregation of scores on an
analytical, knowledge, and motivation test, and a calculated score based on previous
university results.
RESULTS AND DISCUSSION
Following the stages of Schwab (1980), we first report on the scale development
stage (i.e., item analysis, factor analysis, and reliability) and then focus on the scale
evaluation stage (i.e., construct validity and criterion-related validity).
Scale development
Item analysis
The selected pool of 30 items was subjected to an initial process of item analysis.
As suggested by DeVellis (1991), we checked for each item the mean, standard deviation,
item-scale and item-total correlations, the average inter-item correlations, and Cronbach
alpha coefficients. Those items with an item–total correlation of more than 0.30 and a
reasonably high variance in response (standard deviation of more than 0.40) were
retained in the final questionnaire. Based upon these criteria, a total of 12 items were
discarded for further analyses.
14
In Table 3 and 4, item means, standard deviations, average inter-item correlations,
and corrected item-total correlations are reported for Study 1, 2, and 3.
Insert Table 3 & 4 about here
Factor analysis and reliability
In order to examine the factor structure of our items, the different studies were
subjected to a factor analytic procedure. Following the suggestion by Gerbing and
Hamilton (1996), a two-stage factor analysis was conducted (see Hurley et al., 1997).
Each sample was randomly split into two equal halves. One half was used for exploratory
factor analysis, using principal axis factoring with oblique (direct oblimen) rotation (Kim
& Mueller, 1978). The other half was used for cross-validation with confirmatory factor
analysis (AMOS) (Byrne, 2001). Factor parameters were estimated using the maximum
likelihood procedure. All constructs were allowed to correlate with each other.
Exploratory factor analysis (EFA). As suggested by several authors, various rules-
of-thumb were combined to decide on the number of factors that should be retained
(Kerlinger & Lee, 2000; Zwick & Vellicer, 1982, 1986). The extraction and retention of
factors in EFA was simultaneously based on examination of the scree plot (Cattell, 1966)
and the eigenvalues-greater-than-one criterion (Kaiser, 1960). The preliminary findings
of the pilot study were confirmed. In each study, three factors were retained, accounting
for 50 per cent of the variance in Study 1, 53 per cent in Study 2, and 49 per cent in Study
3. An additional examination of the inter-item correlation matrices also suggests a three-
factor-solution. The average inter-item correlations for the different scales are all higher
than 0.30 (Robinson, Shaver, & Wrightsman, 1991). In Table 3 and 4, factor loadings for
the items of the CoSI are reported. Items needed to have a primary factor loading of at
least 0.40 and no secondary loadings of more than 0.30 (Ford, MacCallum, & Tait, 1986).
Although item C7 in Table 4 loads only 0.36 on Factor 2, we decided to keep this item in
the questionnaire as it meets all other psychometric criteria. Factor 1 was labeled as the
planning style, Factor 2 as the creating style, and Factor 3 as the knowing style. People

15
with a planning style are characterized by a need for structure. Planners like to organize
and control, and prefer a well-structured work environment. They attach great importance
to preparation and planning in order to reach their objectives. They strongly want other
people to respect rules and agreements. People with a creating style tend to be creative
and like experimentation. They see problems as opportunities and challenges. They like
uncertainty and freedom. They prefer to think on a conceptual level and are less
interested in the practical implementation of ideas. People with a knowing style look for
facts and data. They want to know exactly the way things are, and tend to retain many
facts and details. They are task-oriented and accurate, and like complex problems if they
can find a clear and rational solution.
Confirmatory factor analysis (CFA). The purpose of CFA in scale development is
to confirm that prior analyses have been conducted thoroughly and appropriately. This
means assessing the quality of the factor structure by statistically testing the significance
of the overall model and of item loadings on factors (Hinkin, 1998). A myriad of fit
indices and as many criteria for determining good fit are at the researcher’s disposal to
choose from (MacCallum & Austin, 2000; Medsker, Williams, & Holohan, 1994). In
Table 5, several fit indices are reported for the three studies: chi-square and normed chi-
square statistics (Jöreskog, 1969), goodness-of-fit index (GFI; Jöreskog & Sörbom,
1989), root mean square residual (RMSR; Bollen, 1989), root mean square error of
approximation (RMSEA; Browne & Cudeck, 1993), adjusted goodness-of-fit index
(AGFI; Jöreskog & Sörbom, 1989), non-normed fit index (NNFI; Tucker & Lewis,
1973), and normed fit index (NFI; Bentler & Bonnett, 1980). A consensus on the
acceptability of a model should be based on examination of the results of all fit indices
(Hair, Anderson, Tatham, & Black, 1998). As sample size might affect fit indices used in
CFA (Guadagnoli & Velicer, 1988; Marsh, Balla, & McDonald, 1988), RMSR, RMSEA,
NNFI, and NFI are considered to be the most appropriate fit indices for our research
(Hair et al., 1998; Kline, 1998; MacCallum & Austin, 2000). Our sample sizes are
considerably large in the light of factor analytic procedures, which makes the chi-square
statistics less appropriate for model assessment (although we do report them for
completeness). Hu and Bentler (1998, 1999) also criticize the wide use of GFI and AGFI
in the structural equation modeling (SEM) literature, because they have been shown to be
16
heavily influenced by sample size (MacCallum & Austin, 2000). Although the evaluation
of fit indices is rather subjective and somewhat arbitrary, higher values often indicate a
better fit. Values above 0.90 for NNFI and NFI are usually considered indicative of a
good fit, although other sources mention a criterion of 0.85 or above as generally
acceptable (Hinkin, 1995). Table 5 reveals that not all values of NNFI and NFI meet the
criterion of 0.90, but all of them (with one exception) meet the criterion of 0.85. No real
threshold level can be established for RMSR (Hair et al., 1998), although a criterion of
0.05 or below is sometimes used (Patterson et al., 2005). Researchers need to evaluate the
value of RMSR in the light of their research objectives and the observed or actual
covariances or correlations. Values of RMSEA ranging from 0.05 to 0.08 indicate a good
fit. This criterion is met in all studies. Overall, we find a good fit for the CFA model and
therefore accept it.
Insert Table 5 about here
Reliability. The Cronbach alpha coefficient (Cronbach, 1951) was used as a proxy
for the internal consistency of our scales. Nunnally and Bernstein (1998) suggest that an
alpha coefficient of 0.70 is a minimally acceptable threshold. The results of the reliability
analysis indicate that in each of the studies this criterion is met for the different scales. A
Cronbach alpha coefficient of 0.73, 0.76, and 0.76 for the knowing style in Study 1, 2,
and 3 respectively was found. Cronbach alpha coefficients in the different studies are
0.81, 0.82, and 0.85 for the planning style and 0.79, 0.79, and 0.78 for the creating style.
Scale evaluation
Besides content validity and internal consistency, new measures need to
demonstrate construct and criterion-related validity (Clark & Watson, 1995; DeVellis,
1991; Hinkin, 1995, 1998).

17
Construct validity
To examine the construct validity of our theory and its related measure, it is
important to describe the relationship with conceptually similar and dissimilar constructs
to define a so-called ‘nomological network’ (Cronbach & Meehl, 1955). Cognitive styles
have been described as the ‘missing link’ between personality and cognition (Riding &
Rayner, 1998). Based on previous research that links cognitive styles with
aforementioned personality and cognition measures, we formulated a range of hypotheses
(Table 6).
Insert Table 6 about here
The resulting hypothesized relationships are grouped in three categories. The first
category contains those scales that are expected to be strongly related to the CoSI
subscales, being other cognitive style measures. As can be seen in Table 6, two
dimensions of the personality type theory are grouped in category 1. Previous research
with regard to cognitive styles and personality types concluded that the dimensions
Sensing–Intuiting and Judging–Perceiving are cognition oriented dimensions of the
MBTI, while Thinking–Feeling is considered to be an affect oriented dimension (i.e.,
taking an impersonal or a personal approach when judging) (Jacobson, 1993; Tullet &
Davies, 1997). The scales in the second category, being personality-related scales, are
expected to show less significant and weaker correlations with the CoSI subscales.
Cognitive styles are generally considered to be independent of, but interacting with
personality (Riding, 2000a). The third group comprises scales that in previous research
are found to be statistically not correlated with cognitive styles (i.e., affect-related scales
and ability).
Table 7 shows the correlations of the CoSI subscales with the other measures used
in our validation research. We highlight the most relevant results for each of the
categories from Table 6.

18
Insert Table 7 about here
Category 1. With regard to the first category, the hypothesized relationships are
to a large extent confirmed. The knowing (r = –0.28, p < 0.05) and the planning style (r =
–0.64, p < 0.01) were negatively correlated with the overall KAI score, while the creating
style (r = 0.64, p < 0.01) was positively correlated. People with a creating style tend to be
more innovation oriented and to restructure the situation while solving problems and
making decisions. People with a knowing and a planning style have a tendency to stay
within the existing structure when solving problems. While people with a creating style
tend to ‘do things differently’, people with a knowing and a planning style tend to ‘do
things better’ (Kirton, 1994). Furthermore, the knowing (r = 0.52, p < 0.01) and the
planning style (r = 0.25, p < 0.05) were positively correlated with the Rationality scale.
These results suggest that both the planning and the knowing style tend to operate within
the rational, analytic cognitive system. For the creating style, no significant correlation
was found with Rationality (r = 0.12, p = 0.31). Consequently, people with a creating
style will not be inclined to process information primarily in an analytical mode. With
regard to the Rationality subscales, we found a remarkable difference between the
knowing and the planning style. The knowing style correlated positively with both
Rational Ability (r = 0.49, p < 0.01) and Rational Engagement (r = 0.40, p < 0.01). The
planning style correlated positively with Rational Ability (r = 0.29, p < 0.05). However,
no significant correlation was found between the planning style and Rational Engagement
(r = 0.14, p = 0.24). This means that, although both styles have the ability to use the
rational thinking style, people with a knowing style will actually engage in this process.
Overall, our findings support the reasoning that the Sensing–Intuiting and the
Judging–Perceiving dimension of the MBTI are most relevant with regard to cognitive
styles, as these correlations are the highest of all four MBTI dimensions. A low, but
significant positive correlation was found between the knowing style (r = 0.12, p < 0.05)
and Sensing. People with a knowing style have great respect for facts. They have an
enormous capacity for details, make errors seldomly, and are good at demanding tasks.
The planning style was positively correlated with Sensing (r = 0.36, p < 0.01) and
19
negatively with Intuiting (r = –0.23, p < 0.01). People with a planning style like rules and
regulations, step-by-step explanations, and doing things the way they always have done.
The creating style was negatively correlated with Sensing (r = –0.43, p < 0.01) and
positively with Intuiting (r = 0.32, p < 0.01). People with a creating style prefer dynamic
structures and are constantly searching for hidden possibilities and new horizons.
Previous research on the link between KAI and MBTI found a strong positive correlation
between adaption and sensing on the one hand, and between innovation and intuiting on
the other hand (Gryskiewicz & Tullar, 1995; Jacobson, 1993). Beyler and Schmeck
(1992) also found that high scores on sensing related positively to measures of a proper,
rule-bound attitude. On the contrary, high scores on intuiting related to flexibility and
creativity. Finally, the knowing and the planning style correlated positively with Judging
(knowing style, r = 0.19, p < 0.01; planning style, r = 0.54, p < 0.01) and negatively with
Perceiving (knowing style, r = –0.15, p < 0.01; planning style, r = –0.55, p < 0.01).
People with a knowing style like to make decisions using a structured approach. They are
concerned with solving rational problems. People with a planning style like to work in a
planned, orderly way. They dislike ambiguity and prefer clarity and order. The creating
style correlated negatively with Judging (r = –0.38, p < 0.01) and positively with
Perceiving (r = 0.36, p < 0.01). People with a creating style like to work in a flexible and
spontaneous way. They can tolerate ambiguity and prefer to leave options open. Judging
was found to be related to orderliness, self-control, and a proper, rule-bound attitude,
while perceiving was related to measures of complexity, flexibility, and imagination
(Beyler & Schmeck, 1992). Gryskiewicz and Tullar (1995) found that perceiving types
are more likely to be innovators, while judging types are more likely to be adaptors.
Category 2. Examination of the results of the second category of hypothesized
relationships reveals less significant and weaker correlations, as expected. Overall, these
results confirm the idea that cognitive styles and personality are independent, but related
constructs. Early works within the cognitive style field refer to a ‘personality space’,
which is a conceptual space in which key bridging components of personality and
cognitive style are situated (Kirton & De Ciantis, 1986). This implies that not all
personality aspects will be related to cognitive styles, but only some key elements that
20
constitute the personality space. Only the knowing style showed a significant correlation
with Thinking (r = 0.15, p < 0.05). People with a knowing style prefer to judge based on a
logical, objective, and impersonal process. They prefer logical analysis and just decisions
based on standards and policies. Furthermore, the knowing style was positively correlated
with Introversion (r = 0.16, p < 0.01) and negatively with Extraversion (r = –0.22, p <
0.01). People with a knowing style feel comfortable when they can focus their attention
internally, to ideas and concepts. They prefer to take their time to integrate and assimilate
outside information. The creating style was positively correlated with Extraversion (r =
0.20, p < 0.01) and negatively with Introversion (r = –0.22, p < 0.01). People with a
creating style get their energy from their environment, from interacting with other people
and things. They like action and want to experience the world to understand it. Jacobson
(1993) also found a significant positive correlation between innovators and extraversion.
Only the knowing style showed a significant correlation with Agreeableness (r = –
0.25, p < 0.05). People with a knowing style are forthright and tend to be critical. In
addition, a significant positive correlation was found between the planning style (r = 0.57,
p < 0.01) and Conscientiousness. Planners are organized, self-disciplined, and reliable. A
significant negative correlation was found between the creating style (r = –0.36, p < 0.01)
and Conscientiousness. People with a creating style do not necessarily stick to a schedule
and tend to be flexible and disorganized. Furthermore, only the planning style showed a
significant correlation with Openness to Experience (r = –0.39, p < 0.01). People with a
planning style tend to be resistant to change, habit-bound, conventional, and closed to
new ideas. Kirton and De Ciantis (1986) also found a strong correlation between the
adaptor and a conservative trait, indicating a predisposition to stay within traditional
boundaries and conforming to past traditions and practices. Finally, a significant positive
correlation was found between the creating style (r = 0.19, p < 0.01) and Optimism. A
significant negative correlation was found between the planning style (r = –0.22, p <
0.01) and Optimism. People with a creating style see problems as challenges or
opportunities. They like uncertainty and believe in the positive outcome of their ideas.
Planners, on the other hand, have difficulty with unexpected changes, are self-critical,
and are inclined to think in terms of worst case scenarios.

21
Category 3. Finally, inspection of the results for the third category of
hypothesized relationships lends support to the independence of the cognitive style
construct from affect-related constructs and ability-related constructs.
Cognitive styles are considered to be conceptually different from affect (Kirton,
1994; Tullett & Davies, 1997). As hypothesized, none of the cognitive styles correlated
significantly with the Experientiality scale (knowing style, r = –0.20, p = 0.11; planning
style, r = –0.001, p = 0.99; creating style, r = 0.21, p = 0.08). Pacini and Epstein (1999)
report a significant positive relationship between Experientiality and emotional
expressivity, lending support to the reasoning that an experiential thinking style is related
to affect and emotionality (Epstein, 1994). In addition, no significant correlations were
found between any of the cognitive styles and Feeling (knowing style, r = –0.10, p =
0.10; planning style, r = –0.04, p = 0.52; creating style, r = 0.08, p = 0.18). Furthermore,
no significant correlation is found between people’s cognitive style and Emotional
Stability (knowing style, r = –0.01, p = 0.89; planning style, r = –0.07, p = 0.49; creating
style, r = 0.17, p = 0.11). Tullett (1997) also refers to zero correlations between the KAI
overall score and emotional stability.
Whether cognitive styles and ability are related or not has been the subject of
continuous debate between researchers in the cognitive style domain (Armstrong, 2000;
Furnham, 1995). Several theorists argue that cognitive style and intellectual abilities are
different in multiple and important ways (Kirton, 2003; Mudd, 1996; Riding & Rayner,
1998; Tullet, 1997). Other research did find relationships between cognitive styles and
ability (e.g., Allinson & Hayes, 1996; Federico & Landis, 1984; Isaksen & Puccio, 1988;
Tiedemann, 1989). However, Armstrong (2000) asserts that these studies did not
carefully consider the nature of the task that is used to measure ability, as some tasks
might favor one cognitive style over the other. In our study, no significant correlations
were found between people’s cognitive style and their overall academic performance
(knowing style, r = –0.01, p = 0.78; planning style, r = –0.08, p = 0.10; creating style, r =
–0.004, p = 0.93). Additionally, no significant correlations were found between people’s
cognitive style and their overall result on the business school’s admission test (knowing
style, r = 0.08, p = 0.07; planning style, r = 0.02, p = 0.65; creating style, r = 0.07, p =
0.10). These findings lend further support to the independence of cognitive styles and

22
ability. However, it might be useful for future research to investigate the possible
moderating effect of type of task on the cognitive style–cognition relationship. Although
people have a preferred or dominant cognitive style, their actual behavior and
performance is also influenced by the demands of the situation or task (Armstrong, 2000;
Spicer, 2004).
Conclusion. Overall, our results lend strong support for the construct validity of
the CoSI. When examining our findings, some results seem to suggest a bipolar
conceptualization of the three styles, with the knowing and the planning style on the
analytic pole and the creating style on the intuitive pole of the continuum. We found, for
instance, a positive correlation with the overall KAI score for the creating style
(indicating higher innovativeness) and a negative correlation for the knowing and the
planning style. Furthermore, the knowing and planning style correlated positively with
Judging and negatively with Perceiving. The creating style, however, showed a positive
correlation with Perceiving and a negative one with Judging. In addition, we found a
moderately high correlation between the knowing and the planning style (r = 0.38, p <
0.01). However, given the different correlations of the knowing and the planning style
with several of the other scales in our research and their different correlation with the
creating style (knowing style, r = –0.02, p = 0.62; planning style, r = –0.23, p < 0.01), we
find it more useful to distinguish between three cognitive styles, without calculating one
overall CoSI score like Allinson and Hayes (1996) or Kirton (1976).
Criterion-related validity
Criterion-related validity refers to the degree of correspondence of a measure with
some other accepted measure, being the criterion (Carmines & Zeller, 1979). Criterion-
related validity is not often assessed in organizational research, as it is not always
possible to find an adequate criterion to relate the scale with (Price, 1997). In the light of
the contemporary interest in person–organization fit (Kristof, 1996), we chose to look at
the relationship between people’s cognitive styles and some work-related characteristics.

23
If the CoSI has criterion-related validity, it should be capable of distinguishing between
groups that are considered to differ in their cognitive styles.
Hierarchical level. One possible difference is that between hierarchical levels.
Continuous debate in management literature has existed whether effective management is
better served by a rational, analytical approach or an intuitive, creative approach (Sadler-
Smith, 2004). Nowadays, intuition seems to be increasingly considered as an important
aspect of effective decision-making (Andersen, 2000; Khatri & Ng, 2000). Additionally,
a considerable number of scholars have stressed the necessity of integrating analytical
and intuitive cognitive styles in managerial work (e.g., Foxall & Hackett, 1994;
Mintzberg, 1994; Sinclair, Ashkanasy, Chattopadhyay, & Boyle, 2002). According to
Hodgkinson and Sparrow (2002), a combination of both styles is required to process
information, if individuals and organizations are to prosper and minimize the dangers of
cognitive biases identified by behavioral decision researchers. However, empirical
evidence for this assertion is scarce. Foxall (1986) found a rather intermediate position
for general management functions on the adaption–innovation continuum, indicating that
they are composed of both adaptive and innovative task subsets. Analysis of variance
(with post hoc Scheffé-test) in Study 1 (Table 8) revealed that people with a management
function score significantly higher on the knowing style (F2,5882 = 28.66, p < 0.01) and on
the creating style (F2,5882 = 34.33, p < 0.01) than clerical staff. This finding suggests that
contemporary managers use both a knowing and a creating style when processing
information and making decisions. Interestingly, no significant difference was found
between people on a management level and professionals for both the knowing and the
creating style. No significant difference was found between any of the hierarchical levels
with regard to the planning style.
Insert Table 8 about here

24
Industry and sector of employment. We did not find any significant differences
between industry of employment and cognitive styles in our research. This is probably
due to the fact that in each industry different types of functions and tasks need to be
performed, indicating there are several kinds of cognitive styles needed. Moreover,
Kirton (1980) emphasizes the importance of making a difference between internally
oriented and externally oriented jobs (even within the same functional specialization).
However, when we make a distinction between the profit and the non-profit sector in
Study 1, we found a significant higher score for the planning style in the non-profit sector
than in the profit sector (t3682 = –2.79, p < 0.01). The non-profit sector is often
government regulated, leading to more administrative requirements and regulations.
Apparently, this attracts more people with a planning style. No significant difference was
found for the knowing and the creating style in this regard.
Job and study choices. Another possible difference is that between several job
functions in organizations. Through selective recruitment and socialization a certain
cognitive climate can arise in organizations or parts of organizations (Kirton & De
Ciantis, 1994). In comparing mean scores for the different cognitive styles in Study 1 and
2 (Table 9), analysis of variance (with post hoc Scheffé-test) showed that people with a
financial function score significantly higher on the knowing style than people with a
function in sales and marketing, or personnel (Study 1, F2,2010 = 18.21, p < 0.01; Study 2,
F3,709 = 2.82, p < 0.05). Financial employees scored significantly lower on the creating
style than sales and marketing, or personnel employees (Study 1, F2,2010 = 18.48, p <
0.01). Interestingly, we also found that people with a function in personnel scored
significantly lower on the planning style than people in a sales and marketing function
(Study 1, F2,2010 = 4.11, p < 0.05). Our results are consistent with previous research that
concluded that people tend to select those professions that emphasize their preferred style
(e.g., Chan, 1996; Myers, McCaulley, Quenk, & Hammer, 2003). Agor (1985), for
instance, found a lower score on intuition for people in financial management and a
higher score for people in personnel management. Foxall (1986) found a higher score on
innovativeness for people in a marketing function and a lower score for people in an
accounting and financial function, indicating a more adaptive tendency. In this regard, we
looked at the profile of MBA students choosing an MBA focused on financial

25
management versus the ones choosing an MBA focused on marketing management
aspects. An independent samples T-test of study orientation in Study 3 indicated that the
financially oriented MBA students (N = 89) scored significantly higher on the knowing
style (t231 = –4.54, p < 0.01) than the marketing oriented MBA students (N = 144).
Additionally, analysis of variance (with post hoc Scheffé-test) indicated that students
with a previous degree in engineering (N = 140) scored significantly higher on the
knowing style than students with a background in economics (N = 249) and social
sciences (N = 57) (F2,443 = 3.14, p < 0.05). No significant differences were found for the
planning and the creating style.
Insert Table 9 about here
CONCLUSION
Given the relevance and usefulness of the cognitive style concept for
organizations, the objectives of this study were twofold. The first was to develop a
psychometrically sound instrument to measure cognitive styles in organizations. This
objective fits very well the call of Riding (2000b) to develop simple, valid, and direct
measures of cognitive style. Our validation process led to a reliable and valid
questionnaire. Our instrument is highly reliable, with Cronbach alpha coefficients ranging
from 0.73 to 0.85. CoSI has a clear factor structure, as examined in a two-stage factor
analytic procedure. Exploratory factor analysis suggested a three-factor solution
(knowing, planning, and creating style). Confirmatory factor analysis indicated adequate
fit for this three-factor model. Moreover, the questionnaire is particularly relevant for use
in organizations, given its length (18 items) and the short time required to complete it
(approximately 10 minutes). Good organizational measures not only have to be valid and
reliable, but also need practicality, this means being easy to administer and to interpret
(Cooper & Schindler, 2003).
26
Secondly, we wanted to find out whether reducing the large field of cognitive
styles theories to one bipolar cognitive style dimension is still warranted. Traditionally,
cognitive style research has focused mainly on the distinction between analytic and
intuitive thinking. However, empirical research on the relationship between different
cognitive style measures found that cognitive style is a complex variable with multiple
dimensions (Beyler & Schmeck, 1992; Bokoros & Goldstein, 1992; Bostic & Tallent-
Runnels, 1991). Therefore, Riding (2000b) refers to the desirability for cognitive style
research of recognizing and confirming the fundamental cognitive style dimensions
within the existing extensive body of style labels. The convergent, discriminant, and
predictive validity analyses in our research clearly indicate the relevance and usefulness
of identifying three cognitive styles rather than two. Overall, our findings support the
reasoning that it might be a valuable endeavor to distinguish between three different
cognitive styles, which initially stem from the traditional conceptualization of the bipolar
analytic–intuitive cognitive style dimension, however, without further situating them
conceptually on a single dimension. We rather see our three cognitive styles situated on a
conceptual triangle, as three independent unipolar scales. This way, we do not exclude
the possibility that people might show a preference for a combination of cognitive styles.
Reflecting on the results of the construct validity analysis, our three different
styles can be described as follows. The knowing style is empirically related with
Rationality (REI) and Thinking (MBTI), indicating a preference for logical, analytical,
and impersonal information processing. Theoretically, this style is rather similar to
existing conceptualizations of the analytic pole, like analysis in Allinson and Hayes’
theory (1996) or Riding’s (1991) analytic style. A significant correlation with the
adaptiveness pole of Kirton’s theory (1994) was also found. With regard to personality,
knowing types are introverts and tend to be rather critical and forthright. The planning
style is empirically related with the adaptiveness pole of Kirton (1994). A significant
negative correlation was established with the overall KAI score. According to Kirton
(1994), adaptors are characterized by the production of a relatively small number of
solutions to problems, a conventional approach to the improvement of efficiency, and
adherence to rules. Additionally, a significant positive correlation was reported between
the planning style and Sensing and Judging (MBTI). The planning style is also correlated
27
with Rationality (REI), although there is only a significant correlation with the Rational
Ability subscale and not with the Rational Engagement subscale. With regard to
personality aspects, planners are found to be very conscious people, who are rather
pessimistic, and not very open to experience. The creating style shows a strong
correlation with the innovator of Kirton’s theory (1994). Innovators proliferate ideas,
seek a broader realization of efficiency by proposing radical change, and are likely to
threaten or subvert the traditional and accepted framework of rules. A significant positive
correlation is found between the creating style and Intuiting and Perceiving (MBTI).
Theoretically, this style is related to existing conceptualizations of the intuitive pole, like
intuition in Allinson and Hayes’ theory (1996) or the innovativeness pole of Kirton
(1994). With regard to personality aspects, creating people are extraverts, tend to be
optimists, flexible, and rather disorganized.
Overall, our validation process indicates that cognitive styles are conceptually
different from ability and affect, and independent of, but interacting with personality.
None of the cognitive styles correlated significantly with Experientiality, Feeling,
Emotional Stability, and academic performance. These results lend strong support for the
construct validity of our theory and measure. The CoSI is found to be a valuable new
instrument to measure cognitive style differences. The unique contribution of our
research lies in the refinement of the analytic–intuitive cognitive style dimension and the
distinction between a knowing and a planning style.
With regard to predictive validity, our results indicate that cognitive style
differences might influence people’s study and job choice, and work-related behavior.
Significant differences in cognitive style profile are found for employees on different
hierarchical levels and in different functions. In addition, people’s sector of employment
also counts for differences in cognitive styles, as well as previous study choices.
Although the CoSI clearly has potential and may contribute to the continuation of
cognitive style research, some limitations of this research should be noted. The CoSI is a
self-reporting questionnaire, which implies that respondents can unduly influence the
result. A self-report measurement relies on respondents’ ability to introspect themselves
accurately and without notions of social desirability. The true test of an instrument’s
validity, however, will be to validate the data against objectively observable behavior
28
(Leonard et al., 1999). Riding (2000b) calls for establishing clear relationships between
style measures and real, objectively observable behavior, in contrast to introspective self-
report measures, to find clear and relevant applications for style. In this regard, the
instrument’s predictive validity can be further investigated by measuring people’s
cognitive styles in team and organizational contexts, for instance on the basis of 360°
feedback sessions. Furthermore, Riding (2000b) calls for future research on the
relationship between style and other individual difference constructs and measures that
may influence people’s behavior. To strengthen the construct validity of our cognitive
style model and instrument, it will be necessary to further investigate it in relation with
other theoretically similar and dissimilar concepts. In this regard, research on the
relationship of CoSI with other existing cognitive style models, learning style theories,
affect-related measures, dispositional personality factors, and intelligence-related
measures is highly relevant. Additionally, the link between cognitive styles and work-
related attitudes (e.g., loyalty, job satisfaction, intention to leave) and work performance
has not been studied very extensively yet. To increase the theoretical impact and practical
relevance of our cognitive style model and to take advantage of the limitations of this
study, such further research is necessary.

29
REFERENCES
Agor, W.H. (1985). Intuition as a brain skill in management. Public Personnel
Management, 14, 15–25.
Allinson, C.W., Chell, E., & Hayes, J. (2000). Intuition and entrepreneurial behavior.
European Journal of Work and Organizational Psychology, 9, 31–43.
Allinson, C.W., & Hayes, J. (1996). The Cognitive Style Index: a measure of intuition-
analysis for organizational research. Journal of Management Studies, 33, 119–135.
Andersen, J.A. (2000). Intuition in managers: are intuitive managers more effective?
Journal of Managerial Psychology, 15, 46–67.
Armstrong, S.J. (2000). The influence of cognitive style on performance in management
education. Educational Psychology, 20, 323–339.
Armstrong, S.J., & Priola, V. (2001). Individual differences in cognitive style and their
effects on task and social orientations of self-managed work teams. Small Group
Research, 32, 283–312.
Barnard, C.I. (1938). The Functions of the Executive. Cambridge: Harvard University
Press.
Bentler, P.M., & Bonnett, D.G. (1980). Significance tests and goodness-of-fit in the
analysis of covariance structures. Psychological Bulletin, 88, 588–606.
Beyler, J., & Schmeck, R.R. (1992). Assessment of individual differences in preferences
for holistic-analytic strategies: evaluation of some commonly available instruments.
Educational and Psychological Measurement, 52, 709–719.
Bokoros, M.A., & Goldstein, M.B. (1992). Common factors in five measures of cognitive
style. Current Psychology: Research & Reviews, 11, 99–109.
Bollen, K.A. (1989). Structural Equations with Latent Variables. New York: Wiley.

30
Bostic, J.Q., & Tallent-Runnels, M.K. (1991). Cognitive styles: a factor analysis of six
dimensions with implications for consolidation. Perceptual and Motor Skills, 72, 1299–
1306.
Bouckenooghe, D., Cools, E., Vanderheyden, K., & Van den Broeck, H. (2005). In search
for the heffalump: an exploration of cognitive style profiles among Flemish
entrepreneurs. Journal of Applied Management and Entrepreneurship, 10, 58–75.
Browne, M.W., & Cudeck, R. (1993). Alternative ways of assessing model fit. In K.A.
Bollen, & J.S. Long (Eds.), Testing Structural Equation Models (pp. 136–161). Newbury
Park: Sage.
Burke, W.W., & Trahant, W. (2000). Business Climate Shifts: Profiles of Change
Makers. Boston: Butterworth Heinemann.
Byrne, B.M. (2001). Structural Equation Modeling with AMOS: Basic Concepts,
Applications, and Programming. Mahwah: Lawrence Erlbaum Associates.
Campbell, D.T., & Fiske, D. (1959). Convergent and discriminant validation by the
multi-trait, multi-method matrix. Psychological Bulletin, 56, 81–105.
Carmines, E.G., & Zeller, R.A. (1979). Reliability and Validity Assessment. Newbury
Park: Sage.
Cascio, W.F. (1995). Whither industrial and organizational psychology in a changing
world of work? American Psychologist, 50, 928–939.
Cassidy, S. (2004). Learning styles: an overview of theories, models, and measures.
Educational Psychology, 24, 419–444.
Cattell, R.B. (1966). The scree test for the number of factors. Multivariate Behavioral
Research, 1, 245–276.
Chan, D. (1996). Cognitive misfit of problem-solving style at work: a facet of person-
organization fit. Organizational Behavior and Human Decision Processes, 68, 194–207.
31
Clark, L.A., & Watson, D. (1995). Constructing validity: basic issues in objective scale
development. Psychological Assessment, 7, 309–319.
Coffield, F., Moseley, D., Hall, E., & Ecclestone, K. (2004). Learning Styles and
Pedagogy in Post-16 Learning: A Systematic and Critical Review. London: Learning &
Skills Research Centre.
Conner, D.R. (1992). Managing at the Speed of Change: How Resilient Managers
Succeed and Prosper Where Others Fail. New York: Villard Books.
Cooper, D.R., & Schindler, P.S. (2003). Business Research Methods (eight edition). New
York: McGraw-Hill.
Cronbach, L.J. (1951). Coefficient α and the internal structure of tests. Psychometrika,
16, 297–335.
Cronbach, L.J., & Meehl, P.E. (1955). Construct validity in psychological tests.
Psychological Bulletin, 52, 281–302.
Denes-Raj, V., & Epstein, S. (1994). Conflict between intuitive and rational processing:
when people behave against their better judgment. Journal of Personality and Social
Psychology, 66, 819–829.
Desmedt, E., & Valcke, M. (2004). Mapping the learning styles jungle: an overview of
the literature based on citation analysis. Educational Psychology, 24, 445–464.
DeVellis, R.F. (1991). Scale Development: Theory and Applications. Newbury Park:
Sage.
Edwards, J.A., Lanning, K., & Hooker, K. (2002). The MBTI and social information
processing: an incremental validity study. Journal of Personality Assessment, 78, 432–
450.
Epstein, S. (1990). Cognitive-experiential self-theory. In L. Pervin (Ed.), Handbook of
Personality Theory and Research (pp. 165–192). New York: Guilford.

32
Epstein, S. (1994). Integration of the cognitive and psychodynamic unconscious.
American Psychologist, 49, 709–724.
Epstein, S., Pacini, R., Denes-Raj, V., & Heier, H. (1996). Individual differences in
intuitive-experiential and analytical-rational thinking styles. Journal of Personality and
Social Psychology, 71, 390–405.
Fandelova, E. (1999). Learning style and risk-taking tendency in university students.
Studia Psychologica, 41, 167–176.
Federico, P.A., & Landis, D.B. (1984). Cognitive styles, abilities, and aptitudes: are they
dependent or independent? Contemporary Educational Psychology, 9, 146–161.
Ford, J.K., MacCallum, R.C., & Tait, M. (1986). The application of exploratory factor
analysis in applied psychology: a critical review and analysis. Personnel Psychology, 39,
291–314.
Foxall, G.R. (1986). Managerial orientations of adaptors and innovators. Journal of
Managerial Psychology, 1, 24–28.
Foxall, G.R., & Hackett, P.M.W. (1992). The factor structure and construct validity of the
Kirton Adaption-Innovation Inventory. Personality and Individual Differences, 13, 967–
976.
Foxall, G.R., & Hackett, P.M.W. (1994). Styles of managerial creativity: a comparison of
adaption-innovation in the United Kingdom, Australia and the United States. British
Journal of Management, 5, 85–100.
Furnham, A. (1995). The relationship of personality and intelligence to cognitive learning
style and achievement. In D.H. Saklofske, & M. Zeidner (Eds.), International Handbook
of Personality and Intelligence (pp. 397–413). New York: Plenum Press.
Gallen, T. (1997). The cognitive style and strategic decisions of managers. Management
Decision, 35, 541–551.

33
Gardner, W.L., & Martinko, M.J. (1996). Using the Myers–Briggs Type Indicator to
study managers: a literature review and research agenda. Journal of Management, 22, 45–
83.
Gardner, R.W., Holzman, P., Klein, G., Linton, H., & Spence, D. (1959). Cognitive
control: a study of individual differences in cognitive behavior. Psychological Issues, 1,
Monograph 4.
Gerbing, D.W., & Hamilton, J.G. (1996). Viability of exploratory factor analysis as a
precursor to confirmatory factor analysis. Structural Equation Modeling, 3, 62–72.
Goldsmith, R.E. (1994). Creative style and personality theory. In M.J. Kirton (Ed.),
Adaptors and Innovators: Styles of Creativity and Problem Solving (pp. 34–50). New
York: Routledge.
Grigorenko, E.L., & Sternberg, R.J. (1995). Thinking styles. In D.H. Saklofske, & M.
Zeidner (Eds.), International Handbook of Personality and Intelligence (pp. 205–229).
New York: Plenum Press.
Gryskiewicz, N.D., & Tullar, W.L. (1995). The relationship between personality type and
creativity style among managers. Journal of Psychological Type, 32, 30–35.
Guadagnoli, E., & Velicer, W.F. (1988). Relation of sample size to the stability of
component patterns. Psychological Bulletin, 103, 265–275.
Guilford, J.P. (1967). The Nature of Human Intelligence. New York: McGraw-Hill.
Hair, J.F., Jr., Anderson, R.E., Tatham, R.L., & Black, W.C. (1998). Multivariate Data
Analysis. Upper Saddle River: Prentice-Hall.
Hayes, J., & Allinson, C.W. (1994). Cognitive style and its relevance for management
practice. British Journal of Management, 5, 53–71.

34
Hayes, J., Allinson, C.W., Hudson, R.S., & Keasey, K. (2003). Further reflections on the
nature of intuition-analysis and the construct validity of the Cognitive Style Index.
Journal of Occupational and Organizational Psychology, 76, 269–278.
Haynes, S.N., Richard, D.C.S., & Kubany, E.S. (1995). Content validity in psychological
assessment: a functional approach to concepts and methods. Psychological Assessment,
7, 238–247.
Herrmann, N. (1994). The Creative Brain (fifth edition). Lake Lure: Brain Books.
Hinkin, T.R. (1995). A review of scale development practices in the study of
organizations. Journal of Management, 21, 967–988.
Hinkin, T.R. (1998). A brief tutorial on the development of measures for use in survey
questionnaires. Organizational Research Methods, 1, 104–121.
Hodgkinson, G.P., & Sadler-Smith, E. (2003). Complex or unitary? A critique and
empirical re-assessment of the Allinson-Hayes Cognitive Style Index. Journal of
Occupational and Organizational Psychology, 76, 243–268.
Hodgkinson, G.P., & Sparrow, P.R. (2002). The Competent Organization: A
Psychological Analysis of the Strategic Management Process. Buckingham: Open
University Press.
Hodgkinson, G.P. (2003). The interface of cognitive and industrial, work and
organizational psychology. Journal of Occupational and Organizational Psychology, 76,
1–25.
Hough, J.R., & ogilvie, dt (2005). An empirical test of cognitive style and strategic
decision outcomes. Journal of Management Studies, 42, 417–448.
Hu, L., & Bentler, P.M. (1998). Fit indices in covariance structure modeling: sensitivity
to underparameterized model misspecification. Psychological Methods, 3, 424–453.
35
Hu, L., & Bentler, P.M. (1999). Cutoff criteria for fit indexes in covariance structure
analysis: conventional criteria versus new alternatives. Structural Equation Modeling, 6,
1–55.
Hunt, R.G., Krzystofiak, F.J., Meindl, J.R., & Yousry, A.M. (1989). Cognitive style and
decision making. Organizational Behavior and Human Decision Processes, 44, 436–453.
Hurley, A.E., Scandura, T.A., Schriesheim, C.A., Brannick, M.T., Seers, A., Vandenberg,
R.J., & Williams, L.J. (1997). Exploratory and confirmatory factor analysis: guidelines,
issues, and alternatives. Journal of Organizational Behavior, 18, 667–683.
Isaksen, S.G., & Puccio, G.J. (1988). Adaption-innovation and the Torrance test of
creative thinking: the level-style issue revisited. Psychological Reports, 63, 659–670.
Jacobson, C.M. (1993). Cognitive styles of creativity: relations of scores on the Kirton
Adaption-Innovation Inventory and the Myers-Briggs Type Indicator among managers in
the USA. Psychological Reports, 72, 1131–1138.
Jarzabkowski, P., & Searle, R.H. (2004). Harnessing diversity and collective action in the
top management team. Long Range Planning, 37, 399–419.
Jöreskog, K.G. (1969). A general approach to confirmatory maximum likelihood factor
analysis. Psychometrika, 34, 183–202.
Jöreskog, K.G., & Sörbom, D. (1989). LISREL 7: A Guide to the Program and
Applications. Chicago: Scientific Software.
Kagan, J. (1965). Individual differences in the resolution of response uncertainty. Journal
of Personality and Social Psychology, 2, 154–160.
Kaiser, H.F. (1960). The application of electronic computers to factor analysis.
Educational and Psychological Measurement, 20, 141–151.
Kerlinger, F.N., & Lee, H.B. (2000). Foundations of Behavioral Research (fourth
edition). Fort Worth: Harcourt College Publishers
36
Khatri, N., & Ng, H.A. (2000). The role of intuition in strategic decision making. Human
Relations, 53, 57-86.
Kim, J. O., & Mueller, C.W. (1978). Factor Analysis: Statistical Methods and Practical
Issues. Beverly Hills: Sage.
Kirton, M. (1976). Adaptors and innovators: a description and measure. Journal of
Applied Psychology, 61, 622–629.
Kirton, M. (1980). Adaptors and innovators in organizations. Human Relations, 33, 213–
224.
Kirton, M.J. (Ed.). (1994). Adaptors and Innovators: Styles of Creativity and Problem
Solving. New York: Routledge.
Kirton, M. J. (2003). Adaption-Innovation in the Context of Diversity and Change.
London: Routledge.
Kirton, M.J., & De Ciantis, S.M. (1986). Cognitive style and personality: the Kirton
Adaption-Innovation and Cattell's Sixteen Personality Factor Inventories. Personality and
Individual Differences, 7, 141–146.
Kirton, M.J., & De Ciantis, S.M. (1994). Cognitive style in organizational climate. In M.
J. Kirton (Ed.), Adaptors and Innovators: Styles of Creativity and Problem Solving (pp.
72–90). New York: Routledge.
Kline, R.B. (1998). Principles and Practice of Structural Equation Modeling. New York:
The Guilford Press.
Kristof, A.L. (1996). Person-organization fit: an integrative review of its
conceptualizations, measurements, and implications. Personnel Psychology, 49, 1–49.
Leonard, N.H., Scholl, R.W., & Kowalski, K.B. (1999). Information processing style and
decision making. Journal of Organizational Behavior, 20, 407–420.

37
MacCallum, R.C., & Austin, J.T. (2000). Applications of structural equation modeling in
psychological research. In S. T. Fiske, D. L. Schacter, C. Zahn-Waxler (Eds.), Annual
Review of Psychology (pp. 201–226). Palo Alto: Annual Reviews.
Marsh, H.W., Balla, J.R., & McDonald, R.P. (1988). Goodness-of-fit indixes in
confirmatory factor analysis: the effect of sample size. Psychological Bulletin, 103, 391–
410.
Medsker, G.L., Williams, L.J., & Holohan, P.J. (1994). A review of current practices for
evaluating causal models in organizational behavior and human resources management
research. Journal of Management, 20, 439–464.
Messick, S. (1984). The nature of cognitive styles: problems and promises in educational
practice. Educational Psychologist, 19, 59–74.
Miller, A. (1991). Personality types, learning styles and educational goals. Educational
Psychology, 11, 217–238.
Mintzberg, H. (1994). The Rise and Fall of Strategic Planning. New York: Prentice Hall.
Most, R.B., & Zeidner, M. (1995). Constructing personality and intelligence instruments:
methods and instruments. In D.H. Saklofse, & M. Zeidner (Eds.), International Handbook
of Personality and Intelligence (pp. 475–503). New York: Plenum Press.
Mudd, S. (1995). Kirton Adaption-Innovation theory: organizational implications.
Technovation, 15, 165–175.
Mudd, S. (1996). Kirton’s A-I theory: evidence bearing on the style/level and factor
composition issues. British Journal of Psychology, 87, 241–254.
Myers, I.B., McCaulley, M.H., Quenk, N.L., & Hammer, A.L. (2003). MBTI Manual: A
Guide to the Development and Use of the Myers-Briggs Type Indicator. Palo Alto:
Consulting Psychologists Press.

38
Myers, P.B., & Myers, K.D. (1998). Myers-Briggs Type Indicator (European English
edition). Palo Alto: Consulting Psychologists Press.
Nickerson, R., Perkins, D., & Smith, E. (1985). The Teaching of Thinking. Hillsdale:
Lawrence Erlbaum Associates.
Nunnally, J.C., & Bernstein, I.H. (1998). Psychometric Theory (third edition). New York:
McGraw-Hill.
Pacini, R, & Epstein, S. (1999). The relation of rational and experiential information
processing styles to personality, basic beliefs and the ratio-bias phenomenon. Journal of
Personality and Social Psychology, 76, 972–987.
Pask, G., & Scott, B.C.E. (1972). Learning strategies and individual competence.
International Journal of Man-Machine Studies, 4, 217–253.
Patterson, M.G., West, M.A., Shackleton, V.J., Dawson, J.F., Lawthon, R., Maitlis, S.,
Robinson, D.L., & Wallace, A.M. (2005). Validating the organizational climate measure:
links to managerial practices, productivity and innovation. Journal of Organizational
Behavior, 26, 379–408.
Power, S.J., Kummerow, J.M., & Lundsten, L.L. (1999). A Herrmann Brain Dominance
profile analysis of the sixteen MBTI types in a sample of MBA students. Journal of
Psychological Type, 49, 27–36.
Price, J.L. (1997). Handbook of organizational measurement. International Journal of
Manpower, 18, 305–558.
Rayner, S., & Riding, R.J. (1997). Towards a categorization of cognitive styles and
learning styles. Educational Psychology, 17, 5–27.
Riding, R.J. (1991). Cognitive Styles Analysis. Birmingham: Learning and Training
Technology.
Riding, R.J. (1997). On the nature of cognitive style. Educational Psychology, 17, 29–49.

39
Riding, R.J. (2000a). Cognitive style: a review. In R.J. Riding, & S.G. Rayner (Eds.),
International Perspectives on Individual Differences. Volume 1: Cognitive Styles (pp.
315–344). Stamford: Ablex Publishing Corporation.
Riding, R.J. (2000b). Cognitive style: a strategic approach for advancement. In R.J.
Riding, & S.G. Rayner (Eds.), International Perspectives on Individual Differences.
Volume 1: Cognitive Styles (pp. 365–377). Stamford: Ablex Publishing Corporation.
Riding, R., & Agrell, T. (1997). The effect of cognitive style and cognitive skills on
school subject performance. Educational Studies, 23, 311–323.
Riding, R., Burton, D., Rees, G., & Sharratt, M. (1995). Cognitive style and personality
in 12-year-old children. British Journal of Educational Psychology, 65, 113–124.
Riding, R., & Cheema, I. (1991). Cognitive styles: an overview and integration.
Educational Psychology, 11, 193–215.
Riding, R., & Pearson, F. (1994). The relationship between cognitive style and
intelligence. Educational Psychology, 14, 413–425.
Riding, R., & Rayner, S. (1998). Cognitive Styles and Learning Strategies:
Understanding Style Differences in Learning and Behaviour. London: David Fulton
Publishers.
Riding, R.J., & Wigley, S. (1997). The relationship between cognitive style and
personality in further education students. Personality and Individual Differences, 23,
379–389.
Robinson, J.P., Shaver, P.R., & Wrightsman, L.S. (1991). Criteria for scale selection and
evaluation. In J.P. Robinson, P.R. Shaver, & L.S. Wrightsman (Eds.), Measures of
Personality and Social Psychological Attitudes (pp. 1–16). San Diego: Academic Press.
Sadler-Smith, E. (1998). Cognitive style: some human resource implications for
managers. International Journal of Human Resource Management, 9, 185–202.
40
Sadler-Smith, E. (2004). Cognitive style and the management of small and medium-sized
enterprises. Organization Studies, 25, 155–181.
Sadler-Smith, E., & Badger, B. (1998). Cognitive style, learning and innovation.
Technology Analysis and Strategic Management, 10, 247–265.
Sarmany, I. (1992). Optimism and cognitive style. Studia Psychologica, 34, 261–267.
Scheier, M.F., & Carver, C.S. (1985). Optimism, coping, and health: assessment and
implications of generalized outcome expectancies. Health Psychology, 4, 219–247.
Scheier, M.F., Carver, C.S., & Bridges, M.W. (1994). Distinguishing optimism from
neuroticism (and trait anxiety, self-mastery, and self-esteem): a reevaluation of the Life
Orientation Test. Journal of Personality and Social Psychology, 67, 1063–1078.
Schwab, D.P. (1980). Construct validity in organizational behavior. In B.M. Staw, & L.L.
Cummings (Eds.). Research in Organizational Behavior (Vol. 2, pp. 3–43). Greenwich:
JAI Press.
Shipman, K.S., & Shipman, V.C. (1985). Cognitive styles: some conceptual,
methodological and applied issues. In E.E. Gordon (Ed.). Review of Research in
Education (Vol. 12, pp. 199–210. Washington: American Educational Research
Association.
Sinclair, M., Ashkanasy, N.M., Chattopadhyay, P., & Boyle, M.V. (2002). Determinants
of intuitive decision-making in management: the moderating role of affect. In N.M.
Ashkanasy, W. Zerbe, & C.E.J. Härtel (Eds). Managing Emotions in the Workplace
(pp.143–163). Armonk: M.E. Sharpe.
Spicer, D. (2004). The Impact of Approaches to Learning and Cognition on Academic
Performance in Business and Management. Working Paper Series, Bradford University
School of Management, February 2004, Working Paper No 04/03.
Sternberg, R.J. (1997). Thinking Styles. New York: Cambridge University Press.
41
Sternberg, R.J., & Grigorenko, E.L. (1997). Are cognitive styles still in style? American
Psychologist, 52, 700–712.
Taggart, W., & Robey, D. (1981). Minds and managers: on the dual nature of human
information processing and management. Academy of Management Review, 6, 187–195.
Taylor, W.G.K. (1989). The Kirton Adaption-Innovation Inventory: should the subscales
be orthogonal? Personality and Individual Differences, 9, 921–929.
Tiedemann, J. (1989). Measures of cognitive styles: a critical review. Educational
Psychologist, 24, 261–275.
Tinajero, C., & Paramo, M.F. (1998). Field dependence-independence cognitive style and
academic achievement: a review of research and theory. European Journal of Psychology
of Education, 13, 227-253.
Tucker, L.R., & Lewis, C. (1973). The reliability coefficient for maximum likelihood
factor analysis. Psychometrika, 38, 1–10.
Tullett, A.D. (1997). Cognitive style: not culture’s consequence. European Psychologist,
2, 258–267.
Tullett, A.D., & Davies, G.B. (1997). Cognitive style and affect: a comparison of the
Kirton Adaption-Innovation and Schutz’s Fundamental Interpersonal Relations
Orientation-Behaviour Inventories (KAI and FIRO-B). Personality and Individual
Differences, 23, 479–485.
Volkema, R.J., & Gorman, R.H. (1998). The influence of cognitive-based group
composition on decision-making process and outcome. Journal of Management Studies,
35, 105–121.
Witkin, H.A. (1962). Psychological Differentiation: Studies of Development. New York:
Wiley.

42
Witkin, H. A., Moore, C. A., Goodenough, D. R., & Cox, P. W. (1977). Field-Dependent
and field-independent cognitive styles and their educational implications. Review of
Educational Research, 47, 1–64.
Woods, S.A., & Hampson, S.E. (2005). Measuring the big five with single items using a
bipolar response scale. European Journal of Personality, 19, 373-390.
Zwick, W.R., & Velicer, W.F. (1982). Factors influencing four rules for determining the
numbers of components to retain. Multivariate Behavioral Research, 17, 253–269.
Zwick, W.R., & Velicer, W.F. (1986). Comparison of five rules for determining the
number of components to retain. Psychological Bulletin, 99, 432–442.
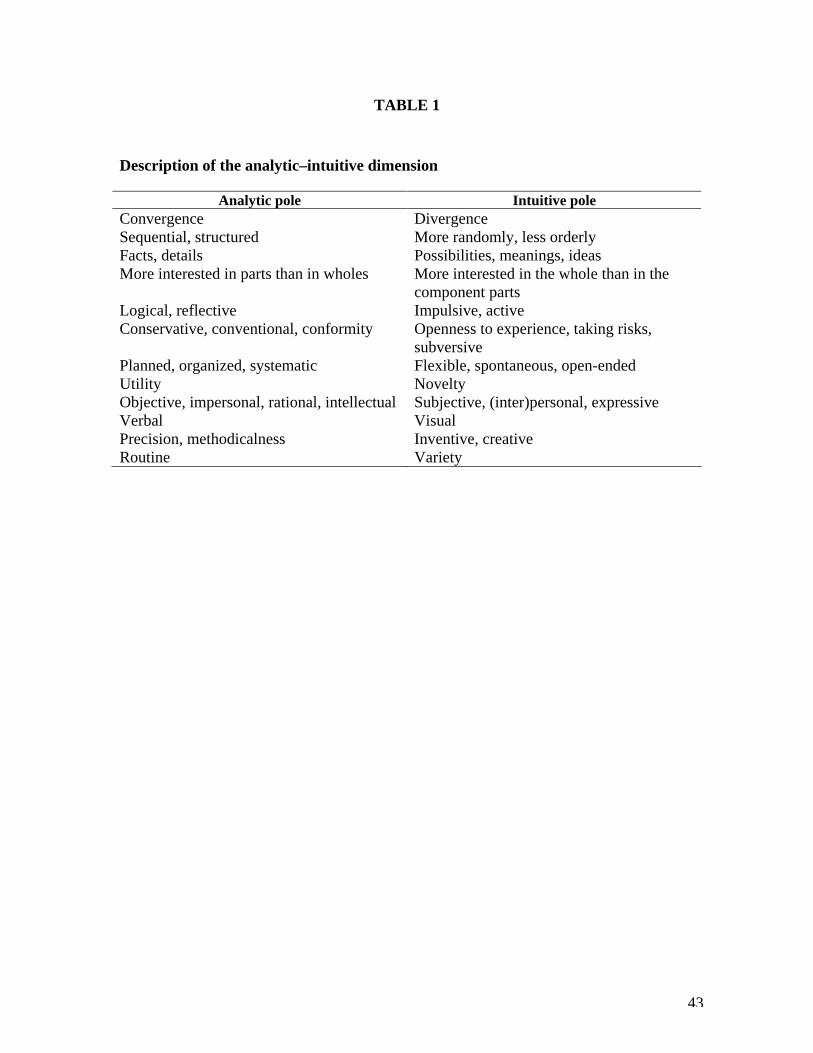
43
TABLE 1
Description of the analytic–intuitive dimension
Analytic pole Intuitive pole Convergence Divergence Sequential, structured More randomly, less orderly Facts, details Possibilities, meanings, ideas More interested in parts than in wholes More interested in the whole than in the
component parts Logical, reflective Impulsive, active Conservative, conventional, conformity Openness to experience, taking risks,
subversive Planned, organized, systematic Flexible, spontaneous, open-ended Utility Novelty Objective, impersonal, rational, intellectual Subjective, (inter)personal, expressive Verbal Visual Precision, methodicalness Inventive, creative Routine Variety
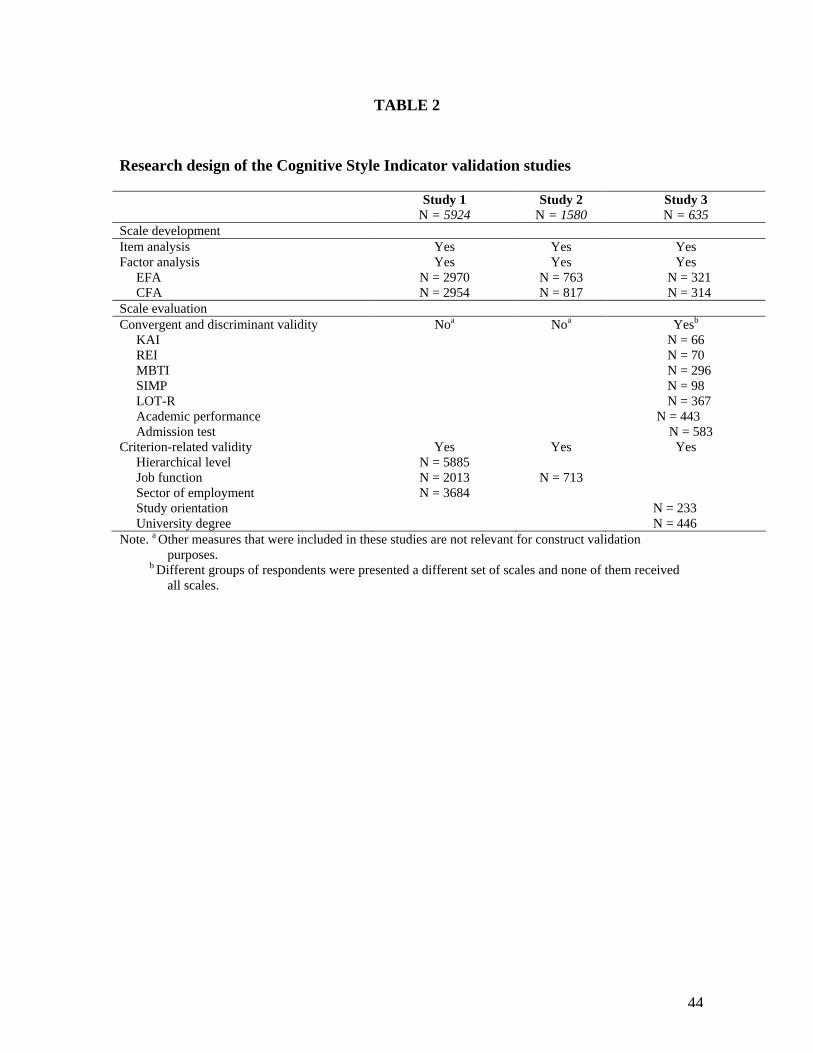
44
TABLE 2
Research design of the Cognitive Style Indicator validation studies
Study 1 Study 2 Study 3 N = 5924 N = 1580 N = 635 Scale development Item analysis Yes Yes Yes Factor analysis Yes Yes Yes EFA N = 2970 N = 763 N = 321 CFA N = 2954 N = 817 N = 314 Scale evaluation Convergent and discriminant validity Noa Noa Yesb KAI N = 66 REI N = 70 MBTI N = 296 SIMP N = 98 LOT-R N = 367 Academic performance N = 443 Admission test N = 583 Criterion-related validity Yes Yes Yes Hierarchical level Job function Sector of employment Study orientation University degree
N = 5885 N = 2013 N = 3684
N = 713
N = 233 N = 446
Note. a Other measures that were included in these studies are not relevant for construct validation purposes.
b Different groups of respondents were presented a different set of scales and none of them received all scales.
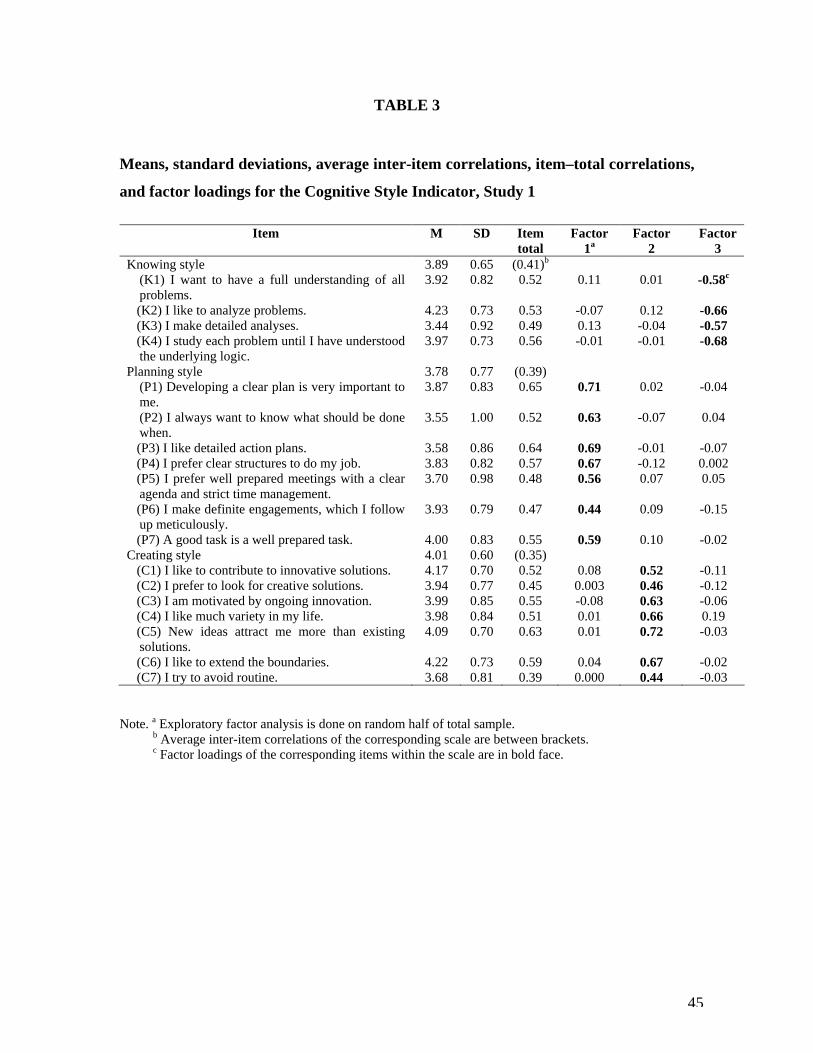
45
TABLE 3
Means, standard deviations, average inter-item correlations, item–total correlations,
and factor loadings for the Cognitive Style Indicator, Study 1
Item M SD Item
total Factor
1a Factor
2 Factor
3 Knowing style
(K1) I want to have a full understanding of all problems.
3.89 3.92
0.65 0.82
(0.41)b
0.52
0.11
0.01
-0.58c
(K2) I like to analyze problems. 4.23 0.73 0.53 -0.07 0.12 -0.66 (K3) I make detailed analyses. 3.44 0.92 0.49 0.13 -0.04 -0.57 (K4) I study each problem until I have understood
the underlying logic. 3.97 0.73 0.56 -0.01 -0.01 -0.68
Planning style 3.78 0.77 (0.39) (P1) Developing a clear plan is very important to me.
3.87 0.83 0.65 0.71 0.02 -0.04
(P2) I always want to know what should be done when.
3.55 1.00 0.52 0.63 -0.07 0.04
(P3) I like detailed action plans. 3.58 0.86 0.64 0.69 -0.01 -0.07 (P4) I prefer clear structures to do my job. 3.83 0.82 0.57 0.67 -0.12 0.002 (P5) I prefer well prepared meetings with a clear
agenda and strict time management. 3.70 0.98 0.48 0.56 0.07 0.05
(P6) I make definite engagements, which I follow up meticulously.
3.93 0.79 0.47 0.44 0.09 -0.15
(P7) A good task is a well prepared task. 4.00 0.83 0.55 0.59 0.10 -0.02 Creating style (C1) I like to contribute to innovative solutions.
4.01 4.17
0.60 0.70
(0.35) 0.52
0.08
0.52
-0.11
(C2) I prefer to look for creative solutions. 3.94 0.77 0.45 0.003 0.46 -0.12 (C3) I am motivated by ongoing innovation. 3.99 0.85 0.55 -0.08 0.63 -0.06 (C4) I like much variety in my life. 3.98 0.84 0.51 0.01 0.66 0.19 (C5) New ideas attract me more than existing
solutions. 4.09 0.70 0.63 0.01 0.72 -0.03
(C6) I like to extend the boundaries. 4.22 0.73 0.59 0.04 0.67 -0.02 (C7) I try to avoid routine. 3.68 0.81 0.39 0.000 0.44 -0.03
Note. a Exploratory factor analysis is done on random half of total sample. b Average inter-item correlations of the corresponding scale are between brackets. c Factor loadings of the corresponding items within the scale are in bold face.

46
TABLE 4
Means, standard deviations, average inter-item correlations, item–total correlations,
and factor loadings for the Cognitive Style Indicator, Study 2 and 3
Study 2 Study 3 M SD Item
total Factor
1a Factor
2 Factor
3 M SD Item
total Factor
1 Factor
2 Factor
3 Kb 4.06 0.96 (0.45)c 3.79 0.79 (0.45)
K1 4.11 1.03 0.50 0.03 0.01 -0.56d 3.84 0.91 0.54 -0.07 0.03 -0.60 K2 4.15 0.93 0.65 -0.10 -0.01 -0.90 3.87 0.84 0.61 0.07 -0.02 -0.66 K3 3.74 1.07 0.53 0.14 -0.04 -0.61 3.35 0.96 0.54 0.25 0.03 -0.53 K4 4.26 0.88 0.58 -0.01 0.09 -0.69 4.08 0.84 0.56 0.001 -0.02 -0.63 P 3.81 1.16 (0.40) 3.58 0.95 (0.44)
P1 4.17 0.94 0.60 0.70 0.10 -0.04 3.72 0.95 0.73 0.70 -0.03 -0.17 P2 3.38 1.25 0.47 0.54 -0.09 0.03 3.39 1.07 0.56 0.59 0.03 0.01 P3 3.67 1.11 0.67 0.77 -0.02 -0.04 3.31 0.96 0.70 0.74 -0.01 -0.03 P4 3.82 1.03 0.59 0.67 -0.03 0.03 3.54 1.01 0.64 0.56 -0.19 -0.08 P5 3.74 1.17 0.53 0.64 0.03 0.06 3.97 0.93 0.54 0.63 -0.001 -0.04 P6 3.93 0.97 0.53 0.62 0.06 -0.07 3.56 0.94 0.53 0.44 -0.03 -0.20 P7 3.92 1.02 0.55 0.65 -0.02 -0.08 3.60 0.98 0.54 0.67 -0.01 0.15 C 4.16 0.80 (0.36) 4.09 0.62 (0.34)
C1 4.37 0.80 0.48 0.12 0.53 -0.13 4.14 0.74 0.47 0.24 0.59 0.07 C2 3.95 0.99 0.47 -0.03 0.52 -0.08 3.87 0.87 0.52 -0.07 0.57 -0.003 C3 4.13 0.93 0.58 0.02 0.69 0.04 4.08 0.76 0.63 -0.05 0.71 0.01 C4 4.29 0.89 0.49 -0.02 0.62 0.09 4.51 0.62 0.44 -0.06 0.49 0.05 C5 4.33 0.78 0.66 0.04 0.81 0.04 4.08 0.81 0.56 -0.10 0.61 -0.11 C6 4.34 0.79 0.60 0.01 0.70 -0.05 4.22 0.78 0.49 -0.01 0.61 -0.13 C7 3.72 1.04 0.42 -0.07 0.50 -0.02 3.72 0.91 0.40 -0.04 0.36 0.04
Note. a Exploratory factor analysis is done on random half of total sample. b K = knowing style; P = planning style; C = creating style c Average inter-item correlations of the corresponding scale are between brackets. d Factor loadings of the corresponding items within the scale are in bold face.

47
TABLE 5 AMOS fit indices for confirmatory factor analysis, Study 1, 2, and 3
Fit indices Study 1 N = 2954
Study 2 N = 817
Study 3 N = 314
Absolute fit measures Chi-square (χ²) of estimated model Degrees of freedom (df) Significance level (p)
1388.62 132
0.000
657.19 132
0.000
372.64 132
0.000 Normed chi-square (χ²/df) 10.52 4.98 2.82 Goodness-of-fit index (GFI) 0.948 0.915 0.880 Root mean square residual (RMSR) 0.033 0.069 0.057 Root mean square error of approximation (RMSEA) p-value of close fit (RMSEA < 0.05)
0.057
0.000
0.070
0.000
0.076
0.000 Incremental fit measures Adjusted goodness-of-fit index (AGFI) 0.933 0.890 0.845 Tucker-Lewis index (TLI) or NNFI 0.901 0.888 0.860 Normed fit index (NFI) 0.906 0.882 0.826 Note. RMSR, RMSEA, NNFI, and NFI are considered to be the most appropriate fit indices for our study.
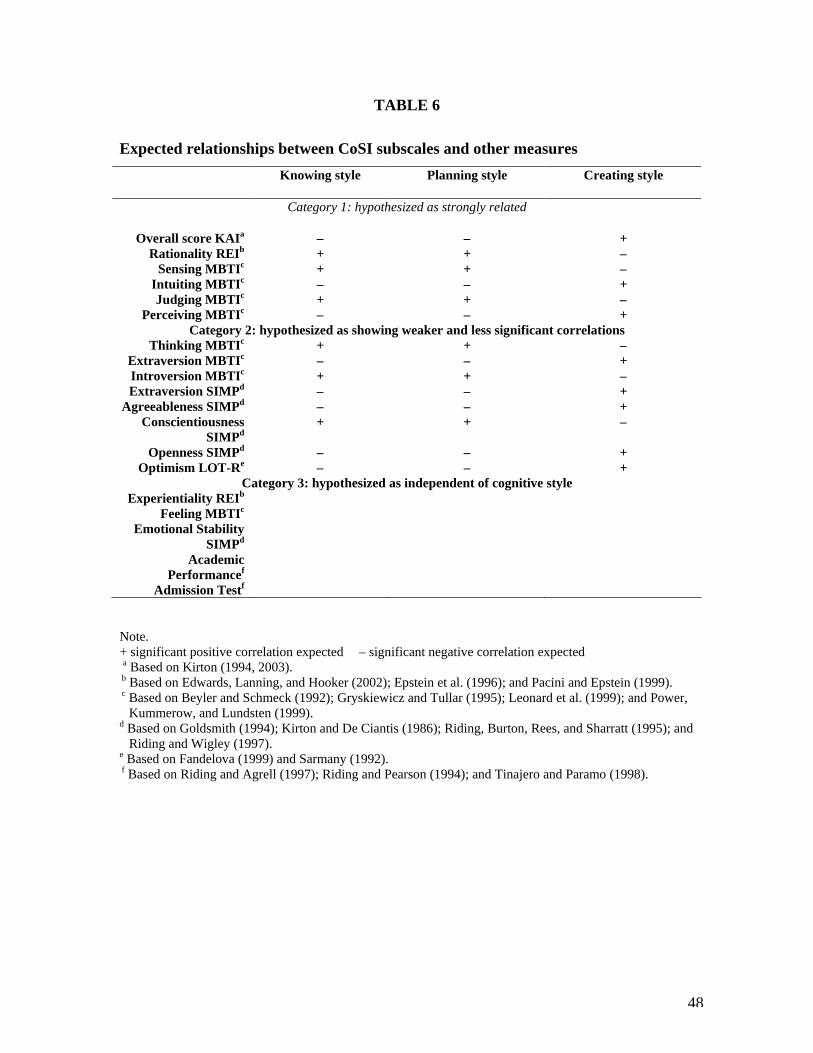
48
TABLE 6
Expected relationships between CoSI subscales and other measures
Knowing style Planning style Creating style
Category 1: hypothesized as strongly related
Overall score KAIa – – + Rationality REI b + + –
Sensing MBTIc + + – Intuiting MBTI c – – + Judging MBTI c + + –
Perceiving MBTIc – – + Category 2: hypothesized as showing weaker and less significant correlations
Thinking MBTI c + + – Extraversion MBTI c – – + Introversion MBTI c + + – Extraversion SIMPd – – +
Agreeableness SIMPd – – + Conscientiousness
SIMPd + + –
Openness SIMPd – – + Optimism LOT-R e – – +
Category 3: hypothesized as independent of cognitive style Experientiality REI b
Feeling MBTIc Emotional Stability
SIMPd
Academic Performancef
Admission Testf Note. + significant positive correlation expected – significant negative correlation expected
a Based on Kirton (1994, 2003). b Based on Edwards, Lanning, and Hooker (2002); Epstein et al. (1996); and Pacini and Epstein (1999).
c Based on Beyler and Schmeck (1992); Gryskiewicz and Tullar (1995); Leonard et al. (1999); and Power, Kummerow, and Lundsten (1999).
d Based on Goldsmith (1994); Kirton and De Ciantis (1986); Riding, Burton, Rees, and Sharratt (1995); and Riding and Wigley (1997).
e Based on Fandelova (1999) and Sarmany (1992).
f Based on Riding and Agrell (1997); Riding and Pearson (1994); and Tinajero and Paramo (1998).

49
TABLE 7
Pearson product–moment correlations between CoSI subscales and other measures
Knowing style Planning style Creating style
Category 1: hypothesized as strongly related Overall score KAI -0.28
*
-0.64**
0.64**
Rationality REI 0.52**
0.25**
0.12
Sensing MBTI 0.12*
0.36**
-0.43**
Intuiting MBTI -0.04 -0.23**
0.32**
Judging MBTI 0.19**
0.54**
-0.38**
Perceiving MBTI -0.15**
-0.55**
0.36**
Category 2: hypothesized as showing weaker and less significant correlations Thinking MBTI 0.15
*
0.06 -0.11
Extraversion MBTI -0.22**
-0.05 0.20**
Introversion MBTI 0.16**
0.11 -0.22**
Extraversion SIMP -0.08 -0.19 0.24*
Agreeableness SIMP -0.25*
-0.11 -0.10
Conscientiousness SIMP 0.19 0.57**
-0.36**
Openness SIMP -0.08 -0.39**
0.14
Optimism LOT-R -0.04 -0.22**
0.19**
Category 3: hypothesized as independent of cognitive style Experientiality REI -0.20 -0.001 0.21
Feeling MBTI -0.10 -0.04 0.08
Emotional Stability SIMP -0.01 -0.07 0.17
Academic Performance -0.01 -0.08 -0.004
Admission Test 0.08 0.02 0.07
Note. *p < 0.05; **p < 0.01; two-tailed
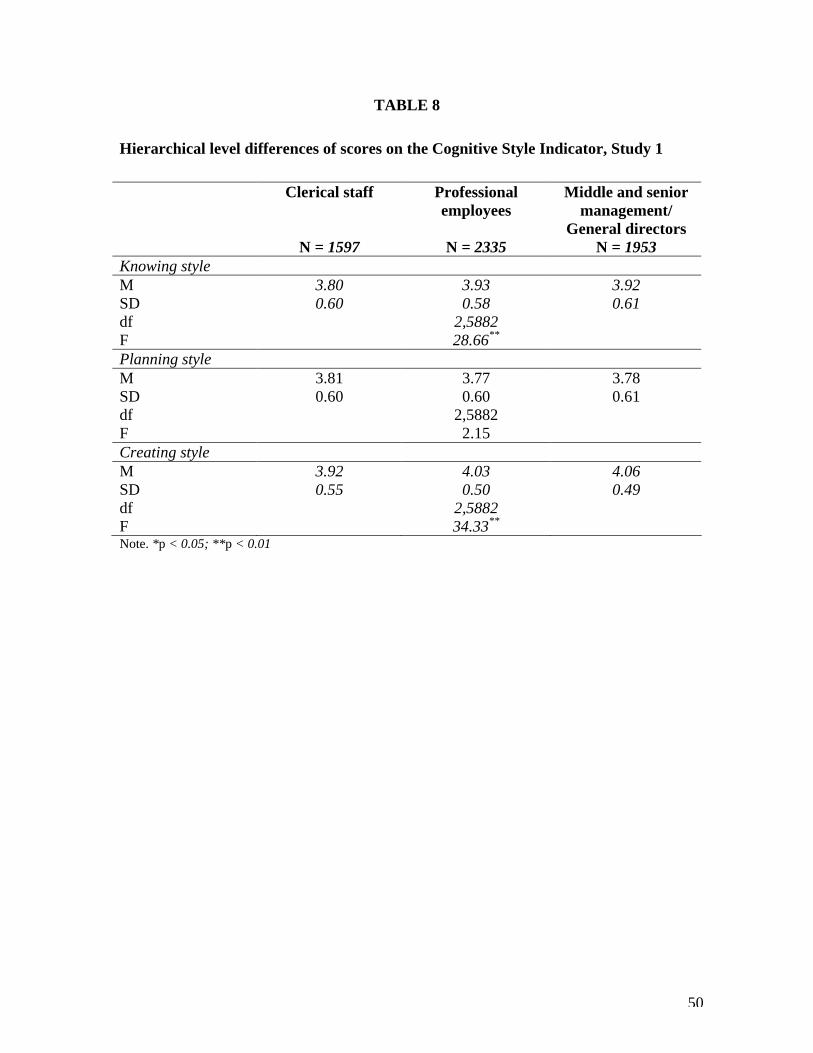
50
TABLE 8
Hierarchical level differences of scores on the Cognitive Style Indicator, Study 1
Clerical staff
N = 1597
Professional employees
N = 2335
Middle and senior management/
General directors N = 1953
Knowing style M 3.80 3.93 3.92 SD 0.60 0.58 0.61 df 2,5882 F 28.66** Planning style M 3.81 3.77 3.78 SD 0.60 0.60 0.61 df 2,5882 F 2.15 Creating style M 3.92 4.03 4.06 SD 0.55 0.50 0.49 df 2,5882 F 34.33** Note. *p < 0.05; **p < 0.01
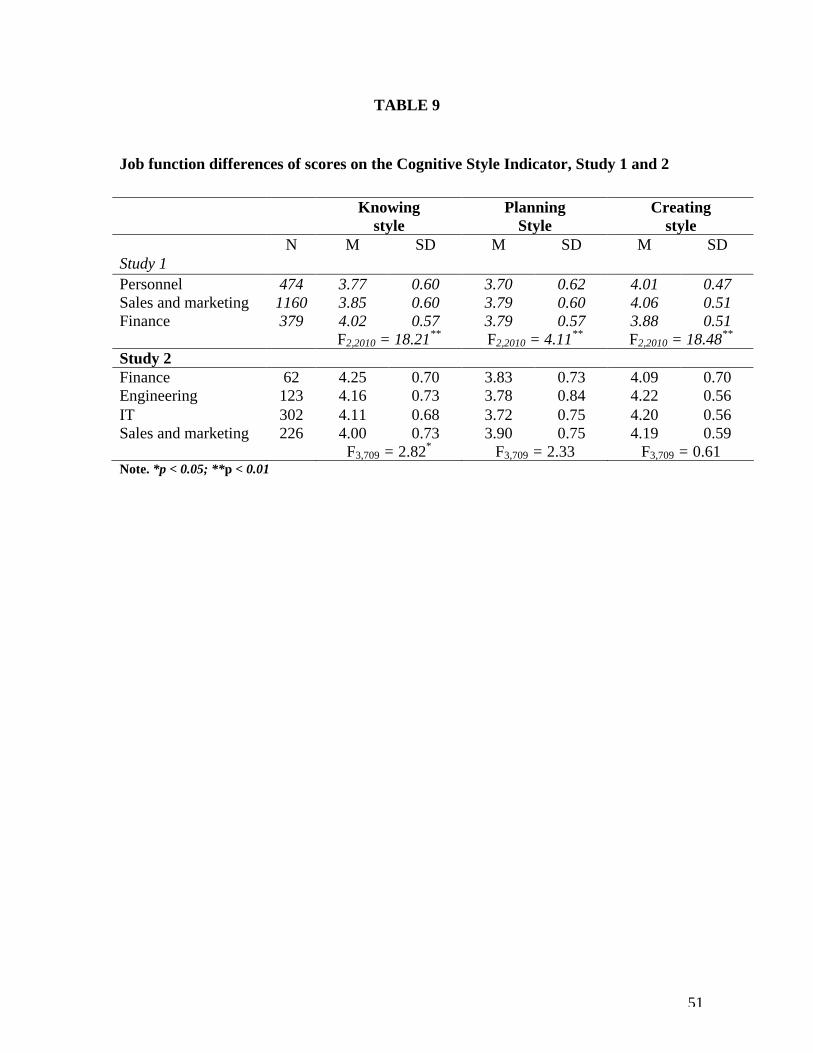
51
TABLE 9
Job function differences of scores on the Cognitive Style Indicator, Study 1 and 2
Knowing
style Planning
Style Creating
style N M SD M SD M SD Study 1 Personnel 474 3.77 0.60 3.70 0.62 4.01 0.47 Sales and marketing 1160 3.85 0.60 3.79 0.60 4.06 0.51 Finance 379 4.02 0.57 3.79 0.57 3.88 0.51 F2,2010 = 18.21** F2,2010 = 4.11** F2,2010 = 18.48** Study 2 Finance 62 4.25 0.70 3.83 0.73 4.09 0.70 Engineering 123 4.16 0.73 3.78 0.84 4.22 0.56 IT 302 4.11 0.68 3.72 0.75 4.20 0.56 Sales and marketing 226 4.00 0.73 3.90 0.75 4.19 0.59 F3,709 = 2.82* F3,709 = 2.33 F3,709 = 0.61 Note. *p < 0.05; **p < 0.01