the chronicle of higher education - 2026 report - may … · 1 moocs have focused the discussion on...
TRANSCRIPT

2026DECADE
T H E
A H E A DThe Seismic Shifts Transforming
the Future of Higher Education

Students study and relax on the steps of the campus library at the University of North Carolina in Chapel Hill. COUR
TESY
ANN
HERM
ES, A
P IM
AGES
/ TH
E CH
RIST
IAN
SCIE
NCE
MONI
TOR

Preface 04
Introduction 05
Section One: The Students of the Future 08
The Financial Future 18
Section Two: Rethinking the Faculty 22
The Emergence of a Bifurcated Faculty 27
New Models for Future Faculty 29
Section Three: The Future of Learning 32
Conclusion 40
Endnotes 42
TABLE OF CONTENTS
©2016 by The Chronicle of Higher Education, Inc. All rights reserved. No part of this publication may be reproduced, forwarded (even for internal use), hosted online, distributed, or transmitted in any form or by any means, including photocopying, recording, or other electronic or mechanical
methods, without the prior written permission of the publisher, except in the case of brief quotations embodied in critical reviews and certain other noncommercial uses permitted by copyright law. For bulk orders or special requests, contact The Chronicle at [email protected]

A t the turn of the 21st century, American higher education was in
the midst of another golden era. Enrollments were expanding as the members of the Baby Boom Echo were reaching college age and emerging technologies were leading to new ways of reaching students anywhere, at any time.
But within a decade, the Great Recession would hit. In just a few years, the financial needs of students skyrocketed, states made drastic cutbacks in appropriations to public colleges and universities in face of historic budget deficits, and the flow of new students started to slow.
It was a new era in higher education, one where the value of a college degree at any cost was questioned by politicians and parents alike, and where technology and “big data” were taking on new roles within the university. Before we look at what’s ahead for higher education in the next decade, it’s important to look back on the significant developments of the past five years that set the stage for what is coming next.
PREFACE
AUTHOR’S BIOThis report was researched and written by Jeffrey J. Selingo, former editor of The Chronicle of Higher Education. He is the author of two books on higher education: There Is Life After College: What Parents and Students Should Know About Navigating School to Prepare for the Jobs of Tomorrow, and College (Un)Bound: The Future of Higher Education and What It Means for Students.
TOC» 04

INTRODUCTION SETTING THE STAGE FOR THE NEXT DECADE OF HIGHER EDUCATION: THREE DEFINING TRENDS, 2011-2016
AS WE LOOK BACK AT RECENT HISTORY, THREE KEY TRENDS ILLUSTRATE HOW MUCH HIGHER EDUCATION HAS EVOLVED SINCE 2011 AND SET THE CONTEXT FOR CHANGES TO COME IN THE THIRD DECADE OF THIS NEW MILLENNIUM.
I n July 2011, several dozen higher-education leaders, ed-tech entrepreneurs, and officials from large philanthropic foundations gathered at Harvard
Business School. They were invited there by Clayton M. Christensen, a professor at the school who was well known for his theory of “disruptive innovation.” Christensen was about to publish a new book, with Henry J. Eyring, that concluded American higher education was ripe for reinvention.
Over the course of the day, the group debated the efficacy of online education for traditional students who had historically embraced face-to-face courses. They sketched out new approaches to financing a college degree. Christensen himself delivered a lengthy lecture on other industries, from health care to technology, that were disrupted when new products took root at the bottom of the market and eventually moved up market, displacing established competitors.
“Higher education is the last major sector of the economy to be disrupted,” he told the group. How long would it take for that to happen, someone in the audience asked? “Within 10 to 15 years, the bottom quarter of the market will either go out of business or merge,” Christensen said with some confidence.
That was a year before MOOCs (Massive Open Online Courses) became a household term and the New York Times declared 2012 the “year of the MOOC.” It was also before the long-term forces of the Great Recession took a more permanent hold in higher education. Within a year of the Harvard gathering, Moody’s Investors Service would place a “negative” outlook on the entire higher-education sector, concerned that net-tuition revenue—the cash colleges have left after giving out financial aid—was essentially flat or declining on too many campuses.
But in the years since, American higher education hasn’t come to look much like Christensen envisioned it would that July day. Sure, the president of the University of Virginia was fired (and then quickly reinstated) because its board didn’t think she was moving quickly enough to position the university for a rapidly changing world. And Sweet Briar College, a small women’s institution in Virginia, announced it would close (before its alumnae saved it).
Still, only a handful of colleges have closed in recent years, not the significant percentage that Christensen predicted. Instead, it was Christensen who came under fire, as academics and journalists largely discredited his research and found that disruption is “at best a marginally useful explanation of how innovation happens.”
Because colleges and universities didn’t undergo the massive transformation that was forecasted doesn’t mean that little has changed over the past five years, however. It’s important to remember that American higher education is in an evolutionary moment in its development, not a revolutionary moment. When any industry seems to be undergoing sweeping change, every new development feels like a major turning point. But in hindsight, what we think of as big moments at the time often turn out to be just blips in the life cycle of an industry. Change, by its nature, is incremental.
TOC» 05

1 MOOCS HAVE FOCUSED THE DISCUSSION ON CAMPUSES ABOUT NEW WAYS OF TEACHING STUDENTS
Massive Open Online Courses may no longer grab front-page headlines the way they did a few years ago, but they haven’t totally disappeared. What’s more important to this discussion about the future of higher education is that their impact has been far different than originally predicted. MOOCs haven’t siphoned away students from traditional colleges, nor have they disrupted the adult education market. Instead, MOOCs have shifted the conversation on campuses about teaching, pedagogical practices, and how to better assess student learning.
“The MOOC momentum pushed people to think about teaching in ways they hadn’t before,” said Edward Maloney, executive director of Georgetown University’s Center for New Designs in Learning and Scholarship. 1
For one, MOOCs prompted entire schools and departments to experiment with technology and new pedagogical approaches. Lectures are out and “flipped classrooms” are in. Faculty members are breaking traditional classroom discussions into shorter chunks and infusing them with feedback tools, such as quizzes and clickers, which actively engage the brain.
Second, data collected from how students interact with classroom technology is now more consistently tracked by professors to give them a sense of what’s working and what isn’t in their courses. “Institutions now have this ability to track, collect, and aggregate more of the data on learning moments captured electronically in the classroom,” said Fred Singer, CEO of Echo360, a technology company that sells lecture-capture tools and helps universities make sense of the real-time data they are collecting.
Third, after years of paying lip service to the ideal of rewarding faculty members for their teaching, institutions are finally investing resources in teaching centers as more professors are showing interest in the science of learning.
2 THE PUBLIC AND POLICY MAKERS ARE DEMANDING BETTER INFORMATION ON HIGHER EDUCATION’S RETURN ON INVESTMENT
Since the early 1980s, the financial returns on a college degree compared to a high school diploma have grown significantly. In 1983 the college wage premium was 42 percent. Today, it surpasses 80 percent.
That has resulted in a surge in enrollment on college campuses in the past four decades. The number of undergraduates has grown by 8 million since the early 1980s, because Americans increasingly see a college degree as the only ticket to financial success. But along with higher enrollment came higher numbers of dropouts. Only a little more than 50 percent of American students who enter college leave with a bachelor’s degree. Student success has been uneven, particularly among different socioeconomic groups that haven’t traditionally attended college. Of those who do graduate, nearly 50 percent find themselves underemployed in jobs that don’t require a degree.
In 2013, in his State of the Union address, President Obama announced that the U.S. Education Department would build a new data tool so that the public could better calculate the return on investment (ROI) of a college degree. This new College Scorecard, the president said, would allow students and parents “to compare schools based on a simple criteria: where you can get the most bang for your educational buck.” It would take two years before the College Scorecard finally debuted, but in the meantime, the president’s focus on ROI unleashed a bevy of new college rankings as well as state efforts to compare colleges based on outcomes.
In the past three years, The Economist, Money magazine, and LinkedIn all released their own set of college rankings based on the earnings and job placement rates of graduates. Seven states—Arkansas, Colorado, Minnesota, Tennessee, Texas, Virginia, and Washington—now match statewide salary data from unemployment insurance records with graduates from colleges and universities within the state, allowing consumers to compare the ROI of both institutions and majors.
TOC» 06
2 0 2 6 : T H E D E C A D E A H E A D

Average returns on a degree are no longer good enough for consumers who want access to better data about what it will mean for them to earn a degree in a particular major from a specific institution.
3 LIFELONG EDUCATION HAS ARRIVED WITH STACKABLE CREDENTIALS
Since 2011, the total number of undergraduate degrees has remained relatively constant, according to the National Student Clearinghouse. However, the share of those graduates who had earned prior credentials, whether a bachelor’s, associate’s, or certificate, has grown by 12 percent.
The first half of this decade marked a significant shift in how Americans accessed higher education. A college degree was long seen as a qualification that students earned at one time in life. Now the path through higher education increasingly includes multiple credentials that students earn throughout their lifetime as their careers shift in an ever-evolving economy.
Students are “stacking” their credentials, mixing multiple bachelor’s degrees with associate’s degrees and professional certificates to create a mosaic of experiences that they hope will set them apart in the job market (Figure 1). In the years ahead, the variety of credentials and the players in the market offering them—from traditional colleges to boot camps with short-term classes—will only proliferate.
What changes are in store for higher education over the next decade?
It’s a question being asked by college leaders, faculty members, policy makers, and of course, students and parents. Few of those stakeholders are happy with the status quo, yet each of them have different worries about the future—a widening economic divide between institutions and students, rising costs, achievement gaps among students of different ethnic and racial groups, and an overuse of part-time faculty members.
This report paints a picture of higher education on the cusp of far-reaching changes over the next decade. What is to come might not be the revolution in higher education often predicted by pundits, but evolutionary shifts in three important areas will have significant consequences for students and institutions. We will look at those changes in the sections ahead.
The first section of this report examines the demographic changes coming to campuses, providing a snapshot of the students of the future. The second section looks at the graying of the faculty and what that means for the academic workforce. Finally, the third section lays out the numerous learning pathways that students might follow a decade from now, from competency-based education to lifelong learning.
F I R ST-T I M E G R A D U ATE S (A L L A G E G R O U P S)
G R A D U ATE S W ITH P R I O R C R E D E NT I A LS (ALL AG E G RO U PS)
2,500,000
2,000,000
1,500,000
1,000,000
500,000
2011-12 2012-13 2013-14 2014-15
FIGURE 1 NUMBER OF FIRST-TIME BACHELOR’S DEGREES FALLING, BUT PRIOR GRADUATES ARE STACKING CREDENTIALS
SOURCE: NATIONAL STUDENT CLEARINGHOUSE RESEARCH CENTER
2,249,597 2,219,609 2,195,929 2,191,855
544,779 577,276 594,667 612,277
TOC» 07
2 0 2 6 : T H E D E C A D E A H E A D

SECT IONONE THE STUDENTS OF THE FUTURE
In this Thursday, Sept. 27, 2012 file photo, students walk through the University of Texas at Austin campus in Austin, Texas. This giant flagship campus—once slow to integrate—is now among the most diverse in the country.
COURTESY ERIC GAY, AP IMAGES

W hat’s well known among college leaders by now, of course, is that the number of high school graduates in the United States
reached a peak in the 2010-11 academic year.
Soon after that all four regions of the country—the Northeast, Midwest, West, and South—experienced a decline in the number of 18-year-olds, according to 2012 projections from the Western Interstate Commission for Higher Education. 2 While states in the South and West have already begun to experience an uptick in their share of high school graduates, the Northeast and the Midwest will remain challenged for years to come as their populations age.
But the story about demographics for colleges and universities is much more complicated than a single line that tracks high school graduates.
For much of the past four decades, the number of high school graduates has fluctuated with baby booms and busts, yet higher-education enrollment continued to grow—up by 8 million undergraduates since 1980. That growth in enrollment was fueled by a combination of a greater percentage of high school graduates going to college, working adult students returning for a degree, and international students. Those last two groups, however, still represent a small slice of enrollments for most traditional colleges, particularly four-year institutions.
The student market of 18-to-22-year-olds remains the lifeblood of many institutions and is also the most predictable segment to forecast since the others are heavily dependent on the health of the economy. Despite the overwhelming evidence about the value of a postsecondary degree in today’s job market, only 65 percent of new high school graduates enroll in college the following fall, a figure that has remained relatively constant in recent years. 3 Absent increasing the share of high school graduates who immediately enroll in college, institutions are stuck competing with each other for the same pool they always have.
BUT THAT POOL OF TRADITIONAL STUDENTS IS SHIFTING THANKS TO SUPPLY-DEMAND MISMATCH, THE CHANGING FACE OF HIGHER EDUCATION, AND THE HOLLOWING OUT OF THE MIDDLE CLASS.
1 A SUPPLY-DEMAND MISMATCH
While the most selective institutions in the U.S. increasingly compete in a global market for students, for the vast majority of colleges and universities student recruitment is a local and regional business. Freshmen enrolled in public four-year colleges typically attend an institution that is less than 100 miles from home; for those attending private four-year colleges, the distance is around 250 miles. 4
Plenty of institutions in recent years have reached far and wide for their freshman class, but they still largely enroll students from in-state and nearby states. The worrisome news for many of those institutions is that in the next decade demand from traditional students is projected to fall in many parts of the country where high school enrollment is lagging, while the supply of seats at colleges will remain mostly steady. Colleges can’t pick up and move to meet demand, of course. And the flow of students from other states is likely to taper off, too, especially for public universities that have used the higher tuition of out-of-state students to balance their budgets.
“There cannot possibly be enough students with the means and willingness to travel out of state for all the schools that want to tap this market,” said Don Hostler, executive director of the National Student Clearinghouse Research Center. 5
This supply-demand problem will be particularly acute in the Northeast and Midwest, which are home to a greater concentration of institutions and are projected to produce fewer high school graduates over the next decade (Figure 2).
The Northeast is expected to experience a decline of about 1 percent each year, on average, of high school graduates by 2027-2028, the result of a free fall in births since the 1990s. The Northeast’s graduating class of 2028 is projected to be 10 percent smaller than in 2009 with some 66,000 fewer graduates. About half of that decline in graduates will occur at private high schools, which have long been a pipeline of well-prepared, high-income students to colleges. What’s particularly noteworthy for colleges in the Northeast is that New Jersey—historically a net exporter of students because of the dearth of higher-education options in the state—will see a decline of almost 15 percent in its high school graduates by 2028.
TOC» 09
2 0 2 6 : T H E D E C A D E A H E A D

The Midwest, which produces 100,000 more graduates than the Northeast in any given year, will face an even steeper decline. The biggest producers of high school graduates in the Midwest—Ohio, Michigan, and Illinois—will all experience historic downturns, with Michigan ending with 86,000 fewer graduates by 2028, a nearly 30 percent drop from 2009.
Meanwhile, the number of graduates in the West, after an uptick around 2023-2024, will largely be the same in a decade as it is now (Figure 3). The primary reason the West will remain flat is that its biggest state, California, which saw its number of high school graduates peak in 2010-2011, will see a 17 percent decline by 2027-2028.
As a result of these shifts in population, the prime spot for recruiting traditional college students will be in the South, the only region the Western Interstate Commission predicts will see growth in high school graduates over the
next decade. The Class of 2025 in southern high schools is expected to be 16 percent larger than the class of 2009, about 175,000 students. Three states in particular, Texas, Florida, and Georgia, provide nearly half of the graduates in the South, a share that is expected to grow slightly over the next decade (Figure 4).
The story of the South’s rise in college enrollment is centered largely in one state: Texas. Texas graduated 277,000 students in 2009. By 2028, it will graduate nearly 100,000 more students. Indeed, within a decade, the Longhorn State will account for more than one out of every four high school graduates in the region. Given the size of its high school classes over the next decade, Texas is quickly becoming a bellwether for the next big shift in demographics—the race and ethnicity of tomorrow’s college students.
SOURCE: WESTERN INTERSTATE COMMISSION FOR HIGHER EDUCATION
S O UTH W E ST M I D W E ST N O RTH E A ST
250,000
200,000
150,000
100,000
50,000
0
-50,000
-100,000
-150,000
2019-2020(11-year change)
2024-2025(16-year change)
FIGURE 2 THE SOUTH WILL CONTRIBUTE MUCH OF THE POPULATION GROWTH IN THE NEXT DECADE
Regional change in total high school graduates, relative to 2008-2009
TOC» 10
2 0 2 6 : T H E D E C A D E A H E A D

FIGURE 3 A SMALLER PIPELINE OF HIGH SCHOOL GRADUATES
Public and non-public graduates
FIGURE 4 THE PRIME RECRUITING TERRITORY OF THE FUTURE—THE SOUTH
The South’s change in total high school graduates, by state, compared to 2008-2009
SOURCE: WESTERN INTERSTATE COMMISSION FOR HIGHER EDUCATION
1.4
1.3
1.2
1.1
1.0
0.9
0.8
0.7
0.6
0.5
MIL
LION
S
2016
-201
7
2017
-201
8
2018
-201
9
2019
-202
0
2020
-202
1
2021
-202
2
2022
-202
3
2023
-202
4
2024
-202
5
2025
-202
6
2026
-202
7
2027
-202
8
2019-2020
2024-2025
M A RYL A N D F L O R I D A G E O R G I A N O RTH C A R O L I N A TE X A S OTH E R
SOURCE: WESTERN INTERSTATE COMMISSION FOR HIGHER EDUCATION
-40,000 -20,000 0 20,000 40,000 60,000 80,000 100,000 120,000 140,000 160,000 180,000
S O UTH W E ST M I D W E ST N O RTH E A ST
TOC» 11
2 0 2 6 : T H E D E C A D E A H E A D

2 THE CHANGING FACE OF HIGHER EDUCATION
For the most part, colleges employ a short-term approach to admissions and enrollment management. Classes are recruited over the course of a year. Enrollment is planned over four years. Strategic plans cover longer time horizons but rarely pinpoint specific enrollment targets more than a few years out.
For colleges that survive on student tuition, a longer-term approach to enrollment planning is needed. Keeping close tabs on the pipeline by following trends in K-12 school enrollment, and even birthrates, is much more critical now than ever before, as the recruiting business in higher education becomes more competitive. “If they weren’t born, they’re not going to go to college,” said William T. Conley, the vice president for enrollment management at Bucknell University. 6
In the history of demographic change in the United States, the 2010 U.S. Census was a turning point. The U.S. population is aging. For every 100 18-year-olds nationally, there are only 95 4-year-olds, according to an analysis of the census figures by The Chronicle.
But not all racial and ethnic groups are aging. Fewer young children are white or black. In about half the states, more are Asian, according to The Chronicle analysis, and nearly everywhere more are Hispanic. In the South, for every grade level from sixth grade to first grade, the percentage of white non-Hispanic students decreases. (Figure 5).
The number of Hispanic students in the pipeline to college is likely to increase in the coming decades. The average Hispanic woman in the U.S. is 27—still in her prime childbearing years. Meanwhile, the average white woman in the U.S. is 42.
“To know what this country is going to look like in 10 years, you only need to glance at the birth rates,” said Steve H. Murdock, who has been tracking demographic trends for several decades as head of the U.S. Census Bureau and state demographer for Texas. “The differences in birth rates are stark. They tell college officials everything they need to know about who will be coming to their campuses by the end of the next decade.”
Indeed, the varying birth rates of whites and Hispanics will further intensify the demographic trends becoming apparent across the country, as the share of white
FIGURE 5 PEERING INTO THE FUTURE OF COLLEGE ENROLLMENTS
The percentage of white non-Hispanics enrolled in public school decreases for every grade level from sixth to first grade
SOURCE: WESTERN INTERSTATE COMMISSION FOR HIGHER EDUCATION
Sixth Fifth Fourth Third Second First
56%
55%
54%
53%
52%
51%
50%
TOC» 12
2 0 2 6 : T H E D E C A D E A H E A D

students plunges. In some places, the numbers are staggering for colleges that have long depended on a steady stream of white students to fill a majority of their classes. California is projected to have 37,000 fewer white high school graduates by the end of this decade, which alone will contribute 70 percent of the loss in the West of white students. At the same time, the state will add 28,000 Hispanic students to its graduating classes.
In other areas of the country suffering from declining populations, namely the Midwest and Northeast, most of that loss will be attributed to falling numbers of white students. In the Northeast, for instance, Hispanic
students will become the region’s largest minority group in high schools by 2020, accounting for 16 percent of graduates, even as the share of white students falls (Figure 6). These trends are important to note because wide and persistent gaps in higher-education attainment rates remain between white students and Asian students compared to everyone else. While the overall educational attainment rate in the U.S. has inched up to 40 percent in recent years—that’s the percentage of the population between 25 and 64 who have a college degree—the rate for blacks is only 28 percent, and even lower for Hispanics at 20 percent.
FIGURE 6 A SHIFTING POTENTIAL APPLICANT POOL
Composition of U.S. public high school graduates, by race/ethnicity
W H ITE N O N-H I S PA N I C H I S PA N I C B L A C K N O N-H I S PA N I C A S I A N / PA C I F I C I S L A N D E R A M E R I C A N I N D I A N /A L A S K A N AT I V E
SOURCE: WESTERN INTERSTATE COMMISSION FOR HIGHER EDUCATION
2008
-200
9
2009
-201
0
2010
-201
1
2011
-201
2
2012
-201
3
2013
-201
4
2014
-201
5
2015
-201
6
2016
-201
7
2017
-201
8
2018
-201
9
2019
-202
0
2020
-202
1
2021
-202
2
2022
-202
3
2023
-202
4
2024
-202
5
2025
-202
6
2026
-202
7
0%
10%
20%
30%
40%
50%
60%
70%
80%
90%
100%
TOC» 13
2 0 2 6 : T H E D E C A D E A H E A D

While attainment rates for every racial and ethnic group have risen in recent years, the gaps have failed to narrow (Figure 7). This could be for a variety of reasons, including inadequate preparation in elementary and secondary schools, difficulty in paying for college, and lack of academic and financial support while attending college.
This means that college campuses are going to be welcoming more racially and ethnically diverse students in the decade ahead, as well as students who are less academically prepared and have lower family incomes than the previous generations of high-achieving, affluent students that propelled a surge in higher-education enrollment over the past four decades. Colleges and universities will need to create more pipelines to and through college than the one that exists today largely to better serve students who will be coming from a variety of backgrounds.
Scores of reports from economists, think tanks, and national commissions in recent years have underscored that the future economy will demand a more educated population. In 2009, President Obama in his first joint address to Congress set a goal that the nation should once again have the highest proportion of college graduates in the world by the end of the decade. Meanwhile, the Lumina Foundation has set a goal that 60 percent of Americans should attain a “high-quality postsecondary degree or credential by 2025.”
But reaching those goals remains elusive. To reach the 60 percent goal, for example, the graduation rates of Hispanics would need to rise from the current 20 percent to about 54 percent. Meanwhile, students from the poorest families in the U.S. would need to increase their completion rates from 20 percent to more than 45 percent.
SOURCE: US CENSUS BUREAU AMERICAN COMMUNITY SURVEY PUMS FILES
FIGURE 7 ATTAINMENT UP, BUT DEGREE GAPS FAILING TO NARROW
Degree-attainment rates for United States residents (ages 25-64), by population group
A S I A N / PA C I F I C I S L A N D E R A M E R I C A N I N D I A N /A L A S K A N AT I V E
W H ITE N O N-H I S PA N I C H I S PA N I CB L A C K N O N-H I S PA N I CTOTA L
2011 2012 2013 2011 2012 2013 2011 2012 2013 2011 2012 2013 2011 2012 2013 2011 2012 2013
59.1% 59.4% 60.1%
23.1% 23.4% 23.9%
38.7% 39.4% 40%43.3% 43.9% 44.5%
27.1% 27.6% 28.1%
19.3% 19.8% 20.3%
TOC» 14
2 0 2 6 : T H E D E C A D E A H E A D

3 THE HOLLOWING OUT OF THE MIDDLE CLASS
Even if college prices remain flat for the students arriving on campuses over the next decade, the cost of college tuition will continue to eat up a larger share of the family paycheck as incomes lag.
Median per capita income in the U.S. has basically flat-lined since 2000, when adjusted for inflation. The typical American family makes slightly less than a typical family did 15 years ago. And while many products have become less expensive in that time, the price tag of three of the biggest expenditures made by middle-class families— housing, college tuition, and health care—have risen much faster than the rate of inflation. 7
Even as colleges discount their tuition more and more each year—the average discount rate was 48 percent for freshmen in 2012—family incomes are simply not keeping pace.
Today, one out of every five families in the U.S. pays 100 percent or more of their annual income to cover the net price of college. Because even the discounted tuition rate outstrips their ability to pay, those families need to borrow or use savings to cover tuition bills. The situation is even
worse for students in the lowest income quartile. Among those families, half pay 100 percent or more of their annual income to cover the net price of college (Figure 8).
The bottom line for college leaders is that even today’s discounted tuition rates are expensive for a broad cross- section of Americans struggling to keep up. And it’s not going to get better in the next decade. Of the 450 counties in the United States that have significantly more younger than older children, all but 100 of them have median incomes below the national average. In 2000, there were only four states in which low-income students exceeded 50 percent of the population; in 2013, there were 20 (Figure 9). 8
Indeed, the poverty rate worsens as you move down the age scale in the U.S., according to a 2015 report from the Pew Research Center. “The biggest winners since 1971 are people 65 and older,” the report said. “The youngest adults, ages 18 to 29, are among the notable losers with a significant rise in their share in the lower-income tiers.”
The report noted that the American middle class is on the decline. Over the past 40 years, the middle class went from a clear majority to a group that is matched in size by lower- and upper-income households.
FIGURE 8 TUITION RISING, INCOMES FALLING
Percent of students whose families pay 100 percent or more of their annual income to cover the net price of college, 1996-2012
1996 2004 2008 20120%
10%
20%
30%
40%
50%
SOURCE: NATIONAL POSTSECONDARY STUDENT AID STUDY
A L L STU D E NTS
L O W E ST I N C O M E Q U A RT I L E
TOC» 15
2 0 2 6 : T H E D E C A D E A H E A D

2000
2013
56%
60%63%
51%
55%
51%59%
50% 68%
60%
61%61%
65%71% 58% 60%
58%
59%
58%
50%
51%52%
53%
52%
51%
FIGURE 9 INCREASING POPULATION OF LOW-INCOME STUDENTS
States where low-income students (family income $20,000-$40,000) exceed 50 percent of the total student population
SOURCE: SOUTHERN EDUCATION FOUNDATION
TOC» 16
2 0 2 6 : T H E D E C A D E A H E A D

This trend has manifested itself on college campuses in the form of a socioeconomic “barbell”—with affluent students who can pay full price or close to it on one end and poor students who receive federal Pell Grants and max out their loan eligibility on the other end. Fewer students are in the middle, especially on the lower end of that middle just above the cutoff for Pell Grants.
For years, merit aid has helped colleges maintain the middle class on their campuses by giving institutions the flexibility to spread aid around to many students in the form of scholarships, while at the same time pulling in some tuition revenue from those students. But as prices have climbed, colleges found they were discounting their tuition too much and their net tuition revenue—the amount of cash actually received from students or their outside aid—was flat or declining.
This was the situation Franklin & Marshall faced in 2008 when trustees of the small private liberal-arts college in Pennsylvania decided to begin phasing out merit aid in order to attract a broader range of students at all income levels. Merit scholarships were becoming too expensive. To increase them, or even maintain them, F&M would need to raise its sticker price, with the extra funds simply going right back out the door in the form of merit aid. A higher sticker price would only further discourage middle- and low-income students from applying, said Dan Porterfield, F&M’s president. “Merit aid didn’t offer an advantage anymore,” he said.
By 2012, F&M had phased out all of its merit aid, and since then the proportion of incoming students eligible for Pell Grants has risen from 5 percent to 17 percent, one of the biggest increases in the country. Ninety-five percent of first-generation college students in the class of 2018 returned for their sophomore year, compared to 92 percent of the class overall. And the academic profile of the admitted student has remained consistent (F&M has even risen in the U.S. News & World Report rankings).
One side benefit of the shift in policy is that students are no longer stretching as much financially to afford an F&M education. Of those enrolling in the year before merit aid was phased out, about half had debt at graduation, with an average of $33,200 in loans. Today, the same percentage of students have loans at graduation, but their debt load is much lower, around $26,162, even though tuition prices have increased in that time and student debt nationwide has skyrocketed.
It’s likely many more college leaders will need to follow Franklin & Marshall’s model in the future. Given the demographic and income trends, colleges—especially the less-selective and less-expensive ones—will need to shift more dollars to need-based aid in order to fill their classes or dramatically cut costs in order to lower tuition for everyone. This strategy is not just about helping low-income students. It’s about survival.
TOC» 17
2 0 2 6 : T H E D E C A D E A H E A D

I n December 2015, Moody’s Investors Service issued a “stable outlook” on the U.S. higher-education sector. The news was notable because in recent
years Moody’s had placed a negative outlook on the sector as a whole. In 2013, for instance, Moody’s issued ratings reports on 45 institutions—and all but 10 were downgrades.
The reason for the slightly more positive outlook from Moody’s for 2016 was that it projected income streams to grow over the next 12-18 months after years of declining revenue in one or more major revenue sources (Figure 10). 9
The report noted, however, that nearly 20 percent of the portfolio of the universities that Moody’s rates—about 500 institutions—would need to cut costs in order to generate sufficient cash flow to continue to invest in programs and facilities.
It’s important to note that Moody’s studies colleges and universities that go to the market to take on debt. Typically, it rates only institutions that have strong balance sheets to begin with. Other reports have issued slightly more dire warnings about the financial outlook for colleges and universities and the steps they should take to maintain their models.
One from Bain & Company in 2012 noted that one-third of all colleges and universities in the United States face financial statements significantly weaker than before the 2008 recession and are on an unsustainable fiscal path. Another quarter of colleges find themselves at serious risk of joining them. 10
“Institutions have more liabilities, higher debt service, and increasing expenses without the revenue or the cash reserves to back them up,” the study noted. “In the past, colleges and universities tackled this problem by passing on additional costs to students and their families, or by getting more support from state and federal sources. Regardless of whether or not families are willing to pay, they are no longer able to foot the ever-increasing bill, and state and federal sources can no longer make up the difference.”
Another report in 2016 from Parthenon-EY found that some 800 institutions face critical challenges because of their inefficiencies or small size. 11 Around 40 percent of American colleges enroll 1,000 or fewer students. Almost another 40 percent enroll fewer than 5,000 students. Since 2010, the smallest institutions, under 1,000 students, have been shedding the most enrollment, a decline of 5 percent compared to the largest institutions, over 10,000, which have grown slightly, on average (Figure 11).
THE FINANCIAL FUTURE
FIGURE 10 AN UPTICK IN REVENUE, BUT WILL IT BE SHORT-LIVED?
Moody’s projections of growth by revenue category 2016-2017
EXPECTED GROWTH OVER NEXT 12-18
MONTHS
STUDENT CHARGES
STATE FUNDING
PATIENT CARE
RESEARCH
ENDOWMENT INCOME
GIFTS
2-3%
2-4%
4-6%
2-4%
4-5%
3-4%
SOURCE: MOODY’S INVESTORS SERVICE
TOC» 18

Since 2007, 72 institutions have shut down, nearly all of them with enrollments of less than 1,000. The report outlined six different risk factors facing higher-education institutions in the future, including small size, no online programs, tuition discount rates greater than 35 percent, and deficit spending. Among the smallest colleges, 77 percent of them exhibited three or more of the risk factors compared to just 24 percent of those with enrollments above 5,000 (Figure 12).
The study from Parthenon-EY indicated that the U.S. has now firmly entered a new era in the modern history of higher education, one where constrained family and government resources will require collaboration among institutions. Except for a handful of small, selective, and well-endowed private colleges, the size of institutions is going to matter to the sustainability of their business model in the future.
The study suggested that in the coming decade institutions would need to seek to collaborate—and well beyond simple agreements to share back-office operations or cross-list courses. “Collaboration in this new era involves colleges and universities coming together as seemingly one institution to change their future direction,” the report said.
In any discussion about the financial future of higher education, it’s important to note the fiscal conditions of public institutions. Some 80 percent of students attend state colleges and universities. Of those, many go to under- resourced community colleges, and 40 percent of all undergraduates in the United States attend regional public colleges (by comparison, the better-known public flagship universities enroll just 20 percent of students).
FIGURE 11 SMALLER INSTITUTIONS STRUGGLING TO MAINTAIN ENROLLMENTS
Enrollment trends by size of institutions, 2010-2013
SOURCE: INTEGRATED POSTSECONDARY EDUCATION DATA SYSTEM
20%
40%
60%
80%
100%
0%
Number of Enrollments
2%
0%
-2%
-4%
-6%
U N D E R 1 , 000 1 , 000 -4 , 9 9 9
5 , 000 -9 , 9 9 9 10 , 000 A N D A B O V E
-5.2%
-1.2%-0.8%
0.8%
TOC» 19
2 0 2 6 : T H E D E C A D E A H E A D

While state appropriations for higher education have risen in absolute terms, they have not kept up with inflation or with increases in enrollment. When measured per student, state spending on instruction at public colleges is at its lowest since 1980 (adjusted for inflation), according to the State Higher Education Executive Officers. As a result, college students and their families, who a decade ago paid for about one-third of the cost of their education, are on track to pay for most of it. In nearly half of the states, they already do.
If current trends continue, state spending on higher education will cease to exist, according to the Pell Institute for the Study of Opportunity in Higher Education. It has projected that Colorado would be the first state where aid to higher education would reach zero, by 2022. By 2050, 15 other states, including South Carolina, Massachusetts, and Virginia, would join Colorado.
FIGURE 12 RISK FACTORS FOR THE FUTURE
Percentage of universities exhibiting risk factors for closing, according to Parthenon-EY
20%
40%
60%
80%
100%
0%
738 929 254 354
6 R I S K FA CTO R S5 R I S K FA CTO R S4 R I S K FA CTO R S3 R I S K FA CTO R S
Total Number of Institutions
Under 1,000 1,000-4,999 5,000-9,999 10,000 and above
| | |
CURRENTLY, 122 INSTITUTIONS EXHIBIT MORE THAN FOUR RISK FACTORS FOR CLOSING
SOURCE: PARTHENON-EY
TOC» 20
2 0 2 6 : T H E D E C A D E A H E A D

Sound impossible? Such projections based on historical trends tend to grab headlines, but are so far in the future that they are often greeted with skepticism. Even so, higher education remains the balance wheel in state budgets. It is usually funded after pensions, health care, roads, prisons, and elementary and secondary schools. Unlike those entities, it has a built-in revenue stream in the form of tuition. Lawmakers can’t charge prisoners for their care.
All signs point to continued pressure on state budgets in the coming decade. The U.S. Government Accountability Office has warned that health care spending is the primary driver of the long-term fiscal challenges facing state governments. According to the GAO, state health-related expenditures will nearly double as a percentage of gross domestic product in the coming decades. 12
So where do these demographic and fiscal challenges leave higher education?
Undoubtedly, the decade ahead will see a continuation of many of the same challenges colleges and universities have faced since the recession of 2008. After eight years of dealing with those fiscal constraints, higher-education leaders had hoped that the tide was turning. But there are few signs that the trends of the past few years will reverse anytime soon. Indeed, the demographic and financial projections outlined above show that the issues officials have grappled with in recent years are only going to accelerate.
Higher-education leaders will also need to confront other issues in the next decade, namely an aging and increasingly expensive faculty and a host of challenges to their core business of education in the form of alternative providers, new ways of measuring learning, and innovative approaches to credentials.
TOC» 21
2 0 2 6 : T H E D E C A D E A H E A D

SECT IONTWO RETHINKING THE FACULTY
Eighty years old and still teaching: A wheelchair does little to curb Harold Scheub’s passion for teaching an African storyteller class in Bascom Hall at the University of Wisconsin-Madison on April 18, 2012.
COURTESY JEFF MILLER, UW-MADISON
B oomers’ Retirement May Create Talent Squeeze,” declared a headline in The Chronicle of Higher Education in 2006, predicting a looming crisis as
the first of the baby boomers reached their mid-60s.
For much of the past decade, college and university officials have been sounding that warning about the coming wave of retirements on campuses. Baby boomers, born between 1946 and 1964, make up a significant share of college professors given their working lives coincided with the massive growth of American higher education over the past 40 years.
Once those retirements came, campus leaders would have a once-in-a-lifetime opportunity to shape their institutions and redefine the role the faculty would play in the future. “Faculty renewal” would allow colleges and universities to shift open positions to emerging academic fields and hire a new crop of up-and-coming scholars, as well as reduce personnel costs that would come as a result of the new, less-expensive hires.
But that surge of retirements has failed to materialize as predicted. The number of professors age 65 and up has more than doubled since the turn of the century, according to the Bureau of Labor Statistics. At many institutions, at least 25 percent of tenured or tenured-track professors are now approaching 70. In 1978, the percentage of faculty over age 60 was only 8 percent. 13
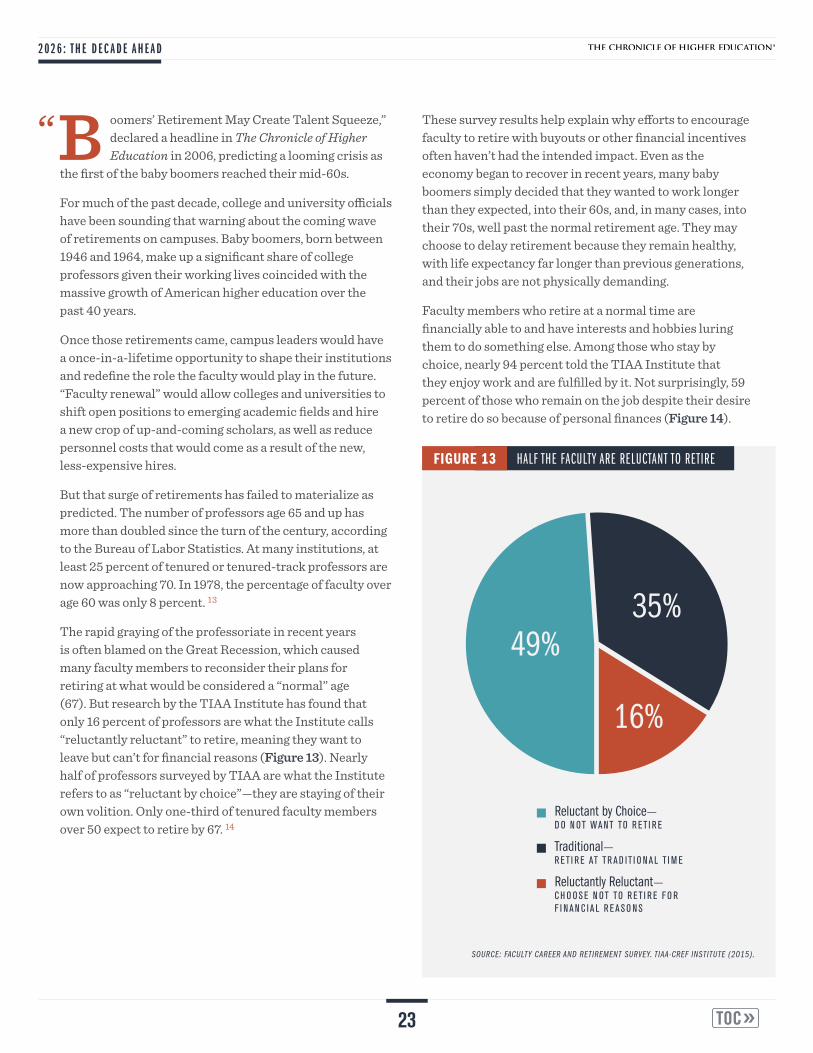
The rapid graying of the professoriate in recent years is often blamed on the Great Recession, which caused many faculty members to reconsider their plans for retiring at what would be considered a “normal” age (67). But research by the TIAA Institute has found that only 16 percent of professors are what the Institute calls “reluctantly reluctant” to retire, meaning they want to leave but can’t for financial reasons (Figure 13). Nearly half of professors surveyed by TIAA are what the Institute refers to as “reluctant by choice”—they are staying of their own volition. Only one-third of tenured faculty members over 50 expect to retire by 67. 14
These survey results help explain why efforts to encourage faculty to retire with buyouts or other financial incentives often haven’t had the intended impact. Even as the economy began to recover in recent years, many baby boomers simply decided that they wanted to work longer than they expected, into their 60s, and, in many cases, into their 70s, well past the normal retirement age. They may choose to delay retirement because they remain healthy, with life expectancy far longer than previous generations, and their jobs are not physically demanding.
Faculty members who retire at a normal time are financially able to and have interests and hobbies luring them to do something else. Among those who stay by choice, nearly 94 percent told the TIAA Institute that they enjoy work and are fulfilled by it. Not surprisingly, 59 percent of those who remain on the job despite their desire to retire do so because of personal finances (Figure 14).
“
SOURCE: FACULTY CAREER AND RETIREMENT SURVEY. TIAA-CREF INSTITUTE (2015).
FIGURE 13 HALF THE FACULTY ARE RELUCTANT TO RETIRE
16%
49%35%
Reluctant by Choice—D O N OT WA NT TO R ET I R E
Traditional—R ET I R E AT TR A D IT I O N A L T I M E
Reluctantly Reluctant—C H O O S E N OT TO R ET I R E F O R F I N A N C I A L R E A S O N S
TOC» 23
2 0 2 6 : T H E D E C A D E A H E A D

For higher education, maintaining a healthy balance of generations within departments is critical to preserving the vitality of the institution. Almost 40 percent of college leaders in a 2014 Chronicle of Higher Education survey said that faculty members remain on the job longer than the institution would like (Figure 15). 15 The vast majority of those executives said they believed that delayed retirements have had a negative impact on the recruitment of new faculty members and labor costs for the institution.
When asked in that Chronicle survey what the optimal age composition of academic departments should be, faculty members and administrators agreed that professors in their 40s and 50s, the prime working years, should make up roughly half of a department. Those under 40 should account for another quarter, with the remainder made up of those over 60, but mostly skewed toward those under 70. While that might be the ideal department, faculty in the survey reported that the age of their department is slightly older than optimal (Figure 16).
FIGURE 14 PROFESSORS RELUCTANT TO RETIRE FOR VARIOUS REASONS
20%
40%
60%
80%
100%
0%
Reluctantly Reluctant—C H O O S E N OT TO R ET I R E F O R F I N A N C I A L R E A S O N S
Reluctant by Choice—D O N OT WA NT TO R ET I R E
P E R S O N A L F I N A N C E S N E C E S S ITATE C O NT I N U E D W O R K
SOURCE: FACULTY CAREER AND RETIREMENT SURVEY. TIAA-CREF INSTITUTE (2015).
W O U L D M I S S C O L L E A G U E S A N D OTH E R A S S O C I ATE S
N O N E E D TO R ET I R E
N E E D TH E H E A LTH I N S U R A N C E B E N E F I TS
R E M A I N E F F E CT I V E A S FA C U LT Y M E M B E R
E NJ OY A N D A R E F U L F I L L E D BY W O R K
TOC» 24
2 0 2 6 : T H E D E C A D E A H E A D

The Chronicle survey found that professors might be more likely to retire if they could continue their teaching and scholarship in familiar ways. Faculty members said the most effective ways to engage them in retirement are through continued teaching and research opportunities and mentoring of young faculty. But administrators polled said that they would prefer retired faculty members be engaged in other ways, such as alumni relations, development, and teaching enrichment courses to the wider community (Figure 17).
Lower than predicted numbers of retirements in the past decade in higher education had a profound impact on colleges and universities in another unexpected way: the rise of adjunct faculty. Faced with a financial crunch brought on by the recession, coupled with a lack of flexibility in assigning their full-time faculty, institutions sought workarounds, and for the most part, that meant hiring more part-time faculty, off the tenure track.
FIGURE 15 DO FACULTY MEMBERS STAY ON THE JOB TOO LONG?
How often, if at all, do faculty/staff remain on the job longer than the institution would like?
FIGURE 16 THE IDEAL AGE OF AN ACADEMIC DEPARTMENT VERSUS THE REALITY
Staff
Faculty
28% 60% 12%
11% 51% 37% 1%
SOURCE: THE GRAYING CAMPUS, 2014
R A R E LY
S O M ET I M E S
F R E Q U E NTLY
A LWAYS
Executives-Healthy Balance
Faculty- Healthy Balance
24% 28% 27%
26% 26% 25% 19%
U N D E R 4 0
4 0 -4 9
5 0 -5 9
6 0 -6 9
22% 24% 21%
16% 5%
28% 5%
4%
70 A N D A B O V EFaculty- Current Makeup of Department
SOURCE: THE GRAYING CAMPUS, 2014
TOC» 25
2 0 2 6 : T H E D E C A D E A H E A D

FIGURE 17 HOW TO ENGAGE RETIRED FACULTY
SOURCE: THE GRAYING CAMPUS, 2014
Continued teaching opportunities
Departmental administrative consultation
Mentoring/training young faculty
Continued research opportunities
Pursuing special projects
Teaching enrichment courses
Mentoring/tutoring students
Public lectures
Alumni relations/development
Academic governance
Research grant writing
Admissions/recruiting
Other
65%
51%
53%
55%
51%
32%
50%
47%
40%
49%
35%
47%
31%
39%
30%
50%
25%
18%
13%
6%
13%
23%
9%
14%
3%
3%
FA C U LT Y
E X E C UT I V E S
TOC» 26
2 0 2 6 : T H E D E C A D E A H E A D

THE EMERGENCE OF A BIFURCATED FACULTY
C ongress made mandatory retirement illegal for most employees in 1986. But it exempted tenured professors until 1994, and asked the National
Academy of Sciences to study the consequences of the end of that requirement.
A 1991 study by the National Research Council, an arm of the Academy, found that most tenured professors were choosing to retire before age 70, and, on many campuses, before 65. The study predicted that those patterns would continue in the absence of mandatory retirement. It also predicted that only the nation’s leading research universities were likely to face a serious problem of low turnover because of professors’ staying on past 70. 16
Those predictions turned out to be wrong. Before the change in the law, studies showed that retirement rates on campuses spiked at around age 70—some 90 percent of 70-year-old faculty members retired within two years. But after the elimination of compulsory retirement more than half of 70-year-olds were still teaching two years later. 17
One of the implications of this shift on campuses has been the emergence of a bifurcated faculty—one group of older, mostly tenured faculty members and another group of younger faculty members, increasingly part-time and off the tenure track.
Since the 1970s, the academic workforce on campuses has shifted to a majority of non-tenure-track faculty, many classified as part-timers. In 1969, tenured and tenure-track positions made up nearly 80 percent of faculty. Today, less than one-third of professors are either tenured or on the tenure track. Of the non-tenure-track positions almost 50 percent are part-time (Figure 18).
The use of part-timers at four-year colleges has accelerated in recent years, as more colleges under financial strain look to fill full-time positions with less-expensive contractors. Fluctuating enrollments across institutions and within fields has led many campus leaders to question making a lifelong commitment to faculty members.
The purpose of adjuncts has changed as well. Historically, adjunct faculty had full-time jobs off campus and were hired for their expertise in a particular subject. The fact that they didn’t participate in departmental activities, campus committees, or shared governance was rarely seen as a problem because there were plenty of full-time faculty members to serve in those roles.
Today, some adjuncts are full-timers who might prefer to be on the tenure track, but the majority are part-timers, who often must cobble together a bunch of teaching gigs in order to achieve the equivalent of a full-time salary. The average part-time faculty member earned $16,718 from a single employer in 2015, according to the AAUP, ranging from around $15,000 at baccalaureate institutions to $26,000 at doctoral universities. Given that these adjunct positions are focused primarily on teaching, the rising use of part-timers or those off the tenure track has placed additional strains on institutions since a smaller slice of tenured professors are left to take on service work.
There is also a growing body of evidence that the proliferation of adjuncts is having a negative impact on student success and outcomes. A National Bureau of Economic Research study has found, for instance, that a 10 percent increase in part-time faculty positions at public universities results in a nearly 3 percent decline in graduation rates. What’s more, researchers say that if students have a part-time instructor it reduces the likelihood that they will take subsequent classes in that subject. 18
Whether the correlation between the use of part-time faculty and outcomes, coming at a time of increased institutional scrutiny of retention and graduation rates, will persuade officials to change their approach remains unclear. For now, leaders seem focused on the short-term budget relief that adjuncts provide to the institution’s bottom line. But as full-time, tenured professors do retire, higher-education officials will begin to plan the faculty of the future. And right now that future looks very different from the generation of faculty members preparing to leave academe.
TOC» 27

FIGURE 18 TRENDS IN THE ACADEMIC WORKFORCE, 1975-2015
16.12% 11.40% 10.22% 9.61% 8.77% 8.20% 7.98% 7.65% 6.84% 8.09% 8.05%
24.00% 30.36% 33.07% 33.19% 37.04% 39.07% 40.50% 41.11% 41.45% 41.14% 40.93%
10.33% 14.09% 13.59% 13.56% 14.96% 16.33% 14.87% 15.06% 12.95% 16.41% 16.73%
20.53% 16.54% 18.14% 18.81% 19.97% 18.67% 19.46% 19.36% 21.02% 12.76% 12.83%
29.03% 27.61% 24.99% 24.82% 19.26% 17.73% 17.19% 16.82% 17.73% 21.60% 21.45%Full-time tenured faculty
Full-time tenure- track faculty
Full-time non-tenure- track faculty
Part-time faculty
Graduate student employees
1975 1989 1993 1995 2003 2005 2007 2009 2011 2013 2014
10%
20%
30%
40%
50%
0%
F U L L-T I M E TE N U R E-TR A C K FA C U LT Y F U L L-T I M E N O N-TE N U R E-TR A C K FA C U LT YF U L L-T I M E TE N U R E D FA C U LT Y
PA RT-T I M E FA C U LT Y G R A D U ATE STU D E NT E M P L OYE E S
SOURCE: NATIONAL CENTER FOR EDUCATION STATISTICS, IPEDS DATA CENTER
TOC» 28
2 0 2 6 : T H E D E C A D E A H E A D

NEW MODELS FOR FUTURE FACULTY
F ew administrators, professors, or university trustees seem happy with the current faculty model in higher education. Various surveys of all three
stakeholder groups consistently reveal their frustrations with the status quo, although each has different reasons. The bifurcated faculty model developed over time, without much deliberation and certainly without any long-range planning.
This unintended shift in the makeup of the academic workforce is not sustainable for the long term as tenured professors retire and institutions increasingly are measured on their student outcomes. It’s highly unlikely higher education will return to the days when the majority of professors were full-time and tenured, so new faculty models are sure to materialize in the coming decade.
What might these new faculty models look like? How might a college or university redesign the structure of its faculty? What types of professors will be needed and how will their roles be constructed? Here are five potential scenarios for the faculty of the future:
1 ONE FACULTY FOR TEACHING, ANOTHER FOR RESEARCH
The job of a full-time faculty member is a bundled collection of roles—research, teaching, and various kinds of service. The rising use of part-time adjuncts has already unintentionally unbundled the faculty role on campuses, because part-timers focus solely on teaching and full-timers perform the traditional roles, although rarely in any balanced proportion.
A different model for unbundling the faculty role would create two distinct tracks for faculty members: one for instructors and another for researchers. The key difference from the often haphazard and arbitrary system of today is that the teaching-only track would be full-time and professors would be evaluated on their teaching, not their research productivity.
Standardizing and elevating the teaching-only role of faculty on campuses would eliminate the ad-hoc hiring of adjuncts that occurs now and professionalize the teaching corps by recruiting academics interested first and foremost in instruction. That in turn would provide another pathway for graduate students into academic careers and encourage graduate programs to create programs for students who want to focus on teaching at universities. Most of all, it would replace what is largely now a two-tiered system on campuses of haves and have-nots, where academics in the second tier are lowly paid and valued, and usually not in that tier by choice.
This two-track model is heavily favored across higher education, according to an extensive survey of 1,500 faculty members, administrators, and policy makers conducted by the Delphi Project at the University of Southern California in 2015. In the study, 50 percent of tenured faculty and 70 percent of full-time, non-tenured faculty said they found the idea of customized pathways in a particular area of practice attractive. So, too, did 68 percent of deans and 74 percent of accreditors. 19
2 THE THREE-MEMBER TEAM: FACULTY, PRECEPTOR, TA
The large introductory lecture class is a mainstay at colleges and universities because of its efficiency: it crowds many paying students into a classroom taught by one faculty member and supplements the instruction with smaller groups led by less-expensive graduate teaching assistants. It might save money, but student outcomes often suffer.
A model is emerging that adds a third person to the teaching team—an instructor in between the professor and the TA. These teachers, sometimes called preceptors, are experienced full-time instructors who help students make connections between what they learn in the lecture to their experience in small group sessions or in labs (in the case of science courses). The TAs also benefit from the preceptors, who teach the graduate students how to teach undergraduates.
TOC» 29

While a course with a preceptor is more expensive to offer, universities experimenting with the model say the additional costs end up paying for themselves over the long run with improved retention and graduation rates. At the University of Delaware, which uses the preceptor model in introductory biology courses, class attendance has gone up and the dropout rate among STEM majors who have preceptors has fallen. 20
3 THE DESIGN-BUILD APPROACH: FACULTY AND AN INSTRUCTIONAL DESIGNER
Historically, faculty members have built their courses on their own, writing the syllabus, choosing the textbooks, and outlining the lectures. But with the growth of online education in the past two decades, a new player arrived on the scene: the instructional designer. Instructional designers help traditional faculty translate their face-to-face courses into virtual classes, where educational material can be presented online.
One byproduct of those collaborative design sessions was that professors began to pay closer attention to pedagogical research and their own presentation styles. As technology invaded the campus classroom with hybrid courses and learning management systems, professors started to work with instructional designers to rethink their face-to-face courses as well.
Today, the position of instructional designer is one of the hottest jobs on campuses nationwide. Membership in the Association for Educational Communications and Technology, the primary national group of institutional designers, has grown by 50 percent over the past decade, to more than 2,400. 21
In many ways, instructional designers play the role of student, looking for the sweet spot in any concept that professors want real students to understand and then helping construct the best ways to explain it using text, video, or visual representations of data. Instructional designers have varied backgrounds in design, technology, learning theory, and pedagogy.
This team approach to designing and building courses typically results in a better experience for students and reduces the workload for faculty, most of whom have little formal training in learning science and often may teach exactly the same way they were taught. As technology is increasingly integrated into the classroom not only to deliver content but also to assess learning, this team-based, design-build approach to creating courses on campuses might become the norm on more campuses.
4 SCHOLARSHIP FOR ALL, NO MATTER THE ROLE
If the faculty role becomes divided between research and teaching, professors will need to remain engaged in some form of scholarship to remain current.
This will require colleges and universities to adopt a more comprehensive definition of research that applies to a wider range of professorial roles on campuses. For instance, faculty members in the teaching function described earlier will need to be encouraged by institutions to conduct research on effective classroom practices and learning science, and that work will need to play a role in their evaluations.
In the 2015 University of Southern California Delphi Project survey for colleges and universities, there was widespread support for adopting a broader definition of research beyond research and pedagogy. At least 75 percent of every stakeholder group in the survey—from governing board members to deans—supported the idea that institutions adopt the definition of scholarship that Ernest Boyer first outlined in his 1990 book, Scholarship Reconsidered: Priorities of the Professoriate.
Boyer, who was at the time president of the Carnegie Foundation for the Advancement of Teaching, rejected the prevailing view that the chief form of academic scholarship that mattered was “scholarship of discovery”—that is, the generation and testing of theory and the pursuit of knowledge for its own sake. Instead, Boyer proposed that there were other forms of scholarship that colleges should value, such as the study of effective teaching methods. Since then, Boyer’s ideas have been adopted to varying degrees on campuses.
TOC» 30
2 0 2 6 : T H E D E C A D E A H E A D

5 A FLEXIBLE FACULTY ROLE
The four scenarios laid out above make clear that the faculty role in the future will likely change drastically from what has existed on college campuses. Flexibility will be a key attribute of anyone pursuing an academic career in the future.
In many ways, varying the role of faculty members on campus will give academics more choices about the pathways to pursue throughout their careers. Today, the faculty career is largely flat and built at one institution. Even those who become full professors perform essentially the same job they did as associate professors.
The midpoint of academic careers is often fraught with anxiety about what’s next. After receiving tenure, faculty members no longer are protected from a heavy load of committee work. Some remain stuck as associate professors for years without a promotion. And unless they are superstars in their fields, it’s not easy to get a job elsewhere. With multiple channels available for faculty, professors in the future might have more choices about the direction of their own careers.
WHETHER ANY OR ALL OF THE SCENARIOS OUTLINED ABOVE WILL BE ADOPTED HINGES ON ONE QUESTION: WHAT WILL THE EMPLOYMENT TERMS BE FOR PROFESSORS IN THE FUTURE?
Tenure is on the decline throughout most of academia, and in the Delphi Project study nearly every group said the current mix between tenured full-timers and non-tenured part-timers is unworkable. (The only group that said the status quo was attractive is professors who were already tenured.)
There was much less agreement in the survey, however, about what will replace the current system. Phasing out tenure in favor of multi-year, renewable contracts was viewed favorably by governing boards and state higher- education officials, but not by deans and tenured faculty members. A similar split in the survey was seen around the idea of maintaining tenure, but modifying it with renewable contracts every 10-15 years.
What will replace the current system remains unclear. But eventually, older faculty members will retire and campuses will be faced with hiring a new academic workforce, one familiar not only with the shift in student learning needs but also with the multitude of new delivery methods.
TOC» 31
2 0 2 6 : T H E D E C A D E A H E A D

SECT IONTHREE THE FUTURE OF LEARNING
Doctoral students attend a multidisciplinary lesson during an immersive class on October 22, 2013.
COURTESY FRANK PERRY, AFP, GETTY IMAGES

H igher education serves both a private good as well as a public purpose—from improving employment prospects for individuals to
promoting more engaged citizenship and healthier societies. But as the introduction to this report outlined, the individual economic benefits of higher education are increasingly the leading measure for students, parents, and policy makers when it comes to calculating the return on investment of a college degree.
That focus on the economic return on college is likely to gain more prominence, given how profoundly the world of work is changing. How colleges should prepare students to succeed in an evolving global, information economy will be the subject of intense debate in the decade ahead—what are the attributes students should possess by the time they graduate from college and how can they best be armed with those skills?
Faced with rapid automation and gains in artificial intelligence, Americans are anxious about the future of employment, according to a survey by the Pew Research Center. Two-thirds of Americans expect that within 50 years robots and computers will do much of the work currently done by humans (Figure 19). Their fear might not be misplaced: a 2013 study by researchers at Oxford University predicted that as many as half of the jobs in the United States were at risk of being displaced in the future because of technology (although academics remained skeptical). 22
SOURCE: PEW RESEARCH CENTER
FIGURE 19 TWO-THIRDS OF AMERICANS THINK THAT COMPUTERS AND ROBOTS WILL DO MUCH OF HUMAN WORK IN 50 YEARS
D E F I N I TE LY
P R O B A B LY
P R O B A B LY N OT
D E F I N I TE LY N OT
Large Corporation
Small/Medium Business
Govt/Education/ Nonprofit
ALL AMERICANS
50% 48%
46%
13% 13%7%
BY SECTOR:
15%
50%
7%
25%
TOC» 33
2 0 2 6 : T H E D E C A D E A H E A D

In 2010, the National Research Council released a report describing the broad skills students need to succeed when facing the future challenges of the workplace. Often described as “21st Century Skills,” these include a mix of cognitive, intrapersonal, and interpersonal attributes such as collaboration and teamwork, creativity and imagination, critical thinking, and problem solving. 23
Colleges and universities are already rethinking their undergraduate curriculum to make sure students learn these skills. Michigan State University, for instance, has adopted the attributes of what it calls the T-shaped professional as a cornerstone of its undergraduate education experience. The vertical bar of the T represents a person’s deep understanding of one subject matter—history, for example—as well as one industry, perhaps energy or health care. The horizontal stroke of T-shaped people is the ability to work across a variety of complex subject areas with ease and confidence, which is encouraged by the classic liberal arts.
Large employers like IBM, IDEO, and Cisco are leading initiatives to hire T-shaped professionals. IBM in particular is experimenting with ways to scan and code an applicant’s résumé to assess a T-score. 24 “The people we like to work with are T-shaped,” said James Spohrer, head of university partnerships at IBM. “We want people who can wrap their head around the whole thing and be part of teams.” 25
FIVE TRENDS DEFINING THE UNIVERSITY OF TOMORROW
Access to a universe of information in the 21st century has transformed how we communicate, process information, and learn. Yet higher education remains rooted in a rigid 19th-century model, even as providers are already delivering unbundled higher education to a growing array of students. A new “learning economy” is beginning to materialize, defined by the following five trends:
1 MATCH.COM FOR COLLEGE ADMISSIONS
Picking a college is an emotional decision, and after months or even years of courting each other, students and colleges often make a bad match. One-third of students transfer between institutions at least once before they graduate, and half of students who enroll in college never get a degree at all.
Despite the stakes involved, the college admissions process remains incredibly inefficient, and in many ways, ineffective. Colleges annually buy lists of student names from testing companies and then start marketing to them. If anything has changed, it is how early that marketing begins. Nearly half of the nation’s colleges start sending materials to prospective students during their sophomore year. Almost 10 percent begin contacting students in eighth grade or earlier, according to the National Association for College Admission Counseling.
Recruiting is a time-consuming and difficult process. And for students and their families, the problem is that colleges know more about them—through the data provided on applications and transcripts—than students know about the school where they might spend the next four years and spend upwards of $200,000 on a degree.
Much of the angst around college admissions is driven by a series of dates on a calendar. Completing the application is just one more event on this calendar. It’s an indication to schools that a particular student is interested and serves as a vehicle to deliver critical information, such as high school grades, test scores, and recommendations.
TOC» 34
2 0 2 6 : T H E D E C A D E A H E A D
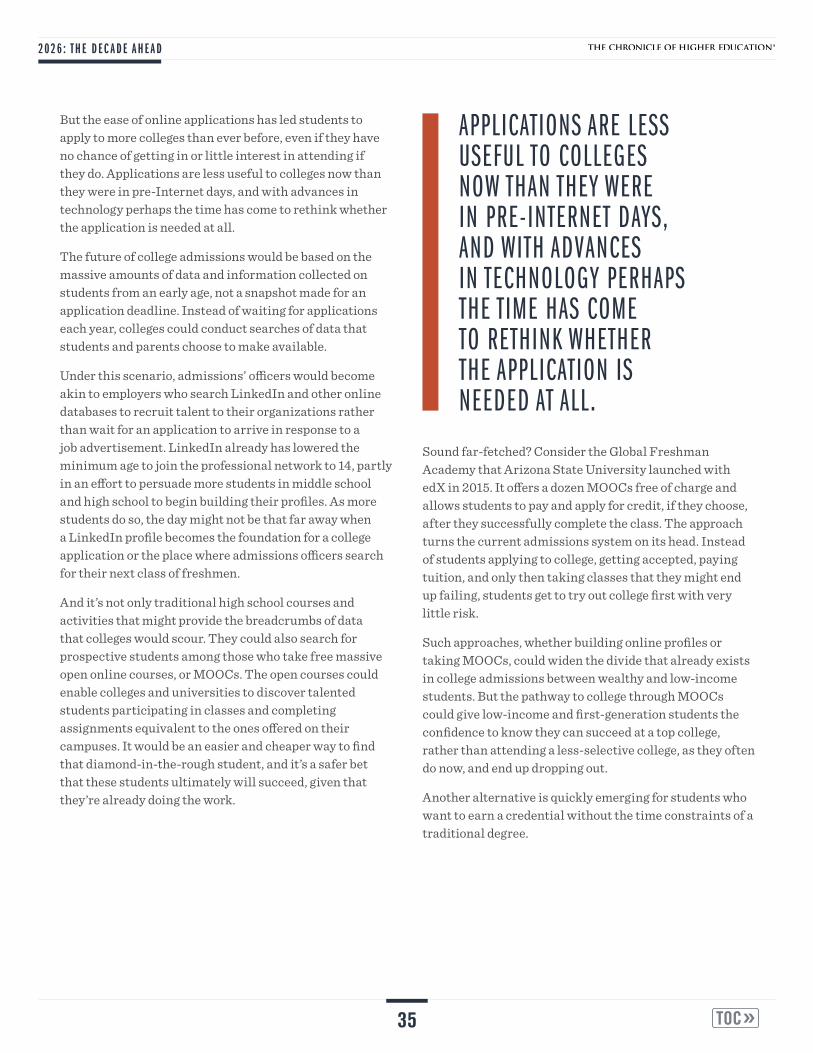
But the ease of online applications has led students to apply to more colleges than ever before, even if they have no chance of getting in or little interest in attending if they do. Applications are less useful to colleges now than they were in pre-Internet days, and with advances in technology perhaps the time has come to rethink whether the application is needed at all.
The future of college admissions would be based on the massive amounts of data and information collected on students from an early age, not a snapshot made for an application deadline. Instead of waiting for applications each year, colleges could conduct searches of data that students and parents choose to make available.
Under this scenario, admissions’ officers would become akin to employers who search LinkedIn and other online databases to recruit talent to their organizations rather than wait for an application to arrive in response to a job advertisement. LinkedIn already has lowered the minimum age to join the professional network to 14, partly in an effort to persuade more students in middle school and high school to begin building their profiles. As more students do so, the day might not be that far away when a LinkedIn profile becomes the foundation for a college application or the place where admissions officers search for their next class of freshmen.
And it’s not only traditional high school courses and activities that might provide the breadcrumbs of data that colleges would scour. They could also search for prospective students among those who take free massive open online courses, or MOOCs. The open courses could enable colleges and universities to discover talented students participating in classes and completing assignments equivalent to the ones offered on their campuses. It would be an easier and cheaper way to find that diamond-in-the-rough student, and it’s a safer bet that these students ultimately will succeed, given that they’re already doing the work.
Sound far-fetched? Consider the Global Freshman Academy that Arizona State University launched with edX in 2015. It offers a dozen MOOCs free of charge and allows students to pay and apply for credit, if they choose, after they successfully complete the class. The approach turns the current admissions system on its head. Instead of students applying to college, getting accepted, paying tuition, and only then taking classes that they might end up failing, students get to try out college first with very little risk.
Such approaches, whether building online profiles or taking MOOCs, could widen the divide that already exists in college admissions between wealthy and low-income students. But the pathway to college through MOOCs could give low-income and first-generation students the confidence to know they can succeed at a top college, rather than attending a less-selective college, as they often do now, and end up dropping out.
Another alternative is quickly emerging for students who want to earn a credential without the time constraints of a traditional degree.
APPLICATIONS ARE LESS USEFUL TO COLLEGES NOW THAN THEY WERE IN PRE-INTERNET DAYS, AND WITH ADVANCES IN TECHNOLOGY PERHAPS THE TIME HAS COME TO RETHINK WHETHER THE APPLICATION IS NEEDED AT ALL.
TOC» 35
2 0 2 6 : T H E D E C A D E A H E A D

2 LEARNING BASED ON COMPETENCIES, NOT SEAT TIME
Competency-based education allows students to move at their own pace, showcasing what they know instead of simply sitting in a classroom for a specific time period. The concept dates back to the 1970s, but until recently it was seen as a fringe idea adopted by nontraditional universities, such as Western Governors University, an online university based in Utah.
Attitudes about competency-based education are beginning to change, in large part because well-known universities, including the University of Wisconsin, Northern Arizona University, and Southern New Hampshire University, have introduced their own self-paced degree programs in recent years. Indeed, the landscape is shifting so quickly that it is difficult to pin down the number of institutions offering competency-based degrees or those with plans to start such programs, with some estimates as low as 50 and others as high as 350. 26
While the particulars of competency-based education differ by institution, the general concept is the same: students demonstrate mastery of a subject through a series of assessment tests or assignments, instead of following a prescribed set of courses. Faculty mentors work closely with students throughout a degree program
to design a schedule and access the learning materials needed to demonstrate mastery, and then another group of course evaluators grades those exams, research papers, or performance assessments.
Many of those faculty mentors and coaches are part-time and hired when enrollment demands them. The resulting cost savings are passed on to students. Many competency-based programs operate on a so-called “all-you-can-eat” pricing model: students are charged a flat fee for all the courses they can take in a specific time period. The average student at Western Governors completes a degree in about two and a half years for around $15,000 in total.
Even so, competency-based education is often met with skepticism within academic circles, particularly among faculty, who have very little understanding about how it works and who view seat time as the only accurate measure of learning. That’s why most of the competency-based programs are focused on serving working adults without a college degree—a very large potential market for colleges and universities, particularly those struggling to attract traditional 18-year-olds to campus. There are nearly 45 million Americans over the age of 24 who have some college and no degree. That’s more than one in five U.S. adults.
Southern New Hampshire, for example, advertises its competency-based program, called College for America, directly to employers as a benefit for their workers. The university has forged partnerships with 100 employers around the country, including Gap, McDonald’s, and Penn Medicine, and now enrolls 3,000 students. An early assessment of the students in the program by the Education Testing Service to measure their learning and skills in areas typically emphasized in general education courses found that students performed similarly to those in on-campus programs.
While the concept of an entire credential based on competencies is probably best suited for adults who have work and life experiences, the idea that a degree should be tied to learning actual skills rather than time spent in a classroom can also be relevant to traditional students.
ATTITUDES ABOUT COMPETENCY-BASED EDUCATION ARE BEGINNING TO CHANGE, IN LARGE PART BECAUSE WELL-KNOWN UNIVERSITIES HAVE INTRODUCED THEIR OWN SELF-PACED DEGREE PROGRAMS IN RECENT YEARS.
TOC» 36
2 0 2 6 : T H E D E C A D E A H E A D

3 A DEGREE WITH COMPETENCIES AND BADGES
Employers want to hire someone with a bachelor’s degree these days even for jobs that previously didn’t require them, but at the same time recruiters increasingly place less trust in a diploma.
Those are the findings from two different studies in recent years. One was an analysis by Burning Glass, a company that evaluates job ads. It discovered, for example, that 65 percent of new job postings for executive secretaries and executive assistants asked for a bachelor’s degree.
The other study was a survey of employers by The Chronicle. It found that a quarter of employers place less value on the bachelor’s degree in hiring today than they did a decade ago. A surprising 70 percent of employers said they would ignore the requirement of a college degree altogether if the other characteristics of the candidate were a good fit.
When employers see a job candidate with a bachelor’s degree they are assured of only one thing: that the person had the self-discipline to complete 120 credit hours to qualify for the degree. That assurance is why college rankings play an outsized role in how students choose colleges. For employers and the public, a diploma from a top school is a signal that the graduate had to at least survive a rigorous game to get past Go.
A degree, however, doesn’t reveal anything about what a person actually learned. Yet students and their parents are paying tens of thousands of dollars a year for the two pieces of paper they leave college with—a diploma and a transcript. When was the last time an employer actually looked at either as proof that job candidates actually knew what they claimed on a résumé?
Today’s economy demands higher-level skills that are best learned through a mash-up of hands-on activities and different classes in various academic disciplines. That’s the experience employers want in job candidates, but aren’t always sure they are getting with a traditional bachelor’s degree.
In the future, the actual diploma students receive at graduation might be just one of several assets demonstrating what they learned.
At some universities this documentation of skills is already happening. Community colleges in North Carolina encourage students to complete coursework while earning certifications from industry groups like the National Institute for Metalworking Skills and the National Aviation Consortium. At Lipscomb University, students can qualify for badges, endorsed by outside experts, to prove they have mastered skills such as “active listening” and “drive and energy.” Students at Elon University get an “extended transcript” describing their nonacademic accomplishments. 27
Instead of asking for a bachelor’s degree in a job ad, employers might request a list of skills and match up candidates based on what they actually know instead of the proxy used now—the name on a degree. This approach could open up job opportunities to a broader array of students who didn’t go to top institutions. The name on a diploma would probably still matter in a hiring process that is inevitably full of hidden biases, but it wouldn’t be the only signal that someone is fit for a job.
IN THE FUTURE, THE ACTUAL DIPLOMA STUDENTS RECEIVE AT GRADUATION MIGHT BE JUST ONE OF SEVERAL ASSETS DEMONSTRATING WHAT THEY LEARNED.
TOC» 37
2 0 2 6 : T H E D E C A D E A H E A D

4 A UNIVERSITY FOR LIFE
In 2014, a group of faculty members and students at Stanford University’s design school unveiled their ideas from a yearlong exercise to rethink what undergraduate education at the institution might be in the year 2025. One of their proposals was for an “open loop university.” Instead of offering undergraduates the usual four years of education, Stanford would admit students for six years of study that they could use at any time in their life. It would be a university for life, with students looping in and out at their convenience.
This university for life is already being built by recent graduates who are navigating a network of providers outside of traditional colleges and universities to acquire the extra training they need for the workplace—without returning to school for an additional degree. With 40 percent of overall student debt now held by graduate students, more and more twenty-somethings are questioning the value of a master’s degree. The number of American students enrolling in graduate school has been on the decline since 2011 (although overall enrollment is up because of international students).
Instead, those with newly minted bachelor’s degrees are heading to boot camps, short-term training schools, which provide the foundational knowledge they need to get started in a job. These boot camps teach skills in high demand in the job market, such as computer coding. But other occupations could be ripe for boot camps in the coming decade, including the medical fields.
For now, the traditional players in higher education are somewhat protected because students in these programs can’t access federal aid, and as a result, must pay out-of-pocket for tuition that can run upwards of $12,000 for a 12-week program. But recently, the U.S. Department of Education announced that it would run an experiment to open up student aid to boot camps through partnerships with traditional colleges already eligible for federal programs.
Such partnerships might form the basis of a university for life, where traditional higher-education institutions curate channels of content from various providers and then push it out to their students and alumni, much like Apple and Google build playlists for their music streaming services. Such content won’t replace the residential campus any time soon, but it will provide students and alumni more value for their money by giving them access to learning platforms when they need them throughout their lifetimes.
5 HIGHER EDUCATION POWERED BY DATA ANALYTICS
Student learning in college has long been assessed by professors well after the actual knowledge transfer takes place in a classroom—through a test given weeks or months later or a capstone project due at the end of the semester. Often, little assessment is done in real time, nor do professors tweak their teaching style to react to student feedback.
Now, technology is being introduced in the classroom and across campuses that can measure student learning in real time and allow students and professors to shift their behavior to change outcomes. This technology—known as data analytics or predictive analytics—is powered by the information bites being created in classrooms every minute of the day. IDC, a consulting firm, predicts that by 2020, 1.7 megabytes of new information will be created every second for every human being on the planet.
THIS UNIVERSITY FOR LIFE IS ALREADY BEING BUILT BY RECENT GRADUATES WHO ARE NAVIGATING A NETWORK OF PROVIDERS OUTSIDE OF TRADITIONAL COLLEGES AND UNIVERSITIES TO ACQUIRE THE EXTRA TRAINING THEY NEED FOR THE WORKPLACE.
TOC» 38
2 0 2 6 : T H E D E C A D E A H E A D
By collecting and analyzing data about student performance, a handful of universities have developed tools to track patterns that provide more personalized advising and course delivery. This approach to using information collected in the normal course of daily life is similar to how corporate America mines data about its customers to better appeal to their buying habits. The science behind these advising systems is the same one that drives the algorithms that recommend music on Spotify and movies on Netflix.
In the case of higher education, data analytics allows institutions such as Arizona State University, Virginia Commonwealth University, and Austin Peay State University in Tennessee to predict outcomes for students in particular courses or majors based on the performance of similar students in the past. For example, colleges know that a student who does not do well in statistics during his or her freshman year is not likely to finish a degree in economics.
But the true promise of predictive analytics lies in the classroom with the ability of institutions to electronically track, collect, and aggregate more data on learning moments in the classroom. The learning management system (LMS), which grew up in the first wave of technology in the late 1990s, is now seen as clunky as students and even professors push to use their own devices for learning, anytime and anywhere.
Students are moving beyond the confines of the LMS to find their own study aids online on YouTube or Amazon. So passive lecture classes that follow the “sage on the stage” model aren’t effective for a new generation of students, nor do they indicate whether students are engaged in their learning. Instead, the future is unfolding on campuses such as the University of Michigan and Case Western Reserve University where professors already track how often and for how long students watch videos in “flipped classrooms,” and even which parts of the lecture might be causing them difficulty.
When the personal computer was first introduced on college campuses, so too was the promise that technology would improve student learning and reduce costs. The latter has definitely not happened, and the first point remains heavily debated. But this much is for sure: the proliferation of new mobile technology and the explosion of big data in the past few years means that if colleges plan to engage the next generation of students, they need to develop an institution-wide approach to technology, a digital strategic plan that covers everything from new entry points for admissions to learning analytics to lifelong learning and micro-credentials.
TECHNOLOGY IS BEING INTRODUCED IN THE CLASSROOM AND ACROSS CAMPUSES THAT CAN MEASURE STUDENT LEARNING IN REAL TIME AND ALLOW STUDENTS AND PROFESSORS TO SHIFT THEIR BEHAVIOR TO CHANGE OUTCOMES.
TOC» 39
2 0 2 6 : T H E D E C A D E A H E A D

A merican higher-education institutions are under enormous strain. For the vast majority of institutions, decades of stable student
enrollment and steady growth in revenue are over, replaced with a future of shifting demographics, existential questions about the future of the faculty, and a dizzying array of technology options for teaching and learning.
At the same time, not only is there a growing economic divide among students as described in Section I, but there is an ever-widening gap between institutions. Today, the wealthiest 40 universities tracked by Moody’s Investors Service account for some two-thirds of total wealth in higher education. The top 10 hold nearly one-third of the overall wealth. The numbers are staggering. Median cash and investments of the wealthiest universities was $6.3 billion compared to $273 million for everyone else in 2014.
After struggling to weather the storms that have roiled higher education over the eight years since the onset of the Great Recession, college and university leaders are left to wonder what’s next. Which institutions will survive, and more important, which ones will thrive, and why?
A closer look at the most innovative campuses and leaders of the past decade paints a potentially optimistic picture for the rest of higher education. Take, for example, the University Innovation Alliance, a collaboration of 11 public research universities with 400,000 students that aims at improving student outcomes by sharing best practices. In the first two years of the group’s existence, its member universities have increased the proportion of degrees awarded to low-income students and expect to graduate in the next decade 30,000 more students than originally projected.
Now the question is whether other institutions will follow: Will colleges and universities understand the unique threats they face? Will they exhibit a willingness to adapt to a changing market? Those that will thrive in the future will likely do so by differentiating themselves, by tailoring their academic offerings and focusing on specific segments of students rather than trying to serve everyone with a one-size-fits-all model.
There is a path forward, and this report outlined several approaches and strategies that colleges and universities can take in the future.
On the student side of the equation, institutions can find new markets of traditional students in the growing South, as well as a large crop of non-traditional students nearly everywhere who have some college credit but no degree. To attract and retain those students, however, more institutions need to shift their emphasis away from merit-aid to affordability and dedicate more money to need-based aid.
On the faculty side, colleges will need to imagine a more flexible workforce in the future as Section II of the report examined. Flexibility, however, should not be confused with a call to use more part-time adjuncts in place of full-time faculty. No one seems happy with the increased adjunctification of higher education in recent years, and the research makes clear that it has resulted in worse student outcomes. Instead, colleges and universities will need to build a new faculty model, from differentiating between research and teaching positions, to varying pathways to tenure, to even new tenure clocks that guarantee a specific time commitment followed by one-year contracts.
CONCLUSION
TOC» 40

Perhaps the biggest unknown in the decade ahead for higher education is in an area that has remained largely unchanged for centuries: teaching and learning. Technology is changing so quickly, and the past few years have seen a buzz of activity among entrepreneurs, venture capitalists, and higher-education leaders trying to figure out how new delivery methods could shift the cost curve for academe.
The approaches institutions can take to the challenges they face are abundant, and in some cases, overlapping. But unlike in the past, when colleges developed their plans based on intuition and the desires and interests of faculty members, the strategies for the next decade need to be rooted in data. Student advising, scheduling, even adding and eliminating academic programs have always been based on instinct and experience. Now the data exist to track students, the classes they took, how they performed, and their outcomes after graduation—all of which can inform decisions in the future.
Finally, forging a path forward doesn’t mean that institutions need to make that journey alone. Collaboration will mark the decade ahead—from simple partnerships like the University Innovation Alliance to more integrated partnerships or outright mergers. Such strategies offer the chance for institutions to enter the new markets described in Section I, or more easily take advantage of the emerging technologies described in Section III.
Since the turn of the century, as technology has disrupted legacy industries from the media to music, analogies have often been made to higher education. Some predict colleges will become the next Borders, Blockbuster, or Tower Records by going out of business. But such comparisons tend to ignore the fact that higher education in the United States is a heavily regulated and subsidized industry.
Perhaps a more apt analogy might be to cities. They tend to evolve, change, and grow over time, but rarely do they die. The same is likely to be true of higher education in the decade ahead, as it evolves to adapt to a new generation of students, faculty, and technological advances.
TOC» 41
2 0 2 6 : T H E D E C A D E A H E A D

ENDNOTES
1 As quoted in Dan Berrett, “Teaching Revival,” The Chronicle of Higher Education, March 9, 2015.
2 The demographic projections in this chapter, unless otherwise noted, depend on the Western Interstate Commission for Higher Education, Knocking at the College Door: Projections of High School Graduates, December 2012. http://www.wiche.edu/knocking-8th.
3 Department of Labor, Bureau of Labor Statistics, College Enrollment and Work Activity of High School Graduates, 2015. http://www.bls.gov/news.release/hsgec.toc.htm.
4 Nicholas Hillman and Taylor Weichman, 2016, Education-Deserts: The Continued Significance of “Place” in the Twenty-First Century. Viewpoints: Voices from the Field. Washington, D.C.: American Council on Education. . https://www.acenet.edu/news-room/Documents/Education-Deserts-The-Continued-Significance-of-Place-in-the-Twenty-First-Century.pdf.
5 As quoted in Eric Hoover and Josh Keller, “More Students Migrate Away From Home,” The Chronicle of Higher Education, October 30, 2011.
6 As quoted in Sara Lipka, “Demographic Data Let Colleges Peer Into the Future,” The Chronicle of Higher Education, January 19, 2014.
7 Pew Research Center, 2015, “The American Middle Class Is Losing Ground,” Washington, D.C. December. http://www.pewsocialtrends.org/2015/12/09/the-american-middle-class-is-losing-ground/.
8 Lipka, “Demographic Data Let Colleges Peer Into the Future.”
9 Pranav Sharma and Eva Bogaty, “2016 Outlook—Moderate Revenue Growth Supports Sector Stability,” Moody’s Investors Services, December 2, 2015.
10 Jeff Denneen and Tom Dretler, “The Financially Sustainable University.” Bain Brief, July 6, 2012. http://www.bain.com/publications/articles/financially-sustainable-university.aspx.
11 Seth Reynolds, Jill Greenburg, and Jeffrey J. Selingo, “Strength in Numbers: Strategies for Collaborating in a New Era for Higher Education,” Parthenon-EY, May 2016.
12 Government Accountability Office, “State and Local Governments’ Fiscal Outlook: April 2013 Update” (April 2013), http://www.gao.gov/special.pubs/longterm/state/index.html.
13 Audrey Williams June, “Aging Professors Create a Faculty Bottleneck,” The Chronicle of Higher Education, March 18, 2012.
14 Paul J. Yakoboski, Understanding the Faculty Retirement (Non)Decision. TIAA-CREF Institute. June 2015.
15 “The Graying Campus: How College Leaders and Faculty View Retirement and Its Impact on the Future of Higher Education,” The Chronicle of Higher Education, 2014.
16 P. Brett Hammond and Harriet P. Morgan, eds., Ending Mandatory Retirement for Tenured Faculty: The Consequences for Higher Education, National Research Council, 1991.
17 Orley Ashenfelter and David Card, “Did the Elimination of Mandatory Retirement Affect Faculty Retirement?” American Economic Review, 2002, v. 92 (4, Sept), 957-980.
18 Ronald Ehrenberg and Liang Zhang, Do Tenured and Tenure-Track Faculty Matter? (Cambridge, MA: National Bureau of Economic Research, 2004).
19 Adrianna Kezar, Daniel Maxey, and Elizabeth Holcombe, “The Professoriate Reconsidered,” The Delphi Project on the Changing Faculty and Student Success, October 2015.
20 Patrick Harker, “Adding a Teacher Between TA and Professor,” The Chronicle of Higher Education, September 30, 2014.
21 Dan Berrett, “Instructional Design,” The Chronicle of Higher Education, February 29, 2016.
22 Carl Benedikt Frey and Michael A. Osborne, “The Future of Employment: How Susceptible Are Jobs to Computerization?” University of Oxford Martin School, September 17, 2013.
23 James W. Pellegrino and Margaret L. Hilton, eds., Committee on Defining Deeper Learning and 21st Century Skills; Center for Education; Division on Behavioral and Social Sciences and Education; National Research Council, 2010.
24 Carla Hickman, “Creating T-Shaped Professionals,” EAB White Paper, Washington, D.C.: July 30, 2014.
25 As quoted in Jeffrey J. Selingo, There Is Life After College: What Parents and Students Should Know About Navigating School to Prepare for the Jobs of Tomorrow, New York: HarperCollins, 2016.
26 Robert Kelchen, The Landscape of Competency Based Education (Washington, D.C.: American Enterprise Institute, 2015).
27 Goldie Blumenstyk, “When a Degree Is Just the Beginning,” The Chronicle of Higher Education, September 14, 2015.
TOC» 42

Students study in the cafeteria at Chabot College in Hayward, California. Chabot is a community college that offers job skills training and education in areas such as nursing, accounting, mechanics, and other skilled trades. Community colleges catering to non-traditional students are an affordable alternative to a four-year degree at a university.CO
URTE
SY TO
NY AV
ELAR
, GET
TY IM
AGES
/ TH
E CH
RIST
IAN
SCIE
NCE
MONI
TOR

1255 Twenty-Third Street, N.W. Washington, D.C. 20037
(202) 466-1000 | Chronicle.com
Copyright ©2016
©2016 by The Chronicle of Higher Education, Inc. All rights reserved. This material may not be reproduced without prior written permission of The Chronicle. For permission requests, contact us at [email protected]