the characteristics of successful benchmarking …specifically, the study objective is to measure...
TRANSCRIPT

Copyright is owned by the Author of the thesis. Permission is given for a copy to be downloaded by an individual for the purpose of research and private study only. The thesis may not be reproduced elsewhere without the permission of the Author.

The Characteristics of Successful Benchmarking
Implementation
Guidelines for a national strategy for promoting benchmarking
A thesis presented in partial fulfilment of the
requirements for the degree in Master of Philosophy in Science and
Advanced Technology
at Massey University, Manawatu, New Zealand
Ahmed Abbas
2014

ii

iii
Abstract
The MPhil research project presented in this thesis forms the first part of
an intended PhD research project. The purpose of the PhD will be to develop a
framework to increase the uptake of benchmarking on a national level whilst the
aim of the MPhil is to examine the state of benchmarking globally. More
specifically, the study objective is to measure and understand the perceived
effectiveness, awareness, current and future uptake of benchmarking. The study
also explores best practice benchmarking characteristics such as duration of the
projects, motivations of benchmarking projects and main benefits of
benchmarking.
An on-line questionnaire was used to collect data. The questionnaire was
translated into five languages and promoted mainly by the Global Benchmarking
Network, (GBN) a network of benchmarking centres representing 21 countries.
The data was then analysed using SPSS statistical package.
The questionnaire consists of seven sections: (1) Organisation’s profile,
(2) Use of improvement technique, (3) General questions on benchmarking, (4)
Best practice benchmarking projects planning phase, (5) Best practice
benchmarking projects research and analysis phase, (6) Best practice
benchmarking projects implementation phase, and finally (7) Best practice
benchmarking projects evaluation phase.
The analysis suggests that informal and performance benchmarking is
being used by a majority of organisations while best practice benchmarking is
lagging behind them. Benchmarking awareness, effectiveness and future uptake
compares favourably with other popular improvement techniques.

iv
Table of Content
Abstract ....................................................................................................................... iii
Table of Content .......................................................................................................... iv
List of Figures .............................................................................................................. ix
Chapter 1: Introduction to the Research ........................................................................ 1
1.1 Introduction to the chapter .............................................................................. 1
1.2 Background to the research ............................................................................ 1
1.3 Aim and objectives of the research ................................................................. 2
1.4 Scope of the research ..................................................................................... 3
1.5 Importance of the research and outcomes ...................................................... 3
1.6 Outline of the thesis ........................................................................................ 4
Chapter 2: Literature Review......................................................................................... 5
2.1 Introduction ..................................................................................................... 5
2.2 The raise of benchmarking.............................................................................. 5
2.3 Description of benchmarking ........................................................................... 6
2.4 Types and Pitfalls of Benchmarking ................................................................ 8
2.5 Best Practice Benchmarking ......................................................................... 11
2.6 Large Scale Benchmarking Initiatives ........................................................... 12
Chapter 3: Research Methodology .............................................................................. 15
3.1 Introduction ................................................................................................... 15
3.2 Research Questions ..................................................................................... 15
3.3 Data Sources ................................................................................................ 15
3.4 Questionnaire Development .......................................................................... 17
3.5 Questionnaire Structure and Questions ........................................................ 18
3.6 Validity and Reliability ................................................................................... 19
3.7 Questionnaire Delivery Methods and Distribution Channels .......................... 20
Chapter 4: Results ...................................................................................................... 21
4.1 Introduction ................................................................................................... 21
4.2 Survey Results .............................................................................................. 21
4.3 Survey Results Analysis ............................................................................... 21
4.3.1 Questionnaire Section 1 Organisation Profile ......................................... 21
4.3.1.1 Question 1.1 Responses Distribution. ............................................. 21
4.3.1.2 Question 1.2. What is your organisation’s major business activity? 24
4.3.1.3 Question 1.3. Within which sector does your organisation operate? 25

v
4.3.1.4 Question 1.4. For how many years has your organisation been
operating?26
4.3.2 Questionnaire section 2. Use of Improvement Techniques .................... 27
4.3.2.1 Question 2.1. Improvement techniques implemented in your
organisation. ................................................................................................... 27
4.3.2.2 Question 2.2. What are the main reasons for not using performance
benchmarking or best practice benchmarking within your organisation? ......... 32
4.3.3 Questionnaire Section 3 General Questions on Benchmarking .............. 33
4.3.3.1 Question 3.1. Benchmarking Training, Data Collection and
Dissemination of Results. ................................................................................ 33
4.3.3.2 Question 3.2. For each of the following performance areas, does your
organisation collect benchmarks (performance comparison data on other
companies)? ................................................................................................... 35
4.3.3.3 Question 3.3. Which of the following services in benchmarking, if
supplied by a third party (an external organisation), would your organisation
potentially use? ............................................................................................... 40
4.3.3.4 Question 3.4 Does your organisation currently use benchmarking
services provided by a third party? .................................................................. 41
4.3.3.5 Question 3.5. If there was a national or regional benchmarking award
to encourage organisations to undertake benchmarking projects, would your
organisation be interested in applying or finding out more information about it?
42
4.3.4 Survey Section 4: Best Practice Benchmarking Projects - Planning....... 43
4.3.4.1 Question 4.1. How many benchmarking projects do you conduct per
year (typically)? ............................................................................................... 43
4.3.4.2 Question 4.2. What is the size of a typical benchmarking team within
your organisation? ........................................................................................... 44
4.3.4.3 Question 4.3. Does your organisation use a particular methodology for
undertaking benchmarking projects? ............................................................... 45
4.3.4.4 Question 4.4. How long does a benchmarking project normally take?
46
4.3.4.5 Question 4.5. What are the main reasons for undertaking
benchmarking projects? .................................................................................. 47

vi
4.3.4.6 Question 4.6. In the last three years which areas of your organisation
have conducted benchmarking projects?......................................................... 48
4.3.4.7 Question 4.7. Our benchmarking project teams usually consist of
people from the following areas. ...................................................................... 49
4.3.4.8 Question 4.8. What types of benchmarking projects do you usually
conduct? 50
4.3.4.9 Question 4.9. When planning a benchmarking project. ................... 51
4.3.5 Section 5: Best Practice Benchmarking Projects - Research and Analysis
54
4.3.5.1 Question 5.1. Which of the following methods does your organisation
use to collect benchmarking data and best practice information? .................... 54
4.3.6 Section 6: Best Practice Benchmarking Projects - Implementation ........ 55
4.3.6.1 Question 6.1. How long does the implementation phase typically take?
55
4.3.6.2 Question 6.2. What percentage of benchmarking projects result in
implementation? .............................................................................................. 56
4.3.7 Section 7: Evaluation ............................................................................. 57
4.3.7.1 Question 7.1 At the end of a benchmarking project, do you measure
the improvements that have occurred? ............................................................ 57
4.3.7.2 Question 7.2. The outcomes (best practices and/or results achieved)
from benchmarking projects are typically communicated by: ........................... 60
4.3.7.3 Question 7.3. The main benefits of benchmarking projects have been:
61
4.3.7.4 Question 7.4. On average, what is the financial return (US$) from a
typical benchmarking project after one year of implementation? ...................... 62
4.3.7.5 Question 7.5. Approximately, what percentage of time is spent by your
organisation on each phase of the benchmarking process out of total time spent?
63
4.3.7.6 Question 7.6. According to your experience, how do the following
factors contribute to the success of a benchmarking project? .......................... 64
4.3.8 Cross Tabulation Results ....................................................................... 66
4.3.8.1 Typical benchmarking team size in major effectiveness benefit
organisations ................................................................................................... 66
vii
4.3.8.2 Frequency of providing best practice benchmarking training to the
employees in each sector ................................................................................ 67
4.3.8.3 Benchmarking methodology used in each sector ............................ 67
4.3.8.4 Future use of benchmarking for each organisation size .................. 68
4.3.8.5 Types of best practice benchmarking projects in each organisation
size 69
4.3.8.6 Employee-related data collection in each sector ............................. 70
4.3.8.7 Customer-related data collection in each sector ............................. 71
4.3.8.8 Financial-related data collection in each sector .............................. 72
4.3.8.9 Process-related data collection in each sector ................................ 73
4.3.8.10 Product-related data collection in each sector ................................ 74
4.3.8.11 Main reasons for not using benchmarking in large organisations .... 75
4.3.8.12 Main reasons for not using benchmarking in medium organisations 76
4.3.8.13 Main reasons for not using benchmarking in small organisations ... 77
4.3.8.14 Main reasons for not using benchmarking in micro organisations ... 78
4.3.8.15 Main reasons for using benchmarking in each sector. .................... 79
Chapter 5: Discussion and Conclusion ....................................................................... 81
5.1 Introduction to the Chapter ........................................................................... 81
5.2 Awareness and Uptake of Benchmarking ..................................................... 81
5.3 Effectiveness of Benchmarking ..................................................................... 82
5.4 Future Use of Benchmarking ........................................................................ 83
5.5 Benchmarking and the Other Performance Improvement Tools .................... 84
5.6 Best Practice Benchmarking ......................................................................... 84
5.7 Conclusion .................................................................................................... 87
5.8 Research Limitations .................................................................................... 88
5.9 Future research ............................................................................................ 89
References ................................................................................................................. 90
Bibliography ................................................................................................................ 95
Appendix-I: Benchmarking Definitions ........................................................................ 99
Appendix-II: Global Benchmarking Network (GBN) members ................................... 100
Appendix-III: Questionnaire ...................................................................................... 103

viii

ix
List of Figures
Figure 1. Research Plan ..................................................................................... 3
Figure 2. World responses distribution .............................................................. 22
Figure 3. Responses distribution by country ..................................................... 23
Figure 4. Responses distribution by organisation size ...................................... 24
Figure 5. Response distribution by business activity ......................................... 25
Figure 6. Responses distribution by sector ....................................................... 26
Figure 7. Number of years in operation ............................................................. 27
Figure 8. Awareness of business improvement techniques .............................. 28
Figure 9. Current use of business improvement techniques ............................. 29
Figure 10. Effectiveness of business improvement techniques ........................ 30
Figure 11. Future use of improvement techniques ............................................ 31
Figure 12. Reasons for not using benchmarking or best practice benchmarking
.......................................................................................................................... 32
Figure 13. Benchmarking training for employees .............................................. 33
Figure 14. Collection and use of benchmarking data ........................................ 34
Figure 15. Disseminations of best practices ..................................................... 35
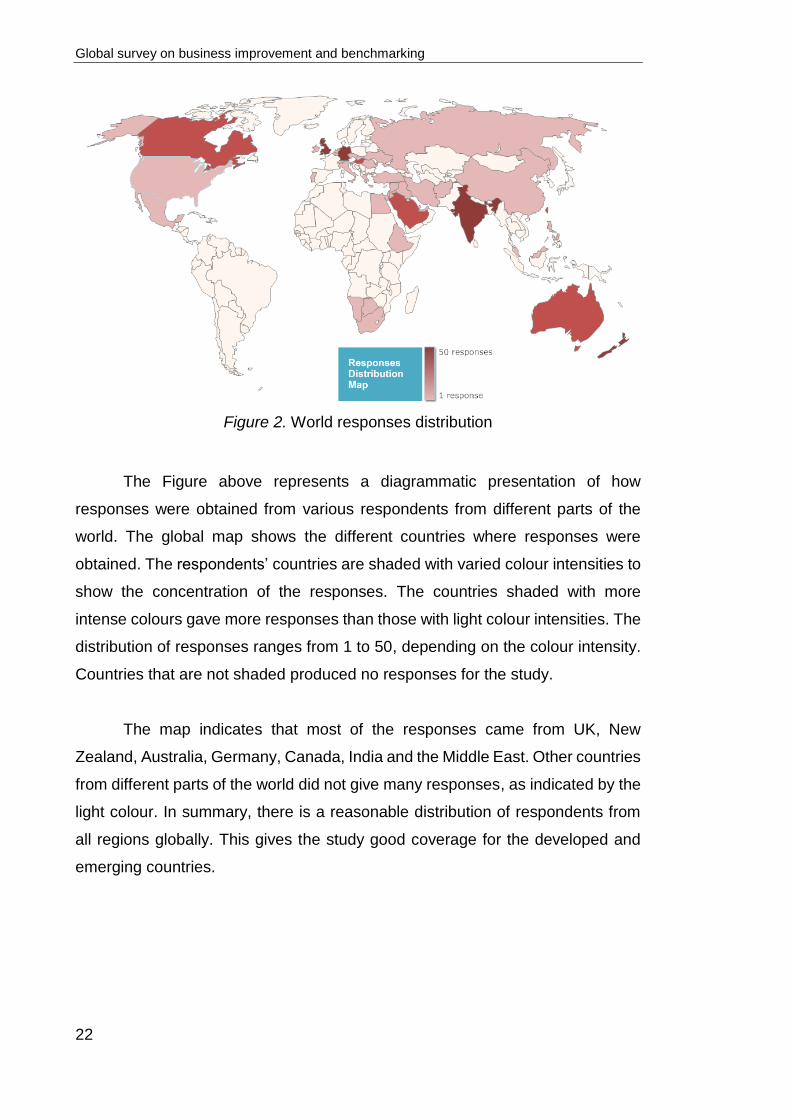
Figure 16. Collection of benchmarking data in employee-related area ............. 36
Figure 17. Collection of benchmarking data in financial-related areas .............. 37
Figure 18. Collection of benchmarking data in process-related areas .............. 38
Figure 19. Collection of benchmarking data in product or services related areas
.......................................................................................................................... 39
Figure 20. Collection of benchmarking data in customer-related areas ............ 39
Figure 21. Most important services supplied by third party ............................... 41
Figure 22. Current use of benchmarking service by third party provider ........... 42
Figure 23. Level of interest in a benchmarking award ....................................... 42
Figure 24. Number of benchmarking project per year ....................................... 44
Figure 25. Size of typical benchmarking team .................................................. 45
Figure 26. Methodology used in benchmarking projects ................................... 46
Figure 27. Duration of benchmarking projects .................................................. 47
Figure 28. Main reasons for undertaking benchmarking ................................... 48
Figure 29. Benchmarking in organisation areas ................................................ 49
Figure 30. Benchmarking team structure .......................................................... 50
x
Figure 31. Types of benchmarking projects ...................................................... 51
Figure 32. Project brief development ................................................................ 52
Figure 33. Calculating the financial aspects of the project ................................ 53
Figure 34. Adherence to code of conduct ......................................................... 54
Figure 35. Most popular data collection methods ............................................. 55
Figure 36. Implementation phase duration........................................................ 56
Figure 37. Percentage of benchmarking projects ending with implementation . 57
Figure 38. Evaluating improvements ................................................................ 58
Figure 39. Financial analysis at the end of benchmarking projects ................... 59
Figure 40. Evaluating benchmarking project process ....................................... 60
Figure 41. Methods of project outcomes communication .................................. 61
Figure 42. Main benefits of benchmarking projects .......................................... 62
Figure 43. Financial return of benchmarking projects ....................................... 63
Figure 44. Time allocation for each phase of benchmarking project ................. 64
Figure 45. Most important requirements for a successful benchmarking project
.......................................................................................................................... 65
Figure 46. Typical benchmarking team size and benchmarking project benefit 66
Figure 47. Frequency of providing best practice training in each sector ........... 67
Figure 48. Use of benchmarking methodology in each organisation size ......... 68
Figure 49. Future use of best practice benchmarking in different organisation
sizes.................................................................................................................. 69
Figure 50. Types of implemented benchmarking projects in different organisation
sizes.................................................................................................................. 70
Figure 51. Percentage of collecting employee-related benchmarks in each sector
.......................................................................................................................... 71
Figure 52.Percentage of collecting customer-related benchmarks in each sector
.......................................................................................................................... 72
Figure 53. Percentage of collecting financial-related benchmarks in each sector
.......................................................................................................................... 73
Figure 54. Percentage of collecting process-related benchmarks in each sector
.......................................................................................................................... 74
Figure 55. Percentage of collecting product-related benchmarks in each sector
.......................................................................................................................... 75
Figure 56. Main reasons for not using benchmarking in large organisations .... 76

xi
Figure 57. Main reasons for not using benchmarking in medium organisations 77
Figure 58. Main reasons for not using benchmarking in small organisations .... 78
Figure 59. Main reasons for not using benchmarking in micro organisations ... 79
Figure 60. Main reasons for undertaking benchmarking projects in each sector
.......................................................................................................................... 80

xii

Global survey on business improvement and benchmarking
1
Chapter 1: Introduction to the Research
1.1 Introduction to the chapter
This chapter explains the research background, aim and objectives,
scope, and outline of the thesis.
1.2 Background to the research
Benchmarking has become an area of interest in the past three decades
for quality developers. It has been recognised as one of the tools for improving
performance and increasing productivity. Any organisation wanting to adopt best
practices for their processes or strategies can use benchmarking. To date,
benchmarking exercises have been initiated by organisations that have identified
the importance and capability of benchmarking in improving their performance.
Other organisations that are unaware of benchmarking and its benefits are either
not implementing benchmarking correctly or are far from starting any
benchmarking project.
There are national programmes sponsored by government departments
and non-profit organisations to implement different programmes to enhance
national productivity, innovation and competitiveness. Benchmarking, as a
powerful learning tool, can play an important role in boosting the results of these
programmes. Therefore, this research mainly aims to develop a national strategy
or a framework to promote the use of benchmarking on a national level.
In spite of the increasing number of published works in benchmarking, the
majority of the publications are a result of a practitioners’ efforts, which call for a
need for a theoretical development in many areas of benchmarking (Dattakumar
& Jagadeesh, 2003; Yasin, 2002); in particular, in developing a strategy to
promote benchmarking on a national level. Therefore, research in this field is

Global survey on business improvement and benchmarking
2
significant, in terms of bridging one of the gaps between theoretical work and
implementation.
A combination of qualitative and quantitative methods will be used to
achieve the aim of this research, by using a questionnaire and interviews
targeting the custodians of benchmarking programmes and questionnaires
targeting organisations that participate in benchmarking programmes. Supporting
statistical data and records as secondary data are presented in the methodology
section.
Upon completion of this research it is expected that this research will
contribute to both academic and practitioner communities.
1.3 Aim and objectives of the research
The main aim of the research is to develop a set of guidelines to help
organisations that are responsible for national benchmarking programmes to
increase the use of benchmarking within their country. In order to achieve this
aim of the research, it is required that the following specific objectives are met:
1. Evaluate the current status of benchmarking in terms of awareness,
use, perception, effectiveness of benchmarking, and identify possible
change in benchmarking uptake.
2. Identify the characteristics of current best practice benchmarking
deployment.
3. To identify the benefits of developing a national benchmarking
strategy. Since benchmarking is a learning tool, a national programme
will have an impact on other programmes such as the Business
Excellence Programme, and identifying the benefit/effect will help in
integrating the national strategy with other national programmes.
4. To identify the key components of a national benchmarking strategy. A
national strategy could be the number of initiative designed for different
organisations; for example for the public sector, or large organisations
or SMEs. It could be in form of technical assistance such as offering a
benchmarking database, training programme or other types of
assistance. Therefore, it is essential to identify the required
components for a successful strategy.

Global survey on business improvement and benchmarking
3
5. To identify best practices in the design and deployment of a national
benchmarking strategy. It is important to take into consideration the
different factors that influence the design and deployment of the
strategy during design and deployment; this is to ensure the maximum
efficiency and effectiveness.
Due to the large scope of this research project, which is beyond the M.Phil
timeframe, it is unlikely all the objectives will be achieved. Therefore, the
M.Phil research will cover the first four objectives only (Figure 1).
Figure 1. Research Plan
1.4 Scope of the research
The scope of the research is described as follows:
a. This research focuses on identifying the current status of benchmarking
and the characteristics of a successful benchmarking.
b. This research is intended for researchers and academics who are
interested in quality and performance improvement, practitioners and
consultants who advise and help organisations to improve their
performance, and national custodian responsible for such programmes.
1.5 Importance of the research and outcomes
For this research project, there are three key motivations:
M.Phil
Evaluate the awareness and use of
benchmarking
Identify possible
change in benchmarking uptake
Evaluate perceptions
of benchmarki
ng effectivenes
s
Identify the characteristics of current best practice benchmarki
ng deployment
Ph.D.
Identify the benefits of
developing a national
benchmarking strategy.
Identify the components of a national benchmarking strategy
Design and deployment of a national benchmarking strategy

Global survey on business improvement and benchmarking
4
• Lack of rigorous research on the international use and benefits of
benchmarking and its role in stimulating economic development.
• Lack of the theoretical development of promotion strategy of
benchmarking within a nation.
• The need for a theoretical study that combines the different types of
benchmarking in one model or framework.
There are at least three potential outcomes for this research. First is the
contribution to the research community by the theoretical examination of the
practitioners’ work. Second, for practitioners in general and benchmarking clubs
in particular, the results of the research will help them to understand the process
of promoting benchmarking. Third, the results could be implemented, at least in
New Zealand.
1.6 Outline of the thesis
The following is the preliminary chapter outline of the thesis and the key
content of each chapter.
Chapter 1: Introduction, aims, objectives and scope. In this chapter, background
of the research area will be presented.
- Chapter 2: Literature review of the previous work. In this chapter, a review
of related literature will be presented to build a theoretical framework for
the research.
- Chapter 3: Research methodology. In this chapter, a description of the
research method will be presented and why the selected methodology was
found to be the most suitable, beside validity and reliability of the used
instruments.
- Chapter 4: Data analysis and results. In this chapter, analysis of gathered
data and its relationship with the theory will presented.
- Chapter 5: Discussion and Conclusions. In this chapter, discussion of the
findings will be presented, along with author's opinions and areas of further
research.

Global survey on business improvement and benchmarking
5
Chapter 2: Literature Review
2.1 Introduction
This chapter defines benchmarking in terms of its modern origin, basic
concept, the establishment of best practice benchmarking and nation-wide
benchmarking initiatives.
2.2 The raise of benchmarking
During the 20th century, organisations around the world adopted different
tools, techniques and strategies in order to compete and survive. At present, the
competition is greater than ever, primarily because of the accelerated growth in
information technology, logistics and free trade agreements. For this reason, it is
imperative that benchmarking becomes a fundamental part of the national quality
culture of any country that intends to compete and survive in the globalisation
era.
The notions of benchmarking and best practice are not new. In 1911,
Frederick Taylor highlighted the need to identify the maximum possible
performance for each activity (Walgenbach & Hegele, 2001). However, the
concept of benchmarking as currently understood is relatively new. The first
systematic benchmarking exercise was conducted by Xerox in the late 1970s
when it sent a team to learn good practices from Fuji-Xerox in Japan (Bogan &
English, 1994; Boxwell, 1994; Mann, 2006). The reason for such trip was the
belief that one organisation can learn from another, even from its competitors.
The next stage of benchmarking development occurred in the late 1980s
when the concept of “learning from outside the industry” was introduced through
the sharing of information to another organisation from a different sector (Yasin,
2002). Further, in the 1990s, the focus of benchmarking expanded through the
benchmarking of organisational strategies and acquiring knowledge globally.
Between 1980s and 1990s, benchmarking became a popular tool among
organisations. In the early 1990s, around 65% of the Fortune 1000 organisations
chose benchmarking as the preferred management tool to gain competitive
Global survey on business improvement and benchmarking
6
advantage (Hong, Hong, Roh, & Park, 2012; and Park, 2012). In France, 50% of
1000 French companies studied indicated that they had implemented
benchmarking; furthermore, 80% of organisations considered benchmarking as
an effective tool (Maire, Bronet, & Pillet, 2005).
A study in the UK revealed that around 45% of 559 organisations studied
were using benchmarking. The study also revealed other issues with
benchmarking in the UK; for example, benchmarking implementation was found
to be low in small organisations and the larger the organisation was, the more
likely it would be using benchmarking. Furthermore, the benchmarking uptake
was low in retailing and services and high in utilities and health (Hinton, Francis,
& Holloway, 2000).
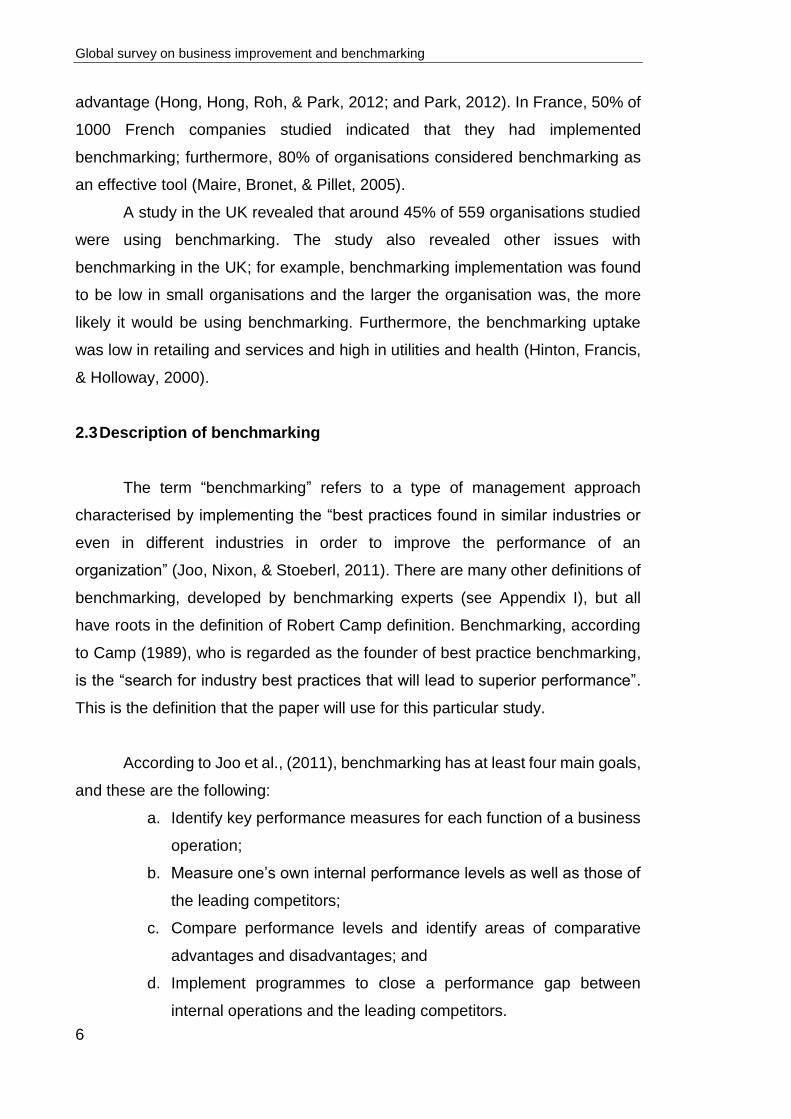
2.3 Description of benchmarking
The term “benchmarking” refers to a type of management approach
characterised by implementing the “best practices found in similar industries or
even in different industries in order to improve the performance of an
organization” (Joo, Nixon, & Stoeberl, 2011). There are many other definitions of
benchmarking, developed by benchmarking experts (see Appendix I), but all
have roots in the definition of Robert Camp definition. Benchmarking, according
to Camp (1989), who is regarded as the founder of best practice benchmarking,
is the “search for industry best practices that will lead to superior performance”.
This is the definition that the paper will use for this particular study.
According to Joo et al., (2011), benchmarking has at least four main goals,
and these are the following:
a. Identify key performance measures for each function of a business
operation;
b. Measure one’s own internal performance levels as well as those of
the leading competitors;
c. Compare performance levels and identify areas of comparative
advantages and disadvantages; and
d. Implement programmes to close a performance gap between
internal operations and the leading competitors.

Global survey on business improvement and benchmarking
7
Benchmarking is a very popular tool in business. In a global study carried
out by Bain & Company [famous consultancy firm], about the usage trends of 25
management tools worldwide, benchmarking came out the fourth most popular
tool in the world and was placed as second most used tool in North America,
Europe, the Middle East and Africa (Rigby & Bilodeau, 2013). This particular
study also found out that in the past 13 years, the benchmarking approach was
always among the top five most used management tools. Since this tool is the
only approach that offers learning from the best using a systematic approach,
benchmarking is recognised by business organisations as effective in improving
business performance (Jarrar & Zairi, 2001). The application of benchmarking
extends across different industries, these include the green operations of the
automotive industry (Nunes & Bennett, 2010), the service quality in the utility
industry (Chau, 2009), and even the sustainable processes in the pharmaceutical
industry (Schneider, Wilson, & Rosenbeck, 2010).
There are at least three reasons why companies make use of the
benchmarking approach. First, it enables the company to see where it stands
among the competition. As Min and Galle (1996) have mentioned, benchmarking
is used to analyse the company’s own strengths and weaknesses and at the
same time the comparative advantage of the competitors in the industry are
likewise evaluated. The results of the analysis are then used by the company to
develop its own strategic plan to achieve a far better position than its rivals.
Second, benchmarking is recognised as effective in improving the
performance of the company. A well-exercised benchmarking programme can
bring major changes to the organisation at different levels, from optimising tasks
and processes to enhancing the organisational strategy. Furthermore,
benchmarking is a proven tool for attaining competitive and comparative positions
by identifying the critical process and upgrading it to a world-class level through
continuous search for best practice. It also has other potential advantages such
as the efficient utilisation of resources, identifying effective goals and objectives,
and setting measures of productivity.
Finally, benchmarking is also strongly correlated with business excellence
models; for example, out of 1000 points of Malcolm Baldrige National Quality
Award (MBNQA) 550 points are influenced by benchmarking. In terms of

Global survey on business improvement and benchmarking
8
categories of assessment criteria, benchmarking affects all the categories
(Spendolini, 1992), and such a heavy influence accelerated the global use of
benchmarking because the MBNQA and similar models such as the EFQM are
used as a foundation for excellence awards for more than 80 awards around the
world including New Zealand and Australia (BPIR, 2013).
However, despite being one of the best tools to gain a national competitive
position in the global market through acquiring, sharing and applying knowledge,
there is still a lack of studies on the effectiveness of benchmarking in the field of
national strategies or programmes. A research gap exists in the aspect of
promoting the different types of benchmarking and exploiting its potential for
increasing national competitiveness.
2.4 Types and Pitfalls of Benchmarking
Attempts to classify benchmarking into different categories have been
made by various scholars and practitioners, but until now, there has been no
single classification system of benchmarking. The absence of such a system will
result in confusion over which type to select. It would be difficult, especially for
inexperienced organisations, to identify which benchmarking type will give the
maximum results at the lowest cost and effort. The succeeding sections present
at least three ways in which benchmarking has been classified. Each scholar
provides three categories for benchmarking. According to Codling (1995) there
are three types of benchmarking: internal, external, and best practices. The
definition of each is as follows:
a. Internal: defined as benchmarking with partner within the same
organisation;
b. External: defined as benchmarking with partner from different
organisation; and
c. Best Practices: defined as benchmarking with the best-in-class, the
main difficulty associated with this type is the identification of the
best-in-class partner. The availability of best practices databases
help organisations to overcome this problem.

Global survey on business improvement and benchmarking
9
d. Alternatively, Bogan & English (1994) classified benchmarking into
three groups. These are performance, process, and strategic. The
description is as follows:
e. Performance: is benchmarking the performance measures and
product characteristics such as reliability, durability and cost.
f. Process: the main focus of process benchmarking is benchmarking
specific work processes such as recruitment process and shipping
process.
g. Strategic: is benchmarking the strategic direction of an organisation
in comparison with a competitor.
The third classification comes from Boxwell (1994) who subdivided
benchmarking into competitive, cooperative or collaborative. Below are the
descriptions for each category.
• Competitive: defined as benchmarking with competitor. This type of
benchmarking is the most difficult type to conduct because competitors
usually will not release any information for the benefit of a competitor.
• Cooperative: a widely practised method of benchmarking due to the
confidentiality of information both parties can keep. In cooperative
benchmarking, both organisations can be from different sectors.
• Collaborative: a group of organisations share information about a
specific task. With the availability of best practices exchange
databases this is the most popular type, and it is also used as a tool to
raise the national competitiveness of an industry by implementing best-
in-class practices.
The preceding sections have shown that each author classified
benchmarking based on a certain viewpoint. Presented above are the existing
three main groups of benchmarking. The first one classifies benchmarking based
on the type of referenced partner (internal, external, best practice/global). The
second group uses categories based on the level of implementation
(performance, process, strategy). Lastly, the third group is comprised of
categories based on the relationship between benchmarking parties (competitive,
cooperative and collaborative).

Global survey on business improvement and benchmarking
10
Some of these types are complex and in order to implement them, the help
of an expert is needed; otherwise the benchmarking exercise will fail to
accomplish its objectives. Therefore, clear identification and classification of
benchmarking types can improve the quality of decisions taken to select certain
benchmarking types. Furthermore, this gap has to be addressed at the
development phase of the strategy because organisations are different in terms
of benchmarking experience.
Benchmarking as a method is relatively new and it has known pitfalls and
drawbacks in terms of concept and implementation. Thus, there is a need for
further theoretical studies as well as practical implementation to gauge its
outcomes.
Yasin (2002) attributes the majority of developments and literatures being
provided by practitioners. Therefore the pitfalls of benchmarking must also be
considered during the development of the strategy, because the failure of
benchmarking at the organisational level will have a negative impact on
promoting benchmarking at the national level.
The major pitfalls for benchmarking are:
a. Before starting any benchmarking project, organisation should form
a working group of experts to make employees well aware of what
is to be benchmarked and to solve any problems, as absence of
this team may lead to a wrong implementation.
b. Similar to other quality initiatives, one of the main barriers of
implementation is top management commitment.
c. Misconception about benchmarking and focusing on benchmarking
as measurement “how much” rather than “how to”.
d. Feasibility of conducting benchmarking exercise including cost,
resources and involved against the outcomes.
e. Identification of best practices can obstruct the benchmarking
exercise, in particular where to find best practice, how to make sure
that the identified best practice is the “best”.
f. Benchmarking is not helpful if used to evaluate fundamentally
different customer requirements, even for similar processes For

Global survey on business improvement and benchmarking
11
example, the cost of serving customers in a first class restaurant is
much more than in a fast-food restaurant, and due to the different
requirements of customers it is likely that the first class restaurant
will not gain significant benefit from a fast-food restaurant.
2.5 Best Practice Benchmarking
The main idea behind benchmarking is to identify better practices that
could be of use if implemented in order to improve the performance. The best
practices are normally obtained by comparing a practice or performance of an
organisation with another one that is assumed to be performing well. Therefore,
benchmarking teams obtain data from the benchmarking ‘partner’ and then use
it in identifying changes required for improving the performance of their own
organisation. This way, the organisation is able to achieve better practice or
performance by identifying best practices and then adapting them.
There are different definitions for best practice benchmarking from
different scholars, researchers and practitioners. It is also worth noting that
although different scholars have defined benchmarking differently, all the
definitions have captured the essential characteristics of best practice
benchmarking. All the definitions have captured the most important aspect of
benchmarking, which is to examine the processes or practices from the
benchmarking partner that can be used to improve the organisation performance.
Studies also reveal that most publicised management ‘text books’ on how to
conduct benchmarking peaked in the late 1990s (Francis & Holloway, 2007).
These include (Camp, 1995; Spendolini, 1992; Watson, 1993; Zairi, 1998), and
for the non-profit sector, (Letts, Grossman, & Ryan, 1999). However, such books
did establish a broad consensus in terms of what they believed best-practice
benchmarking should involve in practice.
Studies also indicate that benchmarking originated in the manufacturing
sector, but soon found applications in other sectors. It is also worth noting that
benchmarking was first implemented in the private sector and then found its way
to the public sector. This is reasonable, bearing in mind that private sectors are

Global survey on business improvement and benchmarking
12
obviously much derived by competitiveness than public sectors. Consequently,
organisations in the private sector were the first to implement benchmarking
practices in order to remain competitive. During the early days of best practice
benchmarking, it was practiced as inter-firm comparisons. The comparison
information was normally obtained by local groups of employers. For instance,
Profit Impact of Marketing Strategies (PIMS) has been offering ‘benchmark’ data
for member organisations within their own industries since the early 1990s
(Merrifield, 1994). The first actual labelling of a performance-enhancing activity
as ‘benchmarking’ in the Western industry is attributed to Xerox in 1983
(Jacobson & Hillkirk, 1986). Their portrayal of Xerox as an “American Samurai”
reflects the escalation of interest in Japanese management techniques in the
1980s such as Kaizen (continuous performance improvement).
Studies also indicate that benchmarking in the early days was
implemented by large organisations that were normally referred to as “blue collar”
service organisations; these included engineering maintenance and transport,
and laboratory-based activities such as pathology. Also, best practice
benchmarking was adopted at a slower rate in ‘white collar’ service organisations
such as retail organisations and financial services among others (Francis &
Holloway, 2007). The idea behind benchmarking was to improve their services
and reduce their costs at the same time (Mathaisel, Cathcart, & Comm, 2004).
2.6 Large Scale Benchmarking Initiatives
Unfortunately, the literature that directly addresses national initiatives of
benchmarking is lacking, which is one of the motivators for this study. Hence, this
literature review focuses on lower levels of benchmarking adoption, such as
sector-wide or industry programmes.
According to Panwar, Nepal, Jain, and Yadav (2013) researching the
implementation of benchmarking concepts in the Indian automobile industry
showed that good performance could be achieved rapidly and successfully if
Indian auto companies significantly invested their time and efforts in adopting
benchmarking. It is also worth noting that several empirical studies have been

Global survey on business improvement and benchmarking
13
carried out in developed as well as developing nations regarding the
implementation of benchmarking concepts in various industrial sectors (Asrofah,
Zailani, & Fernando, 2010; Mamata, Atul, & Upadhyay, 2011; Nemec, Merickova,
& Ochrana, 2008; Vermeulen, 2003).
The Asrofah et al., (2010) study suggested that governments should
intervene and sponsor benchmarking initiatives in order to improve national
productivity, and governments could also utilise benchmarking as a tool to
monitor and control quality. The study also found a positive link between
government intervention and benchmarking effectiveness. Therefore,
governments can play an important role in boosting the uptake and effectiveness
of benchmarking by providing support to organisations wishing to apply
benchmarking.
In Singapore, the government started number of initiatives to help
Singapore organisations in undertaking benchmarking projects. For example, in
1993 the Productivity and Standards Board (PSB), in collaboration with Fuji-
Xerox, established Fuji-Xerox-PSB Benchmarking Centre. The primary role for
the centre was to offer workshops, seminars and consulting services to Singapore
business. In 1996, the PSB took the Fuji-Xerox-PSB initiative to the next level
and started a new programme; the PSB launched the National Best Practice
Programme (NBPP), which aimed to help local organisations to achieve business
excellence level through benchmarking against world class performance levels.
The Brah, Ong, and Rao study (2000) on benchmarking in Singapore,
which was conducted on Singapore Quality Class (SQC) Certified Organisation,
shows that there is a strong positive correlation between effective implementation
of benchmarking and training programmes and seminars organised by the NBPP.
In addition, the study revealed that 92.3% of respondents who have used
benchmarking for more than one year are showing a rising interest in adopting
benchmarking management technique; this interest is even higher among SQC
companies. Further analysis of organisations that are willing to do benchmarking
projects but have not done so, shows that the main reason for not conducting

Global survey on business improvement and benchmarking
14
benchmarking projects was lack of awareness and understanding of
benchmarking concept.
In the UK, recently there was a new benchmarking initiative in construction
sector called UK Benchmarking Construction Policy. The main reason behind UK
Benchmarking Construction Policy is to address the industry’s perceived
problems of high cost, poor performance and client dissatisfaction (Rigby et al.,
2013). Although the initiative was primarily data collection and sharing initiative,
it was expected that there would be a performance improvement through
identifying strengths and weaknesses, and the exchange of information between
customers and suppliers. The results of the initiative were excellent: some
contractors reported 77% reduction in defects, 15% reduction on housing costs,
40% improved productivity, and 90% average client satisfaction.

Global survey on business improvement and benchmarking
15
Chapter 3: Research Methodology
3.1 Introduction
This chapter describes the different stages of research design and
methodology used to achieve the research aim and objectives. It starts with
research questions data, and then discusses data sources, collection methods,
and validity and reliability of research tools.
3.2 Research Questions
In order to accomplish the stated objectives (Objectives 1 to 4 which
shown in section 1.3) there are three research questions:
a. To what extent are the organisations using different types of
benchmarking compared to other performance improvement
techniques?
b. What are the difficulties facing organisations that prevent
adoption and implementation of benchmarking?
c. What are the benefits of implementing benchmarking for
organisations?
The above-stated research questions are based on an initial literature
review and discussions with experts.
In order to answer the research questions, a combination of qualitative and
quantitative methods were used. Also, there are two data sources for the
research, primary and secondary sources.
3.3 Data Sources
There were three data sources used to accomplish the objectives of this
part of the research:
1. Literature review of benchmarking literatures.

Global survey on business improvement and benchmarking
16
2. Survey study for organisations to complete and to be distributed by
benchmarking clubs and national quality organisations. The objective of this
questionnaire is to answer the research questions.
3. In addition to the above, structured interviews with representatives from
benchmarking clubs and benchmarking experts were conducted in order to
gain a deeper understanding about benchmarking and national benchmarking
strategies in their countries. The data from the interviews will not be shown
within this thesis; the analysis and results of this will be carried out in the Ph.D.
research. At this stage it was conducted primarily to utilise the face-to-face
meeting with benchmarking experts overseas.
The primary aim of combining two research methodologies
qualitative/quantitative is to minimise the shortcomings of each approach. The
quantitative (survey) method was used because it can collect data from large
samples. The construction of the survey was done carefully in terms of selecting
the scaling method such as Thurstone, Likert and Guttman, questions that were
asked and the wording of questions, and ensuring validity and reliability of the
survey. Whereas qualitative (Interviews) was used because the quantitative
method is more of a summarising than an exploring tool (Trochim, 2006), another
tool had to be used to gain deeper answers for both the research questions. The
most suitable tool for our sample was found to be interviews, but there was an
extra cost associated with such benefits, in terms of funds and time need to
conduct the interviews.
The research scope is the national benchmarking clubs and networks
around the world. Initially, this was the Global Benchmarking Network (GBN)
whose members agreed to participate in the research. The Global Benchmarking
Network is an organisation consisting of 28 members from 21 countries (23
members at time of data collection) sharing an interest in promoting
benchmarking. The full list of GBN members is listed in Appendix-II.
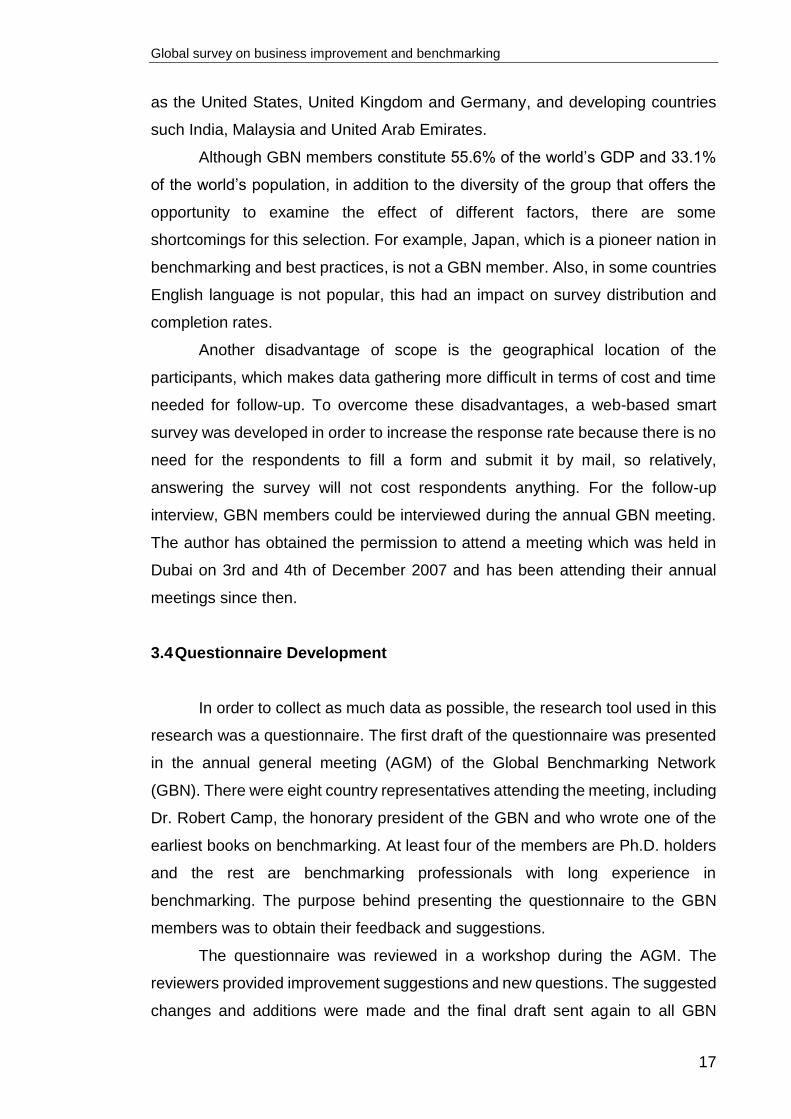
Excluding Japan and France, representatives from all G8 countries are
members in the GBN. Within the members there are developed countries such
Global survey on business improvement and benchmarking
17
as the United States, United Kingdom and Germany, and developing countries
such India, Malaysia and United Arab Emirates.
Although GBN members constitute 55.6% of the world’s GDP and 33.1%
of the world’s population, in addition to the diversity of the group that offers the
opportunity to examine the effect of different factors, there are some
shortcomings for this selection. For example, Japan, which is a pioneer nation in
benchmarking and best practices, is not a GBN member. Also, in some countries
English language is not popular, this had an impact on survey distribution and
completion rates.
Another disadvantage of scope is the geographical location of the
participants, which makes data gathering more difficult in terms of cost and time
needed for follow-up. To overcome these disadvantages, a web-based smart
survey was developed in order to increase the response rate because there is no
need for the respondents to fill a form and submit it by mail, so relatively,
answering the survey will not cost respondents anything. For the follow-up
interview, GBN members could be interviewed during the annual GBN meeting.
The author has obtained the permission to attend a meeting which was held in
Dubai on 3rd and 4th of December 2007 and has been attending their annual
meetings since then.
3.4 Questionnaire Development
In order to collect as much data as possible, the research tool used in this
research was a questionnaire. The first draft of the questionnaire was presented
in the annual general meeting (AGM) of the Global Benchmarking Network
(GBN). There were eight country representatives attending the meeting, including
Dr. Robert Camp, the honorary president of the GBN and who wrote one of the
earliest books on benchmarking. At least four of the members are Ph.D. holders
and the rest are benchmarking professionals with long experience in
benchmarking. The purpose behind presenting the questionnaire to the GBN
members was to obtain their feedback and suggestions.
The questionnaire was reviewed in a workshop during the AGM. The
reviewers provided improvement suggestions and new questions. The suggested
changes and additions were made and the final draft sent again to all GBN

Global survey on business improvement and benchmarking
18
members for any other comments. Another batch of comments was received and
implemented.
After incorporating all suggestions, the final questionnaire was issued and
sent again for all GBN members in order to obtain their support for distribution of
the questionnaire to their contacts database. Furthermore, the questionnaire was
translated into German, Chinese, Russian, Hungarian and Arabic in order to
make it easier to answer and to ensure wider coverage. The GBN members
helped in translating the questionnaire.
3.5 Questionnaire Structure and Questions
The questionnaire was designed to cover different types of benchmarking
experience, whether the organisation is a beginners or advanced. Even if the
organisation does not do any benchmarking, there will be questions relevant to
them.
The first part of the questionnaire aims to explore the position of best
practice benchmarking, performance benchmarking and informal benchmarking
among 20 popular improvement tools. Definitions were provided for all the
techniques to ensure that the respondents had the same understanding of each
technique.
The second part of the questionnaire (section two) aims to explore
performance benchmarking in more detail, such as frequency of benchmarking
training and services supplied by a third party.
The third part of the questionnaire (sections three to seven) aims to
explore the status of best practice benchmarking and how organisations are
performing in each stage of their benchmarking projects.
To make it easier for respondents to answer the questions, the
questionnaire was divided into seven sections. Each section covers a main topic:
• Section 1 - Organisation’s Profile: The purpose of this section is to
collect demographic data about the organisation, such as sector, size,
business activity and number of years in operation.
• Section 2 - Use of Improvement Techniques: The purpose of this
section is to collect data about level of awareness, level of usage,

Global survey on business improvement and benchmarking
19
effectiveness and future usage for 20 popular improvement
techniques.
• Section 3 - General Questions on Benchmarking: The purpose of this
section is to collect data about performance benchmarking projects in
general. Only organisations using performance benchmarking or best
practice benchmarking are required to answer this section.
• Section 4 - Best Practice Benchmarking Projects - Planning: The
purpose of this section is to collect data about the planning phase of
best practice benchmarking such as involvement of employees in
benchmarking projects and area/process of benchmarking. Only
organisations conducting best practice benchmarking are required to
answer this section and the following section.
• Section 5 - Best Practice Benchmarking Projects - Research and
Analysis: The purpose of this section is to collect data about research,
data collection, and analysis phase. In particular, it collects data about
benchmarking data sources.
• Section 6 - Best Practice Benchmarking Projects - Implementation: The
purpose of this section is to collect data about the different aspects of
implementation phase, such as time taken to implement the project.
• Section 7 - Best Practice Benchmarking Projects - Evaluation: the
purpose of this section is to collect data about the benchmarking
project evaluation phase and how organisations measure success of
the project.
3.6 Validity and Reliability
Due to the rigorous process used to develop and review the questionnaire,
the data is considered to be valid and reliable. The following are the main steps
of the questionnaire development that enabled validity and reliability:
• Clear definitions for each type of benchmarking and the 20
improvement techniques were provided to ensure clarity for
understanding the questions.
• The final draft of the questionnaire, which was developed by the
researcher, was presented at the GBN's annual meeting for review. A

Global survey on business improvement and benchmarking
20
team with extensive benchmarking knowledge reviewed the
questionnaire in a workshop and provided input on its design.
• The questionnaire version that incorporated suggestions of the review
team at GBN's annual meeting was sent to the 21 GBN's members for
further review. The final version was issued after three months of
several enhancement and tweaking inputs from GBN members and
academics.
• The non-English versions of the questionnaire were translated by
native speakers with experience in benchmarking. The translated
versions were translated back into English by an electronic solution to
make sure that the translation is correct.
3.7 Questionnaire Delivery Methods and Distribution Channels
After nearly three months of revising the final draft with GBN members, the
final questionnaire was published in six languages using two methods of delivery.
The first and main method was the use of an online survey solution
(SurveyMonkey). A set of automatic rules was used in the electronic copy to guide
responders in answering the questions that were relevant to them only and to
prevent misunderstanding. The second method was by using MS Word versions
were provided for respondents with limited access to the Internet.
There were two main distribution channels for the questionnaire. The first
was through Business Performance Improvement Resource (BPIR.com)
members, which is a membership-based website for users interested in
benchmarking and business improvements. The website has members around
the world from different sectors and sizes. The second method was through GBN
members; each member sent the questionnaire to his or her contacts database.
In order to increase response rate, periodical reminders were sent to
contacts to encourage them to answer and complete the questionnaire.
Collectively, the questionnaire invitation went to thousands of contacts from
around the world through BPIR.com and the GBN members. It is not possible to
calculate precisely the number of invitations sent due to the multiple channels of
distributions.
Global survey on business improvement and benchmarking
21
Chapter 4: Results
4.1 Introduction
Although it was not possible to conduct the study in each and every
country globally, data was collected from all regions globally. Therefore the study
qualifies to be a representative study of global survey on business improvement
from an international point of view. In other words, the data collection process
was well distributed in obtaining findings that represent a global picture on
benchmarking and business improvement. The global map shown on figure 2
indicates that the study is conducted on an international perspective.
4.2 Survey Results
The results of more than 450 responses received from 44 countries around
the world revealed many interesting findings about improvements techniques,
benchmarking in general and phases of Best Practice Benchmarking in particular.
Due to the lack of GBN members in South America and Africa, the
researcher relied on other sources to get responses, such as the international
contacts of GBN members, members of BPIR.com, and posting blogs about the
study.
4.3 Survey Results Analysis
This section is the results of survey results analysis; the analysis was
done using SPSS and MS Excel.
4.3.1 Questionnaire Section 1 Organisation Profile
4.3.1.1 Question 1.1 Responses Distribution.
Global survey on business improvement and benchmarking
22
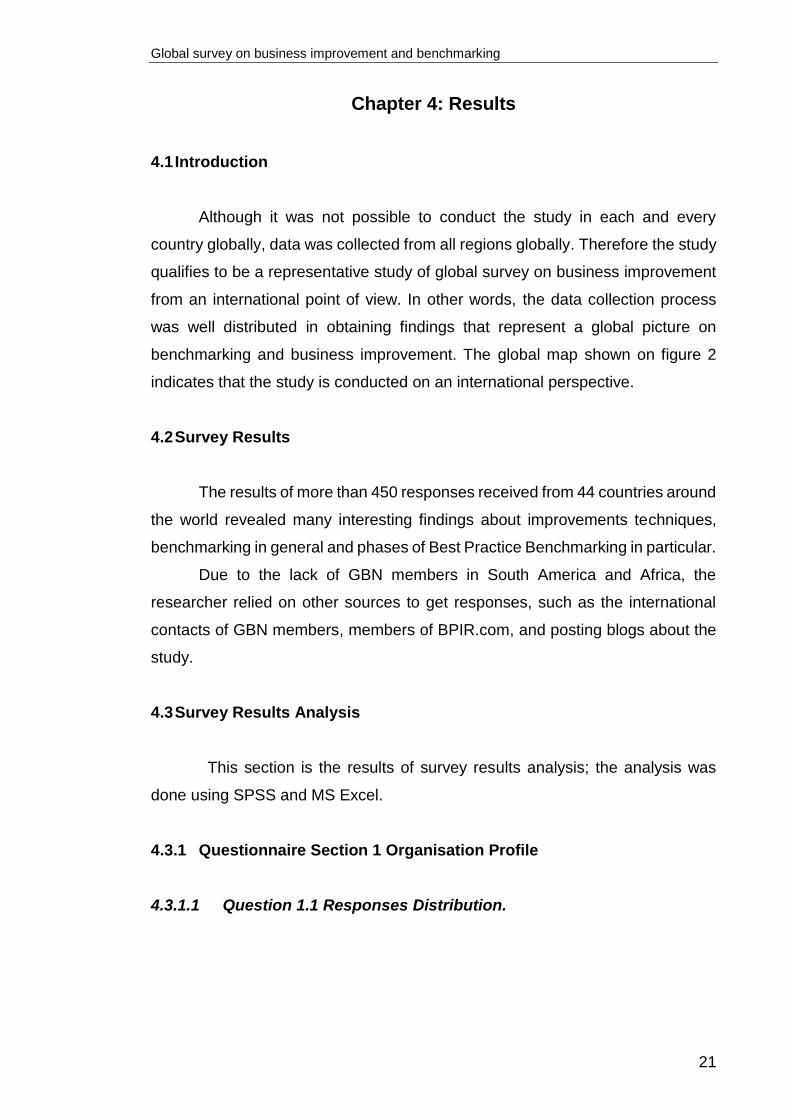
Figure 2. World responses distribution
The Figure above represents a diagrammatic presentation of how
responses were obtained from various respondents from different parts of the
world. The global map shows the different countries where responses were
obtained. The respondents’ countries are shaded with varied colour intensities to
show the concentration of the responses. The countries shaded with more
intense colours gave more responses than those with light colour intensities. The
distribution of responses ranges from 1 to 50, depending on the colour intensity.
Countries that are not shaded produced no responses for the study.
The map indicates that most of the responses came from UK, New
Zealand, Australia, Germany, Canada, India and the Middle East. Other countries
from different parts of the world did not give many responses, as indicated by the
light colour. In summary, there is a reasonable distribution of respondents from
all regions globally. This gives the study good coverage for the developed and
emerging countries.

Global survey on business improvement and benchmarking
23
Figure 3. Responses distribution by country
As indicated in the chart above, most of the responses came from New
Zealand and UK with 12% each, then India and Germany with 10% each, Taiwan
and Canada with 7% each, Australia 6%, Hungary 5%, and Saudi Arabia and
Mauritius with 4% each. Other countries produced 23% of the total responses of
the study, this include US, Singapore, UAE, China and other. The total responses
were 453 valid responses.

Global survey on business improvement and benchmarking
24
Figure 4. Responses distribution by organisation size
Out of the 453 responses there were 436 responses with organisations’
data. Of these, 9% were completed by micro-sized organisations (one to nine
employees), 17% were completed by small-sized organisations (10 to 49
employees), 12% were completed by medium-sized organisations (50 to 250
employees), and 62% were completed by large organisations (more than 250
employees).
4.3.1.2 Question 1.2. What is your organisation’s major business
activity?
In order to know if there is a co-relation between the benchmarking
performance of sectors, it was important to ensure that respondents have
mentioned the major business activities of their organisation. This will show which
organisations have better implementation for benchmarking as a tool to improve
their performances. Around 65% of responses were from five sectors
(manufacturing organisations, personal and other services, government
administration and defence, education, and health and community services)
(Figure 5).

Global survey on business improvement and benchmarking
25
Figure 5. Response distribution by business activity
4.3.1.3 Question 1.3. Within which sector does your organisation
operate?
Another important factor to consider when looking for high benchmarking
uptake is if there are any differences between sectors. The majority of responses
we obtained were from private sectors with 63%, followed by public sector with
27% and finally, non-profit with 10% of total responses (Figure 6).

Global survey on business improvement and benchmarking
26
Figure 6. Responses distribution by sector
4.3.1.4 Question 1.4. For how many years has your organisation been
operating?
It was also essential to consider how long the organisations participating
in the study have been in business. This was important in order to determine if
there is any correlation between the number of years in operation and other
findings, such as the preferred business improvement technique, benchmarking
uptake and results.

Global survey on business improvement and benchmarking
27
Figure 7. Number of years in operation
The largest category was 54% of responses which came from
organisations that have been operational for more than 20 years. The average
number of years in operation for the other categories less than 20 years is around
11%. It is therefore true that most of the responses were from organisations that
have good experience and are well established (Figure 7).
4.3.2 Questionnaire section 2. Use of Improvement Techniques
4.3.2.1 Question 2.1. Improvement techniques implemented in your
organisation.
Level of awareness for moderate and high use of improvement techniques.
Figure 8 shows the popularity of different improvement techniques in terms
of knowledge or awareness. Respondents were asked to rate their level of

Global survey on business improvement and benchmarking
28
awareness for each one of the 20 improvement techniques. Eighty-six percent of
respondents said that they have moderate or high levels of knowledge about
customer (client) surveys, followed by 83% for SWOT analysis, and 82% for
mission and vision statement. Informal benchmarking was sixth with 75%, the
performance benchmarking was just above the 65% Mean, and Best practice
benchmarking was just below the mean with 60%.
Figure 8. Awareness of business improvement techniques
Level of usage of improvement techniques.

Global survey on business improvement and benchmarking
29
In this question, respondents were required to highlight the improvement
techniques currently in use in their organisations during the time of the study. It
is worth noting that some of the highly rated improvement techniques in
awareness in the previous question were not widely used. Also, the informal
benchmark (which is the sixth in awareness) came fourth in usage. On the other
hand, best practice benchmarking, which came in at number 12 in awareness, is
number 15 in usage and below the mean by 10%. This means that there are other
factors hindering organisations from implementing the best practice
benchmarking other than knowledge or expertise (Figure 9).
Figure 9. Current use of business improvement techniques

Global survey on business improvement and benchmarking
30
Since we have measured the level of awareness and usage, it is important
to know how effective benchmarking is. The chart below shows the average for
“moderate” and “major” level of effectiveness. It was evident from the findings
that Quality Management System, Improvement Teams and Customer Client
surveys are perceived as the most effective improvement techniques, which is
shown by high percentage (80%, 77% and 77% respectively) among the
responses. Informal benchmarking, performance benchmarking and best
practice benchmarking scored lower results (Figure 10).
Figure 10. Effectiveness of business improvement techniques
Respondents were also required to state if they expect to use any of the
20 improvement techniques in the coming three years from when the responses
were collected. The idea here was to understand what would be the

Global survey on business improvement and benchmarking
31
benchmarking uptake compared to the other major improvement techniques in
the next three years.
From the chart below, it is evident that though many of the business
improvement techniques were used in most of the organisations, most of them
will not be in use in the coming three years. Regarding benchmarking,
Performance benchmarking and informal benchmarking were first and second,
and best practice benchmarking came fourth.
A mean of 48% future use of different business improvement techniques
which was below average, shows that most of the organisations that were
involved in the study were not willing to continue implementing improvement
techniques that they were using in their business organisations (Figure 11).
Figure 11. Future use of improvement techniques

Global survey on business improvement and benchmarking
32
4.3.2.2 Question 2.2. What are the main reasons for not using
performance benchmarking or best practice benchmarking within
your organisation?
At the end of section one the respondents were asked to state the top
three reasons for not using benchmarking. In this question we asked respondents
to rate three reasons for not using performance benchmarking or best practice
benchmarking in descending order according to their importance. In the analysis
of this question, the reasons selected as number one were given three points,
two points for reasons selected as number two, and one point for reasons
selected as number three. Figure 12 below shows the average points for each
reason. It is evident from the responses collected that organisations that
participated in the study had technical reasons in the top reasons as to why they
never used benchmarking. The most important three reasons were lack of
resources, lack of benchmarking partners, and lack of technical knowledge on
how to do benchmarking.
Figure 12. Reasons for not using benchmarking or best practice benchmarking

Global survey on business improvement and benchmarking
33
4.3.3 Questionnaire Section 3 General Questions on Benchmarking
In order to understand more about benchmarking and how it is
implemented, which is the key issue in the study, respondents were required to
state how benchmarking was used in their respective organisations. Questions
about use of benchmarking were introduced to respondents and they were
required to give their opinion by marking different options provided in the survey.
4.3.3.1 Question 3.1. Benchmarking Training, Data Collection and
Dissemination of Results.
Figure 13. Benchmarking training for employees
The above graph shows responses from different employees who
participated in the study on how employees were trained in benchmarking. The
graph shows that on average, some organisations do not train their employees
on benchmarking; this constituted about 26% of the response collected. Twenty-
nine percent of respondents pointed out that training in benchmarking is rare,
while only 14% of organisations “usually” and “always” train their employee in

Global survey on business improvement and benchmarking
34
benchmarking. Therefore, without proper training in benchmarking, it is most
likely that the benchmarking projects will not be effective.
There was also need to find out what employees do on their own about
benchmarking as they carry out their day-to-day responsibilities. The graph in
Figure 13 has clearly shown that most of the employees who participated in the
study had not received any training about benchmarking. It was therefore
important to find out what employees do about benchmarking. Respondents were
asked to state if employees collect and use benchmarking information. The
findings of the study were recorded in a graphical form, as shown below.
Figure 14. Collection and use of benchmarking data
It is evident from the above graph that employees sometimes collect and
use data on benchmarking. About 45% of the employees who participated in the
study agreed to have collected and used benchmarking information. Only 6%
indicated that they have never collected any benchmarking information. About
21% indicated that they do it “rarely”. This shows that employees do collect and
use information on benchmarking on their own, regardless of the fact that they
receive little training on the same from their organisations.

Global survey on business improvement and benchmarking
35
Figure 15. Disseminations of best practices
Figure 15 shows what organisations are doing regarding dissemination of
best practices that resulted from the benchmarking projects. Approximately 42%
of organisations do “always” and “usually” communicate the best practice that
has been identified to their employees, 17% do not communicate it or do it
“rarely”, while 31% of organisations communicate the best practices sometimes.
4.3.3.2 Question 3.2. For each of the following performance areas, does
your organisation collect benchmarks (performance comparison
data on other companies)?
We also wanted to know what area is the most important for organisations
in collecting benchmarks data from. Therefore, respondents were required to
state if their collected data on areas is related to employees, financial processes,
services and products.
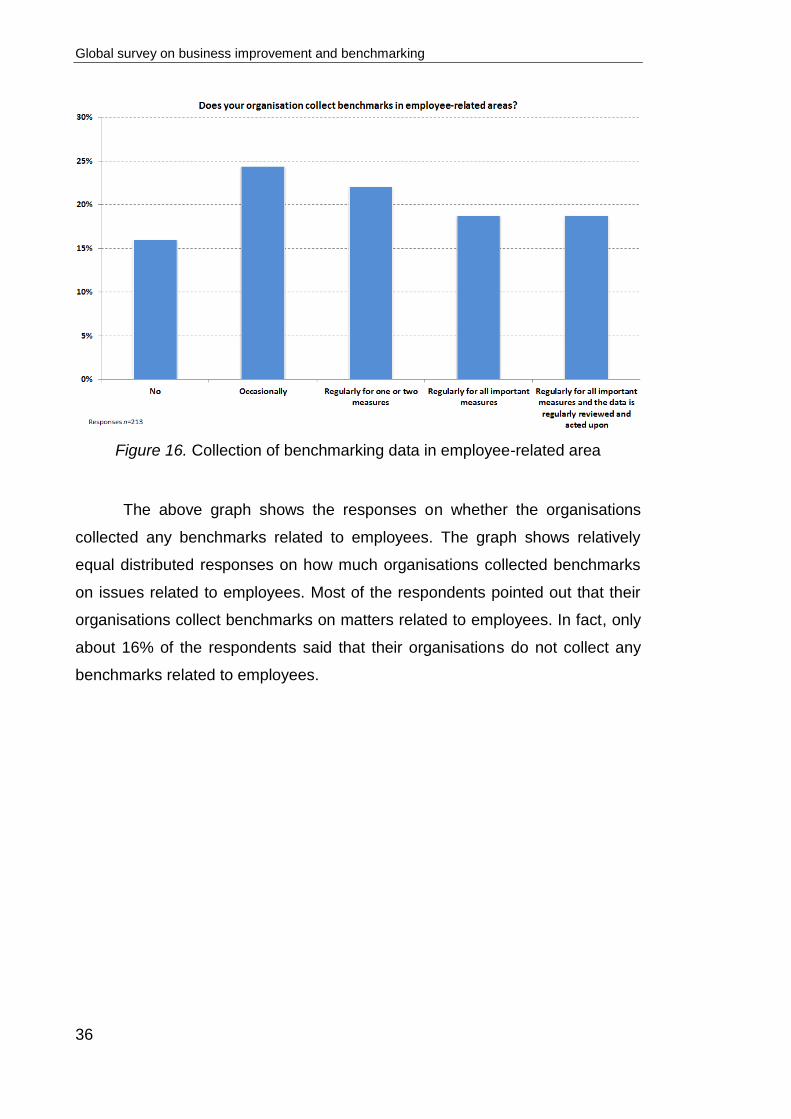
Global survey on business improvement and benchmarking
36
Figure 16. Collection of benchmarking data in employee-related area
The above graph shows the responses on whether the organisations
collected any benchmarks related to employees. The graph shows relatively
equal distributed responses on how much organisations collected benchmarks
on issues related to employees. Most of the respondents pointed out that their
organisations collect benchmarks on matters related to employees. In fact, only
about 16% of the respondents said that their organisations do not collect any
benchmarks related to employees.

Global survey on business improvement and benchmarking
37
Figure 17. Collection of benchmarking data in financial-related areas
For benchmarks related to financial issues, respondents indicated that
their organisations collect benchmarks from other businesses for comparison
purposes. The graph shows an increasing trend for financial area benchmarks;
over 85% of the respondents agreed that their organisations collected
benchmarks on financial matters and only about 14% of the respondents stated
that their organisations do not collect any benchmarks on financial-related areas.
Thirty-one percent of the organisations collect benchmarks regularly for all
important measures and the data is regularly reviewed and acted upon (Figure
17).

Global survey on business improvement and benchmarking
38
Figure 18. Collection of benchmarking data in process-related areas
Respondents were also required to give their views on the collection and
usage of benchmarks in their organisations for process-related areas. The graph
above shows that the majority of respondents indicated that their organisations
collect process-related benchmarks. Twenty percent said that they collect
benchmarks regularly for all important measures and the data is regularly
reviewed and acted upon, while 25% said that they collect the process-related
benchmarks regularly. Fourteen percent said they do not collect benchmarks in
process-related areas. (Figure 18)

Global survey on business improvement and benchmarking
39
Figure 19. Collection of benchmarking data in product or services related areas
The fourth area to ask the respondents about was benchmarks related to
product or services. Only 8% said that they do not collect any benchmarks related
to product or service, while more than 50% said that they do collect benchmarks
regularly for all important measures, and 25% regularly review and act upon the
benchmarks they have collected (Figure 19).
Figure 20. Collection of benchmarking data in customer-related areas

Global survey on business improvement and benchmarking
40
Lastly, respondents were also asked to state if they collect benchmarks
related to customers. The trend of the chart above is similar to financial area
benchmarks, where the responses are increasing. This is an indicator that the
customer-related benchmarks are so important; in fact, 53% said that they do
collect the benchmarks regularly for all important measures and 22% for one or
two measures. Only 10% of the organisations do not collect any benchmarks
related to customers. Among the five areas the customer benchmarks came first
in regard to collecting measures regularly; around 75% of organisations collect
benchmarking data in customer-related area on regular basis (Figure 20).
4.3.3.3 Question 3.3. Which of the following services in benchmarking, if
supplied by a third party (an external organisation), would your
organisation potentially use?
In order to determine how business organisations consider seeking
benchmarks from other organisations, respondents were asked to mention which
benchmarking services they would use if provided by a third party or an external
organisation.
In this question we asked the respondents to rate three potential services
provided by an external organisation in descending order according to its
importance. In the analysis of this question, services selected as number one
were given three points, two points for services selected as number two, and one
point for services selected as number three; the chart is showing the average
points for each service. It is clear from the chart that most of the organisations
are willing to use a best practice database provided by a third party on the above
areas. The best practice database is the most popular while online discussion
forum is the least popular. This shows that the organisations are willing to
benchmark on matters that they feel are important to their organisations and are
reluctant to use benchmarking services that are less likely to improve their
performance.

Global survey on business improvement and benchmarking
41
Figure 21. Most important services supplied by third party
4.3.3.4 Question 3.4 Does your organisation currently use benchmarking
services provided by a third party?
Approximately 72% of the respondents stated that their organisations did
not use benchmarking services provided by a third party. Only about 28% of
respondents said that they are using a benchmarking service provided by a third
party in their organisation. In Question 3.3 almost all participants said that they
would use a best practice database service if available. This shows that there is
a lack of best practice databases.
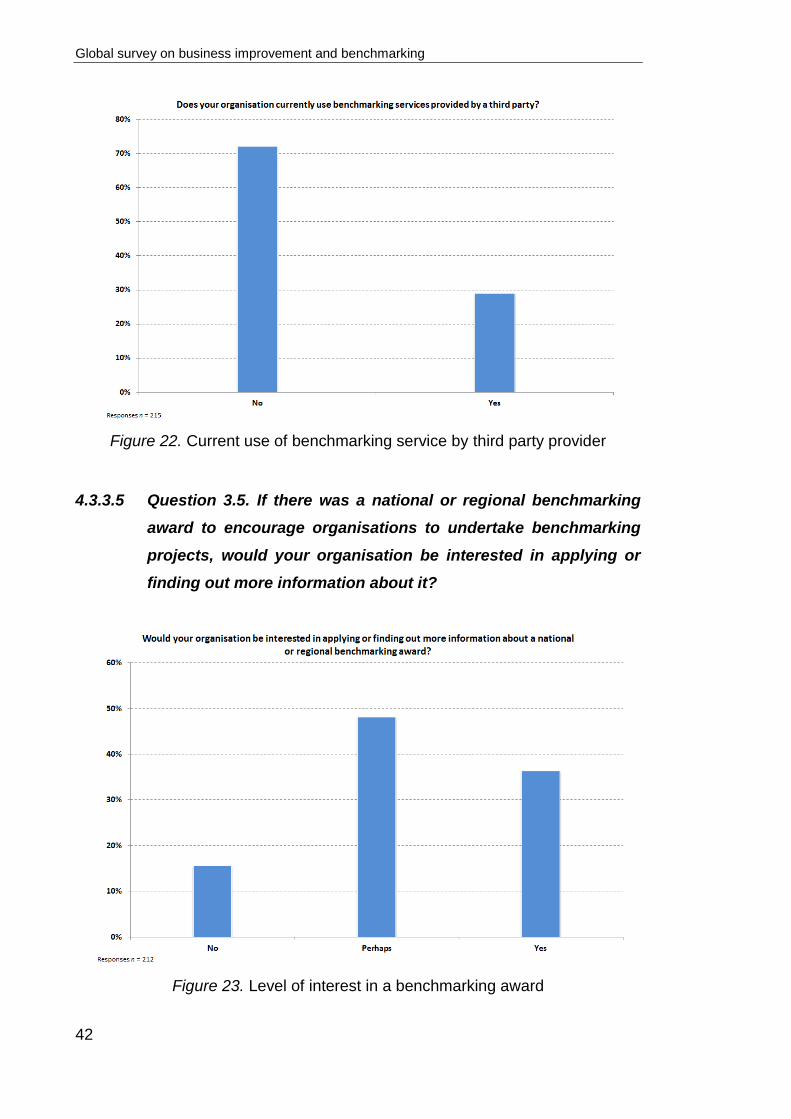
Global survey on business improvement and benchmarking
42
Figure 22. Current use of benchmarking service by third party provider
4.3.3.5 Question 3.5. If there was a national or regional benchmarking
award to encourage organisations to undertake benchmarking
projects, would your organisation be interested in applying or
finding out more information about it?
Figure 23. Level of interest in a benchmarking award

Global survey on business improvement and benchmarking
43
Figure 23 shows the responses on whether the organisations would be
interested in applying for a national or regional benchmarking award.
Respondents were required to respondent with no, yes or perhaps to the
question. Approximately 48% of the total participants were not sure that their
organisations would participate in a national or regional benchmarking award.
Approximately 36% said yes and 16% said no. In regard to most of the employees
not sure about their organisation’s willingness to participate in regional or national
benchmarking awards, the reasons could be that they need to see a direct benefit
for them to participate.
The main reason behind a benchmarking award is to encourage
information sharing between organisations. Therefore, the award will an excellent
learning platform for organisations.
4.3.4 Survey Section 4: Best Practice Benchmarking Projects - Planning
This section is dedicated to planning. Planning is the first phase of a typical
benchmarking project and the most important. We need to know how the
organisations are performing in planning phase in terms of duration, team size,
methodology used, area of benchmarking, number of projects per year, and other
characteristics of the planning phase.
4.3.4.1 Question 4.1. How many benchmarking projects do you conduct
per year (typically)?
Respondents were required to state the number of benchmarking projects
they conduct annually. The options were one project, 2-5 projects, 6-9 projects,
10-20 projects and more than 20 projects. The result shows that the 54% of the
organisations conduct two to five projects per year, and only 6% conduct more
than 20 projects (Figure 24).

Global survey on business improvement and benchmarking
44
Figure 24. Number of benchmarking project per year
4.3.4.2 Question 4.2. What is the size of a typical benchmarking team
within your organisation?
In order to determine reasons for the different number of benchmarking
projects conducted by organisations annually, it was essential to determine the
size of a typical benchmarking team. The participants were required to mark the
size of the benchmarking team in their organisations from the options provided in
the questionnaire.
Around 61% of organisations conduct benchmarking project with four
employees or less. In fact, 31% benchmarking teams are made up of 3-4 people,
followed by 30% for 1-2 people and then 22% for 5-6 people. Only 19% of the
organisations employ seven people or more in a typical benchmarking team
(Figure 25).

Global survey on business improvement and benchmarking
45
Figure 25. Size of typical benchmarking team
4.3.4.3 Question 4.3. Does your organisation use a particular
methodology for undertaking benchmarking projects?
There are number of proven benchmarking methodologies, it is important
that the organisations conduct their benchmarking projects based on one of the
proven benchmarking methodology. The idea was to establish the relationship
between different methodologies used and the success of the benchmarking
projects in improving organisational performance.
Figure 26 shows that most of the organisations developed their own
methodology in benchmarking projects and they do not necessarily use one of
the popular methodologies. Approximately 51% of the total respondents stated
that they are using developed-own methodology when implementing
benchmarking projects and 21% stated that they using a particular methodology.
Approximately 28% pointed out that their organisations never used any method
at all, which is the wrong thing to do, because without a methodology the projects
most likely will fail or at least will not be efficient and effective.

Global survey on business improvement and benchmarking
46
Figure 26. Methodology used in benchmarking projects
4.3.4.4 Question 4.4. How long does a benchmarking project normally
take?
In this question, respondents were required to describe how long it takes
to conduct a benchmarking project and achieve a best practice, excluding the
implementation phase therefore excluding the implementation of achieved best
practices. The idea was to determine the relationship between the sizes of the
benchmarking teams, the number of projects conducted annually, and the
success of benchmarking project.
Around 83% of benchmarking projects took six months or less to complete
while 40% of the benchmarking projects took less than two months. This means
that only 7% of the projects are long term projects that took more than 10 months
to complete (Figure 27).
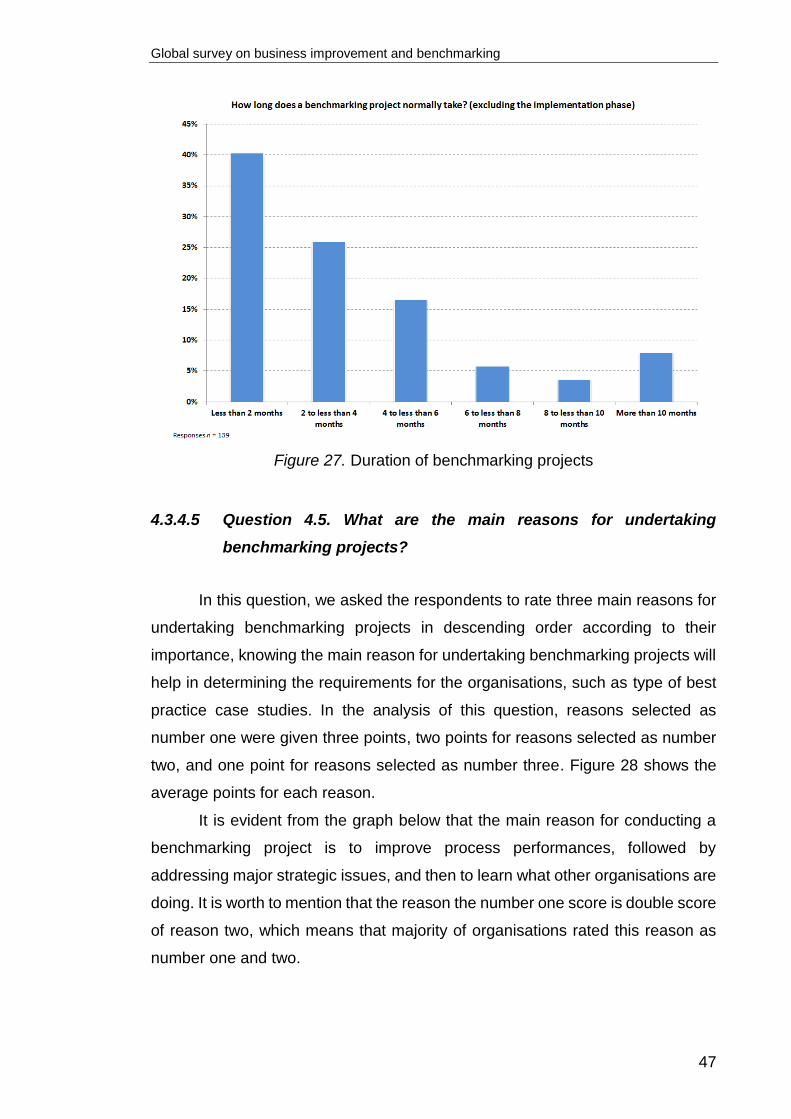
Global survey on business improvement and benchmarking
47
Figure 27. Duration of benchmarking projects
4.3.4.5 Question 4.5. What are the main reasons for undertaking
benchmarking projects?
In this question, we asked the respondents to rate three main reasons for
undertaking benchmarking projects in descending order according to their
importance, knowing the main reason for undertaking benchmarking projects will
help in determining the requirements for the organisations, such as type of best
practice case studies. In the analysis of this question, reasons selected as
number one were given three points, two points for reasons selected as number
two, and one point for reasons selected as number three. Figure 28 shows the
average points for each reason.
It is evident from the graph below that the main reason for conducting a
benchmarking project is to improve process performances, followed by
addressing major strategic issues, and then to learn what other organisations are
doing. It is worth to mention that the reason the number one score is double score
of reason two, which means that majority of organisations rated this reason as
number one and two.
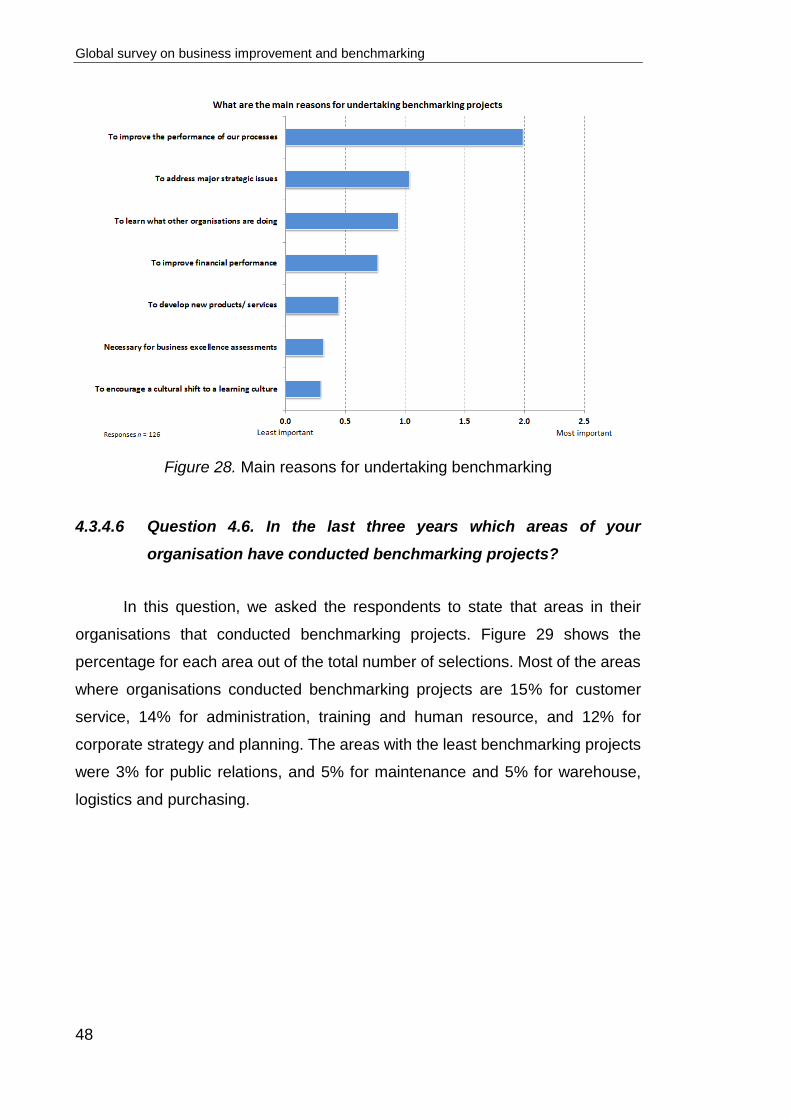
Global survey on business improvement and benchmarking
48
Figure 28. Main reasons for undertaking benchmarking
4.3.4.6 Question 4.6. In the last three years which areas of your
organisation have conducted benchmarking projects?
In this question, we asked the respondents to state that areas in their
organisations that conducted benchmarking projects. Figure 29 shows the
percentage for each area out of the total number of selections. Most of the areas
where organisations conducted benchmarking projects are 15% for customer
service, 14% for administration, training and human resource, and 12% for
corporate strategy and planning. The areas with the least benchmarking projects
were 3% for public relations, and 5% for maintenance and 5% for warehouse,
logistics and purchasing.
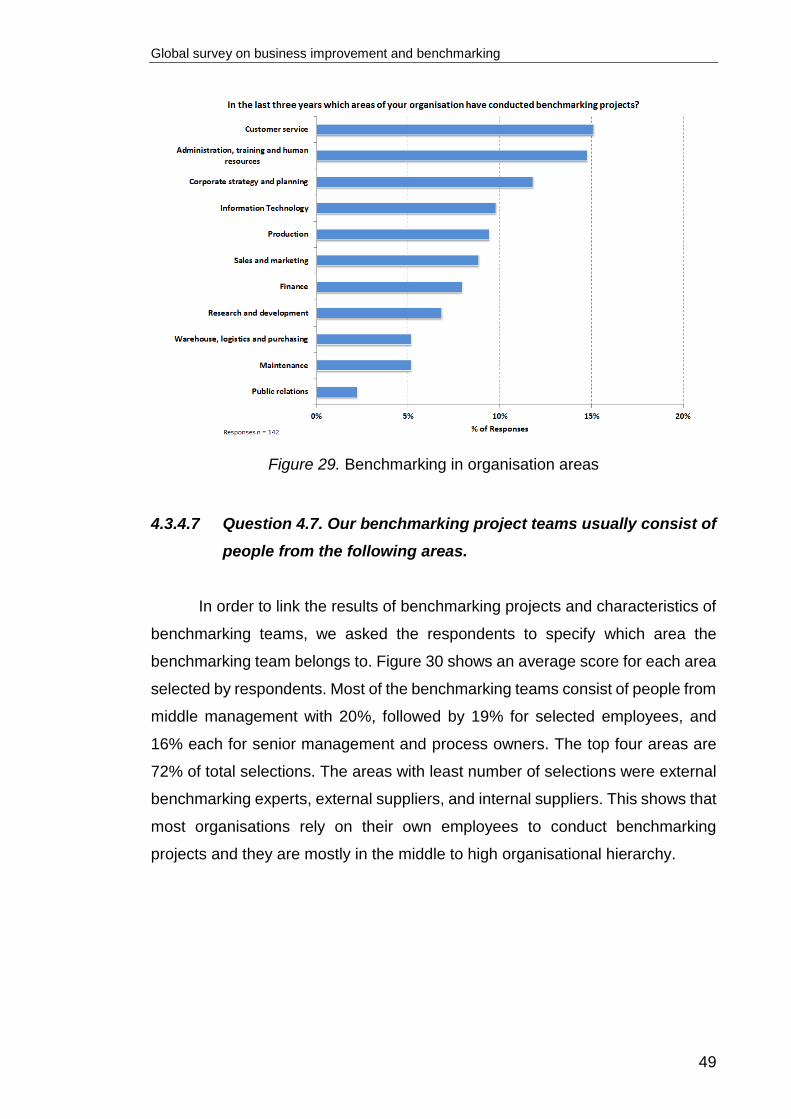
Global survey on business improvement and benchmarking
49
Figure 29. Benchmarking in organisation areas
4.3.4.7 Question 4.7. Our benchmarking project teams usually consist of
people from the following areas.
In order to link the results of benchmarking projects and characteristics of
benchmarking teams, we asked the respondents to specify which area the
benchmarking team belongs to. Figure 30 shows an average score for each area
selected by respondents. Most of the benchmarking teams consist of people from
middle management with 20%, followed by 19% for selected employees, and
16% each for senior management and process owners. The top four areas are
72% of total selections. The areas with least number of selections were external
benchmarking experts, external suppliers, and internal suppliers. This shows that
most organisations rely on their own employees to conduct benchmarking
projects and they are mostly in the middle to high organisational hierarchy.
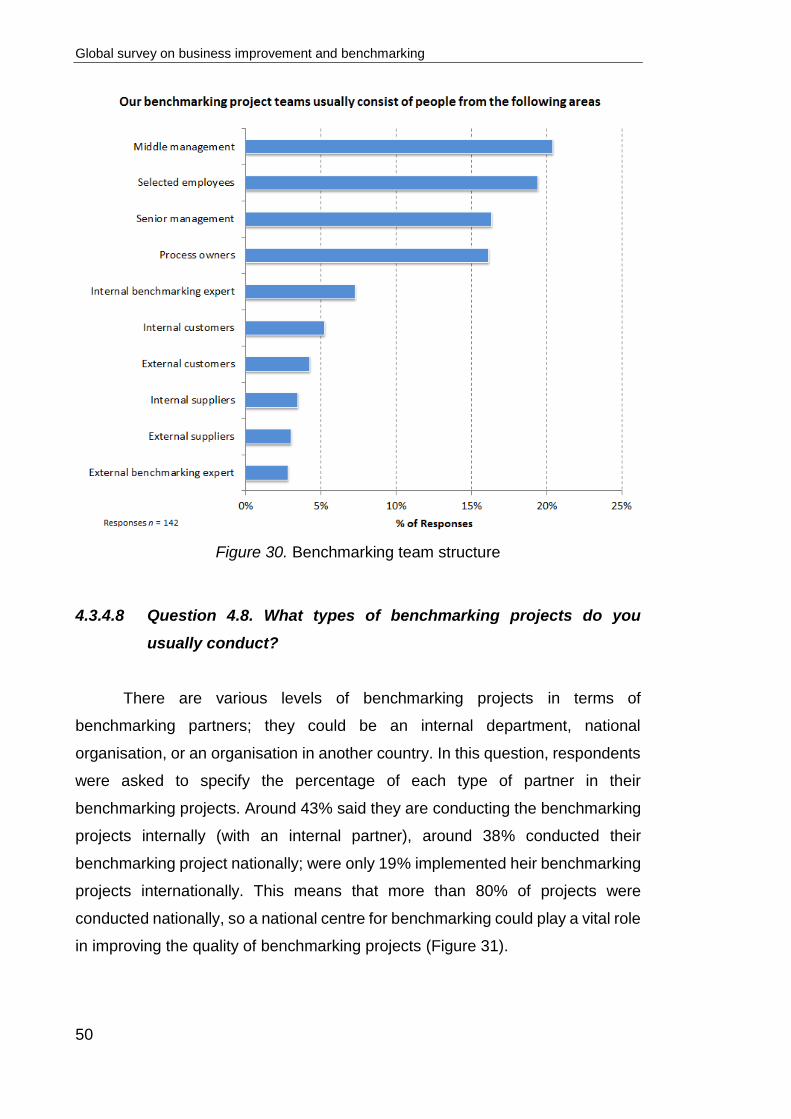
Global survey on business improvement and benchmarking
50
Figure 30. Benchmarking team structure
4.3.4.8 Question 4.8. What types of benchmarking projects do you
usually conduct?
There are various levels of benchmarking projects in terms of
benchmarking partners; they could be an internal department, national
organisation, or an organisation in another country. In this question, respondents
were asked to specify the percentage of each type of partner in their
benchmarking projects. Around 43% said they are conducting the benchmarking
projects internally (with an internal partner), around 38% conducted their
benchmarking project nationally; were only 19% implemented heir benchmarking
projects internationally. This means that more than 80% of projects were
conducted nationally, so a national centre for benchmarking could play a vital role
in improving the quality of benchmarking projects (Figure 31).

Global survey on business improvement and benchmarking
51
Figure 31. Types of benchmarking projects
4.3.4.9 Question 4.9. When planning a benchmarking project.
A benchmarking project without a proper planning that include a project
brief stating the aim, scope, sponsor and members of project team will most likely
lead to project failure or an inefficient project. Respondents were asked to state
how their respective organisations planned benchmarking projects in terms of
project brief, financial aspects and code of conduct.
Respondents were asked to state if a project brief was developed during
planning which includes aim, scope, sponsor and members of the benchmarking
team. Around 67% of organisations “usually” and “always” do develop a project
brief while 14% said they “do not” develop or “rarely” develop a project brief for
the benchmarking projects (Figure 32).
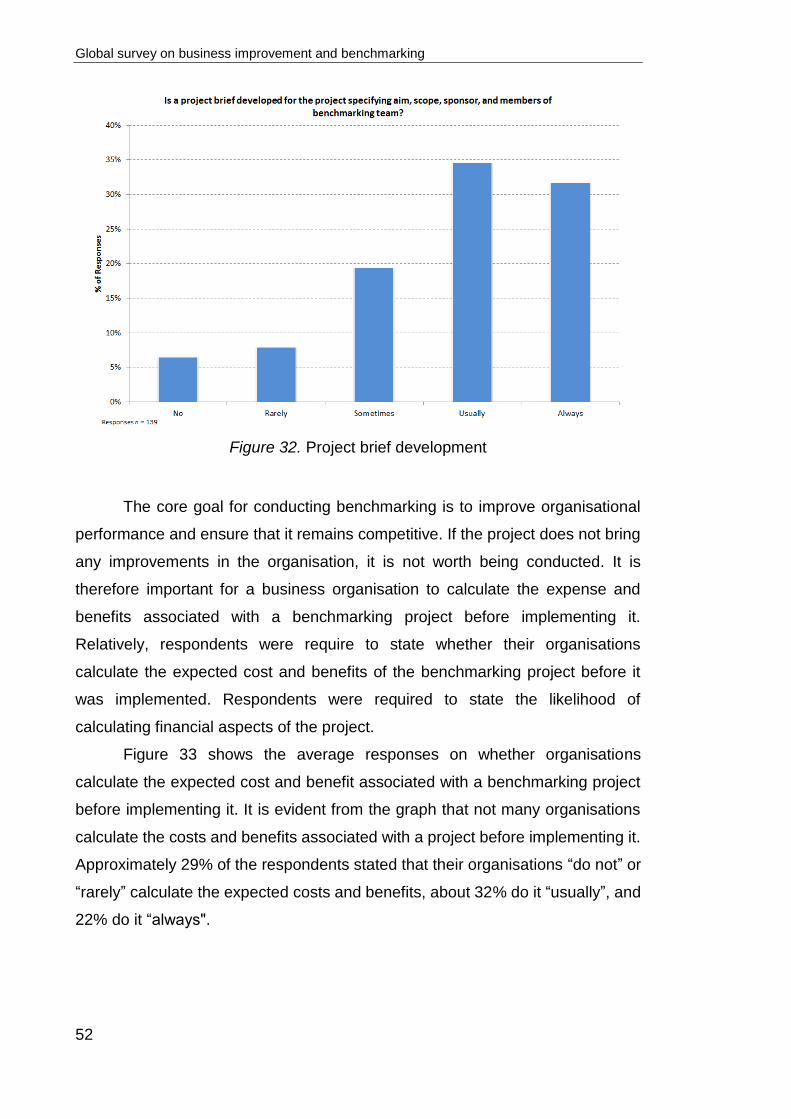
Global survey on business improvement and benchmarking
52
Figure 32. Project brief development
The core goal for conducting benchmarking is to improve organisational
performance and ensure that it remains competitive. If the project does not bring
any improvements in the organisation, it is not worth being conducted. It is
therefore important for a business organisation to calculate the expense and
benefits associated with a benchmarking project before implementing it.
Relatively, respondents were require to state whether their organisations
calculate the expected cost and benefits of the benchmarking project before it
was implemented. Respondents were required to state the likelihood of
calculating financial aspects of the project.
Figure 33 shows the average responses on whether organisations
calculate the expected cost and benefit associated with a benchmarking project
before implementing it. It is evident from the graph that not many organisations
calculate the costs and benefits associated with a project before implementing it.
Approximately 29% of the respondents stated that their organisations “do not” or
“rarely” calculate the expected costs and benefits, about 32% do it “usually”, and
22% do it “always".

Global survey on business improvement and benchmarking
53
Figure 33. Calculating the financial aspects of the project
Different business organisations use different benchmarking code of
conduct. However, the code of conduct is not well understood and followed as
expected, so the outcomes cannot be achieved. During the study respondents
were asked to state whether their organisations understand and follow a certain
benchmarking code of conduct.
Figure 34 presents the average responses regarding the organisation’s
understanding of the code of conduct. It is evident from the responses that
business organisations ensure that the benchmarking code of conduct is
understood and followed as stipulated. Around 58% of organisations “usually”
and “always” ensure that the benchmarking code of conduct is understood and
followed, while 27% of organisations said either “no” or “rarely”.

Global survey on business improvement and benchmarking
54
Figure 34. Adherence to code of conduct
4.3.5 Section 5: Best Practice Benchmarking Projects - Research and
Analysis
4.3.5.1 Question 5.1. Which of the following methods does your
organisation use to collect benchmarking data and best practice
information?
The next step after planning the benchmarking process is research and
analysis, which means finding the best practice and analysing the reasons behind
it that make it a best practice. Research and analysis are probably the most
difficult part in the project, especially for an inexperienced organisation. In this
question, respondents were asked to select data collection methods used in their
organisations from 10 methods. The chart below presents the average responses
on different methods used by organisations to collect benchmarking data.
Figure 35 presents the average of responses for “usually” and “always”.
The most used method is Searching websites with about 59%, followed by
Literature search with 52%, then Site visits with 51%. The least used methods
were Contacting trade association with 26%, followed by Benchmarking networks
with 33%, and then Conferences with 34%.

Global survey on business improvement and benchmarking
55
Figure 35. Most popular data collection methods
4.3.6 Section 6: Best Practice Benchmarking Projects - Implementation
Once the research and analysis stage for benchmarking project is finished,
organisations normally start to commence implementing the findings, depending
on project size, scope and resources available. Some projects might take long
time while and others take a shorter time to implement. It is therefore important
to ask respondents how benchmarking projects were managed during
implementation.
4.3.6.1 Question 6.1. How long does the implementation phase typically
take?
In this question, respondents were asked state how long the
implementation phase took in their organisations. Respondents were required to
choose from the time options provided in the questionnaire that ranged from less
than two months to more than 10 months. The averages responses are presented
in Figure 36. Around 70% of organisations finish implementing the outcomes of

Global survey on business improvement and benchmarking
56
the project in six months and less, while 30% of organisations take more than six
months for implementation. Therefore most projects are short-term projects.
Figure 36. Implementation phase duration
4.3.6.2 Question 6.2. What percentage of benchmarking projects result in
implementation?
It is worth noting that not all benchmarking projects proceed to
implementation stage; there are those that are dropped before implementation
due to several reasons such as lack of resources, failing to find a benchmarking
partner, or even that the projected improvement is not worth the effort to
implement it. In this question, respondents were required to state the percentage
of projects that result in implementation.
The results take the normal distribution shape, the majority 30% of
organisations said that 41-60% of benchmarking projects result in
implementation, only 6% said that more than 91% of projects result in
implementation, while 10% said that the implemented projects were less than
10% (Figure 37).

Global survey on business improvement and benchmarking
57
Figure 37. Percentage of benchmarking projects ending with implementation
4.3.7 Section 7: Evaluation
4.3.7.1 Question 7.1 At the end of a benchmarking project, do you
measure the improvements that have occurred?
Evaluation is the last stage in benchmarking projects. It is important for
organisations to evaluate the improvements that have occurred as result of
implementing a benchmarking project. In this question, respondents were asked
to state whether their organisations conduct an evaluation in order to determine
the improvements that have occurred.
From figure 38, it is evident that business organisations normally measure
the improvements incurred by the benchmarking projects. Only about 3% of
organisations stated that their organisations do not conduct any improvement
measurements after implementing benchmarking projects, while 68% of
organisations said they “usually” and “always” measure improvements.

Global survey on business improvement and benchmarking
58
Figure 38. Evaluating improvements
Following to the evaluating improvement, organisations need to measure
cost and benefit in order to evaluate the success of the project. Respondents
were asked to mention likelihood of undertaking cost and benefit analysis. About
41% said that they “usually” and “always” undertake cost and benefit analysis of
the project, 15% said they “do not” undertake cost and benefit analysis, while
21% do it “rarely”. There could be several reasons why approximately 36% of
organisations either “do not” undertake or “rarely” undertake cost and benefit
analysis (Figure 39). One reason might be that the main reason for conducting
the project is not related to financial improvement. Therefore, the organisation
might want to improve the performance of a process at any cost.
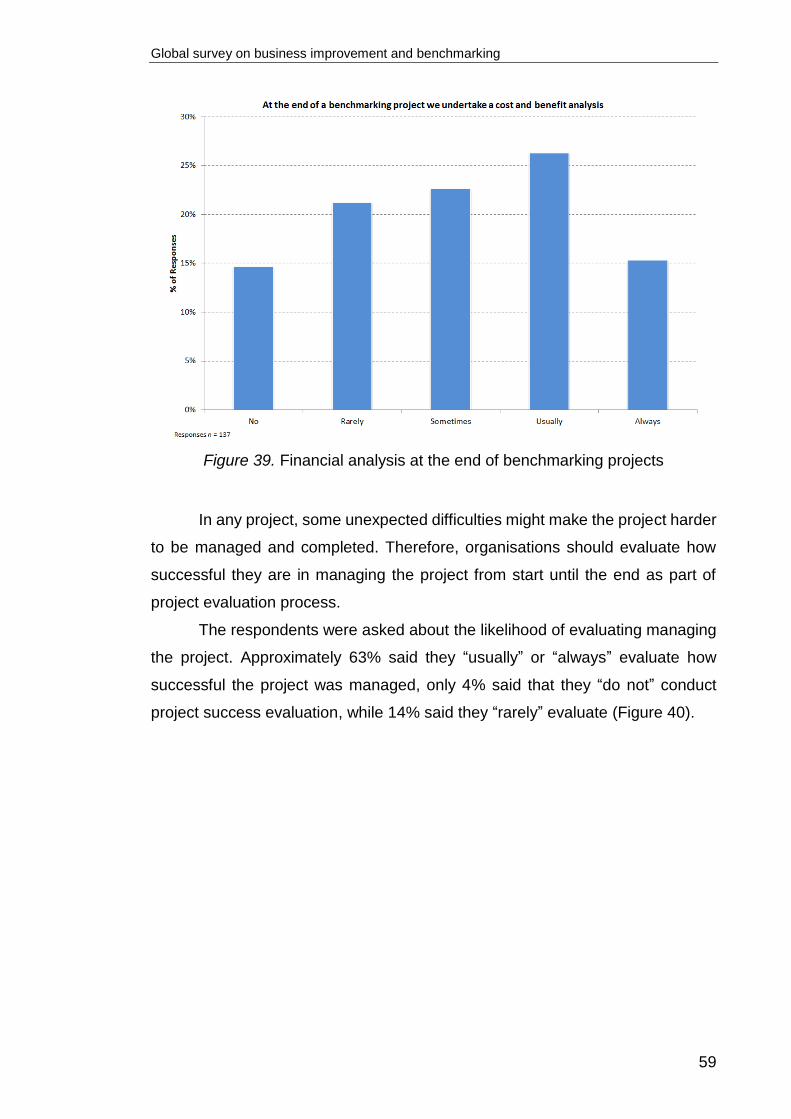
Global survey on business improvement and benchmarking
59
Figure 39. Financial analysis at the end of benchmarking projects
In any project, some unexpected difficulties might make the project harder
to be managed and completed. Therefore, organisations should evaluate how
successful they are in managing the project from start until the end as part of
project evaluation process.
The respondents were asked about the likelihood of evaluating managing
the project. Approximately 63% said they “usually” or “always” evaluate how
successful the project was managed, only 4% said that they “do not” conduct
project success evaluation, while 14% said they “rarely” evaluate (Figure 40).

Global survey on business improvement and benchmarking
60
Figure 40. Evaluating benchmarking project process
4.3.7.2 Question 7.2. The outcomes (best practices and/or results
achieved) from benchmarking projects are typically
communicated by:
Communication of the outcomes or results achieved after a benchmarking
process is very important in every organisation; otherwise staff members might
not be aware about the changes in the process. Clear communication of changes
is essential to avoid misunderstandings between different parties.
Depending on the size, type and resources of the organisation, different
types of communication medium are used to communicate outcomes of
benchmarking projects.
For this question, the respondents were asked to rate three
communication methods of benchmarking outcomes in descending order
according to their importance. In the analysis of this question, methods selected
as number one were given three points, two points for methods selected as
number two, and one point for methods selected as number three. The average
responses for this question are represented in Figure 41.

Global survey on business improvement and benchmarking
61
It is evident from the graph that presentations, reports and formal meeting
are the most preferred methods to communication outcomes of benchmarking
projects, while memos, notice boards and newsletters were the least preferred
methods with score of 0.1 and below (Figure 41).
Figure 41. Methods of project outcomes communication
4.3.7.3 Question 7.3. The main benefits of benchmarking projects have
been:
For this question, respondents were asked to rate three benefits gained
from benchmarking projects in descending order according to their importance.
In the analysis of this question, benefits selected as number one were given three
points, two points for benefits selected as number two, and one point for benefits
selected as number three. The chart below shows the average points for each
benefit. The main benefit of benchmarking projects was “Improved performance
of our processes” with 2.1 points, the second benefit was “Learnt what other

Global survey on business improvement and benchmarking
62
organisations are doing” with 0.8 points, which is half score of benefit number,
followed by “Major strategic issues addressed”. The least benefit was “Assisted
in business excellence assessments”, followed by “Encouraged a cultural shift to
a learning culture” and then “Developed new products/services” (Figure 42).
Obviously, organisations are conducting benchmarking projects primarily for
improving performance more than any other reason.
Figure 42. Main benefits of benchmarking projects
4.3.7.4 Question 7.4. On average, what is the financial return (US$) from
a typical benchmarking project after one year of implementation?
Respondents were asked to state the average financial returns that their
organisations gained from benchmarking after one year of implementing the
benchmarking project. In this question, respondents were required to choose an
average figure from those provided in the questionnaire.
It is evident from the graph below that 56% the benchmarking projects
have a financial return of less than US$50000 per annum. Approximately 28% of

Global survey on business improvement and benchmarking
63
organisations said the average financial return of benchmarking projects was less
than US$10,000, and 28% US$11,000 to US$50,000, while Approximately 25%
of organisations gained more US$101,000. This is an indicator that most
benchmarking projects are relatively small projects (Figure 43).
Figure 43. Financial return of benchmarking projects
4.3.7.5 Question 7.5. Approximately, what percentage of time is spent by
your organisation on each phase of the benchmarking process
out of total time spent?
Different phases of benchmarking take different periods from start to finish.
There are stages that are shorter than others. Respondents were asked to state
the amount of time spent on each phase of the benchmarking project. For this
question respondents were required to indicate the percentage of time spent on
each phases of benchmarking out of total project time from planning to
evaluation.
From figure 44, organisations spend 34% of the benchmarking time on
research and analysis phase followed by 33% for implementation phase, then
20% on planning phase and finally, 13% of time was spent on evaluation phase.

Global survey on business improvement and benchmarking
64
These figures are logical; the research and analysis phase involves many tasks
that take time and are related to benchmarking partners such as site visits and
meetings, which can take time more than expected. This is the same for the
implementation phase; physical changes in the process might be required to
implement the findings, or changes in regard to other departments or customers.
The evaluation phase is more on reviewing the results of benchmarking project
in terms of the changes and the project itself, therefore it is expected that the
evaluation phase will take the least time.
Figure 44. Time allocation for each phase of benchmarking project
4.3.7.6 Question 7.6. According to your experience, how do the following
factors contribute to the success of a benchmarking project?
In order for the benchmarking process to be successful, several supportive
factors should be provided. Respondents were therefore required to rate the
importance of factors to the success of the benchmarking project.
In this question, we asked the respondents to rate how each factor out of
15 factors contributes to the success of benchmarking projects. The average

Global survey on business improvement and benchmarking
65
responses for this question are presented in a graphical form as shown below.
The results shown are the percentage of respondents who answered with “High”
and “Very High” contributions to the success of the project.
Obviously, the most important factor is “Support of top management” with
a score of 99%; without top management support, performance improvement
programmes in general and benchmarking projects in particular will most likely
fail. The second most important factor was “Understanding of own process” with
90%, followed by “Clear project objectives” with 88%. The least important factor
was “Access to external/consultancy support for facilitating benchmarking
projects” with a score of 31% followed by 57% for “Research skills for conducting
surveys and site visits”, and then 70% for “Skills in process analysis” (Figure 45).
Figure 45. Most important requirements for a successful benchmarking project

Global survey on business improvement and benchmarking
66
4.3.8 Cross Tabulation Results
In order to know how some characteristics of benchmarking project setups affect
the results of benchmarking projects, the results were cross-tabulated for further
understanding.
4.3.8.1 Typical benchmarking team size in major effectiveness benefit
organisations
The cross-tabulating of typical benchmarking team size and major
effectiveness in how effective the benchmarking project was shows that
effectiveness increases with an increase of team size up to six people, and the
effectiveness of benchmarking project declines if team size exceeds six people.
Therefore, the maximum effectiveness is at 5-6 people team size, where 28% of
organisations achieved major effectiveness (Figure 46).
Figure 46. Typical benchmarking team size and benchmarking project benefit
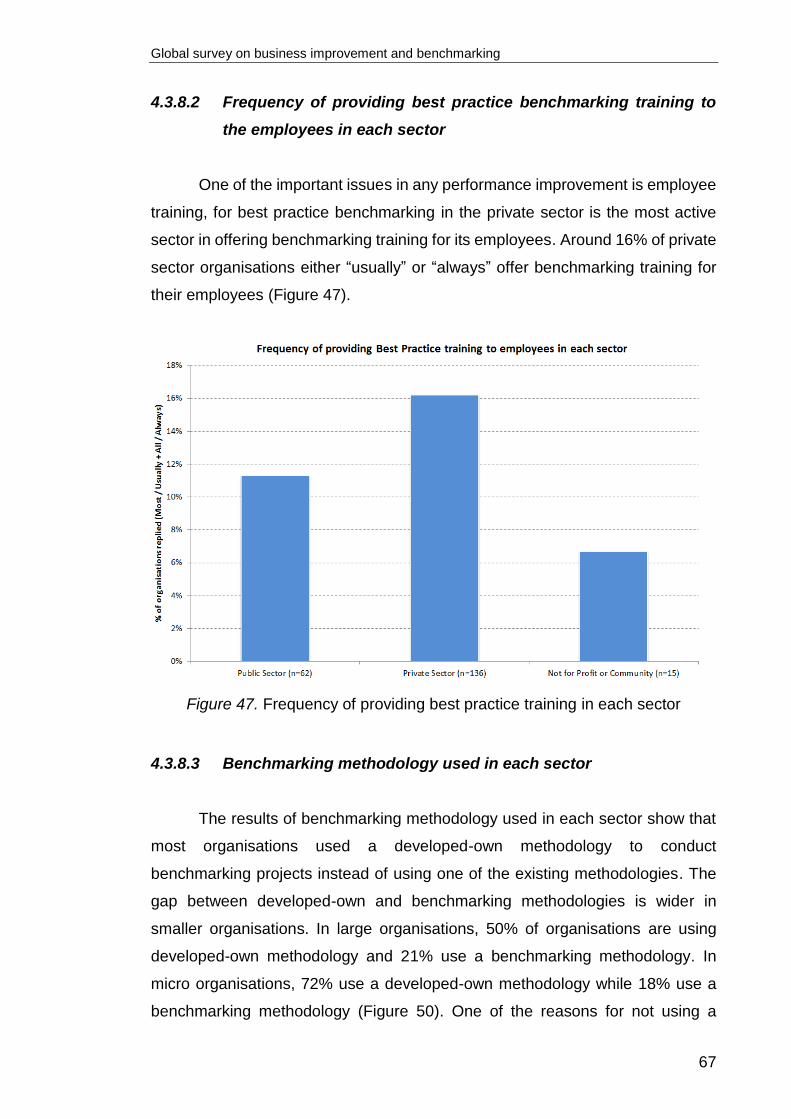
Global survey on business improvement and benchmarking
67
4.3.8.2 Frequency of providing best practice benchmarking training to
the employees in each sector
One of the important issues in any performance improvement is employee
training, for best practice benchmarking in the private sector is the most active
sector in offering benchmarking training for its employees. Around 16% of private
sector organisations either “usually” or “always” offer benchmarking training for
their employees (Figure 47).
Figure 47. Frequency of providing best practice training in each sector
4.3.8.3 Benchmarking methodology used in each sector
The results of benchmarking methodology used in each sector show that
most organisations used a developed-own methodology to conduct
benchmarking projects instead of using one of the existing methodologies. The
gap between developed-own and benchmarking methodologies is wider in
smaller organisations. In large organisations, 50% of organisations are using
developed-own methodology and 21% use a benchmarking methodology. In
micro organisations, 72% use a developed-own methodology while 18% use a
benchmarking methodology (Figure 50). One of the reasons for not using a

Global survey on business improvement and benchmarking
68
benchmarking methodology could be lack of resources in smaller organisations;
they tend to develop a methodology from one of the popular benchmarking
methodologies with main parts of a developed methodology.
Another issue with benchmarking methodologies in sectors is that the
majority of medium organisations do not follow any benchmarking methodology.
Conducting a benchmarking project without a methodology will affect the success
rate of benchmarking projects and their effectiveness.
Figure 48. Use of benchmarking methodology in each organisation size
4.3.8.4 Future use of benchmarking for each organisation size
Future use of benchmarking is one way of measuring uptake of
benchmarking and how popular it is. One of misconceptions about benchmarking
is that benchmarking is suitable for large organisations only, but these results
show that almost half of micro and small organisations are planning to use
benchmarking, while around 57% of micro organisations and 47% of small
organisations are planning to use benchmarking. The highest sector is the large

Global survey on business improvement and benchmarking
69
organisations with 69% and the lowest is medium organisations with 46% (Figure
49).
Figure 49. Future use of best practice benchmarking in different organisation sizes
4.3.8.5 Types of best practice benchmarking projects in each
organisation size
Due to several reasons, organisations prefer to implement one type of best
practice benchmarking over another. For example, international best practice
benchmarking projects are normally more expensive than national best practice
benchmarking, which is also more expensive than the internal projects.
Among the three types of best practice benchmarking, the lowest type is
international best practice benchmarking, with 15% in micro and medium
organisations, 18% in large organisations and 31% in small organisations (Figure
50). Except for medium organisations, internal benchmarking is the most
preferred best practice benchmarking method followed by national best practice
benchmarking and then international best practice benchmarking.

Global survey on business improvement and benchmarking
70
Figure 50. Types of implemented benchmarking projects in different organisation sizes
4.3.8.6 Employee-related data collection in each sector
In each organisation there were some priorities in collecting benchmark
data. In the following five charts the benchmark data area was cross-tabulated
with organisations sectors. For employee-related areas, the public sector was the
highest sector; 44% of public sector regularly collect benchmark data and act
upon them, followed by not-for-profit sectors with 40% and finally, private sectors
with 34% (Figure 51).
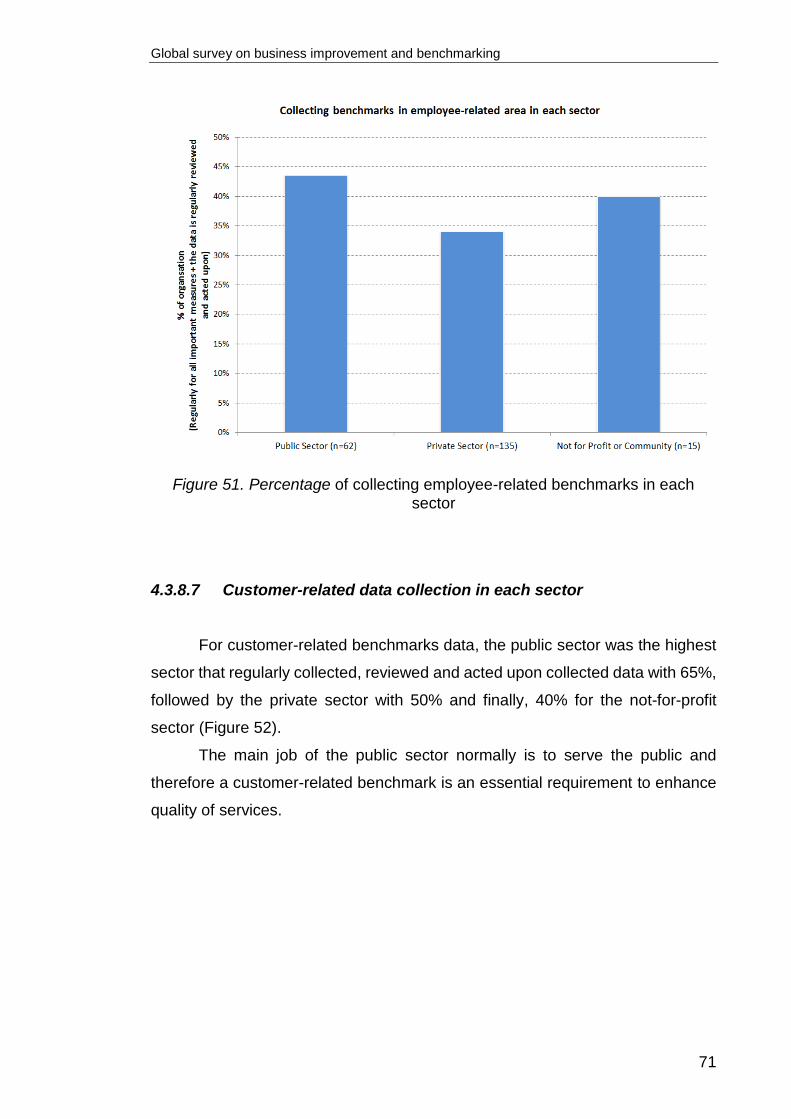
Global survey on business improvement and benchmarking
71
Figure 51. Percentage of collecting employee-related benchmarks in each sector
4.3.8.7 Customer-related data collection in each sector
For customer-related benchmarks data, the public sector was the highest
sector that regularly collected, reviewed and acted upon collected data with 65%,
followed by the private sector with 50% and finally, 40% for the not-for-profit
sector (Figure 52).
The main job of the public sector normally is to serve the public and
therefore a customer-related benchmark is an essential requirement to enhance
quality of services.

Global survey on business improvement and benchmarking
72
Figure 52.Percentage of collecting customer-related benchmarks in each sector
4.3.8.8 Financial-related data collection in each sector
The main driver for the private sector is profitability and therefore
improving the financial figures are what private sector is trying to do with different
performance improvement programmes. For the collection of financial-related
benchmarks the private sector came first, with 56% of organisations do collect
and act upon data regularly, followed by 52% for the public sector and finally,
33% for the not-for-profit sector (Figure 53).

Global survey on business improvement and benchmarking
73
Figure 53. Percentage of collecting financial-related benchmarks in each sector
4.3.8.9 Process-related data collection in each sector
The results of process-related benchmarks data collection in the public
sector and private sector were very close. Managing processes efficiently and
effectively is a prerequisite for product and service continuity. Approximately 48%
of public sector organisations collect and act upon process-related benchmarks
regularly, followed by 46% for the private sector and finally, 33% for not-for-profit
organisations (Figure 54).

Global survey on business improvement and benchmarking
74
Figure 54. Percentage of collecting process-related benchmarks in each sector
4.3.8.10 Product-related data collection in each sector
For product-related benchmarks, the highest sector to collect, review and
act upon them was the private sector with 55%, followed by the public sector with
47%, and finally the not-for-profit sector with 40% (Figure 55). From the area-
related data collection charts, the private sector seems to concentrate on
technical areas such as processes, financial and product while the public sector
is more concerned about soft issues such as human resource and customers.

Global survey on business improvement and benchmarking
75
Figure 55. Percentage of collecting product-related benchmarks in each sector
4.3.8.11 Main reasons for not using benchmarking in large organisations
In order to help organisations to conduct effective and efficient
benchmarking projects, it is important to know the reasons for not using
benchmarking. For large organisations, lack of resources, lack of technical
knowledge in planning benchmarking projects and lack of benchmarking partners
were the top three reasons for not using benchmarking. Among the top three
reasons, the are two reasons could be overcome by providing awareness
sessions and training courses (Figure 56).

Global survey on business improvement and benchmarking
76
Figure 56. Main reasons for not using benchmarking in large organisations
4.3.8.12 Main reasons for not using benchmarking in medium
organisations
For medium organisations, the top three reasons for not using
benchmarking were the same reasons for large organisations but in different
order: the first reason was the lack of technical knowledge in planning
benchmarking projects, while the second was lack of resources. The score of the
first reason is relatively high and it could be resolved by supporting the medium
organisations with the right training (Figure 57).

Global survey on business improvement and benchmarking
77
Figure 57. Main reasons for not using benchmarking in medium organisations
4.3.8.13 Main reasons for not using benchmarking in small organisations
Similar to large and medium organisations, the top three issues in small
organisations were the same but in different order: the most important reason
was the lack of resources, which is something expectable in small organisations,
followed by lack of benchmarking partners and then lack of technical knowledge
in planning benchmarking projects. It has been noted that the difference between
the first two reasons and the remainder of the reasons (0.1) is more than between
other reasons (less than 0.05), which means that the majority of respondents
selected them as the first choice. In addition, the least important reason was the
lack of authority, with very low score less than 0.1, which indicates that this
reason was selected by few organisations as the second or third reason (Figure
58).

Global survey on business improvement and benchmarking
78
Figure 58. Main reasons for not using benchmarking in small organisations
4.3.8.14 Main reasons for not using benchmarking in micro organisations
In micro organisations the situation is different in regard to how the
reasons are ranked. Apart from the first reason which lack of resources, the
reasons were in different order. Another point to note is that the score of the first
three reasons is almost three times the score of the rest of the reasons (Figure
59). This is an indicator that the majority of organisations selected the first three
as the most important three reasons.

Global survey on business improvement and benchmarking
79
Figure 59. Main reasons for not using benchmarking in micro organisations
4.3.8.15 Main reasons for using benchmarking in each sector.
Understanding what motivates organisations to conduct a benchmarking
project will help in understanding how a benchmarking project is initiated.
For all sectors, the first reason to conduct a benchmarking project was to
improve performance of processes. For the public sector, the second reason was
to address major strategic issues and third reason was to learn what other
organisations are doing. In the private sector, learning what other organisations
doing was more important than addressing strategic issues (Figure 60).
The least important reason was to encourage a cultural shift to a learning
culture.
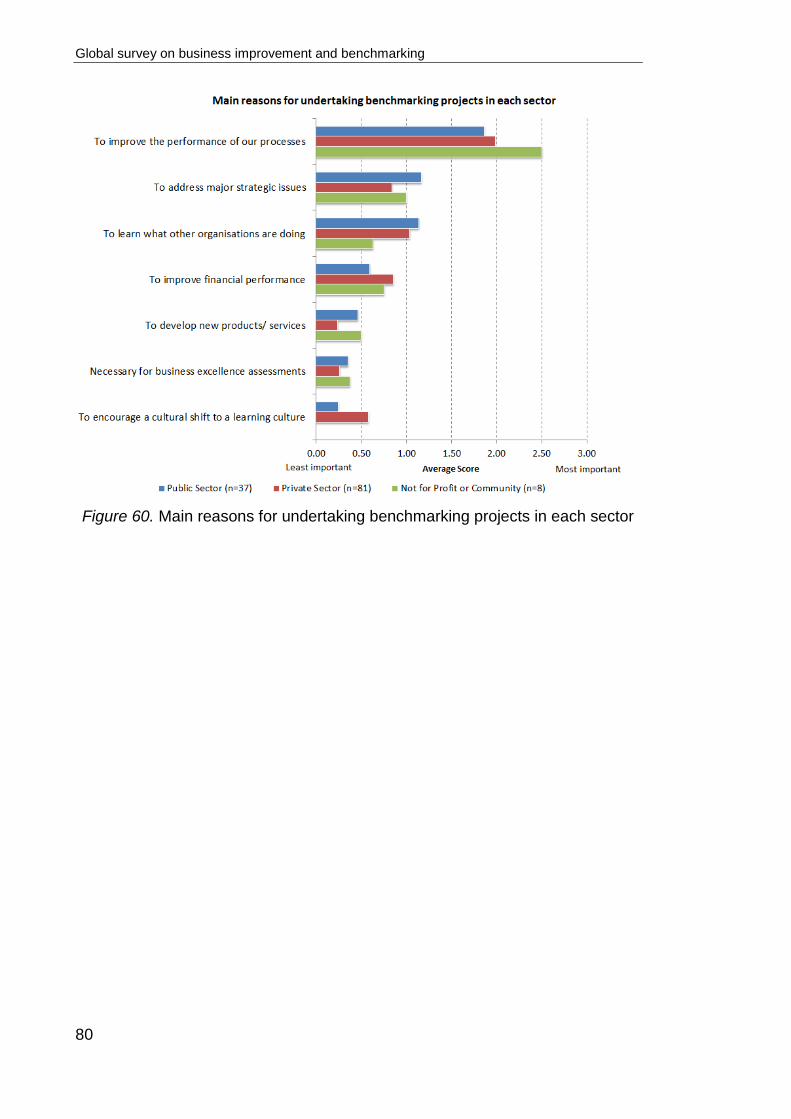
Global survey on business improvement and benchmarking
80
Figure 60. Main reasons for undertaking benchmarking projects in each sector

Global survey on business improvement and benchmarking
81
Chapter 5: Discussion and Conclusion
5.1 Introduction to the Chapter
This chapter concludes the research project by discussing the summary
of the main research findings, limitations of the research, and the next step to
complete the research.
5.2 Awareness and Uptake of Benchmarking
The results from organisations that replied to awareness of performance
improvement techniques question with moderate and high awareness indicate
that organisations are aware of the three types of benchmarking. Usage figures
show that there is a small gap between awareness and usage for formal
benchmarking. This gap is wider in performance benchmarking and then best
practice benchmarking. This might be due the fact that best practice
benchmarking is more complex and needs investments in training and resources
to apply it. Additionally, the recent developments in social media and knowledge
sharing websites make the exchange of ideas much easier and cheaper.
Therefore, informal benchmarking could be done without leaving the workplace.
Another interesting finding is that awareness and usage of the three types
of benchmarking is more than other well-known improvement techniques such as
six-sigma, 5S and lean.
Several published studies have presented similar findings about the
uptake of benchmarking. A study by Voss et al. (1997) on European organisations
suggests that 88% of organisations are using benchmarking and 7% are using
best practice benchmarking. Longbottom (2000) referred to a 1995 study by
Coopers & Lybrand Consultancy Company on Time’s top 100 companies; the
study found that 78% of organisations are involved in benchmarking. A survey in
1993 in Australia found that the uptake of benchmarking among Australia’s top
500 organisations was 70% (Tyler, 2005).
Global survey on business improvement and benchmarking
82
Today, after two decades of several studies about benchmarking usage,
benchmarking has been found to still be a popular tool. More importantly, the
uptake of best practice benchmarking has increased.
5.3 Effectiveness of Benchmarking
Among the three types of benchmarking, best practice benchmarking is
more effective than informal benchmarking and performance benchmarking. This
is due to that best practice benchmarking is more planned and structured than
other two benchmarking types.
When the effectiveness of best practice benchmarking was compared with
other improvement techniques such as six-sigma, lean and 5S, it was ranked
lower. Therefore, usage is higher and effectiveness is lower. The reasons for this
could be:
• Training issues: Training is a crucial part of any improvement
programme. Yet, around 55% of organisations do not provide any
benchmarking training or provide it “rarely”. Furthermore, 30% provide
training only “sometimes” (Figure 13).
• Planning issues: In the planning phase there are number of issues
organisations need to address if they want to achieve good results in
benchmarking. For example, 29% of organisations “do not” do or
“rarely” calculate expected cost and benefit (Figure 33). Another issue
in the planning phase is the methodology used; around 21% of
organisations do not follow any formal benchmarking methodology
while 51% use developed-own methodology, which might be not as
effective as the known methodologies (Figure 26).
Project brief is another area that might lead to a low effectiveness
perception. Thirty-three percent of organisations “do not”, “rarely” or
just “sometimes” develop a project brief. Without a project brief that
outlines aim, scope, and sponsors it will be unlikely the project will
result good outcomes (Figure 31).
• Implementation issues: Around 36% of organisations implement the
findings from less than 40% of their benchmarking projects (Figure 36).
Ideally, all benchmarking should end with successful implementation;

Global survey on business improvement and benchmarking
83
therefore organisations need to target 100% successful
implementation.
Comparing these figures with previous research, a study by Kumar and
Chandra (2001) on US manufacturing organisations pointed out that 40% of
organisations are “completely successful” or “very successful” in terms of
benchmarking effectiveness. In Singapore, Brah, Ong, and Rao (2000) reported
that approximately 58% of organisations rated their benchmarking process as
successful. This is an indicator that benchmarking success varies between
countries, and some countries seem to be better in terms of awareness and
effectiveness. This is one of the major points that to be explored in later phases
of the research.
5.4 Future Use of Benchmarking
Although perception of best practice benchmarking effectiveness is
lagging behind other less popular techniques, the planned use of the three types
of benchmarking remains in the top four. The main reasons behind that could be
due to the types of reasons for not conducting benchmarking, referring to Figure
12, the top three reasons for not using benchmarking are mainly resources-
related issues such providing resources to conduct benchmarking, finding
benchmarking partners, or providing suitable training for conducting
benchmarking projects efficiently. This is in line with previous research such as
Majd (2011), who studied Egyptian organisations. The second most important
reason for not using benchmarking was lack of resources (time and money), also,
Hinton et al., (2000) research in the UK suggested that resource constraints are
one of the main reasons for UK organisations do not conduct any benchmarking
projects. Therefore, organisations are aware of the potential benefit of
benchmarking but they cannot apply it, mainly due to lack of resources. Once this
issue is resolved, then it is likely that organisations will start applying
benchmarking.

Global survey on business improvement and benchmarking
84
5.5 Benchmarking and the Other Performance Improvement Tools
A closer look at the improvement techniques that are compared with
benchmarking shows that they differ in terms of complexity; for example, six
sigma and BPR are complex tools compared with customer (client) surveys and
employee suggestion schemes. Furthermore, some tools were found to be more
popular in certain sectors and organisation size, such as customer (client)
surveys being more popular in service organisations whereas 5S is more popular
in manufacturing organisations.
In Figures 8, 9 and 10, the results of awareness and uptake of
benchmarking show better results than technical techniques such as quality
function deployment (QFD) and six sigma, whereas technical tools are perceived
to be more effective than benchmarking. This difference in awareness, uptake
and effectiveness could be due to several reasons:
1- Organisations might be well aware about the tools but they do not
apply it for technical or resources-related issues such as time and cost.
2- Organisations might apply the technical tools (such as six sigma
and QFD) with the help of third party consultancy companies. This is something
especially common in large organisations; therefore, this can lead to a gap
between awareness and usage.
3- The respondents of the questionnaire were from different countries,
sectors and organisation sizes. This will have an effect on results; for example,
5S originated from Japan and it is more popular in Asian industrial organisations
whereas six sigma is more popular in the UK, Germany and Canada.
5.6 Best Practice Benchmarking
Research results shows that the majority of organisations take less than
four months to complete a benchmarking project, and the main reason for
conducting benchmarking project is to improve process performance in areas of
customer service and human resources (Figures 27, 28 and 29 respectively).
Previous research shows different findings. For example, Kumar and
Chandra (2001) reported that increasing profitability is the main reason for
conducting benchmarking for more than half of the organisations they studied,
Global survey on business improvement and benchmarking
85
while Cassell, Nadin, and Gray (2001) found that 42% of organisations were
conducting benchmarking to improve financial performance. This shows a shift in
what motivates organisations to conduct benchmarking projects.
Financial performance and profitability were the main reasons for an
organisation implementing improvement techniques (or at least benchmarking),
today and, after more than 10 years since the Cassell, Nadin, and Gray (2001)
study, improving process performance seems to be the main concern of
organisations, rather than profitability of financial performance.
In terms of time taken to complete benchmarking projects, there appears
to be a significant decrease in benchmarking project time. For example, the
Longbottom (2000) study of benchmarking in the UK shows that the average time
for the planning phase was 3 to 6 months and the analysis phase was 3 to 6
months. This means that on average, benchmarking projects take from 6 to 12
months to complete, excluding the implementations phase, while our findings
suggest that approximately 82% of organisations take 6 months or less to
complete their benchmarking projects, excluding the implementation phase.
Obviously, the main reason behind this decrease was the advancements
in web technologies and social media; in 2000 the Internet was in its early stages
and only a few organisations shared information publicly, while today it is the
norm for organisations to be present on the Internet and publish frequent reports
about their performance. Furthermore, the social media has made
communication much easier than before; for example, business meetings could
be done online using web-conferencing.
The questionnaire also showed that the majority of organisations (84%)
conduct two or more benchmarking projects annually; this is further evidence that
benchmarking is used regularly and organisations implement it to gain
improvements, not just as something to try as “one-off” or onetime project.
Characteristics of benchmarking teams (Figures 25 and 30) show that the
majority of benchmarking teams (61%) consist of four people or fewer while, in
71% of organisations, the benchmarking team consists of employees from middle
management, selected employees, senior management and process owners,
Bhutta and Huq’s (1999) research suggests that organisations’ employees have
not always been involved in process of benchmarking. This shows a shift in the
way organisations are conducting benchmarking – from a project initiated and
Global survey on business improvement and benchmarking
86
implemented by a separate team to an integrated process in the organisation as
an ongoing process.
In terms of difficulties that obstruct organisations from implementing
benchmarking, the research suggests that lack of resources, lack of
benchmarking partners and lack of technical knowledge are the top three
reasons. Lack of resources were found to be the number one reason in a number
of studies such as the Zeinalnezhad, Mokhtar, and Sahran (2013) study on
Malaysian organisations. Their study suggests that lack of resources, which
include limited time, skilled manpower, and money, are the first barriers to
benchmarking adoption, followed by low levels of knowledge sharing between
partners. Cassell, Nadin, and Gray (2001) suggested that time and resources are
the main reasons for organisations for not undertaking benchmarking. The results
show that resources in terms of time to complete the benchmarking project are
no longer one of the top reasons for obstructing benchmarking uptake; the results
show that the majority of organisations take less than six months to complete
their benchmarking projects (Figure 27). Consequently, the new web
technologies have made the exchange of information much easier than before,
which was reflected in benchmarking project duration.
“Improved performance of processes” is the most important benefits of
benchmarking projects. In fact, the second main benefit, “learnt what other
organisations are doing”, scores less than half of the first benefit. This an indicator
that benchmarking is an effective performance improvement tool. A number of
research studies suggest that the main benefit obtained from benchmarking is
process improvement (Magd, 2011; Panwar, Nepal, Jain, & Yadav, 2013). This
agrees with earlier researchers, such as Clarke and Stan Manton, (1997);
Coopers and Lybrand, (1995); and Jarrar and Zairi, (2001). Other researchers
have suggested other major benefits besides performance improvement, such as
improved customer satisfaction; improved quality conformance and productivity
improvement (Brah, Ong, & Rao, 2000; Chapman & Sloan, 1999). Therefore, the
majority of benchmarking benefits are on the technical and operational level of
the organisation.

Global survey on business improvement and benchmarking
87
5.7 Conclusion
Findings of this research were the result of a comprehensive study on
benchmarking adoption and implementation. The results show that, 30 years
after the inception of formal benchmarking, it remains one of the top used
improvement techniques. However, the uptake of best practice benchmarking is
lagging behind performance benchmarking and informal benchmarking. One of
the main reasons is that performance benchmarking and informal benchmarking
are easier and require fewer resources than best practice benchmarking. In terms
of future use, projections show that the percentage of organisation planning to
apply benchmarking is greater than many other popular improvement techniques,
which is an indicator that benchmarking is perceived as an effective improvement
tool.
The research has also shown that awareness and effectiveness of
benchmarking is comparable to a number of improvement techniques.
Specifically, the awareness of benchmarking is higher than a number of
improvement techniques that are normally used to solve technical issues such as
business process re-engineering and six sigma. This means that benchmarking
is perceived as an effective tool to solve complex issues.
In terms of difficulties that hinder benchmarking adopting, which is the
most important issues that needs to be addressed in order to go further in this
research, the difficulties can be classified in two groups. The first one is a group
of barriers that are related to knowledge such as understanding of benchmarking,
technical knowledge in planning benchmarking projects, and lack of
benchmarking partners. These barriers could be addressed by offering support
services such as benchmarking clubs/networks, online benchmarking databases,
and consultancy services. The second group of barriers are issues related to
management such as lack of top management commitment and fear of sharing
information. These barriers could be addressed by providing professional
benchmarking training services to increase the awareness of benchmarking and
correct the misconceptions. The training issue is not just a management staff
issue; a considerable percentage of organisations said that they have not
received any training on benchmarking. Therefore, providing benchmarking

Global survey on business improvement and benchmarking
88
training to will help organisations to conduct more efficient and effective
benchmarking projects.
Although different researchers have suggested different benefits of
benchmarking, improving process performance is one of the most common
benefits of benchmarking. Therefore, organisations tend to use benchmarking to
solve process performance issues more than addressing strategic issues and
encouraging cultural shifts. Apart from the different benefits brought to
organisations, there is something unique with benchmarking, and that is that
benchmarking enables organisations to see the world outside their own
organisation, thereby giving them the opportunity to have an aerial view of their
organisation and compare it with different organisations.
Finally, benchmarking, in its different forms, has been proven to establish
improvement techniques that will continue to deliver results for organisations of
different sizes, sectors and industries around the world. This will primarily be
through utilisations of best practice benchmarking, as it is the most effective type
of benchmarking.
5.8 Research Limitations
As in any research, there are some limitations in this research. Although
there were 453 responses from 44 countries, making this study one of the most
comprehensive studies on benchmarking adoption to date, from the researcher's
point of view, the number of responses from some counties was few compared
to population, economy size and the number of responses from other countries.
It is preferable to have more responses from developed countries to gain deeper
information about the status of benchmarking. Another issue is that there is one
response per organisation, but this was mainly due to the questionnaire being
sent to the person responsible for performance improvement activities and
therefore his/her answer may not be representative of the organisation.
Moreover, at this part of the final research (developing a national strategy for
promoting benchmarking), only descriptive statistics were used. Also, no country
or sector level analysis was reported, although it was reported in Mann, Abbas,
Kohl, Orth, and Görmer (2010). The reason is that the primary aim of this research

Global survey on business improvement and benchmarking
89
is to look at the benchmarking and understand it globally rather than identify the
relationships between variables.
5.9 Future research
The research was one of few global studies about benchmarking in
general and best practice benchmarking in particular. The main aim of this part
of the research was to examine the state of benchmarking globally in terms of
benchmarking effectiveness, awareness, future use and how the organisations
manage their projects from planning to implementation.
The next step for this research is to build on this thesis and achieve the
remaining objectives shown in section 1.3 by:
Identifying the benefits of developing a national benchmarking
strategy.
Identifying the key components of a national benchmarking
strategy.
And finally,
Identifying the best practices in the design and deployment of a
national benchmarking strategy.

Global survey on business improvement and benchmarking
90
References
Ahmed, P. K., & Rafiq, M. (1998). Integrated benchmarking: a holistic examination of
select techniques for benchmarking analysis. Benchmarking for Quality
Management & Technology, 53, 225-242.
Asrofah, T., Zailani, S., & Fernando, Y. (2010). Best practices for the effectiveness of
benchmarking in the Indonesian manufacturing companies. Benchmarking: An
International Journal, 17(1), 115-143. doi: 10.1108/14635771011022343
Bogan, C. E., & English, M. J. (1994). Benchmarking for best practices : winning through
innovative adaptation. New York: McGraw-Hill.
Boxwell, R. J. (1994). Benchmarking for competitive advantage. New York: McGraw-Hill.
BPIR. (2013). What is Benchmarking? Retrieved 30 June 2013, 2013, from
http://www.bpir.com/index.php?option=com_content&task=view&id=53&Itemid=
69
Brah, S. A., Ong, A. L., & Rao, B. M. (2000). Understanding the benchmarking process
in Singapore. International Journal of Quality & Reliability Management, 17(3),
259-275. doi: 10.1108/02656710010306157
Bhutta, K. S., & Huq, F. (1999). Benchmarking-best practices: an integrated approach.
Benchmarking: An International Journal, 6(3), 14. doi:
10.1108/14635779910289261
Camp, R. C. (1989). Benchmarking : the search for industry best practices that lead to
superior performance. Milwaukee, WI.: ASQ Quality Press
Camp, R. C. (1995). Business process benchmarking : finding and implementing best
practices. Milwaukee, Wis.: ASQC Quality Press.
Chapman, R. L., & Terry R. Sloan. (1999). Large firms versus small firms - do they
implement CI the same way? The TQM Magazine, 11(2), 105-110. doi:
10.1108/09544789910370680

Global survey on business improvement and benchmarking
91
Chau, V. S. (2009). Benchmarking service quality in UK electricity distribution networks.
Benchmarking: An International Journal, 16(1), 47-69.
Clarke, A., & Stan Manton. (1997). A benchmarking tool for change management.
Business Process Management Journal. doi: 10.1108/14637159710192293
Codling, S. (1995). Best practice benchmarking : a management guide. Aldershot,
Hampshire, England ; Brookfield, Vt., USA: Gower.
Coopers, & Lybrand. (1995). Survey of Benchmarking in the UK, London: Coopers &
Lybrand
Cassell, C., Nadin, S., & Gray, M. O. (2001). The use and effectiveness of
benchmarking in SMEs. Benchmarking: An International Journal, 8(3), 212-222.
doi: 10.1108/EUM0000000005624
Dattakumar, R., & Jagadeesh, R. (2003). A review of literature on benchmarking.
Benchmarking: An International Journal, 10(3), 176-209. doi:
10.1108/14635770310477744
Fong, S. W., Cheng, E. W. L., & Ho, D. C. K. (1998). Benchmarking: a general reading
for management practitioners. Management Decision, 36(6), 407-418.
Francis, G., & Holloway, J. (2007). What have we learned? Themes from the literature
on best-practice benchmarking. International Journal of Management Reviews,
9(3), 171-189. doi: 10.1111/j.1468-2370.2007.00204.x
Hinton, M., Francis, G., & Holloway, J. (2000). Best practice benchmarking in the UK.
Benchmarking: An International Journal, 7(1), 52-61. doi:
10.1108/14635770010314954
Hong, P., Hong, S. W., Roh, J. J., & Park, K. (2012). Evolving benchmarking practices:
a review for research perspectives. Benchmarking: An International Journal,
19(4), 444-462. doi: 10.1108/14635771211257945
Jacobson, G., & Hillkirk, J. (1986). Xerox : American samurai. New York: Macmillan.
Global survey on business improvement and benchmarking
92
Jarrar, Y. F., & Zairi, M. (2001). Future trends in benchmarking for competitive
advantage: A global survey. Total Quality Management, 12(7-8), 906-912.
Joo, S.-J., Nixon, D., & Stoeberl, P. A. (2011). Benchmarking with data envelopment
analysis: a return on asset perspective. Benchmarking: An International Journal,
18(4), 529-542. doi: DOI 10.1108/14635771111147623
Kumar, S., & Chandra, C. (2001). Enhancing the effectiveness of benchmarking in
manufacturing organizations. Industrial Management & Data Systems, 101(2),
80-89.
Letts, C., Grossman, A., & Ryan, W. P. (1999). High performance nonprofit organizations
: managing upstream for greater impact. New York: Wiley.
Longbottom, D. (2000). Benchmarking in the UK: an empirical study of practitioners and
academics. Benchmarking: An International Journal, 7(2), 98-117. doi:
10.1108/14635770010322324
Magd, H. (2011). Best Practice through Benchmarking in Egyptian Organizations: An
Empirical Analysis. Global Business & Management Research, 3(1), 67-78.
Maire, J.-L., Bronet, V., & Pillet, M. (2005). A typology of “best practices” for a
benchmarking process. Benchmarking: An International Journal, 12(1), 45-60.
doi: 10.1108/14635770510582907
Mamata, R. S., Atul, K. M., & Upadhyay, V. (2011). Benchmarking of North Indian urban
water utilities. [Article]. Benchmarking: An International Journal, 18(1), 86-106.
Mann, R., Abbas, A., Kohl, H., Orth, R., & Görmer, M. (2010). Global Survey on Business
Improvement and Benchmarking. Berlin, Germany: Global Benchmarking
Network.
Mann, R. (2006). A comparison of how sixteen countries administer and promote
business excellence frameworks. Paper presented at the 3rd Quality Conference
of Bahrain Quality Society, Manama, Bahrain.

Global survey on business improvement and benchmarking
93
Mathaisel, D. F. X., Cathcart, T. P., & Comm, C. L. (2004). A framework for
benchmarking, classifying, and implementing best sustainment practices.
Benchmarking: An International Journal, 11(4), 403-417. doi:
10.1108/14635770410546791
Merrifield, D. (1994). Measurements of productivity: Key to survival. International journal
of technology management : IJTM(9), 771–783.
Min, H., & Galle, W. P. (1996). Competitive benchmarking of fast food restaurants using
the analytic hierarchy process and competitive gap analysis. Operations
Management Review, 11(2/3), 57-72.
Nemec, J., Merickova, B., & Ochrana, F. (2008). Introducing benchmarking in the Czech
Republic and Slovakia. [Article]. Public Management Review, 10(5), 673-684.
doi: 10.1080/14719030802264424
Nunes, B., & Bennett, D. (2010). Green operations initiatives in the automotive industry:
an environmental reports analysis and benchmarking study. Benchmarking: An
International Journal, 17(3), 396-420.
Panwar, A., Nepal, B., Jain, R., & Yadav, O. P. (2013). Implementation of benchmarking
concepts in Indian automobile industry – an empirical study. Benchmarking: An
International Journal, 20(6), 777-804. doi: 10.1108/BIJ-03-2012-0015
Razmi, J., Zairi, M., & Jarrar, Y. F. (2000). The application of graphical techniques in
evaluating benchmarking partners. Benchmarking: An International Journal, 7(4),
304-314.
Rigby, D., & Bilodeau, B. (2013). Managemnt Tools & Trends 2013: Bain & Company.
Rigby, J., Dewick, P., Courtney, R., & Gee, S. (2013). Limits to the Implementation of
Benchmarking Through Kpis in UK Construction Policy. Public Management
Review, 1-25. doi: 10.1080/14719037.2012.757351
Schneider, J. L., Wilson, A., & Rosenbeck, J. M. (2010). Pharmaceutical companies and
sustainability: an analysis of corporate reporting. Benchmarking: An International
Journal, 17(3), 421-434.
Global survey on business improvement and benchmarking
94
Spendolini, M. (1992). The benchmarking book. New York: Amacom.
Trochim, W. M. K. (2006). Research Methods Knowledge Base. Retrieved 7-Jun, 2007,
from http://www.socialresearchmethods.net/kb/qual.php
Tyler, M. C. (2005). Benchmarking in the non-profit sector in Australia. Benchmarking:
An International Journal, 12(3), 219-235. doi: 10.1108/14635770510600348
Vermeulen, W. (2003). Benchmarking as an enabler of business excellence in the South
African financial sector. Benchmarking: An International Journal, 10(1), 65-72.
doi: 10.1108/14635770310457557
Walgenbach, P., & Hegele, C. (2001). What Can an Apple Learn from an Orange? Or:
What Do Companies Use Benchmarking For? Organization, 8(1), 121.
Watson, G. H. (1993). Strategic benchmarking : how to rate your company's performance
against the world's best. New York: J. Wiley and Sons.
Voss, C. A., Åhlström, P., & Blackmon, K. (1997). Benchmarking and operational
performance: some empirical results. Benchmarking for Quality Management &
Technology, 4(4), 273-285. doi: 10.1108/14635779710195113
Yasin, M. M. (2002). The theory and practice of benchmarking: then and now.
Benchmarking: An International Journal, 9(3).
Zeinalnezhad, M., Mokhtar, M., & Sahran, S. (2013). An Investigation of Lead
Benchmarking Implementation: A Comparison of Small/Medium Enterprises and
Large Companies. Benchmarking: An International Journal, 21(1), 7-7.
Zairi, M. (1998). Benchmarking for best practice : continuous learning through
sustainable innovation. Oxford ; Boston: Butterworth Heinemann.

Global survey on business improvement and benchmarking
95
Bibliography
Aapo, L. n., Tomas, E., Barbro, B., Hannu, V., & Ari, V. (2004). Industry-specific cycles
and companies' financial performance comparison using self-organizing maps.
Benchmarking: An International Journal, 11(3), 267-286.
Andersen, B., & Camp, R. C. (1995). Current position and future development of
benchmarking. The TQM Magazine, 7(5), 21-25.
Coulter, J., Baschung, N. S., &Bititci, U. S. (2000). Benchmarking for small- to medium-
sized enterprises. Production Planning & Control, 11(4), 400-408.
Cox, J. R. W., Mann, L., & Samson, D. (1997). Benchmarking as a mixed metaphor:
Disentangling assumptions of competition and collaboration. Journal of
Management Studies, 34(2), 285-314.
Dattakumar, R., & Jagadeesh, R. (2003). A review of literature on benchmarking.
Benchmarking: An International Journal, 10(3), 176-209.
Davies, A. J., &Kochhar, A. K. (1999). Why British companies don’t do effective
benchmarking. Integrated Manufacturing Systems, 10(1), 26-32.
Dedhia, N. S. (2001). Global perspectives on quality. Total Quality Management, 12(6),
657-668.
Denkena, B., Apitz, R., &Liedtke, C. (2006). Knowledge-based benchmarking of
production performance. Benchmarking: An International Journal, 13(1/2), 190-
199.
Dorsch, J. J., &Yasin, M. M. (1998). A framework for benchmarking in the public sector.
International Journal of Public Sector Management, 11(2/3), 92-115.
Fine, T., & Snyder, L. (1999). What is the difference between performance measurement
and benchmarking? Public Management (00333611), 81(1), 24.
Global survey on business improvement and benchmarking
96
Friedman, T. L., & Wyman, O. (2006). The world is flat: a brief history of the twenty-first
century [sound recording :]. New York: Audio Renaissance,.
Hougaard, J. L., &Tvede, M. (2002). Z Benchmark selection: An axiomatic approach.
European Journal of Operational Research, 137(1), 218-228.
Jarrar, Y. F., &Zairi, M. (2000). Best practice transfer for future competitiveness: a study
of best practices. Total Quality Management, 11(4), 734-740.
Koh, S. C. L., & Simpson, M. (2007). Could enterprise resource planning create a
competitive advantage for small businesses? Benchmarking: An International
Journal, 14(1), 59-76.
Kouzmin, A., Löffler, E., Klages, H., &Korac-Kakabadse, N. (1999). Z Benchmarking and
performance measurement in public sectors. International Journal of Public
Sector Management, 12(2), 121.
Kumar, S., & Chandra, C. (2001). Enhancing the effectiveness of benchmarking in
manufacturing organizations. Industrial Management & Data Systems, 101(1-2),
80-89.
Laura, M. M. R., & Cabral, J. A. S. (2006). Z A benchmarking methodology for
metalcasting industry. Benchmarking: An International Journal, 13(1/2), 23-35.
Li, H., & Cheng, E. W. L. (2001). Co-operative benchmarking: a tool for partnering
excellence in construction. International Journal of Project Management, 19(3),
171.
Love, P. E. D., Irani, Z., & Edwards, D. J. (2004). Industry-centric benchmarking of
information technology benefits, costs and risks for small-to-medium sized
enterprises in construction. Automation in Construction, 13(4), 507-524.
Mann, R., & Grigg, N. (2004). Helping the Kiwi to Fly: Creating World-Class
Organizations in New Zealand Through a Benchmarking Initiative. Total Quality
Management, July-August 15(5-6), 707-718.
Global survey on business improvement and benchmarking
97
Najeh, R. I., & Kara-Zaitri, C. (2007). A comparative study of critical quality factors in
Malaysia, Palestine, Saudi Arabia, Kuwait and Libya. Total Quality Management
& Business Excellence, 18(1-2), 189-199.
Prasnikar, J., Debeljak, Z., &Ahcan, A. (2005). Benchmarking as a tool of strategic
management. Total Quality Management, 16(2), 257-275.
Razmi, J., Zairi, M., &Jarrar, Y. F. (2000). The application of graphical techniques in
evaluating benchmarking partners. Benchmarking: An International Journal, 7(4),
304-314.
Taylor, W. A., & Wright, G. H. (2006). The contribution of measurement and information
infrastructure to TQM success. Omega, 34(4), 372-384.
Walgenbach, P., &Hegele, C. (2001). What Can an Apple Learn from an Orange? Or:
What Do Companies Use Benchmarking For? Organization, 8(1), 121.
Watson, G. H. (1994). A perspective on Benchmarking. Benchmarking for Quality
Management & Technology, 1(1), 5-10.
Welch, S., & Mann, R. (2001). The development of a benchmarking and performance
improvement resource. Benchmarking: An International Journal, 8(5), 431-452.
Wireman, T. (2004). Benchmarking or performance measurement: Which is right for your
plant? Plant Engineering, 58(5), 54-56.
Zairi, M. (1996). What’s in the basket? A survey on integrated management through BPR
and TQM’ (Vol. 8, pp. 58–65): MCB UP Ltd.
Zairi, M. (1999). Effective TQM implementation through supplier partnerships: A
benchmarking study of advanced manufacturing technology systems.
International Journal of Industrial Engineering-Theory Applications and Practice,
6(3), 254-264.
Zairi, M., & Ahmed, P. K. (1999). Benchmarking maturity as we approach the millennium?
Total Quality Management, 10(4-5), S810-S816.

Global survey on business improvement and benchmarking
98
Zairi, M., & Al-Mashari, M. (2005). The role of benchmarking in best practice
management and knowledge sharing. Journal of Computer Information Systems,
45(4), 14-31.
Zairi, M., & Youssef, M. (1995). A review of key publications on benchmarking: Part I
(Vol. 2, pp. 65-72).
Zairi, M., & Youssef, M. A. (1996). A review of key publications on benchmarking: part II.
Benchmarking an International Journal, 3(1), 45-49.
Zhao, X., Maheshwari, S. K., & Zhang, J. Benchmarking quality practices in India, China
and Mexico (Vol. 2, pp. 3).

Global survey on business improvement and benchmarking
99
Appendix-I: Benchmarking Definitions
Benchmarking definitions, it is worth to note that all of these definitions are
derived from Camp's definition. Therefore, the core concept remains the same in
all of them.
- (GBN, 2010) “Best Practice Benchmarking describes the comparison of
performance data obtained by studying similar processes or activities and
identifying, adapting, as well as implementing the practices that revealed
the best performance results.”
- (Razmi, Zairi, & Jarrar, 2000) “a continuous process of evaluation of
production process, products, and services with reference to those of the
strongest competitors, known as best practice.”
- American Productivity & Quality Center APQC cited in (Jarrar & Zairi,
2001) “the process of improving performance by continuously identifying,
understanding (studying and analyzing), and adapting outstanding
practices and process found inside and outside the organization and
implementing the results”
- (Fong, Cheng, & Ho, 1998) "a systematic and continuous measurement
process; a process of continuously measuring and comparing an
organization’s business process against business leaders anywhere in the
world to gain information which will help the organization to take action to
improve its performance"

Global survey on business improvement and benchmarking
100
Appendix-II: Global Benchmarking Network (GBN) members
Australia Benchmarking Partnerships
Bahrain Bahrain Quality Society
Canada Organizational Excellence Specialists
China Bejing Research Center for Science of Science
Productivity Centre of Jiangsu Province (JSPC)
Germany Informationszentrum Benchmarking
Lexta Consultants Group
Hungary Hungarian Quality Development Centre (HQDC)
India India Benchmarking Centre – IBC
Iran Intelligent Persian Corporations (IPC)
Ireland Excellence Ireland
Kuwait Gulf Lead Consultants
Malaysia Malaysia Productivity Corporation (MPC)
SDI Centre
New Zealand Centre for Organisational Excellence, Research (COER)
Oman Ideas Management Consuliting
Pakistan Mirza Associates Engineering Services
Saudi Arabia TeamOne Consulting
Singapore SPRING Singapore
Sweden Swedish Institute for Quality (SIQ)
Switzerland TECTEM Benchmarking Center, University of St. Gallen
UAE
Abu Dhabi International Centre for Organisational Excellence
Dubai Quality Group

Global survey on business improvement and benchmarking
101
Ethos Integrated Solutions LLc
U.K. BCS Management Services
Winning Moves Ltd.
USA Best Practice Institute
Global Leadership and Benchmarking Associates

Global survey on business improvement and benchmarking
102

Global survey on business improvement and benchmarking
103
Appendix-III: Questionnaire

Global survey on business improvement and benchmarking
104

Global survey on business improvement and benchmarking
105
Global survey on business improvement and benchmarking
In today’s world of fierce competition customers continually demand higher quality at
lower prices and in shorter time. To meet this demand organisations have adopted
different tools, techniques and strategies in order to improve their operational
performance and strategic position.
We are conducting a research to identify the current status of business improvement tool
use worldwide. To establish a clear view of the use of business improvement tools we
encourage you or a representative from your organisation to complete this survey. It will
take between 10 to 45 minutes of your time dependent on your use of benchmarking.
Those that do not use benchmarking only complete Sections 1 and 2 of the survey –
this will only take 10 minutes of your time.
The person completing the survey should have a good understanding of the business
improvement tools being used within your organisation.
Thank you for your participation.

Global survey on business improvement and benchmarking
106
This survey consists of seven sections and a glossary of terms (at the end of the survey):
For all to complete:
1. Organisation Profile
2. Use of Improvement Techniques
For only those using benchmarking to complete:
3. General Questions on Benchmarking
For only those undertaking benchmarking projects to complete:
4. Best Practice Benchmarking Projects - Planning
5. Best Practice Benchmarking Projects - Research and Analysis
6. Best Practice Benchmarking Projects - Implementation
7. Best Practice Benchmarking Projects - Evaluation
All the data collected from this survey will remain confidential and anonymous.
Published work will only show aggregated data across all organisations surveyed.
Please provide your contact details:
Name:
Position:
Organisation:
Address:
Country:
Telephone:
Email address must be provided to receive a copy of the results of this study
IMPORTANT
Can we share your contact details with the Global Benchmarking Network
representative in your country?

Global survey on business improvement and benchmarking
107
Yes (This will enable you to keep up-to-date with activities happening in your
country)
No

Global survey on business improvement and benchmarking
108
1: ORGANISATION PROFILE
(Answer the questions below on behalf of the organisation’s site or business unit you work
in. We define a ‘site or business unit’ as each company, plant, or division of an organisation
that is financially and operationally autonomous or independent).
1.1 Please provide the following data in your last financial year.
Number of employees: ___________________________________
Revenue in US Dollar: ___________________________________
1.2 What is your organisation’s major business activity? (Tick the one that
applies)
Agriculture, Forestry and Fishing Communication Services
Mining Finance and Insurance
Manufacturing Property and Business Services
Electricity, Gas and Water Supply Government Administration and Defence
Construction Education
Wholesale Trade Health and Community Services
Retail Trade Cultural and Recreational Services
Accommodation, Cafes and Restaurants Personal and Other Services
Transport and Storage Other (specify below)
Other:
1.3 Within which sector does your organisation operate? (Tick the one that
applies)
Public Sector
Private Sector
Not for Profit or Community

Global survey on business improvement and benchmarking
109
1.4 For how many years has your organisation been operating?
5 years and less
6 to 10 year
11 to 15 years
16 to 20 years
More than 20

Global survey on business improvement and benchmarking
110
2: USE OF IMPROVEMENT TECHNIQUES
2.1 Improvement techniques implemented in your organisation. (Please tick those that are applicable)
1: Improvement Technique
2: Level of awareness
Rate your understanding of this
technique as
3: Currently, is this
technique used in
your organisation?
Yes No
4: How effective
has this technique
been in improving
performance in
your organisation?
(Only answer if you’ve ticked
a 'yes' in column 3)
5: Do you expect
to use this
technique in the
next 3 years?
Yes No Z
ero
Min
or
Mo
der
ate
Hig
h
Do
n’t
Kn
ow
No
eff
ect
Min
or
Mo
der
ate
Maj
or
Informal
Benchmarking
Actively encouraging employees to learn from the
experience and expertise of other colleagues and
organisations through comparing practices and
processes e.g. through best practice tours,
conferences, best practice websites, networking
Performance
Benchmarking
Comparing performance levels of a
process/activity with other organisations –
therefore comparing against benchmarks

Global survey on business improvement and benchmarking
111
1: Improvement Technique
2: Level of awareness
Rate your understanding of this
technique as
3: Currently, is this
technique used in
your organisation?
Yes No
4: How effective
has this technique
been in improving
performance in
your organisation?
(Only answer if you’ve ticked
a 'yes' in column 3)
5: Do you expect
to use this
technique in the
next 3 years?
Yes No
Zer
o
Min
or
Mo
der
ate
Hig
h
Do
n’t
Kn
ow
No
eff
ect
Min
or
Mo
der
ate
Maj
or
Best Practice
Benchmarking
Following a structured process for comparing
performance levels and learning why better
performers have higher levels of performance and
adapting/implementing those better practices
Balanced Scorecard
Used for measuring whether the activities of a
company are meeting its objectives in terms of
vision and strategy by focusing on a balanced set
of outcomes
Business Excellence Such as EFQM, Baldrige, or any other national
excellence model
Business Process
Re-engineering
(BPR)
Involves significant changes in the design and
production of an organisation`s products/services
by focusing on processes rather than traditional
functions

Global survey on business improvement and benchmarking
112
1: Improvement Technique
2: Level of awareness
Rate your understanding of this
technique as
3: Currently, is this
technique used in
your organisation?
Yes No
4: How effective
has this technique
been in improving
performance in
your organisation?
(Only answer if you’ve ticked
a 'yes' in column 3)
5: Do you expect
to use this
technique in the
next 3 years?
Yes No
Zer
o
Min
or
Mo
der
ate
Hig
h
Do
n’t
Kn
ow
No
eff
ect
Min
or
Mo
der
ate
Maj
or
Corporate Social
Responsibility
System
System designed to measure, apply, assess, and
report organisational efforts to integrate CSR,
particularly environmental and social concerns,
into all operations
Customer (Client)
Surveys Surveys to obtain customer feedback
Employee
Suggestion Scheme
A formal mechanism by which employees can
offer their ideas
Improvement
Teams
A team established to address a specific
improvement issue

Global survey on business improvement and benchmarking
113
1: Improvement Technique
2: Level of awareness
Rate your understanding of this
technique as
3: Currently, is this
technique used in
your organisation?
Yes No
4: How effective
has this technique
been in improving
performance in
your organisation?
(Only answer if you’ve ticked
a 'yes' in column 3)
5: Do you expect
to use this
technique in the
next 3 years?
Yes No
Zer
o
Min
or
Mo
der
ate
Hig
h
Do
n’t
Kn
ow
No
eff
ect
Min
or
Mo
der
ate
Maj
or
Knowledge
Management
A range of practices used by organisations to
identify, create, represent, and distribute
knowledge
Lean
A process of improvement that focuses on
practices aimed at reducing inventory levels and
waste from the organisation’s key processes
Mission and Vision
Statement
Brief statements of the purpose and vision of an
organisation, with the intention of keeping
employees aware of the organisation's direction
Plan-Do-Check-Act
(PDCA) A four step process for continuous improvement
Quality Function
Deployment (QFD)
A structured team approach in which customer
requirements are translated into appropriate
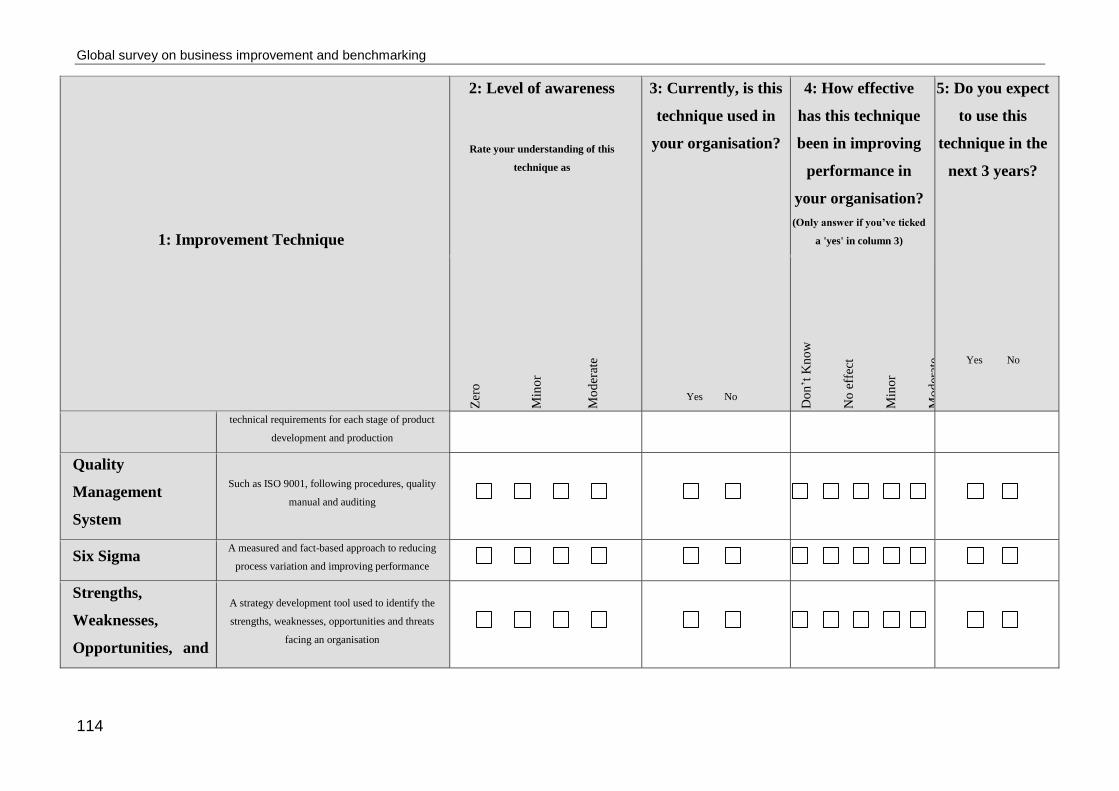
Global survey on business improvement and benchmarking
114
1: Improvement Technique
2: Level of awareness
Rate your understanding of this
technique as
3: Currently, is this
technique used in
your organisation?
Yes No
4: How effective
has this technique
been in improving
performance in
your organisation?
(Only answer if you’ve ticked
a 'yes' in column 3)
5: Do you expect
to use this
technique in the
next 3 years?
Yes No
Zer
o
Min
or
Mo
der
ate
Hig
h
Do
n’t
Kn
ow
No
eff
ect
Min
or
Mo
der
ate
Maj
or
technical requirements for each stage of product
development and production
Quality
Management
System
Such as ISO 9001, following procedures, quality
manual and auditing
Six Sigma A measured and fact-based approach to reducing
process variation and improving performance
Strengths,
Weaknesses,
Opportunities, and
A strategy development tool used to identify the
strengths, weaknesses, opportunities and threats
facing an organisation
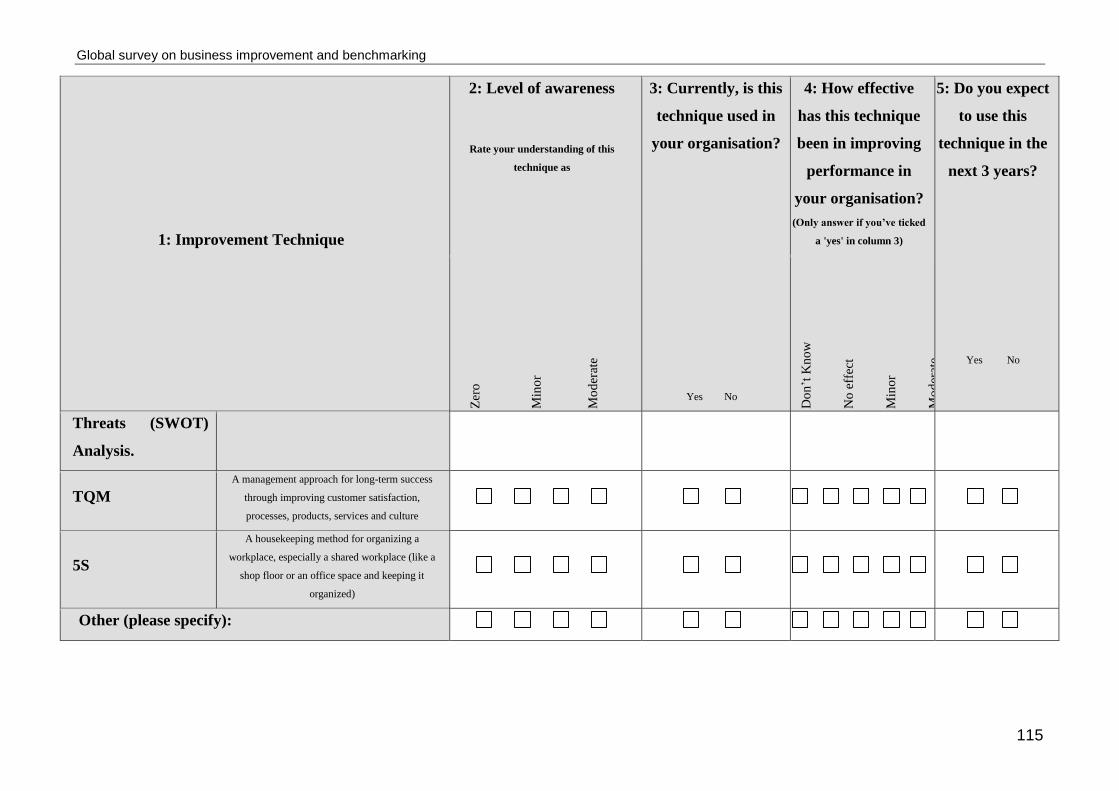
Global survey on business improvement and benchmarking
115
1: Improvement Technique
2: Level of awareness
Rate your understanding of this
technique as
3: Currently, is this
technique used in
your organisation?
Yes No
4: How effective
has this technique
been in improving
performance in
your organisation?
(Only answer if you’ve ticked
a 'yes' in column 3)
5: Do you expect
to use this
technique in the
next 3 years?
Yes No
Zer
o
Min
or
Mo
der
ate
Hig
h
Do
n’t
Kn
ow
No
eff
ect
Min
or
Mo
der
ate
Maj
or
Threats (SWOT)
Analysis.
TQM A management approach for long-term success
through improving customer satisfaction,
processes, products, services and culture
5S
A housekeeping method for organizing a
workplace, especially a shared workplace (like a
shop floor or an office space and keeping it
organized)
Other (please specify):

Global survey on business improvement and benchmarking
116
If you indicated in question 2.1 that your organisation does not use performance or
best practice benchmarking please complete the question below and return the
survey.
THANK YOU.
For all others, please go to Section 3.
2.2 What are the main reasons for not using performance benchmarking or best
practice benchmarking within your organisation? (Indicate up to three only
and rank them from 1 to 3 with “1” indicating the most important)
No clear benefit from benchmarking
Lack of understanding of benchmarking
Lack of technical knowledge in planning benchmarking projects
Lack of resources
Lack of benchmarking partners
Lack of authority
Fear of sharing information
High cost (cost more than benefit)
Long time frame to complete the project
Lack of top management commitment
Other, ___________________________________________
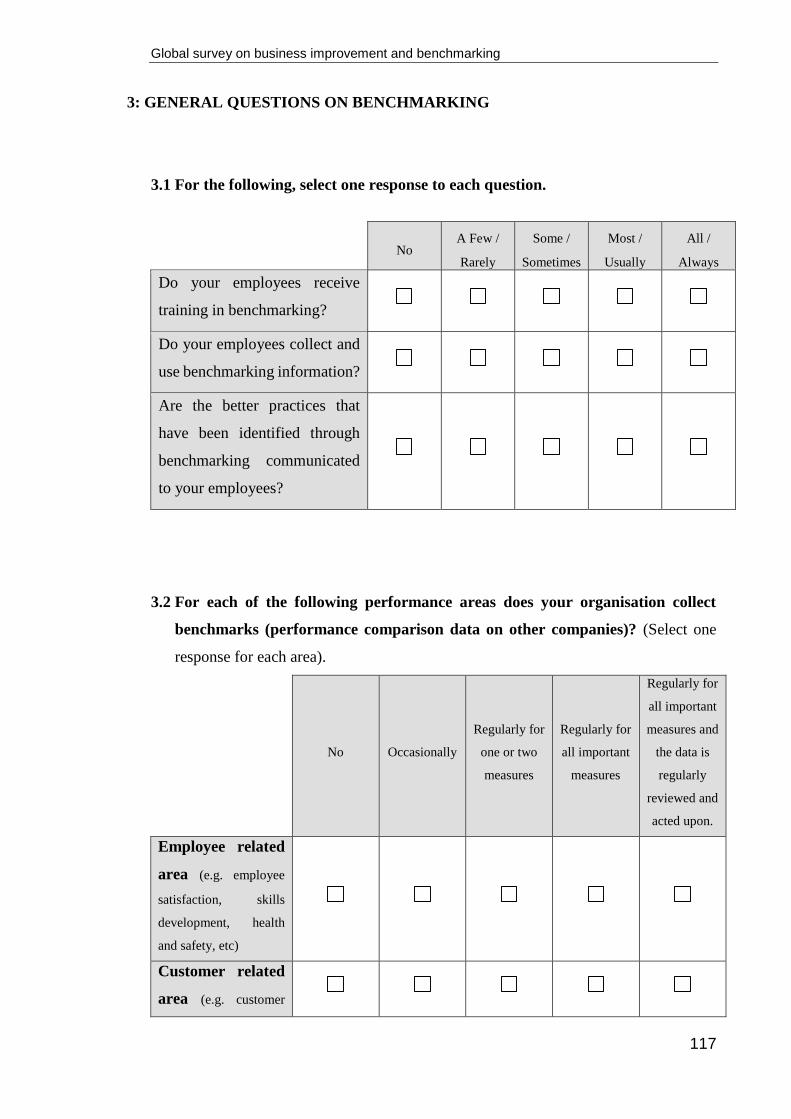
Global survey on business improvement and benchmarking
117
3: GENERAL QUESTIONS ON BENCHMARKING
3.1 For the following, select one response to each question.
No
A Few /
Rarely
Some /
Sometimes
Most /
Usually
All /
Always
Do your employees receive
training in benchmarking?
Do your employees collect and
use benchmarking information?
Are the better practices that
have been identified through
benchmarking communicated
to your employees?
3.2 For each of the following performance areas does your organisation collect
benchmarks (performance comparison data on other companies)? (Select one
response for each area).
No Occasionally
Regularly for
one or two
measures
Regularly for
all important
measures
Regularly for
all important
measures and
the data is
regularly
reviewed and
acted upon.
Employee related
area (e.g. employee
satisfaction, skills
development, health
and safety, etc)
Customer related
area (e.g. customer

Global survey on business improvement and benchmarking
118
satisfaction,
complaints, etc,)
Financial related
area (e.g. profits,
return on investment,
etc,)
Process related
area (e.g. resources
utilisation, delivery
time, etc,)
Product or service
area (e.g. quality,
cost)
3.3 Which of the following services in benchmarking, if supplied by a third party (an
external organisation), would your organisation potentially use? (Indicate up to
three only and rank them from 1 to 3 with “1” indicating the most important)
Support from a consultant in managing
benchmarking projects
Benchmarking training courses
Best practice workshops
Best practice database
Support in finding benchmarking partners
Online discussion forum
Supply of best practice case studies
Supply of benchmarks
Other, ________________________

Global survey on business improvement and benchmarking
119
3.4 Does your organisation currently use benchmarking services provided by a
third party?
No
Yes, (please give organisation’s name) ______________________
3.5 If there was a national or regional benchmarking award to encourage
organisations to undertake benchmarking projects would your organisation be
interested in applying or finding out more information about it?
No
Perhaps
Yes
3.6 If your organisation has a definition for benchmarking what is it?

Global survey on business improvement and benchmarking
120
If you indicated in question 2.1 that your organisation does not use best practice
benchmarking you have finished the survey.
THANK YOU and please return the survey as shown on page 1.
For all others, please go to Section 4.

Global survey on business improvement and benchmarking
121
The remaining sections of the survey should only be completed if your organisation
undertakes best practice benchmarking projects.
4: BEST PRACTICE BENCHMARKING PROJECTS - PLANNING
4.1 How many benchmarking projects do you conduct per year (typically)?
1
2-5
6-9
10-20
More than 20
4.2 What is the size of a typical benchmarking team within your organisation?
1-2 people
3-4 people
5-6 people
7-8 people
More than 8 people
4.3 Does your organisation use a particular methodology for undertaking
benchmarking projects?
No
Developed own methodology
The model/methodology is _______________________________
4.4 How long does a benchmarking project normally take? (excluding the
implementation phase - therefore excluding the implementation of best practices)
Less than 2 months
2 to less than 4 months
4 to less than 6 months
6 to less than 8 months
8 to less than 10 months
More than 10 months

Global survey on business improvement and benchmarking
122
4.5 What are the main reasons for undertaking benchmarking projects? (Indicate up
to three only and rank them from 1 to 3 with “1” indicating the most important)
To address major strategic issues
To improve the performance of our processes
To improve financial performance
To develop new products/ services
Necessary for business excellence assessments
To learn what other organisations are doing
To encourage a cultural shift to a learning culture.
Other, _______________________
4.6 In the last three years which areas of your organisation have conducted
benchmarking projects? (Please tick those that are applicable)
Administration, training and
human resources Production
Corporate strategy and planning Research and development
Customer service Public relations
Finance Sales and marketing
IT Warehouse, logistics and purchasing
Maintenance Other, _________________
4.7 Our benchmarking project teams usually consist of people from the following
areas. (Please tick those that are applicable)
Senior management Process owners
Middle management Internal suppliers
Selected employees Internal customers
Internal benchmarking expert External suppliers
External benchmarking expert External customers
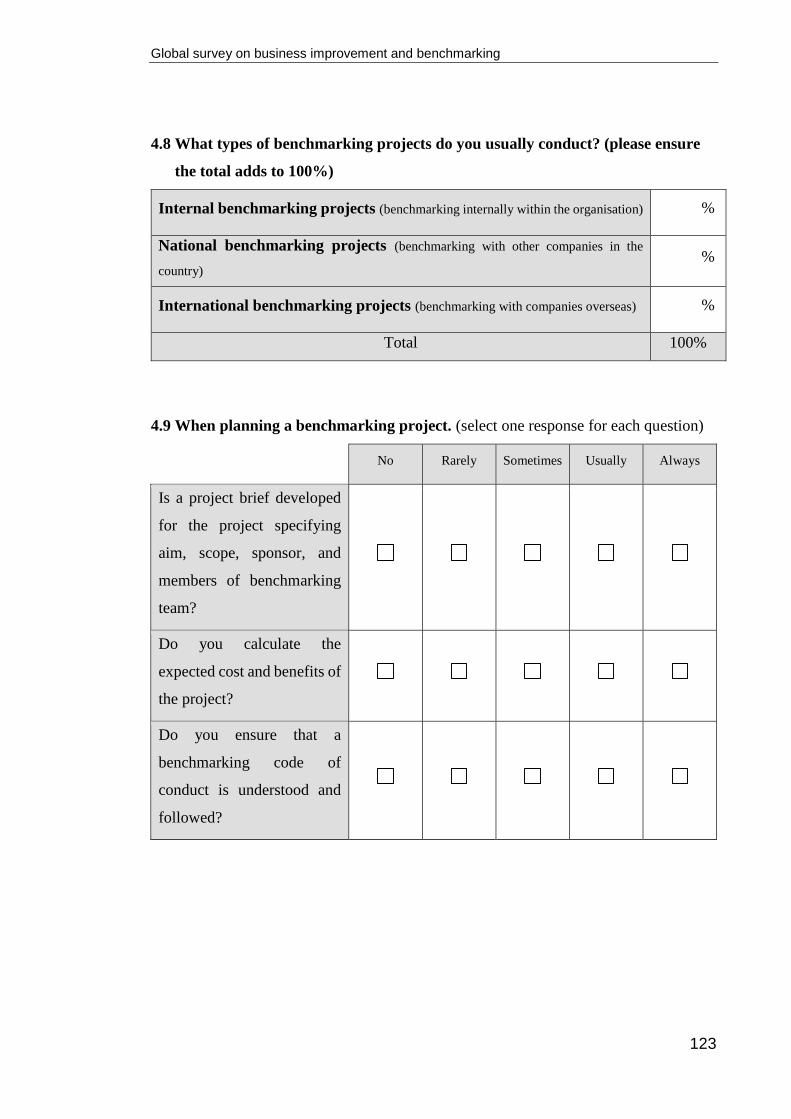
Global survey on business improvement and benchmarking
123
4.8 What types of benchmarking projects do you usually conduct? (please ensure
the total adds to 100%)
Internal benchmarking projects (benchmarking internally within the organisation) %
National benchmarking projects (benchmarking with other companies in the
country) %
International benchmarking projects (benchmarking with companies overseas) %
Total 100%
4.9 When planning a benchmarking project. (select one response for each question)
No Rarely Sometimes Usually Always
Is a project brief developed
for the project specifying
aim, scope, sponsor, and
members of benchmarking
team?
Do you calculate the
expected cost and benefits of
the project?
Do you ensure that a
benchmarking code of
conduct is understood and
followed?
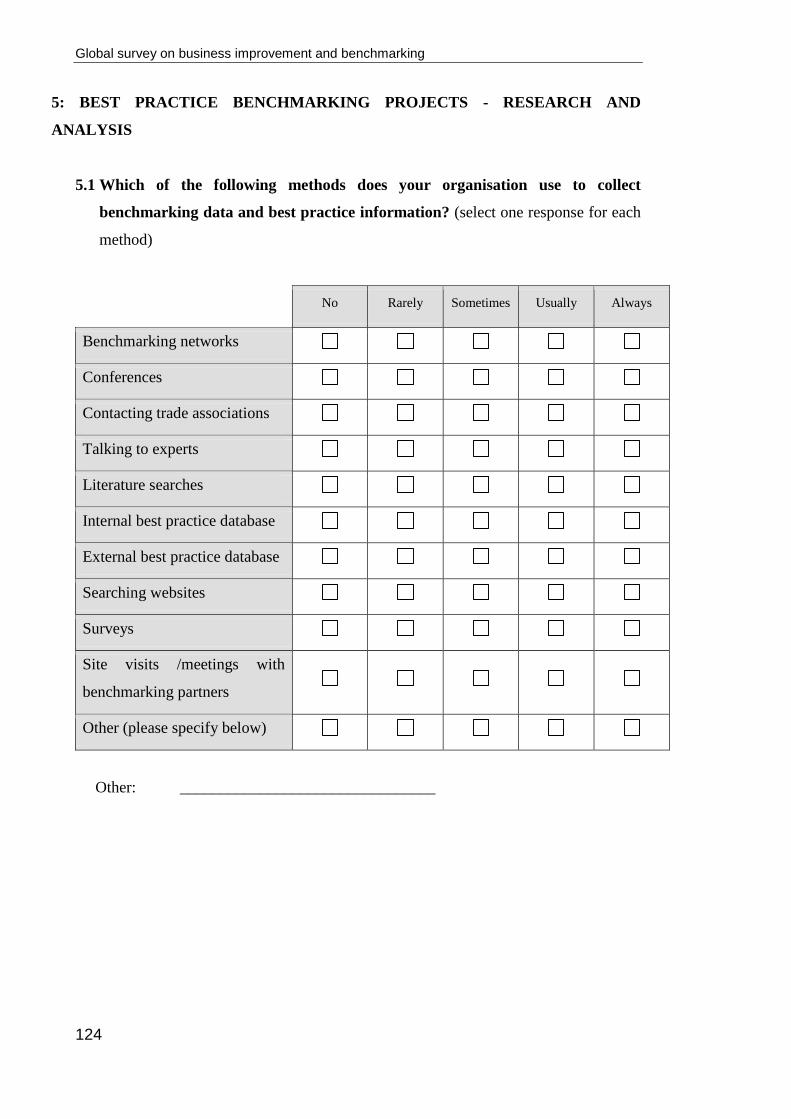
Global survey on business improvement and benchmarking
124
5: BEST PRACTICE BENCHMARKING PROJECTS - RESEARCH AND
ANALYSIS
5.1 Which of the following methods does your organisation use to collect
benchmarking data and best practice information? (select one response for each
method)
No Rarely Sometimes Usually Always
Benchmarking networks
Conferences
Contacting trade associations
Talking to experts
Literature searches
Internal best practice database
External best practice database
Searching websites
Surveys
Site visits /meetings with
benchmarking partners
Other (please specify below)
Other: ________________________________

Global survey on business improvement and benchmarking
125
6: BEST PRACTICE BENCHMARKING PROJECTS - IMPLEMENTATION
6.1 How long does the implementation phase typically take? (e.g. the adaption and
implementation of best practices identified through benchmarking)
Less than 2 months
2 to less than 4 months
4 to less than 6 months
6 to less than 8 months
8 to less than 10 months
More than 10 months
6.2 What percentage of benchmarking projects result in implementation?
1-10%
11-20%
21-40%
41-60%
61-80%
81-90%
91-100%
Don’t know

Global survey on business improvement and benchmarking
126
7: EVALUATION
7.1 At the end of a benchmarking project we. (tick one response for each statement)
No Rarely Sometimes Usually Always
Measure the improvements that
have occurred
Undertake a cost and benefit
analysis.
Evaluate how successfully we
managed the project
7.2 The outcomes (best practices and/or results achieved) from benchmarking
projects are typically communicated by: (Indicate up to three only and rank them
from 1 to 3 with “1” indicating the most important)
Presentations Meetings (informal)
Reports Memos
E-mails Newsletters
Intranet (Internal internet) Notice boards
Meetings (formal) Other: __________________
7.3 The main benefits of benchmarking projects have been: (Indicate up to three
only and rank them from 1 to 3 with “1” indicating the most important)
Major strategic issues
addressed
Assisted in business excellence
assessments
Improved performance of our
processes
Learnt what other organisations are
doing

Global survey on business improvement and benchmarking
127
Improved financial
performance
Encouraged a cultural shift to a
learning culture.
Developed new products/
services
Other: __________________
7.4 On average, what is the financial return (US$) from a typical benchmarking
project, after one year of implementation?
<US$10,000
11,000 to 50,000
51,000 to 100,000
101,000 to 150,000
250,000 to 500,000
>500,000
Don’t know
7.5 Approximately, what percentage of time is spent by your organisation on each
phase of the benchmarking process out of total time spent?
Percentage of time
spent on each phase
Planning %
Research and analysis (learning from others) %
Implementation %
Evaluation %
Total 100%

Global survey on business improvement and benchmarking
128
7.6 According to your experience, how do the following factors contribute to the
success of a benchmarking project?
Ver
y H
igh
Hig
h
Med
ium
Lo
w
Ver
y L
ow
Support of top management
Resource allocated to benchmarking
Understanding of benchmarking
Composition of the benchmarking team
Access to external/consultancy support for
facilitating benchmarking projects
Clear project objectives
Linking of project objectives to strategic
objectives
Understanding of own processes
Obtaining reliable comparison data
Research skills for conducting surveys and site
visits
Skills in process analysis
Ability to find benchmarking partners
Readiness of organisation to implement project
findings
Learning from the success and failures of each
benchmarking project
Project management skills
Other
________________________________

Global survey on business improvement and benchmarking
129
Thank you for completing the survey!
Details on how to return the survey are on the front page.

Global survey on business improvement and benchmarking
130
GLOSSARY OF BENCHMARKING TERMS
Benchmark
A measured, "best-in class” achievement; a reference or measurement standard for
comparison; this performance recognized as the standard of excellence for a specific
business process.
Best practice
There is no single "best practice" because best is not best for everyone. Every organization
is different in some way, different missions, cultures, environments, and technologies.
What is meant by "best" are those practices that have been shown to produce superior
results; selected by a systematic process; and judged as exemplary, good, or successfully
demonstrated. Best practices are then adapted to fit a particular organisation.
Best Practice Benchmarking
Following a structured process for comparing performance levels and learning why better
performers have higher levels of performance and adapting/implementing those better
practices
Code of conduct
A behavioural convention that describes the protocol of behaviours – the set of
conventions prescribing correct etiquette and procedures to be used in benchmarking.
Informal Benchmarking
Actively encouraging employees to learn from the experience and expertise of other
colleagues and organisations through comparing practices and processes e.g. through best
practice tours, conferences, best practice websites, networking)
Benchmarking Partners
Benchmarking Partners are the comparative companies considered in the Benchmarking
project, who are willing to exchange information openly and thus to enter a mutual
learning process.

Global survey on business improvement and benchmarking
131
Performance Benchmarking
Comparing performance levels of a process/activity with other organisations – therefore
comparing against benchmarks.