the characteristics and quality of service sector jobs - oecd · the characteristics and quality of...
TRANSCRIPT

© OECD 2001
Chapter 3
THE CHARACTERISTICS AND QUALITYOF SERVICE SECTOR JOBS
The share of employment in services continued to rise in virtually all OECD countries over the 1990s, approachingnearly three-quarters of all jobs in several countries. This has coincided with significant change in the types of jobsbeing created. In several countries, the incidence of part-time and temporary work rose and, in some, there was a declinein job stability. A few countries also experienced a long-run rise in earnings inequality. These developments have led toa vigorous debate about the quality of service sector jobs. Therefore, this chapter explores the relationship betweenchanges in employment by sector and changes in the characteristics and quality of the jobs that are being created.
Jobs vary considerably across sectors when compared in terms of the incidence of part-time and temporary workarrangements, average length of job tenure, and the incidence of training. But there is also a striking variation in these jobcharacteristics across countries and over time. The fact that differences in employment structures account for relatively littleof this variation suggests that other factors play an important role. These factors include various institutional settings suchas the strength of employment protection legislation, the degree of collective bargaining coverage, the existence of statutorywage floors, etc., as well as the distribution of worker characteristics within each country by age, gender and skill level.
Comparisons of job quality based on measures of working conditions, job satisfaction and pay, reveal no simpledichotomy between the goods-producing sector and the service sector. Good jobs are not primarily located in the formerand bad jobs in the latter. Jobs in hotels and restaurants generally rank poorly across a range of job quality measures. Onthe other hand, jobs in the goods-producing sector are more likely to be associated with poor working conditions than inmany service industries and with lower levels of job satisfaction.
A number of key findings emerge from the analysis of employment levels and growth by wage level. First, thehigher overall employment rate in the United States than in most other OECD countries cannot be solely attributed to a“surplus” of low-paying service jobs; in most instances, it has more high-paying service jobs as well. Second, whilestrong growth in service sector employment in the United States over the 1990s was accompanied by some growth inlow-paid jobs, a much larger expansion took place in jobs in relatively high-paying occupations and industries. Third,Europe experienced slower growth in employment at all wage levels, but with considerable variation across countries.As in the United States, employment grew fastest in high-paying jobs in most European countries.
The configuration of policies that will be appropriate for each country in terms of addressing issues of job qualitywill depend on its initial situation. Countries with a relatively high incidence of jobs involving low pay and poorworking conditions can provide income supplements for low-paid workers and can seek to reduce differences inentitlements between workers in “standard” and “non-standard” jobs. Ultimately policies are required which encourageindividuals and firms to invest more in skills acquisition. On the other hand, for countries wishing to improve theiremployment performance, the solution is not simply to stimulate job creation in poorly-paid service sector jobs but toimplement a broad range of policies designed to stimulate employment more generally.
Summary
90 – OECD Employment Outlook
Introduction
As documented in last year’s chapter on the serviceeconomy [OECD (2000)], the share of employment inservices continued to rise in virtually all OECD countriesover the 1990s, approaching nearly three-quarters of alljobs in several countries. This has coincided with a num-ber of significant changes in the types of jobs that arebeing created which has led to a vigorous debate aboutthe quality of service sector jobs. In many countries, theincidence of part-time and temporary work has risen overtime [OECD (1996, 1999)] and, in some, there has been adecline in job stability [OECD (1997)]. A few countries havealso experienced a long-run rise in earnings inequality, mostnotably in the United States [OECD (1996)].
Last year’s chapter on services also included a sec-toral analysis of the characteristics of workers by age, gen-der and educational attainment. This chapter is mainlyconcerned with the characteristics of jobs as such, and howthey have been affected by the shift in employment frommanufacturing to services. Of course, both job and workercharacteristics are intimately related. In fact, perceptionsabout job quality are likely to be strongly influenced byhow well workers are matched with their job. That is, onthe extent to which a job’s skill requirements, workingarrangements, pay and hours of work correspond to the job-holder’s own skills, preferences and expectations. Thus, thesame job may be considered bad by one worker but goodby another worker. This interrelationship between the char-acteristics of workers and the characteristics of their jobsmeans that any measure of job quality needs to be inter-preted with caution before a job can be classified as beingeither “bad” or “good”. For example, a part-time job mayinvolve either a voluntary or involuntary choice and soin-and-of itself is neither a good nor a bad job.
Given these difficulties in measuring job quality, themain purpose of this chapter is not simply to identify poorjobs as such, and where they are found, but to exploremore generally the relationship between changes in thedistribution of employment by sector and changes in thetypes of jobs that are being created. There are a number ofquestions that the chapter seeks to answer. Are there sys-tematic differences in the types of characteristics that areassociated with jobs in each sector? How has the growthof service sector employment contributed to differencesover time and across countries in the characteristics andquality of jobs? Is there a trade-off between job qualityand employment performance?
As a starting point, the first section surveys the cur-rent structure of goods-producing and service sector jobsaccording to a number of objective job characteristics,including the incidence of part-time and temporary work,
average job tenure and the incidence of training. It thenexamines the extent to which differences in these jobcharacteristics between countries and over time can beexplained by variations in the distribution of employmentby sector. As discussed in the section, there are a numberof potential problems in using these job characteristics asproxy measures of job quality. Therefore, job quality ismeasured more directly in Section II based on the percep-tions of jobholders themselves of their working condi-tions and job satisfaction. Using these measures, thequality of jobs is compared between sectors, but withincountries. A complementary and perhaps broader way ofmeasuring job quality is to simply look at how much a jobpays. Section III first examines earnings differentials bysector. This is followed by a comparison across countriesof employment levels and job growth in terms of whetherjobs are low-paid, medium-paid or high-paid. The finalsection draws together the main results and considerssome implications for policy.
Main findingsThe chapter’s main findings are:
● The incidence of part-time work is substantiallyhigher in the service sector than in the goods-producing sector, but the incidence of temporarywork is more uniform across both sectors. Averagejob tenure varies considerably within the servicesector, but on the whole is somewhat lower than inthe goods-producing sector. The incidence of con-tinuing vocational training, on the other hand, ishigher in the service sector, especially in theproducer and social service sectors.
● Differences in employment structure appear toaccount for only a small part of the large variationacross countries and over time in the overall inci-dence of part-time and temporary work and in aver-age job tenure. Other factors, such as institutionalsettings and workforce characteristics, would appearto be more important in accounting for this variation.
● Comparisons of job quality based on measures ofworking conditions, job satisfaction and pay, revealno simple dichotomy between the goods-producingsector and the service sector. Each has both goodand bad jobs and the ranking of sectors, both at thebroad sectoral level and at a more detailed level,varies according to which measure of job quality isused. Within the service sector, however, some jobsin the personal services sector are consistently ofpoorer quality than jobs in either the goods-producing sector or the rest of the service sector. On

The Characteristics and Quality of Service Sector Jobs – 91
© OECD 2001
the other hand, agricultural and construction jobsoften have poorer working conditions as well.
● The United States has a higher overall employmentrate than in many other OECD countries not justbecause it has a higher proportion of its working-age population employed in poorly-paid service sec-tor jobs. It also has a higher proportion employed inservice jobs that are well paid on average.
● Job growth in most countries over the 1990s,including the United States, took place principallyin high-paying service sector jobs rather than low-paying ones. However, despite strong growth insome countries, Europe as a whole experiencedslower employment growth than the United States atall wage levels.
● The implications for policy will depend on the ini-tial situation of countries. Countries with a highincidence of poor quality jobs need ultimately tofocus on measures to improve education and train-ing. In other countries, where there is more of a con-cern to improve employment performance thesolution is not simply to increase the provision oflow-wage service jobs, but to lower barriers to jobcreation more generally.
I. Part-time work, temporary work, job tenure and training
A. Sectoral classification
The analysis in this section uses the same sectoralclassification as was used in last year’s chapter on ser-vices [OECD (2000)]. Nine broad sectors are identifiedcomprising 21 sub-sectors. The correspondence betweenthese sectors and the ISIC rev. 3 and NACE rev. 1 codesis shown in Table 3.A.1. This classification was also usedfor the analysis of earnings differentials by sector inSection II. However, due to data constraints, it was notpossible to use this same classification uniformlythroughout the chapter. Therefore, for the analysis ofworking conditions, job satisfaction and employment bywage levels in Sections II and III, the sectoral breakdownis based primarily on industries at the one-digit levelaccording to ISIC rev. 3.
B. Incidence of part-time and temporary work
The rise in the number of “atypical” or “non-standard” jobs, such as part-time and temporary jobs, hasbeen of particular concern for several commentators whohave seen this trend as a sign of a decline in job quality[e.g. Letourneux (1998); Mishel et al. (2001)]. But, as
pointed out in OECD (1999), it is not always clear thatpart-time jobs are necessarily inferior to full-time jobs.Only a minority of all part-time workers appears to beworking part-time involuntarily, and, while part-timeworkers earn less on average than full-time workers inmost countries, this can be partly accounted for by loweraverage skill levels or non-pecuniary advantages. In thecase of temporary jobs, they may serve as a useful entrypoint into more permanent work for younger and less-skilled workers. Nevertheless, some part-time and tempo-rary jobs are particularly badly paid and involve poorworking conditions with limited career prospects.1 So it isof interest to see whether these types of working arrange-ments tend to be concentrated in the same sectors in dif-ferent countries and whether they are particularlyprevalent in the service sectors.
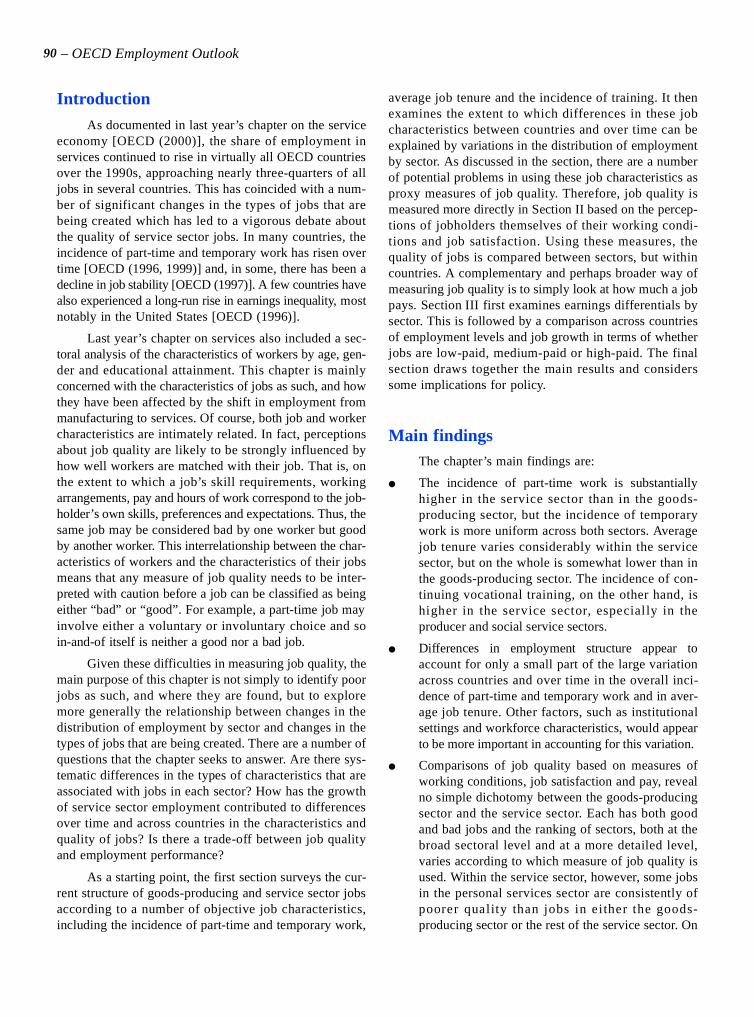
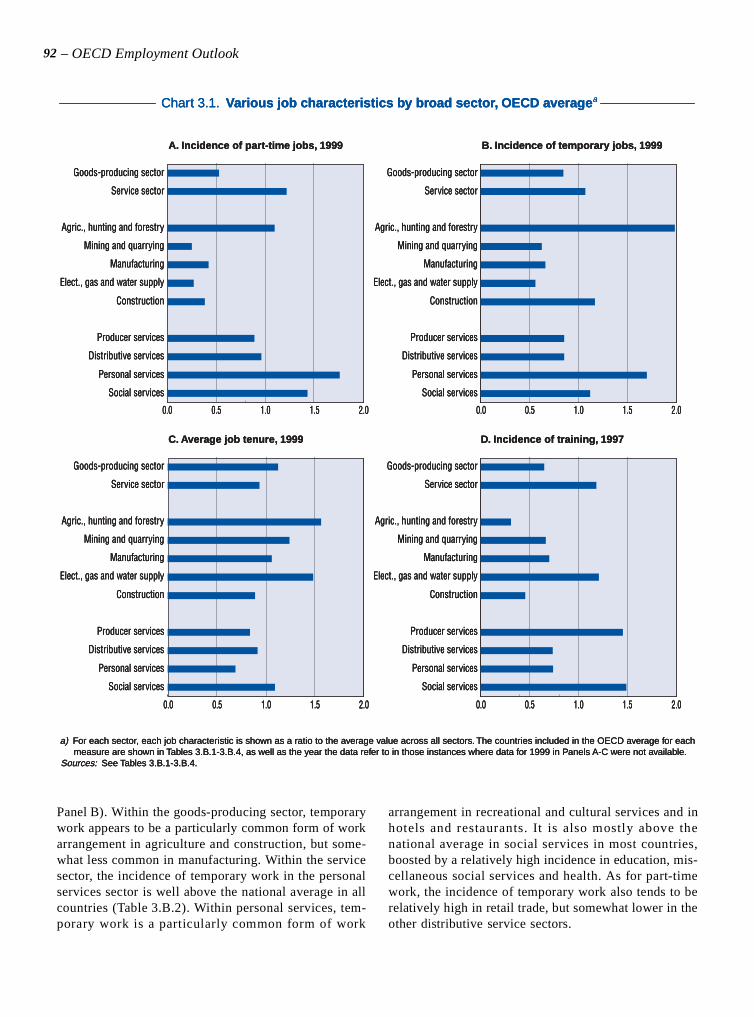
On average across OECD countries, part-timework is a much more common form of working arrange-ment in the service sector than in the goods-producingsector (Chart 3.1, Panel A).2 This pattern is observed inall countries, except Korea, although the gap betweenthe two sectors varies considerably from country tocountry (Table 3.B.1). In general, the incidence of part-time work is highest in personal services followed bysocial services. In several countries, part-time workaccounted for more than one-third of all jobs in personalservices in 1999 (and just over one-half in the Nether-lands). At a more detailed level, part-time work in mostcountries tends to be most common in domestic servicesfollowed by education, recreation and cultural services,hotels and restaurants, other personal services and healthservices. The incidence of part-time work also tends tobe relatively high in retail trade but this is offset withinthe distributive services by lower rates in wholesaletrade and in transport and communication. Within thegood-producing sector, part-time work is only relativelycommon in the agricultural sector.
How well do these sectoral differences in the inci-dence of part-time work correlate with the rate of invol-untary part-time work in each sector? Data for theUnited States indicate that if anything the correlationmay be negative rather than positive [Meisenheimer II(1998)]. For example, the rate of involuntary part-timework (i.e. as a proportion of all part-time employment ineach sector) was 34% in manufacturing but only around17% in the service sector as a whole. Thus, a higherincidence of part-time employment in one sector thananother may not necessarily indicate that the proportionof all workers in that sector who are working part-timeinvoluntarily is also higher.
Temporary jobs are more evenly spread across boththe goods-producing and service sectors (Chart 3.1,
92 – OECD Employment Outlook
Panel B). Within the goods-producing sector, temporarywork appears to be a particularly common form of workarrangement in agriculture and construction, but some-what less common in manufacturing. Within the servicesector, the incidence of temporary work in the personalservices sector is well above the national average in allcountries (Table 3.B.2). Within personal services, tem-porary work is a particularly common form of work
arrangement in recreational and cultural services and inhotels and restaurants. It is also mostly above thenational average in social services in most countries,boosted by a relatively high incidence in education, mis-cellaneous social services and health. As for part-timework, the incidence of temporary work also tends to berelatively high in retail trade, but somewhat lower in theother distributive service sectors.
a) For each sector, each job characteristic is shown as a ratio to the average value across all sectors. The countries included in the OECD average for each measure are shown in Tables 3.B.1-3.B.4, as well as the year the data refer to in those instances where data for 1999 in Panels A-C were not available.
Sources: See Tables 3.B.1-3.B.4.
A. Incidence of part-time jobs, 1999 B. Incidence of temporary jobs, 1999
C. Average job tenure, 1999 D. Incidence of training, 1997
Chart 3.1. Various job characteristics by broad sector, OECD averagea
0.0 0.5 1.0 1.5 2.0
0.0 0.5 1.0 1.5 2.0
0.0 0.5 1.0 1.5 2.0
0.0 0.5 1.0 1.5 2.0
Social services
Personal services
Distributive services
Producer services
Construction
Elect., gas and water supply
Manufacturing
Mining and quarrying
Agric., hunting and forestry
Service sector
Goods-producing sector
Social services
Personal services
Distributive services
Producer services
Construction
Elect., gas and water supply
Manufacturing
Mining and quarrying
Agric., hunting and forestry
Service sector
Goods-producing sector
Social services
Personal services
Distributive services
Producer services
Construction
Elect., gas and water supply
Manufacturing
Mining and quarrying
Agric., hunting and forestry
Service sector
Goods-producing sector
Social services
Personal services
Distributive services
Producer services
Construction
Elect., gas and water supply
Manufacturing
Mining and quarrying
Agric., hunting and forestry
Service sector
Goods-producing sector

The Characteristics and Quality of Service Sector Jobs – 93
© OECD 2001
Interpreting these differences across sectors andcountries is complicated by the fact that temporaryemployment potentially covers a range of different typesof work arrangements. In addition to employment under afixed-term contract, temporary employment can includeseasonal and casual work and working under contract fora temporary work agency. These different types ofarrangements may not all imply the same degree of pre-cariousness. Moreover, countries differ in their coverageand definitions of these arrangements.
These differences will not only affect the overall inci-dence of temporary work across countries but also its rela-tive incidence across sectors within countries. For example,around 23% of employees in Australia considered them-selves to be casual workers in 2000 but only around 4%reported that they were working under a fixed-term con-tract employment (Table 3.B.2).3 Compared with a higher-than-average incidence of casual employment in the dis-tributive and personal services sector, the incidence offixed-term employment is below average in both sectors,considerably so in the distributive service sector. The rela-tive incidence of fixed-term contracts is also considerablylower in agriculture and manufacturing than the incidenceof casual work. For France, the incidence of temporaryagency working in the first half of 1999 was only 3% com-pared with an incidence of 14% under a more inclusivemeasure of temporary employment. In contrast to the pat-tern for all forms of temporary employment, the relativeincidence of temporary agency working is substantiallylower in the service sector and much higher in thegoods-producing sector, especially in manufacturing.
C. Job tenure
Another aspect of jobs concerns job stability as cap-tured by average job tenure. This is typically measured bythe length of time workers have been in their current job orwith their current employer, and so refers to continuingspells of employment rather than to completed spells.There are a number of factors that suggest that there isprobably a positive relationship between tenure and jobquality. First, earnings tend to be positively correlated withaverage job tenure even after controlling for other factorsaffecting earnings differentials. Second, involuntary jobloss often entails a loss of earnings not only because of lostincome during a period of unemployment but also becauseearnings may be subsequently lower in a new job. There-fore, all other things equal, jobs with higher turnover willtend to be associated with greater job insecurity. But again,this indicator needs to be interpreted with caution. Not allshort-tenure jobs reflect conditions that are imposed byemployers, they can also reflect the preferences of jobhold-ers themselves and may be compensated for by higher rates
of pay. Moreover, previous OECD work found little directrelationship between job tenure and job insecurity – a risein perceptions of job insecurity had not generally beenmatched by a decline in job stability [OECD (1997)]. Itwas suggested that this might partly be because job tenureis influenced by job insecurity itself, and, that while job sta-bility may not have changed much, the consequences of jobseparation may have worsened.
Average tenure is somewhat lower in general in theservice sector than in the goods-producing sector(Chart 3.1, Panel C). This pattern holds for all countries,but with a much larger gap between the two broad sectorsoccurr ing in Greece , Austra lia and Switze rland(Table 3.B.3). Average job tenure is particularly low inpersonal services in all countries. In social services, onthe other hand, it is on par or higher in most countriesthan in manufacturing. At a more detailed level, job ten-ure tends to be highest (and higher than in manufacturing)in public administration, communications and education.It is lowest in domestic services, hotels and restaurantsand in business and professional services. Within thegood-producing sector, average tenure tends to be rela-tively low in the construction industry and relatively highin agriculture and in public utilities.4
D. Training
The incidence of continuing vocational trainingprovides a rough indicator of opportunities for careerdevelopment and advancement. In fact, this is one of thefew indicators of job quality where service jobs consis-tently come out ahead of jobs in the goods-producingsector (Chart 3.1, Panel D). On average, across thecountries shown in Table 3.B.4, the probability of aworker receiving continuing vocational training during agiven period of time is almost one-fifth higher than thenational average for workers in services and around one-third lower for workers in the goods-producing sector.Within the service sectors, the incidence of training ishighest in producer and social service sectors and lowestin the distributive and personal services sectors. Buteven for these latter two sectors, the incidence of train-ing in at least one of the sectors is higher than inmanufacturing in the majority of countries.
These results for training might at first seem some-what anomalous given the results for some of the othercharacteristics of jobs. Part-time work is much more prev-alent in the service sector than the goods-producing sec-tor, and yet there is evidence that part-time workerstypically receive less training on average than full-timeworkers [OECD (1999)]. Average job tenure is also some-what lower and job turnover higher in services than ingoods production. Given that, all other things equal, the

94 – OECD Employment Outlook
pay-off to firm-specific training will be lower for anemployer when labour turnover is relatively high, thiswould tend to lower the incidence of training in the ser-vice sector relative to the goods-producing sector. Thefact that more training occurs per employee in the servicesector than the goods-producing sectors suggests that thegap between the two sectors is probably even higher forworkers with similar characteristics.
There are a number of possible reasons for thisresult. These include the relationship between trainingand educational attainment and the sectoral impact oftechnological change. There is in general a positiveassociation between educational attainment and the inci-dence of training [OECD (1999)]. As workers in the ser-vice sector have a higher level of educational attainment,on average, than those in the goods-producing sector[OECD (2000)], this would partly explain the higherincidence of training in the service sector. A related rea-son may be the greater retraining requirements imposedby technological change on some sectors than on others.For instance, the incidence of working with computersand other forms of information technology (IT) appearsto be higher in certain service sectors (notably in theproducer service sectors and for government workers inthe social service sector) than in manufacturing.5 Thus,the IT revolution may require more frequent and wide-spread retraining to take place in these service sectorsthan in manufacturing.6
E. Accounting for country differences in job characteristics
Sectoral differences in part-time and temporarywork and in average job tenure partly reflect differencesin the average characteristics of workers in each sector.For example, part-time work is considerably more com-mon among women workers in general than among men,irrespective of the sector they each work in. Average ten-ure also tends to be lower for younger workers andwomen than for older workers and men. Therefore, it is ofsome interest to examine the extent to which job qualityand worker characteristics are correlated across sectors.
In Panel A of Table 3.1, correlation coefficients areshown between various aspects of jobs and characteristicsof workers when measured separately in each of ninebroad sectors and pooled across countries.7 Each measureof job quality (incidence of part-time and temporary workand average job tenure) is shown as a ratio of its value foreach sector divided by the national average. This is donein order to abstract from country differences in the abso-lute levels of these measures. The question being askedhere is to what extent sectoral, rather than country, varia-tions in job quality are related to sectoral differences inworker characteristics.
Not surprisingly, the incidence of part-time and tem-porary work tends to be higher in sectors that have ahigher-than-average proportion of workers that arewomen and younger workers. The incidence of part-time
1. 1
a) ** and * mean statistically significant at 1 % and 5 % levels respectively.b) Gender, age, education and occupation refer to the proportion of all workers in each sector that are, respectively: women; aged less than 25; low-skilled (ISCED 0-2);
and blue-collar workers (ISCO 6-8). In order to abstract from country differences in levels, each of these variables and the job characteristic measures have beennormalised by dividing the value for each sector by the corresponding national value for all sectors. The nine sectors correspond to the sectoral breakdown shown inChart 3.1 and Tables 3.B.1-3.B.3 (see Annex 3.A for further details).
c) The employment share in services refers to the share of service sector employment in total employment. The other variables are as defined as in Panel A but refer tonational averages and to levels rather than to ratios.
Source: EU countries, European Labour Force Survey (data supplied by EUROSTAT); for the United States, OECD estimates based on microdata from the Current Popu-lation Survey (outgoing rotation group file and, for temporary workers, contingent workers supplement); and for the other countries, data supplied by nationalstatistical authorities based on their national labour force surveys.
Table 3.1. Correlates of sectoral and country differences in various job characteristics, 1998Correlation coefficientsa
Part-time incidence Temporary incidence Average job tenure
A. Correlations across countries and 9 sectorsb
Gender 0.79** 0.25* –0.33**Age 0.34** 0.30** –0.60**Education 0.01 0.43** 0.12Occupation –0.48** 0.14* 0.46**Part-time incidence 1Temporary incidence 0.42** 1Average job tenure –0.28** 0.06 1
B. Correlations across countries onlyc
Employment share in services 0.53** –0.32 –0.55*

The Characteristics and Quality of Service Sector Jobs – 95
© OECD 2001
work is negatively correlated with the incidence of blue-collar work (which can be partly attributed to a higherincidence of blue-collar work among men than amongwomen) but is not correlated with the level of educationalattainment. Temporary work, on the other hand, appearsto be more common in sector with a relatively high pro-portion of workers with few educational qualifications.Average job tenure tends to be lower in sectors thatemploy relatively more women and youth and higher insectors employing relatively more blue-collar workers.However, apart from the relationship between part-timework and gender and between tenure and age, the size ofthe correlation coefficients indicates that the characteris-tics of workers shown in Table 3.1 account for less thanone-half of the variation across sectors.
The results in Panel A of Table 3.1 also indicate towhat extent variations in different job characteristicstend to be associated within the same sectors. Sectorswith a high incidence of part-time work tend to be asso-ciated with a high incidence of temporary work and, to alesser extent, with lower average job tenure. However,there does not appear to be any association across sec-tors between the importance of temporary work andaverage job tenure.
Of course, the characteristics of workers in each sec-tor will reflect both labour supply and demand factors.Workers with different characteristics will have differentpreferences with respect to the sector they wish to work inand the type of working arrangements. There are likely tobe differences across sectors in the skill requirements offirms and in their needs with respect to flexibility in hiringand firing. Institutional factors will in turn affect both theselabour supply and demand decisions. Disentangling theseparate influence of these factors in accounting for sec-toral differences in various job characteristics is not simple.
Country comparisons can provide some usefulinformation on this issue. In fact, there are substantial dif-ferences across countries that need to be accounted for.For example, in 1999, the overall incidence of part-timeemployment ranged from a low of under 6% in the CzechRepublic to a high of just over 30% in the Netherlands(Table 3.B.1). A similar variation across countries canalso be observed for the overall incidence of temporarywork and to a lesser degree for average job tenure(Tables 3.B.2 and 3.B.3). If demand factors alone aredriving sectoral differences in various job characteristicsthen country differences in employment structure wouldtend to account for much of this variation across countriesat the economy-wide level.
At a broad level, there is a reasonably strong andpositive correlation across countries between the overall
incidence of part-time work and the overall employmentshare in the service sector (Table 3.1, Panel B). Averagejob tenure also tends to be lower in countries with ahigher employment share in services.
A deeper analysis of country differences in employ-ment structures at a more detailed sectoral level (i.e. for the21 sectors shown in Annex 3.A) can be carried out within asimple shift-share framework. The results are reported inChart 3.2. For each job chracteristic, the overall differencebetween each country and the (weighted) average for allcountries at the economy-wide level is first calculated. Thisdifference is then decomposed into “between”, “within”and “interaction” effects.8 The first effect reflects differ-ences in employment structure between each country andthe “average” country, while the second reflects differencesbetween countries in each job characteristic for the samesectors. The third effect captures the effect of interactionsbetween both differences in employment structure and ineach job characteristic.
In the case of part-t ime work, differences inemployment structure (“between” effects) account for arelatively small proportion of the overall difference inincidence between each country and the “average” coun-try. If each country had the same structure as on averageacross all countries, but all else was unchanged, then theoverall incidence of part-time employment would changeby one percentage point or less in all countries except theCzech Republic and Germany. Most of the differencebetween countries appears to stem from the “within”effect, i.e. the incidence of part-time work tends to be uni-formly higher or lower across all sectors in one countrythan in another.
A similar result is also recorded for the incidence oftemporary employment. Again, the “between” effectaccounts for around one percentage point or less of theoverall difference between each country and the “aver-age” country. In the case of average job tenure, the“between-sector” effect in some countries accounts for asignificant part of the overall difference in tenure acrosscountries, but even so the contribution is almost alwaysmuch smaller in magnitude than that of the “within-sector” effect. For example, job tenure for women isalmost 4.5 years higher in Greece than on average in othercountries. Of this, differences in employment structureaccount for just over one year whereas differences withineach sector account for almost two years. In contrast,average job tenure for both men and women in the UnitedStates is well below the average for other countries, butagain this is mainly accounted for by lower average jobtenure in all sectors rather than because it has a higheremployment share in services.

96 – OECD Employment Outlook
Total Within Between
a) For each job characteristic, “total” refers to the difference between each country and the (weighted) average for all countries at the economy-wide level;“between” refers to the contribution of differences in employment structure; and “within” refers to the contribution of differences across countries withineach sector. Countries have been ranked by the size of the overall difference for each job characteristic. The data refer to 1999 for all countries, exceptAustria (1995 for average job tenure) and the Czech Republic and Canada (1998 for all measures).
Sources: See Tables 3.B.1-3.B.3.
Chart 3.2. Accounting for differences across countries in various job characteristicsa
A. Incidence of part-time work B. Incidence of temporary work
C. Average job tenure for men D. Average job tenure for women
Percentage pointsPercentage points
Years
– 10 – 5 0 5 10 15
NetherlandsNorway
AustraliaSwitzerland
New ZealandUnited Kingdom
BelgiumCanadaIreland
GermanySweden
DenmarkFrance
United StatesAustria
LuxembourgItaly
FinlandPortugal
SpainGreece
Czech Republic
– 2 – 1 0 1 2 3 4 5
Years
GreeceItaly
BelgiumLuxembourg
SwedenAustriaFrance
PortugalGermany
SpainNetherlands
IrelandSwitzerland
FinlandUnited Kingdom
DenmarkCanada
United States
– 5 0 5 10 15 20
SpainPortugalFinlandFrance
SwedenGreece
GermanyNetherlands
CanadaSwitzerland
NorwayBelgium
DenmarkItaly
AustriaUnited KingdomCzech Republic
IrelandUnited StatesLuxembourg
– 2 – 1 0 1 2 3 4 5
PortugalGreece
SwedenItaly
FranceBelgiumFinlandAustria
GermanyLuxembourg
SpainSwitzerlandNetherlands
DenmarkIrelandCanada
United KingdomUnited States

The Characteristics and Quality of Service Sector Jobs – 97
© OECD 2001
F. Changes over time in part-time, temporary work and job tenure
The analysis has concentrated on a snapshot of var-ious job characteristics at a point-in-time. As such, it can-not provide answers to questions such as whether thegrowth of employment in the service sector has contrib-uted to changes in these characteristics or not. Forinstance, the incidence of part-time work is generallymuch higher in the service industries than in the goods-producing industries. However, a shift of jobs into the ser-vice sectors need not necessarily lead to, or account for, arise in the part-time employment share at the level of thewhole economy. If the incidence of part-time work falls inall sectors, the overall share may also fall despite a com-positional shift of employment into sectors with ahigher-than-average incidence of part-time work.
A more dynamic perspective on the relationshipbetween changes over time in the sectoral distribution ofemployment and changes in various job characteristicscan be provided by using the same type of shift-shareanalysis as was used to account for differences acrosscountries. The results are reported in Chart 3.3. As before,changes over time in the overall share of part-time, tem-porary employment and average job tenure can be decom-posed into “between”, “within” and “interaction” effects.9
If employment shifts into the service sector were the prin-cipal reason for observing changes at the economy-widelevel, the between-sector contribution would tend to bemuch greater than the within-sector contribution.
In the case of part-time employment (Chart 3.3),there has been a substantial rise in its incidence in sev-eral countries. For example, in Australia, Belgium,Ireland and Japan it has risen by over 5 percentagepoints. Employment shifts between sectors have tendedto push up the overall incidence of part-time work in allcountries except Japan, Korea, the Netherlands andSpain. But this has been by less than one percentagepoint in all countries, except for Australia. Changeswithin sectors generally account for a much larger pro-portion of the overall change.
The rise in the share of temporary jobs in totalemployment has been less pronounced in most countriesthan the rise in the part-time employment share, exceptfor substantial rises in Belgium, France and Spain. In allcases, between-sector effects account for less than onepercentage point of the overall change in the temporary-employment share. Where the temporary-employmentshare has risen significantly, the within-sector effectlargely dominants the between-sector effect.
In the case of average job tenure, no consistenttrends over time emerge. Job tenure rose in some coun-tries and fell in others, although women in most of thecountries shown in Chart 3.3 did experience rising tenure.In virtually all countries, and particularly for men,employment shifts between sectors have had a negativebut small impact on average tenure. In contrast, changesin average job tenure within sectors have generally had apositive impact, especially for women.
To summarise, differences in employment struc-ture appear to account for only a small part of the vari-ation across countries and over time in average jobtenure and the overall incidence of part-time and tempo-rary employment. Thus, general institutional, economicand social changes that tend to affect all sectors haveprobably been more important factors rather than theshift of employment out of goods production and intoservices. These include the strength of employment pro-tection legislation, the degree of collective bargainingcoverage, the existence of statutory wage floors, etc., aswell as the distribution of worker characteristics interms of age, gender and skill level.
II. Working conditions and job satisfaction
A. Working conditions
The various job characteristics described so far provideonly very indirect measures of job quality. As an alternativeto these indirect measures, more direct measures are pro-vided by surveys of working conditions. In these types ofsurveys, jobholders are typically asked a number of ques-tions about various aspects of their working conditions cov-ering the work environment, the nature of the tasksperformed in the job, the degree of job autonomy, etc. Thesesurveys can potentially provide a useful insight into differ-ences across sectors in the types of job tasks being performedand whether they involve relatively poor or relatively goodworking conditions.10 However, it is not evident how toderive an aggregate measure of job quality from the poten-tially wide array of information on working conditions that isavailable. Moreover, not all countries have these types ofsurveys, and there can be large differences in the type ofquestions that are asked in those that do.
In order to minimise these potential problems, theanalysis mainly draws upon the results of the EuropeanSurvey on Working Conditions [European Foundation(1997)], which provides a useful source of comparabledata for European Union countries (see Box 3.1).

98 – OECD Employment Outlook
Chart 3.3. Accounting for changes over time in various job characteristicsa
a) For each country, “total” refers to the change over time for each job characteristic at the economy-wide level; “between” refers to the contribution ofshifts in the employment structure; and “within” refers to the contribution of changes within each sector. Countries have been ranked by the size of theoverall change in each job characteristic.
b) The data refer to: 1992-1998 for Korea and New Zealand; 1992-1999 for Germany, Italy and Switzerland; 1995-1999 for Austria; 1987-1998 for Canada;1993-1998 for the Czech Republic; 1984-1998 for Japan; and 1987-1999 for all other countries.
c) The data refer to: 1992-1999 for Germany, Italy and Switzerland; 1995-1999 for Austria; 1993-1998 for the Czech Republic; 1984-1998 for Japan; and1987-1999 for all other countries.
d) The data refer to: 1992-1998 for Canada; and to1992-1999 for all other countries.Sources: See Tables 3.B.1-3.B.3.
Percentage points Percentage pointsA. Change in incidence of part-time workb B. Change in incidence of temporary workc
C. Change in average job tenure for mend D. Change in average job tenure for womend
Years Years
– 4 – 2 0 2 4 6 8 10 – 5 0 5 10 15
– 2 – 1 0 1 2 – 2 – 1 0 1 2
Total Within Between
IrelandJapan
BelgiumAustraliaGermany
NetherlandsLuxembourgSwitzerland
SpainPortugal
FranceCanada
United KingdomItaly
KoreaNew Zealand
GreeceAustria
Czech RepublicUnited States
Denmark
Luxembourg
France
Belgium
Netherlands
Spain
Portugal
Canada
Switzerland
Italy
Greece
United Kingdom
Denmark
Germany
Ireland
SpainFrance
BelgiumGermany
NetherlandsItaly
AustriaPortugal
Czech RepublicJapan
United KingdomLuxembourg
DenmarkSwitzerland
GreeceIreland
Luxembourg
Portugal
France
Belgium
Canada
United Kingdom
Italy
Switzerland
Spain
Germany
Greece
Ireland
Netherlands
Denmark
The Characteristics and Quality of Service Sector Jobs – 99
© OECD 2001
Broad differences in working conditions between thegoods-producing sector and the service sector are shownfor each EU country in Table 3.2. The same information isshown at a more detailed sectoral level for the EU as awhole in Chart 3.4. In both the table and the chart, the datarefer to the percentage of workers that report experiencinga particular type of working conditions. Higher values indi-cate less favourable working conditions.
In Table 3.2, no clear-cut distinction emergesbetween the two sectors. Nevertheless, there are severalareas where working conditions appear to be distinctlyless favourable in the goods-sector than in the service sec-tor, but none where the opposite is true. In almost allcountries, jobs in the goods-producing sector appear to bemore likely to be associated with unpleasant working con-ditions or work tasks than in the service sector. On aver-age for the EU, they also appear to offer less workautonomy. However, this result does not hold for all indi-vidual EU countries. For the other aspects of working
conditions, apart from “antisocial” hours of work, theyalso appear to be less favourable on average in the EU inthe goods-producing sector than in the service sector. Butthese differences are either relatively small and/or do nothold for every country.
Within the service sector, the hotel and restaurantand transport and communications sectors stand out asgenerally having less favourable work conditions thanother service industries (Chart 3.4). Working conditionsin these two sectors also tend to be as bad as or lessfavourable than in the goods-producing sector. Forinstance, a higher proportion of workers in these sectorsreport working “antisocial” hours and having no addi-tional benefits than do workers in manufacturing. Theprevalence of jobs involving unpleasant work tasks,monotonous work, limited work autonomy or limitedworking-time flexibility is also roughly similar. In addi-tion, the proportion of workers not feeling secure in theirjobs is higher in the hotel and restaurant sector than in
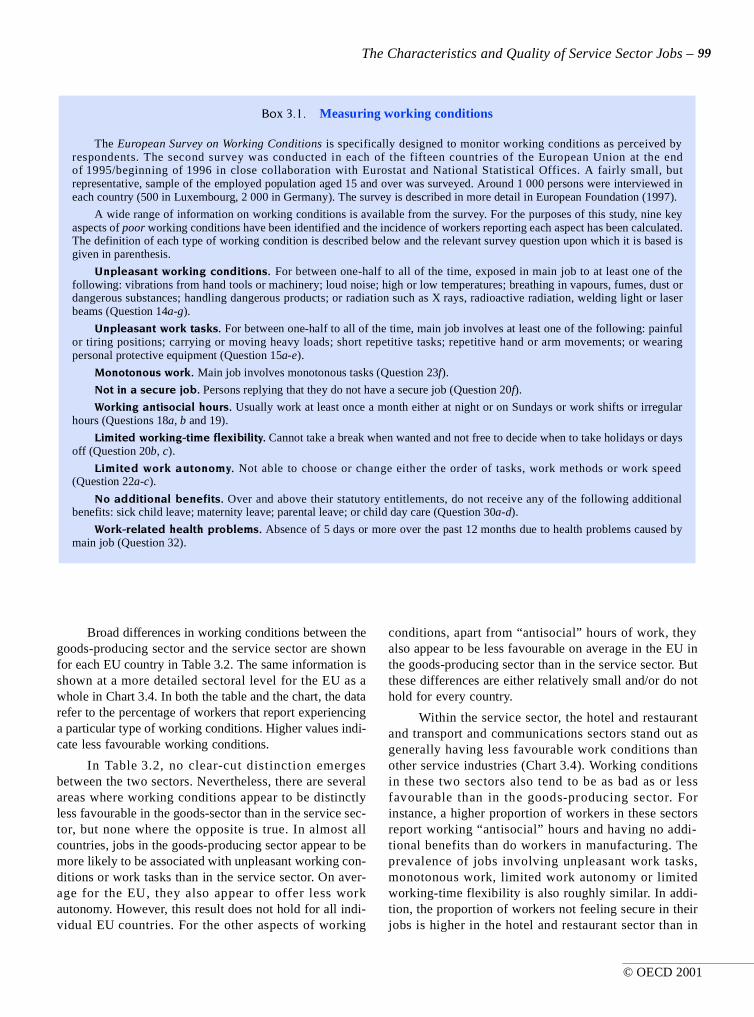
Box 3.1. Measuring working conditions
The European Survey on Working Conditions is specifically designed to monitor working conditions as perceived byrespondents. The second survey was conducted in each of the fifteen countries of the European Union at the endof 1995/beginning of 1996 in close collaboration with Eurostat and National Statistical Offices. A fairly small, butrepresentative, sample of the employed population aged 15 and over was surveyed. Around 1 000 persons were interviewed ineach country (500 in Luxembourg, 2 000 in Germany). The survey is described in more detail in European Foundation (1997).
A wide range of information on working conditions is available from the survey. For the purposes of this study, nine keyaspects of poor working conditions have been identified and the incidence of workers reporting each aspect has been calculated.The definition of each type of working condition is described below and the relevant survey question upon which it is based isgiven in parenthesis.
Unpleasant working conditions. For between one-half to all of the time, exposed in main job to at least one of thefollowing: vibrations from hand tools or machinery; loud noise; high or low temperatures; breathing in vapours, fumes, dust ordangerous substances; handling dangerous products; or radiation such as X rays, radioactive radiation, welding light or laserbeams (Question 14a-g).
Unpleasant work tasks. For between one-half to all of the time, main job involves at least one of the following: painfulor tiring positions; carrying or moving heavy loads; short repetitive tasks; repetitive hand or arm movements; or wearingpersonal protective equipment (Question 15a-e).
Monotonous work. Main job involves monotonous tasks (Question 23f).
Not in a secure job. Persons replying that they do not have a secure job (Question 20f).
Working antisocial hours. Usually work at least once a month either at night or on Sundays or work shifts or irregularhours (Questions 18a, b and 19).
Limited working-time flexibility. Cannot take a break when wanted and not free to decide when to take holidays or daysoff (Question 20b, c).
Limited work autonomy. Not able to choose or change either the order of tasks, work methods or work speed(Question 22a-c).
No additional benefits. Over and above their statutory entitlements, do not receive any of the following additionalbenefits: sick child leave; maternity leave; parental leave; or child day care (Question 30a-d).
Work-related health problems. Absence of 5 days or more over the past 12 months due to health problems caused bymain job (Question 32).

100 – OECD Employment Outlook
manufacturing, although the proportion is lower than inagriculture and construction. At the other end of the scale,workers in financial intermediation appear to have someof the most favourable working conditions, closely fol-lowed by workers in public administration, and in realestate and business activities.
In Table 3.3, averages are presented across the ninedifferent aspects of working conditions as a convenientway of summarising broad differences in poor working
conditions across sectors. The absolute value of the inci-dence of each working condition does not in itself conveyany information about the comparative value that workersthemselves place on these working conditions. Therefore, itwould be meaningless to simply average these absolute val-ues across the different types of working conditions. Instead,two alternative methods of averaging are presented. The firstconsists of calculating the ratio of the incidence of each typeof working condition in each sector to the overall incidencefor all sectors and then averaging these ratios. The second
1. 1
a) See Box 3.1 in text for definition of each type of working condition. A higher value indicates less favourable working conditions.b) Data refer to wage and salary earners only.Source: OECD estimates based on microdata from the Second European Survey on Working Conditions (1995/96).
Table 3.2. Working conditions in Europe by broad sector, 1995/96a
Percentage of workers in each sector experiencing each type of working condition
Unpleasant working conditions Unpleasant work tasks Monotonous work Working antisocial hours
Limited working-time flexibility
Goods-producing
sector
Servicesector
Goods-producing
sector
Servicesector
Goods-producing
sector
Servicesector
Goods-producing
sector
Servicesector
Goods-producing
sector
Servicesector
Austria 62 29 72 52 34 27 23 22 60 52Belgium 41 22 66 50 35 36 27 20 50 55Denmark 46 26 62 48 46 36 21 23 26 40Finland 58 29 74 66 57 41 44 39 31 46France 62 36 79 65 55 45 17 24 40 42Germany 52 20 66 42 41 29 19 17 69 54Greece 83 43 84 70 58 59 27 28 38 49Ireland 52 28 65 53 52 55 25 27 37 45Italy 44 33 63 57 41 42 15 19 33 38Luxembourg 53 24 61 40 42 34 32 18 37 39Netherlands 50 27 74 63 41 28 21 23 46 47Portugal 59 32 79 66 47 40 17 29 41 40Spain 65 36 79 62 63 60 16 22 47 58Sweden 58 26 70 47 37 23 24 17 25 43United Kingdom 53 38 72 65 66 67 23 28 40 39
European Union 55 30 71 57 49 44 19 22 48 46
Limited work autonomy Work-related health problems Not in a secure job No additional benefitsb
Goods-producing sector
Service sector Goods-producing sector
Service sector Goods-producing sector
Service sector Goods-producing sector
Service sector
Austria 54 49 13 7 14 11 21 13Belgium 43 34 9 5 15 21 35 24Denmark 37 30 3 3 15 12 53 41Finland 41 45 10 5 24 26 56 50France 50 41 5 5 40 34 36 33Germany 64 49 12 8 19 10 18 14Greece 42 51 8 4 40 28 31 18Ireland 42 45 2 1 14 11 34 26Italy 52 42 2 3 21 16 25 18Luxembourg 59 42 7 5 9 12 34 18Netherlands 32 35 8 7 19 15 27 18Portugal 45 35 11 5 30 34 24 17Spain 60 43 6 5 26 25 36 29Sweden 40 42 4 5 25 28 75 80United Kingdom 40 39 3 3 23 19 30 27
European Union 52 43 7 5 24 20 29 25

The Characteristics and Quality of Service Sector Jobs – 101
© OECD 2001
consists of ranking sectors for each type of working condi-tion separately and then ranking the average of these ranks.Both types of averaging implicitly assign an equal weight toeach type of working condition. In reality, of course, theywill be valued differently and these valuations will differacross workers. Nevertheless, these averages provide a use-ful way of summarising whether sectors can be distinguishedbetween those with generally more favourable working con-ditions and those with generally less favourable conditions.
As it turns out, both procedures produce similarresults. On average, the risk of facing poor workingconditions appear to be lower in many service sectorsthan most goods-producing sectors, particularly infinancial intermediation, real estate and business activ-ities and public administration. The least favourableconditions appear to be in hotels and restaurants, agri-culture, construction, manufacturing and transport andcommunications.
4. Construction (F)5. Wholesale & retail (G)6. Hotels & restaurants (H)
1. Agriculture (A+B)2. Mining & manufacturing (C+D)3. Electricity, gas, water (E)
7. Transport & communications (I)8. Financial intermediation (J)9. Real estate & business activities (K)
10. Public administration (L)11. Other services (M-Q)
a) See Box 3.1 in text for definition of each type of working condition. A higher value indicates less favourable working conditions.b) The dashed line in each chart represents the average across all sectors.c) Data refer to wage and salary earners only.Source: OECD calculations based on results from the Second European Survey of Working Conditions.
Percentage of workers in each sector experiencing each type of working condition
Not in a secure job
Limited work autonomy
Unpleasant working environment
01 2 3 4 5 6 7 8 9 10 11
10203040506070
1 2 3 4 5 6 7 8 9 10 1105
101520253035
1 2 3 4 5 6 7 8 9 10 11202530354045505560
Working antisocial hours
No additional benefitsc
Unpleasant work tasks
1 2 3 4 5 6 7 8 9 10 1130
40
50
60
70
80
90
1 2 3 4 5 6 7 8 9 10 110
10
20
30
40
50
60
1 2 3 4 5 6 7 8 9 10 1105
10152025303540
Limited working-time flexibility
Work-related health problems
Monotonous job
1 2 3 4 5 6 7 8 9 10 1130
35
40
45
50
55
60
1 2 3 4 5 6 7 8 9 10 11202530354045505560
1 2 3 4 5 6 7 8 9 10 1102468
101214
Chart 3.4. Working conditions in Europe by sector, 1995a, b

102 – OECD Employment Outlook
It is difficult to compare these results with those forother countries outside of the EU because of differencesin the way each country gathers information on workingconditions. In one study for Canada, the average numberof a range of monetary and non-monetary benefits that arereceived by employees in each sector is reported [Statis-tics Canada (1998)]. In 1995, employees in public admin-is t rat ion, finance and communications receivedconsiderably more benefits on average than employees inthe manufacturing sector while employees in retail trade,hotels and restaurants and other personal services sectorsreceived considerably fewer. Employees in other servicesectors received either a similar or slightly small numberof benefits on average than in manufacturing but far morethan in agriculture and construction. The results werebased on the 1995 Survey of Work Arrangements. Thenon-monetary benefits include working a regular daytimeschedule (or other schedule by choice), being in a perma-nent job, having access to flexitime and stating a prefer-ence for working the same hours for the same pay ratherthan fewer hours for less pay or more hours for more pay.The monetary benefits include being covered by variouspension and health plans and entitlements to paid sickleave and paid vacation.
For the United States information is available on theprevalence of flexitime and shift work [Beers (2000)].In 1997, flexitime arrangements were generally moreprevalent in all broad service sub-sectors than in goods-producing sectors, apart from agriculture. A less clear dis-tinction emerges in the case of shift work and other non-regular daytime schedules where the prevalence of thesearrangements is much higher in several service sectors,
such as hotels and restaurants, transport and otherpersonal services, than in the manufacturing sector.
B. Job satisfaction
Another way of trying to measure job quality moredirectly is to simply ask people whether they are satisfiedwith their jobs or not. However, considerable care isrequired in interpreting the results of this type of subjec-tive measure in the context of international comparisons.There can be subtle differences between countries in theway questions about job satisfaction are asked and inter-preted. There are also likely to be systematic country dif-ferences in the way people respond to these types ofsubjective questions. Even within the same country, it isnot entirely clear what precise aspect of job quality isbeing captured by questions about job satisfaction. Beingsatisfied with one’s job may be an important benefit of ajob but answers to questions about job satisfaction areprobably also reflecting the extent to which a range ofexpectations about pay, working conditions and careerprospects are realised in practice.11
Bearing in mind these qualifications, the relativedegree of job satisfaction by sector is reported inTable 3.4 according to the results of the European Work-ing Conditions Survey (EWCS) and the European Com-munity Household Panel (ECHP) Survey. Two measuresare shown. The first is the average of satisfaction scoresreported in each sector (higher values indicate greater sat-isfaction). However, a simple average of ordinal values isimplicitly assigning the same weight to each possibleresponse when there is no reason to believe that a scoreof 4 indicates twice as much satisfaction as a score of 2.
1. 1
. . Data not applicable.a) The data refer to averages across nine different aspects of working conditions (see text and Box 3.1). A higher value indicates less favourable working conditions.b) Simple average of the ratio for each type of working conditions of the incidence in each sector relative to the average incidence for all sectors.c) Ranking of the average rank for each sector based on its value for each type of working conditions.Source: OECD estimates based on microdata from the Second European Survey on Working Conditions (1995/96).
Table 3.3. Averages across a range of working conditions in Europe by sector, 1995/96a
Average of ratiosb Ranking of ranksc
Goods-producing sector 1.12 . .Agriculture (A + B) 1.23 11Mining and manufacturing (C + D) 1.09 8Electricity, gas, water (E) 1.07 5Construction (F) 1.15 10
Service sector 0.93 . .Wholesale and retail (G) 0.90 6Hotels and restaurants (H) 1.26 9Transport and communications (I) 1.14 7Financial intermediation (J) 0.71 1Real estate and business activities (K) 0.85 2Public administration (L) 0.86 3Other services (M – Q) 0.93 4

The Characteristics and Quality of Service Sector Jobs – 103
© OECD 2001
Therefore, the second measure shows the proportion ofworkers in each sector reporting the highest level of sat-isfaction. The results are fairly similar across the two sur-veys and suggest that, on average across EU countries,job satisfaction tends to be higher in the service sectorthan in the goods-producing sector. However, this is notuniformly the case throughout the service sector. Workersin hotels and restaurants report relatively low levels ofsatisfaction while the highest levels are reported in realestate and business activities, public administration andother social and personal services. Workers in transportand communications also report relatively low levels ofjob satisfaction.
To some extent these sectoral differences in job sat-isfaction may reflect compositional differences in thecharacteristics of workers. All other things equal, there issome evidence that women tend to report higher levels ofjob satisfaction than men and that there is a U-shapedrelationship between age and job satisfaction [Clark(1997); Clark and Oswald (1996)]. Therefore, a moredetailed analysis is required of whether these sectoral dif-ferences remain once allowance is made for differencesacross sectors in the composition of employment accordingto various worker characteristics.
In Table 3.5, the results are shown of regressingreported levels of job satisfaction from the two surveysagainst sector of employment, as well as against various
other job and worker characteristics that are likely to influ-ence job satisfaction.12 The coefficients on the sector vari-ables are reported relative to manufacturing. A positivecoefficient for a particular sector indicates that, all otherthings equal, job satisfaction is higher in that sector. Itcould be argued that job characteristics such as part-timeand temporary status, average job tenure, firm size, earn-ings and, possibly, occupation, should not be included inthe regression since they also represent different aspects ofjob quality. However, it is interesting to examine whetherthere are sectoral differences in other unobserved factorsthat are associated with job satisfaction. Therefore, theregression results in Table 3.5 are shown both with andwithout controls for these job characteristics.
Both the ECHP and EWCS results in Table 3.5(Model 2) suggest that, after controlling for a range ofworker characteristics (and unobservable factors affectingcross-country differences), job satisfaction tends to behigher in most other sectors than in manufacturing. Thisis broadly in line with the results in Table 3.4. Interest-ingly enough, the ECHP results also suggest that, evenafter controlling for sectoral differences in a range of jobcharacteristics (Model 1), there are still other aspects ofjobs which are associated with lower levels of job satisfac-tion in manufacturing than in other sectors. However, thesedifferences are less important than when only worker char-acteristics are controlled for. These unobserved aspects of
1. 1
a) The data refer to replies to question 36 of the survey: On the whole are you very satisfied, fairly satisfied, not very satisfied or not at all satisfied with your main job?b) The data refer to the variable PK001 of the survey: satisfaction with work or main activity. The level of satisfaction is scored as 1 for not satisfied through to 6 for fully
satisfied. Only replies from persons in employment were taken into account.c) Weighted average of job satisfaction scores (i.e. 1 for least satisfied category, 2 for the next level of satisfaction and so on).d) Proportion of workers reporting highest level of job satisfaction.Source: OECD estimates based on microdata from the Second European Survey on Working Conditions (1995-1996) and the 1994-1996 waves of the European Commu-
nity Household Panel Survey.
Table 3.4. Job satisfaction in Europe by sector, 1994-1996
European Survey on Working Conditionsa European Community Household Panelb
Average level of satisfactionc Proportion very satisfiedd Average level
of satisfactionc Proportion very satisfiedd
Goods-producing sector 3.03 26.2 4.21 11.6Agriculture (A + B) 2.86 22.8 4.03 13.4Industry (C + D + E) 3.07 27.2 4.25 11.3Construction (F) 3.03 25.5 4.19 11.5
Service sector 3.18 34.8 4.41 14.8Wholesale and retail (G) 3.09 31.5 4.23 12.9Hotels and restaurants (H) 3.07 24.6 4.11 12.0Transport and communications (I) 3.09 27.9 4.28 10.9Financial intermediation (J) 3.18 35.2 4.47 14.1Real estate and business activities (K) 3.21 37.8 4.46 15.1Public administration (L) 3.27 39.5 4.50 14.3Other services (M – Q) 3.24 38.1 4.49 17.1
All sectors 3.12 31.6 4.33 13.8

104 – OECD Employment Outlook
jobs are probably related to the results reported earlieron working conditions that showed poorer conditions inmanufacturing in a number of dimensions than else-where. The EWCS results are somewhat different in thatafter controlling for both job and worker characteristics,job satisfaction appears lower in a number of servicesectors than in manufacturing. However, unlike theECHP, the EWCS does not contain information on edu-cation and earnings and so these characteristics couldnot be controlled for.
III. Pay levels as a measure of job qualityAnother important job characteristic that may be
more directly linked to job quality is the rate of pay that isassociated with a job. Invariably, studies of earnings dif-ferentials find that rates of pay are highly correlated withthe level of skill required in the job, whether measured byformal educational qualifications, tenure in the job andoverall work experience or by more direct measures interms of knowledge requirements and the complexityinvolved in carrying out the job.13 Within the same sectormore highly-paid employees tend to have better working
conditions than lower-paid employees in the sense ofworking in less physically demanding or noisy jobsand/or with greater autonomy in their work schedules.This suggests that better quality jobs can be proxied bythose with higher pay.14
While knowing what a job pays may be a usefulway of assessing job quality, there are a number of poten-tial problems with comparing earnings across sectors andcountries (see Box 3.2). In order to improve comparabil-ity, earnings are reported as hourly earnings for all work-ers, when available, otherwise to earnings of full-timeworkers only. To the extent possible, the earnings data forthe European countries are drawn from harmonisedsources such as the European Structure of Earnings Sur-vey and the European Community Household Panel.Earnings differentials across sectors are also shown rela-tive to earnings of manufacturing workers, as earningsdata for this sector are available in all countries. Never-theless, not all of the various problems of comparabilitycan be fully resolved, and the reported results should onlybe taken as providing a broad indication, as opposed toprecise estimates, of differences across sectors andcountries in earnings differentials.
1. 1
. . Data not available.a) For the questions on job satisfaction and the possible replies see Table 3.4. The coefficients reported in the table are the results of an ordered probit regression where the
dependent variable is the job satisfaction score of each individual. The independent variables include variables for sector of employment (with manufacturing as thereference sector) and other job characteristics (earnings – ECHP only, occupation, part-time status, permanent status, firm size, average job tenure). Variables for variousworker characteristics (gender, education – ECHP only, marital status, presence of dependent children) and for country and year (ECHP only) effects are also included. Apositive coefficient indicates that relative to the manufacturing sector job satisfaction is higher all else equal and vice versa. All reported coefficients are significant at the1 per cent level.
b) Full model with all job and worker characteristics included.c) Reduced model without any variable for job characteristics, apart from sector of employment.Sources: OECD estimates based on microdata from the Second European Survey on Working Conditions (1995/96) and the 1994-1996 waves of the European Community
Household Panel Survey.
Table 3.5. Job satisfaction by sector, controlling for job and worker characteristicsa
European Community Household Panel European Survey on Working Conditions
Model 1b Model 2c Model 1b Model 2c
Agriculture (A + B) 0.03 –0.11 –0.10 –0.16Mining and/or electricity, gas and water (C/E) 0.08 0.11 0.07 0.22Construction (F) 0.03 –0.02 –0.15 –0.11Wholesale and retail (G) 0.02 0.03 –0.07 0.03Hotels and restaurants (H) –0.05 –0.05 0.03 –0.01Transport and communications (I) 0.01 0.04 0.00 0.08Financial intermediation (J) 0.05 0.15 –0.03 0.12Real estate and business activities (K) 0.05 0.09 –0.02 0.20Public administration (L) 0.15 0.22 0.18 0.34Other services (M – Q) . . . . 0.12 0.28
Education (M) 0.21 0.31 . . . .Health and social work (N) 0.25 0.30 . . . .Other social and personal services (O – Q) 0.05 0.01 . . . .
Controls for worker characteristics Yes Yes Yes YesControls for job characteristics Yes No Yes NoControls for fixed country effects Yes Yes Yes Yes
Number of observations 77 377 81 788 10 080 11 489

The Characteristics and Quality of Service Sector Jobs – 105
© OECD 2001
A. Overall earnings differentials across sectors
Table 3.6 provides a summary of earnings differen-tials across sectors relative to manufacturing. For thosecountries for which earnings data are available coveringall sectors, average earnings in the service sector areslightly higher or around the same as in the goods-producing sector in most countries. The main exceptionsare Australia and the United States. In Australia earn-ings for full-time workers are substantially higher in theservice sector than in the goods-producing sector. Incontrast, relative earnings for American service workersare substantially lower.15
Within the goods-producing sector, average earn-ings tend to be highest in electricity, gas and water andlowest in construction and agriculture. Within the ser-vice sector, jobs in producer services record the highestaverage earnings in most countries followed by socialservices. Average earnings are lower in distributive ser-vices than in manufacturing in most countries, with thenotable exceptions of Portugal and Italy, and lower stillin personal services.16
B. The distribution of jobs by broad wage levels
So far the distribution of earnings in each sector hasbeen ignored. The level of average earnings may be thesame in any two sectors, but with a very different disper-sion of earnings. Consequently, one sector may have ahigher incidence of low-paying jobs and/or higher inci-dence of high-paying jobs than in the other sector. Oneway to take account of sectoral differences in earnings
distribution is to divide up sectors by occupationalgroups. It is then possible to look at how the earnings ofsimilar groups of workers in terms of occupational statusvary across sectors and countries although of course thisignores the dispersion of earnings within these occupa-tional groups. In the following analysis, employment ineach country has been div ided up into 13 sectors(see Table 3.7) and into a number of broad occupationsvarying from 4 to 7 according to sector. In total, some76 separate sector/occupation categories are identified(see Table 3.C.1). These categories are then ranked on thebasis of average hourly earnings for workers in each cat-egory in 1995 and assigned to three groups (low, mediumor high paid) of equal size on the basis of employmentshares (see Annex 3.C for further details).17
In Table 3.7, the sectoral composition of jobs ineach of these three wage groups is shown for the EU andthe United States (a breakdown by occupation as well isprovided in Tables 3.C.1 and 3.C.2 for the EU countriesand 3.C.3 for the United States). In both economies, theservice sector accounts for the lion’s share of low-paidjobs, but it also accounts for a large majority of high-paidjobs as well. This is hardly surprising as the service sectoraccounts for a large majority of all jobs. In fact, in botheconomies, the service sector accounts for a higher shareof high-paying jobs than its share of all jobs. Service-sector jobs are somewhat over-represented in low-payingjobs but only in Europe and only by a small amount. Inboth economies, service sector jobs are under-representedin medium-paying jobs, especially in Europe.18
Box 3.2. Comparing earnings differentials across countries
International studies of earnings differentials usually need to confront a number of problems concerning data comparability.
First, there are substantial differences across countries in the way earnings are defined and in the way the data arecollected. The earnings data may or may not include overtime pay and other regular and irregular bonuses. These componentsof pay can differ in importance both across countries and sectors.
Second, not all countries regularly collect earnings data on individuals (as opposed to total wage and salarypayments) across all sectors of the economy. This is often the case for countries relying on establishment surveys oradministrative data as their main source of earnings data. Information is often lacking for public administration,education, health and other social and personal services.
Third, not all countries report earnings data on an hourly basis. This can hamper comparisons across sectors. A sector with arelatively high incidence of part-time work will tend to record relatively low earnings if earnings are measured on a weekly,monthly or annual basis, irrespective of whether hourly rates of pay are high or not in that sector.
Finally, different survey instruments are used to collect earnings data. Administrative data and establishments surveys tend toreport more accurately both earnings and hours paid for than household surveys, but their sectoral coverage can be limited, smallfirms are sometimes excluded and they may not cover very low-paid workers for other reasons. The coverage of household surveystends to be better but at the cost of greater reporting error with respect to earnings, hours worked and sector of employment.
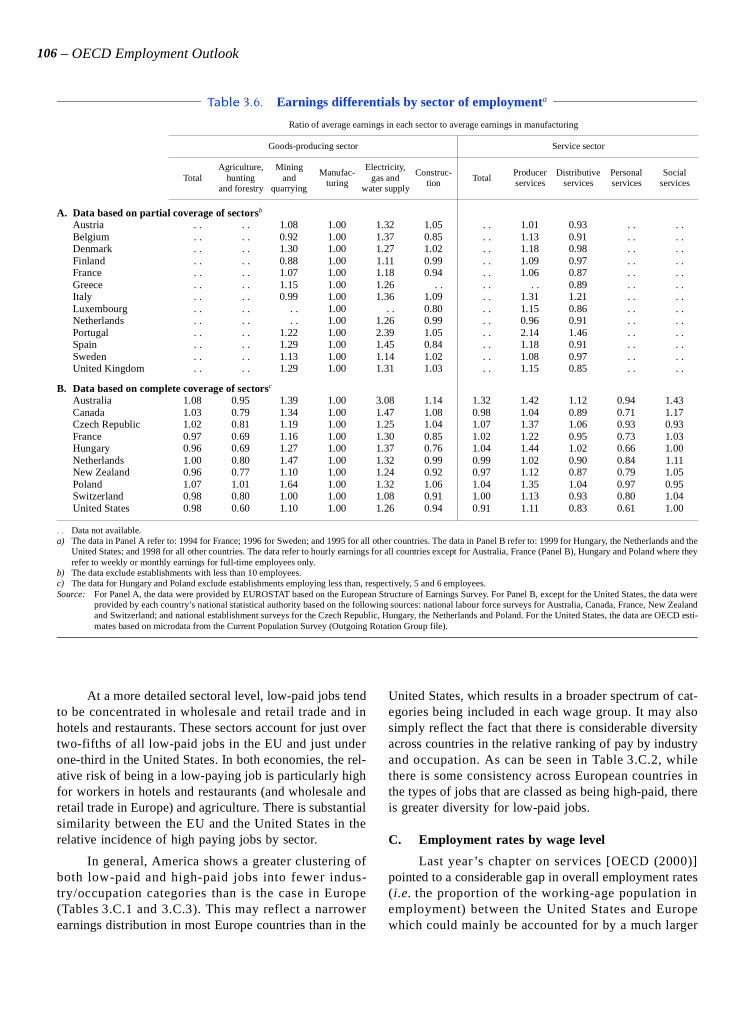
106 – OECD Employment Outlook
At a more detailed sectoral level, low-paid jobs tendto be concentrated in wholesale and retail trade and inhotels and restaurants. These sectors account for just overtwo-fifths of all low-paid jobs in the EU and just underone-third in the United States. In both economies, the rel-ative risk of being in a low-paying job is particularly highfor workers in hotels and restaurants (and wholesale andretail trade in Europe) and agriculture. There is substantialsimilarity between the EU and the United States in therelative incidence of high paying jobs by sector.
In general, America shows a greater clustering ofboth low-paid and high-paid jobs into fewer indus-try/occupation categories than is the case in Europe(Tables 3.C.1 and 3.C.3). This may reflect a narrowerearnings distribution in most Europe countries than in the
United States, which results in a broader spectrum of cat-egories being included in each wage group. It may alsosimply reflect the fact that there is considerable diversityacross countries in the relative ranking of pay by industryand occupation. As can be seen in Table 3.C.2, whilethere is some consistency across European countries inthe types of jobs that are classed as being high-paid, thereis greater diversity for low-paid jobs.
C. Employment rates by wage level
Last year ’s chapter on services [OECD (2000)]pointed to a considerable gap in overall employment rates(i.e. the proportion of the working-age population inemployment) between the United States and Europewhich could mainly be accounted for by a much larger
1. 1
. . Data not available.a) The data in Panel A refer to: 1994 for France; 1996 for Sweden; and 1995 for all other countries. The data in Panel B refer to: 1999 for Hungary, the Netherlands and the
United States; and 1998 for all other countries. The data refer to hourly earnings for all countries except for Australia, France (Panel B), Hungary and Poland where theyrefer to weekly or monthly earnings for full-time employees only.
b) The data exclude establishments with less than 10 employees.c) The data for Hungary and Poland exclude establishments employing less than, respectively, 5 and 6 employees.Source: For Panel A, the data were provided by EUROSTAT based on the European Structure of Earnings Survey. For Panel B, except for the United States, the data were
provided by each country’s national statistical authority based on the following sources: national labour force surveys for Australia, Canada, France, New Zealandand Switzerland; and national establishment surveys for the Czech Republic, Hungary, the Netherlands and Poland. For the United States, the data are OECD esti-mates based on microdata from the Current Population Survey (Outgoing Rotation Group file).
Table 3.6. Earnings differentials by sector of employmenta
Ratio of average earnings in each sector to average earnings in manufacturing
Goods-producing sector Service sector
TotalAgriculture,
hunting and forestry
Miningand
quarrying
Manufac- turing
Electricity, gas and
water supply
Construc- tion Total
Producer services
Distributive services
Personal services
Social services
A. Data based on partial coverage of sectorsb
Austria . . . . 1.08 1.00 1.32 1.05 . . 1.01 0.93 . . . .Belgium . . . . 0.92 1.00 1.37 0.85 . . 1.13 0.91 . . . .Denmark . . . . 1.30 1.00 1.27 1.02 . . 1.18 0.98 . . . .Finland . . . . 0.88 1.00 1.11 0.99 . . 1.09 0.97 . . . .France . . . . 1.07 1.00 1.18 0.94 . . 1.06 0.87 . . . .Greece . . . . 1.15 1.00 1.26 . . . . . . 0.89 . . . .Italy . . . . 0.99 1.00 1.36 1.09 . . 1.31 1.21 . . . .Luxembourg . . . . . . 1.00 . . 0.80 . . 1.15 0.86 . . . .Netherlands . . . . . . 1.00 1.26 0.99 . . 0.96 0.91 . . . .Portugal . . . . 1.22 1.00 2.39 1.05 . . 2.14 1.46 . . . .Spain . . . . 1.29 1.00 1.45 0.84 . . 1.18 0.91 . . . .Sweden . . . . 1.13 1.00 1.14 1.02 . . 1.08 0.97 . . . .United Kingdom . . . . 1.29 1.00 1.31 1.03 . . 1.15 0.85 . . . .
B. Data based on complete coverage of sectorsc
Australia 1.08 0.95 1.39 1.00 3.08 1.14 1.32 1.42 1.12 0.94 1.43Canada 1.03 0.79 1.34 1.00 1.47 1.08 0.98 1.04 0.89 0.71 1.17Czech Republic 1.02 0.81 1.19 1.00 1.25 1.04 1.07 1.37 1.06 0.93 0.93France 0.97 0.69 1.16 1.00 1.30 0.85 1.02 1.22 0.95 0.73 1.03Hungary 0.96 0.69 1.27 1.00 1.37 0.76 1.04 1.44 1.02 0.66 1.00Netherlands 1.00 0.80 1.47 1.00 1.32 0.99 0.99 1.02 0.90 0.84 1.11New Zealand 0.96 0.77 1.10 1.00 1.24 0.92 0.97 1.12 0.87 0.79 1.05Poland 1.07 1.01 1.64 1.00 1.32 1.06 1.04 1.35 1.04 0.97 0.95Switzerland 0.98 0.80 1.00 1.00 1.08 0.91 1.00 1.13 0.93 0.80 1.04United States 0.98 0.60 1.10 1.00 1.26 0.94 0.91 1.11 0.83 0.61 1.00

The Characteristics and Quality of Service Sector Jobs – 107
© OECD 2001
service sector in the United States. The fact that employ-ment rates in some low-paying personal services sectorsare much higher in the United States than on average inEurope, has prompted some calls for measures to expandemployment in these sectors in Europe. But to whatextent can the overall employment gap be accounted forby a deficit of low-paid jobs in Europe?
To answer this question, jobs for each country wereagain classed into three broad wage groups (low, mediumand high). Jobs (i.e. industry/occupation cells) in everycountry were assigned to the same wage group as theequivalent job in the United States based on its wage andemployment structure for 1999. Thus, the comparisonbecomes one of looking at jobs that are low-, medium- orhigh-paying by American standards and seeing whetheremployment in these jobs relative to the working-agepopulation is higher or lower in other OECD countriesthan in the United States. The issue is whether the higheremployment rate in the United States relative to manyother countries principally occurs in jobs that are poorlypaid by American standards.
As it turns out, America has a job “surplus” relativeto most countries, not just in low-paying jobs but equallyin high-paying jobs. This can be seen in Table 3.8 whichshows the difference in employment rates between the
United States and the European Union by sector andbroad wage level, and in Chart 3.5 which makes the samecomparison by wage level only but for a wider range ofOECD countries.19 In 1999, the overall employment rategap between the United States and EU countries was13.7 percentage points. Around 7.5 percentage points canindeed be accounted for by higher American employmentin re la tive ly low-paying jobs. However, a lmost8 percentage points of the overall gap can also beaccounted for by higher American employment in rela-tively well paid jobs. The United States actually appearsto have a small job “deficit” in medium-paid jobs. Theseresults should perhaps not be too surprising. Earnings ine-quality in the United States is generally much higher thanin most European countries, with a larger gap in earningsrelative to median workers both for high-paid and low-paid workers [OECD (1996); Bardone et al. (1998)]. Incombination with its higher overall employment rate, thisimplies that America must have relatively more jobs thanEurope at both ends of the wages scale.
It can also be seen from Table 3.8 that these differ-ences in employment rates at each wage level are notevenly spread across the sectors. Within services, higherAmerican employment rates in low-paying jobs in whole-sale and retail trade and in hotels and restaurants accountfor over 4 percentage points of the US-EU gap.20 Outside
1. 1
a) For each country, jobs (i.e. employment in 76 industry/occupation cells) are ranked on the basis of average hourly earnings in 1995 and then placed into three groups ofequal size in terms of employment shares. The EU data are weighted averages of all EU countries except Luxembourg and Sweden.
Sources: OECD calculations based on data from the European Community Household Panel Survey and the European Labour Force Survey for Europe and on data from theCurrent Population Survey (Outgoing Rotation Group file) for the United States.
Table 3.7. Sectoral distribution of jobs by wage level in the European Union and in the United States, 1999a
Percentage of all jobs at each wage level (low/medium/high)in each sector
Incidence of pay at each wage level (low/medium/high)in each sector relative to the overall incidence
Low paid Medium paid High paid Low paid Medium paid High paid
Industries (ISIC-Rev. 3) EU USA EU USA EU USA EU USA EU USA EU USA
Goods-producing sector 26.4 26.6 54.0 31.5 21.9 20.1 0.8 1.0 1.6 1.2 0.6 0.8Agriculture (A + B) 11.3 6.9 2.3 0.0 0.4 0.5 2.5 2.7 0.5 0.0 0.1 0.2Mining and utilities (C + E) 0.0 0.0 1.2 1.8 2.2 2.8 0.0 0.0 1.0 1.2 1.9 1.8Manufacturing (D) 10.4 17.5 34.6 14.3 16.2 13.5 0.5 1.2 1.7 0.9 0.8 0.9Construction (F) 4.6 2.2 15.9 15.4 3.1 3.2 0.6 0.3 2.0 2.3 0.4 0.5
Service sector 73.6 73.4 46.0 68.5 78.1 79.9 1.1 1.0 0.7 0.9 1.2 1.1Wholesale and retail (G) 30.6 17.9 6.4 28.8 9.1 4.5 2.0 1.1 0.4 1.7 0.6 0.3Hotels and restaurants (H) 10.2 14.6 0.8 4.0 1.5 0.0 2.5 2.4 0.2 0.6 0.4 0.0Transport and communications (I) 3.5 0.0 6.4 10.1 8.0 6.6 0.6 0.0 1.1 1.9 1.3 1.2Financial intermediation (J) 0.1 0.0 3.7 6.7 6.3 7.9 0.0 0.0 1.1 1.4 1.8 1.6Real estate and business activities (K) 6.1 10.6 6.8 2.2 12.0 19.7 0.7 0.9 0.8 0.2 1.4 1.8Public administration (L) 2.1 0.0 6.2 3.0 12.1 2.4 0.3 0.0 0.9 1.7 1.7 1.4Education (M) 3.3 7.6 2.5 0.4 14.3 15.2 0.5 0.9 0.4 0.1 2.1 1.9Health and social work (N) 7.5 15.3 10.8 3.6 9.7 14.1 0.8 1.4 1.2 0.3 1.0 1.2Community, social and personal (O + P + Q) 10.2 7.3 2.4 9.6 5.1 9.5 1.7 0.8 0.4 1.1 0.9 1.1
Total 100.0 100.0 100.0 100.0 100.0 100.0 1.0 1.0 1.0 1.0 1.0 1.0

108 – OECD Employment Outlook
of these sectors, higher United States employment rates inwell-paid jobs are fairly evenly spread across the businessand social service sectors, except for public administra-tion where there are relatively fewer jobs overall in theUnited States than in Europe.
Within the EU average, there are some individualcountry differences in the size of the jobs deficit com-pared with the United States and its distribution by sec-tor (Chart 3.5 and Table 3.C.4). The overall jobs deficitis particularly large in Italy and Spain (between 23 to2 4 p er c en t a g e p o i n t s c om p a r ed w i t h a g ap o f13.7 percentage points for the EU as a whole). It is non-existent in Denmark and relatively small in Sweden, theNetherlands and the United Kingdom. However, thesame broad patterns generally hold in each country, asfor the EU as a whole, with respect to comparisons ofemployment rates at each wage level. Thus, a higheroverall employment rate in the United States than inmost European countries cannot be solely attributed tothe fact that it has generated far more low-paying ser-vice jobs. The United States has also been more success-ful at generat ing jobs in re la tive ly high-payingoccupations in both the goods-producing and servicesectors, although this is true to a much lesser extent inFinland, the Netherlands and the United Kingdom.
Outside of the EU, the United States actually has ajobs deficit in comparison with Switzerland, but only in
medium-paid jobs. It has a particularly large jobs surplusin comparison with Hungary, almost as large as incomparison with Italy and Spain.
D. Employment growth by wage level
Looking into employment growth by wage level canhelp to throw some light on at least two important issues.First, it helps to answer the question as to whether theexpansion of the service sector has been accompanied bygrowth in low-paid jobs. Second, it can help to clarifywhether there is any obvious trade-off between the quantityand quality of jobs in terms of comparing employmentperformance across countries.
As already seen (Section III.A), the extent to whichservice sector jobs are low paid in comparison withgoods-producing jobs varies both across the different ser-vice sub-sectors within countries as well as across coun-tries for the service sector as a whole. Employment shareshave risen fastest in most countries in the producer andsocial service sectors [OECD (2000), Table 3.C.1], andthese sectors appear to pay relatively well on average(Table 3.6). This may suggest that in most countries rela-tively high-paid jobs have expanded at a faster pace thanlow-paying ones. Whether this is the case or not will alsodepend on the extent to which job growth (job declines)have been greater (smaller) in higher-paying jobs withineach sector than low-paying ones. Therefore, in the
1. 1
. . Not applicable (i.e. no broad occupations in the US for the given industry have average earnings at the given wage level).a) For each country, jobs (i.e. employment in 76 industry/occupation cells) are assigned to the same broad wage groups as the equivalent job in the United States. For the
United States, jobs are first ranked on the basis of average hourly earnings in 1999 and then placed in one of three wage groups (low, medium, high) of equal size in termsof employment shares.
Source: OECD estimates based on data from the European Labour Force Survey for Europe and on data from the Current Population Survey (Outgoing Rotation Groupfile) for the United States.
Table 3.8. The US-EU employment rate gap by wage level and sector, 1999a
Percentage points
Wage level
Industries (ISIC-Rev. 3) Low paid Medium paid High paid All wage levels
Goods-producing sector 0.0 –2.6 1.1 –1.6Agriculture (A + B) –0.8 . . 0.0 –0.9Mining and utilities (C + E) . . 0.2 0.3 0.4Manufacturing (D) 0.7 –2.4 0.4 –1.3Construction (F) 0.2 –0.4 0.4 0.2
Service sector 7.5 0.8 6.9 15.2Wholesale and retail (G) 2.3 1.5 –0.6 3.2Hotels and restaurants (H) 1.9 0.4 . . 2.2Transport and communications (I) 0.1 0.0 0.3 0.3Financial intermediation (J) . . 0.5 1.0 1.6Real estate and business activities (K) 0.4 0.7 2.2 3.3Public administration (L) . . –1.6 –1.4 –3.0Education (M) 1.0 –0.5 1.4 1.9Health and social work (N) 1.3 –1.0 2.3 2.6Community, social and personal (O + P + Q) 0.5 1.0 1.6 3.1
Total 7.5 –1.8 7.9 13.7

The Characteristics and Quality of Service Sector Jobs – 109
© OECD 2001
following analysis, the same methodology is used as inSection III.B to classify jobs by broad wage levels (low,medium, high) based on each country’s own structure ofwages and employment in 1995. Employment changesover time are then traced out for each group of jobs.21
In the case of the United States, it can be seen thatemployment growth over the period 1989 to 1999 hasbeen much more substantial in jobs that are relativelyhigh-paid on average than in jobs that are low or mediumpaid on average (Chart 3.6, Panel A).22 This result isbroadly similar to the results reported in Ilg (1996) andIlg and Haugen (2000), although both studies found thatemployment growth in low-paying jobs was faster thanfor medium-paying ones.23
Of course, it is possible that this picture underesti-mates the extent to which low-wage employment hasrisen in the United States. Earnings inequality has risensubstantially over time in the United States [OECD(1996)], and there may have been a rise in earnings dis-persion for individual workers within each of the indus-try/occupation categories underlying this analysis. Itcould be, therefore, that a growing proportion of workersin each broad wage group is in fact receiving relativelylow wages. This possibility can be examined by looking
at the proportion of all workers who earn either belowtwo-third of median hourly earnings (i.e. low-paid work-ers) or more than one-and-a-half times median earnings(i .e. high-paid workers). The results in Chart 3.6(Panel B) suggest that the incidence of low pay has fallenslightly over the 1990s matched by stability or a smallrise in the incidence of high pay.
The distribution of job growth in other OECD coun-tries over the 1990s by broad wage levels can also be car-ried out using the same methodology. The results areshown in Chart 3.7.24
The European pattern of job growth by wage levelhas been similar to one for the United States. In both,there has been more substantial growth in jobs that arerelatively high-paid on average than in those categoriesthat are low- or medium-paid on average.25 This patternholds for most EU countries and for Switzerland.26 However,with the notable exceptions of Ireland, the Netherlands andSpain, job growth in Europe has been slower at all wagelevels than in the United States. In general, these resultssuggest that neither in the United States nor in Europeancountries has a disproportionate part of growth in servicesector employment been occurring in jobs that are onaverage low-paid.27
a) For each country, jobs (i.e. employment in 76 industry/occupation cells) are assigned to the same broad wage groups as the equivalent job in the US.For the US, jobs are first ranked on the basis of average hourly earnings in 1999 and then placed in one of three wage groups (low, medium, high) ofequal size in terms of employment shares. The data refer to 1998 for Australia, the Czech Republic, Hungary and New Zealand. Individual countries areranked in ascending order by the size of their overall employment rate gap with the United States.
Sources: OECD estimates based on data from the European Labour Force Survey for EU countries, the Current Population Survey (Outgoing RotationGroup file) for the United States and national labour force surveys for other countries.
Percentage points
– 20
– 15
– 10
– 5
0
5
10
15
20
25
30
EU15
Switzerl
and
Denmark
United
Kingdo
m
Sweden
Netherl
ands
Portug
al
New Ze
aland
Austria
Austra
lia
Czech R
epub
lic
Finlan
d
German
y
Irelan
d
Luxe
mbourg
Franc
e
Belgium
Greece
Hunga
ry Italy
Spain
Low paid Medium paid High paid All wage levels
Chart 3.5. Employment rate gap between the United States and other OECD countriesby wage level, 1999a
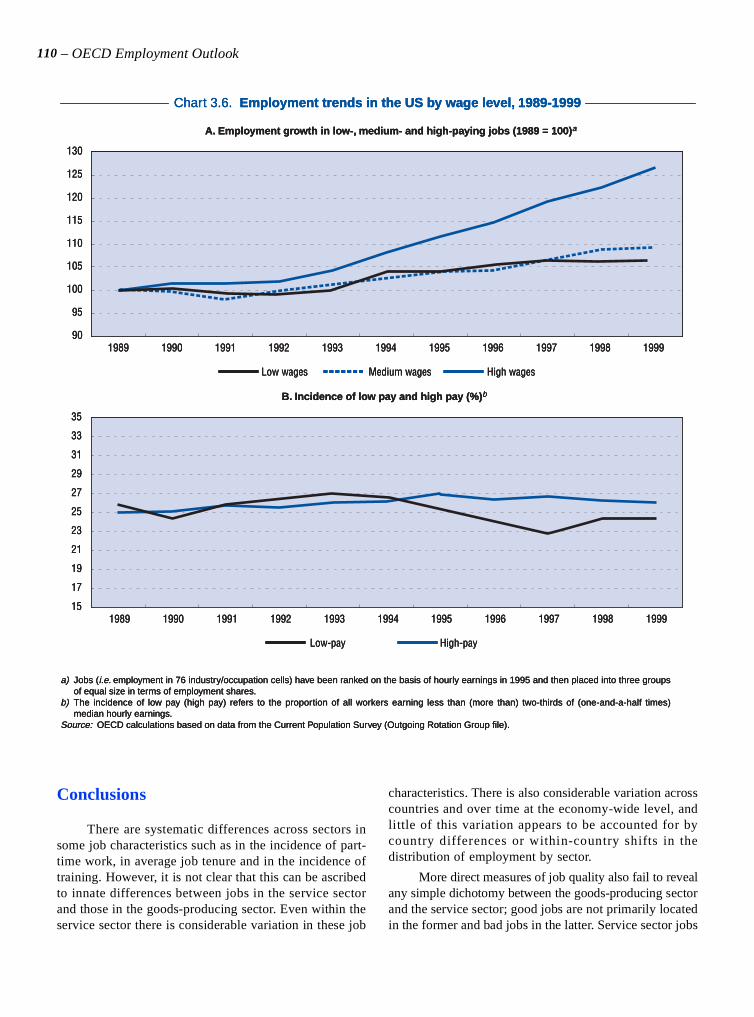
110 – OECD Employment Outlook
Conclusions
There are systematic differences across sectors insome job characteristics such as in the incidence of part-time work, in average job tenure and in the incidence oftraining. However, it is not clear that this can be ascribedto innate differences between jobs in the service sectorand those in the goods-producing sector. Even within theservice sector there is considerable variation in these job
characteristics. There is also considerable variation acrosscountries and over time at the economy-wide level, andlittle of this variation appears to be accounted for bycountry differences or within-country shifts in thedistribution of employment by sector.
More direct measures of job quality also fail to revealany simple dichotomy between the goods-producing sectorand the service sector; good jobs are not primarily locatedin the former and bad jobs in the latter. Service sector jobs
a) Jobs (i.e. employment in 76 industry/occupation cells) have been ranked on the basis of hourly earnings in 1995 and then placed into three groupsof equal size in terms of employment shares.
b) The incidence of low pay (high pay) refers to the proportion of all workers earning less than (more than) two-thirds of (one-and-a-half times)median hourly earnings.
Source: OECD calculations based on data from the Current Population Survey (Outgoing Rotation Group file).
B. Incidence of low pay and high pay (%)b
A. Employment growth in low-, medium- and high-paying jobs (1989 = 100)a
Medium wagesLow wages High wages
Low-pay High-pay
90
95
100
105
110
115
120
125
130
1989 1990 1991 1992 1993 1994 1995 1996 1997 1998 1999
15
17
19
21
23
25
27
29
31
33
35
1989 1990 1991 1992 1993 1994 1995 1996 1997 1998 1999
Chart 3.6. Employment trends in the US by wage level, 1989-1999
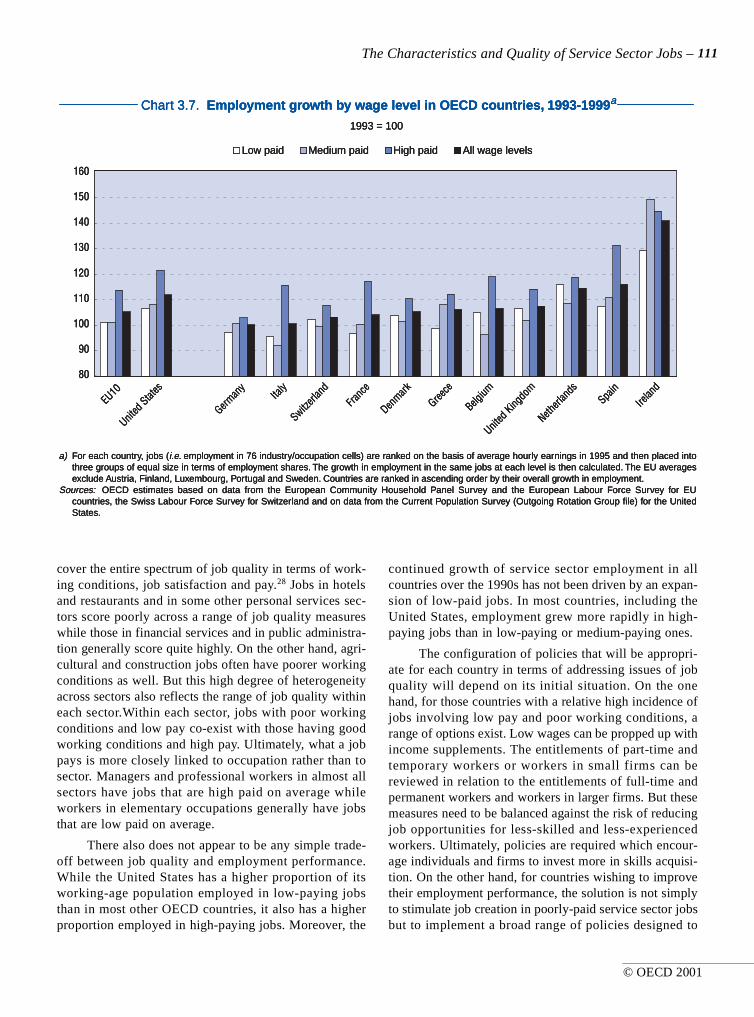
The Characteristics and Quality of Service Sector Jobs – 111
© OECD 2001
cover the entire spectrum of job quality in terms of work-ing conditions, job satisfaction and pay.28 Jobs in hotelsand restaurants and in some other personal services sec-tors score poorly across a range of job quality measureswhile those in financial services and in public administra-tion generally score quite highly. On the other hand, agri-cultural and construction jobs often have poorer workingconditions as well. But this high degree of heterogeneityacross sectors also reflects the range of job quality withineach sector.Within each sector, jobs with poor workingconditions and low pay co-exist with those having goodworking conditions and high pay. Ultimately, what a jobpays is more closely linked to occupation rather than tosector. Managers and professional workers in almost allsectors have jobs that are high paid on average whileworkers in elementary occupations generally have jobsthat are low paid on average.
There also does not appear to be any simple trade-off between job quality and employment performance.While the United States has a higher proportion of itsworking-age population employed in low-paying jobsthan in most other OECD countries, it also has a higherproportion employed in high-paying jobs. Moreover, the
continued growth of service sector employment in allcountries over the 1990s has not been driven by an expan-sion of low-paid jobs. In most countries, including theUnited States, employment grew more rapidly in high-paying jobs than in low-paying or medium-paying ones.
The configuration of policies that will be appropri-ate for each country in terms of addressing issues of jobquality will depend on its initial situation. On the onehand, for those countries with a relative high incidence ofjobs involving low pay and poor working conditions, arange of options exist. Low wages can be propped up withincome supplements. The entitlements of part-time andtemporary workers or workers in small firms can bereviewed in relation to the entitlements of full-time andpermanent workers and workers in larger firms. But thesemeasures need to be balanced against the risk of reducingjob opportunities for less-skilled and less-experiencedworkers. Ultimately, policies are required which encour-age individuals and firms to invest more in skills acquisi-tion. On the other hand, for countries wishing to improvetheir employment performance, the solution is not simplyto stimulate job creation in poorly-paid service sector jobsbut to implement a broad range of policies designed to
a) For each country, jobs (i.e. employment in 76 industry/occupation cells) are ranked on the basis of average hourly earnings in 1995 and then placed intothree groups of equal size in terms of employment shares. The growth in employment in the same jobs at each level is then calculated. The EU averagesexclude Austria, Finland, Luxembourg, Portugal and Sweden. Countries are ranked in ascending order by their overall growth in employment.
Sources: OECD estimates based on data from the European Community Household Panel Survey and the European Labour Force Survey for EUcountries, the Swiss Labour Force Survey for Switzerland and on data from the Current Population Survey (Outgoing Rotation Group file) for the UnitedStates.
80
90
100
110
120
130
140
150
160
EU10
United
States
German
yIta
ly
Switzerl
and
Franc
e
Denmark
Greece
Belgium
United
Kingdo
m
Netherl
ands
Spain
Irelan
d
1993 = 100
Low paid Medium paid High paid All wage levels
Chart 3.7. Employment growth by wage level in OECD countries, 1993-1999a

112 – OECD Employment Outlook
stimulate employment more generally. This may involvereviewing barriers to employment for low-skilled workerssuch as high labour costs as a result of high statutory min-imum wages and/or high social security charges. But itwill also depend on improving product-market competi-tion, stimulating entrepreneurship more generally and
achieving sustained economic growth. In either case, it isdifficult to lay the blame on either too many low-qualityservice sector jobs or too few. The quality and quantity ofjobs in the service sector depend on institutional settingsand labour market policies that affect employment in allsectors.

The Characteristics and Quality of Service Sector Jobs – 113
© OECD 2001
NOTES
1. For example, in March 2000, a significantly higher propor-tion of temporary workers than permanent workers in theEU reported being exposed to a range of poor working con-ditions. These included carrying heavy loads, working inpainful positions, working at high speed, making repetitivemovements, having no control over the pace of work or nothaving received training, etc. [Merllié and Paoli (2001)]. Insome countries, non-wage benefits for part-time workersare lower than for full-time workers even on a pro ratabasis, and the incidence of job-related training for part-tim-ers appears to be lower than for full-timers even after con-trolling for a range of job and worker characteristics[OECD (1999)].
2. Country differences in the overall incidence of part-time andtemporary work will be affected by how these characteristicsare measured. In order to improve the comparability of theresults, part-time work in this study is not based on self-assessment, but is defined for most countries as usual weeklyhours of work of less than 30 hours. There are some nationaldifferences in the way permanent versus temporary jobs aredefined [OECD (1996)]. This may limit somewhat the com-parability of the overall incidence of temporary work, butshould affect less the comparisons of the relative incidence oftemporary work in different sectors.
3. See Murtough and Waite (2000) and Campbell and Burgess(2001) for a more detailed examination of the differenttypes of working arrangements in Australia and thecharacteristics of the workers involved.
4. These data on average tenure can be heavily influenced bya relatively small number of workers with long tenure.Some sectors may record a high turnover of labour, but nev-ertheless have a core group of workers who remain in thesame job for a considerable length of time. In this case,average job tenure will still tend to be quite high but willmask considerable job instability and job insecurity forsome groups of workers. However, when the incidence ofjobs with short-term tenure (of less than 12 months) andwith long-term tenure (10 years and over) is measured (notshown), the sectoral pattern is by and large very similar tothe pattern observed for average job tenure, i.e. short-tenurejobs are more prevalent in sectors with low average job ten-ure, and long-tenure jobs are more common in sectors withhigh average job tenure.
5. According to the Second European Survey of WorkingConditions [European Foundation (1997)], the proportionof EU workers in 1995 whose job involves working withcomputers at least half of the time, in financial intermedia-tion, real estate and business activities, and public adminis-tration was, respectively, 68, 42 and 32% compared with26% in manufacturing.
6. Goux and Zamora (2001) report for France that computertraining courses accounted for just over a quarter of all trainingcourses that were paid for by enterprises in 1999.
7. Occupation is shown in Table 3.1 as a worker characteristic.It could be argued that it is more a characteristic of aworker’s job. Nevertheless, it is interesting to see to whatextent other aspects of jobs are correlated with occupation.
8. If sc refers to the overall incidence of part-time or tempo-rary employment or to average job tenure in country c andsa to the average for all countries then the difference (sc – sa)can be decomposed into the following three components:
(1)
(2)
(3)
where i refers to sector i and e refers to the employmentshare in sector i. The interaction effect turns out to be gen-erally quite small and so is not separately shown inChart 3.2.
9. The decomposition is the same as in note 8, except sa and ea
here refer to job quality and the employment share, respec-tively, for the same country in the earlier period. As before, theinteraction effect is not separately shown in Chart 3.3 since it isgenerally quite small.
10. There is some element of subjectivity involved in thesequestions about working conditions that may affect com-parisons across countries. For example, what constitutes“monotonous tasks” may not be precisely defined and mayinstead rely on each respondent’s judgement about whatthis means.
11. See Clark (1997).
12. An ordered probit regression model was used in each casewith controls for country and year effects in addition tocontrols for various worker and job characteristics.
13. The importance of these more direct measures of skill forexplaining variations in wages across jobs is shown inPierce (1999).
14. One potential problem with using pay as a proxy for jobquality is raised by the theory of compensating differentials.This theory suggests that for similar jobs in terms of skillrequirements, those jobs with poorer working conditions,e.g. dirtier or involving a more intense rhythm of work, willbe compensated by higher rates of pay than those with bet-ter working conditions. In other words, based on pay alone,the job with poorer working conditions may well be classed
eci e
ai–( ) s
ai×
i
∑
sc
i sa
i–( ) ea
i×i
∑
ec
i ea
i–( ) sci s
ai–( )×
i
∑

114 – OECD Employment Outlook
as being a better quality job than the one with better work-ing conditions. However, even in this case, the higher levelof pay may itself be a source of extra “utility” in terms ofconferring greater social status, say, than a lower-paid joband so may still be correctly indicating a better quality job. Itis not clear how important these compensating differentialsare in practice. In a recent American study by Pierce(1999), a negative rather than a positive wage premium isreported for jobs that were physically more demanding thanother jobs that were identical in other observable respects.However, the same study does report a positive wage pre-mium for jobs involving greater work risks. But both thesedimensions of jobs account for only a very small part of theoverall variation in wages across jobs. Other factors appearto be much more important such as the knowledge requiredfor carrying out a job, and the complexity involved, as wellas a worker’s occupation and industry of employment.
15. Germany is not shown in Table 3.6 as hourly earnings data ata detailed level for the service sector are not generally avail-able. However, using a mixture of microcensus and socialsecurity data for Germany, Freeman and Schettkat (2001)suggest that inter-industry wage differentials are quite similarin both western Germany and the United States.
16. The much higher level of average earnings in Portugal andItaly in the distributive service sector relative to the manu-facturing sector may be due to the fact that the data forthese two countries are based on an establishment surveyw hi c h e xc l ud e s e s t a b l i shm e n t s w i t h l e s s t ha n10 employees. These excluded establishments will typicallyhave lower-than-average earnings in comparison withlarger establishments.
17. A similar exercise has been carried out for the United Statesby I l g (1996) and I l g and Haugen (2000) u s i ng90 industry/occupation categories.
18. It should be remembered that these comparisons arebased on average wages for industry/occupation cellsand so do not refer to wages of individual workers. Forinstance, some workers may have a low wage despite arelatively high average wage for all workers in the sameindustry/occupation class as them.
19. As in the preceding analysis, 76 separate industry/occupa-tion cells are identified. However, for every country, thesecells are assigned to the same broad wage groups as theequivalent cell in the United States based on its wage andemployment structure for 1999. The results appear to berelatively insensitive to the year chosen to categorise jobsby broad wage groups. Similar results are obtainedusing 1995 instead of 1999 as the reference year. It shouldbe recalled, however, that because of difficulties in compar-ing sectoral and occupational data across countries, theseresults should not be taken as precise estimates but as indi-cating broad differences between the United States andother OECD countries.
20. The results of detailed case studies of differences inemployment structures in retail between France and theUnited States are reported in Jany-Catrice and Baret (2001).
21. There are a number of limitations that should be borne inmind when interpreting the results of this analysis. First,some employment changes within each group may be dueto spurious fluctuations in the reported industry/occupationcell that a person is working in. However, unless there have
been major changes in the underlying survey (such as in itsmethodology, design or industry/occupation classifica-tions), this should not affect longer-run trends. Second, theanalysis uses a fixed reference year to classify jobs by wagelevel but these broad wage differentials between jobs maychange over time which may shift the composition of thesewage groups. But this should not greatly affect the analysisover a relatively short time span.
22. The actual increase in employment for each broad groupingshould be only taken as an indication of the order of magni-tude of job growth rather than as a precise estimate. There arevarious statistical breaks, notably in 1990 and 1994, becauseof the introduction of new population benchmarks and otherchanges in the survey methodology underlying the data.However, while these breaks affect absolute levels, they areless likely to have affected the relative difference between thethree broad groups in terms of job growth.
23. The methods used in both studies and in this chapter toclass jobs by wage level are broadly comparable. However,there are a number of differences that may account for thedivergence in some of the results between these studies andthe chapter. One important difference is that in these studiesjobs were classed on the basis of weekly earnings ratherthan hourly earnings. Thus, many part-time workers wereclassed as low paid irrespective of their hourly rate of pay.Another difference is that the breakdown of jobs by indus-try and occupation in these studies is also somewhat finerthan the one used in this chapter.
24. The data refer to job growth over the 6-year periodbetween 1993 and 1999. Comparable European data onemployment by industry and occupation are generallynot available prior to 1993.
25. A similar pattern of higher-than-average employmentgrowth in more skilled occupations and in high-educationsectors is reported for EU countries by the EuropeanCommission (2000). A similar finding for Australia is alsoreached in the Joint Governments’ Submission (2001)based on an analysis of average earnings and total hoursworked by very detailed occupations. They find thatfrom 1986 to 2000 growth was consistently strongest inhigh-paid jobs. Over the period 1986-1995, this was fol-l owed by gr owt h in low-paid jobs and, ove r theperiod 1996-2000, by growth in medium-paid jobs.
26. Gubian and Ponthieux (2000) obtain a somewhat differentresult for France. They find that the employment share of low-skilled jobs rose slightly between 1994 and 2000, following asubstantial decline since at least 1984. They link this smallimprovement to the various measures taken since 1993 tolower employer social security charges for low-paid workers.Their study, however, is not directly comparable with theresults of the analysis used in this chapter since they classifyjobs by occupation only rather than using wage levels to rankjobs and a classification of jobs by both sector and occupation.Moreover, their study examines job growth for employees onlyand they are looking at a more restrictive group of low-skilledworkers, account ing for under 25% of employeesbetween 1994 and 2000. In this chapter, on the other hand,employment growth is examined for all workers, and the low-paid group accounts for roughly one-third of the total.
27. Freeman and Schettkat (2001) provide a long-run comparisonof job growth in the United States and western Germany over

The Characteristics and Quality of Service Sector Jobs – 115
© OECD 2001
the period 1970 to 1995. They also find that job growth in theUnited States mainly took place at both the low and high endsof the wage scale whereas for Germany there was a slightdecline in low-wage jobs, a stagnation in high-wage jobs andmodest growth in jobs just below the mean wage. They alsodismiss the conjecture that service sector employment growthhas been concentrated in low-wage industries. Finally, they areunable to find much evidence linking the different patterns of
employment growth between the United States and Germanywith differences in wage structures and changes in relativewages by sector.
28. Meisenheimer II (1998) reaches a similar conclusion forthe United States based on a comparison across sectors ofpay, employee benefi ts , job security, occupationalstructure and occupational safety.

116 – OECD Employment Outlook
Annex 3.A
For the data on part-time and temporary work, job tenure,training and earnings (Table 3.6 only), the sectoral classificationis the same as was used in last year’s chapter on services [OECD(2000)]. The correspondence between these nine broad sectors
and sub-sectors and the ISIC rev. 3 and NACE rev. 1 codes (atthe 2-digit level) is shown in Table 3.A.1. Elsewhere the sectoralbreakdown is primarily based on industries at the one-digit levelaccording to ISIC rev. 3.
Sectoral classification
1. 1
Table 3.A.1. Definition of sectors used in analysis of part-time and temporary employment,job tenure and training
Sector ISIC rev. 3/NACE rev. 1
Agriculture, hunting and forestry 01, 02, 05
Mining and quarrying 10 to 14
Manufacturing 15 to 37
Electricity, gas and water supply 40 to 41
Construction 45
Producer servicesBusiness and professional services 71 to 74Financial services 65, 67Insurance 66Real estate 70
Distributive servicesRetail trade 50, 52Wholesale trade 51Transportation 60 to 63Communication 64
Personal servicesHotels and restaurants 55Recreational and cultural services 92Domestic services 95Other personal services 93
Social servicesGovernment proper 75, 99Health services 85Educational services 80Miscellaneous social services 90 to 91

The Characteristics and Quality of Service Sector Jobs – 117
© OECD 2001
Annex 3.B
The data corresponding to Chart 3.1 at an individual country level are shown below in Tables 3.B.1-3.B.4.
Job characteristics by sector and country: detailed tables
1. 1
. . Data not available.a) Part-time employment refers to usual weekly hours of work of less than 30, except where noted otherwise.b) Part-time work refers to employed persons whose usual and actual weekly hours of work are less than 35.c) 1998 instead of 1999.d) Part-time employment refers to actual weekly hours of less than 35. Sanitation services and activities of membership organisations (ISIC-Rev. 3 sectors 90 and 91) are
included in personal services instead of social services.e) Part-time employment includes persons who usually work between 30 and less than 37 hours per week and who declare themselves to be working part-time.f) Unweighted average of countries shown in table.Source: EU countries, European Labour Force Survey (data supplied by EUROSTAT); for the United States, OECD estimates based on outgoing rotation group microdata
from the Current Population Survey; and for the other countries, data supplied by national statistical authorities based on their national labour force surveys.
Table 3.B.1. Relative importance of part-time employment by sector, 1999a
Ratio of incidence of part-time employment in each sector to average incidence for all sectors
Incidence in per centAll sectors
Goods-producing sector Service sector
TotalAgriculture,
hunting and forestry
Miningand
quarrying
Manufac- turing
Electricity, gas and
water supply
Construc- tion
Total Producer services
Distributive services
Personal services
Social services
Australiab 0.49 0.90 0.10 0.38 0.15 0.49 1.18 0.87 1.18 1.48 1.24 26.2Austria 0.50 0.81 0.79 0.48 0.21 0.33 1.28 1.35 1.28 1.62 1.12 12.3Belgium 0.27 0.57 0.16 0.26 0.21 0.22 1.30 0.64 0.73 1.39 1.90 20.1Canadac 0.51 0.97 0.18 0.47 0.11 0.47 1.21 0.99 1.11 1.81 1.15 18.7Czech Republicc 0.58 0.89 0.10 0.65 0.45 0.31 1.37 1.19 1.21 1.51 1.57 5.7Denmark 0.49 0.78 . . 0.52 0.37 0.28 1.22 0.81 1.17 2.41 1.22 15.3Finland 0.57 1.33 1.01 0.41 0.06 0.41 1.23 1.15 1.10 2.22 1.10 9.4France 0.33 0.91 0.13 0.27 0.19 0.24 1.29 0.79 0.69 2.18 1.67 14.7Germany 0.50 0.79 0.15 0.53 0.28 0.34 1.30 1.20 1.22 1.65 1.30 17.2Greece 0.64 1.16 0.07 0.28 0.00 0.31 1.24 0.47 0.34 1.23 2.74 7.9Ireland 0.34 0.61 . . 0.29 0.19 0.28 1.36 0.72 1.12 1.94 1.70 18.3Italy 0.44 0.88 0.21 0.38 0.26 0.34 1.34 0.95 0.64 1.59 2.11 11.9Japanc, d 0.88 1.76 . . 0.79 0.80 0.63 1.07 1.06 0.98 1.35 1.06 23.5Koreac, d 1.15 1.88 0.19 0.58 0.18 1.46 0.90 0.63 0.64 0.93 1.67 6.8Luxembourg 0.36 1.11 . . 0.27 0.58 0.34 1.21 0.75 0.79 2.05 1.55 12.1Netherlands 0.43 0.83 0.32 0.44 0.28 0.21 1.10 0.73 1.00 1.64 1.25 30.5New Zealandc 0.57 0.98 0.10 0.43 0.24 0.44 1.21 0.94 1.09 1.66 1.28 23.5Norwaye 0.52 0.92 0.27 0.53 0.30 0.32 1.17 0.69 1.01 1.46 1.37 26.4Portugal 0.98 2.95 . . 0.29 0.28 0.26 1.02 0.87 0.57 1.95 0.96 9.4Spain 0.41 0.86 0.24 0.38 0.28 0.17 1.36 1.34 0.86 2.85 0.99 7.9Sweden 0.53 1.48 . . 0.45 0.20 0.36 1.18 0.83 1.05 1.68 1.30 16.2Switzerland 0.51 0.90 . . 0.48 0.41 0.37 1.21 0.84 0.89 1.48 1.59 25.9United Kingdom 0.34 0.74 0.11 0.33 0.26 0.29 1.25 0.78 1.21 1.94 1.34 22.9United States 0.37 1.27 0.10 0.26 0.15 0.37 1.22 0.80 1.17 2.18 1.13 12.9
OECD averagef 0.53 1.10 0.25 0.42 0.27 0.38 1.22 0.89 0.96 1.76 1.43 16.5

118 – OECD Employment Outlook
1. 1
. . Data not available.a) The data refer to wage and salary workers only.b) The data for the first row for Australia refer to workers who are not entitled to paid holiday leave and/or paid sick leave and who considered themselves to be casual
workers. These data are not strictly comparable with the data for the other countries as they include a substantial proportion of workers who appear to be in an “ongoing”job with no fixed finishing date. The data for the second row refer to workers with a fixed-term contract. In both cases, the data refer to 2000.
c) 1998 instead of 1999.d) The data refer to temporary work agency employment only.e) Sanitation services and activities of membership organisations (ISIC-Rev. 3 sectors 90 and 91) are included in personal services instead of social services.f) The data for the United State refer to “contingent” workers i.e. all workers who expect their work will end in the near future for economic (as opposed to personal)
reasons.g) Unweighted average of countries shown in table, including first row only for Australia and France.Source: For Australia, ABS, Employment Arrangements and Superannuation, April to June 2000, Cat. No. 6361.0; EU countries, European Labour Force Survey (data sup-
plied by EUROSTAT) and, for France (second row), “Le Travail Temporaire au Premier Semestre 2000 : Nouvelle Accélération”, Premières Informations,DARES, No. 08.1, February, 2001; for the United States, OECD estimates based on microdata from the “contingent workers” supplement to the Current Popula-tion Survey; and for the other countries, data supplied by national statistical authorities based on their national labour force surveys.
Table 3.B.2. Relative importance of temporary employment by sector, 1999a
Ratio of incidence of temporary employment in each sector to average incidence for all sectors
Incidence in per centAll sectors
Goods-producing sector Service sector
TotalAgriculture,
huntingand forestry
Miningand
quarrying
Manufac- turing
Electricity, gas and
water supply
Construc- tion Total
Producer services
Distributive services
Personal services
Social services
Australiab 0.75 1.98 0.08 0.54 0.25 1.04 1.07 0.83 1.31 1.77 0.68 23.3Australiab 0.54 0.38 2.09 0.39 1.83 0.45 1.13 0.88 0.29 0.89 2.25 4.2Austria 1.06 1.55 0.73 0.85 0.82 1.55 0.97 0.69 0.96 1.87 0.81 7.9Belgium 0.71 1.80 1.25 0.72 0.56 0.50 1.12 0.91 0.52 2.35 1.38 10.3Canadac 0.91 3.03 0.72 0.53 0.65 1.94 1.04 0.96 0.73 1.32 1.20 11.8Czech Republicc 0.79 0.98 0.62 0.83 0.69 0.62 1.19 1.00 0.80 1.25 1.65 6.0Denmark 0.97 2.53 . . 0.69 0.65 1.41 1.01 0.59 0.77 1.58 1.21 10.1Finland 0.79 1.72 0.84 0.63 0.31 1.10 1.09 0.73 0.70 1.43 1.40 18.2France 0.96 1.52 0.18 0.89 0.52 1.16 1.02 0.83 0.80 1.21 1.18 14.0Franced 2.00 0.25 0.85 2.10 0.76 2.32 0.45 0.52 0.63 0.17 0.11 3.0Germany 0.92 1.97 0.63 0.76 0.83 1.19 1.05 0.85 0.86 1.36 1.20 12.7Greece 1.07 2.98 0.44 0.66 0.23 1.97 0.97 0.74 0.66 2.58 0.65 13.0Ireland 0.69 1.02 1.35 0.53 0.48 1.05 1.15 0.69 1.01 2.31 1.01 4.9Italy 0.99 3.71 0.30 0.63 0.50 1.40 1.01 0.86 0.87 1.88 0.93 9.9Japanc, e 0.72 1.97 . . 0.64 0.24 0.86 1.15 0.94 1.11 1.81 0.84 11.4Luxembourg 0.56 2.16 . . 0.41 0.00 0.75 1.12 0.83 1.11 1.53 1.21 3.3Netherlands 0.71 1.86 0.45 0.73 0.55 0.39 0.89 0.79 0.85 2.38 0.67 12.0Norway 0.71 1.64 0.34 0.63 0.91 0.69 1.09 0.61 0.73 1.43 1.41 10.6Portugal 0.91 1.69 0.95 0.65 0.64 1.41 1.07 1.14 1.02 1.48 0.91 18.7Spain 1.24 1.87 0.64 0.87 0.44 1.88 0.86 0.76 0.92 1.22 0.66 32.7Sweden 0.57 1.28 0.26 0.52 0.15 0.74 1.16 0.86 0.84 1.96 1.30 13.9Switzerland 0.85 1.97 . . 0.61 0.99 1.34 1.06 0.84 0.84 1.48 1.21 11.7United Kingdom 0.72 1.46 0.76 0.60 1.07 1.00 1.10 0.98 0.60 1.57 1.42 6.8United Statesf 0.81 2.46 0.60 0.50 0.72 1.41 1.06 1.18 0.53 1.16 1.38 4.5
OECD averageg 0.84 1.96 0.62 0.66 0.55 1.15 1.06 0.85 0.84 1.68 1.10 12.2

The Characteristics and Quality of Service Sector Jobs – 119
© OECD 2001
1. 1
a) The data refer to employees, except for Canada and Australia where they refer to all persons in employment.b) The data refer to 2000 and are OECD estimates. The original data refer to the distribution of employed persons by tenure intervals. Average tenure has been calculated by
using the mid-point of each closed interval and assuming a mid-point of 27.5 years for the group with tenure of 20 years and over.c) The data refer to 1995.d) The data refer to 1998.e) The data refer to 2000.f) Unweighted average of countries shown in table.Source: For Australia, ABS, Labour Mobility, Australia, August 2000, Cat. No. 6209.0; EU countries, European Labour Force Survey (data supplied by EUROSTAT); for the
United States, OECD estimates based on microdata from the “Job Tenure” supplement to the Current Population Survey; and for the other countries, data suppliedby national statistical authorities based on their national labour force surveys.
Table 3.B.3. Sectoral differences in average job tenure, 1999a
Ratio of average tenure for each sector to average tenure for all sectors
Level (years)
All sectors
Goods-producing sector Service sector
TotalAgriculture,
hunting and forestry
Miningand
quarrying
Manufac-turing
Electricity, gas and water supply
Construc-tion
Total Producer services
Distributive services
Personal services
Social services
Australiab 1.22 1.72 1.20 1.11 1.66 1.10 0.92 0.80 0.87 0.78 1.16 6.9Austriac 1.12 1.65 1.30 1.01 1.51 0.90 0.92 0.93 0.88 0.76 1.03 10.6Belgium 1.02 1.27 1.04 1.04 1.37 0.83 0.99 0.88 0.97 0.80 1.09 11.7Canadad 1.13 1.74 1.11 1.04 1.70 0.91 0.94 0.83 0.90 0.61 1.21 8.1Denmark 1.07 1.54 0.97 1.01 1.54 0.97 0.97 1.00 0.94 0.71 1.02 8.5Finland 1.13 1.53 1.16 1.09 1.71 0.77 0.93 0.85 0.95 0.69 1.01 10.1France 1.09 1.33 1.35 1.09 1.44 0.90 0.96 0.87 0.92 0.63 1.12 11.2Germany 1.07 1.33 1.61 1.11 1.38 0.83 0.96 0.88 0.94 0.69 1.08 10.3Greece 1.28 1.84 0.90 0.83 1.13 0.92 0.81 0.76 0.82 0.56 0.95 13.3Ireland 1.14 1.98 1.42 0.88 1.98 0.79 0.92 0.75 0.90 0.56 1.24 9.4Italy 0.97 1.27 1.12 0.93 1.28 0.85 1.02 0.93 1.01 0.76 1.16 12.1Luxembourg 1.16 1.65 1.43 1.37 1.40 0.74 0.95 0.82 0.93 0.73 1.10 10.9Netherlands 1.20 1.62 1.39 1.12 1.73 1.11 0.93 0.81 0.86 0.74 1.10 9.6Portugal 1.11 1.93 0.82 0.90 1.14 0.61 0.90 0.73 0.91 0.74 1.03 11.8Spain 1.02 1.39 1.13 1.08 1.48 0.62 0.99 0.91 0.97 0.70 1.23 10.1Sweden 1.11 1.48 1.48 1.06 1.47 1.04 0.96 0.79 0.92 0.61 1.10 11.5Switzerland 1.25 1.88 1.49 1.14 1.04 1.06 0.90 0.84 0.96 0.81 0.92 9.4United Kingdom 1.17 1.78 1.27 1.11 1.46 1.15 0.94 0.85 0.87 0.68 1.12 8.3United Statese 1.19 0.88 1.48 1.28 1.88 0.85 0.94 0.79 0.91 0.59 1.18 6.7
OECD averagef 1.13 1.57 1.25 1.06 1.49 0.89 0.94 0.84 0.92 0.69 1.10 10.0

120 – OECD Employment Outlook
1. 1
. . Data not available.a) The incidence of training refers to the proportion of employees aged 25 to 54 who had undertaken training in the past 4 weeks, where training refers to education or
training for a reason other than secondary or initial vocational training.b) Including sanitation services and activities of membership organisations (ISIC-Rev. 3 sectors 90 and 91).c) Excluding sanitation services and activities of membership organisations (ISIC-Rev. 3 sectors 90 and 91).d) The data refer to current training, while the reference period used by the other countries is any time during the previous 4 weeks.e) Unweighted average of countries shown in table, excluding France.Source: European Labour Force Survey (data supplied by EUROSTAT).
Table 3.B.4. Relative importance of continuing vocational training by sector, 1997a
Ratio of incidence of training in each sector to average incidence for all sectors
Incidence in per centAll sectors
Goods-producing sector Service sector
TotalAgriculture,
hunting and forestry
Miningand
quarrying
Manufac- turing
Electricity, gas and water supply
Construc- tion
Total Producer services
Distributive services
Personal servicesb
Social servicesc
Austria 0.72 0.43 0.47 0.80 1.38 0.45 1.13 1.21 0.94 0.69 1.43 7.9Belgium 0.58 0.38 1.80 0.55 1.69 0.44 1.19 1.48 0.75 0.90 1.38 3.4Denmark 0.60 0.15 0.91 0.65 1.43 0.39 1.17 1.28 0.74 1.06 1.35 18.4Finland 0.70 0.67 0.28 0.77 1.00 0.41 1.14 1.53 0.71 0.97 1.30 18.0Franced 0.49 0.24 0.84 0.57 0.75 0.22 1.21 1.11 0.58 0.86 1.74 1.9Germany 0.71 0.47 0.50 0.73 1.40 0.62 1.18 1.27 0.62 0.93 1.64 4.2Greece 0.68 0.00 0.34 0.63 1.25 0.00 1.21 1.69 0.71 0.42 1.63 0.7Hungary 0.50 0.21 0.48 0.56 0.79 0.33 1.32 2.11 0.78 0.94 1.64 4.2Iceland 0.62 0.32 0.00 0.62 1.72 0.77 1.17 1.25 0.80 0.83 1.42 14.0Ireland 0.77 0.22 0.82 0.86 1.20 0.59 1.11 1.52 0.60 0.55 1.46 6.6Italy 0.46 0.20 0.58 0.50 1.21 0.25 1.33 1.17 0.74 0.65 1.87 3.8Luxembourg 0.63 0.00 0.00 1.02 0.00 0.07 1.16 1.84 0.72 0.43 1.21 2.5Netherlands 0.88 0.59 1.62 0.91 1.26 0.77 1.05 1.40 0.83 0.89 1.07 14.9Norway 0.82 0.19 1.21 0.83 1.32 0.74 1.06 1.12 0.81 0.66 1.27 11.7Portugal 0.38 0.11 0.77 0.41 0.59 0.31 1.36 2.24 0.68 0.40 1.85 3.2Spain 0.38 0.22 0.00 0.46 1.08 0.21 1.34 1.37 0.61 0.79 2.10 3.1Sweden 0.92 0.77 0.61 0.93 1.61 0.75 1.03 1.14 0.82 0.76 1.14 18.3United Kingdom 0.71 0.37 0.93 0.69 1.61 0.67 1.11 1.12 0.65 0.73 1.54 14.2
OECD averagee 0.65 0.31 0.66 0.70 1.21 0.46 1.18 1.46 0.74 0.74 1.49 8.8

The Characteristics and Quality of Service Sector Jobs – 121
© OECD 2001
Annex 3.C
This annex describes in more detail how the distributionof employment by wage level was calculated, and gives thesources and definitions for the underlying data. It also containssupplementary tables on the industry and occupational distribu-tion of employment by wage level (corresponding to Table 3.7)and on the employment rate gap by wage level and industrybetween the United States and individual OECD countries(corresponding to Table 3.8 and Chart 3.5).
Methodology
The same methodology was used for all countries for whichthe distribution of employment by wage level was estimated.
First, the same 76 separate industry/occupation cells wereidentified for each country. These cells are based on ISIC andISCO breakdowns at the one-digit level (see Table 3.C.1 fordetails). Some further aggregation of industries and occupationswas required because of the relatively small sample size of theEuropean Community Household Panel (used for EU countries),which meant that hourly earnings could not be calculated forsome industry/occupation cells at the one-digit level.
For the analysis of the growth and distribution of employ-ment by wage level, average hourly earnings were then calcu-lated for each cell using hourly earnings data for each countryfor 1995. The analysis of the employment rate gap between theUnited States and other OECD countries uses the US wagestructure to rank jobs by wage level and so hourly earnings datawere calculated for 1999 for the United States only.
Finally, cells were assigned to one of three groups (lowpaid, medium paid and high paid) of roughly equal size in termsof employment shares. This was carried out by cumulating totalemployment in ascending order from low wage cells to highwage cells. A cell was assigned to a higher broad wage group ifthe difference between the cumulated running total and eitherone- or two-thirds of total employment accounted for more thanhalf of the employment in that cell. Thus, employment at eachbroad wage level corresponds to roughly a third of total employ-ment for the year used to rank cells by their average hourlyearnings, but is greater or less than this in other years.
Sources and definitions
For the total employment data, the sources are the Euro-pean Labour Force Survey for the EU countries (as provided byEurostat), the Current Population Survey for the United States (as
estimated by the OECD based on microdata from the OutgoingRotation Group file) and national labour force surveys for theother countries (as provided by the national authorities). Forsome countries and for some years, either the industry or occu-pation of a relatively small proportion of employed persons wasunknown. In these cases, an iterative procedure was used toassign these persons to an industry/occupation cell based on theproportions of persons in each industry and occupation forwhich this information was known. In the case of Ireland,employment by industry was available for 1999 but not by occu-pation. Therefore, this split was estimated based on theindustry/occupation split in 1997.
For the data on hourly earnings data, the sources are theEuropean Community Household Panel (ECHP) for theEU countries (as estimated by the OECD based on microdata fromthe ECHP), the Current Population Survey for the United States (asestimated by the OECD based on microdata from the OutgoingRotation Group file) and the Swiss Labour Force Survey for Swit-zerland (as provided by the Swiss national statistical office).
For the United States, hourly earnings refer either to hourlyearnings of employees paid by the hour or to usual weekly earn-ings of employees divided by their usual weekly hours of work. Inall cases, the data refer to gross earnings. A number of adjust-ments to the data were made as suggested by Mishel et al. (2001).Individual observations were discarded where hourly earningswere either below $0.5 or above $100 in terms of 1989 CPI-U-X1 dollars and where reported usual weekly hours of work wereoutside of the range 1-99. Earnings were also imputed for therelatively small number of observations affected by top coding.
For the EU countries, hourly earnings refer to net monthlyearnings (net only of social security contributions in the case ofFrance) divided by usual weekly hours of work. In order to par-tially correct for possible spurious earnings observations andbecause of small sample sizes, the earnings data were derived byaveraging across the 1994, 1995 and 1996 waves of the ECHP.The 1994 and 1996 data were deflated to 1995 wage levels bydividing through by the overall growth in average hourlyearnings between these years and 1995.
For Switzerland, hourly earnings are calculated by divid-ing gross annual earnings by 52 and then by usual weekly hoursof work. Individual observations were discarded where hourlyearnings were either below CHF 2 or above CHF 200.
Employment by wage level: sources, methods and supplementary tables

122 – OECD Employment Outlook
1. 1
a) For each country, jobs (i.e. employment in 76 industry/occupation cells) are ranked on the basis of average hourly earnings in 1995 and then placed into three groups ofequal size in terms of employment shares. The data are weighted averages of all EU countries except Luxembourg and Sweden.
Sources: OECD estimates based on data from the European Community Household Panel Survey and the European Labour Force Survey.
Table 3.C.1. Employment shares by wage level in the European Union, 1999a
Percentage of all jobs at each wage level (low/medium/high) in each industry/occupation cell
Industries (ISIC-Rev. 3) Occ
upat
ion
s (I
SCO
-88
code
s)
Man
ager
s an
d pr
ofes
sion
als
(1 +
2)
Tech
nici
ans
and
asso
c. p
rof.
(3)
Cle
rks
(4)
Serv
ice
and
sale
s w
orke
rs (
5)
Cra
ft a
nd tr
ade
wor
kers
(6
+ 7
)
Plan
t and
mac
hine
ope
rato
rs (
8)
Ele
men
tary
occ
upat
ions
(9)
Cle
rks
and
serv
ice
wor
kers
(4
+ 5)
Man
ual w
orke
rs (
6 +
7 +
8 +
9)
Plan
t and
ele
men
tary
(8
+ 9
)
Tota
l
Low-paid jobsAgriculture (A + B) 0.2 0.2 0.3 10.7 11.3Mining and utilities (C + E) 0.0 0.0 0.0 0.0 0.0 0.0Manufacturing (D) 0.0 0.0 0.0 0.8 5.1 0.0 4.4 10.4Construction (F) 0.1 0.4 0.9 0.9 1.7 0.6 4.6Wholesale and retail (G) 0.0 1.9 5.7 14.4 4.0 1.6 2.9 30.6Hotels and restaurants (H) 0.8 0.1 0.2 7.5 1.6 10.2Transport and communications (I) 0.0 0.0 0.1 0.2 0.0 2.7 0.5 3.5Financial intermediation (J) 0.0 0.0 0.0 0.1 0.1Real estate and business activities (K) 0.0 0.0 1.1 0.7 0.3 0.4 3.7 6.1Public administration (L) 0.0 0.0 0.6 0.1 0.3 0.1 1.1 2.1Education (M) 0.0 0.0 0.3 1.2 1.8 3.3Health and social work (N) 0.0 0.0 1.2 4.9 1.5 7.5Community, social and personal (O + P + Q) 0.0 0.7 0.3 4.2 0.6 0.5 3.8 10.2
Total 1.0 3.2 9.5 33.9 11.3 6.2 18.3 0.9 15.7 0.0 100.0
Medium-paid jobsAgriculture (A + B) 0.1 0.0 0.1 2.0 2.3Mining and utilities (C + E) 0.0 0.2 0.4 0.2 0.4 1.2Manufacturing (D) 0.0 0.4 4.1 0.8 15.2 14.1 0.0 34.6Construction (F) 0.0 0.6 13.6 0.6 0.3 0.9 15.9Wholesale and retail (G) 0.0 2.6 1.1 0.5 2.1 0.1 0.1 6.4Hotels and restaurants (H) 0.4 0.1 0.2 0.0 0.1 0.8Transport and communications (I) 0.0 0.0 3.6 0.4 0.5 1.4 0.6 6.4Financial intermediation (J) 0.0 0.0 3.6 0.1 3.7Real estate and business activities (K) 0.0 2.2 3.6 0.1 0.9 0.0 0.0 6.8Public administration (L) 0.0 0.1 2.6 1.8 0.8 0.3 0.7 6.2Education (M) 0.0 1.4 0.8 0.1 0.3 2.5Health and social work (N) 0.0 5.9 1.2 2.7 1.0 10.8Community, social and personal (O + P + Q) 0.0 0.2 1.2 0.1 0.3 0.1 0.5 2.4
Total 0.5 13.6 18.5 6.3 33.7 16.6 2.2 4.8 3.5 0.4 100.0
High-paid jobsAgriculture (A + B) 0.4 0.0 0.0 0.0 0.4Mining and utilities (C + E) 0.5 0.4 0.7 0.3 0.2 2.2Manufacturing (D) 8.0 6.4 1.8 0.0 0.0 0.0 0.0 16.2Construction (F) 2.2 0.2 0.6 0.0 0.0 0.0 3.1Wholesale and retail (G) 8.3 0.8 0.0 0.0 0.0 0.0 0.0 9.1Hotels and restaurants (H) 1.4 0.1 0.0 0.0 0.0 1.5Transport and communications (I) 2.0 1.9 1.3 0.1 0.5 2.1 0.0 8.0Financial intermediation (J) 2.2 2.7 1.3 0.0 6.3Real estate and business activities (K) 8.9 3.1 0.0 0.0 0.0 0.0 0.0 12.0Public administration (L) 4.3 4.4 1.8 1.3 0.1 0.1 0.0 12.1Education (M) 12.6 1.5 0.2 0.0 0.0 14.3Health and social work (N) 6.8 2.8 0.1 0.0 0.0 9.7Community, social and personal (O + P + Q) 3.4 1.3 0.4 0.0 0.0 0.1 0.0 5.1
Total 61.2 25.8 5.5 1.4 1.9 2.3 0.1 1.6 0.0 0.2 100.0

The Characteristics and Quality of Service Sector Jobs – 123
© OECD 2001
1. 1
Notes and sources: See Table 3.C.1.
Table 3.C.2. Location of jobs by wage level in the European Union, 1995Number of countries (out of a maximum of 13) in each industry/occupation cell by wage level
Industries (ISIC-Rev. 3) Occ
upat
ions
(IS
CO
-88
code
s)
Man
ager
s an
d pr
ofes
sion
als
(1 +
2)
Tech
nici
ans
and
asso
c. p
rof.
(3)
Cle
rks
(4)
Serv
ice
and
sale
s w
orke
rs (
5)
Cra
ft a
nd tr
ade
wor
kers
(6
+ 7
)
Plan
t and
mac
hine
ope
rato
rs (
8)
Ele
men
tary
occ
upat
ions
(9)
Cle
rks
and
serv
ice
wor
kers
(4
+ 5)
Man
ual w
orke
rs (
6 +
7 +
8 +
9)
Plan
t and
ele
men
tary
(8+
9)
Tota
l
As
a %
of
max
. pos
sibl
e ca
ses
Low-paid jobsAgriculture (A + B) 3 4 9 12 28 54Mining and utilities (C + E) 0 0 0 0 1 1 2Manufacturing (D) 0 0 1 8 2 0 12 23 25Construction (F) 1 1 2 4 9 5 22 28Wholesale and retail (G) 0 1 8 12 9 10 12 52 57Hotels and restaurants (H) 5 4 8 13 12 42 66Transport and communications (I) 0 0 1 3 1 5 6 16 18Financial intermediation (J) 0 0 5 5 10Real estate and business activities (K) 0 0 4 10 5 6 13 38 42Public administration (L) 0 0 2 1 2 3 6 14 15Education (M) 0 1 3 10 9 23 35Health and social work (N) 0 0 2 9 7 18 28Community, social and personal (O + P + Q) 0 1 2 12 6 6 11 38 42
Total 9 12 31 78 27 34 69 14 45 1 320 32As a per cent of maximum possible cases 5 7 26 67 26 37 76 27 69 8 32
Medium-paid jobsAgriculture (A + B) 4 5 4 1 14 27Mining and utilities (C + E) 0 1 6 5 5 17 26Manufacturing (D) 0 2 10 5 11 13 1 42 46Construction (F) 0 4 9 9 3 8 33 42Wholesale and retail (G) 0 6 5 1 4 3 1 20 22Hotels and restaurants (H) 4 7 4 1 16 25Transport and communications (I) 0 0 6 6 6 6 6 30 33Financial intermediation (J) 0 1 8 5 14 27Real estate and business activities (K) 0 6 9 2 7 3 27 30Public administration (L) 0 2 6 6 9 7 5 35 38Education (M) 0 5 9 3 4 21 32Health and social work (N) 0 7 10 4 6 27 42Community, social and personal (O + P + Q) 0 2 9 1 7 5 2 26 29
Total 8 48 68 28 59 46 18 25 17 5 322 33As a per cent of maximum possible cases 5 28 58 24 57 51 20 48 26 38 33
High-paid jobsAgriculture (A + B) 6 4 0 0 10 19Mining and utilities (C + E) 13 12 7 8 7 47 72Manufacturing (D) 13 11 2 0 0 0 0 26 29Construction (F) 12 8 2 0 1 0 23 29Wholesale and retail (G) 13 6 0 0 0 0 0 19 21Hotels and restaurants (H) 4 2 1 0 0 7 11Transport and communications (I) 13 13 6 4 6 2 1 45 49Financial intermediation (J) 13 12 5 3 33 63Real estate and business activities (K) 13 7 0 1 1 4 26 29Public administration (L) 13 11 5 6 2 3 2 42 46Education (M) 13 7 1 0 0 21 32Health and social work (N) 13 6 1 0 0 20 31Community, social and personal (O + P + Q) 13 10 2 0 0 2 0 27 30
Total 152 109 18 11 18 11 4 13 3 7 346 35As a per cent of maximum possible cases 90 64 15 9 17 12 4 25 5 54 35

124 – OECD Employment Outlook
1. 1
a) Jobs (i.e. employment in 76 industry/occupation cells) are ranked on the basis of average hourly earnings in 1995 and then placed into three groups of equal size in termsof employment shares.
Source: OECD estimates based on data from the Current Population Survey (Outgoing Rotation Group file).
Table 3.C.3. Employment share by wage level in the United States, 1999a
Percentage of all jobs at each wage level (low/medium/high) in each industry/occupation cell
Industries (ISIC-Rev. 3) Occ
upat
ions
(IS
CO
-88
code
s)
Man
ager
s an
d pr
ofes
sion
als
(1 +
2)
Tech
nici
ans
and
asso
c. p
rof.
(3)
Cle
rks
(4)
Serv
ice
and
sale
s w
orke
rs (
5)
Cra
ft a
nd tr
ade
wor
kers
(6
+ 7
)
Plan
t and
mac
hine
ope
rato
rs (
8)
Ele
men
tary
occ
upat
ions
(9)
Cle
rks
and
serv
ice
wor
kers
(4
+ 5)
Man
ual w
orke
rs (
6 +
7 +
8 +
9)
Plan
t and
ele
men
tary
(8
+ 9
)
Tota
l
Low-paid jobsAgriculture (A + B) 0.0 0.2 0.4 6.4 6.9Mining and utilities (C + E) 0.0 0.0 0.0 0.0 0.0 0.0Manufacturing (D) 0.0 0.0 0.0 0.0 0.0 14.8 2.7 17.5Construction (F) 0.0 0.0 0.0 0.0 2.2 0.0 2.2Wholesale and retail (G) 0.0 0.0 9.7 0.0 0.0 3.2 5.1 17.9Hotels and restaurants (H) 0.0 0.0 1.8 11.0 1.8 14.6Transport and communications (I) 0.0 0.0 0.0 0.0 0.0 0.0 0.0 0.0Financial intermediation (J) 0.0 0.0 0.0 0.0 0.0Real estate and business activities (K) 0.0 0.0 5.2 1.8 0.0 1.1 2.5 10.6Public administration (L) 0.0 0.0 0.0 0.0 0.0 0.0 0.0 0.0Education (M) 0.0 0.0 4.0 1.6 2.0 7.6Health and social work (N) 0.0 0.0 4.8 8.6 1.9 15.3Community, social and personal (O + P + Q) 0.0 0.0 4.0 0.0 0.0 0.8 2.6 7.3
Total 0.0 0.2 29.4 22.9 0.0 19.9 15.1 0.4 12.2 0.0 100.0
Medium-paid jobsAgriculture (A + B) 0.0 0.0 0.0 0.0 0.0Mining and utilities (C + E) 0.0 0.0 0.0 0.7 1.0 1.8Manufacturing (D) 0.0 0.0 4.2 0.5 9.6 0.0 0.0 14.3Construction (F) 0.0 0.3 12.5 1.6 0.0 1.0 15.4Wholesale and retail (G) 0.0 3.4 0.0 19.9 5.5 0.0 0.0 28.8Hotels and restaurants (H) 3.9 0.1 0.0 0.0 0.0 4.0Transport and communications (I) 0.0 0.0 3.3 0.0 0.0 5.5 1.3 10.1Financial intermediation (J) 0.0 0.0 6.5 0.2 6.7Real estate and business activities (K) 0.0 0.0 0.0 0.0 2.2 0.0 0.0 2.2Public administration (L) 0.0 0.0 2.4 0.2 0.0 0.1 0.3 3.0Education (M) 0.0 0.4 0.0 0.0 0.0 0.4Health and social work (N) 0.0 3.6 0.0 0.0 0.0 3.6Community, social and personal (O + P + Q) 0.0 0.0 0.0 8.5 1.1 0.0 0.0 9.6
Total 3.9 7.8 9.9 29.2 30.9 7.2 1.6 8.3 0.2 1.0 100.0
High-paid jobsAgriculture (A + B) 0.5 0.0 0.0 0.0 0.5Mining and utilities (C + E) 1.2 0.2 1.4 0.0 0.0 2.8Manufacturing (D) 10.5 3.0 0.0 0.0 0.0 0.0 0.0 13.5Construction (F) 3.2 0.0 0.0 0.0 0.0 0.0 3.2Wholesale and retail (G) 4.5 0.0 0.0 0.0 0.0 0.0 0.0 4.5Hotels and restaurants (H) 0.0 0.0 0.0 0.0 0.0 0.0Transport and communications (I) 3.0 1.2 0.0 0.4 1.9 0.0 0.0 6.6Financial intermediation (J) 4.8 3.1 0.0 0.0 7.9Real estate and business activities (K) 15.1 4.7 0.0 0.0 0.0 0.0 0.0 19.7Public administration (L) 1.7 0.3 0.0 0.0 0.4 0.0 0.0 2.4Education (M) 15.2 0.0 0.0 0.0 0.0 15.2Health and social work (N) 14.1 0.0 0.0 0.0 0.0 14.1Community, social and personal (O + P + Q) 8.7 0.8 0.0 0.0 0.0 0.0 0.0 9.5
Total 82.5 13.4 0.0 0.4 3.7 0.0 0.0 0.0 0.0 0.0 100.0

The Characteristics and Quality of Service Sector Jobs – 125
© OECD 2001
1. 1
Table 3.C.4. Employment rate gap between the United States and other OECD countries by wage level and sector, 1999a
Percentage points
Aus
tral
ia
Aus
tria
Bel
gium
Cze
ch R
epub
lic
Den
mar
k
Fin
land
Fra
nce
Ger
man
y
Gre
ece
Hun
gary
Irel
and
Ital
y
Lux
embo
urg
Net
herl
ands
New
Zea
land
Por
tuga
l
Spa
in
Sw
eden
Swit
zerl
and
Uni
ted
Kin
gdom
Low paid
Goods-producing sector –0.1 –1.3 1.5 –2.9 –1.6 –1.5 –0.1 1.2 –4.9 –0.5 –3.1 –0.1 2.7 2.3 –3.7 –7.7 –1.8 –0.7 0.5 1.7Agriculture (A + B) –1.4 –2.4 0.5 –1.7 –0.6 –2.4 –0.8 0.0 –7.8 –2.0 –3.6 –1.0 0.6 0.7 –3.7 –7.1 –2.0 –0.3 –2.2 0.9Mining and utilities (C + E) . . . . . . . . . . . . . . . . . . . . . . . . . . . . . . . . . . . . . . . .Manufacturing (D) 1.4 0.9 0.6 –1.4 –0.9 0.5 0.2 0.9 2.6 1.2 1.4 0.7 2.0 1.3 0.2 0.1 0.7 –0.9 2.3 0.6Construction (F) 0.0 0.2 0.4 0.1 –0.1 0.3 0.5 0.3 0.3 0.2 –0.8 0.2 0.1 0.4 –0.2 –0.6 –0.4 0.5 0.3 0.1
Service sector 4.9 6.7 9.1 10.6 2.2 8.1 6.7 8.5 10.7 11.4 7.2 11.2 8.2 6.1 6.5 4.9 8.3 1.9 5.6 4.0Wholesale and retail (G) 0.5 1.9 2.5 3.1 2.0 3.5 2.4 2.2 3.2 3.5 2.4 3.3 2.5 1.3 1.4 2.1 2.5 2.6 1.8 1.6Hotels and restaurants (H) 1.5 0.6 2.8 1.8 2.4 1.9 2.4 2.2 1.2 2.4 0.9 2.0 2.1 2.0 1.4 0.9 1.4 2.1 1.8 1.4Transport and communications (I) –0.1 0.0 –0.1 –0.1 –0.2 –0.1 0.1 0.1 0.1 0.0 0.1 0.1 0.0 0.0 –0.9 0.2 0.1 0.0 –0.3 0.0Financial intermediation (J) . . . . . . . . . . . . . . . . . . . . . . . . . . . . . . . . . . . . . . . .Real estate and business activities (K) 0.0 0.2 0.6 0.9 0.2 –0.1 0.1 0.5 1.1 0.9 0.7 0.9 0.5 0.0 0.2 0.6 0.2 0.3 0.2 0.2Public administration (L) . . . . . . . . . . . . . . . . . . . . . . . . . . . . . . . . . . . . . . . .Education (M) 0.7 1.4 1.2 0.8 0.8 0.9 0.8 1.4 1.6 0.7 0.9 1.3 1.5 1.4 1.0 0.4 1.5 0.6 1.2 0.1Health and social work (N) 1.9 1.8 1.4 3.1 –3.5 1.0 0.4 1.5 2.9 2.7 1.9 3.0 1.8 0.5 2.8 1.9 2.6 –4.8 0.5 0.3Community, social and personal (O + P + Q) 0.2 0.6 0.8 0.9 0.5 0.9 0.6 0.7 0.6 1.2 0.4 0.6 –0.2 1.0 0.7 –1.1 0.0 1.1 0.3 0.5
Total 4.8 5.4 10.6 7.6 0.5 6.5 6.7 9.7 5.8 10.9 4.1 11.1 10.9 8.5 2.8 –2.7 6.5 1.2 6.0 5.7
Medium paid
Goods-producing sector –0.3 –5.2 0.4 –7.4 –2.5 –1.4 –0.4 –5.4 –1.4 –3.6 –2.2 –3.0 –0.8 –0.5 –0.5 –9.0 –1.3 –0.1 –4.6 –1.5Agriculture (A + B) . . . . . . . . . . . . . . . . . . . . . . . . . . . . . . . . . . . . . . . .Mining and utilities (C + E) –0.1 0.1 0.2 –0.4 0.2 0.1 0.2 0.1 0.1 –0.3 0.1 0.2 0.2 0.2 0.1 0.2 0.2 0.2 0.2 0.1Manufacturing (D) 0.2 –4.0 –0.3 –5.1 –2.0 –1.7 –0.7 –4.3 –1.7 –4.1 –2.4 –3.4 0.0 –0.7 –0.6 –6.8 –1.1 –0.4 –3.5 –1.4Construction (F) –0.4 –1.3 0.5 –1.9 –0.7 0.1 0.0 –1.3 0.2 0.8 0.1 0.3 –1.0 –0.1 0.0 –2.4 –0.5 0.1 –1.4 –0.2
Service sector –2.9 –2.2 2.0 1.0 –1.8 1.5 –0.1 0.0 3.7 3.7 1.7 1.4 –1.6 –1.3 0.2 3.5 5.3 0.1 –8.7 –0.7Wholesale and retail (G) –0.5 0.5 2.7 1.5 0.7 1.5 2.7 1.3 2.1 1.9 1.4 0.0 2.5 1.2 1.4 1.3 2.3 1.0 –1.5 1.4Hotels and restaurants (H) 0.0 0.2 0.1 0.6 0.5 0.5 0.3 0.4 –0.1 0.7 –0.3 0.9 0.4 0.2 0.0 0.2 0.1 0.7 0.5 0.2Transport and communications (I) –0.5 –1.0 –0.2 –1.1 –0.4 –0.3 0.1 0.2 –0.1 –0.6 –0.5 0.5 –0.3 –0.5 1.1 0.9 0.3 –0.8 –0.6 –0.7Financial intermediation (J) 0.3 –0.5 0.1 1.1 0.6 0.9 0.7 0.2 0.8 1.3 0.1 0.8 –0.9 0.9 0.5 0.9 0.8 1.4 –0.1 0.1Real estate and business activities (K) 0.1 0.6 1.1 1.3 0.9 1.1 0.5 0.7 1.3 1.3 0.3 1.0 1.1 0.3 0.2 1.1 1.2 0.3 –0.4 –0.2Public administration (L) –1.3 –0.9 –2.7 –0.9 –1.2 –0.7 –2.4 –1.0 –1.7 –1.0 –1.1 –2.1 –2.8 –1.2 –1.0 –1.9 –1.2 –0.4 –1.4 –1.6Education (M) –0.1 –0.8 –0.3 –0.6 –0.5 –0.2 –1.2 –0.7 –0.1 –0.3 0.0 –0.2 –0.6 –0.3 –0.8 –0.8 –0.1 –0.6 –1.7 –0.4Health and social work (N) 0.4 –1.6 –0.1 –0.9 –3.6 –1.9 –1.1 –2.0 0.1 –0.7 0.8 –0.6 –1.0 –3.0 0.2 0.4 0.6 –2.1 –3.0 –0.6Community, social and personal (O + P + Q) –1.3 1.2 1.4 0.1 1.3 0.7 0.4 0.9 1.4 1.2 1.1 1.2 0.1 1.0 –1.4 1.2 1.2 0.7 –0.6 1.0
Total –3.2 –7.4 2.4 –6.5 –4.3 0.1 –0.5 –5.4 2.3 0.1 –0.5 –1.5 –2.4 –1.9 –0.3 –5.5 3.9 0.0 –13.3 –2.2

126 – OECD Employment Outlook
1. 1
. . Not applicable (i.e. no broad occupations in the US for the given industry have average earnings at the given wage level).a) For each country, jobs (i.e. employment in 76 industry/occupation cells) are assigned to the same broad wage groups as the equivalent job in the United States. US jobs
are first ranked on the basis of average hourly earnings in 1999 and then placed in one of three wage groups (low, medium, high) of equal size in terms of employmentshares. The data refer to 1998 for Australia, the Czech Republic, Hungary and New Zealand.
Source: OECD estimates based on data from the European Labour Force Survey for the EU countries, the Current Population Survey (Outgoing Rotation Group file) forthe United States and national labour force surveys for the other countries.
Table 3.C.4. Employment rate gap between the United States and other OECD countries by wage level and sector, 1999a (cont.)
Percentage points
Aus
tral
ia
Aus
tria
Bel
gium
Cze
ch R
epub
lic
Den
mar
k
Finl
and
Fran
ce
Ger
man
y
Gre
ece
Hun
gary
Irel
and
Ital
y
Lux
embo
urg
Net
herl
ands
New
Zea
land
Port
ugal
Spai
n
Swed
en
Switz
erla
nd
Uni
ted
Kin
gdom
High paid
Goods-producing sector 2.2 1.4 1.0 –1.5 0.6 –0.5 1.6 –0.1 3.3 1.4 1.2 2.5 2.9 –0.4 1.6 2.1 2.7 0.4 –0.3 –0.4Agriculture (A + B) 0.1 0.0 0.0 –0.1 0.0 0.0 0.1 0.1 0.1 –0.2 0.1 0.0 0.1 –1.0 –0.1 0.0 0.0 0.1 0.0 –0.1Mining and utilities (C + E) 0.2 0.2 0.3 –0.9 0.3 0.3 0.3 0.1 0.2 –0.3 0.4 0.4 0.4 0.4 0.5 0.2 0.4 0.3 0.2 0.3Manufacturing (D) 1.6 0.6 0.3 –0.6 –0.2 –1.0 0.5 –0.6 2.4 1.3 0.7 1.6 2.0 0.1 0.6 1.7 1.8 –0.6 –1.1 –0.6Construction (F) 0.4 0.6 0.4 0.1 0.5 0.2 0.7 0.3 0.6 0.5 0.0 0.5 0.4 0.2 0.5 0.2 0.5 0.6 0.5 0.0
Service sector 3.8 8.0 3.3 8.2 2.9 2.5 8.5 6.9 8.4 10.0 7.4 11.2 3.0 –1.1 1.7 11.5 10.5 3.2 1.4 1.1Wholesale and retail (G) 0.0 –1.0 –1.3 –0.2 –0.9 –0.9 –0.5 –0.2 –2.4 0.2 –0.2 0.9 –0.4 –1.2 –1.7 –1.0 –0.9 –0.2 –0.7 –1.6Hotels and restaurants (H) . . . . . . . . . . . . . . . . . . . . . . . . . . . . . . . . . . . . . . . .Transport and communications (I) 0.2 0.4 –0.2 –0.1 –0.4 –0.4 0.0 0.3 0.5 0.2 0.7 0.6 –0.2 0.2 –0.4 0.6 0.6 0.2 –0.1 0.0Financial intermediation (J) 0.8 1.5 1.1 1.2 0.7 1.5 1.1 1.1 1.5 1.1 1.2 1.2 –1.9 0.1 1.0 1.6 1.5 0.8 –0.4 0.5Real estate and business activities (K) 0.8 3.2 2.6 2.7 0.6 1.2 2.3 2.4 3.3 3.8 2.2 3.1 2.4 –0.3 0.7 3.7 3.6 0.3 0.2 0.6Public administration (L) –0.8 –1.9 –0.9 –1.6 –1.4 –1.1 –1.1 –2.7 –0.4 –1.1 –0.5 –0.6 –1.4 –2.4 –1.6 –0.7 –0.6 –1.5 –1.6 –1.1Education (M) 0.5 1.3 –0.2 1.7 0.4 0.9 2.0 1.9 1.1 1.1 1.1 1.2 1.0 0.1 0.5 2.3 1.6 0.6 1.2 0.6Health and social work (N) 1.3 2.9 0.6 3.0 2.3 0.0 2.9 2.6 2.9 3.1 1.1 2.8 2.7 1.1 2.1 2.9 2.6 1.6 1.9 1.0Community, social and personal (O + P + Q) 0.8 1.5 1.5 1.5 1.5 1.2 1.7 1.4 1.9 1.7 1.8 2.1 0.7 1.2 1.1 2.0 2.0 1.4 0.9 1.0
Total 6.0 9.4 4.3 6.7 3.5 2.0 10.1 6.8 11.7 11.3 8.6 13.7 5.9 –1.4 3.3 13.6 13.2 3.6 1.1 0.7
All wage levels
Goods-producing sector 1.8 –5.1 2.9 –11.9 –3.6 –3.5 1.1 –4.3 –3.0 –2.7 –4.0 –0.5 4.9 1.4 –2.6 –14.5 –0.4 –0.4 –4.5 –0.3Agriculture (A + B) –1.4 –2.4 0.5 –1.8 –0.6 –2.4 –0.6 0.1 –7.7 –2.1 –3.6 –1.0 0.7 –0.4 –3.8 –7.1 –2.0 –0.2 –2.2 0.8Mining and utilities (C + E) 0.1 0.4 0.6 –1.3 0.5 0.4 0.5 0.3 0.3 –0.6 0.5 0.5 0.6 0.7 0.6 0.4 0.6 0.5 0.5 0.4Manufacturing (D) 3.1 –2.6 0.5 –7.1 –3.1 –2.2 0.1 –4.0 3.3 –1.6 –0.2 –1.1 4.0 0.6 0.2 –5.0 1.5 –1.8 –2.3 –1.4Construction (F) 0.0 –0.5 1.4 –1.7 –0.4 0.7 1.2 –0.6 1.1 1.5 –0.7 1.0 –0.5 0.5 0.3 –2.8 –0.4 1.1 –0.6 0.0
Service sector 5.7 12.4 14.4 19.7 3.3 12.1 15.1 15.5 22.8 25.0 16.3 23.8 9.6 3.7 8.5 19.9 24.0 5.2 –1.7 4.5Wholesale and retail (G) 0.0 1.4 3.9 4.4 1.8 4.2 4.5 3.3 2.9 5.6 3.6 4.1 4.6 1.3 1.1 2.5 4.0 3.4 –0.4 1.4Hotels and restaurants (H) 1.6 0.8 2.8 2.4 2.9 2.5 2.7 2.6 1.1 3.0 0.6 2.8 2.5 2.2 1.4 1.0 1.5 2.8 2.3 1.7Transport and communications (I) –0.3 –0.5 –0.5 –1.3 –0.9 –0.8 0.2 0.5 0.5 –0.4 0.3 1.2 –0.5 –0.2 –0.1 1.7 1.1 –0.6 –1.0 –0.7Financial intermediation (J) 1.1 1.0 1.3 2.2 1.3 2.4 1.8 1.3 2.3 2.4 1.2 2.0 –2.8 1.0 1.5 2.5 2.3 2.2 –0.5 0.6Real estate and business activities (K) 0.9 4.0 4.3 4.9 1.7 2.2 3.0 3.6 5.7 6.0 3.1 5.0 4.0 0.0 1.1 5.4 5.0 0.9 0.0 0.6Public administration (L) –2.1 –2.8 –3.5 –2.6 –2.6 –1.8 –3.5 –3.7 –2.1 –2.2 –1.6 –2.8 –4.3 –3.6 –2.6 –2.5 –1.8 –2.0 –2.9 –2.7Education (M) 1.2 2.0 0.7 1.9 0.8 1.7 1.5 2.6 2.6 1.4 2.1 2.3 2.0 1.2 0.7 1.9 3.0 0.6 0.8 0.4Health and social work (N) 3.7 3.1 1.9 5.3 –4.9 –1.0 2.2 2.2 5.9 5.0 3.7 5.2 3.6 –1.4 5.1 5.3 5.8 –5.3 –0.6 0.7Community, social and personal (O + P + Q) –0.3 3.3 3.7 2.5 3.4 2.8 2.7 3.0 3.9 4.1 3.4 3.9 0.6 3.2 0.4 2.1 3.2 3.2 0.6 2.5
Total 7.5 7.4 17.3 7.8 –0.3 8.6 16.2 11.1 19.8 22.3 12.3 23.3 14.5 5.2 5.8 5.4 23.7 4.8 –6.2 4.2

The Characteristics and Quality of Service Sector Jobs – 127
© OECD 2001
BIBLIOGRAPHY
BARDONE, L., GITTLEMAN, M. and KEESE, M. (1998),“Causes and Consequences of Earnings Inequality in OECD Countries”, Lavoro e Relazioni Industriali, No. 2, July-December,pp. 13-58.
BEERS, T. (2000), “Flexible Schedules and Shift Work: Replacing the “9-to-5’ Workday?”, Monthly Labor Review, June, pp. 33-40.
CAMPBELL, I. and BURGESS, J. (2001), “Casual Employment in Australia and Temporary Employment in Europe: Developing a Cross-National Comparison”, Work,Employment and Society, March, pp. 171-184.
CLARK, A. (1997), “Job Satisfaction and Gender: Why are Women so Happy at Work?”, Labour Economics, No. 4, pp. 341-372.
CLARK, A. and OSWALD, A. (1996), “Satisfaction and Comparison Income”, Journal of Public Economics, No. 61, pp. 359-381.
EUROPEAN COMMISSION (2000), Employment in Europe 2000, Brussels.
EUROPEAN FOUNDATION FOR THE IMPROVEMENT OF LIVING AND WORKING CONDITIONS (1997), Second European Survey on Working Conditions, Dublin.
FREEMAN, R. and SCHETTKAT, R. (2001), Differentials in Service Industry Employment Growth: Germany and the US in the Comparable German American StructuralDatabase, Employment and Social Affairs, Employment and European Social Fund, European Commission, Brussels.
GOUX, D. and ZAMORA, P. (2001), “La formation en entreprise continue de se développer”, Insee-Première, No. 759, February.
GUBIAN, A. and PONTHIEUX, S. (2000), “Emplois non qualifiés, emplois à bas salaires et mesures d’allégement du coût du travail”, Premières Synthèses, No. 51.1,December.
ILG, R. (1996), “The Nature of Employment Growth, 1989-95”, Monthly Labor Review, June, pp. 29-36.
ILG, R. and HAUGEN, S (2000), “Earnings and Employment Trends in the 1990s”, Monthly Labor Review, March, pp. 21-33.
JANY-CATRICE, F. and BARET, C. (2001), “L’emploi et les services du commerce du détail en France et aux États-Unis”, Travail et Emploi, No. 85, January, pp. 58-71.
JOINT GOVERNMENTS’ SUBMISSION (2001), Joint Governments’ Submission to the Safety Net Review – Wages, 2000-2001, Commonwealth of Australia, Canberra.
LETOURNEUX, V. (1998), Precarious Employment and Working Conditions in the European Union, European Foundation for the Improvement of Livingand Working Conditions, Dublin.
MEISENHEIMER II, J. (1998), “The Services Industry in the ‘Good’ versus ‘Bad’ Jobs Debate”, Monthly Labor Review, February, pp. 22-47.
MERLLIÉ, D. and PAOLI, P. (2001), Third European Survey on Working Conditions (2000), European Foundation for the Improvement of Living and WorkingConditions, Dublin.
MISHEL, L., BERNSTEIN, J. and SCHMITT, J. (2001), The State of Working America, 2000-01, Cornell University Press, Ithaca, New York.
MURTOUGH, G. and WAITE, M. (2000), The Diversity of Casual Contract Employment, Productivity Commission Staff Research Paper, AusInfo, Canberra.
OECD (1996), Employment Outlook, Paris.
OECD (1997), Employment Outlook, Paris.
OECD (1999) Employment Outlook, Paris.
OECD (2000), Employment Outlook, Paris.

128 – OECD Employment Outlook
PIERCE, B. (1999), “Using the National Compensation Survey to Predict Wage Rates”, Compensation and Working Conditions, Winter, pp. 8-16.
STATISTICS CANADA (1998), Work Arrangements in the 1990s, Analytic Report No. 8, May.