the central role of noise in evaluating interventions that...
TRANSCRIPT

The Central Role of Noise in Evaluating Interventions That UseTest Scores to Rank Schools
By KENNETH Y CHAY PATRICK J MCEWAN AND MIGUEL URQUIOLA
Many programs reward or penalize schools based on studentsrsquo average perfor-mance Mean reversion is a potentially serious hindrance to the evaluation of suchinterventions Chilersquos 900 Schools Program (P-900) allocated resources based oncutoffs in schoolsrsquo mean test scores This paper shows that transitory noise inaverage scores and mean reversion lead conventional estimation approaches tooverstate the impacts of such programs It further shows how a regression-discontinuity design can be used to control for reversion biases It concludes thatP-900 had significant effects on test score gains albeit much smaller than is widelybelieved (JEL C23 C29 I21 I28 I29)
Every state government in the United Stateshas begun to measure student achievement ag-gregate the results and rate the performance ofpublic elementary and secondary schools1 Agrowing number of states further use test-basedrankings to allocate rewards assistance andsanctions to schools2 Not surprisingly there is
considerable interest in the impact of such in-terventions on student test scores3
Thomas J Kane and Douglas O Staiger(2001 2002a) have noted that mean test scoresmay provide a noisy measure of school perfor-mance due to large error variances particularlyamong smaller schools They conclude thatmean test scores from a single year can providea misleading ranking of schools For example aschoolrsquos appearance at the bottom (or top) of aranking may be the result of transitory bad (orgood) luck in the testing year and may not beindicative of the schoolrsquos true performance
This paper examines an important implica-tion of these findings If transitory testing noisedue to luck or sampling variation is mean re-verting then conventional evaluation ap-proaches will yield misleading estimates of theeffect of interventions that use test-based rank-ings to select schools For example supposethat schools with very low mean scores in agiven year are selected to receive an interven-tion (eg assistance or sanctions) If the previ-ous reasoning is correct then the measured poorperformance of such schools is in part a resultof having obtained a strongly negative error inthe program assignment year Unless errors are
Chay Department of Economics University of Cali-fornia Berkeley 549 Evans Hall 3880 Berkeley CA94720 and National Bureau of Economic Research (e-mailkenchayeconberkeleyedu) McEwan Department ofEconomics Wellesley College 106 Central St WellesleyMA 02481 (e-mail pmcewanwellesleyedu) UrquiolaSchool of International and Public Affairs and Departmentof Economics Columbia University 1402B InternationalAffairs Building New York NY 10027 (e-mailmsu2101columbiaedu) For helpful comments we thankMichael Boozer David Card David Figlio SebastianGaliani Hidehiko Ichimura Robert LaLonde Lant Pritch-ett Douglas Staiger and especially Thomas Lemieux andthree anonymous referees We are also grateful to CristianCox and many officials of Chilersquos Ministry of Education forproviding data
1 Under the federal No Child Left Behind Act of 2001 allstates must use test score results to assess whether publicschools are making ldquoadequate yearly progressrdquo (Ronald ASkinner and Lisa N Staresina 2004)
2 As of 2004 16 states used rankings to allocate rewardsto high-performing schools 36 provided assistance to low-performing ones and 27 administered such sanctions asclosure or the withholding of funds to low-performingschools (Skinner and Staresina 2004) Other countries haveexperimented with rewarding schools or teachers based onthe test score performance of students such as Israel (VictorLavy 2002) Kenya (Paul Glewwe et al 2003) Mexico(McEwan and Lucrecia Santibanez 2004) and Chile thesubject of this paper
3 See Eric A Hanushek and Margaret E Raymond(2002) and the citations therein for a recent overview ofthe literature on test-based accountability They note that thenascent literature often focuses on the gaming responses ofschool personnel to the enactment of reforms rather thanthe reformsrsquo impact
1237
perfectly correlated over time one would ex-pect subsequent test scores in such schools torise even in the absence of the interventionThus the measured test score gains from astraightforward difference-in-differences analy-sis will reflect a combination of a true programeffect and spurious mean reversion4 The di-lemma is similar to that observed in evaluationsof training programs in which assignment to theprogram is based on preprogram earnings5
To date the literature has not reached a con-sensus on how severe the biases introduced bymean reversion can be or on how best to ad-dress them We analyze this issue in the contextof P-900 in Chile Beginning in 1990 the pro-gram identified approximately 900 schoolswhich had low mean fourth-grade test scores in1988 In the first three years of the programmdashthe focus of this papermdashprogram participationwas strongly determined by whether a schoolrsquosmean score fell below a cutoff value in itsregion Treated schools received infrastructureimprovements instructional materials teachertraining and tutoring for low-achieving students
We find that transitory noise in averagescores and the resulting mean reversion leadconventional estimation approaches to overstategreatly the positive impact of P-900 For exam-ple difference-in-differences estimates suggestthat P-900 increased 1988ndash1992 test scoregains by 04 to 07 standard deviations yetusing P-900ndashtype assignment rules we cangenerate similar effects during earlier periods inwhich the program was not yet in operation(1984ndash1988) Further schools chosen for P-900exhibit a sharp decline in test scores just beforethe program year which is consistent with anegative shock in average scores in the yearused to assign program participation
To address this problem we implement a
regression-discontinuity approach that exploitsthe discrete relation between program selectionand preprogram test scores We also derive asimple analytical framework for measuring andeliminating the effect of the error variance intest scores on the mean reversion bias We findthat P-900 resulted in no test score gains from1988 to 1990 the first year of its operation butthat it did increase 1988ndash1992 test score gainsby about 02 standard deviations Graphicalanalyses and several robustness checks providecomplementary evidence that comparing thegains of schools just above and just below theassignment cutoff effectively eliminates rever-sion biases Finally the strategies illustratedherein should be applicable whenever tests orother ldquoprescoresrdquomdashin concert with assignmentcutoffsmdashare used to allocate a program
I Background on P-900
In 1990 the Chilean government introducedP-900 a program of four interventions targetedat low-performing publicly funded schools(Juan Eduardo Garcıa-Huidobro 1994 2000Garcıa-Huidobro and Cecilia Jara Bernardot1994)6 First schools received improvements intheir infrastructure such as building repairsSecond schools were given a variety of instruc-tional materials including textbooks for stu-dents in grades one through four smallclassroom libraries cassette recorders and copymachines Third teachers in these grades at-tended weekly training workshops conductedby local supervisors of the Ministry of Educa-tion The workshops were focused on improv-ing pedagogy in the teaching of language andmathematics Fourth the program created after-school tutoring workshops that met twice aweek and were attended by 15 to 20 third andfourth graders who were not performing at
4 For instance Kane and Staiger (2002b) suggest thatmean reversion led North Carolina officials to concludeerroneously that test score gains among low-achievingschools were due to a program of targeted assistance
5 Specifically those enrolled in the training programoften experienced negative labor market shocks right beforeenrollment relative to those who were not enrolled In shortOrley Ashenfelterrsquos ldquodiprdquo is relevant whenever treatmentassignment is based on noisy pretreatment values of theoutcome variables whether these are earnings or test scores(eg Ashenfelter 1978 Ashenfelter and David Card 1985Joshua D Angrist and Alan B Krueger 1999 JamesJ Heckman et al 1999)
6 ldquoLow-performingrdquo was simply defined as the schoolsobtaining the lowest mean performance unadjusted for thecharacteristics of the students that they enroll About 90percent of enrollments in Chile are in public and privateschools that receive voucher-style government subsidiesAll of these institutions were eligible for P-900 ldquoEliterdquoprivate schools which charge tuition and do not receivepublic subsidies account for the remaining 10 percent ofenrollment These were not eligible for the program Fordetails on Chilersquos system of school finance see McEwanand Martin Carnoy (2000) and Chang-Tai Hsieh andUrquiola (2003)
1238 THE AMERICAN ECONOMIC REVIEW SEPTEMBER 2005
grade level Each workshop was guided by twotrained aides recruited from graduates of localsecondary schools
The first two years of the program (1990 and1991) focused on the provision of infrastructureand instructional materials (Garcıa-Huidobro2000) In 1992 the program expanded to in-clude in-service training and after-school work-shops Several program officials including anearly administrator indicated to us that the in-service training and after-school workshopsconstituted the bulk of effort and expenditureFurther all treated schools apparently receivedthe interventions with roughly the same inten-sity Unfortunately there is no administrativerecord of what each school received and there-fore we cannot identify separately the contri-bution of each component of the interventionWe therefore treat P-900 as a ldquoblack boxrdquo andestimate the combined impact of its components
In addition to the effects of resource invest-ments the program may have affected schoolsin other ways First teachers and administratorsmight have raised their effort levels in responseto the identification of their schools as poorlyperforming especially given that governmentofficials openly described the program as ldquoin-tensive carerdquo (Cristian Cox 1997) It is alsopossible that they reduced effort in the hope ofreceiving additional resources from the pro-gram Second P-900 may have encouraged thechildren of some households to exit or enter thetreated schools One might expect the former ifparents interpreted program selection as a signalthat the institution was not adequately servingtheir children The latter could result if theythought their children could benefit from addi-tional resources
The programrsquos initial assignment occurred intwo stages (Garcıa-Huidobro and Jara Bernar-dot 1994 Garcıa-Huidobro 2000) The firstrelied on achievement tests administered to thepopulation of fourth graders in 19887 Officialsof the Ministry of Education calculated eachschoolrsquos mean in language mathematics and
the combination of both subjects These scoreswere ordered from highest to lowest within eachof Chilersquos 13 administrative regions Separatecutoff scores were established for each regionand schools below their regionrsquos cutoff werepreselected to participate It bears emphasis thatthe 1988 scores were collected under a differentgovernment (before the return of democraticelections) at which time P-900 was not evencontemplated It is therefore not plausible thatschools sought to manipulate their performancein 1988 in order to qualify for the program in1990
In the second stage regional teams of offi-cials reviewed each list and some preselectedschools were removed from eligibility The de-cisions were apparently based on two criteriaFirst very small or inaccessible schools did notparticipate in order to reduce program costs andalso because another program (MECE-Rural)would eventually be created for them Secondschools were excluded if they demonstratedmanagerial problems such as private voucherschools which misreported their enrollments anoffense subject to legal penalties Finally thereis the possibility that regional teams introducedunobserved criteria for school eligibilitySchools themselves however appear to havehad little scope to refuse the program in partbecause all costs were covered by the nationalgovernment
In the past P-900 has been lauded as a suc-cess and the previous literature reflects a wide-spread perception that it substantially raised theachievement of treated schools8 The empiricalbasis of this perception can be easily replicatedSuppose that we observe the mean fourth-gradeachievement of each school at two differentpoints in time We can assess whether meanachievement increases more among P-900schools than among untreated schools using adifference-in-differences framework
(1) yj yj90 yj
88
P900j j90 j
88
where yjt is the average score across fourth7 The test scores were collected as part of the SIMCE
(Sistema de Medicion de la Calidad de la Educacion) andincluded both public and private schools In practice someschools were excluded from the testing because of theirextremely low enrollments In total the excluded schoolsaccounted for no more than 10 percent of total enrollmentand they were not eligible for P-900
8 See for example Garcıa-Huidobro (1994) Garcıa-Huidobro (2000) Alan Angell (1996) Marcela Gajardo(1999) World Bank (1999) and Andrea Tokman (2002)
1239VOL 95 NO 4 CHAY ET AL THE CENTRAL ROLE OF NOISE
graders in school j at time t yj is the change inthe mean from 1988 to 1990 (hereafter the ldquogainscorerdquo) P900j is a dummy variable equal to oneif the school received the treatment and j
t arethe unobserved school-level factors at time tThe parameter of interest is which measuresthe gain for treated schools relative to untreatedschools
Table 1 reports descriptive statistics forfourth-grade language and mathematics gainscores in 1988ndash1990 and 1988ndash19929 Note
that the 1988 combined mean scores were usedto assign the program and that this assignmentremained in force through 1992 Further 1990was the first full year of treatment with all testsadministered at the end of the respective schoolyears Using these data to estimate (1) yieldslarge and statistically significant estimates of For example the 1988 to 1990 gain scoresimply program effects that are equivalent to030 and 049 standard deviations in math andlanguage respectively For 1988 to 1992 gainscores the implied P-900 effects are 045 and068 standard deviations respectively10 Thusit is not surprising that many observers have9 Test score data are available after 1992 but we do not
use them for three reasons First the program selection rulesbecame increasingly nebulous Some schools were removedfrom the treatment group and they were replaced by othersThe selection of these schools apparently relied more on thesubjective opinions of ministry personnel and less on a strictassignment rule Second the Ministry of Education initiateda large reform of primary schools with World Banksupportmdashthe MECE program The program started on asmall scale in 1992 but rapidly expanded during the nextsix years to the universe of publicly funded schools It is notknown whether the program was more or less likely to betargeted at P-900 schools Third we presume that schools
became increasingly aware of P-900 selection rules and mayhave sought to obtain low scores in order to participateundermining the application of the regression-discontinuitydesign
10 These estimates are from the full sample of schoolsThe subsequent regression-discontinuity estimates will relyupon a smaller subsample of urban schools with largerenrollments
TABLE 1mdashDESCRIPTIVE STATISTICS
1988ndash1990 Sample 1988ndash1992 Sample
AllNonndashP-900 P-900 All
NonndashP-900 P-900
Math score 1988 489 509 406 498 524 406(102) (101) (50) (97) (91) (50)
Language score 1988 507 530 410 521 552 411(119) (118) (65) (114) (106) (64)
Math gain score 1988ndash1990 60 54 84(99) (101) (89)
Language gain score 1988ndash1990 50 41 88(95) (94) (89)
Math gain score 1988ndash1992 134 124 167(96) (92) (100)
Language gain score 1988ndash1992 114 101 162(90) (85) (91)
P-900 019 022Urban 059 062 050 069 074 0514th-grade enrollment (median) 30 31 29 38 41 29
(25-tile 75-tile) [15 63] [13 68] [20 48] [21 70] [21 78] [21 49]SES index 1990 548 577 427 597 644 429
(295) (301) (233) (278) (272) (229)SES index 1992 443 494 263
(303) (300) (239)Sample size 4628 3741 887 3878 3016 862
Notes Standard deviations are in parentheses Test scores are expressed as the percentage of items correct P-900 is a dummyvariable indicating program treatment Urban is a dummy variable indicating urban (versus rural) location 4th-gradeenrollment reports the number of fourth-graders who took the SIMCE test in 1988 and whose scores comprise theschool-level average The SES index measures student socioeconomic status (SES) as reported by the Junta Nacional deAuxilio Escolar y Becas (JUNAEB) It is scaled 0ndash100 with higher values indicating higher SES
1240 THE AMERICAN ECONOMIC REVIEW SEPTEMBER 2005
concluded that the P-900 program has been oneof the most successful schooling interventionsin the developing world
II Evaluation Problems due to Testing Noise
For these estimates to have a causal interpre-tation it must be the case that the differences inthe gain scores of treated and untreated schoolsare entirely due to the program In this sectionwe argue that mean reversionmdashthe outgrowthof imprecisely measured mean test scoresmdashcauses this condition to be violated Further it isa plausible explanation for the large effectsfound in previous evaluations We derive a sim-ple analytical framework to illustrate the role oftesting noise in mean reversion bias
Figure 1 (panel A) presents a stylized versionof the actual assignment rule It plots the aver-
age score of each school in the year used todetermine school rankings (referred to as ldquopre-scorerdquo) on the x-axis and the treatment status ofthe school assuming a value of 0 or 1 on they-axis The prescore ranges from 0 to 100 andwe arbitrarily choose 50 as the program cutoffThat is all schools with prescores of 50 or lessare treated and the rest are not
Panel B illustrates a visual analogue of thecase in which the difference-in-differences es-timate may be unbiased The y-axis and x-axisdisplay the post-program gain score and theprescore respectively Here the vertical dis-tance between the two line segments is theadded gain among P-900 schoolsmdashie thetreatment effect A causal interpretation of theeffect may be justified since prescores and gainscores are not otherwise related
If on the contrary schools with lower
FIGURE 1 HYPOTHETICAL PROGRAM ASSIGNMENT AND EFFECTS ON TEST SCORES
1241VOL 95 NO 4 CHAY ET AL THE CENTRAL ROLE OF NOISE
prescores have higher gain scores even in theabsence of P-900 the situation might resem-ble panel C where there is no programeffectmdashthat is there is no break in the rela-tion between the gain score and the prescoreclose to the assignment cutoff Neverthelessa regression specification like (1) will errone-ously suggest a positive treatment effect byfitting a difference in means without allowingfor mean reversion
Why might schools with lower prescoreshave higher gain scores The answer is rootedin noisy measures of schoolsrsquo mean test scores(Kane and Staiger 2001) First there may beone-time events that influence test scores suchas a school-wide illness or distraction from con-struction noise in the schoolrsquos vicinity Secondthere is sampling variation in test scores sinceeach cohort of students that enters a school isanalogous to a random draw from a local pop-ulation Thus a schoolrsquos mean test score willvary with the specific group of students startingschool in any given year This variance in turndepends on two factors the variability of per-formance in the population from which theschool draws its students and the number of
students in the grade tested We cannot directlyassess the first of these but we can verify theimplication that scores should be more variablein schools with lower enrollments
Figure 2 (panel A) plots each schoolrsquos av-erage 1988 language score against its fourth-grade enrollment in 1988 It reveals that meanperformance is substantially more variableamong smaller schools Similarly panel Bplots 1988 ndash1990 language gain scores againstcombined enrollment in 1988 and 1990 Itshows a strong negative relationship betweenschool-level variation in gain scores and schoolenrollments
Of critical importance is the fact that extremescores in 1988 occur among schools with lowerenrollments (eg fewer than 30 students in thefourth grade) This suggests that some schoolsobtained very low scores in 1988 and thereforequalified for P-900 simply because they expe-rienced an ldquounluckyrdquo circumstance or a baddraw of fourth-grade students that year Sincethey are unlikely on average to experience abad draw again in 1990 or 1992 their averageachievement will tend to risemdashie they willrevert toward the meanmdasheven in the absence of
FIGURE 2 AVERAGE SCORES GAIN SCORES AND ENROLLMENT
Notes All panels use the full sample of schools The lines in panels A C and D arenonparametric predictions from an unweighted local linear regression smoother with band-widths of 01 The lines in panel B are the estimated first and ninety-ninth percentiles of1988ndash1990 language gain scores (see text for details)
1242 THE AMERICAN ECONOMIC REVIEW SEPTEMBER 2005
P-900 Thus mean reversion poses a seriouschallenge to any evaluation of such a program11
More formally consider a simple model forindividual fourth-grade test scores in 1988 and1990
(2) yij88 j uj
88 i88
(3) yij90 j uj
90 i90
where i indexes students and j indexes schoolsj is a school-level permanent effect on studentscores uj
t is a school-level transitory shock(eg construction noise) in year t and i
t isstudent irsquos ldquotest-takingrdquo ability in fourth-gradecohort t We assume that j uj
t and it are
independent of each other We further assumethat i
88 and i90 are independent which is plau-
sible since students in each year are drawn fromdifferent cohorts Suppose further that uj
88 anduj
90 are independent and that jDiid(0
2)uj
Diid(0 u2) i
Diid(0 2)12
In this scenario the average test scores at theschool level in 1988 and 1990 have the form
(4) yj88 j uj
88 i j
1
Nj88 i
88
(5) yj90 j uj
90 i j
1
Nj90 i
90
and it follows that the variance of the 1988 to1990 school gain score is
(6) Var(yj90 yj
88) 2u2
2Nj88 Nj
90
Nj88Nj
90
Thus the variation in gain scores acrossschools is a function of the variance in thetransitory school-level shock (u
2) the variancein individual testing abilities (
2) and the en-rollment sizes in the two years (Nj
88 and Nj90)
Although we do not have student-level testingdata equation (6) implies that one can estimatethe student testing variance by regressing thesample variances of 1988ndash1990 gain scoresamong schools with the exact same number ofstudents in 1988 and 1990 on a constant and[(Nj
88 Nj90)Nj
88Nj90]13 The estimated constant
(multiplied by 05) provides an estimate of thevariance of the transitory school effect u
2 andthe estimated slope coefficient provides an es-timate of the variance of the student effects
2Implementing this regression with 1988ndash
1990 language gain scores yields an estimate(and sampling error) of u
2 equal to 147 (26)and an estimate of
2 equal to 5865 (548)14
To gauge the reliability of these estimates Fig-ure 2 (panel B) plots the first and ninety-ninthpercentiles of 1988ndash1990 language gain scoresimplied by the estimates of u
2 and 2 further
assuming that ujt and i
t are normally distrib-uted15 The implied 1-to-99 interval fits the ac-tual school-level variation in gain scores quitewell First it emulates the decreasing variationas total enrollment increasesmdashparticularly theldquofunnelingrdquo effect at total enrollments below150 In addition only 24 percent of the schoolobservations lie outside the interval which isclose to the 2 percent predicted by the normalityassumption16
11 While noise in the treatment selection variable (due toluck or sampling variation) leads to some ldquorandomizationrdquoin the treatment assignment this will still result in meanreversion bias if the noise is transitory and the selectionvariable is equal to previous values of the outcome variableThus our context for applying the regression-discontinuitydesign differs substantially from the static cross-sectionalcase in which the selection variable is not the outcomevariable
12 The independence of uj88 and uj
90 may be viewed as astrict assumption since it stipulates that school-level shocksdie out within two years which may not be true if the shockis a severe natural disaster or a regime change at the school(eg a new administration) In addition the independenceof the three variance components will be violated if forexample better schools attract more or different studentsThese possibilities do not detract from the expositionalusefulness of the model Further below we estimate modelsthat do not rely on these restrictions with virtually nochange in the estimated effects of P-900
13 In other words individual-level variances have impli-cations for the variance in average scores across schoolswith the same number of students in 1988 and 1990 Un-fortunately student-level data are not available for theseyears
14 For 1988ndash1990 mathematics gain scores the estimateof u
2 is 126 (28) and the estimate of 2 is 7260 (589)
15 Thus the ninety-ninth and first percentiles are equal to 1(099) 2u
2 2[(Nj
88 Nj90)Nj
88Nj90] where
1 is the inverse of the standard normal cumulative dis-tribution function and is the average 1988ndash1990 languagegain score
16 Further 92 percent of the observations lie outside theimplied 5-to-95 percentile interval and 472 percent lieoutside the implied 25-to-75 interquartile rangemdashboth closeto the 10 and 50 percent implied by normality
1243VOL 95 NO 4 CHAY ET AL THE CENTRAL ROLE OF NOISE
Using this framework one can describe howmean reversion potentially introduces bias indifference-in-differences estimates of the P-900effects Recall that such bias arises from a re-lation between 1988 test scores which are usedto determine selection into the program and testscore gains Consider the ldquoregressionrdquo coeffi-cient relating the 1988ndash1990 gain score to the1988 average score
(7) Covyj
90 yj88 yj
88
Varyj88
Covyj
88 yj90
Varyj88
1
2
2 u
2
2
Nj88
1
This slope coefficient would prevail even in theabsence of the P-900 intervention It clarifiesthree scenarios under which mean reversionmay or may not bias the results
First the slope coefficient is zero (and meanreversion is absent) if variance in test scores is dueentirely to permanent differences across schools(
2) If this unlikely circumstance prevails thenthe difference-in-differences estimate will beunbiased (as illustrated in Figure 1 panel B)
Second the slope coefficient becomes nega-tive and approaches 1 as (a) the variance dueto student heterogeneity (
2) and the variancedue to school-level transitory shocks (u
2) in-crease and (b) as the number of students en-rolled in a school (Nj
88) gets small If all schoolshave the same enrollment then the (negative)slope coefficient is the same for all schoolsThis form of mean reversion is illustrated by thestraight lines in Figure 1 (panels C and D) Theassumption of identical enrollments across allschools conflicts however with the data
Third the slope coefficient will vary acrossschools to the extent that they enroll differentnumbers of students In particular the coeffi-cient will be more negative for smaller schoolsFigure 2 (panel A) already illustrated thatsmaller schools were more likely to obtain verylow average scores in 1988 and were thereforemore likely to qualify for the program To fur-ther illustrate this point Figure 2 (panel C) plots
nonparametric predicted values of schoolsrsquo1988 enrollment against their 1988 averagescore and shows that schools with extremescores (particularly low ones) tend to have smallenrollments This is consistent with the meanreversion illustrated in panels E and F of Fig-ure 1 Specifically since the schools in the tailsof the 1988 test score distribution are on aver-age smaller than the schools in the middle ofthe distribution the mean reversion pattern willhave a cubic polynomial shape with steepernegative slopes at very low and very high 1988scores Figure 2 (panel D) shows the nonpara-metric fit of the 1988ndash1990 language gain scoreas a function of the 1988 test score selectionvariable (from a local linear regression smoother)The estimated conditional mean has slightlysteeper slopes at very low and high scoresconsistent with a cubic polynomial shape
III Regression-Discontinuity Approaches toMean Reversion
The discrete nature of the program selectionrule facilitates a quasi-experimental regression-discontinuity (henceforth RD) design to controlfor mean reversion biases17 We illustrate severalapproaches that produce consistent estimates ofthe treatment effect as long as the reversion bias isldquosmoothrdquo at the regional test score cutoff deter-mining selection into the P-900 intervention
Building upon equation (1) the goal is toeliminate sources of correlation between P900jand (j
90 j88) such as mean reversion First
we can use equations (4) and (5) to rewrite (1)
(8) yj90 yj
88
P900j uj90
i j
1
Nj90 i
90 uj
88 i j
1
Nj88 i
88 and
17 For a history and overview of the RD approach seeDonald T Campbell and Julian C Stanley (1963) and espe-cially William R Shadish et al (2002) The RD design hasrecently been used to explore a range of issues in the econom-ics of education (Angrist and Lavy 1999 Jonathan Guryan2001 Brian A Jacob and Lars Lefgren 2004a b Kane2003 Wilbert van der Klaauw 2002 Urquiola forthcoming)
1244 THE AMERICAN ECONOMIC REVIEW SEPTEMBER 2005
(9) P900j 1yj88 y
1j uj88
i j
1
Nj88 i
88 ywhere 1 is an indicator function that isequal to one if the enclosed statement istrue and y is the cutoff for P-900 eligibil-ity in the schoolrsquos region As long as uj
t
and it are nontrivial and transitory and
school enrollments are finite there will bea positive correlation between P900j and(j
90 j88)
The key to addressing this problem is tonote that P-900 assignment is a discrete func-tion of 1988 average test scores This impliesthat one can control for ldquosmoothrdquo functions of1988 scores to control for mean reversion biaswhile still estimating the P-900 effect Aslong as the chosen function of 1988 scoresabsorbs the reversion bias the resulting esti-mates will be consistent The previous discus-sion suggests three candidates for controlfunctions The first is simply a linear term in1988 average scores
(10) yj P900j 1yj88 j
which is sufficient if the mean reversion func-tion is linear as illustrated in panels C and D ofFigure 1
Second we anticipate that the mean re-version function may have a cubic polyno-mial shape since smaller schools are morelikely to have scores in the tails of the testscore distribution Thus one can directly ad-just for a cubic polynomial in 1988 averagescores
(11) yj P900j
1yj88 2yj
882 3yj
883 j
This specification will control for mean rever-sion patterns such as those in panels E and F ofFigure 1
A third approach is to adjust for the meanreversion pattern implied by the model
(12) yj P900j
2
2 u
2
2
Nj88
1 yj88 j
This allows the intensity of mean reversion tovary with schoolsrsquo enrollments It can be esti-mated via nonlinear least squares18 It is possi-ble that the ldquocontrol functionrdquo in (12) ismisspecified in its arguments Nj
88 and yj88 due
to violations of the underlying assumptions ofthe model Thus we also estimate specificationsin which Nj
88 yj88 and their interaction enter
flexibly into the regression model to gauge therobustness of the findings from estimating equa-tion (12)
A stricter approach is to estimate the regres-sion for the subsample of schools within arbi-trarily narrow bands close to the cutoff point y(eg Angist and Lavy 1999 van der Klaauw2002) If other factors affecting gain scores aresimilar for schools just above and below thecutoff then comparing the gain scores in treatedand untreated schools with prescores close tothe cutoffs will control for all omitted factorscorrelated with being selected for P-900 includ-ing the intensity of mean reversion Under thisassumption discrete differences in mean gainscores between treated and untreated schoolsclose to the cutoff can be attributed to P-900 InFigure 1 panels D and F depict a stylized ver-sion of this situation where the treatment effectis identified as the break in the relation betweenthe gain and the prescore close to the disconti-nuity Below we also adjust for a cubic poly-nomial in 1988 scores even when focusing onnarrow subsamples of schools
Before proceeding two further empiricalchallenges must be addressed selection andsorting The selection issue arises because theprogramrsquos initial allocationmdashbased on a strictassignment rulemdashwas occasionally subverted
18 Note that equation (12) cannot be used to estimate thestudent-level variance (
2) thus we restrict its value to theestimate obtained from equation (6) when we apply nonlin-ear least squares We also restrict the school-level transitoryvariance (u
2) to be equal to the estimates obtained fromequation (6) although this is not necessary In less restric-tive regression results not reported here the estimates of u
2
are similar to those obtained from (6)
1245VOL 95 NO 4 CHAY ET AL THE CENTRAL ROLE OF NOISE
when administrators removed some schoolsfrom program participation19 This raises thepossibility that assignment is correlated withunobserved determinants of achievement Wecarry out three exercises to address this issue
First we repeat the previous analysis whileexcluding Region 13 (the ldquoMetropolitan Re-gionrdquo composed primarily of Santiago) fromthe sample This is the region in which admin-istrators seem to have exercised the most dis-cretion by far20
Second we apply an instrumental variables(IV) approach that uses the indicator function 1yj
88 y) as an instrument for P-900 statusEven if P900j is correlated with j because ofselection one can still obtain consistent esti-mates of by instrumenting P900j with theindicator for initial program eligibility (equal toone if a school falls below the regional cutoff)In this case the first stage and reduced-formequations of the two-stage least squares estima-tor are
(13) P900j 130 131 ELIGIBLEj 132yj88
133yj882
134yj883
vj and
(14) yj 0 1 ELIGIBLEj 2yj88
3yj882
4yj883
j where
ELIGIBLEj 1yj88 y
1j uj88
ij
1
Nj88 i
88 y and
131 provides an estimate of the discrete jump inthe probability of treatment for schools belowthe cutoff 1 is the discrete difference in test
gain scores between schools below and abovethe cutoff The instrumental variable estimate isequal to 1131
Third we apply an entirely different identi-fication strategy facilitated by the variation incutoff scores across Chilersquos 13 regions21 In-stead of comparing treated and untreatedschools close to cutoffs within regions we com-pare treated and untreated schools across re-gions with the same prescores
In addition to selection sorting poses a prob-lem because it is possible that families re-sponded to P-900 by withdrawing or enrollingtheir children in treated schools potentially al-tering the distribution of observed and unob-served student attributes across treated anduntreated schools A straightforward way ofaddressing sorting (as well as selection) is toinclude controls for schoolsrsquo observable socio-economic status (SES) in the specificationsabove
IV Program Assignment
The first stage of program assignment reliedon the combined mean of 1988 fourth-grade testscores in concert with assignment cutoffs thatwere specific to each of Chilersquos 13 regions Toillustrate this Figure 3 reports data for Region 9in the south of Chile In panel A each dotrepresents a school ordered on the basis of its1988 average score (on the x-axis) On the y-axis a ldquoonerdquo indicates a school that received theP-900 treatment while a ldquozerordquo indicates un-treated schools The figure highlights two im-portant features of program assignment
First assignment did not rely exclusively on1988 test scores because there are treated anduntreated schools with similar 1988 test scoresparticularly in the left side of the distributionThis is consistent with official accounts of theassignment process that were discussed in aprevious section Regional teams from the Min-istry of Education excluded some preselectedschools particularly if these were small andrural In light of this panel B restricts attentionto urban schools with 15 or more students in the
19 Thus the P-900 program is closer to the ldquofuzzyrdquo RDdesign that is described by Shadish et al (2002)
20 In previous work we excluded a larger subset ofregions including Region 13 and were left with a sample inwhich the selection rule correctly assigned at least 95 per-cent of schools to their treated or untreated status (Chay etal 2003) This yields a similar pattern of results In fact theMetropolitan Region by virtue of its size accounts for thevast majority of misassigned schools (ie those whereadministrators exercised discretion by ignoring the initialselection)
21 John H Tyler et al (2000) use a similar approach intheir analysis of the General Education Development (GED)test
1246 THE AMERICAN ECONOMIC REVIEW SEPTEMBER 2005
fourth grade (henceforth referred to as urbanlarger schools)22 There is evidently a discretechange in the probability of treatment in Region9 among these schools providing a good settingfor an RD analysis Of course this judgmentmust be made separately for each of Chilersquos 13regions
Second the exact regional cutoffs are notobserved Panel A assumes that the cutoff islocated at the rounded-up integer of the highest1988 test score observed among treated schools(56 in Region 9) We refer to this as ldquocutoffdefinition 1rdquo This definition is accurate if ad-ministrators only remove schools from the treat-ment that fall below the initial cutoff consistentwith published accounts However panel Bmakes it clear that administrators may have alsoadded schools to the treatment with 1988 test
scores above the cutoff In the case of Region 9(see panel B) there is one such school in thesubsample of urban larger schools In such acase ldquocutoff definition 1rdquo will yield cutoffs thatare too high
To further explore this issue Table 2 sum-marizes the data from each of Chilersquos 13 re-gions23 Columns 1 and 2 of the table presentsample sizesmdashboth the total and that whichremains after restricting attention to urbanlarger schools Column 3 contains ldquocutoff def-inition 1rdquo Columns 4 and 5 present the percent-age of schools that are classified correctly usingthis definitionmdashie a school with an average1988 score below (above) the cutoff actually
22 Varying the 15-student threshold somewhat does notaffect the conclusions reached below
23 With the exception of Region 13 (comprised mostly ofSantiago) the regionsrsquo numbers correspond to a north-to-south geographic order Thus Region 1 is the northernmostarea of Chile Region 12 is the southernmost area andRegion 13 is located just south of Region 5
FIGURE 3 PROGRAM ALLOCATION IN VARIOUS REGIONS
Notes Panel A includes all schools in Region 9 Panel B includes urban larger schools (iethose with fourth-grade enrollments of 15 or more) in Region 9 Panel C includes urban largerschools in all regions (1 to 13) while Panel D excludes Region 13 Each dot in panels A andB represents a school In panel A the vertical line is at the rounded-up value of the highestscore for a school receiving P-900 in Region 9 (ldquocutoff definition 1rdquo in Table 2) In Panel Bthe vertical line is at the 1988 average score of 474 (ldquocutoff definition 2rdquo as discussed in thetext and featured in Table 2) In panels C and D solid lines are nonparametric predictionsfrom an unweighted uniform kernel smoother with bandwidths of 005 Dotted lines are OLSpredictions from a regression of the P-900 indicator variable on an indicator equal to one ifthe school scored below cutoff definition 2 in 1988
1247VOL 95 NO 4 CHAY ET AL THE CENTRAL ROLE OF NOISE
received (did not receive) the treatment Asexpected the cutoffs perform better in the ur-ban larger school sample where four regionshave correct classification rates above 90 per-cent In contrast Region 13 has by far theworst rate of correct assignment (only 32 per-cent) and conditioning on urban larger schoolshas little effect on this rate24 In addition na-tionwide only 59 percent of the schools arecorrectly classified
The visual evidence from Region 9 (and otherregions) suggests that the true cutoff falls below afew outlying high scores among the schools in-volved in P-900 The issue can be formalized asthe problem of determining the breakpoint for aregression-discontinuity design when the truebreakpoint is not known In another paper (Chayet al 2005) we propose an approach for deter-mining the breakpoints in such data The approachsets the break for P-900 eligibility at the score thatmaximizes the goodness-of-fit from a model ofP-900 participation as a function of an indicator
equal to one if the schoolrsquos score is below aparticular threshold25 This simplifies to choosingas the cutoff the 1988 average score that maxi-mizes the estimated difference in the probabilityof P-900 selection between schools just below andabove the cutoff
These scores are shown in column 6 and werefer to them as ldquocutoff definition 2rdquo26 Theresults for this second definition are presented incolumns 7 and 8 In the urban larger schoolsample at least 90 percent of schools are clas-sified correctly in 9 regions and this figure is 85percent or more in the remaining 4 regionsNationwide approximately 92 percent of theurban larger schools are correctly classified as
24 This is to be expected since Region 13 composedmainly of metropolitan Santiago contains very few smalleror rural institutions
25 We thank an anonymous referee for suggesting thisexercise Also see Kane (2003)
26 In an earlier draft of this paper (Chay et al 2003) weused the rounded-up integer of the ninety-fifth percentilescore among P-900 schools in each region as cutoff defini-tion 2 In Chay et al (2005) we find that the ldquooptimalrdquoregional cutoffs are the previous cutoffs minus 06 pointsUsing the previous definition leads to very similar findingsto those presented in this paper In addition we get similarfindings when we allow the optimal breakpoints to be dif-ferent distances from the ninety-fifth-percentile score indifferent clusters of regions (see Chay et al 2005)
TABLE 2mdashP-900 CUTOFF DEFINITIONS SAMPLE SIZES AND PERCENTAGE CORRECTLY CLASSIFIED BY REGION
Region
Number of schools
Cutoff definition 1 Cutoff definition 2
Percent correctlyclassified
Percent correctlyclassified
Allschools
(1)
Urban largerschools
(2)
Cutoffscore(3)
Allschools
(4)
Urban largerschools
(5)
Cutoffscore(6)
Allschools
(7)
Urban largerschools
(8)
1 65 49 52 892 1000 514 877 9802 76 70 50 842 914 494 842 9143 59 47 52 831 957 514 831 9574 266 95 55 530 874 514 613 9475 493 333 53 647 745 494 787 8986 373 124 49 550 758 434 818 9767 494 157 48 575 796 424 775 9758 768 377 52 536 695 434 773 9719 359 202 56 551 693 474 755 98010 487 173 59 427 572 494 661 91311 20 16 53 850 875 524 850 87512 37 28 53 919 929 524 892 89313 1131 973 61 318 320 464 844 864Total 4628 2644 508 590 778 916
Notes Definition 1 places the cutoff at the rounded-up value of the highest (average) score observed among all treated schoolsin the entire region Definition 2 defines the cutoff value as the score that maximizes the percentage of schools correctlyclassified across all 13 regions (ie the rounded-up integer of the 95-percentile score in each region minus 06 points see textfor details) Urban larger schools are those the Ministry of Education classifies as urban and which have enrollments of atleast 15 students in the fourth grade
1248 THE AMERICAN ECONOMIC REVIEW SEPTEMBER 2005
being in or out of P-900 As mentioned aboveadministrators in Region 13 exercised the mostdiscretion in removing ldquoeligiblerdquo schools fromthe program When this region is excluded fromthe sample ldquocutoff definition 2rdquo correctly clas-sifies the P-900 status of 95 percent of all urbanlarger schools in Chile
Figure 3 (panel C) describes the result of thisexercise for the nationwide sample of urbanlarger schools In order to pool the data acrossregions we create a variable that indicates eachschoolrsquos score relative to its respective regionalcutoff This simplifies the presentation of theresults and will eventually facilitate the estima-tion of an average nationwide P-900 effect Thefigure plots unweighted smoothed values of theproportion of schools treated with respect totheir distance from their respective regional cut-off score As expected there are sharp changesin the probability of treatment close to the cut-
off an essential component of the RD approachPanel C also plots fitted values of a regressionof P-900 on eligibility (essentially the ldquofirststagerdquo described in equation (13) but withoutadditional controls) It shows that probability oftreatment is 067 higher among eligible schools
Finally panel D presents the same informa-tion but excluding Region 13 from the sampleAs expected the changes in the probability oftreatment are even more pronounced and theprobability of treatment is 082 higher amongeligible schools
V Results
A simple difference-in-differences analysissuggests that P-900 had a substantial effect onfourth-grade gain scores Columns 1 and 6 inTable 3 illustrate this for math and languagerespectively The coefficients on the treatment
TABLE 3mdashP-900 EFFECTS ON 1988ndash1990 AND 1988ndash1992 MATH AND LANGUAGE GAIN SCORES
1988ndash1990 Gain score 1988ndash1992 Gain score
(1) (2) (3) (4) (5) (6) (7) (8) (9) (10)
Panel A MathematicsP-900 228 002 011 016 025 374 161 148 179 209
(040) (047) (046) (051) (053) (044) (050) (048) (056) (060)
Score relative to cutoff016 015(002) (002)
2 14232 14165
(1836) (3401)SES index 1990 015 018
(001) (001)Change in SES
1990ndash1992007
(001)Cubic in 1988 score N N N Y Y N N Y Y YRegion dummies N N N N Y N N N N YAdjusted-R2 0013 0041 0046 0041 0130 0031 0053 0060 0053 0140Sample size 2644 2644 2644 2644 2644 2591 2591 2591 2591 2591
Panel B LanguageP-900 425 025 018 002 054 594 224 209 167 210
(039) (044) (041) (048) (049) (039) (044) (043) (048) (052)
Score relative to cutoff028 026(002) (002)
2 6879 6232
(555) (1121)SES index 1990 013 016
(001) (001)Change in SES
1990ndash1992007
(001)Cubic in 1988 score N N N Y Y N N Y Y YRegion dummies N N N N Y N N N N YAdjusted-R2 0050 0147 0151 0155 0230 0089 0163 0175 0173 0250Sample size 2644 2644 2644 2644 2644 2591 2591 2591 2591 2591
Notes The sample includes urban schools with 15 or more students in the fourth grade in 1988 Huber-White standard errors are in parenthesesColumns 3 and 8 present the results from nonlinear least squares applied to the model described in the text
Significantly different from 0 at the 10-percent level Significantly different from 0 at the 5-percent level Significantly different from 0 at the 1-percent level
1249VOL 95 NO 4 CHAY ET AL THE CENTRAL ROLE OF NOISE
dummy are always statistically significant andsubstantial For 1988ndash1990 gain scores the ef-fects are equivalent to 023 and 045 standarddeviations of the math and language test scoredistributions respectively For 1988ndash1992 gainscores the effect sizes are equal to 039 and 066standard deviations of the respective distribution
A Evidence on Mean Reversion
If test scores are indeed a noisy measure ofperformance however then a portion of theseestimates is likely due to mean reversion Fur-ther if this is the case we should find ldquoP-900effectsrdquo even in periods in which no programexisted To verify this we drew on test scorescollected in 198427 As a first exercise we iden-tified a sample of 1546 schools with scoresavailable in 1984 and 1988 To maintain com-
parability with other estimates we restricted thesample to include urban schools with 15 ormore students in the fourth grade We thenranked schools according to their 1984 averagescore and roughly simulating the actual P-900selection rule designated the lowest 20 percentas ldquotreatedrdquo Of course P-900 did not exist inthis period and there were no similar schemesUnless driven by mean reversion the fictitioustreatment should yield no effect In fact esti-mating (1) with 1984ndash1988 math gain scoresyields an estimate for of 40 somewhat largerthan that for 1988ndash1992 This suggests thatmean reversion is indeed a primary concern inevaluating this type of program
To provide additional time series evidence onthis issue Figure 4 uses 1534 schools with testscores in 1984 1988 1990 and 1992 (againlimiting the sample to urban larger schools)Panels A and B show the annual mean score ofP-900 and nonndashP-900 schools respectively28
27 These test scores were collected under a differentsystem the PER (Programa de Evaluacion de Rendimiento)and were applied to a smaller sample of schools No test scoreswere collected in the years between 1984 and 1988
28 Test scores within each year are standardized to amean of 50 and a standard deviation of 10
FIGURE 4 MEAN LANGUAGE SCORES 1984ndash1992
Notes The figures use Programa de Evaluacion de Rendimiento (PER) data for 1984 andSIMCE data for 1988 1990 and 1992 (see text for details) All panels use the sample of urbanschools that have at least 15 students and were tested in each year (N 1534) The test scoresin panels A and B are standardized to a mean of 50 and standard deviation of 10 In panel Cthe top line refers to schools that had 1988 prescores within 2 points of their regional cutoff(N 236) The next line refers to schools which had prescores within 5 points of theirregional cutoff (N 534) The final line refers to the full sample (N 1534)
1250 THE AMERICAN ECONOMIC REVIEW SEPTEMBER 2005
The key observation is that scores for treatedschools display a ldquodiprdquo in 1988 A plausibleinterpretation is that many schools experiencedtransitory negative shocks in 1988 leadingthem to be selected By 1990 mean reversionreturned their scores close to their 1984 levelsImportantly the opposite story can be told ofpanel B where untreated schools experience aslight upward ldquobouncerdquo in 1988 This is consis-tent with positive shocks that are followed bymean reversion Nonetheless the bounce is lesspronounced in panel B because the untreatedschools are drawn from a less extreme part ofthe 1988 test score distribution
In short mean reversion appears to pose asubstantial challenge to the evaluation of pro-grams like P-900 The remainder of the paperaddresses this challenge with an RD design Itrelies upon the expectation that we shouldobserve fewer fluctuations like those in panelsA and B (Figure 4) among schools close toregional cutoff scores Panel C illustrates thisby presenting the mean difference in testscores between P-900 and untreated schoolsfor three sets of schools all schools (thebottom line) and those within 5 and 2 pointsof their respective regional cutoffs (the linesin the middle and at the top of the figurerespectively)
In 1984 the difference between treated anduntreated schools in the full sample was equal toabout 10 points In 1988 the year of assign-ment it increased to almost 15 By 1990 how-ever the difference was again almost exactlyequal to 10 points But the raw differences aresmaller when the sample is restricted to schoolsthat are close to their regional cutoffs and thedips are much less pronounced This is consis-tent with this difference being less influenced byunusually high or low scores that noise wouldinduce in the extremes of the distribution Itsuggests that an RD approach can be a valu-able way of addressing the problem of meanreversion
Finally we note that Figure 4 foreshadowssome results in the next section Panels A andC suggest that treated schools experiencedtransitory shocks in 1988 and that by 1990they had returned to their previous perfor-mance In both cases however slight im-provements are visible by 1992 implying thatthe program may have had a real effect onachievement
B Regression-Discontinuity Results
Panels A through D in Figure 5 plot un-weighted smoothed values of schoolsrsquo gainscores against their 1988 prescores (relative totheir respective regional cutoff) distinguishingbetween P-900 and untreated schools There is anegative relation between gain scores and 1988scores which is consistent with substantialmean reversion29 Further the pattern of meanreversion is reminiscent of Figure 1 (panel E) inthat it is generally more intense for schools wellbelow the cutoffmdashalthough the same does nothold for those with extremely high scores Thispartially reflects the fact that the RD sampledoes not include schools with extremely lowfourth-grade enrollments ie below 15 students
To the extent that P-900 had an effect weshould observe a break in these relationshipsclose to the cutoff (one analogous to that inFigure 1 panels D and F) The graphs for1988ndash1990 gain scores (Figure 5 panels A andB) suggest no such break the P-900 and nonndashP-900 lines essentially overlap at the cutoffNevertheless a ldquonaiverdquo evaluation would sug-gest that P-900 had a large effect in its first yearPanels C and D which refer to 1988ndash1992 gainscores present a different picture Here a breakis visible and is equal to roughly 2 points30
The regression results are consistent with thevisual evidence Table 3 adds increasingly flexiblespecifications of the 1988 average score to controlfor mean reversion as well as SES controls andregional fixed effects31 When columns 2 and 7
29 In both periods the average gains are substantial andfew schools had negative gain scores This is consistent withanecdotal evidence indicating that the tests became some-what less difficult over time It could also be evidence thatschools are ldquoteaching to the testrdquo
30 In fact two types of breaks are visible in thesefiguresmdashthose at the cutoff and those for treated and un-treated schools with overlapping 1988 scores (our initialregression evidence will capture both)mdashand their magni-tude is generally similar This reflects the fact that theassignment discontinuities (Figure 3) are imperfect leadingto ldquofuzzinessrdquo across the cutoff score In view of this themost unrestricted graphical representation of the effects isobtained by calculating smoothed values separately for theP-900 and untreated schools as we do in Figure 5
31 In other regressions not reported we also include flex-ible specifications of the 1988 language or mathematics scorecorresponding to the dependent variable These did not yieldsubstantively different results For a subset of these schools wecan further include a polynomial of 1984 test scores We omit
1251VOL 95 NO 4 CHAY ET AL THE CENTRAL ROLE OF NOISE
include controls for schoolsrsquo 1988 score (relativeto their regional cutoff) the P-900 coefficients fallsubstantially particularly for 1988ndash1990 gainscores (in which case they are essentially zero)Columns 3 and 8 estimate equation (12) via non-linear least squares restricting the student-levelvariance to be equal to the estimates from theprevious section The coefficient estimates for theP-900 indicator are comparable These specifica-tions also yield estimates of
2 which we returnto in the conclusion
The next two specifications include a cubic inthe 1988 score with some small changes in theP-900 coefficients Finally columns 5 and 10attempt to control for selection and sorting byincluding controls for SES as well as regionaldummies This leads to slight increases in theP-900 coefficients (less than half a point) Over-all the P-900 coefficientsrsquo magnitude is consis-tent with no effect for 1988ndash1990 gain scoresand an effect of about 2 points for 1988ndash1992gain scores32
these specifications because they reduce the sample size whilenot substantively affecting any of the conclusions below
32 As discussed above we also estimated models thatallow 1988 average scores and school enrollment to enter
FIGURE 5 GAIN SCORES BY 1988 AVERAGE SCORE RELATIVE TO THE REGIONAL CUTOFF
Notes The sample includes urban schools with fourth-grade enrollments of 15 or morePanels A to D include all regions while panels E and F exclude Region 13 The figures plotnonparametric predictions from an unweighted uniform kernel smoother The bandwidths are03 for the P-900 schools and 01 for the nontreated schools which reflects the fact that thereare over three times as many observations in the nontreated category
1252 THE AMERICAN ECONOMIC REVIEW SEPTEMBER 2005
This conclusion holds even when we limit thesample to schools that fall within increasinglynarrow bands near the cutoff point for eachregion Table 4 presents the results from suchregressions for the 1988ndash1992 gain scores (Weomit similar estimates for 1988ndash1990 gainssince they simply reaffirm the finding of noeffect) Here again there are statistically sig-nificant effects close to two points for bothlanguage and mathematics for the subsamplesof schools within 5 3 and 2 points of theregional cutoffs
To summarize we find no evidence thatP-900 had produced a positive effect by 1990but we do find effects on 1988ndash1992 gainscores of approximately two points roughlyequal to 02 standard deviations What couldaccount for the lack of an effect on 1988ndash1990gain scores The 1990 cohort of fourth-gradersin P-900 schools participated for a single year(the 1990 test was administered toward the endof the school year) Thus one possibility is thata single year of exposure was insufficient toaffect achievement Another possibility is thatthe programmdashas it was implementedmdashwas dif-ferent in 1990 (recall that fewer program ele-ments were available in the first year)Regarding the positive effects in 1988ndash1992gain scores one interpretation is that scoresincrease by a small amount for each year ofexposure to P-900 (ie 007 standard devia-tions)33 Another is that the effect was obtained
more flexibly into the regression specification than in equa-tion (11) Specifically we included a cubic in scores aquadratic in enrollments and the interaction of scores withenrollments (we also estimated more flexible specificationswith no substantive change in the results) Table A1 avail-able in the Web Appendix presents the results Columns 2and 6 show that as predicted by the model school enroll-ments are a significant predictor of test score gains condi-tional on 1988 scores The other columns show that theestimates of the P-900 effect are not sensitive to moreflexible specifications of the ldquocontrol functionrdquo Furthermodels that include school sizes fit the data better than themodel that includes only a cubic in 1988 test scores iethat have higher adjusted R2rsquos
33 One might also ask whether test score gains are jus-tified by program costs An early cost analysis of the pro-gram estimated an annualized cost of $26 per student in1992 which is 11 percent of the typical school-wide costper student (Claudia R Peirano and Robert W McMeekin
TABLE 4mdashP-900 EFFECTS ON 1988ndash1992 GAIN SCORES WITHIN NARROW BANDS OF THE SELECTION THRESHOLD
5 Points 3 Points 2 Points
(1) (2) (3) (4) (5) (6)
Panel A MathematicsP-900 150 182 179 200 237 239
(060) (066) (073) (077) (084) (085)SES index 1990 014 013 012
(002) (003) (003)Change in SES 1990ndash1992 008 009 006
(002) (002) (002)Cubic in 1988 score N Y N Y N YR2 0007 0067 0011 0074 0021 0080Sample size 883 883 553 553 363 363
Panel B LanguageP-900 278 223 210 196 262 248
(054) (057) (069) (070) (080) (075)SES index 1990 013 012 012
(002) (003) (003)Change in SES 1990ndash1992 007 009 006
(002) (002) (002)Cubic in 1988 score N Y N Y N YR2 0030 0111 0017 0101 0029 0111Sample size 883 883 553 553 363 363
Notes The sample includes urban schools with 15 or more students in the fourth grade in 1988 Huber-White standard errorsare in parentheses
Significantly different from 0 at the 10-percent level Significantly different from 0 at the 5-percent level Significantly different from 0 at the 1-percent level
1253VOL 95 NO 4 CHAY ET AL THE CENTRAL ROLE OF NOISE
in a single grade but this cannot be determinedfrom the data
C Robustness
For a first robustness check we restricted thesample by excluding Region 13 the one withthe most evidence of administrative discretionin P-900 selection Panels E and F in Fig-ure 5 present the graphical evidence for thissubsample with similar breaks evident in the
vicinity of the cutoff The regression results(available in Table A2 in the Web Appendixhttpwwwe-aerorgdatasept05_app_mcewanpdf) are statistically significant and generally closeto those in Tables 3 and 4 despite the reducedsample sizes
As a second check we instrument for P-900status using the indicator of program eligibilityin equations (13) and (14) Table 5 (panel A)presents the first-stage regression results AsFigure 3 (panels C and D) had already suggestedeligible schoolsmdashie those falling below the cut-offmdashhave a substantially higher probability ofbeing treated This finding is robust to the inclu-sion of a cubic in 1988 scores as well as othercontrols In the subsamples that exclude Region13 (columns 5 and 6) the eligibility coefficient is
1994) Whether the program is cost-effective can be deter-mined only by obtaining cost-effectiveness ratios for otherprogramsmdashinformation that is not available
TABLE 5mdashFIRST-STAGE REDUCED-FORM AND IV RESULTS FOR 1988ndash1992 GAIN SCORES USING ELIGIBILITY FOR P-900 AS
AN INSTRUMENT
(1) (2) (3) (4) (5) (6)
Panel A First-stage estimates (P-900)Eligible 067 060 054 053 073 071
(002) (002) (003) (004) (003) (004)R2 0556 0562 0579 0408 0722 0606
Panel B Reduced-form estimates (mathematics)Eligible 347 116 136 146 144 135
(038) (049) (058) (067) (069) (077)R2 0034 0052 0113 0063 0142 0074
Panel C Reduced-form estimates (language)Eligible 589 212 127 162 166 190
(034) (043) (051) (060) (061) (070)R2 0109 0162 0232 0103 0262 0129
Panel D IV estimates (mathematics)P-900 519 193 251 275 196 191
(058) (081) (107) (123) (093) (109)
Panel E IV estimates (language)P-900 882 353 235 304 227 269
(053) (072) (093) (111) (083) (099)
Notes on all panelsLinear selection term N Y Y Y Y YCubic in 1988 score N N Y Y Y YSES controls N N Y Y Y YWithin 5 points N N N Y N YExcluding Region 13 N N N N Y YSample size 2591 2591 2591 883 1640 569
Notes The sample includes urban schools with 15 or more students in the fourth grade in 1988 Huber-White standard errorsare in parentheses The eligible variable is an indicator equal to one if the school has a 1988 average test score below cutoffdefinition 2 and equal to zero otherwise In panels D and E eligible is used as an instrumental variable for school participationin P-900
Significantly different from 0 at the 10-percent level Significantly different from 0 at the 5-percent level Significantly different from 0 at the 1-percent level
1254 THE AMERICAN ECONOMIC REVIEW SEPTEMBER 2005
even larger All regressions explain a large pro-portion of the variance in treatment status
Panels B and C contain the estimates of thereduced-form model in which math and lan-guage gains are regressed on the indicator ofP-900 eligibility The eligibility coefficient isanalogous to the intent-to-treat estimator in arandomized experiment The coefficients are al-ways positive and significant at conventionallevels The simple difference-in-differences es-timates for the impact of eligibility in column 1are similar in magnitude to the difference-in-differences estimates of the P-900 effects inTable 3 This highlights that even if one has avalid instrument for a program like P-900mdasheg the case where pure ldquonoiserdquo causes schoolsto be under or over the cutoffsmdashmean reversionmay still bias the IV estimates of the programeffects on test score gains34
The IV estimates reported in panels D and Eof Table 5 are simply the ratio of the reduced-form coefficients to the corresponding first-stage coefficients They provide estimates of theeffect of the treatment on the treated They arenaturally somewhat larger than the reduced-form estimates They are also similar in magni-tude to the OLS estimates of the program effectsshown in the preceding tables suggesting thatunobservable selection may not be an importantsource of bias35
For a third robustness check the data permitan entirely different identification strategy fa-cilitated by regional variation in cutoffs Insteadof comparing treated and untreated schoolswithin regions on either side of prescore cutoffswe can compare treated and untreated schoolswith similar prescores across regions As anexample consider the sample of schools withmean 1988 scores that are greater than 494 andless than or equal to 514 In Regions 1 3 4 11and 12 these schools are below the correspond-ing regional cutoff (and subject to the treat-ment) In contrast schools in regions 2 5 to 10and 13 are above the corresponding regionalcutoff (and not subject to the treatment) Hencethey can serve as a counterfactual This assumesthat the effect of the treatment does not varyacross regions and that the choice of cutoffacross regions is exogenous36
Table A4 (available in the Web Appendix)focuses on 1988ndash1992 test score gains andsummarizes the results for five feasible ldquoexper-imentsrdquo each conducted within successiveranges of 1988 scores The point estimates aremore variable but are generally positive andconsistent with the estimates found earlier (withthe exception of panel B) In fact estimatesfrom the pooled sample that controls for intervaldummy variables in panel F yield results quiteclose to those observed above (about 2 points in
34 This point is illustrated in panels A and B of Figure A1(in the Web Appendix) for the 1988ndash1992 gain scores Thedotted lines plot the fitted values of a regression of theaverage gain score on only an eligibility dummy (drawnfrom column 1 in Table 5) The solid lines plot those froma regression on the same dummy and the 1988 score (rela-tive to the regional cutoff) thereby introducing the simplestcontrol for mean reversion (see column 2 in Table 5) Theestimated break at the cutoff is substantially smaller in thelatter case Panels C and D in Figure A1 (available in theWeb Appendix) plot nonparametric predictions separatelyfor the samples of eligible and ineligible schools Theyshow a clear break in 1988ndash1992 test score gains for eligi-ble versus ineligible schools near the regional cutoffs
35 The results in Table 3 suggest that selection and sort-ing (on observed SES) lead to small downward biases inestimates of the program effect To examine this furtherTable A3 (available in the Web Appendix) reports resultsfrom regressions of the 1990 and 1992 SES indices on theindicator variables for P-900 treatment and for P-900 eligi-bility for various samples For the full sample of schoolscolumn 1 in panels A and B shows that treated schools havemuch lower average SES than untreated schools Althoughthe difference is greatly reduced by controlling for a cubicin 1988 average scores (ie the control function) and by
focusing on the subsamples of schools near the regionalcutoffs (columns 2 to 6) it is still statistically significantWhile the findings imply a small role for sorting (eg thecoefficients on the P-900 indicator are similar for the 1990and 1992 SES regressions) they are consistent with thepossibility that the schools scoring below the regional cutoffwhich were removed from the P-900 program list hadhigher average SES than the eligible schools which were notremoved Columns 7 to 12 in panels A and B report theresults from the same exercise in a sample that excludesRegion 13 The estimated P-900 coefficient is much smallerand statistically insignificant after controlling for a cubic in1988 scores Panels C and D report the results from speci-fications in which the dependent variable is the indicator forprogram eligibility (ie whether a school falls below theregional cutoff) In all samples there is no relationshipbetween eligibility and SES after controlling for a cubic in1988 scores This suggests that the estimates in Table A3and in Table 5 may be purged of the potential selectionbiases in the OLS estimates in Table 3
36 We have little direct evidence on how regional cutoffswere chosen For example they do not simply reflect thefact that the twentieth percentile within each region variesindeed different proportions of schools appear to have beentreated across regions
1255VOL 95 NO 4 CHAY ET AL THE CENTRAL ROLE OF NOISE
gain scores) In addition the estimates are ro-bust to the inclusion of additional controls for1988 test scores suggesting that limiting thesample to narrow ranges of initial test scoresremoves a substantial amount of the reversionbias
As a final check on mean reversion we em-ployed 1988 and 1992 data to create two ficti-tious programs ldquoP-450rdquo and ldquoReverse P-900rdquo37
The first is obtained by selecting the bottom 10percent of schools as opposed to the bottom 20percent that was roughly applied in the case ofP-900 ldquoReverse P-900rdquo in turn selects the top20 percent of performers in 1988 The expecta-tion given our claims about mean reversion isthat in simple difference-in-differences specifi-cations ldquoP-450rdquo should produce estimateslarger than those for P-900 while ldquoReverseP-900rdquo should yield estimates of a negativesign and perhaps similar in magnitude Furtherin regressions that control for a cubic in 1988scores and use subsamples of schools withinnarrow bands around the fictitious cutoffs theseeffects should be diminished or disappear en-tirely Table A5 in the Web Appendix confirmsthese expectations using the full sample ofschools38
VI Conclusion
In the perpetual search for policies to im-prove education quality many governmentshave turned to interventions that use test-basedschool rankings to allocate resources rewardsor sanctions Not surprisingly there is a grow-ing demand for knowledge on the effect of theseinterventions This paper has shown that noiseand the consequent mean reversion produce im-portant complications in the evaluation of suchschemes The use of intuitively appealing eval-
uation strategies like difference-in-differencescan lead to dramatically biased estimates of theprogram effects
That is certainly the case in previous evalu-ations of Chilersquos P-900 program Our resultssuggest that a regression-discontinuity method-ology can potentially circumvent this problemIn the case of P-900 it reveals that the pro-gramrsquos effects while positive are much smallerthan the previous estimates Just as importantthe issues our findings raise are germane tothe ongoing evaluation of similar programsmdashincluding many statesrsquo educational accountabil-ity reformsmdashthat assign treatments on the basisof high or low prescore measures To the extentthat assignment is based on strict cutoffs themethods used in this paper are a useful means ofaddressing potential biases
The results also suggest that noise might limitthe ability of student testing to identify ldquobadrdquo orldquogoodrdquo schools Employing the estimates of u
2
2 and 2 in this paper it is straightforward to
calculate the percentage of variance in 1988scores that is due to transitory rather than per-manent components For a school with the me-dian fourth-grade enrollment of 30 students 33percent and 21 percent of the variance in lan-guage and math scores respectively are due totransitory testing noise For a school with thetwenty-fifth-percentile enrollment of 15 thecorresponding percentages are higher (44 and30 percent) Thus many smaller schools wereeligible for the P-900 program due to transitorynegative shocks to their average test scores in1988 This finding is especially relevant for theP-900 program since it had a compensatoryintent the government desired to improve thelowest achieving schools thereby aiding low-income children who presumably dispropor-tionately populate such institutions Our resultssuggest that the achievement of this goal washampered by school-level sampling variation intest scores
REFERENCES
Angell Alan ldquoImproving the Quality and Equityof Education in Chile The Programa 900Escuelas and the MECE-Basicardquo in AntoniaSilva ed Implementing policy innovationsin Latin America Politics economics andtechniques Washington DC Inter-AmericanDevelopment Bank 1996 pp 94ndash119
37 We are indebted to a referee and seminar participantsfor suggesting this analysis
38 The simple difference-in-differences specifications incolumn 1 suggest strongly positive effects for P-450(slightly larger than a corresponding estimate of 734 forP-900 in the same sample) The effect for ldquoReverse P-900rdquois comparable in magnitude but of the opposite sign Col-umns 2 and 3 repeat these analyses with additional controlsand within narrow bands The ldquoprogramrdquo effects disappearand are statistically insignificant as one would anticipateFor reasons of space we present results for 1988ndash1992language scores Those from other subjectyear combina-tions yield similar conclusions
1256 THE AMERICAN ECONOMIC REVIEW SEPTEMBER 2005
Angrist Joshua D and Krueger Alan B ldquoEmpir-ical Strategies in Labor Economicsrdquo in OrleyC Ashenfelter and David Card eds Hand-book of labor economics Vol 3A Amster-dam Elsevier Science North-Holland 1999pp 1277ndash1366
Angrist Joshua D and Lavy Victor ldquoUsing Mai-monidesrsquo Rule to Estimate the Effect of ClassSize on Scholastic Achievementrdquo QuarterlyJournal of Economics 1999 114(2) pp533ndash75
Ashenfelter Orley C ldquoEstimating the Effect ofTraining Programs on Earningsrdquo Review ofEconomics and Statistics 1978 6(1) pp 47ndash57
Ashenfelter Orley C and Card David ldquoUsingthe Longitudinal Structure of Earnings to Es-timate the Effect of Training Programsrdquo Re-view of Economics and Statistics 198567(4) pp 648ndash60
Campbell Donald T and Stanley Julian C Ex-perimental and quasi-experimental designsfor research Boston Houghton Mifflin1963
Chay Kenneth Y McEwan Patrick J andUrquiola Miguel ldquoThe Central Role of Noisein Evaluating Interventions That Use TestScores to Rank Schoolsrdquo National Bureau ofEconomic Research Inc NBER Working Pa-pers No 10118 2003
Chay Kenneth Y McEwan Patrick J andUrquiola Miguel ldquoImplementing the Regres-sion Discontinuity Design When the BreakPoint Is Unknown Evidence from a School-ing Intervention in Chilerdquo Unpublished Pa-per 2005
Cox Cristian La reforma de la educacion chil-ena Contexto contenidos implementacion(The reform of Chilean education Contextcontents implementation) Documentos DeTrabajo 8 Santiago PREAL 1997
Gajardo Marcela Reformas educativas enAmerica Latina Balance de una decadaDocumentos de Trabajo 15 SantiagoPREAL 1999
Garcıa-Huidobro Juan Eduardo ldquoPositive Dis-crimination in Education Its Justification anda Chilean Examplerdquo International Review ofEducation 1994 40(3ndash5) pp 209ndash21
Garcıa-Huidobro Juan Eduardo ldquoEducationalPolicies and Equity in Chilerdquo in FernandoReimers ed Unequal schools unequalchances The challenges to equal opportunity
in the Americas Cambridge MA HarvardUniversity Press 2000 pp 161ndash78
Garcıa-Huidobro Juan Eduardo and Jara Ber-nardot Cecilia ldquoEl Programa de las 900Escuelasrdquo in Marcela Gajardo ed Coopera-cion internacional y desarrollo de la educa-cion Santiago Agencia de CooperacionInternacional 1994 pp 39ndash72
Glewwe Paul Ilias Nauman and Kremer Mi-chael ldquoTeacher Incentivesrdquo National Bureauof Economic Research Inc NBER WorkingPapers No 9671 2003
Guryan Jonathan ldquoDoes Money MatterRegression-Discontinuity Estimates fromEducation Finance Reform in Massachu-settsrdquo National Bureau of Economic Re-search Inc NBER Working Papers No8269 2001
Hanushek Eric A and Raymond Margaret EldquoImproving Educational Quality How Bestto Evaluate Our Schoolsrdquo in Yolanda KKodrzycki ed Education in the 21st cen-tury Meeting the challenges of a changingworld Boston Federal Reserve Bank of Bos-ton 2002 pp 193ndash236
Heckman James J Lalonde Robert J andSmith Jeffrey A ldquoThe Economics and Econo-metrics of Active Labor Market Programsrdquoin Orley Ashenfelter and David Card edsHandbook of labor economics Vol 3A Am-sterdam Elsevier Science North-Holland1999 pp 1865ndash2097
Hsieh Chang-Tai and Urquiola Miguel ldquoWhenSchools Compete How Do They CompeteAn Assessment of Chilersquos NationwideSchool Voucher Programrdquo National Bureauof Economic Research Inc NBER WorkingPapers No 10008 2003
Jacob Brian A and Lefgren Lars ldquoThe Impact ofTeacher Training on Student AchievementQuasi-Experimental Evidence from School Re-form Efforts in Chicagordquo Journal of HumanResources 2004a 39(1) pp 50ndash79
Jacob Brian A and Lefgren Lars ldquoRemedialEducation and Student Achievement A Re-gression-Discontinuity Analysisrdquo Review ofEconomics and Statistics 2004b 86(1) pp226ndash44
Kane Thomas J ldquoA Quasi-Experimental Esti-mate of the Impact of Financial Aid on Col-lege-Goingrdquo National Bureau of EconomicResearch Inc NBER Working Papers No9703 2003
1257VOL 95 NO 4 CHAY ET AL THE CENTRAL ROLE OF NOISE
Kane Thomas J and Staiger Douglas O ldquoIm-proving School Accountability MeasuresrdquoNational Bureau of Economic Research IncNBER Working Papers No 8156 2001
Kane Thomas J and Staiger Douglas O ldquoThePromise and Pitfalls of Using ImpreciseSchool Accountability Measuresrdquo Journal ofEconomic Perspectives 2002a 16(4) pp91ndash114
Kane Thomas J and Staiger Douglas O ldquoVola-tility in Test Scores Implications for Test-Based Accountability Systemsrdquo in DianeRavitch ed Brookings papers on educationpolicy Washington DC Brookings Institu-tion Press 2002b pp 235ndash83
Lavy Victor ldquoEvaluating the Effect of Teach-ersrsquo Group Performance Incentives on PupilAchievementrdquo Journal of Political Econ-omy 2002 110(6) pp 1286ndash1317
McEwan Patrick J and Carnoy Martin ldquoTheEffectiveness and Efficiency of PrivateSchools in Chilersquos Voucher Systemrdquo Educa-tional Evaluation and Policy Analysis 200022(3) pp 213ndash39
McEwan Patrick J and Santibanez LucrecialdquoTeacher Incentives and Student Achieve-ment Evidence from a Large-Scale Reformin Mexicordquo Unpublished Paper 2004
Peirano Claudia R and McMeekin Robert WldquoGastos y costos del programa de las 900Escuelas en el perıodo enero 1990-junio1993rdquo in Marcela Gajardo ed Cooperacion
internacional y desarrollo de la educacionSantiago Agencia de Cooperacion Interna-tional 1994 pp 73ndash97
Shadish William R Cook Thomas D andCampbell Donald T Experimental and quasi-experimental designs for generalized causalinference Boston Houghton Mifflin 2002
Skinner Ronald A and Staresina Lisa N ldquoStateof the Statesrdquo Education Week 2004 23(17)pp 97ndash99
Tokman Andrea P Evaluation of the P900 pro-gram A targeted education program forunderperforming schools Documento deTrabajo No 170 Santiago Banco Central deChile 2002
Tyler John H Murnane Richard J and WillettJohn B ldquoEstimating the Labor Market Sig-naling Value of the GEDrdquo Quarterly Journalof Economics 2000 115(2) pp 431ndash68
Urquiola Miguel ldquoIdentifying Class Size Ef-fects in Developing Countries Evidencefrom Rural Schools in Boliviardquo Review ofEconomics and Statistics (forthcoming)
van der Klaauw Wilbert ldquoEstimating the Effectof Financial Aid Offers on College Enroll-ment A Regression-Discontinuity ApproachrdquoInternational Economic Review 2002 43(4)pp 1249ndash87
World Bank Educational change in LatinAmerica and the Caribbean A World Bankstrategy paper Washington DC WorldBank 1999
1258 THE AMERICAN ECONOMIC REVIEW SEPTEMBER 2005
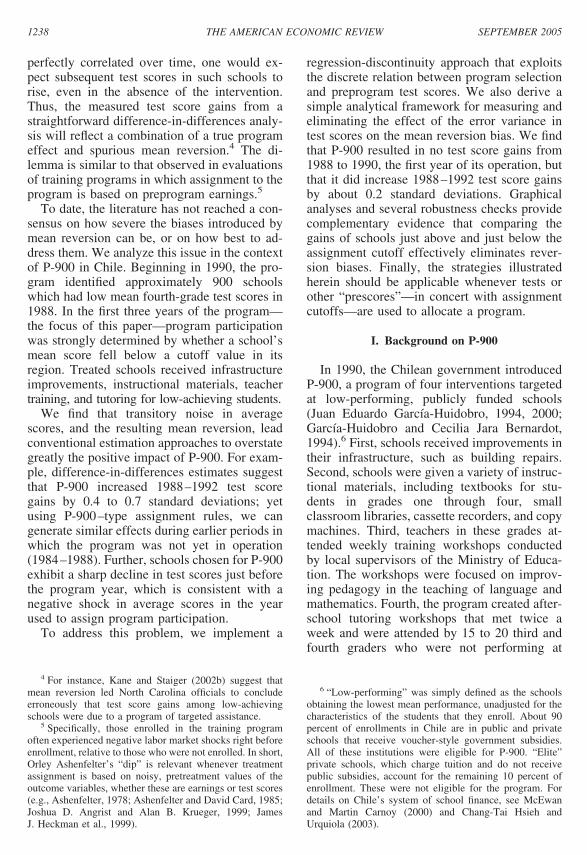
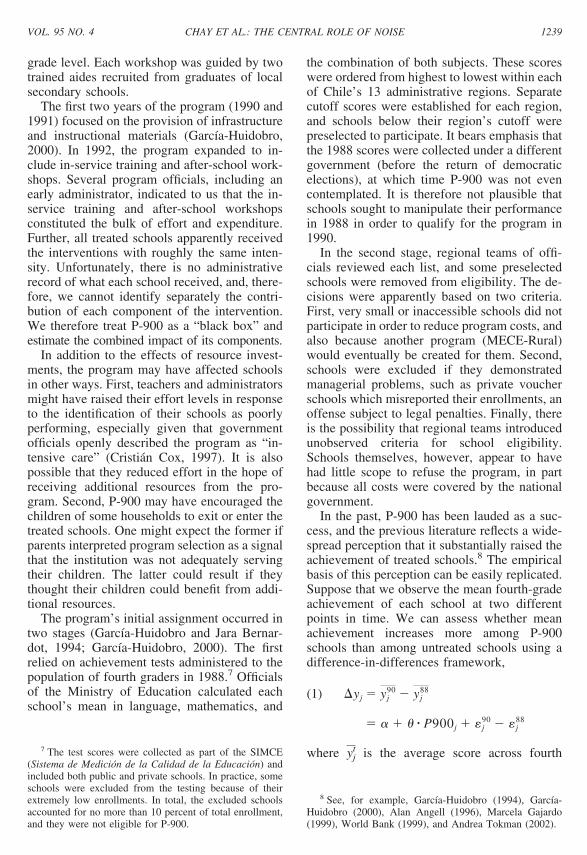
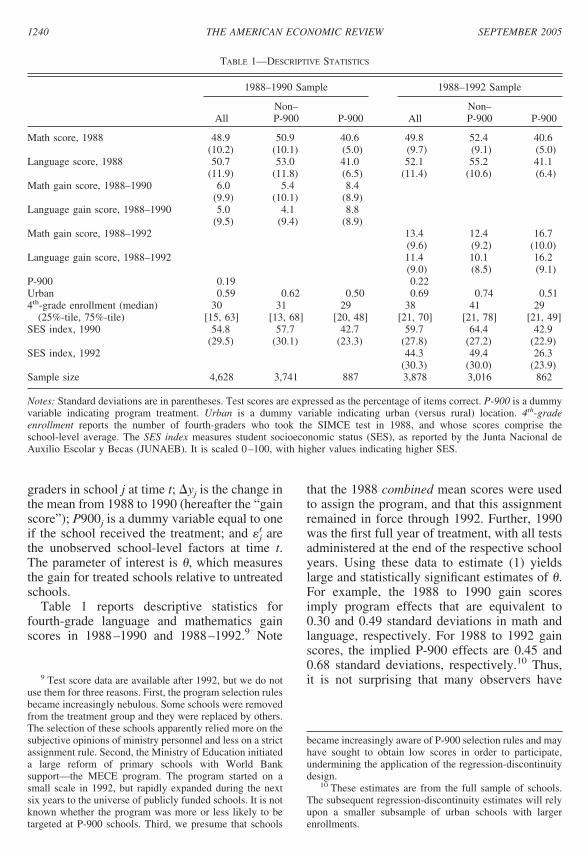
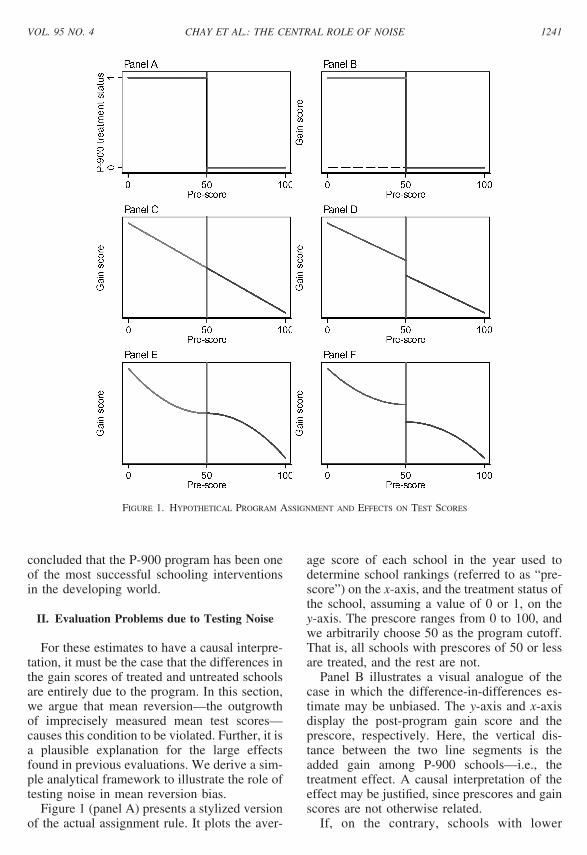
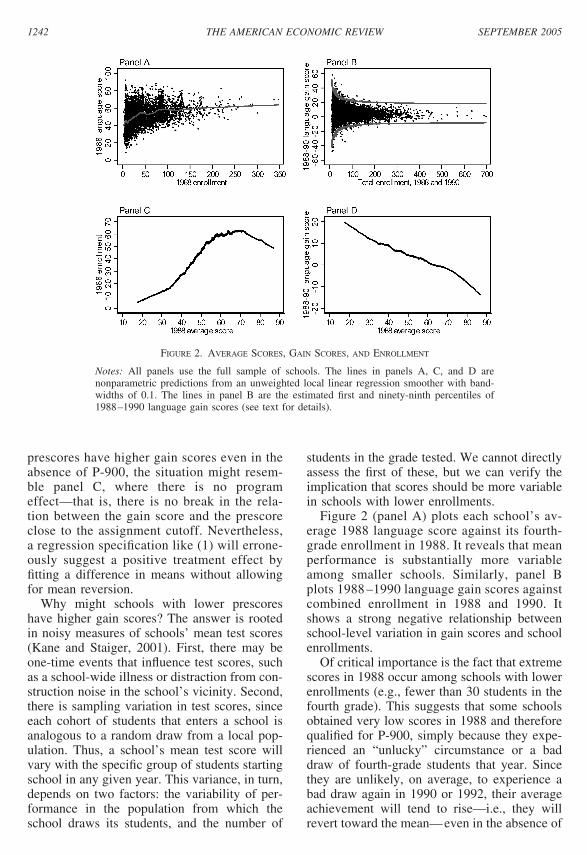
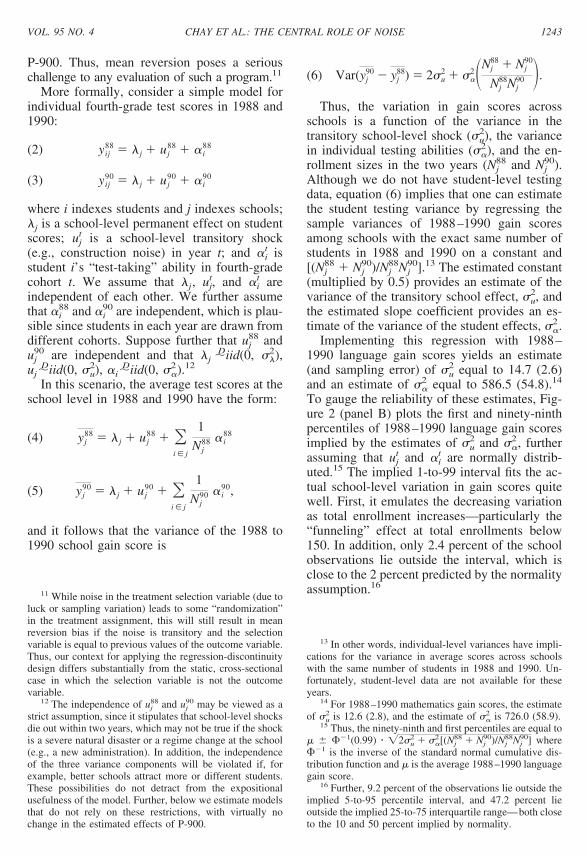
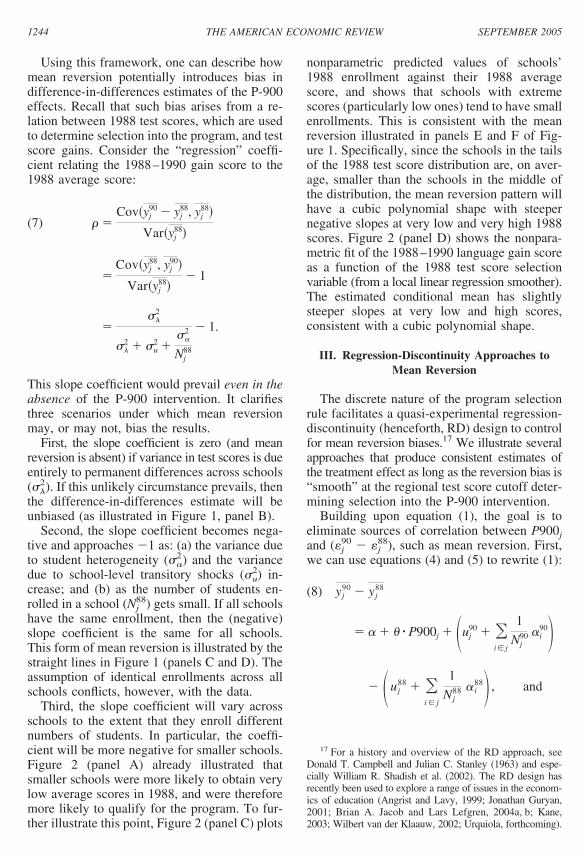
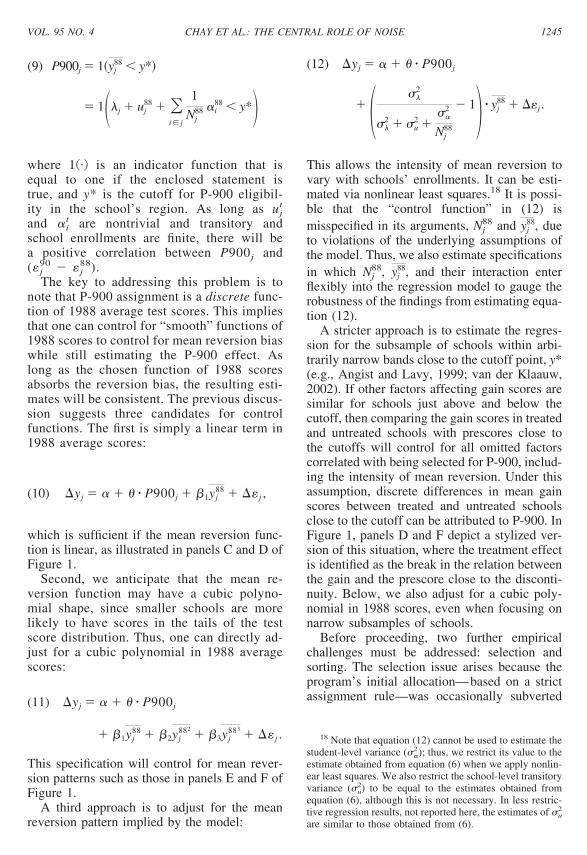
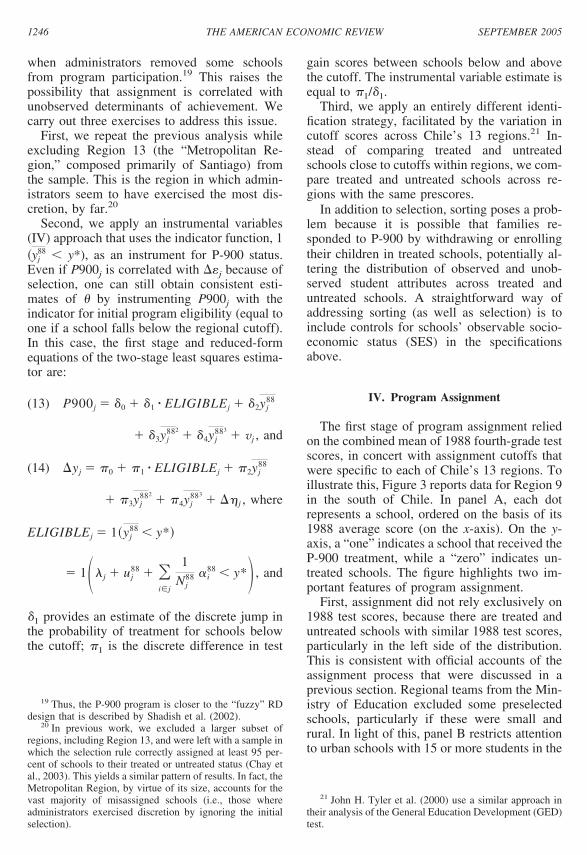
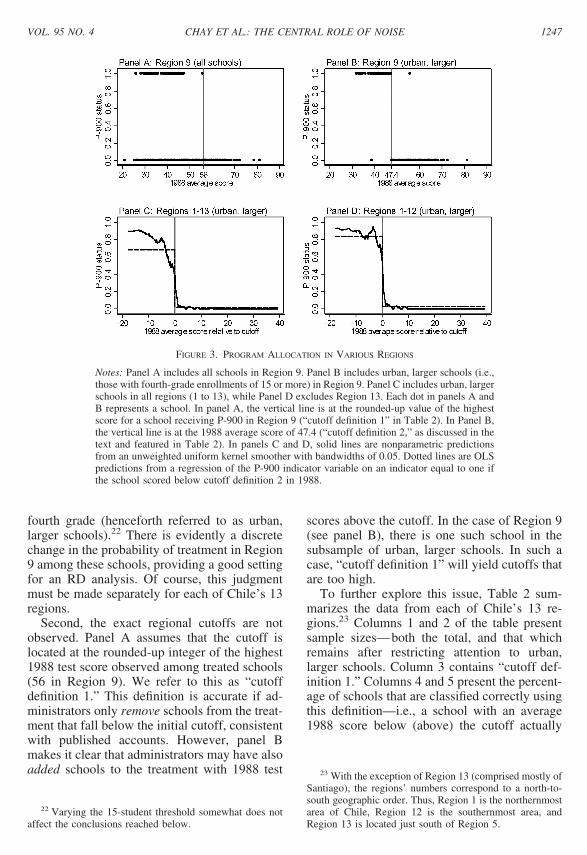
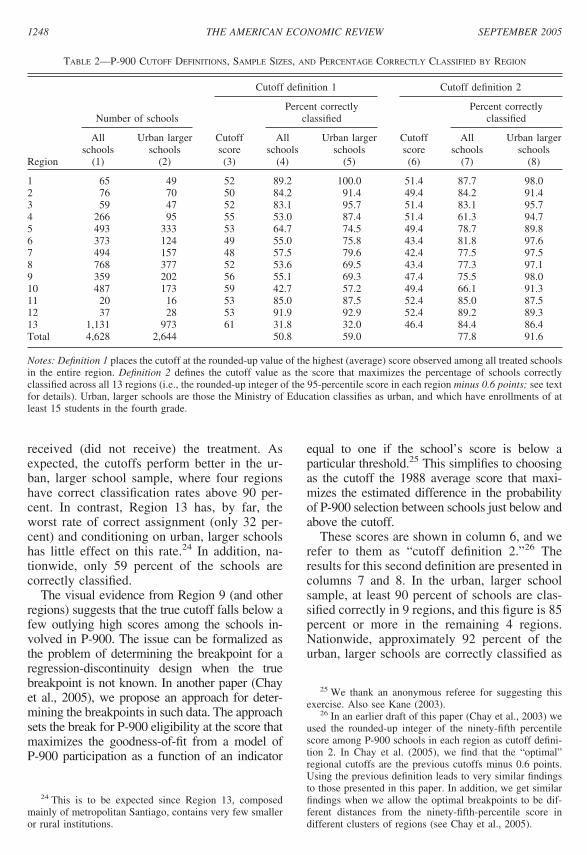
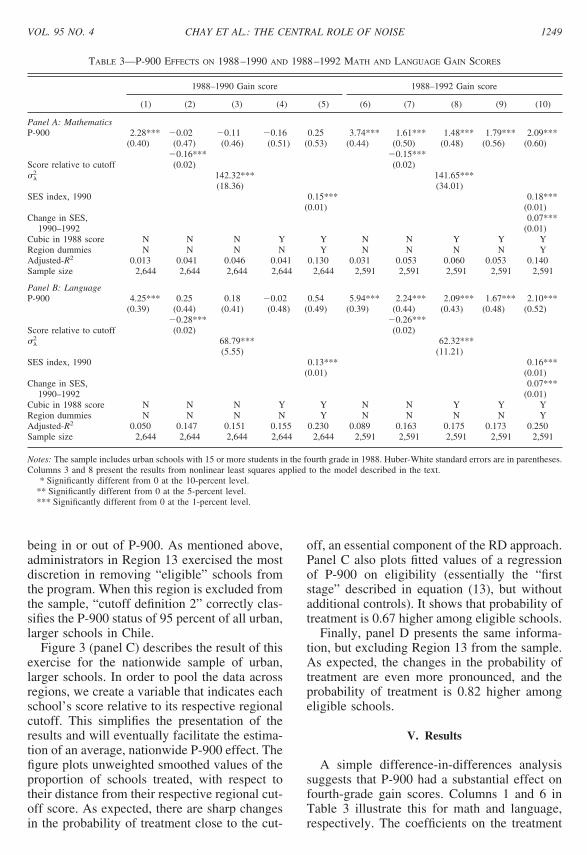
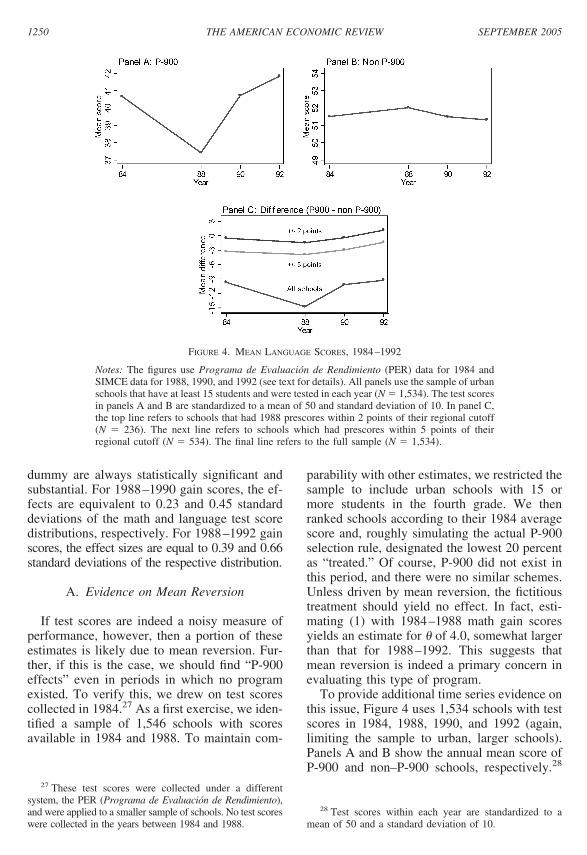
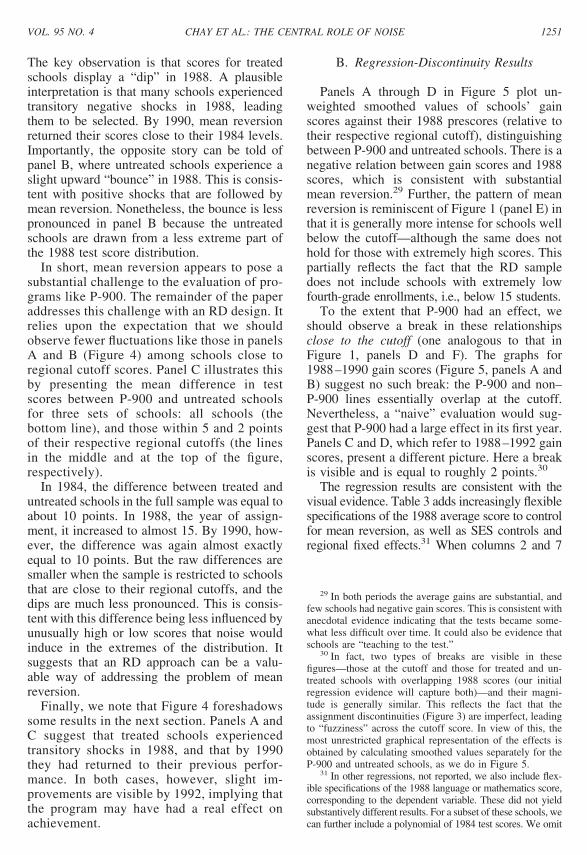
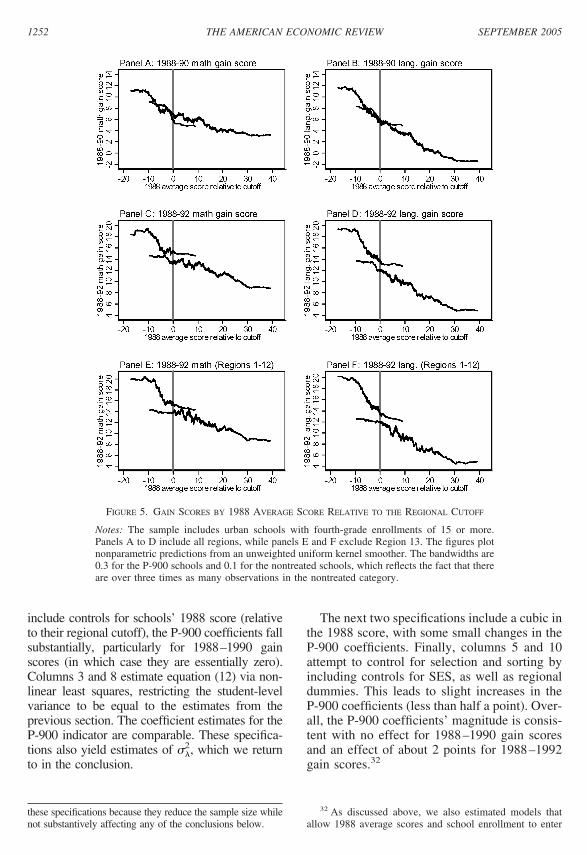
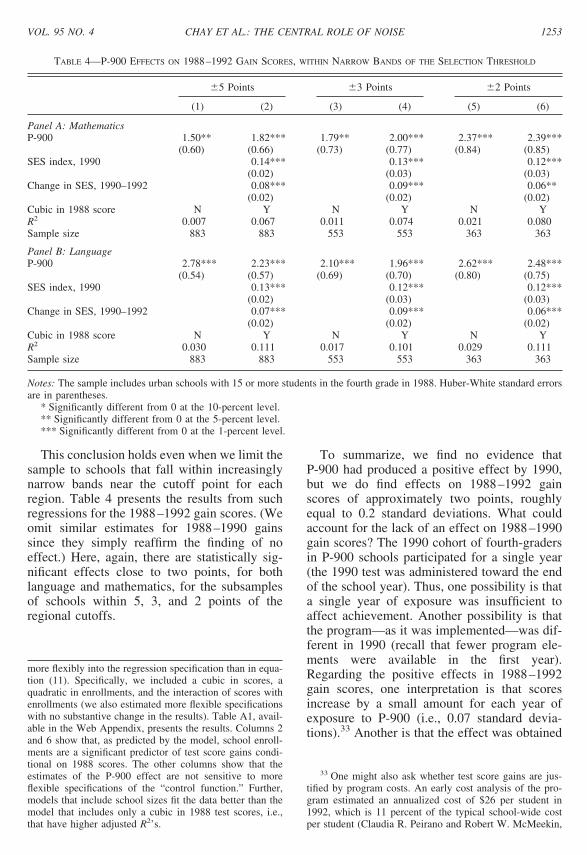
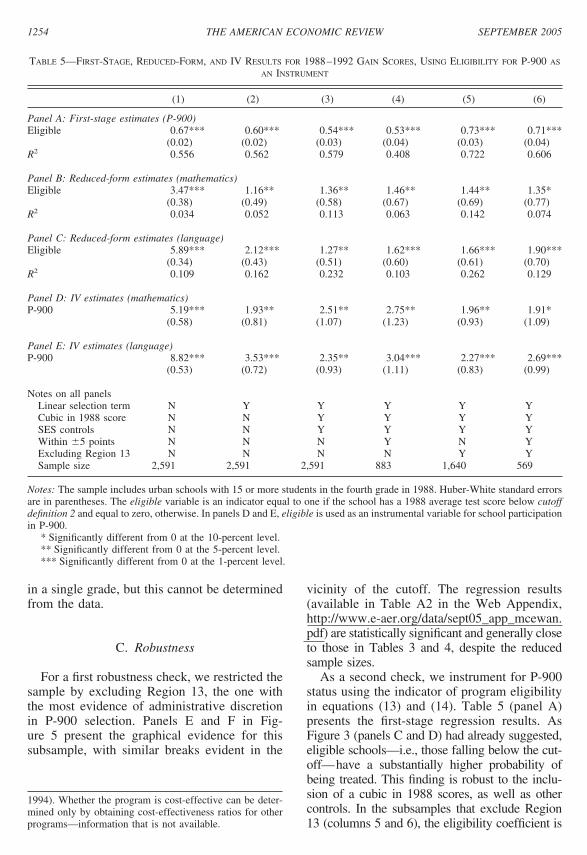
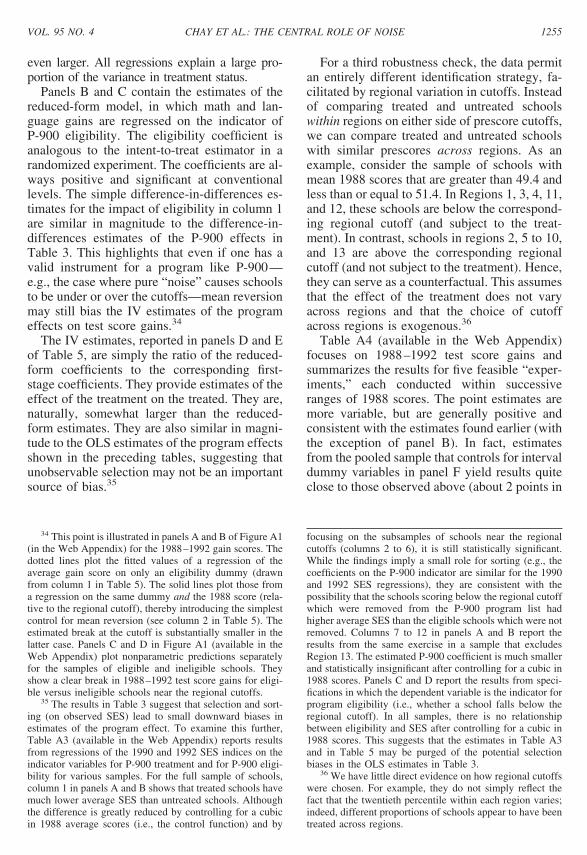