the central business district the cbd: the commercial and economic core of a city the heart of the...
TRANSCRIPT


The Central Business District
• The CBD: the commercial and economic core of a city
• The heart of the city
• the area most accessible to public transport
• the location with the highest land values.

Characteristics
• Parking.• Transport Terminals.• Wholesalers/Warehouses.• Small Shops.• Concentration of Banks/Businesses.• Offices.• Department/Chain Stores.• Car Sales/Services.• Medical/Fire Services.

Location Of Industry
• Manufacturing areas are located within the inner-city.
• They are also located along major highways and in industrial suburbs.
• Industries found in cities usually include skilled labor, medical instruments, fashion accessories and clothes, newspapers etc.
• Port industries.

CBD – Main functions• Shops – top of the shopping hierarchy in a city.
Widest range and the largest department stores. Wide sphere of influence.
• Offices – Banks, building societies, solicitors, government offices. Offices occupy high-rise blocks or upper floors above shops.
• Culture and Entertainment – Areas of the CBD “come alive” at night. Chicago’s clubs, theatres, Navy Pier, music, etc.
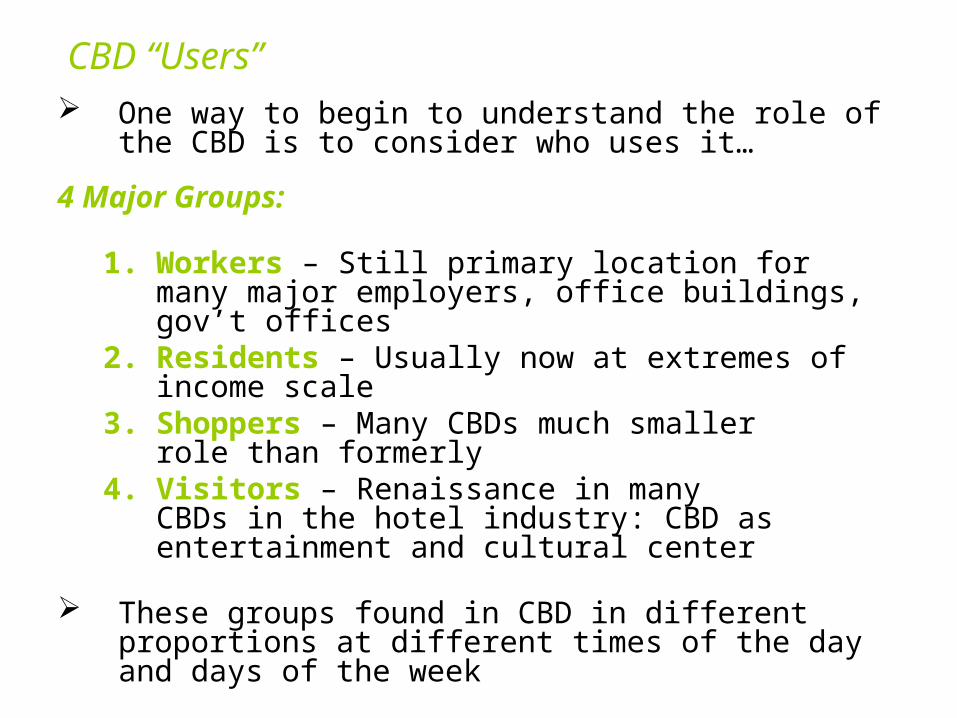
CBD “Users” One way to begin to understand the role of the CBD is
to consider who uses it…
4 Major Groups:
1. Workers – Still primary location for many major employers, office buildings, gov’t offices
2. Residents – Usually now at extremes of income scale
3. Shoppers – Many CBDs much smaller role than formerly
4. Visitors – Renaissance in many CBDs in the hotel industry: CBD asentertainment and cultural center
These groups found in CBD in different proportions at different times of the day and days of the week

CORE
FRAME
Zone of decay
Zone of improvement
Bus and coach station
Smaller shops
Offices- insurance companies,solicitors
Multi-storeyCar parks
Car sales and services
Theatres and cinemas
University
Railwaystation
Banks
High-riseOffice blocks
Specialist shops
Departmentstores

CBD – Problems• Traffic congestion – Towns grew and
street patterns were established before the motor car was invented. Rush hour traffic – “grid-lock”
• Pollution – Water, land, air and noise pollution are all common in city centres. Pollution adds to the stresses of living in urban areas and is thought to aggravate some diseases such as asthma and bronchitis.

Lack of space and high cost of land
• Competition for land – extremely high prices. Smaller firms and retailers forced away from the CBD

Land use patterns:
• Towns and cities do not grow in a haphazard way but tend to develop recognizable shapes and patterns.
• Each town is unique and will have developed its own distinctive pattern, it will also show some characteristics shared by other urban settlements.

Although all towns and cities are different, most have grown and developed in the same way.
Believe it or not there is a PATTERN to it all !

We can show this pattern by using a MODEL – a simplified picture.
This is an URBAN MODEL to show the different land use within a town or city.
Each different colour sector represents a different type of land use.

Urban Land Use Models• Burgess Model• Hoyt Model • Multiple Nuclei Model• Mann’s Compromise Model

Burgess Model:
Inner city
Suburbs

The Burgess Model: The Concentric Zone Model
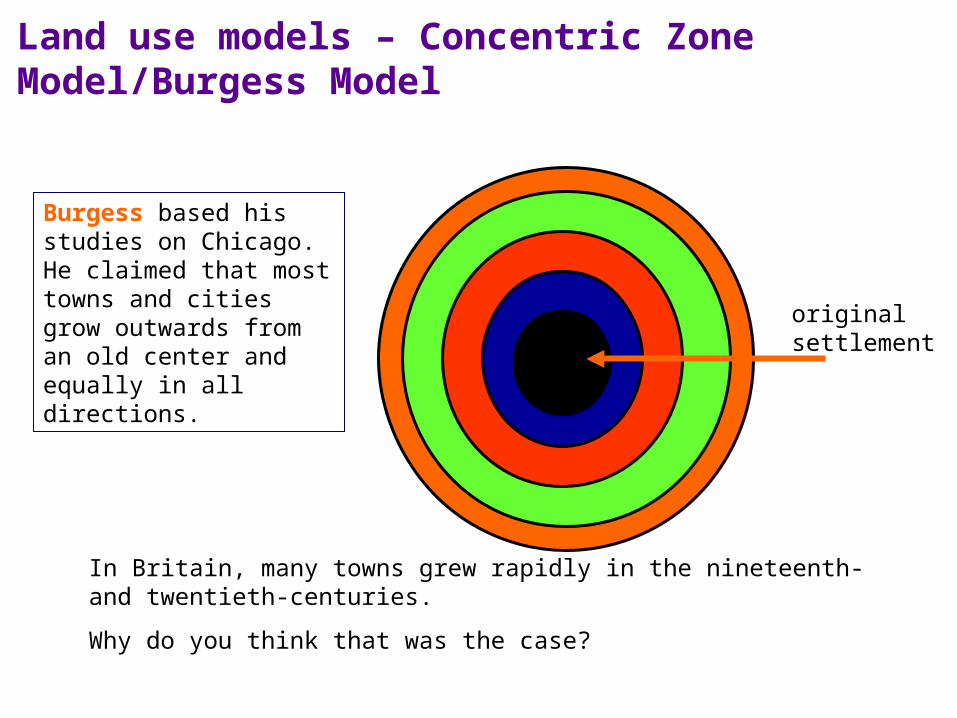
Land use models – Concentric Zone Model/Burgess Model
original settlement
Burgess based his studies on Chicago. He claimed that most towns and cities grow outwards from an old center and equally in all directions.
In Britain, many towns grew rapidly in the nineteenth- and twentieth-centuries.
Why do you think that was the case?
Explanation of Burgess Model
• Having made in depth studies of the morphology of Chicago in the 1920's, Burgess concluded that city land-use could be identified as a series of concentric rings around the CBD.

Explanation of Burgess Model
• Then, we get three rings of housing. The first will be high density, poor quality that traditionally houses the workers for the factories.
• Next, is slightly lower density, middle class housing. These will be semi-detached with gardens.
• Finally, there is a ring of high class housing for those who can afford to commute.

Burgess Model• Timeframe
• 1920’s• Class conscious
society• Housing segregated
according to income• Lack of transport
infrastructure
• Assumptions• Older buildings in city centre• Newer buildings at edge of
city• Land values highest in city
centre• Strong economic and ethnic
segregation• Low income groups lack
transport and live close to city centre.
• Cities develop on a flat plain with equal access to transport

Evaluation: For
• If taken as a very broad pattern, then a large number of towns and cities follow the pattern identified by Burgess.
• It is good model because it is simple and easy to understand.
• Burgess could not have foreseen the changes in transport routes or society yet his model is still relevant when identifying the reasons behind the urban morphology of a city.
• It helps us to understand the process involved in the growth of a city.

Evaluation: Against • It does not take any physical features into
account. Burgess' own case study - Chicago - does not follow the pattern because it is on the coast! The growth of any city will be influenced by the physical geography of the area.
• Transport is much more readily available allowing more people to commute Burgess could not have foreseen this.
• Urban renewal and gentrification has meant that some of the most expensive property can now be found in traditional 'low class' areas.

Hoyt

Explanation
• Hoyt's model came nearly twenty years after Burgess'.
• It was based on 142 American cities.
• He proposed his model after the introduction of public transportation.
• He suggested that the city grew in a series of sectors or 'wedges'.
• An industrial sector would remain industrial as the zone would have a common advantage - perhaps a railway line or river.
• Note how the low quality housing is next to the industrial zone, middle class next to low class and high class as far as possible from industry and low class.

Hoyt ModelTimeframe
•Late 1930’s•Income and status divided society•Housing areas reflect social segregation
Assumptions•Settlement develops along transport routes•Towns radiate out from the CBD•Low-income and industrial areas lie next to each other•Wealthy people choose the best sites

Evaluation: For
• Some cities seem to follow Hoyt's sectors.
• It provides us with an alternative set of explanations to Burgess.
• Communication routes (Rivers, roads, railways) do often provide a very definite boundary to a sector/land-use.

Evaluation: Against• Like Burgess, there is no reference to out
of town developments.– ie: commuter towns which developed after the
car became popular
• Like Burgess, there is no reference to the physical environment.

Multiple Nuclei Model

Harris and Ullman’s Multiple Nuclei Theory
• 1945
• As an urban area grows, it develops around a number of different business centres or nuclei.

Multiple Nuclei Theory• Assumptions;
• Modern cities more complex than suggested by other theorists
• Each nucleus acts as a growth point
• Growth occurs outwards from each nucleus, until they all merge into one large urban area

Evaluations For
• Mixture of Burgess and Hoyt
• Shows some land-uses attract more of the
same, for example industrial areas
• Some land-uses may deter others from
locating nearby, eg; housing is usually
located away from industrial areas

Evaluations Against
• Not an exact fit for all cities
and towns
• Too complex

Mann’s Compromise Model

Evaluations For
• Elements of both Burgess and Hoyt models.
• SW wind blows smoke and pollution towards East.
• Wealthy choose to live in pleasant unpolluted areas.

Evaluations Against
• Does not include inner city renewal.
• Based on limited study of only a few studies– not entirely accurate.