the cement industry in mexico: an analysis of its determinants
TRANSCRIPT

Articles
The Cement Industry in Mexico: An Analysis of its Determinants
Belem Vásquez1
Salvador Corrales1
1Colegio de la Frontera Norte, Mexico. E-mail addresses: [email protected] and [email protected],
respectively.
Abstract:
Below, this paper analyzes and identifies some of the determinants that explain cement industry
production in Mexico. The objective of this study was to identify the effect of exports and external
competition on cement production, as well as internal drivers, such as investment, employment, and
overall economic activity. As a function of augmented production, error correction models were
estimated. The results indicate that the cement production exchange rate is positively related with
exports and negatively with external competition. Overall economic activity showed a strong effect on
production. Assuming that the industry operates as an oligopoly, the results imply that there are no
incentives to favor the entrance of competitors.
Key Words: Cement industry, production, companies, market, investment, employment
Date received: April 29, 2016.
Date accepted: October 4, 2016.
Introduction
Measured in terms of production capacity, the Mexican cement industry is one of the largest. However,
production levels have fluctuated sharply over the years. The industry gathered steam during the age of
import substitution industrialization, which helped boost national production through fiscal incentives

and financial support, going from an installed capacity of 574 million to 17.02 million metric tons in the
period 1940-1980 (Salomón, 2006). With six business groups comprising the industry, the annual
growth rate between 1940 and 1960 amounted to 10.2%. The industry leader was Cementos Tolteca,
followed by Cementos Anáhuac, Cementos Mexicanos, Cruz Azul, Guadalajara, and San Luis Mining
Co. (Kumakan and Martínez, 2008).
Starting in the 1990s, Mexican cement companies began to make major moves by way of mergers and
acquisitions that are extremely important to understanding how the market is distributed, how prices
behave, and how Mexico currently competes in the international market. Data obtained in 2015 show
that the cement industry remained highly concentrated in the hands of just six companies that continue
to dominate the domestic market: Cemex, Grupo Cementos de Chihuahua, Cemento Moctezuma,
Holcim-Apasco, Cruz Azul, and Cementos Fortaleza (constituted by the purchase of Lafarge by Carlos
Slim and Antonio del Valle, the top shareholder in the chemical conglomerate Mexichem) (see Table 1).
Cemex rules the national market with nearly 50% of production and sales, followed by Holcim-Apasco.
Table 1. Companies that are Part of the Mexican Cement Industry (2015)
Company Number of Plants Headquarters
Cemex 15 Monterrey, N. L.
Cemento Moctezuma 3 México, D.F.
Cementos y Concretos
Nacionales (Cruz Azul)
4 México, D.F.
GCC Cemento 3 Chihuahua
Holcim-Apasco 7 México, D.F.
Cementos Fortaleza
(Lafarge)
3 México, D.F.
Source: Created by the authors based on data from the National Cement Chamber.
Little formal work has been done to analyze the behavior of the Mexican cement industry in detail. The
most germane studies have focused on analyzing the overall nature of the industry (Avalos and Schatan,
2003; Kumakan and Martínez, 2008), analyzing the efficient use of energy in production (Sterner,
1990), the market structure by which the industry operates (De la Garza and Arteaga, 2012), and the
relationships of agglomeration and prices among the six multinationals (Ghemawat and Thomas, 2005).
Other papers have emphasized only Cemex, in light of its role as a market and global leader (Barragán
and Cerutti, 2003), or the group consisting of Cemex, Holcim-Apasco, and Lafarge (Vera, 2013).
Accordingly, this paper sets out to analyze several of the determinants of growth and production in the
Mexican cement industry. The objective is to investigate to what degree the burgeoning participation of
the industry in the international market, rooted in its expansion plans and the eliminating of antidumping
tariffs, has increased production and to what extent external competition has had an effect through

cement imports. Another goal is to analyze the effect of more domestic determinants, such as
investment, employment, and overall general economic activity, on production. Beginning with an
augmented production function, various error correction models were estimated to determine the
statistical significance of each of these external- and internal-order elements on cement production in
Mexico, with monthly data ranging from 2005 to 2015.
This paper is separated into five sections: the first offers a theoretical analysis of the structure of the
oligopolistic market. The second analyzes trends in Mexico with aggregate data on employment,
investment, and foreign trade. The third describes the methodology. The fourth parses the results
obtained. Finally, the fifth section provides conclusions. The hypothesis is that the rising presence of
imports in the national market affects production, and the elimination of tariffs has not boosted cement
exports. In the domestic market, we assume that the growth of the construction industry is the main
determinant for the upswing in cement production.
Theoretical Discussion
The market structure in which the cement industry operates could be considered an oligopoly, as a
homogenous product is predominant and companies are interdependent in setting production or prices.
High barriers to entry for new competitors mean that Mexico imports very little cement. Moreover,
accusations of disloyal trade practices have afflicted the market’s ability to export to its principal
destination (the United States). In the past ten years, the peak growth rate was reached in 2006 with
7.7%, while the value of production grew 5.8% in real terms. However, starting in 2006, the industry
took a nosedive in terms of both production and export levels. The most critical moment came between
2009 and 2010, when production declined severely at -4.21% and exports were down -52.4%. It is
understandable that the financial crisis unleashed by the United States in 2008 would have such strong
repercussions for the Mexican economy and, in particular, for the cement industry. However, while the
economy as a whole began to recover in 2013, both the construction and cement production businesses
continued to experience negative growth rates. Finally, according to the National Institute for Statistics
and Geography (INEGI), in 2015, the industry produced 44.9 million tons of cement and, for the first
time in ten years, managed to hit a growth rate of 7% (INEGI, 2015a).
Unlike in situations of perfect competition, where companies take the prices dictated by the market and
based on that establish production levels, in an oligopoly, the decisions that each company makes affect
market prices and, therefore, the profits of all of the other companies. Because they all produce the same
homogenous good, they are necessarily interdependent and, consequently, they must behave
strategically.

The theory of “imperfect competition” contains diverse models to explain how agents in an oligopoly
behave. Departing from a simplified model where there are n companies that produce a homogenous
good, companies must decide on the price they will charge or the amount they will produce. To
maximize profits (revenue less costs), there are two solutions to be found: in the Cournot model,
companies simultaneously choose the amount, while in the Bertrand model, they simultaneously set the
price (Varian, 2011).
In an oligopoly, the income (𝐼𝑇𝑖) and profit of company i (𝐼𝐼𝑖) are a function not only of its production
level (𝑞𝑖) but also of the production of the rest of the companies: 𝑄_𝑖. Accordingly, the equation for the
profit of company i is:
(1)
Where 𝐶𝑇𝑖 represents total costs. In considering what its maximizing production (𝑞𝑖) should be,
company i must consider the behavior of the other companies (𝑄_𝑖). This function is referred to as the
reaction function because it represents the company’s production in terms of the production of the other
companies. As such, at equilibrium, the production amounts are the same:
(2)
As such, when maximizing, the price of the oligopoly is:
(3)
The price of the product depends on the marginal cost of c and n, so at the limit, the price is equal to the
marginal cost, and it is a competitive price:

(4)
If in a duopoly or oligopoly there are clear differences between the companies, and one of them is
dominant, then there are two possible solutions. If the dominant company manages to set the price
before the other, it becomes the leader in the price selection and, therefore, the other is the follower. If
the dominant company fixes the amount, then it is a leader in production choice and the follower
companies maximize their profits based on that production (Stackelberg model of competition).
Another strategy that companies may choose is collusion, meaning that by way of collaboration, they
reduce the competition between them to maximize profits as if they were a single company:
(5)
In expression (5), the total profits are the sum of the profits of each company. The marginal costs for
each company are equal to the marginal income of the industry. Because only one function is
maximized, the maximum profit of the industry is similar to what would be obtained with a monopoly
owning various plants. The advantage is that collusion permits, through fixing production and the price
of the product, the companies already in the market to prevent new competitors from entering. However,
the equilibrium in collusion is not stable, because the companies need to set the criteria for distributing
the total profit. If just one of them does not respect the agreements, then it can increase its production
share and profits at the cost of the rest. Collusion means that the total profits of the industry are higher,
because production and prices are set, but it is detrimental to consumers and potential new competitors.
For that reason, collusion is prohibited and penalized by competition law.
In practice, however, it is common for companies to agree to form cartels, which persist for many years.
Levenstein and Suslow (2006) conducted an extensive review of empirical cases of cartels in different
industries to identify, among other aspects, how successful they are and how long they last. They found
that the duration varies widely. For example, the beer cartel (in the United States) was maintained for
nine years, while the cement cartel (in South Africa) stuck around for 40 years (Levenstein and Suslow,
2006: 53). The success and duration of cartels is greater where there are fewer participants and when
product demand is inelastic. In both cases, the cement industry met these conditions. Other documented
cases seem to support that collusion and concentration in the cement industry are themes common
around the world, including in India (Pradhan, 1992), Canada (Kleit and Palsson, 1996), and Germany
(Blum, 2007), among others.

Beyond oligopolistic competitive practices, there are other theories that explain the behavior of
companies that try to fend off competition. For example, the theory of vertical integration asserts that the
acquisition of companies that belong to the production and distribution chain leads to vertical
integration, erecting entry barriers for new competitors (Blair and Kaserman, 1983; Carlton, 1979). For
example, Kleit and Palsson (1996) found that, in cement companies in central Canada, the acquisition of
integrative and cement distribution companies had led to vertical integration that was blocking new
competitors from entering the market because of the high costs of participating. The vertical integration
of these companies therefore permitted them to set high prices as compared to companies located
outside of the region.
The Performance of the Mexican Cement Industry
The Mexican cement industry supplies one of the most important products for the construction industry:
cement, whose productive chain in the industry is rather short (Pozas, 1999), because when construction
projects are being built, very few modifications can be made that would require adding complementary
materials. From another perspective, various chains converge around cement (steel, glass, aluminum,
wood, etc.) until the projects are finished, and their uses will be defined depending on the types of
materials and, likewise, the demand for cement.
Given the makeup of the materials and inputs required by this industry, it has become concentrated in
the hands of just a few companies, to the extent that an oligopolistic market has emerged, prompting
both open and concealed collusion to manipulate the market. In light of the narrowness of the productive
chain and specialization in just a few products, companies do not invest in complementary industrial
activities. The experience of Cemex is an example of success that defies the logic of the networks of
transnational companies, which shape the globalization of the economy (Corrales, 2006; Kang and
Sakai, 2000).
It is more common for cement industry companies to engage in mergers and acquisitions to control the
market, which gives rise to international competition through hostile takeovers of companies and other
small cement businesses that are well-positioned in growing markets with demand. Over the past two
decades, this agglomeration strategy (Ghemawat and Thomas, 2005) has made evident this process of
concentration in the cement industry, whose beneficiaries, in the end, have been the big transnational
cement companies.
In Mexico and around the world, large infrastructure projects like bridges and buildings require
significant quantities of cement and lead to competition between cement companies to supply the

cement. Surely, given the high composition of the capital to produce it and the cost to transport it to the
end consumer, the cement industry is dominated by just a few companies, in other words, those with the
capacity to manipulate prices (De la Garza and Arteaga, 2012).
Table 2 shows some of the performance indicators for the cement industry2 from 2005 to 2015.
Throughout these years, the industry has been controlled by six companies that own around 34 of the 37
plants. They currently have 30,000 points of sale in the country, creating 86,000 direct jobs. However,
their share in the Gross Domestic Product (GDP) fluctuates around 1%. In the table, we can see that in
2005, national cement production amounted to 39.7 million tons, while national consumption per capita
reached 384.1 kilos per inhabitant. Ten years later, production rose (44.9 million tons), but per capita
consumption fell to 375.5 kilos per inhabitant.
Table 2. Cement Production and Consumption in Mexico
Year Number of
plants
Average
capital
used (%)
Cement
production
(millions
of tons)
Growth
rate,
production
(%)
Consumpti
on per
capita
(kilos per
inhabitant)
Productio
n value
(millions
of pesos
2008)
2005 37 84.1 39.7 384.1 59828.2
2006 37 86.3 42.7 7.7 413.7 63316.9
2007 35 85.7 43.4 1.6 420.5 62352.0
2008 35 85.8 42.3 -2.6 409.5 59816.2
2009 35 85.0 40.9 -3.2 396.3 58186.5
2010 35 83.3 39.2 -4.2 349.2 56034.8
2011 35 84.2 40.6 3.6 361.6 55201.2
2012 34 83.9 41.6 2.5 370.5 56229.2
2013 35 80.6 39.8 -4.3 354.6 57189.8
2014 34 82.2 41.9 5.3 373.3 60026.8
2015 34 84.3 44.9 7.0 375.5 64047.4
a/ The number of plants in 2005 and 2007 was taken from the EAIM, Scian 2002.
Source: Created by the authors based on data from the EMIM, annual data, and the Population Census,
INEGI.
The effects of the 2008 financial crisis reveal how consumption per capita in 2009 hit 396 kilograms,
which can be explained by the pressures of recovery through new investment in infrastructure and
engineering, which behave very similarly to the national economic growth rate. In view of slow
economic growth in the wake of the crisis, and dependency on the American economy, the decrease in
national and per capita cement consumption became marked. A more detailed examination, with
statistics from the Monthly Manufacturing Industry Survey (EMIM) conducted by INEGI (2015b)

shows that production values have plummeted since 2006, when the peak prior to the financial crisis was
attained, with a real growth rate of 5.8%. From 2008 to 2010, the industry only experienced negative
growth rates. It is possible that the effects of the financial crisis have hit cement producers more
severely, because Cemex, Holcim-Apasco, and Lafarge remain highly invested in the stock market to
finance their productive activities (Vera, 2013).
The situation in 2015 was very different, because at that point in time, the industry began to show signs
of a rapid recovery. That same year, production ascended to 64 billion pesos (2008 prices), representing
real growth of 6.7%. The EMIM data confirm that in 2015, the productive capacity for cement was 45
million tons, with an idle capacity of 15.7%. When it comes to the characteristics of the product, most of
the cement production is Portland cement, made with pulverized clinker material (accounting for more
than 80% of total production). In order of importance, Portland cement is followed by white cement,
which is a mixture of limestone and kaolin clay with low iron and gypsum content (around 2.5%), and
then mortar, which is a mixture of cement with sand and water (around 8%). These three types of
materials constitute the main products in the industry. There is also mixed cement, which is a
combination of Portland cement and ground and granulated clinker from blast furnaces, volatile ash,
silicate fumes, calcined clay, hydrogenated limestone, and other pozzolana (Cemex, 2016). Table 3
shows how the share of each type of cement has oscillated throughout the time period.
Table 3. Principal Indicators for the Cement Industry in Mexico. 2005-2015.
Year Total
production
(millions
of tons)
Portland
(%)
White (%) Mortar
(%)
Employed
staff
Gross
fixed
investment
(millions
of pesos)
2005 39.7 90.7 2.0 7.4 92943 1394.6
2006 42.7 84.2 2.0 7.4 93668 3026.0
2007 43.4 82.8 2.0 7.8 93960 2348.4
2008 42.3 85.1 1.9 8.2 92237 3206.7
2009 40.9 87.9 1.6 8.4 84708 1202.6
2010 39.2 91.8 1.8 6.7 84105 1816.4
2011 40.6 88.6 1.9 8.7 87471 1065.2
2012 41.6 86.5 2.1 9.1 87967 4478.6
2013 39.8 90.4 2.4 9.0 87382 1852.8
2014 41.9 85.8 2.7 9.0 86022 4365.3
2015 44.9 80.2 2.0 9.3 86802 4278.0
Source: Created by the authors based on data from the EMIM and the EIMA from INEGI and the
Ministry of the Economy.

Job creation has fluctuated closely with production; merely because it is a capital-intensive industry,
employment in recent years has been lower than it was in 2005. The industry has made large
investments over the years, with the exception of during the 2009-2010 crisis. International trade
expectations, as well as the presence of new producers (Cementos Fortaleza, from Carlos Slim and
associates) gave investment a big push in recent years; in fact, of 116.2% in 2015, which could also be a
result of rising consumption. The National Cement Chamber (CANACEM) placed consumption growth
at 7.6%, while INEGI data reported 9.6%.
As can be observed in Figure 1, annual growth rates are represented by several of the aforementioned
indicators. There is a trend derived from the recovery cycle of the industry, which came at the cost of a
decrease in the number of people employed by the industry, as well as a downturn for international trade
and production in 2009. It turns out that there is a close relationship between the economic activity
indicator for the construction business and cement, because construction is the main source of demand
for cement and pre-mixed concrete.
Source: Created by the authors based on data from the EMIM (INEGI, 2015b), INEGI (2015a), and the
Ministry of the Economy (2016).
Figure 1. Annual Growth Rates (%)

In July 2014, the merger of Lafarge and Holcim-Apasco jeopardized every other competitor, even those
from Mexico, as the industry was shaken up with new and old competitors taking pieces of the market,
and oligopolistic practices that affected prices. The presence of one of the wealthiest businessmen in all
of Mexico and the world in this industry, the stagnation of the Mexican construction industry, and rising
imports from both the United States and China are all factors that have pushed cement prices down in
some regions of the country (Torres, 2014).
Mexican cement exports, in the makeup of their value, skyrocketed starting in 1985, with income higher
than 150 million dollars, but tumbled again to below 70 million in 1990, in response to the antidumping
laws enforced by the United States in 1989. The signing of the North American Free Trade Agreement
(NAFTA) in 1994 marked a big step forward in trade negotiations; however, the Mexican cement
industry did not benefit because at the same time, it was hit with the antidumping sanctions. These
sanctions amounted to fees of up to 26.28 dollars per ton of cement, making it difficult to export at
competitive prices.
To American analysts, cement prices are largely determined by transportation costs; although Mexican
cement prices were below American prices, Mexican cement needed to be transported long distances,
which translated into higher prices in the end (Cook, 1994). This was reflected in compensatory taxes of
between 43% and 62% in the midst of the full-on crisis of 1995. Cemex undertook a new commercial
strategy: consolidate its position in the United States as an autonomous business unit, in order to not
have to depend on exports (Barragán and Cerutti, 2003). In general, exports as a proportion of the total
product are not high, and competitive strategies are based on mergers and acquisitions or collusion. As a
result of the disloyal competition of Cemex and other companies in the world, the number of plants
operating in the United States fell from 141 in 1986 to 134 in 1989, with 67 of these plants owned by
foreign entities or operated in joint ventures (Cook, 1994). On the contrary, as of 2006, Cemex already
had 12 plants in the United States with a capacity of 13.2 million tons (Salomón, 2006). Some studies
have proven that the antidumping measures applied to the Portland cement generated differentiated
effects in the United States due to market segmentation. Cohen-Meidan (2013) found that in the region
of North America close to the Gulf of Mexico, the antidumping measures applied to Mexican cement
inflated domestic prices 9% more than the control group; however, prices were not altered in the border
region or in California. This suggests, accordingly, that Mexican imports lost market share primarily in
regions where their exports were not competitive, while maintaining a stronghold in areas supplied my
ocean transport (lower cost than overland).
After 16 years of disputes between Mexico and the United States, in 2006, the two countries reached an
agreement to establish different time periods to permit the exportation of Mexican cement to specific
regions. In these negotiations, it was agreed that grey Portland cement and clinker cement in amounts no
greater than 3 million tons could be exported starting on April 3, 2006 and ending on March 31, 2007.
The second period was set for April 1, 2007 to March 31, 2008, and the third from April 1, 2008 to
March 31, 2009 (Secretaría de Economía, 2006). Once the agreement expired in early 2009, the quotas
were eliminated, as well as the export limitations, with no need to file a suit before the United States
Department of Commerce (US Department of Commerce, 2009).

According to data kept by the online Tariff Information System (SIAVI) of the Ministry of the
Economy, in 2005, Portland cement exports were sent to the United States (87.86%), Guatemala (4.1%),
Belize (4.3%), Panama (2.9%), and the rest of the world (0.84%). Sixty-one percent of imports, in both
value and volume that same year, came from the United States, meaning that intra-industrial trade
prevailed. In light of the weight to cement price ratio, the amount of exports is relatively small with
respect to national production (close to 3%).
Cement imports have a much smaller weight in the trade structure; as of 2015, looking at origin, the
same trend for trading partners has been maintained; 77.1% of cement imports came from the United
States, 15.1% from China, and 3.6% from Croatia (Secretaría de Economía, 2016). The domestic market
also receives imports from other countries, including: Spain, the Netherlands, Poland, and Germany,
among the most frequent. The commercial dispute with the United States due to the antidumping
measures had a significant effect on exports; even so, due to the productive capacity of the Mexican
cement industry, the trade balance stayed positive (see Figure 2).
Source: Created by the authors based on data from INEGI (2015b) and the Ministry of the Economy
(2016).
Figure 2. International Trade for the Cement Industry and Share held by the Competition in the
Domestic Market
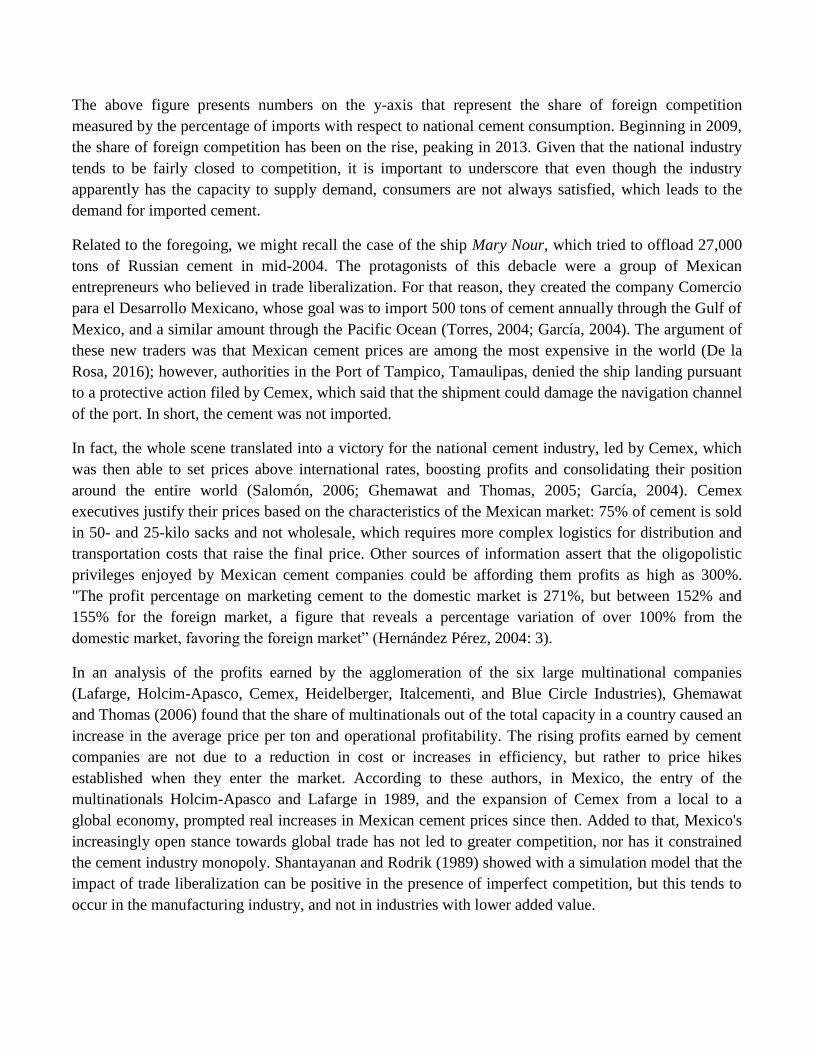
The above figure presents numbers on the y-axis that represent the share of foreign competition
measured by the percentage of imports with respect to national cement consumption. Beginning in 2009,
the share of foreign competition has been on the rise, peaking in 2013. Given that the national industry
tends to be fairly closed to competition, it is important to underscore that even though the industry
apparently has the capacity to supply demand, consumers are not always satisfied, which leads to the
demand for imported cement.
Related to the foregoing, we might recall the case of the ship Mary Nour, which tried to offload 27,000
tons of Russian cement in mid-2004. The protagonists of this debacle were a group of Mexican
entrepreneurs who believed in trade liberalization. For that reason, they created the company Comercio
para el Desarrollo Mexicano, whose goal was to import 500 tons of cement annually through the Gulf of
Mexico, and a similar amount through the Pacific Ocean (Torres, 2004; García, 2004). The argument of
these new traders was that Mexican cement prices are among the most expensive in the world (De la
Rosa, 2016); however, authorities in the Port of Tampico, Tamaulipas, denied the ship landing pursuant
to a protective action filed by Cemex, which said that the shipment could damage the navigation channel
of the port. In short, the cement was not imported.
In fact, the whole scene translated into a victory for the national cement industry, led by Cemex, which
was then able to set prices above international rates, boosting profits and consolidating their position
around the entire world (Salomón, 2006; Ghemawat and Thomas, 2005; García, 2004). Cemex
executives justify their prices based on the characteristics of the Mexican market: 75% of cement is sold
in 50- and 25-kilo sacks and not wholesale, which requires more complex logistics for distribution and
transportation costs that raise the final price. Other sources of information assert that the oligopolistic
privileges enjoyed by Mexican cement companies could be affording them profits as high as 300%.
"The profit percentage on marketing cement to the domestic market is 271%, but between 152% and
155% for the foreign market, a figure that reveals a percentage variation of over 100% from the
domestic market, favoring the foreign market” (Hernández Pérez, 2004: 3).
In an analysis of the profits earned by the agglomeration of the six large multinational companies
(Lafarge, Holcim-Apasco, Cemex, Heidelberger, Italcementi, and Blue Circle Industries), Ghemawat
and Thomas (2006) found that the share of multinationals out of the total capacity in a country caused an
increase in the average price per ton and operational profitability. The rising profits earned by cement
companies are not due to a reduction in cost or increases in efficiency, but rather to price hikes
established when they enter the market. According to these authors, in Mexico, the entry of the
multinationals Holcim-Apasco and Lafarge in 1989, and the expansion of Cemex from a local to a
global economy, prompted real increases in Mexican cement prices since then. Added to that, Mexico's
increasingly open stance towards global trade has not led to greater competition, nor has it constrained
the cement industry monopoly. Shantayanan and Rodrik (1989) showed with a simulation model that the
impact of trade liberalization can be positive in the presence of imperfect competition, but this tends to
occur in the manufacturing industry, and not in industries with lower added value.

Econometric Procedure
Some of the main players in the cement industry behave pursuant to the logic of oligopolistic
competition. At the aggregate level, the industry can be represented by a single function of production
Q. Accordingly, in order to determine the effect of external-order (exports and the competition of
imports) and the effect of internal-order factors (jobs, investment, and demand) on cement production,
the following augmented production function was specified:
(6)
(7)
Q is the total value of cement production, K is gross fixed investment, L is the number of people
employed by the industry, A is productive efficiency, and μ is the externality generated by the
international cement demand (which is why we use exports as a proxy). The coefficients α and β are the
share of capital and labor, respectively, and (1–α–β) is the share of export demand. We assume that α
and β are less than one, such that there are decreasing returns on labor and capital.
Taking the natural logarithm of Equation 7 and the derivative with respect to t, we obtain the following
production function:
(8)
Where ψ is the growth rate of i=Q, L, K, μ. Equation 8 implies that increases in the export demand will
raise production in (1–α–β). The equation may take the following form:

(9)
In Equation 9, the lower-case letters indicate natural logs, Δ is the differences operator, q is the value of
cement production, l is employment, inv is gross fixed investment, ex is the value of exports, compes is
an indicator of the share of foreign competition in the domestic market and is measured as the share of
imported cement in the market, igaet represents economic activity and is measured by a global economic
activity indicator, D represents a dummy variable that captures the effects of antidumping (taking the
value of 0 for 2005 to May 2009 and 1 starting in April 2009), and Ɛ is the error term.
The database comes from the Monthly Manufacturing Industry Survey (EMIM) and the Monthly
Expanded Industrial Survey (EIMA) published by INEGI (2015b, 2015c). The period of analysis
considered was from 2005:1 to 2015:12. The data in pesos were deflated in order to eliminate the effect
of prices. To do so, the National Cement Producer Price Index was used, with basis in June 2012. The
amounts were subsequently converted into dollars. The original data in dollars were deflated using the
Real Exchange Rate Index published by the Bank of Mexico. Finally, all of the variables were
transformed into natural logs to reduce variance. This is indicated with an "l" in the notation.
Results
The use of relatively long monthly time series requires a unit root test to prevent spurious estimates that
could lead to invalid inferences. As such, unit root tests were applied to all of the variables, specifically,
the Augmented Dickey Fuller (1981) and Phillips and Perron (1988) tests. The results are presented in
Table 4.
Table 4. Results of the ADF and PP Unit Root Tests
Augmented Dickey Fuller
Phillips-Perron
Variables Level Difference Level Difference
lq Constant
and trend
0.6883 -8.094* Constant
and trend
-6.125* -34.783*
ll -2.98 -10.8783* -2.901 -14.302*
linv -2.8723 -7.4134* -5.179* -10.038*
lex -2.9346 -12.0427* -5.215* -21.72*
lcompes -1.909 -12.9111* -5.925* -27.942*
ligat -1.9802 -2.2819 -5.865* -27.987*
ligac -3.4093 -2.7902 -4.805* -19.928*
lvpro Just
constant
-0.5247 -3.5660* Just
constant
-6.389* -34.644*
lL -2.416 -10.906* -2.135 -14.300*
linv -3.0008 -7.468* -5.369* -10.128*
lex -3.0068 -12.063* -5.258* -21.705*
lcompes -1.8973 -12.922* -4.759* -27.244*
ligaet -0.2606 -2.293 -1.959 -28.154*
ligaec -3.255** -2.677 -3.769* -19.746*
*Significance level of 1%. Critical value of -4.03;
**Significance level of 5%. Critical value of -3.44.
Source: Created by the authors.
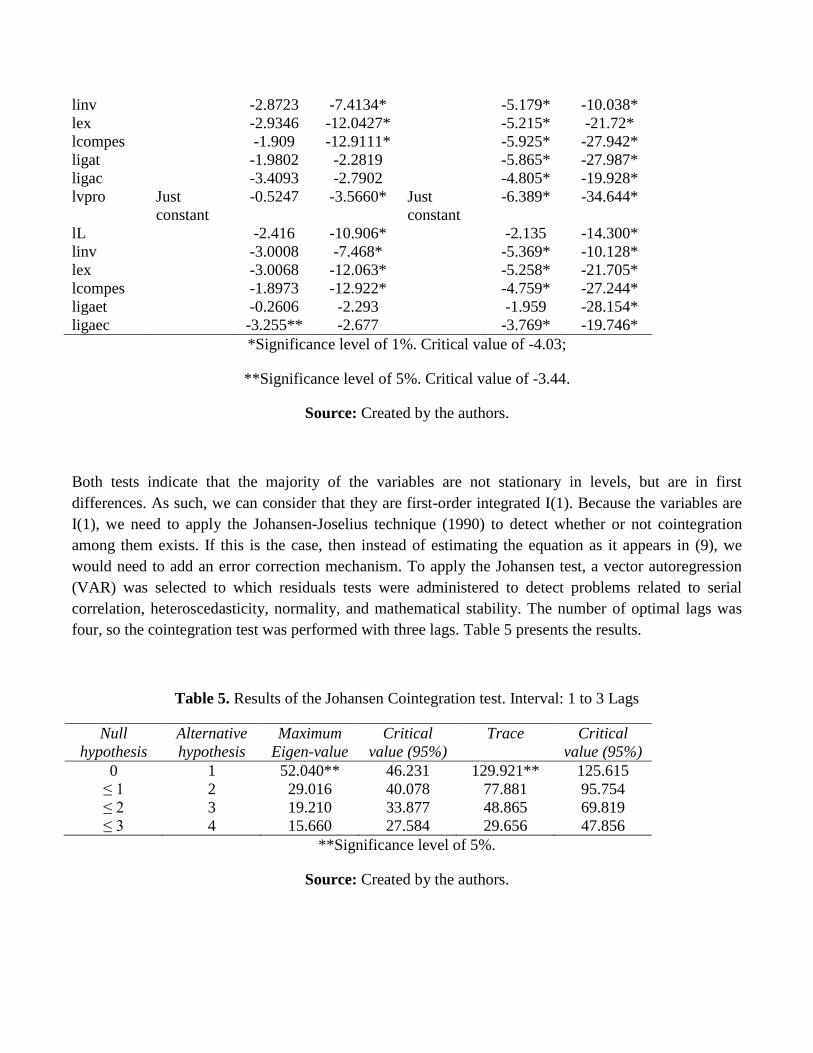
Both tests indicate that the majority of the variables are not stationary in levels, but are in first
differences. As such, we can consider that they are first-order integrated I(1). Because the variables are
I(1), we need to apply the Johansen-Joselius technique (1990) to detect whether or not cointegration
among them exists. If this is the case, then instead of estimating the equation as it appears in (9), we
would need to add an error correction mechanism. To apply the Johansen test, a vector autoregression
(VAR) was selected to which residuals tests were administered to detect problems related to serial
correlation, heteroscedasticity, normality, and mathematical stability. The number of optimal lags was
four, so the cointegration test was performed with three lags. Table 5 presents the results.
Table 5. Results of the Johansen Cointegration test. Interval: 1 to 3 Lags
Null
hypothesis
Alternative
hypothesis
Maximum
Eigen-value
Critical
value (95%)
Trace Critical
value (95%)
0 1 52.040** 46.231 129.921** 125.615
≤ 1 2 29.016 40.078 77.881 95.754
≤ 2 3 19.210 33.877 48.865 69.819
≤ 3 4 15.660 27.584 29.656 47.856
**Significance level of 5%.
Source: Created by the authors.

The maximum Eigen-value and trace statistics signal a rejection of the null hypothesis of no
cointegration, which means that the alternative hypothesis that there exists at least one vector is
accepted. Once the existence of cointegration was proven, we proceeded to the Engle Granger (1987)
theorem to estimate an error correction model (ECM). This model requires introducing the residuals
estimated in the cointegration equation (long-term) with one lag, in the short-term equation. The ECM is
only estimated with stationary variables, so all of the dependent variables were differentiated as
independent, so they now represent change rates. Table 6 presents the outcomes of the estimates for the
equation: q = d0 + d1 l + d2 inv + d3 ex + d4 compes + ecmt-1 + ℇ
Table 6. Estimates of the ECM. Dependent Variable: dq
9.1
9.2
9.3
9.4
Variabl
es
Coeffic
ient
T-est. Coeffic
ient
T-est. Coeffic
ient
T-est. Coeffic
ient
T-est.
C 0.001 0.17 -0.002 -0.26 -0.004 -0.59 -0.004 -0.61
DL 0.019 0.05 0.006 0.02 -0.244 -0.86 -0.253 -0.89
DINV -0.013 -0.61 -0.012 -0.55 -0.031 -1.22 -0.031 -1.15
DEX 0.058* 2.98 0.058*
*
2.99 0.022 1.56 0.023 1.59
DCOM
PES
-
0.067*
-3.48 -
0.067*
*
-3.47 -
0.060*
-4.76 -
0.060*
-4.67
DUM
MY
0.004 0.46 0.002 0.23 0.002 0.25
DIGAC 0.047 0.42
DIGAT 1.447* 9.13 1.405* 8.25
ECM(-
1)
-0.396 -4.64 -0.399 -4.69 -0.395 -3.86 -0.405 -3.79
AR(1) -0.332 -3.04 -0.331 -3.01 0.013 0.09 0.022 0.14
R2 0.419 0.420 0.653 0.654
S.E.
D.W. 1.995 1.994 1.978 1.978
LM test 0.951 [0.389
]
0.981 [0.377
]
0.271 [0.763
]
0.264 [0.769
]
BPG
test
1.626 [0.158
]
1.408 [0.216
]
1.348 [0.234
]
1.509 [0.161
]
Note 1: The d prefixed to the variables indicates first difference; Note 2: Diagnostic tests were
administered to the residuals to detect serial correlation problems (Lagrange Multiplier Test),
heteroscedasticity (Breusch-Pagan-Godfrey test), and normality (Jarque-Bera test). The probabilities are
given in brackets.

*Indicates 1% of statistical significance. The null hypothesis of insignificance is rejected.
Source: Created by the authors.
The results of the estimation of Model 9.1 indicate that the change rate for cement production (dq) is
positively related with the change in exports (dex). In other words, the stimulus to cement exports has
been an essential element that has had a positive effect on the rise in production in the industry during
this period. Although a lower proportion of cement production is destined for exportation, this amount
still seems to be an important determinant of growth, because it perhaps entails greater investment in
processes, more efficient use of resources, etc., such that it increases the value of production. We also
find that the rate of change in the competition (dcompes), measured by the share of imports, is an
element that has a negative impact on the national cement production rate. This indicates that, given the
market structure of the industry, the companies that comprise the oligopoly have little or no incentive to
permit competitors to gain a greater share of the market. This result suggests that it is possible that the
Mexican industry favors the barrier to entry for new competitors, which would match up with what other
studies have identified in terms of the existence of cartels in the cement industry in other countries,
aiming to maintain market power (Pradhan, 1992; Kleit and Palsson, 1996; Blum, 2007; Levenstein and
Suslow, 2006). With the reference framework of the theory of the oligopoly, De la Garza and Arteaga
(2011) tried to identify the nature of the behavior of the cement industry in Mexico. Drawing on data
from 2005 to 2007, the authors found no evidence of collusion, but rather of Stackelberg-type
competition, but these estimates were not robust. In terms of the effect of national-order variables, the
growth rate in employment and fixed investment turned out to be not statistically significant.
In the estimate of Model 9.2, a fictitious variable (dummy) was added to measure the impact of the
elimination of tariff barriers imposed by the United States, in particular, starting in April 2009, when the
tariffs were done away with altogether. In this case, the dummy coefficient was positive but not
significant, which indicates that the openness of the United States market, although with the correct sign,
did not affect the growth rate of the production value. Industry performance seems to have been
divorced from the sanctions imposed by the United States, perhaps due to business strategies that
consider the domestic market as the principal destination for its production, but also precisely because
when the tariff barriers were dismantled in 2009, the United States fell into a severe recession because of
the financial crisis.
In the estimates of Models 9.3 and 9.4, two national-order variables were added to determine whether
economic activity in general and that of the construction industry, specifically, are explanatory of the
growth in the value of production. Accordingly, the variable igat was added, which is an overall
indicator of total economic activity, and igac was also added, which is an overall indicator of economic
activity, but only of the construction industry. Both variables are measured through the physical volume
of production index calculated by INEGI, used to measure short-term changes in production. The
estimation of Model 9.3 shows that the change rate of the variable digat has a positive and significant

effect on the growth rate of cement production equal to 1.447. This indicates that the growth of
economic activity in general generates higher demand for cement and, as a result, there is an effect on
cement production, because it includes not only commercial and industrial production but also that of
self-construction, and infrastructure expansion and improvements, as well as any other activities that use
cement as a raw material.
In Model 9.4, the variable digac was added to determine whether, specifically, it was the growth of the
construction industry that had an impact on the change rate of cement production. The results indicate
once again that it is total economic activity digat, and not just construction, which has a statistically
significant effect on the value of cement production. Much of the demand for cement is to build
infrastructure for government projects, which represent about 30% and 40% of demand, with around
40% for self-construction of housing and developers and around 20% for commercial and industrial
construction. As such, it is evident that cement production and sales depend on economic conditions,
federal government spending, credit for housing, and even the inflow of remittances, all of which are
considered triggers for rising cement consumption.
Conclusions
In general, the main results of the models illustrate that the growth rate of cement production in Mexico
cannot be explained by internal-order elements of the industry, such as changes in employment or fixed
investment, but rather that it responds positively to the demand for exports and negatively to the
participation of foreign competitors. Given that exports still represent a low proportion of the total value
of production, the quantitative effect on the cement growth rate is low. The same is true of foreign
competition. However, the negative relationship with cement production is evident, which is why we
believe there is little chance that the industry would view the entrance of large volumes of imports as
favorable. Considering that the market structure is oligopolistic, this result suggests, indirectly, that the
cement industry has greater incentives to maintain price- or amount-setting agreements in order to
prevent outside competitors from making inroads and to increase profits.
When we add in a variable to measure the effect of national economic activity, we find a strong cause-
effect relationship between the physical production of the economy and the change rate in cement
production. If we consider that the top destination for cement is the domestic market, then the notion
that the cement industry is strongly tied to the behavior of the national economy is only further
reinforced.

Finally, in recognition that the estimates of the models may be sensitive to specification errors, the
results show consistently that the greater the share of the market obtained by foreign competition in
Mexico, the more negative the impact on the growth of the industry. This confirms the fact that national
cement production looks to the domestic market as its main source of growth and justifies the
oligopolistic market structure that favors coordinated decision-making.
1The data from the cement industry refer to the data classified by INEGI in branch 327310:
“Manufacturing of cement and cement-based products in integrated plants.”
Bibliography
Aguilar, Roberto (2014), “Lafarge-Holcim a la caza de Cemex en su territorio”, Alto Nivel, 18 de agosto
(consultado el 17 de febrero de 2016), disponible en <http://www.altonivel.com.mx/44689-
lafargeholcim-a-la-caza-de-cemex-en-su-territorio.html>
Avalos, Marcos y Claudia Schatan (2003), Condiciones de competencia en el contexto internacional:
cemento, azúcar y fertilizantes en Centroamérica, Working paper EGAP-2004-08, Monterrey, México
(consultado el 3 de marzo de 2007), disponible en
<http://alejandria.ccm.itesm.mx/egap/documentos/EGAP-2004-08.pdf>
Banco de México, Estadísticas, varios años (consultado el 26 de febrero de 2016), disponible en
<http://www.banxico.org.mx/estadisticas/index.html>
Barragán Villareal, Juan y Mario Cerutti (2003), Cemex: del mercado interno a la empresa global,
Associação Brasileirá de Pesquisadores em História Econômica, V Congresso Brasileiro de História
Econômica e 6ª Conferência internacional de História de Empresas, Caxambu/2003 (consultado en
agosto de 2006), disponible en
<http://www.abphe.org.br/arquivos/2003_juan_ignacio_barragan_mario_cerutti_cemex-del-mercado-
interno-a-la-empresa-global.pdf>
Blair, Roger y David L. Kaserman (1983), Law and Economics of Vertical Integration and Control,
New York, Academic Press.
Blum, Ulrich (2007), “The East German Cement Cartel: Cartel Efficiency and Policy after Economic
Transformation”, Eastern European Economics, vol. 45, núm. 6, pp. 5-28.
Cámara Nacional del Cemento (CANACEM) (2015), Estadísticas, México, CANACEM (consultado el
22 de septiembre de 2015), disponible en <http://www.canacem.org.mx/2006>
Carlton, Dennis (1979), “Vertical Integration in Competitive Markets under Uncertainty”, Journal of
Industrial Economics, vol. 27, núm. 3, pp. 189-209.
Cemex (2016), Tipos de cemento, productos y servicios: cemento (consultado el 26 de febrero de 2016),
disponible en <http://www.cemex.com/ES/ProductosServicios/TiposCemento.aspx>
Cohen-Meidan, Maya (2013), “The Heterogeneous Effects of Trade Protection: a Study of US
Antidumping Duties on Portland Cement”, Review of Industrial Organization, vol. 42, pp. 369-394.
Cook, Robert (1994), “Cement Exports from Mexico”, TED Case Studies, vol. 3, núm. 2.

Corrales, Salvador (2006), Redes productivas en la Industria Acerera. El caso de Altos Hornos de
México, S. A. 1982-2002, Tijuana, El Colegio de la Frontera Norte.
De la Garza, Óscar y Julio Arteaga García (2011), “Análisis de la competencia en la Industria
Cementera en México”, EconoQuantum, vol. 8, núm. 1, pp. 73-89.
De la Rosa, Tomás (2016), “El cemento más caro del mundo” (consultado el 4 de mayo de 2016),
disponible en <http://www.economiahoy.mx/economiahoy/opinion/noticias/6632952/04/15/El-cemento-
mas-caro-del-mundo.html>
Dickey, David A. y Wayne A. Fuller (1981), “Likelihood Ratio Statistics for Autoregressive Time
Series with a Unit Root”, Econometrica, vol. 49, núm. 4, pp. 1057-1072.
Engle, Robert F. and Granger C. W. J. (1987), “Co-Integration and Error Correction: Representation,
Estimation, and Testing”, Econometrica, vol. 55, núm. 2, pp. 251-276.
García, Eduardo (2004), “Cemex y su escaramuza con Mary Nour reaviva la polémica sobre la
competencia en la industria”, Revista Sentido Común (consultado en agosto de 2006), disponible en
<http://www.sentidocomun.com.mx/artículo_buscado.phtml>
Ghemawat, Pankaj y Catherine Thomas (2005), Multinational Agglomeration in the Cement Industry:
Patterns, Drivers, and Performance Implications, Harvard Business School (consultado en febrero de
2006), disponible en <http://www.rotman.utoronto.cal~baum/workshop/Ghemawat_worksho.pdf>
Gutiérrez, Salvador y Francisco Núñez (2002), Caso Trabajo Final: Cemex, construyendo el futuro,
México, ITESO (consultado en agosto de 2006), disponible en
<http://iteso.mx/~fnunez/eegutierrez/final.doc>
Hernández, Ma. Vianney (2004), Caso de Estudio: Cemex, México, ITESO (consultado en agosto de
2006), disponible en <http://iteso.mx/~fnunez/ee2004hernandezcemex.doc>
Hernández Pérez, David (2004), Gaceta Parlamentaria, Exposición de Motivos para regular los precios
del cemento en el mercado nacional e internacional, Gaceta LIX/1SPR-162388, 18 de agosto, México,
Senado de la República (consultado en agosto de 2006), disponible en
<http://www.senado.gob.mx/index.php?ver=sp&mn=2&sm=2&id=2388>
Instituto Nacional de Estadística y Geografía (INEGI) (2015a), Encuesta Anual de la Industria
Manufacturera. Varios años, México (consultado el 16 de febrero de 2016), disponible en
<http://www.inegi.org.mx/sistemas/bie/?idserPadre=10800070#D10800070>
______ (2015b), Encuesta Mensual de la Industria Manufacturera. Varios años, México (consultado el
16 de febrero de 2016), disponible en
<http://www.inegi.org.mx/sistemas/bie/?idserPadre=10800070#D10800070>
______ (2015c), Encuesta Industrial Mensual Ampliada. Varios años, México (consultado el 11 de
marzo de 2016), disponible en
<http://www.inegi.org.mx/sistemas/bie/?idserPadre=10800070#D10800070>
Johansen, S and K. Juselius (1990), “Maximum Likelihood Estimation and Inference on Co-integration
with Application for the Demand for Money”, Oxford Bulletin of Economics and Statistics, vol. 52,
núm. 2, pp. 169-210.
Kang, N. and K. Sakai (2000), “International Strategic Alliances: Their Role in Industrial
Globalization”, OECD Science, Technology and Industry Working Papers, 2000/5, OECD
Kleit, A. y H. Palsson (1996), “Is There Anticompetitive Behavior in the Central Canadian Cement
Industry? Testing Arbitrage Cost Hypothesis”, Canadian Journal of Economics, pp. 343-356.
Kumakan, Gabesh y Saúl Martínez (2008), “Evolución reciente de la industria de cemento: un estudio
comparativo entre México y la India”, Revista Mexicana de Estudios sobre la Cuenca del Pacífico, vol.
2, núm. 3, pp. 165-202.

Levenstein, Margaret y Valerie Suslow (2006), “What Determines Cartel Success?”, Journal of
Economic Literature, vol. 44, núm. 1, pp. 43-95.
Phillips, Peter C. B. y Pierre Perron (1988), “Testing for a Unit Root in Time Series Regression”,
Biometrika, vol. 75, núm. 2, pp. 335-346.
Pozas, María de los Ángeles (1999), Mexican Firms in the New Global Economy, PhD, Dissertation,
The John Hopkins University, Baltimore, Maryland, USA.
Salomón, Alfredo (2006), “La Industria del Cemento en México”, Comercio Exterior, vol. 56, núm. 9,
pp. 812-824.
Secretaría de Economía (2006), Acuerdo México-Estados Unidos sobre Comercio de Cemento.
Dirección de Comunicación Social (consultado en agosto de 2006), disponible en
<http://www.economia-nci.gob.mx/sphp_pages/sala_prensa/textobd.php?res=943>
______ (2016), Sistema de Información Arancelaria vía Internet SIAVI (consultado el 15 de marzo de
2016), disponible en <http://www.economia-snci.gob.mx>
Shantayanan, Deverajan y Dani Rodrik (1989), “Trade Liberalization in Developing Countries: do
Imperfect Competition and Scale Economies Matter?”, The American Economic Review, vol. 79, núm.
2, pp. 283-287.
Sterner, Thomas (1990), “Energy Efficiency and Capital Embodied Technical Change: The Case of
Mexican Cement Manufacturing”, The Energy Journal, vol. 11, núm. 2, pp. 155-167.
Torres, Enrique (2014), “El nuevo competidor en la Industria Cementera”, Forbes, 2 de octubre
(consultado el 24 de febrero de 2016), disponible en <http://www.forbes.com.mx/el-nuevo-competidor-
en-la-industria-cementera>
Torres, Armando (2004), “Disputa por cemento ruso”, Revista Fortuna, año II, núm. 20 (consultado en
agosto de 2006), disponible en
<http://revistafortuna.com.mx/opciones/archivo/2004/septiembre/html/negocios/disputa.htm>
US Department of Commerce (2009), Gray Portland Cement and Clinker from Mexico: Initiation of
Changed Circumstances Review, Preliminary Results of Review, International Trade Administration,
Federal Register, vol.74, núm. 30, pp. 7393-7394 (consultado el 26 de febrero de 2016), disponible en
<http://www.strtrade.com/media/publication/333_2009-February-16-ita_mexico_cement.pdf>
Varian, Hal R. (2011), Microeconomía intermedia, 8ª ed, Antoni Bosch, Barcelona.
Vera Martínez, Paola (2013), “La industria del cemento entre la sustentabilidad y la inestabilidad
financiera” [tesis de doctorado], UNAM, Programa de Posgrado en Ciencias de la
Administración, diciembre (consultado el 24 de febrero de 2016), disponible en
<http://132.248.9.195/ptd2013/noviembre/0705167/0705167.pdf>