the cellular thermal shift assay for evaluating drug target
TRANSCRIPT

©20
14 N
atu
re A
mer
ica,
Inc.
All
rig
hts
res
erve
d.
protocol
2100 | VOL.9 NO.9 | 2014 | nature protocols
IntroDuctIonWe developed CETSA to monitor and quantify the extent to which a drug candidate reaches and directly binds to a protein target of interest within a cell1. It relies on the principle of thermodynamic stabilization inferred to the protein as a result of ligand binding, which can be used for the estimation of binding free energies, as well as other thermodynamic properties, for isolated systems at equilibrium2–5. Melting temperature (Tm) shift assays (TSAs) have been of great value in the drug discovery industry for more than a decade, allowing compound libraries to be screened for the presence of stabilizing ligands on isolated targets using, e.g., fluorescence- or light scattering–based techniques6–9. Similarly, academic research has made extensive use of TSAs in, e.g., struc-tural genomics initiatives, as a means to effectively deconvolute ligand specificities among members of groups of proteins10,11. The CETSA approach builds on the same principle as conven-tional TSAs, although it greatly broadens the utility, as the ligand-induced stabilization is investigated at the target level in more complex environments such as in cell lysates, intact cells and even tissues1. The possibility to directly study target engagement in primary cells helps preserve, to the best of our understanding, the correct subcellular localization, post-translational modifica-tions and interactions with proteins and other biomolecules, and thereby the biological relevance of the studied system. As such, the CETSA methods complement similar studies on purified proteins. In addition, target engagement is a direct measure of the bind-ing of ligand to a target, much in contrast to phenotypic assays in which the response to a compound is based on a functional readout, such as altered levels of metabolites, changes in the phos-phorylation status of downstream targets or impact on cellular viability. The involvement of a target of interest in the functional response can be inferred through the use of known modulators, if these are sufficiently selective, and based on prior knowledge
of target function. The CETSA approach offers the possibility to firmly link the observed phenotypic response to a compound with a particular target engagement.
A typical output from a CETSA experiment is a comparison between apparent melting curves (or, more accurately, tempera-ture-induced aggregation curves), in which the protein in the presence and absence of ligand is subjected to a panel of tempera-tures such that a potential thermal stabilization can be assessed. Alternatively, an isothermal dose-response curve is generated, in which the stabilization of the protein can be followed as a function of increasing ligand concentration. The latter requires knowledge of the temperature at which the unliganded protein denatures and precipitates. In either format, but most easily as an isothermal dose-response curve, CETSA can be used in drug discovery programs to address the fundamental questions of whether the drug candidates actually engage their intended tar-gets in a biologically relevant setting and at what concentration regimes they exert their effects. In a preclinical and clinical setting, the measure of target engagement in vitro and in specific tissues (e.g., tumors) is a reliable reporter showing whether the drug reaches the intended tissue and acts on the protein of interest. A comparison of compounds and their binding to the targets of choice in cells from multiple patients could aid in predicting treatment response in clinical trials and as a diagnostic tool in the clinic12,13. It is thus our hope that the CETSA method can be developed as a means to select treatment for patients, set treatment schemes, adjust dosing and even monitor treatment resistance.
Practically, the shift in thermal stability is estimated by measur-ing the amount of remaining soluble target protein at different temperatures for ligand-treated and control samples. As such, CETSA procedures rely on the irreversible aggregation that fol-lows denaturation of the target protein of choice9. In this way,
The cellular thermal shift assay for evaluating drug target interactions in cellsRozbeh Jafari1, Helena Almqvist2, Hanna Axelsson2, Marina Ignatushchenko1, Thomas Lundbäck2, Pär Nordlund1 & Daniel Martinez Molina1
1Department of Medical Biochemistry and Biophysics, Division of Biophysics, Karolinska Institutet, Stockholm, Sweden. 2Chemical Biology Consortium Sweden, Science for Life Laboratory Stockholm, Division of Translational Medicine and Chemical Biology, Department of Medical Biochemistry and Biophysics, Karolinska Institutet, Solna, Sweden. Correspondence should be addressed to T.L. ([email protected]), P.N. ([email protected]) or D.M.M. ([email protected]).
Published online 7 August 2014; doi:10.1038/nprot.2014.138
thermal shift assays are used to study thermal stabilization of proteins upon ligand binding. such assays have been used extensively on purified proteins in the drug discovery industry and in academia to detect interactions. recently, we published a proof-of-principle study describing the implementation of thermal shift assays in a cellular format, which we call the cellular thermal shift assay (cetsa). the method allows studies of target engagement of drug candidates in a cellular context, herein exemplified with experimental data on the human kinases p38a and erK1/2. the assay involves treatment of cells with a compound of interest, heating to denature and precipitate proteins, cell lysis, and the separation of cell debris and aggregates from the soluble protein fraction. Whereas unbound proteins denature and precipitate at elevated temperatures, ligand-bound proteins remain in solution. We describe two procedures for detecting the stabilized protein in the soluble fraction of the samples. one approach involves sample workup and detection using quantitative western blotting, whereas the second is performed directly in solution and relies on the induced proximity of two target-directed antibodies upon binding to soluble protein. the latter protocol has been optimized to allow an increased throughput, as potential applications require large numbers of samples. Both approaches can be completed in a day.
©20
14 N
atu
re A
mer
ica,
Inc.
All
rig
hts
res
erve
d.
protocol
nature protocols | VOL.9 NO.9 | 2014 | 2101
CETSA is similar to light scattering–based assays used for looking at isolated proteins. There are, however, several ways to specifi-cally evaluate the levels of remaining soluble protein after a heat challenge. Here we describe the general requirements for this methodology and discuss available options in the protocol along with tentative applications and their limitations. We have used the human kinases p38α and ERK1/2 as example cases for working out CETSA protocols for low-throughput characterization and high-throughput screening applications.
Applications of the methodIn our original proof-of-principle publication1, we showed that proteins often unfold and precipitate sufficiently independently in cells, so measurement of thermal stabilization owing to ligand binding is feasible using CETSA. As such, the CETSA approach can give critical target engagement information for a range of different drug targets. The method was validated by using several model systems to address problems such as drug efficacy, drug transport, drug activation, off-target effects and drug resistance in mammalian cells, as well as drug distribution in animals. The CETSA process used in the proof-of-principle study starts with the treatment of cells with either drugs or control, followed by heating of the cells to denature and precipitate the protein of interest, cell lysis, removal of cell debris and aggregates through centrifugation, and finally detection of the remaining thermostabilized target protein by, e.g., denaturing gel electrophoresis and western blot detection using target-specific antibodies. The obtained apparent aggregation temperatures (Tagg), with and without drugs, can be compared, and substantial shifts demonstrate ligand binding.
A key feature of the method is that it allows researchers to use a common technological platform for studies of biological sys-tems of increasing complexity and relevance to a clinical situation. A drug discovery program could start with a screen of compound libraries for stabilizing compounds of a defined protein target in cell lysates using CETSA. Identified molecules can then be fur-ther characterized in terms of their ability to reach and bind the target in adequately chosen intact cells, thereby also addressing, for example, permeability and general protein-binding aspects. Comparisons of target engagement in cell lysates versus intact cells provide a means to systematically study the aspects that con-trol ligand availability to the target protein1. By using the same approach and reagents, one can next examine drug distribution in different tissues, first in animal models and potentially also later in patient cells during clinical studies to confirm access to and impact on the target protein. Finally, the same underlying princi-ple could constitute the basis of an accompanying diagnostics kit for selection of patients in whom the target remains responsive to the drug. Hence, there are a number of applications in which the CETSA method would be an attractive reporter assay.
For example, applying CETSA for primary screening of reason-ably sized compound libraries could serve to identify starting points for medicinal chemistry programs. As many target classes offer a broad range of screen assay alternatives, this approach may be of particular interest for targets that are difficult to express and purify in a biologically active and relevant form or for which other assay formats are difficult to establish for technical reasons. In our experience, and similarly to standard TSA approaches, CETSA rarely gives false positive ligand-binding data, in contrast to many activity-based assays14,15. Therefore, we see an immediate need
for the verification of target binding for identified hit compounds from high-throughput screening campaigns of isolated targets in order to focus downstream efforts on the most relevant set of compounds. As already outlined, such confirmatory experiments can be conducted in a panel of different in vitro systems, which besides Tm shift assays and other biophysical studies on the iso-lated target can also include CETSA applications in cell lysates, overexpressing cells, primary cells or even tissues. The possibility to recombinantly overexpress the target of interest also provides an option to include epitope tags or reporters to enable generic detection protocols. We believe that the ability to confirm direct binding in a cellular setting will have a role as an important complement to ‘close-to-target’ assays in cells (i.e., functional assays based on the known or presumed function of the target protein). This serves the purpose of associating target engage-ment to the functional response and in the end also to the desired phenotypic readout. The coupling to a specific target engage-ment is crucial, as the desired phenotypic response may often come across as a consequence of modulation of a broad range of targets, which is the case, for example, with cell viability assays. The close-to-target assays and the on-target CETSA approach will help to firmly link the phenotypic response to the desired mechanism of action involving the target of interest. Along the same lines, we are investigating the possibility to use the CETSA approach for unbiased target identification purposes, i.e., using quantitative mass spectrometry (MS)16 to study how the acces-sible portion of the proteome responds to compounds identified in phenotypic screens.
The possibility to investigate target binding and stabilization in a cellular setting will also help address aspects of the studied ligands other than the intrinsic affinity for the target, i.e., aspects affecting the availability of the ligand in the investigated system. A prerequisite for a positive CETSA response is that the ligand reaches the target in sufficient amounts in a complex background of the intact viable cell and its surroundings. Such aspects can be studied by varying serum concentration in the cell culture to examine the effect of plasma protein binding. Alternatively, cells that suppress or overexpress important transport proteins could be used for studies of factors that control cellular permeability of the ligand. We have previously demonstrated that time-dependent accumulation, as well as intracellular modification, can be assessed for inhibitors of thymidylate synthase1. The latter exam-ple serves to illustrate that CETSA experiments in cells are able to pick up compounds that require metabolic activation to become active ligands and that would have been missed if assayed for with isolated target protein.
Experimental designThe CETSA protocol relies on a few crucial components; first, a heating step in which target proteins denature and precipitate unless stabilized through ligand binding and, second, a step in which proteins that remain stable during heating are distinguished from proteins that denature and precipitate (see Fig. 1 for an out-line of the general protocol). The latter can be achieved either through separation of the soluble material, e.g., by centrifugation or filtration of the samples to remove denatured and precipitated material, or by using a detection method capable of distinguishing between these entities (e.g., one based on antibodies recognizing only the folded protein). Below is a general description of two
©20
14 N
atu
re A
mer
ica,
Inc.
All
rig
hts
res
erve
d.
protocol
2102 | VOL.9 NO.9 | 2014 | nature protocols
different variants of the CETSA protocol followed by an outline of known and anticipated limitations. As already alluded to above, many of the steps can be varied to address fundamental aspects of the studied target protein and system, such as the protein source (cell lysate, intact cells, biopsies or tissue extracts), the means by which the sample is treated with compounds before heating, the means and time applied for sample heating and the method used for cell lysis (when applicable). The need for sample workup, such as the separation of the remaining stabilized protein from the denatured and precipitated material, as well as the ways to do so, is also variable and is intimately linked to the choice of detection method.
General sample preparation and detection using western blotting. In our original presentation of the CETSA metho-dology1, we introduced a western blot–based procedure as an attractive choice for the detection of stabilized soluble protein. It is a method available to any biochemistry laboratory housing standard equipment for gel electrophoresis, as well as western blot running systems and cameras for quantitative analy-sis. CETSA methods are simple to establish in this format, and the only unique reagent required for a given assay is a specific antibody directed toward the protein of interest. In addition, western blotting approaches provide a direct visual confirmation not only of the presence but also of the size of the target protein of interest, thus providing insurance that the correct protein is indeed recognized by the antibody and that assay conditions are appropriately chosen to prevent target protein degradation. This approach is suitable for studies of one or a few proteins in parallel with a limited number of known ligands.
Before running CETSA on a new target of interest, there are a few initial experiments and choices that are important. First, the origin of the protein source (i.e., cell type and culture conditions) must be chosen such that it reflects the studied biology in the best possible way. A minimal requirement is that the protein is expressed in sufficient quantities and in a relevant form allowing ligand binding. Second, to obtain sufficient selectivity for a given target protein, a high-quality antibody directed toward the tar-get protein must be selected. If experiments are to be conducted in immortalized cell lines, it is possible to do a quick screen on lysates from several cell lines using one or several antibodies in the same experiment (Box 1). Finding a high-quality antibody that gives a single band on the western blot for the protein of interest is ideal for allowing quantitative detection, and we recommend that a few antibodies be tested in order to validate an appropriate
western blot protocol to achieve this. The selectivity of the antibodies can be further validated by running MS analysis on the detected bands or by the use of blocking peptides when applicable. The appropriate cellular condition or cell status should also be carefully chosen and validated. In this regard, data mining to find information on expression profiles of the target of interest could supply valuable information about optimal cell conditions for the target protein.
Before running CETSA on the protein in the selected cell line or primary cells, a melting curve (spanning a wide temperature range) must be established in the absence of any stabilizing ligands so that the apparent Tagg of the protein of interest can be determined. During these preliminary experiments, a few other parameters are investigated, including sample volumes, cell densi-ties, heating duration, and the appropriate means for separating protein aggregates and cellular debris from the remaining soluble protein fraction. In addition, the method of cell lysis after heating of the cells must be optimized to ensure complete and uniform
In vitro Ex vivo In vivo Ex vivo In vivo
Lysate orintact cells
Collect organsof interest
Collect organsof interest
Aliquot samples for meltingcurve or dose-response
curve
Biopsy orsample
frompatient
Biopsy orsample
fromtreated patient
Treatment
Treat sampleswith compound
Heat to temperature range for melt curveor selected temperature for ITDRF
Homogeneousdetection
Identify native protein withantibody pairs
Follow protocol outlined inFigure 2, if using AlphaScreen
Donor
1O2
Celllysis
Separatecell debris and precipitate
from soluble protein
Centrifugation or filtering
Denaturing detectionmethods — SDS-
PAGE+ western blot
Quantification + analysis
100
Hospital
50
Rel
ativ
eba
nd in
tens
ity (
%)
0
10–4 10–3 10–2 10–1
Temperature, °C
100 101 102
100
50
040 43 46 49 52 55 58 61 64 67 70
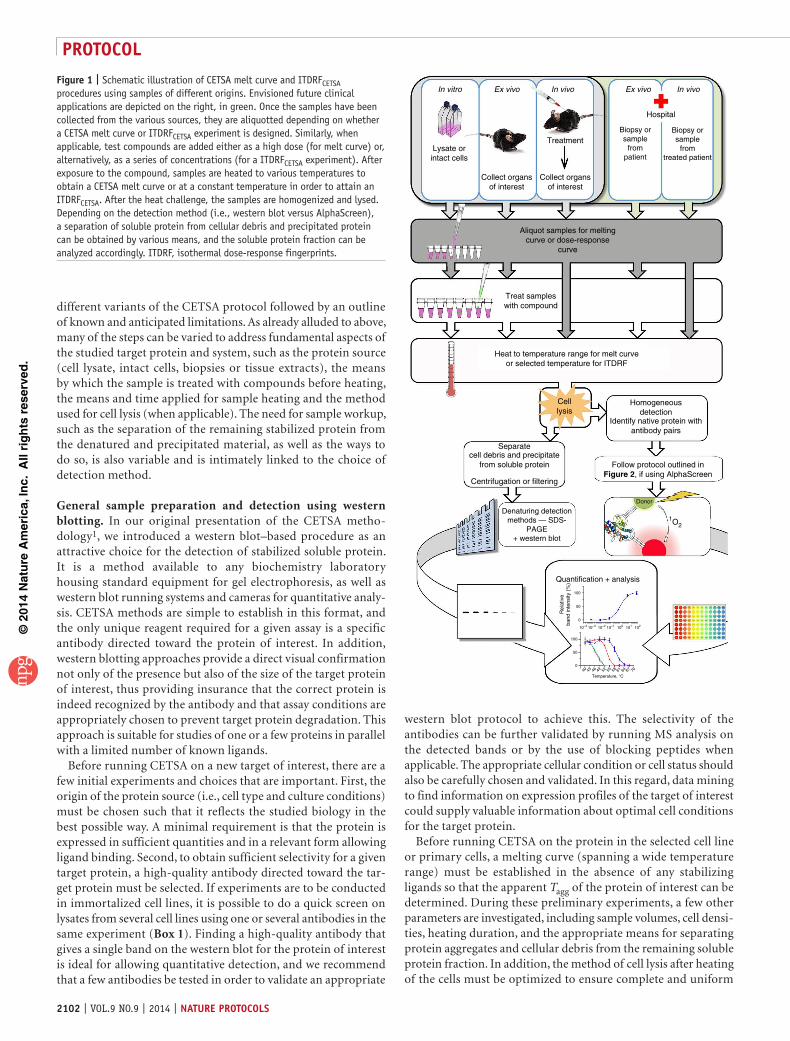
Figure 1 | Schematic illustration of CETSA melt curve and ITDRFCETSA procedures using samples of different origins. Envisioned future clinical applications are depicted on the right, in green. Once the samples have been collected from the various sources, they are aliquotted depending on whether a CETSA melt curve or ITDRFCETSA experiment is designed. Similarly, when applicable, test compounds are added either as a high dose (for melt curve) or, alternatively, as a series of concentrations (for a ITDRFCETSA experiment). After exposure to the compound, samples are heated to various temperatures to obtain a CETSA melt curve or at a constant temperature in order to attain an ITDRFCETSA. After the heat challenge, the samples are homogenized and lysed. Depending on the detection method (i.e., western blot versus AlphaScreen), a separation of soluble protein from cellular debris and precipitated protein can be obtained by various means, and the soluble protein fraction can be analyzed accordingly. ITDRF, isothermal dose-response fingerprints.

©20
14 N
atu
re A
mer
ica,
Inc.
All
rig
hts
res
erve
d.
protocol
nature protocols | VOL.9 NO.9 | 2014 | 2103
lysis of cells in all samples, whereas the soluble protein is kept in solution. This can be systematically achieved using various protocols and/or lysis buffers (e.g., with and without detergents), ensuring that the detergent does not solubilize any aggregates of the protein of interest. The removal of protein aggregates and cellular debris from the remaining soluble protein fraction after heating and lysis can be achieved by centrifugation or filtration. Other sample workup procedures, such as the use of affinity reagents that recognize only the folded protein, can also be envisioned either by the use of affinity purification or by direct detection of folded protein16.
When the basic components of the protocol have been put in place, the CETSA experiments can be initiated, first by determin-ing a melting curve for the target protein with a known ligand present in order to obtain information on the extent of stabiliza-tion inferred (part 1 of the PROCEDURE). Here additional fac-tors must be considered, such as the concentration of the ligand and the duration of exposure. For cellular systems, it is crucial to allow enough time for transport of the compounds across the cell membrane. Furthermore, certain compounds are modified and activated before engaging their intended targets. Therefore, it is important to allow enough time for these processes to occur during the preincubation step. The effect of a compound on the cells in terms of viability and cell numbers should be carefully monitored, so that similar amounts of cells are used as in the control experiment without the compound. This is particularly important given that ligand concentrations at the protein target must exceed the dissociation constant to observe stabilization2,5,
which means that the compound concentrations used in the CETSA approach are likely to be higher than those applied in functional cell assays. Before the heating step, it is also optional to wash the cells of any excess drug. It should be pointed out, however, that such washing steps will affect the equilibria in the experiment, and ligands with rapid off-rates could be lost. This will be discussed in more detail in the ‘Limitations’ section.
The primary objective of the experiment comparing apparent melting curves for the protein targets in treated cells and control cells, besides obtaining information on the absolute shift size, is to visualize the temperature at which an isothermal dose-response experiment can be run (part 2 of the PROCEDURE). Whereas part 1 of the PROCEDURE establishes temperature-induced aggregation curves, including potential stabilization with compounds, part 2 of the PROCEDURE involves doing the dose-response experiments at a fixed temperature. Such dose-response experiments can be performed at temperatures at which a statistically significant difference is observed between protein levels in ligand-stabilized and control samples. Depending on the purpose of the experiment and the number of data points required to obtain such a difference, it may be preferable to work at a temperature at which the difference is maximal or at the lowest possible temperature to minimize deviations in observed dose-responses compared with those at the biologically relevant temperature (most often 37 °C). As a rule of thumb, the heat-ing temperature is kept as low as possible, given that the ligand concentration required to reach the inflection point of the dose-response curve increases with temperature in most cases, which
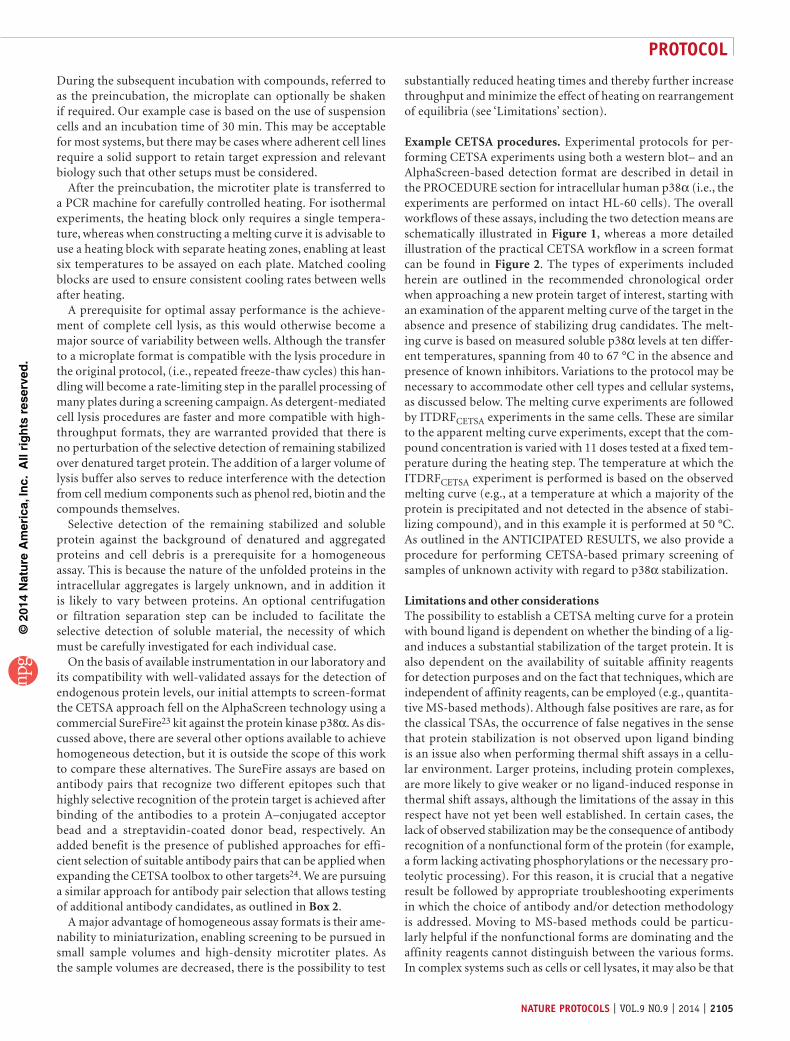
Box 1 | Antibody and cell line screen ● tIMInG variable, depending on cell lines and antibodiesTo find and optimize the antibody and cell line used for CETSA western blot–based experiments, a simple screen can be conducted. Sim-ply run SDS-PAGE gels with an array of cell lines that could be biologically relevant for the experiment; follow this by western blots using your antibodies of choice.
procedure1. Expand the cell lines to be screened according to a standard cell culture protocol.2. Collect a suitable amount of each cell line and wash the cells with suitable wash buffer.3. Add a buffer of choice to the tubes, resuspend the cells and snap-freeze the cells in liquid nitrogen.4. Freeze-thaw the cells twice using liquid nitrogen and a thermal cycler or heating block set at 25 °C.5. Briefly vortex the tubes and centrifuge the tubes containing the cell lysates at 20,000g for 20 min at 4 °C to pellet the cellular debris.6. Remove an aliquot from each cleared cell line lysate and mix with the SDS-PAGE loading buffer of your choice and follow the manufacturer’s recommendations.7. Load each cell line sample on separate lanes in a preferred gel. Depending on the number of antibodies to be tested, load the same samples on matching number of gels.8. Perform the SDS-PAGE separations and transfer the samples to nitrocellulose membranes; follow by antibody incubations according to the supplier’s recommendations.9. After development and analysis, choose the antibody cell line pair that gives the cleanest and sharpest signals and bands.
Cell line Cell line
Antibody 1 Antibody 2 Antibody 3
1 2 3 4 5 6 1 2 3 4 5 6Cell line
1 2 3 4 5 6
This image shows a schematic illustration of a hypothetic outcome from a cell line and an antibody screen. In this particular experiment, antibody 3 and cell line 2 offer the best possible combination for western blot experiments.

©20
14 N
atu
re A
mer
ica,
Inc.
All
rig
hts
res
erve
d.
protocol
2104 | VOL.9 NO.9 | 2014 | nature protocols
translates into an unnecessary elevation of ligand concentrations (empirical observations in our laboratory; see also the discussion on data interpretation under ‘Limitations’ section). As the choice of experimental conditions, including cell medium conditions and timing, as well as test temperatures, influences the observed dose-response, we refer to these results as isothermal dose-response fingerprints or ITDRFCETSA (ref. 1). In our laboratory, most of the dose-response studies are conducted at temperatures above the apparent Tagg, at which a majority of the unliganded protein has denatured and aggregated, but in certain cases experiments are also conducted at or below the apparent Tagg. The dose-response curve can be established from any number of concentrations and with desired increments in ligand concentration.
A major advantage of western blot–based detection is the excellent availability of high-affinity antibodies to exposed epitopes in denatured proteins. In addition, if applicable, multiplexing with several antibodies against other relevant proteins in the same western blot experiment can increase output and provide information about selectivity and off-target effects of the investigated compounds. In this format, this is particularly useful when investigating selectivity to related proteins (e.g., homologous kinases such as cyclin-dependent kinases1), or a few targets for which adverse effects must be monitored. This, how-ever, requires highly specific antibodies giving rise to a single band for each protein, as well as substantial differences in molecular sizes between the proteins to allow sufficient separation and thus accurate quantification and interpretation. Furthermore, as west-ern blotting is based on the detection of SDS-PAGE–separated proteins, it is less prone to artifacts that may arise in other detec-tion formats, such as interference from phenol red and biotin in the cell culture medium or from the investigated compounds themselves, which could be colored or fluorescent. As an alterna-tive, MS-based technologies could be used to identify putative stabilization of a broad panel of proteins and to provide a more comprehensive view of off-target effects. As already mentioned, this approach could possibly also allow deconvolution of pheno-typic screen readouts with respect to which targets are engaged by the identified compounds.
Screen format with homogeneous detection. Whereas the western blot format can accommodate up to a few hundred data points, some of the tentative CETSA applications require a mark-edly higher daily sample throughput. Although the transition to a higher throughput format can be envisioned for only selected assay steps, it is clear that a fully screen-compatible format requires the transfer of all steps to a microtiter (or equivalent)-based format. This means that all sample and reagent additions can be done using automated liquid handling equipment, and
heating and cooling can be achieved using microtiter plate– compatible equipment. The latter also applies to the separation of soluble protein from the denatured and aggregated protein (i.e., by centrifugation and/or filtration steps). Subsequently, detection of the amount of target protein in the soluble fraction can be achieved using a broad range of available assays, including different ELISA variants, proximity ligation assays17, dot blots18,19 or targeted MS strategies20. To further optimize throughput, the number of assay steps must be brought down to a minimum. The ideal method should hence allow the quantification of stabilized protein against a background of the same protein in a denatured and aggregated form, as well as cell lysate. Obvious alternatives for homogeneous detection include methods in which antibodies or other affinity reagents recognize the folded structure, such as AlphaScreen21 or time-resolved fluorescence resonance energy transfer (TR-FRET)-based assays22. As the choice of detection method will vary between laboratories, depending on prior experiences and instrument setup, we will not go through these alternatives in detail. Instead, the description below focuses on one example of a high-throughput screening–amenable CETSA protocol that is based on a completely homogeneous assay with-out any wash or sample workup steps. This assay procedure is outlined in Figure 2.
Besides considerations regarding the choice of protein source, there are a number of additional issues of importance when developing a microtiter-based CETSA protocol. First, it is good screening practice to minimize sample transfers between plates to reduce the overall assay variability and cost. Another challenge that must be solved is to ensure homogeneous com-pound access to all material in the respective wells, and the pre-cautions taken to achieve this may vary depending on whether the experiment is performed in cell lysates, adherent or suspension cells, or tissue homogenates. As outlined in Figure 2, we recom-mend adding a large volume of a homogeneous cell suspension to a smaller volume of compound solution, as this facilitates mixing.
Add cellsto compounds
ECHOCompound dispenser
Dilutesamples
in lysis buffer
Celllysis
Optional step
Heat samples
Add acceptorbeads
Add donor beads
Transfer aliquotsof lysed samplesto detection plate
Centrifugation/filtration
Read signals
Incubate
Incubate
Incubate
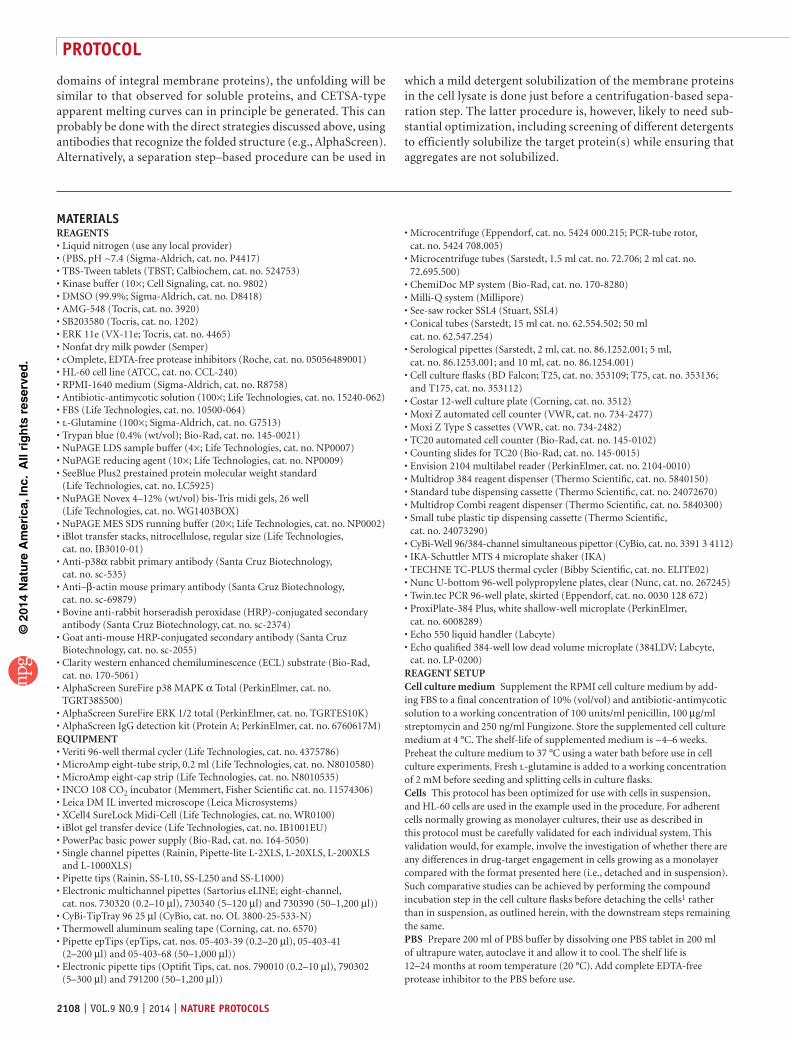
Figure 2 | The screen format assay procedure. Compound stock solutions are first dispensed into individual wells followed by the addition of a cell suspension to all wells. The samples are next preincubated for 30 min before placing the microplates in a PCR machine for heating to a predefined temperature for 3 min. The plate is then allowed to cool before samples are diluted with lysis buffer. At this point, it is optional to remove the cell debris and protein aggregates by means of centrifugation and/or filtration. The diluted samples must then be transferred to a suitable detection plate (unless detection can be made in the same plate). Finally, the detection is achieved by following a standard protocol for AlphaScreen bead additions, incubations and readings.
©20
14 N
atu
re A
mer
ica,
Inc.
All
rig
hts
res
erve
d.
protocol
nature protocols | VOL.9 NO.9 | 2014 | 2105
During the subsequent incubation with compounds, referred to as the preincubation, the microplate can optionally be shaken if required. Our example case is based on the use of suspension cells and an incubation time of 30 min. This may be acceptable for most systems, but there may be cases where adherent cell lines require a solid support to retain target expression and relevant biology such that other setups must be considered.
After the preincubation, the microtiter plate is transferred to a PCR machine for carefully controlled heating. For isothermal experiments, the heating block only requires a single tempera-ture, whereas when constructing a melting curve it is advisable to use a heating block with separate heating zones, enabling at least six temperatures to be assayed on each plate. Matched cooling blocks are used to ensure consistent cooling rates between wells after heating.
A prerequisite for optimal assay performance is the achieve-ment of complete cell lysis, as this would otherwise become a major source of variability between wells. Although the transfer to a microplate format is compatible with the lysis procedure in the original protocol, (i.e., repeated freeze-thaw cycles) this han-dling will become a rate-limiting step in the parallel processing of many plates during a screening campaign. As detergent-mediated cell lysis procedures are faster and more compatible with high-throughput formats, they are warranted provided that there is no perturbation of the selective detection of remaining stabilized over denatured target protein. The addition of a larger volume of lysis buffer also serves to reduce interference with the detection from cell medium components such as phenol red, biotin and the compounds themselves.
Selective detection of the remaining stabilized and soluble protein against the background of denatured and aggregated proteins and cell debris is a prerequisite for a homogeneous assay. This is because the nature of the unfolded proteins in the intracellular aggregates is largely unknown, and in addition it is likely to vary between proteins. An optional centrifugation or filtration separation step can be included to facilitate the selective detection of soluble material, the necessity of which must be carefully investigated for each individual case.
On the basis of available instrumentation in our laboratory and its compatibility with well-validated assays for the detection of endogenous protein levels, our initial attempts to screen-format the CETSA approach fell on the AlphaScreen technology using a commercial SureFire23 kit against the protein kinase p38α. As dis-cussed above, there are several other options available to achieve homogeneous detection, but it is outside the scope of this work to compare these alternatives. The SureFire assays are based on antibody pairs that recognize two different epitopes such that highly selective recognition of the protein target is achieved after binding of the antibodies to a protein A–conjugated acceptor bead and a streptavidin-coated donor bead, respectively. An added benefit is the presence of published approaches for effi-cient selection of suitable antibody pairs that can be applied when expanding the CETSA toolbox to other targets24. We are pursuing a similar approach for antibody pair selection that allows testing of additional antibody candidates, as outlined in Box 2.
A major advantage of homogeneous assay formats is their ame-nability to miniaturization, enabling screening to be pursued in small sample volumes and high-density microtiter plates. As the sample volumes are decreased, there is the possibility to test
substantially reduced heating times and thereby further increase throughput and minimize the effect of heating on rearrangement of equilibria (see ‘Limitations’ section).
Example CETSA procedures. Experimental protocols for per-forming CETSA experiments using both a western blot– and an AlphaScreen-based detection format are described in detail in the PROCEDURE section for intracellular human p38α (i.e., the experiments are performed on intact HL-60 cells). The overall workflows of these assays, including the two detection means are schematically illustrated in Figure 1, whereas a more detailed illustration of the practical CETSA workflow in a screen format can be found in Figure 2. The types of experiments included herein are outlined in the recommended chronological order when approaching a new protein target of interest, starting with an examination of the apparent melting curve of the target in the absence and presence of stabilizing drug candidates. The melt-ing curve is based on measured soluble p38α levels at ten differ-ent temperatures, spanning from 40 to 67 °C in the absence and presence of known inhibitors. Variations to the protocol may be necessary to accommodate other cell types and cellular systems, as discussed below. The melting curve experiments are followed by ITDRFCETSA experiments in the same cells. These are similar to the apparent melting curve experiments, except that the com-pound concentration is varied with 11 doses tested at a fixed tem-perature during the heating step. The temperature at which the ITDRFCETSA experiment is performed is based on the observed melting curve (e.g., at a temperature at which a majority of the protein is precipitated and not detected in the absence of stabi-lizing compound), and in this example it is performed at 50 °C. As outlined in the ANTICIPATED RESULTS, we also provide a procedure for performing CETSA-based primary screening of samples of unknown activity with regard to p38α stabilization.
Limitations and other considerationsThe possibility to establish a CETSA melting curve for a protein with bound ligand is dependent on whether the binding of a lig-and induces a substantial stabilization of the target protein. It is also dependent on the availability of suitable affinity reagents for detection purposes and on the fact that techniques, which are independent of affinity reagents, can be employed (e.g., quantita-tive MS-based methods). Although false positives are rare, as for the classical TSAs, the occurrence of false negatives in the sense that protein stabilization is not observed upon ligand binding is an issue also when performing thermal shift assays in a cellu-lar environment. Larger proteins, including protein complexes, are more likely to give weaker or no ligand-induced response in thermal shift assays, although the limitations of the assay in this respect have not yet been well established. In certain cases, the lack of observed stabilization may be the consequence of antibody recognition of a nonfunctional form of the protein (for example, a form lacking activating phosphorylations or the necessary pro-teolytic processing). For this reason, it is crucial that a negative result be followed by appropriate troubleshooting experiments in which the choice of antibody and/or detection methodology is addressed. Moving to MS-based methods could be particu-larly helpful if the nonfunctional forms are dominating and the affinity reagents cannot distinguish between the various forms. In complex systems such as cells or cell lysates, it may also be that

©20
14 N
atu
re A
mer
ica,
Inc.
All
rig
hts
res
erve
d.
protocol
2106 | VOL.9 NO.9 | 2014 | nature protocols
the target of interest requires interaction partners or allosteric regulators for proper ligand binding. In this case, the observation of a ligand-induced stabilization is dependent on the appropri-ate choice of the cellular system, in addition to the choice of the antibody or other detection methodologies.
A matter of great importance is also the choice of conditions under which the cells are heated to generate apparent melting curves or dose-response curves. Leaving compounds in the medium during heating ensures that there is no bias for com-pounds that are retained in the cells or that have longer target residence times25. However, heating may result in an alteration of all equilibria involved; for example, the binding to serum proteins and cell permeability may also be affected. As already demon-strated1, the cells are left relatively intact during the transient
heating up to temperatures of 60–65 °C (Supplementary Fig. 1), but the kinetics of potential changes in these equilibria must be studied for each ligand and system. A measure taken to minimize the impact of rearrangements of the equilibria is to reduce the heating time, which requires efficient and uniform temperature ramping and cooling. When using thermal cyclers or other types of heating blocks for the sample vials or microplates, the time required to reach a certain temperature and to do so homoge-neously in the complete sample increases with sample volume. To obtain heating times on the second rather than minute scale, it is necessary to reduce the sample volume or to completely alter the sample geometry and heating device to improve heat transfer. This is a key reason why we, in parallel to the western blot format, have also pursued screen-compatible methods with the potential
Box 2 | Generic format for antibody pair selection A prerequisite for homogeneous antibody-based detection assays is the identification of a suitable antibody pair with sufficient affinity and selectivity for the target protein. Importantly, this must be achieved on the basis of target epitopes that are well exposed in the native protein, as completely denaturing conditions are not compatible with antibody functionality. When this cannot be achieved, it is optional (aside from changing detection methodology) to search for conditions, e.g., levels and identity of detergents, as well as buffer pH and ionic strength, in which the antibody pair is fully functional but in which the soluble target protein exposes additional epitopes (i.e., is partially unfolded), such that the choice of antibodies is broadened. Choices regarding which antibodies to test are preferably made on the basis of available information on epitope recognition and target protein structure, but identification of an appropriate antibody pair can also be achieved in well-designed screening approaches. As outlined in the main text, there are published approaches for efficient selection of suitable antibody pairs with protein A functionality on both the acceptor and the donor AlphaScreen beads24. Although fully functional, this approach is associated with the risk of antibody rearrangements between beads, which may influence signal levels, as well as the exclusion of a significant portion of available antibodies for target protein recognition (because protein A only provides sufficient high-affinity binding to certain antibodies as defined by species and isoform32). Efficient screening of antibodies with poor protein A affinity can be achieved by biotinylation, such that they can instead be captured on streptavidin-functionalized donor beads (applied in this work for the p38α kinase). An alternative means to extend the range of antibodies available for testing is to combine the protein A functionality on one bead with a capturing antibody on the other bead. This secondary capturing antibody is directed toward the Fc domain of a primary antibody with poor protein A affinity. This approach adds additional specificity to the system, as the capturing antibody, which is directly conjugated to either acceptor or donor beads (the latter is illustrated below), is species-specific. Together with the dual protein A affinity approach, as well as approaches that involve two anti-Fc domain–directed antibodies with different species selectivity on separate beads, a large proportion of available antibodies can be tested.
Donor bead
Capturing antibodye.g., Anti-mouse IgG1
with lowprotein Aaffinity
Target antibodyMatching the capturing antibody,
e.g., raised in mouse
Antibodybinding
to protein Ae.g., Rabbit derived
Protein Acoated
Acceptor bead
Target protein
Shown above is an illustration of one example of the combined use of a high-affinity protein A–binding antibody together with a directly conjugated secondary antibody that recognizes the Fc domain of an antibody toward the target of interest. The positioning of the respective antibodies on either acceptor or donor beads can be varied by changing the bead functionalization. This is valuable when screening for antibodies, as it can influence the strength of the AlphaScreen signal. By using a battery of capturing anti-FC domain antibodies toward antibodies generated in different species, a large portion of commercially available antibodies specific to the protein of interest can be effectively screened. On the basis of our experience with ligand-induced quenching of the antibody pair recognition (as demonstrated in supplementary Data), we recommend that the antibody selection be performed both in the presence and absence of a set of known ligands. If a suitable pair, recognizing all entities of the protein target similarly (e.g., unliganded and ligand-bound), cannot be identified, the user is advised to use alternative detection methodologies. Alternatively, counter-screening can be considered, in which signal quenching is tested at a temperature well below the apparent Tagg of the target protein, as substantial signal alterations in themselves are a sign of target engagement.

©20
14 N
atu
re A
mer
ica,
Inc.
All
rig
hts
res
erve
d.
protocol
nature protocols | VOL.9 NO.9 | 2014 | 2107
for extreme miniaturization, possibly even down to the 1,536-well format and single-digit microliter volumes.
Another important kinetic aspect relates to the time used for preincubation with the compounds, as this could result in an altered ability to recognize the target protein. This is because the compounds may effect the post-translational status of the target protein if it is involved in quickly responding signaling pathways, which in turn may influence the antibodies’ ability to detect the protein. In these cases, it will be preferable to use antibodies that do not discriminate between the different protein forms or to use MS-based methods that detect either form. Alternatively, 2D gel electrophoresis could be used to facilitate the separation of different forms before western blot–mediated quantification. Similarly, the compounds may also induce functional responses that affect protein levels, such as altered proteasomal activity, either in general or for the target protein specifically, and such responses will be dependent on the preincubation time. If the incubation times extend toward hours, compounds could also influence protein levels through altered transcription and trans-lation activities. For this reason, our protocols generally do not involve preincubation times longer than 30–60 min, unless the intention is to address specific cellular events known to require longer times.
The ITDRFCETSA values obtained from dose-response experi-ments have already been proven to be valuable for the demonstra-tion of binding and relative ranking between ligands for a broad range of different target proteins in our laboratory. However, a firm quantitative interpretation of the observed CETSA responses, in terms of converting the apparent Tagg values, as well as isothermal dose-response fingerprints to ligand affinities, requires establish-ing models that accurately describe the thermal denaturation of the target protein in its complex environment (i.e., from fully native to completely denatured and aggregated material). For iso-lated proteins that comply with a reversible two-state transition, ligand affinities can be quantitatively determined on the basis of the knowledge of the ligand concentration dependence of the Tm shift. The calculations require independent experimental deter-mination of the unfolding enthalpy and heat capacity change of the unliganded protein2,5. These relationships do not apply to transitions at non-equilibrium, such as those we observe when the denatured protein precipitates within cells. However, an excellent correlation has been demonstrated between observed equilibrium Tm values and apparent Tagg values derived from light-scattering experiments in which isolated proteins are irreversibly denatured and aggregated in melting curve experiments9. Depending on the kinetics of protein unfolding and aggregation, the transition from native through unfolded to aggregated protein (N→U→A) can sometimes be approximated by a two-state irreversible model26. Besides the unfolding enthalpy and heat capacity of the protein, which determines the shape of the melting curve for reversible two-state transitions, the kinetics involved in aggrega-tion of the unfolded protein will have a key role in determining both the shape and the apparent midpoint (Tagg) of the melting curve for irreversible transitions26. Although this remains to be investigated in detail, the user can expect these parameters to vary with heating time in the CETSA experiment, as this experimental condition controls the extent to which aggregation drives the shift from folded to unfolded protein. This is an important argument for minimizing the heating times, besides the influence on cell
membrane integrity, and further minimization of sample volumes will help achieve this. In the CETSA experiments, the aggrega-tion occurs in a complex cellular environment, but surprisingly our empirical observations so far are in reasonable compliance with an independent thermal denaturation and aggregation for the individual proteins19. We further observe that the choice of ITDRFCETSA temperature influences the observed stabilization in qualitative agreement with observations from isolated target proteins (i.e., the inflection point of the dose-response curve increases toward higher ligand concentrations with increasing test temperature in most cases). Our long-term goal is to accu-mulate data on a broad range of different target proteins and to apply these data for the derivation of models that better describe the intracellular denaturation and aggregation of target proteins, and with them the quantitative relationships between observed responses and ligand affinities.
When a discrepancy in apparent Tagg or responses to ligands is observed between assay formats, it may indicate that the soluble protein fraction consists of several subpopulations of the target protein, i.e., ligand-bound and unliganded native protein and possibly also partially unfolded but not aggre-gated protein. This is because the western blot format involves a thermal and detergent-mediated denaturation of all soluble material, and thus we expect the same behavior of all sub-populations during detection, whereas any assay format that does not involve prior denaturation may respond differently to the different subpopulations if these are differently recog-nized by the antibody or antibody pairs. This, in turn, may vary between different cell lysis protocols and the downstream sample handling protocols, as detergents and extensive dilutions will influence the ratio between ligand-bound and unliganded protein. These matters can only be addressed by comparative studies with results from the western blot format to ensure that the final protocol measures the intended subpopulation of stabilized native protein, regardless of whether it is ligand-bound or not. Similarly, if the antibody pair used in the homogene-ous assay format detects ligand-bound and unliganded target protein differentially, an example of which is shown below in the ANTICIPATED RESULTS section, we recommend searching for an alternative antibody pair for which recognition remains unaltered upon ligand binding. As already noted, a strategy for antibody pair selection is described in Box 2, including how to handle the situation if the ligands quench the ability of the antibodies to recognize the stabilized protein.
Of importance for the general applicability of the CETSA meth-ods is also which target proteins can be addressed. Although the pilot study of CETSA only involved soluble proteins1, it is likely that the method will work well also for subsets of interfacial and integral membrane proteins. Thermal shift assays on deter-gent-purified membrane proteins using the same principles as CETSA have been applied to monitor ligand binding to an integral membrane transporter27. Direct heating of detergent-solubilized membrane proteins in a lysate also has the potential to generate CETSA data. Integral membrane domains in intact cells are often highly stabilized by the lipid bilayer and therefore unfold at very high temperatures, and thus it might be challenging to establish CETSA protocols for monitoring ligand binding to such domains. However, for membrane protein domains that are not in the lipid bilayer (e.g., interfacial proteins, or extracellular or intracellular
©20
14 N
atu
re A
mer
ica,
Inc.
All
rig
hts
res
erve
d.
protocol
2108 | VOL.9 NO.9 | 2014 | nature protocols
domains of integral membrane proteins), the unfolding will be similar to that observed for soluble proteins, and CETSA-type apparent melting curves can in principle be generated. This can probably be done with the direct strategies discussed above, using antibodies that recognize the folded structure (e.g., AlphaScreen). Alternatively, a separation step–based procedure can be used in
which a mild detergent solubilization of the membrane proteins in the cell lysate is done just before a centrifugation-based sepa-ration step. The latter procedure is, however, likely to need sub-stantial optimization, including screening of different detergents to efficiently solubilize the target protein(s) while ensuring that aggregates are not solubilized.
MaterIalsREAGENTS
Liquid nitrogen (use any local provider)(PBS, pH ~7.4 (Sigma-Aldrich, cat. no. P4417)TBS-Tween tablets (TBST; Calbiochem, cat. no. 524753)Kinase buffer (10×; Cell Signaling, cat. no. 9802)DMSO (99.9%; Sigma-Aldrich, cat. no. D8418)AMG-548 (Tocris, cat. no. 3920)SB203580 (Tocris, cat. no. 1202)ERK 11e (VX-11e; Tocris, cat. no. 4465)Nonfat dry milk powder (Semper)cOmplete, EDTA-free protease inhibitors (Roche, cat. no. 05056489001)HL-60 cell line (ATCC, cat. no. CCL-240)RPMI-1640 medium (Sigma-Aldrich, cat. no. R8758)Antibiotic-antimycotic solution (100×; Life Technologies, cat. no. 15240-062)FBS (Life Technologies, cat. no. 10500-064)l-Glutamine (100×; Sigma-Aldrich, cat. no. G7513)Trypan blue (0.4% (wt/vol); Bio-Rad, cat. no. 145-0021)NuPAGE LDS sample buffer (4×; Life Technologies, cat. no. NP0007)NuPAGE reducing agent (10×; Life Technologies, cat. no. NP0009)SeeBlue Plus2 prestained protein molecular weight standard (Life Technologies, cat. no. LC5925)NuPAGE Novex 4–12% (wt/vol) bis-Tris midi gels, 26 well (Life Technologies, cat. no. WG1403BOX)NuPAGE MES SDS running buffer (20×; Life Technologies, cat. no. NP0002)iBlot transfer stacks, nitrocellulose, regular size (Life Technologies, cat. no. IB3010-01)Anti-p38α rabbit primary antibody (Santa Cruz Biotechnology, cat. no. sc-535)Anti–β-actin mouse primary antibody (Santa Cruz Biotechnology, cat. no. sc-69879)Bovine anti-rabbit horseradish peroxidase (HRP)-conjugated secondary antibody (Santa Cruz Biotechnology, cat. no. sc-2374)Goat anti-mouse HRP-conjugated secondary antibody (Santa Cruz Biotechnology, cat. no. sc-2055)Clarity western enhanced chemiluminescence (ECL) substrate (Bio-Rad, cat. no. 170-5061)AlphaScreen SureFire p38 MAPK α Total (PerkinElmer, cat. no. TGRT38S500)AlphaScreen SureFire ERK 1/2 total (PerkinElmer, cat. no. TGRTES10K)AlphaScreen IgG detection kit (Protein A; PerkinElmer, cat. no. 6760617M)
EQUIPMENTVeriti 96-well thermal cycler (Life Technologies, cat. no. 4375786)MicroAmp eight-tube strip, 0.2 ml (Life Technologies, cat. no. N8010580)MicroAmp eight-cap strip (Life Technologies, cat. no. N8010535)INCO 108 CO2 incubator (Memmert, Fisher Scientific cat. no. 11574306)Leica DM IL inverted microscope (Leica Microsystems)XCell4 SureLock Midi-Cell (Life Technologies, cat. no. WR0100)iBlot gel transfer device (Life Technologies, cat. no. IB1001EU)PowerPac basic power supply (Bio-Rad, cat. no. 164-5050)Single channel pipettes (Rainin, Pipette-lite L-2XLS, L-20XLS, L-200XLS and L-1000XLS)Pipette tips (Rainin, SS-L10, SS-L250 and SS-L1000)Electronic multichannel pipettes (Sartorius eLINE; eight-channel, cat. nos. 730320 (0.2–10 µl), 730340 (5–120 µl) and 730390 (50–1,200 µl))CyBi-TipTray 96 25 µl (CyBio, cat. no. OL 3800-25-533-N)Thermowell aluminum sealing tape (Corning, cat. no. 6570)Pipette epTips (epTips, cat. nos. 05-403-39 (0.2–20 µl), 05-403-41 (2–200 µl) and 05-403-68 (50–1,000 µl))Electronic pipette tips (Optifit Tips, cat. nos. 790010 (0.2–10 µl), 790302 (5–300 µl) and 791200 (50–1,200 µl))
•••••••••••••••••••
•
••
•
•
•
•
•
•
••
•••••••••
••
•••
•
Microcentrifuge (Eppendorf, cat. no. 5424 000.215; PCR-tube rotor, cat. no. 5424 708.005)Microcentrifuge tubes (Sarstedt, 1.5 ml cat. no. 72.706; 2 ml cat. no. 72.695.500)ChemiDoc MP system (Bio-Rad, cat. no. 170-8280)Milli-Q system (Millipore)See-saw rocker SSL4 (Stuart, SSL4)Conical tubes (Sarstedt, 15 ml cat. no. 62.554.502; 50 ml cat. no. 62.547.254)Serological pipettes (Sarstedt, 2 ml, cat. no. 86.1252.001; 5 ml, cat. no. 86.1253.001; and 10 ml, cat. no. 86.1254.001)Cell culture flasks (BD Falcon; T25, cat. no. 353109; T75, cat. no. 353136; and T175, cat. no. 353112)Costar 12-well culture plate (Corning, cat. no. 3512)Moxi Z automated cell counter (VWR, cat. no. 734-2477)Moxi Z Type S cassettes (VWR, cat. no. 734-2482)TC20 automated cell counter (Bio-Rad, cat. no. 145-0102)Counting slides for TC20 (Bio-Rad, cat. no. 145-0015)Envision 2104 multilabel reader (PerkinElmer, cat. no. 2104-0010)Multidrop 384 reagent dispenser (Thermo Scientific, cat. no. 5840150)Standard tube dispensing cassette (Thermo Scientific, cat. no. 24072670)Multidrop Combi reagent dispenser (Thermo Scientific, cat. no. 5840300)Small tube plastic tip dispensing cassette (Thermo Scientific, cat. no. 24073290)CyBi-Well 96/384-channel simultaneous pipettor (CyBio, cat. no. 3391 3 4112)IKA-Schuttler MTS 4 microplate shaker (IKA)TECHNE TC-PLUS thermal cycler (Bibby Scientific, cat. no. ELITE02)Nunc U-bottom 96-well polypropylene plates, clear (Nunc, cat. no. 267245)Twin.tec PCR 96-well plate, skirted (Eppendorf, cat. no. 0030 128 672)ProxiPlate-384 Plus, white shallow-well microplate (PerkinElmer, cat. no. 6008289)Echo 550 liquid handler (Labcyte)Echo qualified 384-well low dead volume microplate (384LDV; Labcyte, cat. no. LP-0200)
REAGENT SETUPCell culture medium Supplement the RPMI cell culture medium by add-ing FBS to a final concentration of 10% (vol/vol) and antibiotic-antimycotic solution to a working concentration of 100 units/ml penicillin, 100 µg/ml streptomycin and 250 ng/ml Fungizone. Store the supplemented cell culture medium at 4 °C. The shelf-life of supplemented medium is ~4–6 weeks. Preheat the culture medium to 37 °C using a water bath before use in cell culture experiments. Fresh l-glutamine is added to a working concentration of 2 mM before seeding and splitting cells in culture flasks.Cells This protocol has been optimized for use with cells in suspension, and HL-60 cells are used in the example used in the procedure. For adherent cells normally growing as monolayer cultures, their use as described in this protocol must be carefully validated for each individual system. This validation would, for example, involve the investigation of whether there are any differences in drug-target engagement in cells growing as a monolayer compared with the format presented here (i.e., detached and in suspension). Such comparative studies can be achieved by performing the compound incubation step in the cell culture flasks before detaching the cells1 rather than in suspension, as outlined herein, with the downstream steps remaining the same.PBS Prepare 200 ml of PBS buffer by dissolving one PBS tablet in 200 ml of ultrapure water, autoclave it and allow it to cool. The shelf life is 12–24 months at room temperature (20 °C). Add complete EDTA-free protease inhibitor to the PBS before use.
•
•
••••
•
•
••••••••••
••••••
••

©20
14 N
atu
re A
mer
ica,
Inc.
All
rig
hts
res
erve
d.
protocol
nature protocols | VOL.9 NO.9 | 2014 | 2109
Reducing loading buffer For 40 samples, prepare 800 µl of reducing loading buffer by mixing 560 µl of 4× NuPAGE LDS sample buffer with 240 µl of 10× NuPAGE reducing agent before use.Western blot wash buffer Dissolve one TBS-Tween tablet in 500 ml of Milli-Q water to obtain TBS with 0.05% (wt/vol) Tween (TBST). The shelf life is 1 week at room temperature.Western blot blocking buffer Dissolve 2.5 g of nonfat dry milk in 50 ml of TBST to obtain 5% (wt/vol) nonfat milk. The blocking buffer should be freshly prepared.Clarity western ECL substrate kit Mix equal volumes of Clarity luminol substrate and Clarity peroxide solution. Make fresh ECL substrate before development of the western blot membrane(s). Approximately 12 ml of substrate solution is needed for four midi-size nitrocellulose membranes.Acceptor bead mix The acceptor bead mix is prepared according to the manufacturer’s specifications by diluting the activation buffer (from the SureFire kit) fivefold in reaction buffer (from the SureFire kit). The acceptor beads (from the Protein A IgG detection kit) are next diluted 50-fold in the already prepared mix of activation and reaction buffer. The acceptor bead mix should be used immediately after preparation for best results. Excess mix should be discarded. crItIcal A precipitate may form in the activation buffer when it is stored in the refrigerator; it must therefore re-equilibrate at room temperature before use so that the buffer components can re-dissolve.Donor bead mix Dilute donor beads (from the Protein A IgG detection kit) 20-fold in dilution buffer (from the SureFire kit) immediately before use according to the manufacturer’s specifications. The donor mix should be used immediately for best results. Excess mix should be discarded. crItIcal The donor beads are light-sensitive, so work must be performed in subdued light.PerkinElmer lysis buffer The 5× lysis buffer (from the SureFire kit) is diluted fivefold in double-distilled water according to the manufacturer’s specifications. The lysis buffer should be used immediately for best results. Excess mix should be discarded.Compound preparation Compounds delivered as powders are dissolved in DMSO to yield 10 mM stock solutions. All our library compounds are stored frozen as 10 mM stock solutions until use. The 10 mM stock solutions are diluted to 4 mM in DMSO before use in the ITDRFCETSA experiments. ! cautIon Use appropriate safety equipment and a controlled environment when working with potentially toxic and mutagenic compounds. This is particularly important when handling DMSO solutions, as the solvent is highly skin permeable. crItIcal Water-soluble compounds can be dissolved in water instead. For nonpolar organic compounds, it might be necessary to use lower concentrations of the compounds in DMSO owing
to their lower solubility. If this is the case, it is important to determine the DMSO tolerance of the cells that you are working with before deciding how much of the compound to add.EQUIPMENT SETUPINCO 108 CO2 incubator Place a water tray containing sterilized ultrapure water in the incubator, and then set the incubator to 37 °C, 95% humidity and 5% CO2.Veriti 96-well thermal cycler Use the Veriti 96-well thermal cycler for heat treatment of the cells. The Veriti thermal cycler is equipped with a 96-well heating block for 0.2-ml PCR tubes divided into six different VeriFlex zones, with each zone of 16 wells capable of maintaining a specific temperature independently of the other zones. Create a two-stage program in the Veriti thermal cycler with temperature increments of 3 °C, in which the first stage spans temperatures from 40–55 °C for 3 min and the second stage span temperatures of 58–73 °C for 3 min. An intermediate step can be introduced with the same temperature as in the first stage to allow more time for handling of the tubes between the two heating steps. During the 3-min heat exposure, it is not necessary to heat the lid of the thermal cycler; this option can be chosen in the experimental design program.TECHNE TC-PLUS thermal cycler Use the TECHNE TC-PLUS thermal cycler for heat treatment of the cells in a 96-well plate format. The TECHNE TC-PLUS thermal cycler is equipped with a 96-well heating block. Create a one-step program in the TECHNE TC-PLUS thermal cycler for heating at 50 °C for 3 min using maximum ramping speed. In this instrument, the plate must be present during temperature ramping, but this is achieved in 5 s, and hence it will not affect the total incubation time significantly. This thermal cycler is compatible with the Twin.tec skirted 96-well plates used for dispensing with the Labcyte Echo.Envision multilabel reader Use the Envision plate reader with the AlphaScreen standard protocol settings: emission filter center wavelength at 570 nm, bandwidth 100 nm, transmittance 75%, total measurement time 550 ms and excitation time 180 ms (mirror D640as).Labcyte Echo Use the Labcyte Echo 550 instrument to transfer DMSO stock solutions of compounds from a Labcyte 384 LDV source plate to a Twin.tec 96-well PCR plate.CyBi-Well 96-channel simultaneous pipettor Use the CyBi-Well 96-channel simultaneous pipettor for mixing and transfer of lysate from a Twin.tec 96-well PCR plate to a 384-well ProxiPlate. Create a protocol with two main steps. The first step consists of six sequential aspiration and dispensing steps in the Twin.tec 96-well PCR plate using a volume of 25 µl in each step. In the second step, 4 µl of the mixed lysate is transferred from the Twin.tec 96-well PCR plate to a selected quadrant within a 384-well ProxiPlate.
proceDurepart 1, determination of the apparent melting curve for an intracellular protein by cetsa: cell handling and compound treatment ● tIMInG 2–3 h crItIcal Part 1 of the PROCEDURE (Steps 1–17) describes how to establish a CETSA melting curve for intracellular p38α (i.e., the experiment is performed on intact HL-60 cells). The curve is based on measured soluble protein levels at ten different temperatures with endpoints spanning from 40–67 °C in the presence of 20 µM AMG-548, SB203580 or ERK 11e plus cells treated with DMSO alone as a negative control.
1| Expand HL-60 cells in cell culture medium to a cell density of ~2 million cells per ml using standard sterile cell culture procedures and supplies. Approximately 120 million HL-60 cells are required to establish four CETSA melting curves. This experiment should be performed at least three times, each on different days, in order to get statistically meaningful results.
2| Add 15 ml of the 2 million HL-60 cells per milliliter of suspension into four separate T75 flasks. If you are working with adherent cells and it is desirable to avoid detaching the cells, the compound incubation step could instead be performed in suitable cell culture flasks or microplates, with the heating step (Step 11) performed either immediately after cell detachment (using the method of your choice) or directly in the culture containers.

©20
14 N
atu
re A
mer
ica,
Inc.
All
rig
hts
res
erve
d.
protocol
2110 | VOL.9 NO.9 | 2014 | nature protocols
3| Add 30 µl each of the 10 mM DMSO stock solutions of AMG-548, SB203580 and ERK 11e to individual flasks to get a final concentration of 20 µM of each compound. Add the same volume of DMSO to the remaining flask serving as the vehicle or solvent control. Gently mix the cell suspension by pipetting up and down several times using a serological pipette. crItIcal step If the compound concentrations are adjusted, ensure that the predetermined DMSO tolerability of the cells in question is not exceeded. As a rule of thumb, avoid DMSO concentrations above 1% (vol/vol), but note that many cells are much more sensitive, so it is advisable to do a pilot experiment to determine DMSO tolerance.! cautIon Use appropriate safety equipment and a controlled environment when working with potentially toxic and mutagenic compounds. This is particularly important when handling DMSO solutions, as the solvent is highly skin-permeable.
4| Incubate the cell culture flasks for 1 h in the CO2 incubator at 37 °C.? trouBlesHootInG
5| Collect the cell suspension with a serological pipette and transfer the cells to marked 15-ml conical tubes.
6| Count the cell numbers and assess cell viability using a preferred method. crItIcal step It is important to examine whether the compound has acutely affected the viability or membrane integrity of the compound-treated cells.? trouBlesHootInG
7| Centrifuge the conical tubes at 300g for 3 min at room temperature to pellet the cells, and then carefully remove and discard all of the culture medium. crItIcal step The centrifugal force may need to be adjusted if the cellular test system is altered such that the cells are more sensitive to disruption during centrifugation or are more difficult to pellet.
8| Gently resuspend the cell pellets with 15 ml of PBS and centrifuge them at 300g for 3 min at room temperature to pellet the cells again. Carefully remove and discard all of the supernatant (repeat this step if necessary).? trouBlesHootInG
9| Add 1 ml of PBS supplemented with protease inhibitors to each respective tube and carefully resuspend the cell pellet.! cautIon Protease inhibitors must be avoided if they interfere with the target or system being evaluated. The extent of such interference can be tested in prior experiments for each individual target protein.
10| Distribute each cell suspension, i.e., with DMSO control or with the test compound, into ten different 0.2-ml PCR tubes with 100 µl of cell suspension in each tube (~3 million cells per tube). Mark each tube or strip with a designated temperature (40–67 °C). This yields a total of 40 PCR tubes divided into ten strips with four tubes per strip (this setup facilitates the tube handling during heat treatment). The tubes are kept at room temperature before the heat treatment step.
Heat treatment of cell suspensions ● tIMInG 10 min11| Heat the PCR-tube strips with the first six temperature endpoints (40–55 °C) at their designated temperature for 3 min in the Veriti 96-well thermal cycler. Immediately after heating, remove and incubate the tubes at room temperature for 3 min. After this 3-min incubation, immediately snap-freeze the samples according to the instructions in Step 13. crItIcal step Do not let the temperature in the blocks rise to the designated temperature while the tubes are in the cycler. Only place the tubes in the blocks when the temperature has reached the designated temperature. It is crucial to ensure consistent timing between tubes in both the heating and cooling steps, as well as between heat stages.? trouBlesHootInG
12| In the meantime, heat the remaining four strips at their designated temperature (58–67 °C) for 3 min in the Veriti 96-well thermal cycler. Immediately after heating, remove and incubate the tubes at room temperature for 3 min. crItIcal step Do not let the temperature in the blocks rise to the designated temperature while the tubes are in the cycler. Only place the tubes in the blocks when the temperature has reached the designated temperature. It is crucial to ensure consistent timing between tubes in both the heating and cooling steps.? trouBlesHootInG

©20
14 N
atu
re A
mer
ica,
Inc.
All
rig
hts
res
erve
d.
protocol
nature protocols | VOL.9 NO.9 | 2014 | 2111
13| Snap-freeze the heat-treated cell suspensions in liquid nitrogen. pause poInt The experiment can be paused here, with the samples kept at −80 °C overnight.
cell lysis ● tIMInG 1 h14| Freeze-thaw the cells twice using liquid nitrogen and a thermal cycler or heating block set at 25 °C in order to ensure a uniform temperature between tubes. The tubes are vortexed briefly after each thawing. The resulting cell lysates are kept on (4 °C) ice after the last thawing step.? trouBlesHootInG
15| Briefly vortex the tubes and centrifuge the cell lysate–containing tubes at 20,000g for 20 min at 4 °C to pellet cell debris together with precipitated and aggregated proteins. Carefully remove the tubes from the centrifuge and avoid disturbing the pellets. Keep the samples on ice in a cooling block.? trouBlesHootInG
16| Carefully transfer 90 µl of each supernatant with the soluble protein fraction to a new tube. The soluble fraction is now ready for analysis with the detection method of your choice. crItIcal step Be sure not to touch the sides of the tubes and especially not the pellet with the pipette tip when transferring the supernatant. pause poInt Although the samples should be processed on the same day, when they are not in use they should be stored on ice for a maximum of 1–2 h.
Detection of soluble protein17| As already described, the detection and quantification of the remaining soluble protein can be achieved using several methods. Herein we describe two variants based on a western blot (option A) and on a homogeneous AlphaScreen (option B) format. The decision on which format to use depends on the experimental setup in the laboratory and compatibility with available affinity reagents, as outlined above. A key distinguishing factor between these formats is the throughput requirements, with the western blot format being suitable for about 10–100 samples per day and person, whereas the AlphaScreen format can be applied in high-throughput screening campaigns with tens of thousands of data points per day.(a) Western blot format ● tIMInG 5–6 h (or 1–2 d with overnight incubations) (i) Initiate the SDS-PAGE procedure by mixing 40 µl of each respective clarified cell lysate with 20 µl of reducing
loading buffer in new 0.2-ml PCR tubes; vortex briefly, briefly spin down the samples in a microcentrifuge and heat all the tubes at 70 °C for 10 min.
(ii) Again vortex the tubes and briefly spin down the samples in a microcentrifuge. (iii) Assemble precast NuPAGE Novex 4–12% (wt/vol) bis-Tris Midi 26-well gels in XCell4 SureLock Midi-Cell chambers and
fill the chamber with 1× NuPAGE MES SDS buffer. (iv) Carefully load 13 µl (corresponds to the lysate from ~2.6 × 10⁴ HL-60 cells) of each sample into the wells. Run
the samples for each CETSA melt curve on the same gel. The loading order of the samples on the gel can be varied; however, it is convenient to load the samples from the same temperature endpoint next to each other to better visualize the differences in soluble protein levels caused by incubation with different compounds at each given temperature.
(v) Perform SDS-PAGE at 200 V for 45 min using an appropriate power supply. (vi) When the separation of proteins by SDS-PAGE is complete, remove the gels from their plastic cassettes and rinse them
briefly with deionized water in a tray. (vii) Initiate the western blot procedure by assembling the nitrocellulose iBlot transfer sandwich or stack according to the
manufacturer’s description, and perform the transfer using iBlot gel transfer device ‘Program 1’ (25V, 8 min). (viii) Remove the nitrocellulose membrane(s) from the transfer sandwiches and place the membrane in a container or tray
filled with wash buffer. (ix) Wash the nitrocellulose membrane for 10 min with wash buffer. (x) Block the nitrocellulose membrane with blocking buffer for 1 h at room temperature or overnight at 4 °C. (xi) Briefly rinse the nitrocellulose membrane with wash buffer and incubate them for 1 h at room temperature with 15 ml
of 0.4 µg/ml anti-p38α IgG rabbit primary antibody diluted in blocking buffer. Alternatively, the membrane can be incubated with the primary antibody overnight at 4 °C.
(xii) Wash the membrane three times for 10 min with wash buffer. Longer and/or additional wash cycles can further reduce the background if required.

©20
14 N
atu
re A
mer
ica,
Inc.
All
rig
hts
res
erve
d.
protocol
2112 | VOL.9 NO.9 | 2014 | nature protocols
(xiii) Incubate the membrane with 15 ml of 80 ng/ml bovine anti-rabbit HRP-conjugated IgG secondary antibody diluted in blocking buffer for 1 h at room temperature.
(xiv) Wash the membrane three times for 10 min with wash buffer. Longer and/or additional wash cycles can reduce the background if required.
(xv) Use a clean tweezer to lift and place each membrane on a clean flat surface (such as a plastic lid) and add 3 ml of Clarity western ECL substrate solution to each membrane; incubate for 5 min at room temperature. Make sure that the solution is evenly covering the entire membrane. If preferred, develop the membrane separately.
(xvi) Lift the membrane using tweezers, allow the excess ECL solution to drip onto a clean paper towel, place the membrane between the sheets of a plastic film (e.g., clear sheet protectors) and place these into the ChemiDoc MP imager.
(xvii) Choose an appropriate signal accumulation mode setup in Image Lab, expose the membrane and acquire a series of consecutive images until the bands are overexposed. For this particular setup, the bands corresponding to p38α should appear rapidly and become overexposed within 5–10 s.
(xviii) Select an image in which none of the bands are overexposed, and then quantify the different p38α bands by using the volume tools in the analysis toolbox in Image Lab.
(xix) Use a data processing software program (e.g., GraphPad Prism) and evaluate the data by applying a suitable model (see the ‘Limitations’ section regarding model choice). For the melting curves shown in the ANTICIPATED RESULTS, data were first normalized by setting the highest and lowest value in each set to 100 and 0%, respectively. Data were then fitted to obtain apparent Tagg values using the Boltzmann Sigmoid7 equation within GraphPad Prism. ? trouBlesHootInG
(xx) Inspect the curve to ensure compliance with the model and with the intention to choose an appropriate temperature for follow-up isothermal dose-response or screening experiments. This is commonly at a temperature at which a majority of the protein is precipitated and not detected in the absence of stabilizing compound, but at which a majority of the protein remains soluble in the presence of a saturating concentration of a known stabilizing compound. For further details on the choice of temperature, see the ‘Limitations’ section.
(B) alphascreen format ● tIMInG 5–6 h or overnight (i) Dilute each respective cleared cell lysate 15-fold in 1× PerkinElmer lysis buffer (from the AlphaScreen SureFire kit)
and mix the contents carefully by six repeated aspiration and dispensing steps. (ii) Transfer 4 µl of each solution from the PCR tubes to a separate well of a 384-well ProxiPlate. (iii) Add 5 µl of acceptor bead mix, seal the plate with a Thermowell plate seal and agitate the plate on a plate shaker
for ~5 min at 500 r.p.m. (iv) Incubate the plate for 2 h at room temperature.
crItIcal step From now on, all work must be performed under subdued light because of light-sensitive reagents (AlphaScreen donor beads).
(v) Add 2 µl of donor bead mix, seal the plate and centrifuge the plate briefly at 100g at room temperature for 10 s. Agitate the plate on a plate shaker for ~5 min at 500 r.p.m.
(vi) Incubate the plate at room temperature for at least 2 h or preferably overnight. (vii) Read the chemiluminescence signal in the Envision plate reader. (viii) Use a data processing software (e.g., GraphPad Prism) and evaluate the chemiluminescence data by applying a
suitable model. See Step 17A(xix) for details. ? trouBlesHootInG
(ix) Inspect the curve to ensure compliance with the model and with the intention to choose an appropriate temperature for follow-up isothermal dose-response or screening experiments. This is commonly done at a temperature at which a majority of the protein is precipitated and not detected in the absence of stabilizing compound, but at which a majority of the protein remains soluble in the presence of a saturating concentration of a known stabilizing compound. For further details on the choice of temperature and quantitative interpretations of the thermal shifts, see the ‘Limitations’ section.
part 2, determination of the isothermal dose-response fingerprint for an intracellular protein: cell handling and compound treatment ● tIMInG 2 h crItIcal The procedure for establishing an ITDRFCETSA is similar to the apparent melting curve experiment, except that the compound concentration is varied instead of the temperature when heating the cells. Steps 18–30 show how to establish a dose-response fingerprint at 50 °C on the basis of 11 different compound concentrations. The appropriate temperature to perform this experiment is derived from analysis of the data obtained in generating the apparent melting curve (part 1 of the PROCEDURE section).

©20
14 N
atu
re A
mer
ica,
Inc.
All
rig
hts
res
erve
d.
protocol
nature protocols | VOL.9 NO.9 | 2014 | 2113
18| Expand HL-60 cells in cell culture medium to a cell density of ~1–2 million cells per ml using standard sterile cell culture procedures and supplies. Approximately 60 million HL-60 cells are needed for three ITDRFCETSA experiments using both western blot– and AlphaScreen-based detection.
19| Collect the cell suspension with a serological pipette and transfer the cells to 15-ml conical tubes.
20| Centrifuge the conical tubes to pellet the cells at 300g for 3 min at room temperature and carefully remove and discard the culture medium. Resuspend the cell pellet in fresh cell culture medium to yield a cell density of ~40 million cells per milliliter.
21| Place 15 µl of the 4 mM DMSO stock solutions of the AMG-548, SB203580 and ERK 11e compounds in separate wells of column 1 of a 96U NUNC plate. Place 10 µl of DMSO in columns 2–12 of the same plate.! cautIon Use appropriate safety equipment and a controlled environment when working with potentially toxic and mutagenic compounds. This is particularly important when you are handling DMSO solutions, as the solvent is highly skin-permeable.
22| Serially dilute the stock solutions by transferring 5 µl from columns 1 to 2 and by mixing thoroughly with the predispensed DMSO by a minimum of seven aspiration and dispensing steps. This is done simultaneously for all three compound solutions using a multipipette. Continue this process by moving one column at the time, i.e., 2–3, 3–4 and so on, until the sample in column 11 has been thoroughly mixed. Remove 5 µl from column 11 to ensure the same volume of 10 µl in all wells. This procedure generates an 11-point dose-response curve with threefold difference in concentration between wells. Column 12 with added DMSO serves as a negative control.
23| Split the serial dilutions into two copies by transferring 5 µl of all solutions to a second 96U NUNC plate. Place one of the copies in a −20 °C freezer as backup.
24| Dilute all the serially diluted solutions 50-fold through the addition of cell culture medium.
25| Transfer 5 µl of all diluted compound solutions to a Twin.tec PCR plate.
26| Add 15 µl of the homogenous cell suspension (40 million cells per milliliter) to each well of the Twin.tec PCR plate.
27| Incubate the plate for 30 min in the CO2 incubator at 37 °C. Carefully shake the plate manually every 10 min to promote compound access to the cells.
Heat treatment of cell suspensions ● tIMInG 10 min28| Place the PCR plate in a TECHNE thermal cycler and heat the cells for 3 min at 50 °C. crItIcal step In this instrument, the plate must be present during temperature ramping, but this is achieved in 5 s and hence it will not affect the total incubation time substantially.? trouBlesHootInG
29| Remove the plate from the instrument and place it in an aluminum block at room temperature for 3 min to ensure consistent cooling between wells.
cell lysis and detection of soluble protein30| For reasons already described, we present two different means for the detection and quantification of soluble protein, i.e., a western blot approach (option A) and a homogeneous AlphaScreen-based assay (option B).(a) Western blot format ● tIMInG 5–6 h (or 1–2 d with overnight incubations) (i) Transfer 50 µl of the samples in individual wells of the Twin.tec PCR plate into individual 0.2-ml PCR tubes, preferably
in strips. This yields a total of 36 PCR tubes or 12 tubes per compound (keeping the tubes in strips facilitates tube handling).
(ii) Snap-freeze the heat-treated cell suspensions in liquid nitrogen. pause poInt The experiment can be paused here with the samples kept at −80 °C overnight.

©20
14 N
atu
re A
mer
ica,
Inc.
All
rig
hts
res
erve
d.
protocol
2114 | VOL.9 NO.9 | 2014 | nature protocols
(iii) Freeze-thaw the cells twice using liquid nitrogen and a thermal cycler or heating block set at 25 °C to ensure a uniform temperature between tubes. The tubes are vortexed briefly after each thawing. The resulting cell lysates are kept on ice (4 °C) after the last thawing step. ? trouBlesHootInG
(iv) Briefly vortex the tubes and centrifuge the cell lysate containing tubes at 20,000g for 20 min at 4 °C to pellet cell debris together with precipitated and aggregated proteins. Carefully remove the tubes from the centrifuge so as not to disturb the pellet. Keep the samples on ice in a cooling block.
(v) For each tube, transfer 40 µl of each supernatant containing the soluble protein fraction to a new tube. The soluble fraction is now ready for analysis by western blotting. crItIcal step Be sure not to touch the sides of the tubes and especially not the pellet with the pipette tip when transferring the supernatant.
(vi) From here on, the protocol is identical to that described in Step 17A. However, for analysis, data should be normalized to a maximum of 100% for the highest value and to 0% for the lowest value and then analyzed by applying the saturation binding curve (rectangular hyperbola; binding isotherm) function within GraphPad Prism. We apply this equilibrium model for empirical ranking of compounds (see ‘Limitations’ section for a discussion on the choice of models). ? trouBlesHootInG
(B) alphascreen format ● tIMInG 5–6 h or overnight (i) Add 140 µl of 1× PerkinElmer lysis buffer to all wells.
crItIcal step For cost and throughput reasons, there will be interest in minimizing both the sample volume and the volume of added cell lysis buffer (ongoing efforts in our laboratory). When attempting this, it must be checked that the medium components do not interfere with the readout. In this particular case, the dilution serves to minimize interference of biotin in the cell medium with the detection step, as one of the antibodies is captured on streptavidin-coated beads.
(ii) Thoroughly mix the cell suspensions with the added lysis buffer to achieve a complete cell lysis in all samples by using the 96-well head on the CyBi-Well liquid handling station. This is achieved by means of six aspiration and dispensing cycles of 25 µl each. ? trouBlesHootInG
(iii) Using the same 96-well head, transfer 4 µl of the samples from the Twin.tec PCR plate to a quadrant of the 384-well ProxiPlate.
(iv) Use a multipipette to add 5 µl of the acceptor bead mix, seal the plate with Thermowell plate seals and agitate the plate on a plate shaker for ~5 min at 500 r.p.m.
(v) Incubate the plate for 2 h at room temperature. crItIcal step From now on, all work must be performed under subdued light because of light-sensitive reagents (AlphaScreen donor beads).
(vi) Use a multipipette to add 2 µl of donor bead mix, seal the plate(s) and centrifuge it briefly at 100g at room temperature for 10 s. Agitate the plate(s) on a plate shaker for ~5 min at 500 r.p.m.
(vii) Incubate the plate at room temperature for at least 2 h or preferably overnight. (viii) Read the luminescence signal in the Envision plate reader. (ix) Use data processing software (e.g., GraphPad Prism) and evaluate the chemiluminescence data by applying a suitable
model. See Step 30A(vi) for details. ? trouBlesHootInG
? trouBlesHootInGTroubleshooting advice can be found in table 1, with separate sections for general issues that may arise when performing the CETSA procedure, as well as during target protein detection by means of western blot and AlphaScreen techniques, respectively. For general problems related to western blotting procedures, the user is directed to available troubleshooting guides. Similarly, for concerns related to the AlphaScreen technology, the user is referred to the manufacturer’s troubleshooting guide (http://www.perkinelmer.com/se/Resources/TechnicalResources/ApplicationSupport-Knowledgebase/AlphaScreen-SureFire-no-wash-assay/surefire_troubleshoot.xhtml).
The problems listed in the table are generally observed when the potential stabilization is being detected, i.e., in Steps 17A(xix), 17B(viii), 30A(vi) or 30B(ix). Specific considerations have also been added to address specific steps in the protocol.
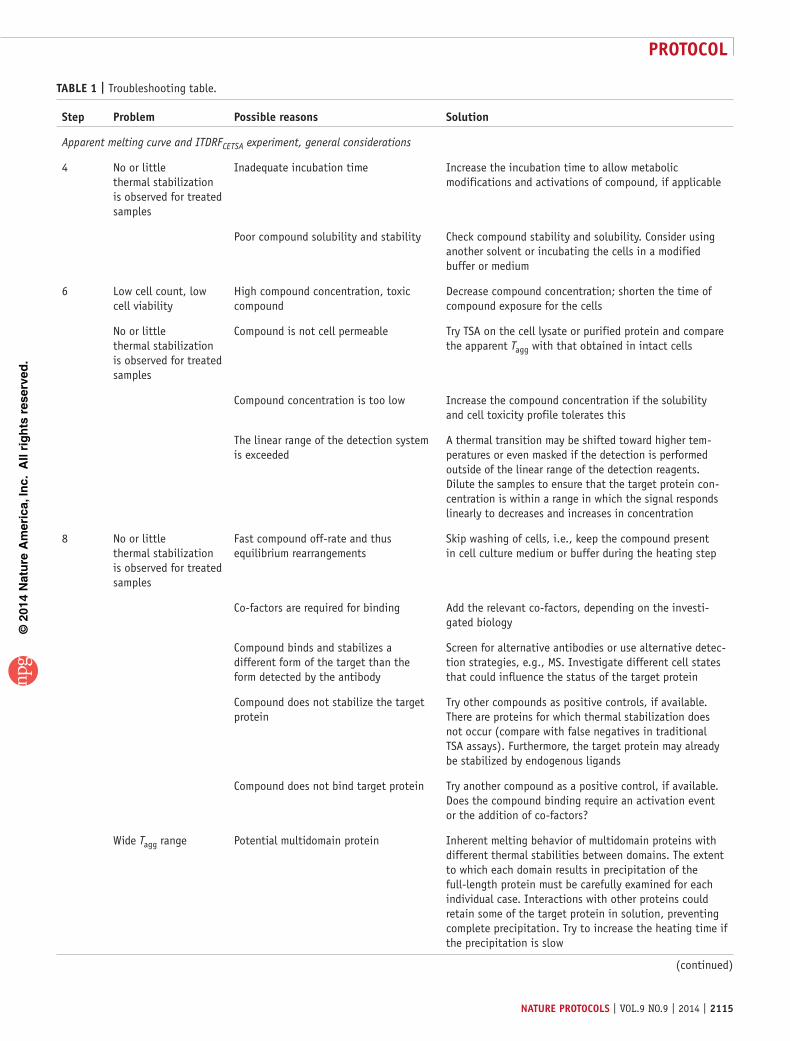
©20
14 N
atu
re A
mer
ica,
Inc.
All
rig
hts
res
erve
d.
protocol
nature protocols | VOL.9 NO.9 | 2014 | 2115
taBle 1 | Troubleshooting table.
step problem possible reasons solution
Apparent melting curve and ITDRFCETSA experiment, general considerations
4 No or little thermal stabilization is observed for treated samples
Inadequate incubation time Increase the incubation time to allow metabolic modifications and activations of compound, if applicable
Poor compound solubility and stability Check compound stability and solubility. Consider using another solvent or incubating the cells in a modified buffer or medium
6 Low cell count, low cell viability
High compound concentration, toxic compound
Decrease compound concentration; shorten the time of compound exposure for the cells
No or little thermal stabilization is observed for treated samples
Compound is not cell permeable Try TSA on the cell lysate or purified protein and compare the apparent Tagg with that obtained in intact cells
Compound concentration is too low Increase the compound concentration if the solubility and cell toxicity profile tolerates this
The linear range of the detection system is exceeded
A thermal transition may be shifted toward higher tem-peratures or even masked if the detection is performed outside of the linear range of the detection reagents. Dilute the samples to ensure that the target protein con-centration is within a range in which the signal responds linearly to decreases and increases in concentration
8 No or little thermal stabilization is observed for treated samples
Fast compound off-rate and thus equilibrium rearrangements
Skip washing of cells, i.e., keep the compound present in cell culture medium or buffer during the heating step
Co-factors are required for binding Add the relevant co-factors, depending on the investi-gated biology
Compound binds and stabilizes a different form of the target than the form detected by the antibody
Screen for alternative antibodies or use alternative detec-tion strategies, e.g., MS. Investigate different cell states that could influence the status of the target protein
Compound does not stabilize the target protein
Try other compounds as positive controls, if available. There are proteins for which thermal stabilization does not occur (compare with false negatives in traditional TSA assays). Furthermore, the target protein may already be stabilized by endogenous ligands
Compound does not bind target protein Try another compound as a positive control, if available. Does the compound binding require an activation event or the addition of co-factors?
Wide Tagg range Potential multidomain protein Inherent melting behavior of multidomain proteins with different thermal stabilities between domains. The extent to which each domain results in precipitation of the full-length protein must be carefully examined for each individual case. Interactions with other proteins could retain some of the target protein in solution, preventing complete precipitation. Try to increase the heating time if the precipitation is slow
(continued)
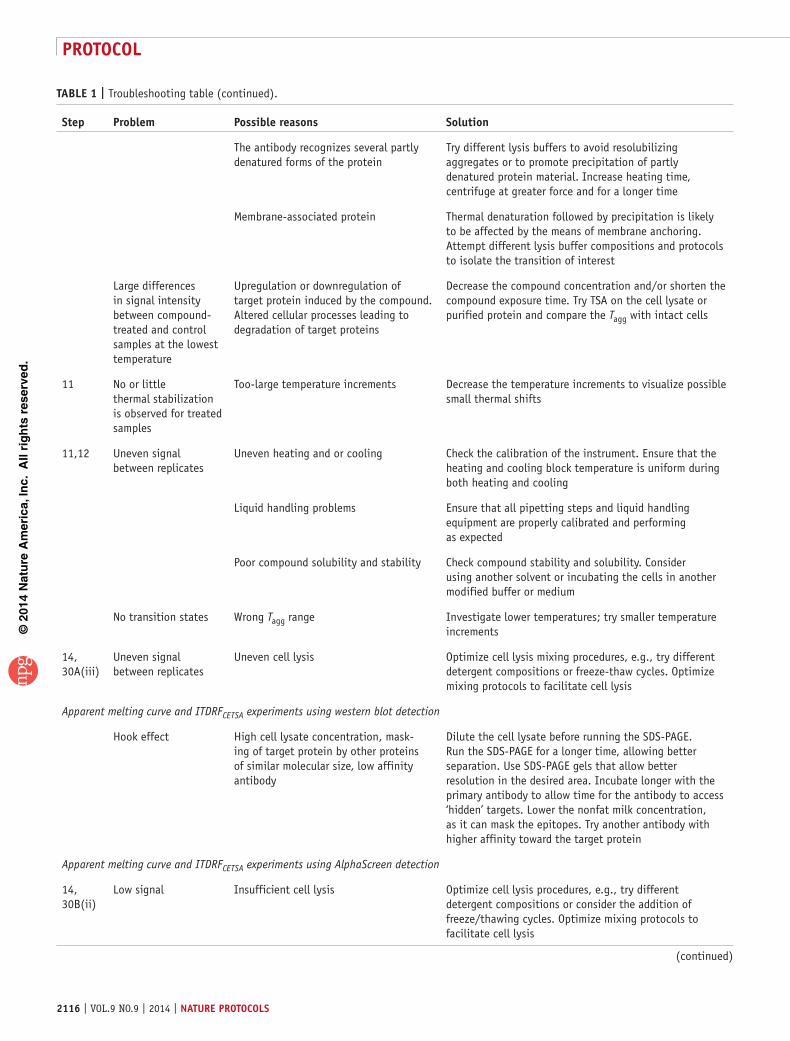
©20
14 N
atu
re A
mer
ica,
Inc.
All
rig
hts
res
erve
d.
protocol
2116 | VOL.9 NO.9 | 2014 | nature protocols
taBle 1 | Troubleshooting table (continued).
step problem possible reasons solution
The antibody recognizes several partly denatured forms of the protein
Try different lysis buffers to avoid resolubilizing aggregates or to promote precipitation of partly denatured protein material. Increase heating time, centrifuge at greater force and for a longer time
Membrane-associated protein Thermal denaturation followed by precipitation is likely to be affected by the means of membrane anchoring. Attempt different lysis buffer compositions and protocols to isolate the transition of interest
Large differences in signal intensity between compound-treated and control samples at the lowest temperature
Upregulation or downregulation of target protein induced by the compound. Altered cellular processes leading to degradation of target proteins
Decrease the compound concentration and/or shorten the compound exposure time. Try TSA on the cell lysate or purified protein and compare the Tagg with intact cells
11 No or little thermal stabilization is observed for treated samples
Too-large temperature increments Decrease the temperature increments to visualize possible small thermal shifts
11,12 Uneven signal between replicates
Uneven heating and or cooling Check the calibration of the instrument. Ensure that the heating and cooling block temperature is uniform during both heating and cooling
Liquid handling problems Ensure that all pipetting steps and liquid handling equipment are properly calibrated and performing as expected
Poor compound solubility and stability Check compound stability and solubility. Consider using another solvent or incubating the cells in another modified buffer or medium
No transition states Wrong Tagg range Investigate lower temperatures; try smaller temperature increments
14, 30A(iii)
Uneven signal between replicates
Uneven cell lysis Optimize cell lysis mixing procedures, e.g., try different detergent compositions or freeze-thaw cycles. Optimize mixing protocols to facilitate cell lysis
Apparent melting curve and ITDRFCETSA experiments using western blot detection
Hook effect High cell lysate concentration, mask-ing of target protein by other proteins of similar molecular size, low affinity antibody
Dilute the cell lysate before running the SDS-PAGE. Run the SDS-PAGE for a longer time, allowing better separation. Use SDS-PAGE gels that allow better resolution in the desired area. Incubate longer with the primary antibody to allow time for the antibody to access ‘hidden’ targets. Lower the nonfat milk concentration, as it can mask the epitopes. Try another antibody with higher affinity toward the target protein
Apparent melting curve and ITDRFCETSA experiments using AlphaScreen detection
14, 30B(ii)
Low signal Insufficient cell lysis Optimize cell lysis procedures, e.g., try different detergent compositions or consider the addition of freeze/thawing cycles. Optimize mixing protocols to facilitate cell lysis
(continued)

©20
14 N
atu
re A
mer
ica,
Inc.
All
rig
hts
res
erve
d.
protocol
nature protocols | VOL.9 NO.9 | 2014 | 2117
taBle 1 | Troubleshooting table (continued).
step problem possible reasons solution
Target molecule concentration is above the linear range of detection
Titrate cell numbers and make sure that your analyte is within the linear range of detection. Note that a too high analyte concentration may oversaturate the detection system and generate a decreased signal (hook effect)
Target molecule concentration below the limit of detection
Titrate cell number and make sure that your analyte is within the linear range of detection
Interference from biotin in the media Check the influence of the cell media composition on your detection system. If necessary change medium or increase the dilution of samples to reduce interference. Alternatively, increase the AlphaScreen donor bead concentration
Antibody binding has not reached equi-librium
Incubate the plate for a longer time period. Evaluate alternative antibody pairs that allows a faster establishment of equilibrium
Large differences in signal intensity between compound treated and control samples at the lowest temperature
Interference of compounds on epitope recognition, i.e., a compound-induced quenching of antibody recognition
Evaluate alternative antibody pairs or alternatively attempt the identification of alternative buffer conditions during detection that prevents ligand binding
See also TROUBLESHOOTING guidance for Step 6 above
High background Cross-reactivity in the detection system Evaluate alternative antibody pairs with more selective recognition of the target protein. If possible, increase the dilution of samples to reduce interference
Antibodies also recognize aggregated protein
Evaluate alternative antibody pairs. Include a centrifuga-tion or filtration step to remove aggregated proteins
15 High background Detergents in the lysis buffer dissolve the aggregated protein
Optimize the lysis buffer composition and protocol to avoid solubilizing aggregates
28 Uneven signal over the plate
Plate edge effects owing to temperature gradients during compound treatment
Keep temperature constant in media and reagents during compound dilution and cell treatment
Plate edge effects owing to temperature gradients during reading
Ensure that incubation with donor beads is at the instru-ment ambient temperature or allow a proper time for equilibration close to the instrument before reading
See also TROUBLESHOOTING guidance for Step 6 above
● tIMInGSteps 1–10, cell handling and compound treatment: 2–3 hSteps 11–13, heat treatment of cell suspensions: 10 minSteps 14–16, cell lysis: 1 hStep 17A, western blot format: 5–6 h (or 1–2 d with overnight incubations)Step 17B, AlphaScreen format: 5–6 h or overnightSteps 18–27, cell handling and compound treatment: 2 hSteps 28 and 29, heat treatment of cell suspensions: 10 minStep 30A, western blot format: 5–6 h (or 1–2 d with overnight incubations)Step 30B, AlphaScreen format: 5–6 h or overnightBox 1, antibody and cell line screen: 5–6 h after stable cell lines are acquired (or 1–2 d with overnight incubations)Box 4, high-throughput screening procedure: 7–8 h or overnight
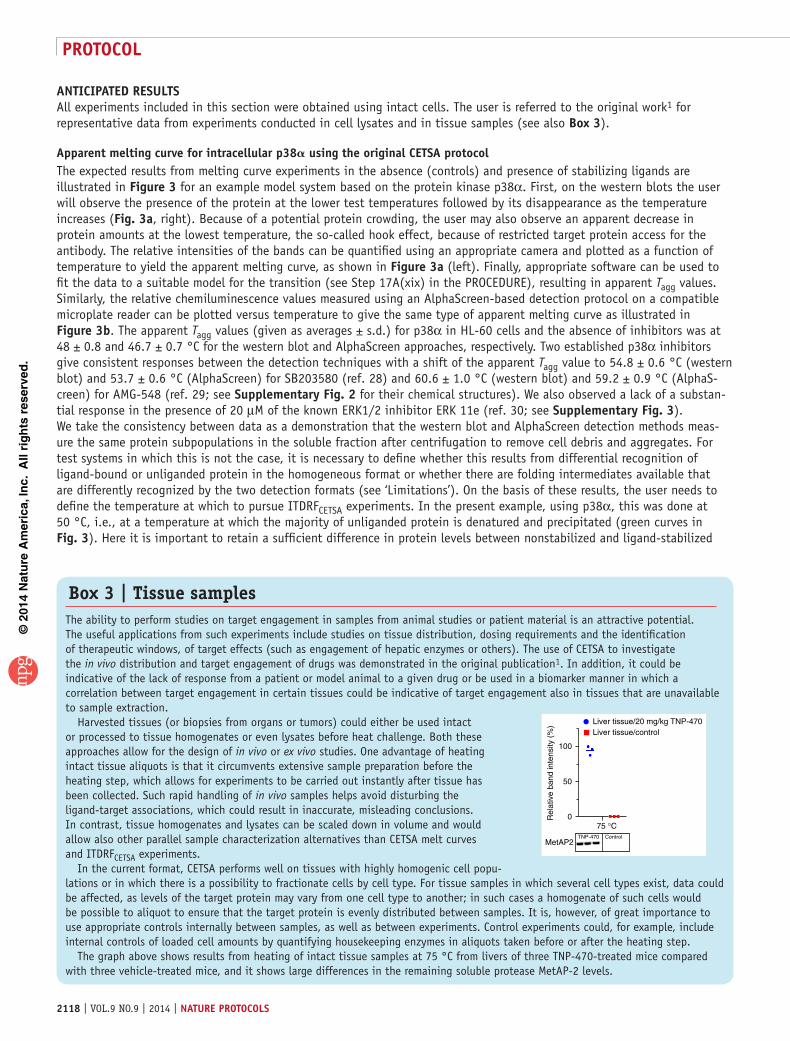
©20
14 N
atu
re A
mer
ica,
Inc.
All
rig
hts
res
erve
d.
protocol
2118 | VOL.9 NO.9 | 2014 | nature protocols
antIcIpateD resultsAll experiments included in this section were obtained using intact cells. The user is referred to the original work1 for representative data from experiments conducted in cell lysates and in tissue samples (see also Box 3).
apparent melting curve for intracellular p38a using the original cetsa protocolThe expected results from melting curve experiments in the absence (controls) and presence of stabilizing ligands are illustrated in Figure 3 for an example model system based on the protein kinase p38α. First, on the western blots the user will observe the presence of the protein at the lower test temperatures followed by its disappearance as the temperature increases (Fig. 3a, right). Because of a potential protein crowding, the user may also observe an apparent decrease in protein amounts at the lowest temperature, the so-called hook effect, because of restricted target protein access for the antibody. The relative intensities of the bands can be quantified using an appropriate camera and plotted as a function of temperature to yield the apparent melting curve, as shown in Figure 3a (left). Finally, appropriate software can be used to fit the data to a suitable model for the transition (see Step 17A(xix) in the PROCEDURE), resulting in apparent Tagg values. Similarly, the relative chemiluminescence values measured using an AlphaScreen-based detection protocol on a compatible microplate reader can be plotted versus temperature to give the same type of apparent melting curve as illustrated in Figure 3b. The apparent Tagg values (given as averages ± s.d.) for p38α in HL-60 cells and the absence of inhibitors was at 48 ± 0.8 and 46.7 ± 0.7 °C for the western blot and AlphaScreen approaches, respectively. Two established p38α inhibitors give consistent responses between the detection techniques with a shift of the apparent Tagg value to 54.8 ± 0.6 °C (western blot) and 53.7 ± 0.6 °C (AlphaScreen) for SB203580 (ref. 28) and 60.6 ± 1.0 °C (western blot) and 59.2 ± 0.9 °C (AlphaS-creen) for AMG-548 (ref. 29; see supplementary Fig. 2 for their chemical structures). We also observed a lack of a substan-tial response in the presence of 20 µM of the known ERK1/2 inhibitor ERK 11e (ref. 30; see supplementary Fig. 3). We take the consistency between data as a demonstration that the western blot and AlphaScreen detection methods meas-ure the same protein subpopulations in the soluble fraction after centrifugation to remove cell debris and aggregates. For test systems in which this is not the case, it is necessary to define whether this results from differential recognition of ligand-bound or unliganded protein in the homogeneous format or whether there are folding intermediates available that are differently recognized by the two detection formats (see ‘Limitations’). On the basis of these results, the user needs to define the temperature at which to pursue ITDRFCETSA experiments. In the present example, using p38α, this was done at 50 °C, i.e., at a temperature at which the majority of unliganded protein is denatured and precipitated (green curves in Fig. 3). Here it is important to retain a sufficient difference in protein levels between nonstabilized and ligand-stabilized
Box 3 | Tissue samples The ability to perform studies on target engagement in samples from animal studies or patient material is an attractive potential. The useful applications from such experiments include studies on tissue distribution, dosing requirements and the identification of therapeutic windows, of target effects (such as engagement of hepatic enzymes or others). The use of CETSA to investigate the in vivo distribution and target engagement of drugs was demonstrated in the original publication1. In addition, it could be indicative of the lack of response from a patient or model animal to a given drug or be used in a biomarker manner in which a correlation between target engagement in certain tissues could be indicative of target engagement also in tissues that are unavailable to sample extraction. Harvested tissues (or biopsies from organs or tumors) could either be used intact or processed to tissue homogenates or even lysates before heat challenge. Both these approaches allow for the design of in vivo or ex vivo studies. One advantage of heating intact tissue aliquots is that it circumvents extensive sample preparation before the heating step, which allows for experiments to be carried out instantly after tissue has been collected. Such rapid handling of in vivo samples helps avoid disturbing the ligand-target associations, which could result in inaccurate, misleading conclusions. In contrast, tissue homogenates and lysates can be scaled down in volume and would allow also other parallel sample characterization alternatives than CETSA melt curves and ITDRFCETSA experiments. In the current format, CETSA performs well on tissues with highly homogenic cell popu-lations or in which there is a possibility to fractionate cells by cell type. For tissue samples in which several cell types exist, data could be affected, as levels of the target protein may vary from one cell type to another; in such cases a homogenate of such cells would be possible to aliquot to ensure that the target protein is evenly distributed between samples. It is, however, of great importance to use appropriate controls internally between samples, as well as between experiments. Control experiments could, for example, include internal controls of loaded cell amounts by quantifying housekeeping enzymes in aliquots taken before or after the heating step. The graph above shows results from heating of intact tissue samples at 75 °C from livers of three TNP-470-treated mice compared with three vehicle-treated mice, and it shows large differences in the remaining soluble protease MetAP-2 levels.
100
50
75 °CTNP-470 Control
Liver tissue/20 mg/kg TNP-470Liver tissue/control
MetAP2
Rel
ativ
e ba
nd in
tens
ity (
%)
0

©20
14 N
atu
re A
mer
ica,
Inc.
All
rig
hts
res
erve
d.
protocol
nature protocols | VOL.9 NO.9 | 2014 | 2119
samples such that any effect of the ligand can be measured with statistical certainty, thus favoring doing these experiments at high temperatures where nonstabilized protein levels are low. However, at the same time it is important to avoid too-elevated temperatures, as this translates into a loss of sensitive response to ligands such that weak binders can be missed. As already described under ‘Limitations’, the user should also be aware that there may be examples in which ligand binding results in a reduced ability of the affinity reagents to detect the remaining soluble protein when applying the homogeneous screen format, because in this case the protein remains in a native and therefore potentially ligand-binding form also during detection. Such a ligand-induced detection signal quench is illustrated and described in detail for another example protein kinase pair ERK1/2 in supplementary Data. This is not a problem if western blots or other detection formats that allow the recognition of linear epitopes after isolation of the soluble fraction are used.
Isothermal dose-response fingerprint for intracellular p38a
When performing the ITDRFCETSA experiments, the user is expected to observe an increased presence of target protein, as the ligand concentration is increased to levels where protein binding saturates. This occurs because the experiment is conducted at a temperature where a major portion of the target protein denatures and precipitates unless it is thermally stabilized by the ligand. The increased protein levels are observed visually on the western blot (Fig. 4a, right). After quantification, the relative intensities are plotted as a function of ligand concentration to generate the ITDRFCETSA curve in Figure 4a (left). The corresponding data for the homogeneous assay using AlphaScreen-based detection can be found in Figure 4b. Appropriate software is used to fit the data to a suitable model yielding the concentrations at which half-maximal thermal stabilization of p38α in HL-60 cells is observed. In these examples, the outcome was 0.41 ± 0.12 µM (western blot) and 0.26 ± 0.11 µM (AlphaScreen) for SB203580 and 19 ± 7 nM (western blot) and 35 ± 16 nM (AlphaScreen) for AMG-548, whereas ERK 11e did not result in any stabilization within the tested concentration range (see supplementary Data for the dose-response
AMG-548
SB203580
ERK 11e
Drug conc.
p38α
β-Actin
p38α
β-Actin
p38α
β-Actin
100
50
0
10–4 10–3 10–2
[Compound] (µM)
10–1 100 101 102
Rel
ativ
e ba
nd in
tens
ity (
%)
AMG-548SB203580ERK 11e
a
100
50
0
10–4 10–3 10–2
[Compound] (µM)
10–1 100 101 102Rel
ativ
e A
lpha
Scr
een
sign
al (
%)
AMG-548SB203580ERK 11e
b
Figure 4 | Illustration of the amount of stabilized soluble p38α accessible for detection in the presence of increasing concentrations of compounds in HL-60 cells. (a,b) Quantification was either made using western blot (a, left; the right image shows raw western blot data for p38α as well as corresponding β-actin levels) or the SureFire assay (b) directed toward p38α. Data were obtained in the presence of the dual ERK1/2 inhibitor ERK 11e (green triangle) as a negative control and the established p38α inhibitors SB203580 (red square) and AMG-548 (blue circle) as positive controls. All experiments were performed at three independent occasions, and data are given as the average ± s.e.m. from these experiments. The solid lines represent the best fits of the data to the saturation binding curve model within the GraphPad Prism software. All data were obtained as outlined in the PROCEDURE.
100
a
50
0
Temperature (°C)40 43 46 49 52 55 58 61 64 67 70
Rel
ativ
e ba
nd in
tens
ity (
%)
AMG-548SB203580
DMSOERK 11e
AMG-548SB203580
DMSOERK 11e
100
b
50
0
Temperature (°C)40 43 46 49 52 55 58 61 64 67 70
Rel
ativ
e A
lpha
Scr
een
sign
al (
%)
40 °C
AM
G-5
48
SB
2035
80
DM
SO
AM
G-5
48
SB
2035
80
AM
G-5
48
SB
2035
80
DM
SO
DM
SO
AM
G-5
48
SB
2035
80
DM
SO
AM
G-5
48
SB
2035
80
DM
SO
AM
G-5
48
SB
2035
80
DM
SO
AM
G-5
48
SB
2035
80
DM
SO
AM
G-5
48
SB
2035
80
DM
SO
AM
G-5
48
SB
2035
80
DM
SO
AM
G-5
48
SB
2035
80
DM
SO
43 °C 46 °C 49 °C 52 °C
55 °C 58 °C 61 °C 64 °C 67 °C
Figure 3 | Illustration of the remaining amount of p38α accessible for detection as a function of the temperature used for heat treatment of HL-60 cells. (a,b) Quantification was either based on western blotting (a, left; the right image shows raw western blot data for p38α) or the SureFire assay (b) directed toward p38α. Data were obtained in the absence (green triangle) and in the presence of several different compounds, including the dual ERK1/2 inhibitor ERK 11e (purple, inverted triangle) as a negative control (supplementary Fig. 3) and the established p38α inhibitors SB203580 (red square) and AMG-548 (blue circle) as positive controls. All experiments were performed at three independent occasions, and data are given as the average ± s.e.m. from these experiments. The solid lines represent the best fits of the data to the Boltzmann sigmoid within the GraphPad Prism software. All data were obtained as outlined in the PROCEDURE.

©20
14 N
atu
re A
mer
ica,
Inc.
All
rig
hts
res
erve
d.
protocol
2120 | VOL.9 NO.9 | 2014 | nature protocols
Box 4 | High-throughput screening procedure for the identification of stabilizers of intracellular p38a ● tIMInG 7–8 h or overnightThe screening procedure is very similar to that described for the ITDRFCETSA experiment. The major difference is that the assay allows the parallel processing of a larger number of plates simultaneously. In this example, the screen concerns the testing of library compounds at one concentration, but the same procedure can also be applied for a dose-response characterization of a large number of identified active hit compounds from a high-throughput screening campaign. To achieve this, the assay is additionally adapted for the use of automated liquid handling instrumentation. The procedure below describes the analysis of 352 different compounds along with 16 positive and 16 negative controls at 10 µM compound concentration on one 384-well ProxiPlate. To achieve this, four 96-well plates are used for cell treatment and heating and one 384-well ProxiPlate for the AlphaScreen-based detection. As already described, the temperature at which to perform the screen experiment is set at 50 °C on the basis of the previous melting curve of the ligand-free form of intracellular p38α.
cell handling and compound treatment ● tIMInG 2 h1. Expand HL-60 cells in cell culture medium supplemented with 10% (vol/vol) serum and antibiotics to a cell density of ~1.5–2 million cells per ml using standard sterile cell culture procedures and supplies. Approximately 260 million HL-60 cells are needed for one 384-well detection plate, including an overhead of 10% to accommodate dead volumes when using the automated liquid handling equipment.2. Collect the cell suspension with a serological pipette and transfer the cells to 15-ml conical tubes.3. Centrifuge the conical tubes to pellet the cells at 300g for 3 min at room temperature and carefully remove and discard the culture medium. Resuspend the cell pellet in fresh cell culture medium supplemented with 10% (vol/vol) serum and antibiotics to yield a cell density of ~30 million cells per milliliter.4. Prepare compound source plates by placing 10 mM DMSO stock solutions of the individual library compounds in a Labcyte 384 LDV plate. The source plates are sealed and stored under controlled atmosphere conditions (low oxygen and relative humidity) to prevent compound deg-radation and precipitation. The preparation of source plates is commonly achieved by transfer of stock solutions from mother plates purchased from commercial small molecule library vendors using a liquid handler such as the CyBi-Well, preferably equipped with a 384-well head.! cautIon Use appropriate safety equipment and a controlled environment when working with potentially toxic and mutagenic compounds. This is particularly important when you are handling DMSO solutions, as the solvent is highly skin-permeable.5. Use the Echo 550 acoustic liquid dispenser to place 20 nl of the 10 mM DMSO stock solutions in each well of four separate Twin.tec PCR plates in columns 1–11. Add 40 nl of the 10 mM DMSO solution of SB203580 to wells A–D in column 12, serving as a positive control, and 20 nl of DMSO to wells E–H in column 12, serving as a negative control, to each of the four 96-well plates. To ensure that all wells received the same amount of DMSO, the Echo is also used to dispense DMSO up to a total volume of 100 nl in all wells.6. Add 20 µl of the homogenous cell suspension (30 million cells per milliliter) to the Twin.tec PCR plates using a Multidrop.7. Incubate the plates for 30 min in the CO2 incubator at 37 °C. Carefully shake the plates manually every 10 min to promote compound access to the cells.
Heat treatment of cell suspensions ● tIMInG 10 min8. Place the PCR plates sequentially in a TECHNE thermal cycler and heat the cells for 3 min at 50 °C. crItIcal step In this instrument, the plate must be present during temperature ramping, but this is achieved in 5 s, and hence will not substantially affect the total incubation time.9. Remove the plates from the instrument and place them in aluminum blocks at room temperature for 3 min to ensure consistent cooling between wells.
cell lysis and detection of soluble protein ● tIMInG 5–6 h or overnight10. Add 140 µl of 1× PerkinElmer lysis buffer to all wells using a Multidrop. crItIcal step For cost and throughput reasons, minimizing both the sample volume and the volume of added cell lysis buffer will be of interest (on-going efforts in our laboratory). When attempting this, ensure that the medium components do not interfere with the readout. In this particular case, the dilution serves to minimize interference of biotin in the cell medium with the detection step, as one of the antibodies is captured on streptavidin-coated beads.11. By using the CyBi-Well, mix the cell suspensions with the compounds of the 96-well plates thoroughly to achieve complete cell lysis in all samples. This is achieved by means of a minimum of six aspiration and dispensing cycles of 25 µl each. Transfer 4 µl of the samples in the first 96-well plate to quadrant one on the 384-well ProxiPlate using the CyBi-Well. This procedure is done sequentially for each 96-well plate, with plate 2 being placed in quadrant 2 and so on until the fourth plate is placed in quadrant 4.12. Depending on the plate numbers, use a multipipette or Multidrop Combi mounted with a small tube dispensing cassette to add 5 µl of the acceptor bead mix, seal the plates with Thermowell plate seals and agitate the plates on a plate shaker for ~5 min at 500 r.p.m.13. Incubate the plates for 2 h at room temperature. crItIcal step From now on, all work has to be performed under subdued light because of light-sensitive reagents (AlphaScreen Donor beads).14. Depending on the plate numbers, use a multipipette or Multidrop Combi mounted with a small tube dispensing cassette to add 2 µl of donor bead mix, seal the plate(s) and centrifuge them briefly at 100g at room temperature for 10 s. Agitate the plate(s) on a plate shaker for ~5 min at 500 r.p.m.15. Incubate the plate(s) at room temperature for at least 2 h or preferably overnight.16. Read the chemiluminescence signal in the Envision plate reader.17. Use data processing software (e.g., GraphPad Prism) to evaluate the chemiluminescence data by applying a suitable model. Here data were normalized by dividing the observed value for each well with the average value of the control wells containing DMSO only. Normalized data were then illustrated as a function of the position in the 96-well microplate (well ID) using GraphPad Prism.
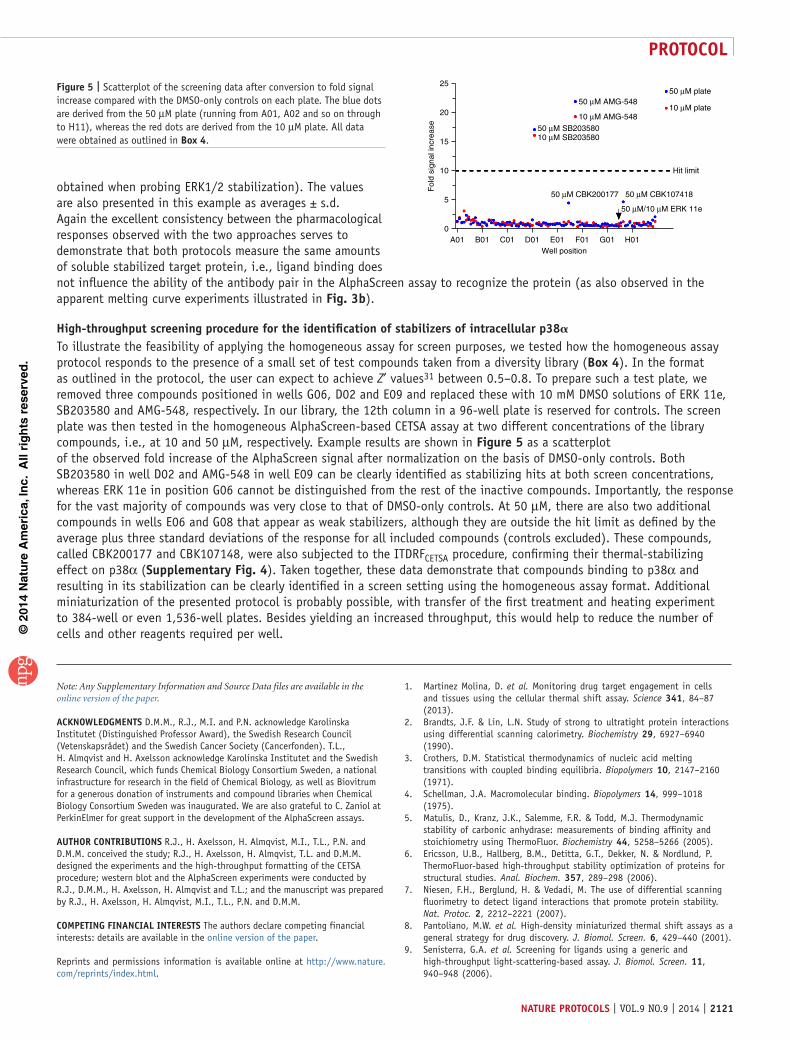
©20
14 N
atu
re A
mer
ica,
Inc.
All
rig
hts
res
erve
d.
protocol
nature protocols | VOL.9 NO.9 | 2014 | 2121
obtained when probing ERK1/2 stabilization). The values are also presented in this example as averages ± s.d. Again the excellent consistency between the pharmacological responses observed with the two approaches serves to demonstrate that both protocols measure the same amounts of soluble stabilized target protein, i.e., ligand binding does not influence the ability of the antibody pair in the AlphaScreen assay to recognize the protein (as also observed in the apparent melting curve experiments illustrated in Fig. 3b).
High-throughput screening procedure for the identification of stabilizers of intracellular p38a
To illustrate the feasibility of applying the homogeneous assay for screen purposes, we tested how the homogeneous assay protocol responds to the presence of a small set of test compounds taken from a diversity library (Box 4). In the format as outlined in the protocol, the user can expect to achieve Z′ values31 between 0.5–0.8. To prepare such a test plate, we removed three compounds positioned in wells G06, D02 and E09 and replaced these with 10 mM DMSO solutions of ERK 11e, SB203580 and AMG-548, respectively. In our library, the 12th column in a 96-well plate is reserved for controls. The screen plate was then tested in the homogeneous AlphaScreen-based CETSA assay at two different concentrations of the library compounds, i.e., at 10 and 50 µM, respectively. Example results are shown in Figure 5 as a scatterplot of the observed fold increase of the AlphaScreen signal after normalization on the basis of DMSO-only controls. Both SB203580 in well D02 and AMG-548 in well E09 can be clearly identified as stabilizing hits at both screen concentrations, whereas ERK 11e in position G06 cannot be distinguished from the rest of the inactive compounds. Importantly, the response for the vast majority of compounds was very close to that of DMSO-only controls. At 50 µM, there are also two additional compounds in wells E06 and G08 that appear as weak stabilizers, although they are outside the hit limit as defined by the average plus three standard deviations of the response for all included compounds (controls excluded). These compounds, called CBK200177 and CBK107148, were also subjected to the ITDRFCETSA procedure, confirming their thermal-stabilizing effect on p38α (supplementary Fig. 4). Taken together, these data demonstrate that compounds binding to p38α and resulting in its stabilization can be clearly identified in a screen setting using the homogeneous assay format. Additional miniaturization of the presented protocol is probably possible, with transfer of the first treatment and heating experiment to 384-well or even 1,536-well plates. Besides yielding an increased throughput, this would help to reduce the number of cells and other reagents required per well.
25
20
15
50 µM SB20358010 µM SB203580
50 µM CBK200177 50 µM CBK107418
50 µM/10 µM ERK 11e
Hit limit
50 µM plate
10 µM plate10 µM AMG-548
50 µM AMG-548
10
Fol
d si
gnal
incr
ease
5
A01 B01 C01 D01 E01 F01Well position
G01 H010
Figure 5 | Scatterplot of the screening data after conversion to fold signal increase compared with the DMSO-only controls on each plate. The blue dots are derived from the 50 µM plate (running from A01, A02 and so on through to H11), whereas the red dots are derived from the 10 µM plate. All data were obtained as outlined in Box 4.
Note: Any Supplementary Information and Source Data files are available in the online version of the paper.
acKnoWleDGMents D.M.M., R.J., M.I. and P.N. acknowledge Karolinska Institutet (Distinguished Professor Award), the Swedish Research Council (Vetenskapsrådet) and the Swedish Cancer Society (Cancerfonden). T.L., H. Almqvist and H. Axelsson acknowledge Karolinska Institutet and the Swedish Research Council, which funds Chemical Biology Consortium Sweden, a national infrastructure for research in the field of Chemical Biology, as well as Biovitrum for a generous donation of instruments and compound libraries when Chemical Biology Consortium Sweden was inaugurated. We are also grateful to C. Zaniol at PerkinElmer for great support in the development of the AlphaScreen assays.
autHor contrIButIons R.J., H. Axelsson, H. Almqvist, M.I., T.L., P.N. and D.M.M. conceived the study; R.J., H. Axelsson, H. Almqvist, T.L. and D.M.M. designed the experiments and the high-throughput formatting of the CETSA procedure; western blot and the AlphaScreen experiments were conducted by R.J., D.M.M., H. Axelsson, H. Almqvist and T.L.; and the manuscript was prepared by R.J., H. Axelsson, H. Almqvist, M.I., T.L., P.N. and D.M.M.
coMpetInG FInancIal Interests The authors declare competing financial interests: details are available in the online version of the paper.
Reprints and permissions information is available online at http://www.nature.com/reprints/index.html.
1. Martinez Molina, D. et al. Monitoring drug target engagement in cells and tissues using the cellular thermal shift assay. Science 341, 84–87 (2013).
2. Brandts, J.F. & Lin, L.N. Study of strong to ultratight protein interactions using differential scanning calorimetry. Biochemistry 29, 6927–6940 (1990).
3. Crothers, D.M. Statistical thermodynamics of nucleic acid melting transitions with coupled binding equilibria. Biopolymers 10, 2147–2160 (1971).
4. Schellman, J.A. Macromolecular binding. Biopolymers 14, 999–1018 (1975).
5. Matulis, D., Kranz, J.K., Salemme, F.R. & Todd, M.J. Thermodynamic stability of carbonic anhydrase: measurements of binding affinity and stoichiometry using ThermoFluor. Biochemistry 44, 5258–5266 (2005).
6. Ericsson, U.B., Hallberg, B.M., Detitta, G.T., Dekker, N. & Nordlund, P. ThermoFluor-based high-throughput stability optimization of proteins for structural studies. Anal. Biochem. 357, 289–298 (2006).
7. Niesen, F.H., Berglund, H. & Vedadi, M. The use of differential scanning fluorimetry to detect ligand interactions that promote protein stability. Nat. Protoc. 2, 2212–2221 (2007).
8. Pantoliano, M.W. et al. High-density miniaturized thermal shift assays as a general strategy for drug discovery. J. Biomol. Screen. 6, 429–440 (2001).
9. Senisterra, G.A. et al. Screening for ligands using a generic and high-throughput light-scattering-based assay. J. Biomol. Screen. 11, 940–948 (2006).

©20
14 N
atu
re A
mer
ica,
Inc.
All
rig
hts
res
erve
d.
protocol
2122 | VOL.9 NO.9 | 2014 | nature protocols
10. Fedorov, O. et al. A systematic interaction map of validated kinase inhibitors with Ser/Thr kinases. Proc. Natl. Acad. Sci. USA 104, 20523–20528 (2007).
11. Vedadi, M. et al. Chemical screening methods to identify ligands that promote protein stability, protein crystallization, and structure determination. Proc. Natl. Acad. Sci. USA 103, 15835–15840 (2006).
12. Garnett, M.J. et al. Systematic identification of genomic markers of drug sensitivity in cancer cells. Nature 483, 570–575 (2012).
13. Barretina, J. et al. The Cancer Cell Line Encyclopedia enables predictive modelling of anticancer drug sensitivity. Nature 483, 603–607 (2012).
14. Feng, B.Y. & Shoichet, B.K. A detergent-based assay for the detection of promiscuous inhibitors. Nat. Protoc. 1, 550–553 (2006).
15. Walters, W.P. & Namchuk, M. Designing screens: how to make your hits a hit. Nat. Rev. Drug Disc. 2, 259–266 (2003).
16. Nordlund, P. Methods for determining ligand binding to a target protein using a thermal shift assay. UK patent no. GB2490404 (2012).
17. Weibrecht, I. et al. Proximity ligation assays: a recent addition to the proteomics toolbox. Exp. Rev. Proteom. 7, 401–409 (2010).
18. Knaust, R.K. & Nordlund, P. Screening for soluble expression of recombinant proteins in a 96-well format. Anal. Biochem. 297, 79–85 (2001).
19. Asial, I. et al. Engineering protein thermostability using a generic activity-independent biophysical screen inside the cell. Nat. Commun. 4, 2901 (2013).
20. Branca, R.M et al. HiRIEF LC-MS enables deep proteome coverage and unbiased proteogenomics. Nat. Methods 11, 59–62 (2014).
21. Eglen, R.M. et al. The use of AlphaScreen technology in HTS: current status. Curr. Chem. Genomics 1, 2–10 (2008).
22. Bazin, H., Preaudat, M., Trinquet, E. & Mathis, G. Homogeneous time resolved fluorescence resonance energy transfer using rare earth cryptates as a tool for probing molecular interactions in biology. Spectrochim. Acta. A Mol. Biomol. Spectrosc. 57, 2197–2211 (2001).
23. Osmond, R.I.W., Das, S. & Crouch, M.F. Development of cell-based assays for cytokine receptor signaling, using an AlphaScreen SureFire assay format. Anal. Biochem. 403, 94–9101 (2010).
24. Bembenek, M.E. et al. Determination of complementary antibody pairs using protein A capture with the AlphaScreen assay format. Anal. Biochem. 408, 321–327 (2011).
25. Copeland, R.A., Pompliano, D.L. & Meek, T.D. Drug-target residence time and its implications for lead optimization. Nat. Rev. Drug Disc. 5, 730–739 (2006).
26. Lepock, J.R. et al. Influence of transition rates and scan rate on kinetic simulations of differential scanning calorimetry profiles of reversible and irreversible protein denaturation. Biochemistry 31, 12706–12712 (1992).
27. Quistgaard, E.M. et al. Structural and biophysical characterization of the cytoplasmic domains of human BAP29 and BAP31. PLoS ONE 8, e71111 (2013).
28. Saklatvala, J. et al. Role for p38 mitogen-activated protein kinase in platelet aggregation caused by collagen or a thromboxane analogue. J. Biol. Chem. 271, 6586–6589 (1996).
29. Dominguez, C., Powers, D.A. & Tamayo, N. p38 MAP kinase inhibitors: many are made, but few are chosen. Curr. Opin. Drug Disc. Dev. 8, 421–430 (2005).
30. Aronov, A.M. et al. Structure-guided design of potent and selective pyrimidylpyrrole inhibitors of extracellular signal-regulated kinase (ERK) using conformational control. J. Med. Chem. 52, 6362–6368 (2009).
31. Zhang, J.H., Chung, T.D. & Oldenburg, K.R. A simple statistical parameter for use in evaluation and validation of high-throughput screening assays. J. Biomol. Screen. 4, 67–73 (1999).
32. Richman, D.D., Cleveland, P.H., Oxman, M.N. & Johnson, K.M. The binding of staphylococcal protein A by the sera of different animal species. J. Immunol. 128, 2300–2305 (1982).