the "caps" prediction system and stock market returns
TRANSCRIPT

www.hks.harvard.edu
The "CAPS" Prediction System and Stock Market Returns Faculty Research Working Paper Series
Christopher Avery Harvard Kennedy School and NBER
Judith Chevalier Yale School of Management and NBER
Richard J. Zeckhauser Harvard Kennedy School
July 2011 RWP11-028: Revision of RWP09-011, April 2009
The views expressed in the HKS Faculty Research Working Paper Series are those of the author(s) and do not necessarily reflect those of the John F. Kennedy School of Government or of Harvard University. Faculty Research Working Papers have not undergone formal review and approval. Such papers are included in this series to elicit feedback and to encourage debate on important public policy challenges. Copyright belongs to the author(s). Papers may be downloaded for personal use only.
The “CAPS” PredictionSystem and Stock Market
Returns
Christopher Avery, Judith Chevalier,Richard Zeckhauser
July 2011
Acknowledgements: We appreciate the efforts of the Motley Fool Com-pany in making data available to us. Avery and Zeckhauser gratefully ack-howledge support from the Alfred P. Sloan Foundation.

Abstract: We study the predictive power of approximately 2.5 millionstock picks submitted by individual users to the “CAPS” website run by theMotley Fool company (www.caps.fool.com). These picks prove to be surpris-ingly informative about future stock prices. Indeed, a strategy of shortingstocks with a disproportionate number of negative picks on the site andbuying stocks with a disproportionate number of positive picks produces areturn of over nine percent per annum over the sample period. These resultsare mostly driven by the fact that negative picks on the site strongly predictfuture stock price declines; positive picks on the site produce returns thatare statistically indistinguishable from the market. A Fama French decom-position suggests that these results are largely due to stock-picking ratherthan style factors or market timing.
Christopher Avery,Harvard University John F. Kennedy School of Government and NBER
Judith A Chevalier,Yale School of Management and NBER
Richard Zeckhauser,Harvard University John F. Kennedy School of Government

1 INTRODUCTION 3
1 Introduction
“Social investing” or “crowdsourcing” websites attempt to forecast stockprice performance by aggregating predictions from individual website par-ticipants. We analyze the informational content of these predictions forthe future price movements of individual stocks. Our data consists of morethan 2.5 million stock picks provided by more than 60,000 individuals fromNovember 1, 2006 to December 31, 2008, a period with significant swingsin stock market performance. These individuals made predictions throughthe CAPS open access website created and operated by the Motley Foolcompany (www.caps.fool.com). The Motley Fool prediction system is mo-tivated by a hypothesis, contrary to the efficient markets hypothesis, thatposits that many individuals—each with limited information—can providevery accurate assessments of future movements in individual stock prices, iftheir information is elicited and aggregated in an appropriate fashion.
While collaborative filtering has been demonstrated to be useful in awide variety of contexts (such as the Ebay user rating system or the Amazonrecommendor system), it has not been demonstrated to be of value in thechallenging context of predicting stock price movements. It is natural toask how collaborative filtering could possibly elicit information that is notalready incorporated into stock prices: why not trade on information ratherthan volunteer it without prospect of financial gain to a public website? Theidea behind collaborative filtering of stock opinions is that individuals havehigh trading costs and imprecise information. Individuals whose tradingcosts exceed the expected value of their imprecise information will rationallychoose not to trade to the point where this information is fully reflected inprices. Thus, the idea behind collaborative filtering is that it aggregates theunutilized information of such individuals.1.
We analyze the informational content of stock market picks submittedto CAPS by tracking the performance of portfolios formed on the basis ofthose picks. We intentionally use simple algorithms to create portfolios basedon positive and negative picks (predictions of increases and decreases in theprices of individual stocks, respectively). We show that buying positive picksand shorting negative picks produces annual returns of over nine percent overour sample period. Using a Fama French decomposition, we show that theseexcess returns are largely due to stock-picking rather than style factors ormarket timing.
1Why individuals bother to post their information is another interesting question. Asdiscussed below, Motley Fool labels and promotes top performers in the CAPS system.This may be a source of utility in it of itself

1 INTRODUCTION 4
This paper builds on several separate strains of academic literaturewithin finance. First, many studies assess the ability of institutional in-vestors to surpass market profits without taking on excessive risk. Studies ofinvestment professionals, such as mutual fund managers (Chevalier and El-lison, 1999, Wermers, 2000, Pastor and Stambaugh 2002, and Baker, Litov,Wachter, and Wurgler, 2006, among others), newsletter publishers (Met-rick, 1999) and analysts (Mikhail, Walther, Willis, 2003) generally concludethat a small percentage of people consistently “beat the market”. However,the results of these papers suggest that there are relatively few people whopossess either the information or the ability to successfully pick individualstocks.
A second set of studies supports the conventional wisdom that individualinvestors perform poorly as stock market investors. Odean and coauthors,in a series of papers, exploit a large dataset of individual customer accountsat a major discount brokerage firm to analyze the results for individualsas traders. Odean (1999) finds that individual investors’ purchases tend tounderperform their sales by a significant margin. Barber and Odean (2000)show that, on average, the stock choices of individual investors underperformmarket indices, and that this underperformance is particularly acute foractive traders. Barber and Odean (2001a) find that men are more likely tobe active traders than women, and that this trading hurts their portfolioreturns. They link this evidence to survey results showing that men aremore confident in their investing abilities, and conclude that overconfidencein stock-picking ability leads to underperformance. Finally, Barber, Odean,and Zhu (2009) show that stocks purchased heavily by individual investorsin a given week tend to outperform other stocks for the next two weeks, butthen underperform the market in the subsequent months.
Despite these findings, there is growing evidence that some individualinvestors have superior information about some assets. For example, Co-val, Hirshleifer, and Shumway (2005) demonstrate that individual investors’trades show strong persistence in performance. This suggests that someindividuals may be able to earn abnormal profits. Furthermore, a num-ber of papers suggest that the excess performance may result because thoseindividuals concentrate their portfolios in stocks for which they have an in-formational advantage. For example, Ivkovic and Weisbenner (2005) andMassa and Simonov (2006) using U.S. and Swedish data, respectively, findthat investments in local stocks outperform non-local investments and inthe Swedish case, outperform market benchmarks. Similarly, Ivkovic, Sialm,and Weisbenner (2008), using data on the investments of a large number ofindividual investors made through a discount broker from 1991 to 1996, find

1 INTRODUCTION 5
that among households with account balances greater than $100,000, thosethat hold only 1 or 2 stocks outperform those that hold 3 or more stocksby 41 basis points per month. They also show that the excess performanceis concentrated in non-S&P500 stocks that receive little analyst coverage.These findings are consistent with some investors concentrating their hold-ings in securities for which they have a true informational advantage. Suchan informational advantage would be harder to achieve for stocks that arewidely followed.
Another set of related studies considers the effect of the internet onstock market trading and prices. The internet has lowered the cost of stocktrading, but has also made it possible for individuals to participate in thestock market as commentators on message boards. One common theme ofprior research is that the internet may exacerbate behavioral biases that leadto suboptimal investments (Barber and Odean, 2001b), and possibly evencreate new methods for stock manipulation (Frieder and Zittrain, 2007).A series of recent papers assesses the informational content of postings onmessage boards such as Yahoo! and Raging Bull as well as the effect ofthese messages on stock trading and prices. The most robust finding in thisliterature identifies a connection between the volume of messages about astock and future trading of that stock—a high volume of messages tendsto predict higher future trading volumes and pricing volatility (Antweilerand Frank, 2004). In terms of information, message board postings overlapin content with forthcoming news stories (Antweiler and Frank, 2004), andearnings announcements (Bagnoli, Daniel and Watts, 1999), but messageboards promulgate them sooner than traditional media sources.
Yet there is at best limited evidence that the informational contentof message board postings predicts future price movements for individualstocks. Even though message board postings may predict future news ar-ticles, the news articles themselves have limited and short-lived predictivepower on future stock prices (Tetlock, 2007). Similarly, the assessed corre-lation between message board content and stock price movements is gener-ally small and short-lived (Das and Chen, 2007, Tumarkin and Whitelaw,2001, Antweiler and Frank, 2004), though very unusual volumes of mes-sage board activity correlate with substantial next-day price movements forthinly traded microcap stocks (Sabherwal, Sarkar, and Zhang, 2008) andnegative future returns for a broader set of stocks (Antweiler and Frank,2006).
This paper departs substantially from the previous literature on messageboard content because of the nature of the data compiled by the MotleyFool CAPS website. CAPS differs from stock message boards in three im-

1 INTRODUCTION 6
portant ways that facilitate our research. First, CAPS users make specificpredictions about the future price of a particular stock. In contrast, anal-ysis of message board postings requires a systematic language-extractionalgorithm to classify each message imperfectly as (say) “Buy/Sell/Hold”.Second, CAPS is designed to promote the reputations of its participants.Each player is rated based on the performance of previous picks, and eachplayer’s past history of picks and performance can be viewed by others.Third, CAPS synthesizes the history of past picks to produce a rating foreach stock (from the worst rating of “One Star” to the best rating of “FiveStars”) that provides a single prediction for each stock at each point in time.
A final set of related papers concerns online prediction markets suchas Intrade. These websites host competitive prediction markets for tradeof shares that will pay off if a particular event occurs (e.g. Rick Santo-rum receives the Republican presidential nomination). Recent work such asWolfers and Zitzewitz (2004) and Wolfers (2004) examine the functioning ofmarkets. In many ways, CAPS can be thought of as a hybrid of a messageboard and a prediction market. First, like a prediction market but unlikea message board, CAPS users make very specific predictions. In the caseof CAPs, these predictions are always about the future price of a particularstock. In contrast, analysis of message board postings requires a system-atic language-extraction algorithm to classify each message imperfectly as(say) “Buy/Sell/Hold”. Second, CAPS synthesizes the history of past picksto produce a rating for each stock (from the worst rating of ”One Star”to the best rating of ”Five Stars”. Prediction markets aggregate predic-tions by displaying a market price that clears the market. Message boardsdo not generally attempt to aggregate predictions. Third, message boardsdo not generally attempt to incentivize participants to produce high qual-ity predictions. Prediction markets are automatically incentivized becauseparticipants receive financial payouts if their predictions are correct. Incontrast, incentives in Motley Fool exist, but are less explicit. Participantshave no direct financial incentives to participate. Instead, participants re-ceive reputation scores and the best players with the best reputation scoresare highlighted on the site.
The paper proceeds as follows. Section 2 describes the data. Section3 provides descriptive statistics based only on absolute returns. Section4 analyzes portfolio returns using a Four-Factor decomposition. Section 5concludes.

2 DATA 7
2 Data
The data for this study was provided by the Motley Fool company under alicense agreement with Harvard University. The data contains all stock mar-ket picks from the CAPS website from November 1, 2006 through December31, 2008. The Motley Fool compiles information on each participant’s picks,and uses this information to rate both players and stocks. CAPS only allowspicks for stocks that have a price of at least $1.50 per share and a marketcap of at least $100 Million at any given time.
CAPS allows participants to make predictions about the future move-ments of individual stocks from their current prices. Many websites, includ-ing CAPS, Amazon.com, and eBay use some kind of reputation system tomeasure past performance of website participants.2. CAPS assigns a ratingto each participant as a function of the objective performance of the stocksthat she/he picked. Similar to Amazon.com’s “top reviewers” program (butin contrast to eBay), it is not clear what material benefit a participant gainsfrom garnering a positive reputation on CAPS, though CAPS includes anumber of features that promote interest in participant reputation. Eachparticipant’s player rating is publicly available and represents that partici-pant’s current percentile ranking (from 0 to 100) based on the market perfor-mance of past picks.3 Participants with ratings of 80 or above, representingthose in the top fifth of player ratings, are labelled as “CAPS All Stars” andtheir picks are highlighted throughout the website.
The data provided by Motley Fool for the study includes 2,704,719 dis-tinct picks encompassing 7,287 different stocks and 113,154 different user-names.4 As part of the data for the study, Motley Fool also provided thedaily CAPS rankings of these stocks from “1-Star” (the worst) to“5-Stars”(the best) for this one-year period. The CAPS website states that thesestock rankings are based on a proprietary algorithm, aggregating individualplayer positive and negative picks using a methodology that gives higher
2On eBay, for example, participants are invited to rate individual transactions withothers as buyers and sellers (although they receive no direct rewards for doing so). Theresulting scores for participants (number of rankings and percent positive) have beenshown to be of sufficient credibility to participants that the sellers ratings have been showto affect both the price and the probability that a listed good is sold on eBay (Resnickand Zeckhauser, 2002; Resnick, Zeckhauser, Swanson, and Lockwood, 2006; Cabral andHortacsu, 2010.
3Participants with fewer than seven CAPS picks are not given player ratings.4An individual person can register more than once on the CAPS website and make
picks using multiple “player names”. The exact number of distinct participants who havemade picks on the CAPS website is unknown.

2 DATA 8
weight to players with higher rankings (i.e. better past performance) and tomore recent picks. 5 We note that the CAPS methodology contrasts withthat used in other stock market-oriented crowdsourcing websites. For ex-ample, Piqqem.com weights all participants opinions equally to form overallpredictions, consistent with their stated philosophy that “every individualhas some unique knowledge that is relevant to at least some set of stocks”.
Each star rating corresponds to a quintile of stocks based on an under-lying (unreported) CAPS cardinal rating for those stocks. That is, “1 Star”stocks consist of those stocks at the 20th percentile or below in cardinalranking, whereas “5 Star” stocks consist of those stocks at the 80th per-centile or above in cardinal ranking based on past CAPS picks. We weregiven no information about the proprietary system used to generate theserankings and made no attempt to identify its properties.
We compiled stock price data from the Center for Research and SecurityPrices (CRSP) for November 1, 2006 (the official launch date for CAPS) toJune 30, 2009 (six months after the end of our sample of CAPS stock picks).Since CRSP and CAPS use different identification numbers for stocks, wematched stocks across the two databases by ticker symbol and by name. Wewere able to match 6,429 stocks using this methodology. We used YahooFinance for historical pricing data for 385 stocks that do not appear in CRSPbut that received at least ten CAPS picks during at least one of the fivetrading periods identified below in Table 1.6 Our matched database of stockpicks from CAPS and stock prices from CRSP/Yahoo includes incorporates2,695,044 CAPS picks, comprising 99.6% of the picks in the original data set.The remaining unmatched picks are primarily for small and often de-listedstocks.
We will present results for stocks in different size classes; we classifycompanies with market caps of more than $5 Billion as “Large Caps”, com-panies with market caps between $1 and $5 Billion as “Medium Caps” andcompanies with market caps less than $1 Billion as “Small Caps”.7
5See http://caps.fool.com/help.aspx for publicly available information on theCAPS rating algorithm.
6One distinction between the CRSP data and the Yahoo Finance data is that stockprices listed in Yahoo Finance have already been adjusted to account for dividends andsplits. We used a standard method to adjust the CRSP prices for dividends and splits,essentially assuming that dividend distributions are reinvested in the given stock. Wemade one adjustment to the Yahoo data, assigning the closing price on a day where astock was not traded to be the opening price on the next that the stock is traded. Bycontrast, Yahoo uses a default procedure of listing the closing price to equal the previousday’s closing price on a day that a stock is not traded.
7CRSP provides the number of shares outstanding for each stock, so we compute

2 DATA 9
0
25000
50000
75000
100000
125000
150000
175000
200000
Num
ber o
f Pi
cks
Month
Figure 1: Total CAPS Picks by Month
Figure 1 graphs the number of picks submitted to the CAPS website foreach month during the sample period. CAPS enjoyed a steady increase inpopularity over time from its launch through the middle of 2008, but thenumber of picks submitted per month fell in the last half of 2008. Thispattern suggests that some users may have lost interest in participating inCAPS over the course of the financial crisis and coincident downturn in stockprices in late 2008.
2.1 Trading Periods in the Sample
This study focuses attention on stock returns in five separate six monthtrading periods: (1) January 1 to June 30, 2007; (2) July 1 to December 31,2007; (3) January 1 to June 30, 2008; (2) July 1 to December 31, 2008; (5)January 1 to June 30, 2009. We assess the predictive power of CAPS ratings
the market cap for stocks listed in CRSP for each trading day in the sample by simplymultiplying this number of shares by (unadjusted) closing price. We were unable to findsimilar information in Yahoo Finance for most of the 170 stocks where we used Yahoo tocompile historical price information. Therefore, we estimated the historical market capsfor this subset of stocks based on the current market caps listed for these companies onthe CAPS website as of February, 2009 and February, 2010.
3 DESCRIPTIVE STATISTICS FOR CAPS PICKS 10
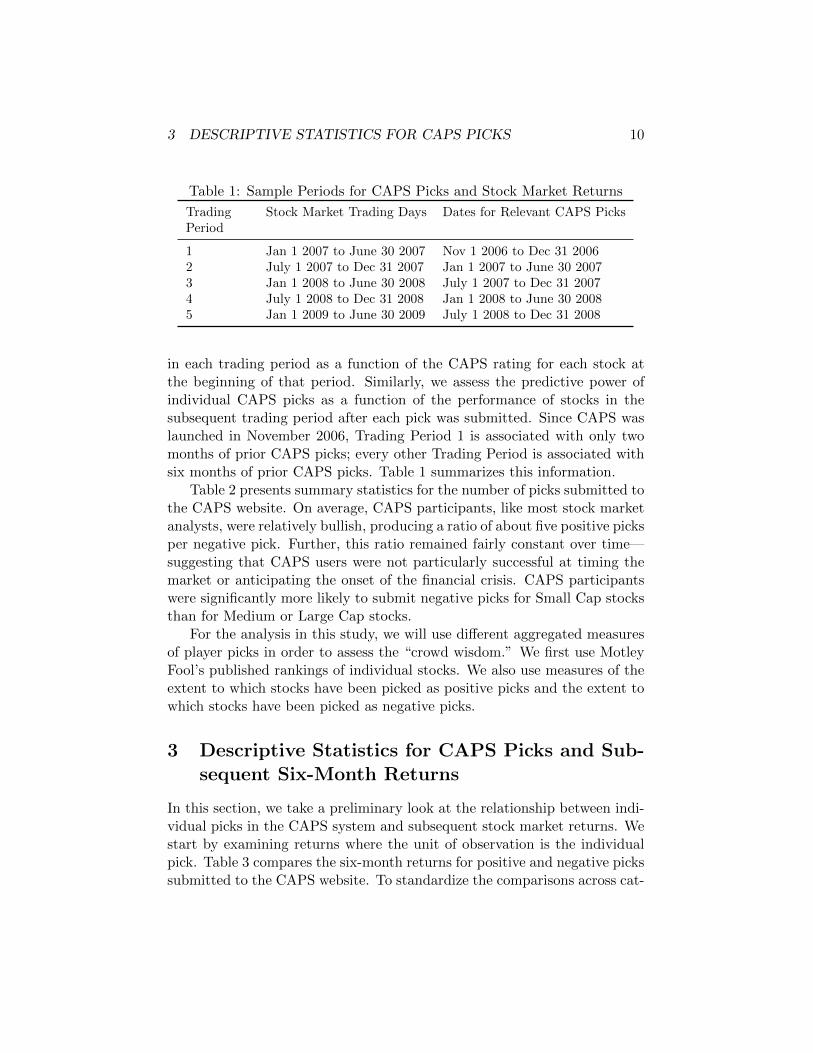
Table 1: Sample Periods for CAPS Picks and Stock Market Returns
TradingPeriod
Stock Market Trading Days Dates for Relevant CAPS Picks
1 Jan 1 2007 to June 30 2007 Nov 1 2006 to Dec 31 20062 July 1 2007 to Dec 31 2007 Jan 1 2007 to June 30 20073 Jan 1 2008 to June 30 2008 July 1 2007 to Dec 31 20074 July 1 2008 to Dec 31 2008 Jan 1 2008 to June 30 20085 Jan 1 2009 to June 30 2009 July 1 2008 to Dec 31 2008
in each trading period as a function of the CAPS rating for each stock atthe beginning of that period. Similarly, we assess the predictive power ofindividual CAPS picks as a function of the performance of stocks in thesubsequent trading period after each pick was submitted. Since CAPS waslaunched in November 2006, Trading Period 1 is associated with only twomonths of prior CAPS picks; every other Trading Period is associated withsix months of prior CAPS picks. Table 1 summarizes this information.
Table 2 presents summary statistics for the number of picks submitted tothe CAPS website. On average, CAPS participants, like most stock marketanalysts, were relatively bullish, producing a ratio of about five positive picksper negative pick. Further, this ratio remained fairly constant over time—suggesting that CAPS users were not particularly successful at timing themarket or anticipating the onset of the financial crisis. CAPS participantswere significantly more likely to submit negative picks for Small Cap stocksthan for Medium or Large Cap stocks.
For the analysis in this study, we will use different aggregated measuresof player picks in order to assess the “crowd wisdom.” We first use MotleyFool’s published rankings of individual stocks. We also use measures of theextent to which stocks have been picked as positive picks and the extent towhich stocks have been picked as negative picks.
3 Descriptive Statistics for CAPS Picks and Sub-sequent Six-Month Returns
In this section, we take a preliminary look at the relationship between indi-vidual picks in the CAPS system and subsequent stock market returns. Westart by examining returns where the unit of observation is the individualpick. Table 3 compares the six-month returns for positive and negative pickssubmitted to the CAPS website. To standardize the comparisons across cat-

3 DESCRIPTIVE STATISTICS FOR CAPS PICKS 11
Table 2: Positive and Negative Picks Submitted to the CAPS Website
Number ofPicks
Percentageof Picks
Percent PositivePicks
1. Whole Sample 2,684,733∗ 100% 80.8%
2. Large Cap ($above $5B) 985,632 39.1% 86.2%3. Medium Cap ($1B–$5B) 678,792 26.8% 82.6%4. Small Cap ($100M–$1B) 860,874 34.2% 77.3%
5. Trading Period 1 157,696 5.9% 84.9%6. Trading Period 2 486,268 18.1% 82.3%7. Trading Period 3 612,778 22.8% 80.0%8. Trading Period 4 834,053 31.1% 81.9%9. Trading Period 5 593,938 22.1% 78.6%
∗Tabulations in row 1 include picks for stocks with market caps too smallto be included in analysis.
egories in this table, we compute six month returns for each stock in eachof our five trading periods based on the periods listed in Table 1. That is,we compute the returns associated with each pick based on the six-monthreturns for that stock in the next trading period—so a pick submitted inAugust 2007 is associated with stock market returns in Trading Period 3beginning in January 2008. The overall return reported below, then, is theaverage return of all positive picks during the relevant time period and allnegative picks over the relevant time period.8 Since we impose an artifi-cial lag between the submission of most picks and the calculation of marketreturns associated with that pick, the summary results in Table 3 likelyunderestimate the information contained in each pick.
Several systematic patterns stand out in Table 3. First, the average six-month return in most periods was negative in most cases. Trading Periods 1and 5 produced nominally positive returns, but these were more than offsetby the huge negative returns in Trading Period 4.
More interestingly, Positive Picks systematically outperformed Negative
8Thus, consider the example where only two stocks existed in the universe. AssumeStock A was the subject of 5 negative picks and 10 positive picks in a trading period andStock B was the subject of 2 negative picks and 20 positive picks. The “return on negativepicks” reported above is then the weighted average of Stock A and Stock B’s returns in thetrading period, with the weights being 5/7 and 2/7, respectively. The “return on positivepicks” reported above is the weighted average of Stock A and Stock B’s returns in thetrading period, with the weights being 1/3 and 2/3, respectively.

3 DESCRIPTIVE STATISTICS FOR CAPS PICKS 12
Table 3: Returns for Positive and Negative CAPS Picks
Return on Return on Return on Return onPositive Negative Equal-Weight Value-Weight
Picks Picks Mkt Index Mkt Index
Whole Sample -11.8% -16.0% -11.2% -10.7%
Large Cap -11.6% -16.2% -12.5% -11.2%Medium Cap -11.0% -13.3% -11.1% -10.6%
Small Cap -12.5% -17.5% -10.9% -10.3%
Trading Period 1 9.8% 6.5% 7.1% 6.9%Trading Period 2 -1.6% -10.1% -10.9% -0.1%Trading Period 3 -11.6% -23.0% -13.7% -11.8%Trading Period 4 -40.2% -37.1% -30.8% -28.1%Trading Period 5 16.7% 10.9% 15.9% 3.2%
Picks, with simple differences of at least 2.5% in average returns in everyperiod except for Trading Period 4. These differences are strikingly large inmagnitude— across all five trading periods, a pick-weighted portfolio (equalinvestment for each pick) based on buying positive picks produced a six-month return of −11% whereas a pick-weighted portfolio based on buyingnegative picks produced a six-month return of −15.4%. Since each tradingperiod is six months, this difference of 4.4 percentage points translates intoan enormous difference of approximately nine percentage points in returnsper year.
Furthermore, Table 3 shows that the relationship between returns forPositive vs. Negative Picks varies very little by market cap. In particu-lar, Positive Picks outperformed Negative Picks by about five percentagepoints in six-month returns for both Large and Small Cap stocks, thoughby approximately half as much for Medium Cap Stocks.
The positive and negative picks submitted by the individual players inCAPS form the basis for the ranking assigned by Motley Fool to each stock—1 star to 5 stars. Figure 2 graphs simple average returns for stocks with eachMotley Fool ranking for each of our five six month trading periods. In eachcase, we classify stocks by their Motley Fool (quintile) rankings from the daybefore the start of the trading period. The return for a given stock in eachperiod is simply the percentage change in stock price from the beginning

3 DESCRIPTIVE STATISTICS FOR CAPS PICKS 13
to the end of that trading period. So, for example, stocks with a 1-starrating on December 31, 2006 had an average return of 3.7% in the firsttrading period (Jan 2007 to June 2007), while stocks with a 5-star rating onDecember 31, 2006 had an average return of 13.7% during that same tradingperiod. This difference of 11 percentage points in returns translates into adifference of (approximately) 22 percentage points in annualized returns.
2
3
4
5
1
-40%
-30%
-20%
-10%
0%
10%
20%
30%
Jan 07 - June 07 Jul 07 - Dec 07 Jan 08 - June 08 Jul 08 - Dec 08 Jan 09 - Dec 09
1 Star
2 Stars
3 Stars
4 Stars
5 Stars
Figure 2: Six Month Return by Motley Fool Rating
Consistent with the patterns in Table 3, there is a clear monotonic re-lationship between Motley Fool rating and average stock returns in each ofthe first three trading periods. Averaging across these three periods, 5-starstocks produced returns 14.6 percentage points higher than 1-star stocks insix-month returns (29.2 percent annualized). The major reversal occurredin period 4, during the height of the financial crisis. During this period, 1star stocks performed best and 5 star stocks performed worst. Averagingacross the five half-year periods, 5 star stocks outperformed 1 star stocks by9 percentage points.

3 DESCRIPTIVE STATISTICS FOR CAPS PICKS 14
3.1 Alternate Rankings Based on Positive and Negative Picks
We also used the data for individual picks to compute our own stock rankingsin order to separately assess the predictive power of positive and negativeCAPS picks. For each trading period, we tabulated the number of activepositive picks and the number of active negative picks for each stock sub-mitted to CAPS in the six months just prior to the start of that tradingperiod.9 We then grouped stocks by market cap and classified each stockwith at least ten active picks from the previous six months into quintiles.One classification was based entirely on the number of positive picks thatthe stock received; the second classification was based solely on the numberof negative picks that the stock received.
For our Positive Pick Ranking, we assigned a ranking of 5 to the topquintile of stocks and a ranking of 1 to the bottom quintile of stocks basedon a simple count of active positive picks within each subgroup of stocksby market cap. That is, the stocks with Positive Pick Ranking of 5 in anytrading period were those stocks that were in the top 20% among “LargeCap”, “Medium Cap” or “Small Cap” stocks in the count of active positivepicks on the first trading day of the period.10
Similarly, for our Negative Pick Ranking, we assigned a ranking of 1to the least frequently picked quintile of stocks and a ranking of 5 to themost frequently picked quintile of stocks based on a simple count of activenegative picks within each subgroup of stocks by market cap. That is, wecode both our Negative Pick Ranking and our Positive Pick Ranking so thatthe ranking of 5 in each case corresponds to the group of stocks about whichplayers are most optimistic.
Clearly, the Motley Fool ranking is some aggregation of Negative Picksand Positive Picks. However, depending on the pattern of picks submit-ted by different players, in principle, a stock’s ranking in the Negative PickRanking and a stock’s ranking in the Positive Pick Ranking may be posi-tively correlated, negatively correlated or uncorrelated.
Figure 3 provides a summary of the positive pick portfolio, constructed
9CAPS participants have the opportunity to “close” a pick at any time, “locking in”the market returns associated with that pick. Once a pick is closed, subsequent changesin prices associated with that pick have no effect on the ranking of the participant whosubmitted that pick. For the purposes of creating “Positive Pick” and “Negative Pick”rankings in each Trading Period, we exclude picks that were both submitted and closedby a participant in the previous six month period.
10We first divide stocks into groups by Market Cap and then order them by numberof positive picks because there is an empirical positive relationship between cap size andnumber of picks (both positive and negative) submitted to CAPS.

3 DESCRIPTIVE STATISTICS FOR CAPS PICKS 15
identically to Figure 2, except that the returns are shown for unweightedPositive Pick Portfolio quintiles. Figure 4 provides a summary of the Nega-tive Pick Portfolio.
1 2 3 4 5
-40%
-30%
-20%
-10%
0%
10%
20%
30%
Jan 07 - June 07 Jul 07 - Dec 07 Jan 08 - June 08 Jul 08 - Dec 08 Jan 09 - Dec 09
1 Star
2 Stars
3 Stars
4 Stars
5 Stars
Figure 3: Six Month Return by Positive Pick Rating
The results for the Positive Pick Ratings are similar to those for theoverall Motley Fool rating, but smaller. The 5 star portfolio outperformsthe 1 star portfolio by an average of 2 percentage points across the five six-month periods (with dramatic underperformance in the fourth period). TheNegative Pick Ratings 5 star portfolio outperforms the 1 star portfolio by 8percentage points over the time period. The 5 star Negative Pick Portfoliooutperforms the 1 star portfolio in every one of the 5 periods, even duringthe Period 4 financial crisis. Interestingly, Motley Fool stockpickers makeNegative Picks much less frequently than Positive Picks, yet these resultssuggest that Negative Picks are, on average, more reliable during our sampleperiod.

4 PERFORMANCE DECOMPOSITION 16
1 2 3 4 5 Add
-40%
-30%
-20%
-10%
0%
10%
20%
30%
Jan 07 - June 07 Jul 07 - Dec 07 Jan 08 - June 08 Jul 08 - Dec 08 Jan 09 - Dec 09
1 Star
2 Stars
3 Stars
4 Stars
5 Stars
Figure 4: Six Month Return by Negative Pick Rating
4 Performance Decomposition
We have demonstrated that the stocks ranked highly by Motley Fool par-ticipants earn higher subsequent raw returns than the stocks ranked poorlyby Motley Fool participants during our sample period. The portfolios ofstocks favored by Motley Fool participants may have different returns fromthe portfolios of stocks disfavored by Motley Fool participants because theyhave different risk or style factors on average, because they have time-varyingdifferences in risk or style factors, or the differences may be independent ofrisk or style factors. Thus, we decompose differences that can be attributedto market or style factors, and differences that cannot be attributed to mar-ket or style factors.
We use the classic style/risk factors identified by Fama and French (1996)and Carhart (1997) to decompose performance. Fama and French (1996)identified three measures that have been demonstrated to predict futurestock returns. The first of these factors is the “Market Return” less the riskfree rate, RMRF, which can be used to control for correlation between thereturns in a portfolio of individual stocks and the returns on the market

4 PERFORMANCE DECOMPOSITION 17
portfolio. (For example, this correlation would be high for a portfolio ofhigh-beta stocks, indicating a high-risk portfolio.) The second factor is avalue/growth factor, HML, which can be used to control for the compositionof a portfolio of stocks in terms of book value relative to market value. Thethird factor is a small stock factor, SMB, which controls for composition ofa portfolio of stocks in terms of market cap value. We use the three factorsidentified by Fama and French in our analysis along with a fourth factor,Momentum, Mom, identified by Carhart (1997). The Momentum factorcan be used to control for the composition of a portfolio of stocks in termsof previous year’s stock market performance.
We observe Motley Fool participants in the aggregate over 5 quarters.We separately examine the Motley Fool CAPS-ranked quintile portfolios, thePositive Pick quintile portfolios and the Negative Pick quintile portfolios.For each of these portfolio types, we focus on the investment strategy ofbuying the 5th quintile portfolio (highest, or 5 star) and shorting the 1stquintile portfolio (lowest, or 1 star). We compute the one-day returns foreach of the 5 rating portfolios for each trading day from January 1, 2007 toJune 30, 2009. There are 628 trading days under study.
Our decomposition strategy isolates the unexplained alpha after control-ling for various factors. To understand the decomposition strategy, considerthe mean daily raw return net of the risk-free rate:
αA =
∑t(rij − rft)
Tallof (A)
Where T is the number of trading days. Of course, since the risk free rate isfairly stable, the behavior of αA is very similar to the raw returns examinedabove. We also consider the constant term from two regressions:
rij − rft = αB + RMRFtβ1 + SMBtβ2 + HMLtβ3 + Momtβ4 + eit(B)
rij − rft = αC + (RMRFtxIt)B1 + (SMBtxIt)B2 + (HMLtxIt)B3
+ (MomtxIt)B4 + eit (C)
Where RMRF, SMB, HML and Mom are the four as described above andIt is a vector of indicator variables for each of the 5 trading periods. HereαB is the return net of loadings on the Fama French factors and momentumfactor and αC is the return net of the four factors when the weights on thefour factors have been allowed to vary by trading period.
Following Wermers (2000), we can decompose the average return netof the risk free rate in (A) into three components of interest. First, αC is

4 PERFORMANCE DECOMPOSITION 18
the return net of time-varying four factors. This is the return that can-not be explained at all by market timing or style factors and thus, this isthe “stock-picking” return earned by the strategy. Next, αB − αC is the“market-timing” return. If Motley Fool participants systematically favoredstocks that covaried with risk or style portfolios that were going to earn highraw returns, but picked average-returning stocks within each style factor,we could observe positive market timing returns but zero “stock-picking”return. Finally, αA − αB is the portion of the return attributable to theaverage style or risk weightings of Motley Fool participants. Thus, for ex-ample, if Motley Fool participants chose stocks that had a high correlationwith the returns of small cap stocks minus large cap stocks, and the SMBportfolio had significant returns relative to the market over our entire sampleperiod, then a significant part of the return would be attributable to stylefactors. Note then, that this decomposition is complete: the overall returnαA equals the “stock-picking” return (αC) plus the “market timing” return(αB − αC) plus the “average style” return (αA − αB).
The results for the estimated αs in specifications (A), (B), and (C) andthe resulting decompositions are shown in Table 4. We show the resultsusing the Motley Fool CAPS-ranked quintile portfolios, the Positive Pickquintile portfolios, and the Negative Pick quintile portfolios.
The results are quite striking. Both the Negative Pick quintile portfoliostrategy and the MF quintile portfolio strategy earn significantly positivereturns, on average, net of (constant) Fama French factors, as shown in(B). The Positive Pick quintile portfolio strategy fails to earn significantlypositive returns. Indeed, for all three portfolios, controlling for the averagestyle or risk factors has little impact on the magnitude of the estimatedexcess returns.
When allowing for time-varying Fama French and momentum factors,however, we see that only the Negative Pick quintile portfolio continues toshow significantly positive alpha. The decomposition suggests that the Neg-ative Pick quintile portfolio strategy has positive and statistically significantreturns attributable to stock picking and small negative returns associatedwith average style and market timing. In contrast, the Positive Pick quintileportfolio has strongly negative return attributable to stock picking and pos-itive returns attributable to market timing which nets out to almost zero.Unsurprisingly, since the Motley Fool portfolio must be some combinationof the positive and negative picks, it nets out to small positive stock pickingand market timing factors.
We also illustrate how the estimated time-varying 4-factor alphas evolveover time for all five of the quintile portfolios in the following figures. In

4 PERFORMANCE DECOMPOSITION 19
Table 4: Return Decomposition.
MF Positive Negative
(A) overall 0.066 0.012 0.056(1.42) (0.35) (1.63)
(B) controlling for 4 factors 0.062 0.009 0.057(2.16) (0.31) (2.84)
(C) controlling for time-varying four factors 0.029 −0.055 0.069(1.22) (2.23) (3.86)
Performance Decompositionreturn attributable to stock pricing (C) 0.029 −0.055 0.069
return attributable to market-timing(B)–(C)
0.033 0.064 −0.012
return attributable to style (A)–(B) 0.004 0.003 −0.001
Table 4: Regressions using daily returns from buying the 5th quintile portfo-lio and shorting the 1st quintile portfolio in each category (in percents—e.g.×100). For the both the Negative Pick Portfolio and the Positive Pickportfolio, the 5th quintile is defined as the set of stocks about which CAPSparticipants are most optimistic. Results in (A), (B), and (C) show constantterm (α) from regressions. t-statistics are in parentheses.

4 PERFORMANCE DECOMPOSITION 20
each case, we estimated the Alpha coefficient for each portfolio relative toPortfolio 1 for each Trading Period.
2 3 4 5
-0.4
-0.3
-0.2
-0.1
0
0.1
0.2
Jan 07 - June 07 Jul 07 - Dec 07 Jan 08 - June 08 Jul 08 - Dec 08 Jan 09 - Dec 09
2 Stars
3 Stars
4 Stars
5 Stars
Figure 5: Estimated Alpha After Four-Factor Filtering: Motley Fool Rank-ing. The figure shows alpha for each star quintile portfolio minus the alphaof the 1 star quintile portfolio.
Consistent with the results above, the estimated alphas in Figure 5 are onnet positive for all four of the quintile portfolios relative to the first quintileportfolio. Furthermore, there is a systematically monotonic pattern for theestimated alphas in each of the first two trading periods. That is, withineach portfolio of stocks with a given ranking higher rated stocks performedbetter than each portfolio of stocks with a lower ranking during each of thefirst three periods period after four-factor filtering. However, four-factorfiltering produces qualitatively different results from the raw returns datafor the last two trading periods. In each of those periods, 5-star stocksperform worse than stocks of all other rankings and have negative estimatedalpha values. The positive estimated alphas for 5-star stocks is statisticallysignificant at the 5% level in each of the first two periods, but neither ofthe negative estimated alphas for 5-star stocks for the last two periods is

4 PERFORMANCE DECOMPOSITION 21
statistically significant.11
Figures 6 and 7 present Estimated alphas for each period for our alterna-tive Positive Pick and Negative Pick Rankings quintile portfolios. Compar-ing Figures 5 and 6, rankings based on Positive Picks have estimated alphavalues that are systematically more negative than the estimated alpha val-ues for the overall CAPS ratings. The estimated alphas for 5-star stocksbased on Positive Picks are negative in every period and are both large inmagnitude and statistically significant in trading periods 4 and 5, suggest-ing that 5-star stocks based on Positive Picks performed significantly worsethan 1-star stocks based on Positive Picks in these periods after four-factorfiltering.
2 3 4 5
-0.4
-0.35
-0.3
-0.25
-0.2
-0.15
-0.1
-0.05
0
0.05
0.1
Jan 07 - June 07 Jul 07 - Dec 07 Jan 08 - June 08 Jul 08 - Dec 08 Jan 09 - Dec 09
2 Stars
3 Stars
4 Stars
5 Stars
Figure 6: Estimated Alpha After Four-Factor Filtering: Positive Pick Rank-ing. The figure shows alpha for each star quintile portfolio minus the alphaof the 1 star quintile portfolio.
11The estimated negative alpha in trading period 4 is of the same magnitude as theestimated positive alphas for the previous three periods, but interestingly, the standarderror on this estimated value is about twice as large as the standard errors in previousperiods—consistent with the observation of unusual variations in daily movements in stockprices during the last half of 2008.

4 PERFORMANCE DECOMPOSITION 22
2 3 4 5
-0.4
-0.3
-0.2
-0.1
0
0.1
0.2
Jan 07 - June 07 Jul 07 - Dec 07 Jan 08 - June 08 Jul 08 - Dec 08 Jan 09 - Dec 09
2 Stars
3 Stars
4 Stars
5 Stars
Figure 7: Estimated Alpha After Four-Factor Filtering: Negative Pick Rank-ing, The figure shows alpha for each star quintile portfolio minus the alphaof the 1 star quintile portfolio.
By contrast, comparing Figures 5 and 7, rankings based on NegativePicks have estimated alpha values that are systematically more positivethan those for the overall CAPS ratings. The estimated alphas for Portfolio5 (once again, these estimated alphas are relative to Portfolio 1) are positivein every period and are statistically significantly different than 0 in everyperiod except for trading period 3.
4.1 Robustness
An immediate concern with our analysis is that the exceptional performanceof the Negative Pick portfolio may derive from thinly traded Small Capstocks. Recall that, at the time of our study, CAPS only allowed picks forstocks that have a price of at least $1.50 per share and a market cap of atleast $100 Million at any given time. Furthermore, we construct our pickrankings by subdividing twenty percent of each of the Small Cap Stocks, theMedium Cap Stocks, and the Large Cap stocks into each pick ranking. Thus,by construction, there are as many Small Cap stocks in the 5th quintile of
4 PERFORMANCE DECOMPOSITION 23
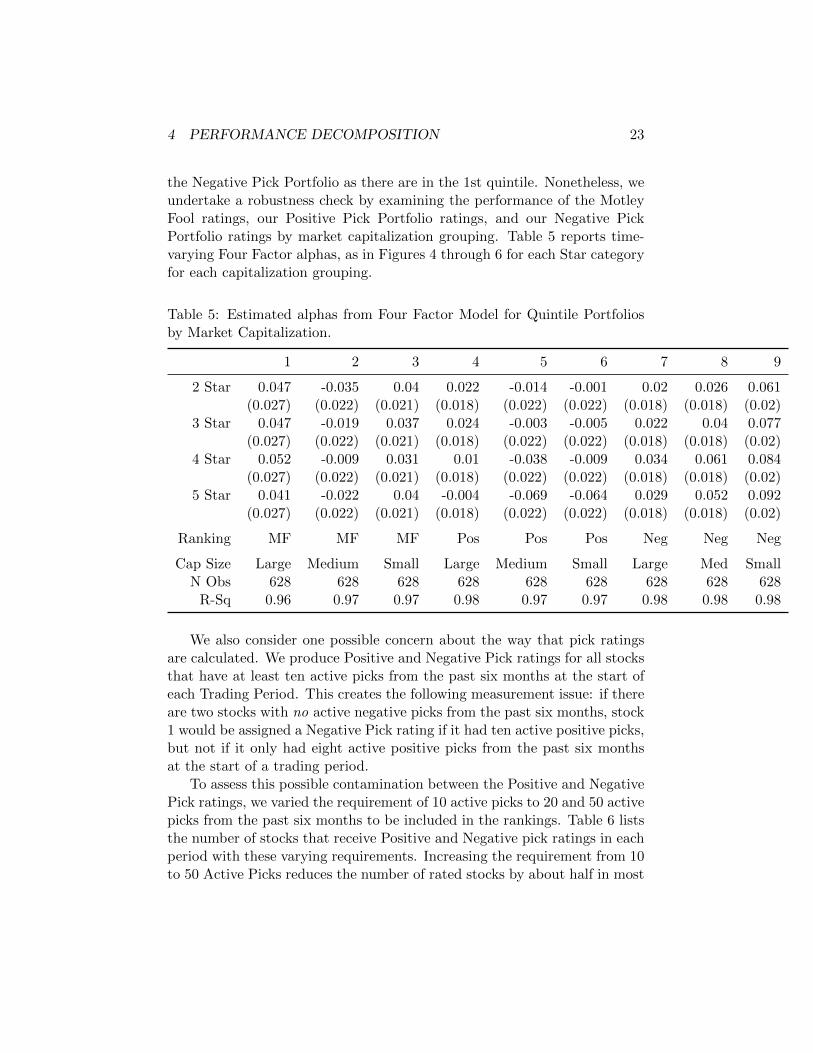
the Negative Pick Portfolio as there are in the 1st quintile. Nonetheless, weundertake a robustness check by examining the performance of the MotleyFool ratings, our Positive Pick Portfolio ratings, and our Negative PickPortfolio ratings by market capitalization grouping. Table 5 reports time-varying Four Factor alphas, as in Figures 4 through 6 for each Star categoryfor each capitalization grouping.
Table 5: Estimated alphas from Four Factor Model for Quintile Portfoliosby Market Capitalization.
1 2 3 4 5 6 7 8 9
2 Star 0.047 -0.035 0.04 0.022 -0.014 -0.001 0.02 0.026 0.061(0.027) (0.022) (0.021) (0.018) (0.022) (0.022) (0.018) (0.018) (0.02)
3 Star 0.047 -0.019 0.037 0.024 -0.003 -0.005 0.022 0.04 0.077(0.027) (0.022) (0.021) (0.018) (0.022) (0.022) (0.018) (0.018) (0.02)
4 Star 0.052 -0.009 0.031 0.01 -0.038 -0.009 0.034 0.061 0.084(0.027) (0.022) (0.021) (0.018) (0.022) (0.022) (0.018) (0.018) (0.02)
5 Star 0.041 -0.022 0.04 -0.004 -0.069 -0.064 0.029 0.052 0.092(0.027) (0.022) (0.021) (0.018) (0.022) (0.022) (0.018) (0.018) (0.02)
Ranking MF MF MF Pos Pos Pos Neg Neg Neg
Cap Size Large Medium Small Large Medium Small Large Med SmallN Obs 628 628 628 628 628 628 628 628 628
R-Sq 0.96 0.97 0.97 0.98 0.97 0.97 0.98 0.98 0.98
We also consider one possible concern about the way that pick ratingsare calculated. We produce Positive and Negative Pick ratings for all stocksthat have at least ten active picks from the past six months at the start ofeach Trading Period. This creates the following measurement issue: if thereare two stocks with no active negative picks from the past six months, stock1 would be assigned a Negative Pick rating if it had ten active positive picks,but not if it only had eight active positive picks from the past six monthsat the start of a trading period.
To assess this possible contamination between the Positive and NegativePick ratings, we varied the requirement of 10 active picks to 20 and 50 activepicks from the past six months to be included in the rankings. Table 6 liststhe number of stocks that receive Positive and Negative pick ratings in eachperiod with these varying requirements. Increasing the requirement from 10to 50 Active Picks reduces the number of rated stocks by about half in most

4 PERFORMANCE DECOMPOSITION 24
Table 6: Number of Rated Stocks as Function of Active Picks Required forRating
Active PicksRequired for
Rating
Period 1 Period 2 Period 3 Period 4 Period 5
10 2,413 4,046 4,177 4,138 3,28420 1,512 3,090 3,292 3,344 2.50750 633 1,623 1,949 2,104 1,431
periods.Table 7 compares the estimated alpha values for three different rankings—
Motley Fool, Positive Pick and Negative Pick ratings—as we vary the num-ber of active picks required for a stock to be rated. The estimated alphasfor each ranking scheme change relatively little with these variations in therequired number of active picks. With the most rigorous requirement of50 active picks for a stock to be rated, the estimated alpha for the 5-StarPositive Pick ratings remains negative but loses statistical significance. Butour more important finding—that the Negative Pick ratings have positiveand significant estimated alphas, continues to hold with these more rigorousranking rules.
Conclusion
Our investigation of the Motley Fool CAPS system shows that CAPS predic-tions are surprisingly informative about future stock prices. In particular,while we don’t find much predictive capability of positive stock picks, we dofind that negative picks do predict future stock price declines. Our FamaFrench decomposition suggests that these are results are due to stock pickingrather than style factors or market timing.
It may not be surprising that the collaborative filtering technology ismore successful at predicting abnormally negative future stock performancethan it is at predicting abnormally positive future stock performance. Theliterature surrounding short sales (for example, Jones and Lamont, 2002 andBoehme, Danielsen, and Sorescu, 2006), suggests that acting on negativeinformation about the prospects for a stock can be more costly and difficultthan acting on positive information about the prospects for a stock. Thesepapers find support for the hypothesis of Miller (1977) that dispersion ofinvestor opinion in the presence of short-sale constraints may lead to stock

4 PERFORMANCE DECOMPOSITION 25
Table 7: Estimated Alphas for Pick Rankings with Varying Numbers ofPicks Required for Ranking Using Time-Varying Four Factor Alphas
(1) (2) (3) (4) (5) (6) (7) (8) (9)
2-Star Stock .025 .040 .040 −.000 .014 .017 .044 .047 .054(.017) (.019) (.021) (.017) (.019) (.023) (.015) (.017) (.023)
3-Star Stock .030 .050 .059 .002 .016 −.008 .057 .057 .054(.017) (.019) (.021) (.017) (.019) (.023) (.015) (.017) (.023)
4-Star Stock .031 .052 .060 −.013 −.009 −.013 .069 .070 .065(.017) (.019) (.021) (.017) (.019) (.023) (.015) (.017) (.023)
5-Star Stock .029 .053 .066 −.055 −.045 −.046 .069 .087 .080(.017) (.019) (.021) (.017) (.019) (.023) (.015) (.017) (.023)
Ranking Pos Pos Pos Neg Neg NegSystem MF MF MF Pick Pick Pick Pick Pick Pick
Active Picksfor Rating
10 20 50 10 20 50 10 20 50
N obs 628 628 628 628 628 628 628 628 628R-squared 0.98 0.98 0.97 0.98 0.98 0.97 .99 .98 .97
price overvaluation. This may be particularly true for smaller traders.Interesting questions remain about what factors lead the CAPS system
to predict future stock returns. In future work, we hope to analyze thetext written by participants as part of the pick submission process. Moregenerally, we will examine whether there are ways to judge ex ante whichparticipants picks have relatively more predictive power.

4 PERFORMANCE DECOMPOSITION 26
References
Antweiler, Werner and Murray Z. Frank, 2004, “Is All That Talk JustNoise? The Information Content of Internet Stock Message Boards,” Jour-nal of Finance 59(3), 1259-1294.
Antweiler, Werner and Murray Z. Frank, 2006, “Does Talk Matter? Ev-idence from a Broad Cross Section of Stocks,” working paper, University ofMinnesota.
Bagnoli, Mark, Messod Daniel and Susan G. Watts, 1999, “WhisperForecasts of Quarterly Earnings per Share, Journal of Accounting and Eco-nomics 28(1), 27-50.
Baker, Malcolm, Lubomir Litov, Jessica A. Wachter and Jeffrey Wur-gler, 2010, “Can Mutual Fund Managers Pick Stocks? Evidence from theirTrades Prior to Earnings Announcements”, Journal of Financial and Quan-titative Analysis” 45, 1111-1131.
Barber, Brad M., Terrance Odean,, and Ning Zhu, 2009, “Do retailtrades move markets?”, Review of Financial Studies 22, 151- 186.
Barber, Brad M. and Terrance Odean, 2001a, “Boys will be Boys: Gen-der, Overconfidence, and Common Stock Investment” Quarterly Journal ofEconomics 116(1), 261-292.
Barber, Brad M. and Terrance Odean, 2001b, “The Internet and theInvestor,” Journal of Economic Perspectives 15(1), 41-54.
Barber, Brad M. and Terrance Odean, 2000, “Trading is Hazardous toYour Wealth: The Common Stock Investment Performance of IndividualInvestors” Journal of Finance 55(2), 773-806.
Boehme, Rodney, Bartley R. Danielson, and Sorin M. Sorescu, 2006,“Short-sale constraints, differences of opinion, and overvaluation,” Journalof Financial and Quantitative Analysis 41,455-487.
Cabral, Luis and Ali Hortacsu, 2010, “The Dynamics of Seller Reputa-tion: Evidence from eBay,” The Journal of Industrial Economics 58 (1),

4 PERFORMANCE DECOMPOSITION 27
54-78.
Chevalier, Judith A. and Glenn Ellison, 1999, “Are Some Mutual FundManagers Better than Others? Cross-Sectional Patterns in Behavior andPerformance,” Journal of Finance 54(3), 875-899.
Coval, Joshua, David Hirshleifer, and Tyler Shumway, 2005, “Can Indi-vidual Investors Beat the Market?” working paper, Harvard University.
Das, Sanjiv R. and Mike Y. Chen, 2007, “Yahoo! for Amazon: Senti-ment Extraction from Small Talk on the Web”, Management Science 53(9),1375-1388.
Frieder, Laura and Jonathan Zittrain, 2007, “Spam Works: Evidencefrom Stock Touts and Corresponding Market Activity,” Hastings Commu-nications and Entertainment Law Journal 30, 479-520.
Hogarth, Robin, 1977, “Methods for Aggregating Opinions,” in HelmutJungerman and Gerald de Zeeuw (eds.), Decision Making and Change inHuman Affairs, D. Reidel Publishing Co., Dordrecht, Holland, 231-255.
Ivkovic, Zoran and Scott Weisbenner, 2005, “Local Does as Local Is: In-formation Content of the Geography of Individual Investors’ Common StockInvestments”, Journal of Finance 60(1), 267-306.
Ivkovic, Zoran, Clemens Sialm, and Scott Weisbenner, 2008, “PortfolioConcentration and the Performance of Individual Investors”, Journal of Fi-nancial and Quantitative Analysis, 43(3), 613-656.
Jones, Charles M. and Owen A. Lamont, 2002, “Short-sale constraintsand stock returns”, Journal of Financial Economics 66, 207-239.
Linstone, Harold A. and Murray Turoff (eds.), 1975, The Delphi Method:Techniques and Applications, Addison-Wesley, Reading, Ma.
Metrick, Andrew, 1999, “Performance evaluation with transactions data:The stock selection of investment newsletters,” Journal of Finance 54, 1743-1775.
Mikhail, Michael B., Beverly R. Walther, and Richard H. Willis, 2004,“Do security analysts exhibit persistent differences in stock picking ability?”,

4 PERFORMANCE DECOMPOSITION 28
Journal of Financial Economics 74, 67-91.
Odean, Terrence, 1999, “Do investors trade too much?”, American Eco-nomic Review 89, 1279-1298.
Pastor, Lubos, and Robert F. Stambaugh, 2002, “Investing in equitymutual funds”, Journal of Financial Economics 63, 351-380.
Resnick, Paul and Richard Zeckhauser, 2002, “Trust Among Strangersin Internet Transactions: Empirical Analysis of eBay’s Reputation System,”in The Economics of the Internet and E-Commerce, M. R. Baye (ed.), Am-sterdam: Elsevier Science, 127-157.
Resnick, Paul, Richard Zeckhauser, John Swanson, and Kate Lockwood,2006, “The value of reputation on eBay: A controlled experiment”, Experi-mental Economics 9, 79-101.
Sabherwal, Sanjiv, Salil Sarkar and Ying Zhang, 2008, “Online Talk:Does It Matter?” Managerial Finance 34(6), 423-426.
Sunstein, Cass, 2006, “Deliberation and Information Markets”, in RobertHahn and Paul Tetlock (eds.), Information Markets: A New Way of MakingDecisions, AEI Press, Washington, D.C., 67-99.
Tetlock, Paul, 2007, ”Giving Content to Investor Sentiment: The Roleof Media in the Stock Market,” Journal of Finance 62(3), 1139-1168.
Wermers, Russell, 2000, “Mutual fund performanc: An empirical decom-position into stock-picking talent, style, transactions costs, and expenses,”Journal of Finance 55, 1655-1695.
Tumarkin, Robert and Robert Whitelaw, 2001, “News or Noise? Inter-net Postings and Stock Prices?”, Financial Analysts Journal 57, 41-51.
Wolfers, Justin and Eric Zitzewitz, 2004,“Prediction markets”, The Jour-nal of Economic Perspectives 18, 107-126.