the canadian real estate association es release canadian real estate association ... as with the...
TRANSCRIPT
News ReleaseThe Canadian Real Estate Association
The trademarks MLS®, Multiple Listing Service® and the associated logos are owned by The Canadian Real Estate Association (CREA) and identify the quality of services provided by real estate professionals who are members of CREA.
According to statistics1 released today by The Canadian Real Estate Association (CREA), national home sales activity posted its fifth consecutive month-over-month decline in January 2014.
Highlights: • National home sales fell 3.3% from December to January.• Actual (not seasonally adjusted) activity stood 0.4% above January 2013 levels.• The number of newly listed homes edged up 0.2% from December to January.• The Canadian housing market remains in balanced territory.• The national average sale price rose 9.5% on a year-over-year basis in January.• The MLS® Home Price Index (HPI) rose 4.8% year-over-year in January.
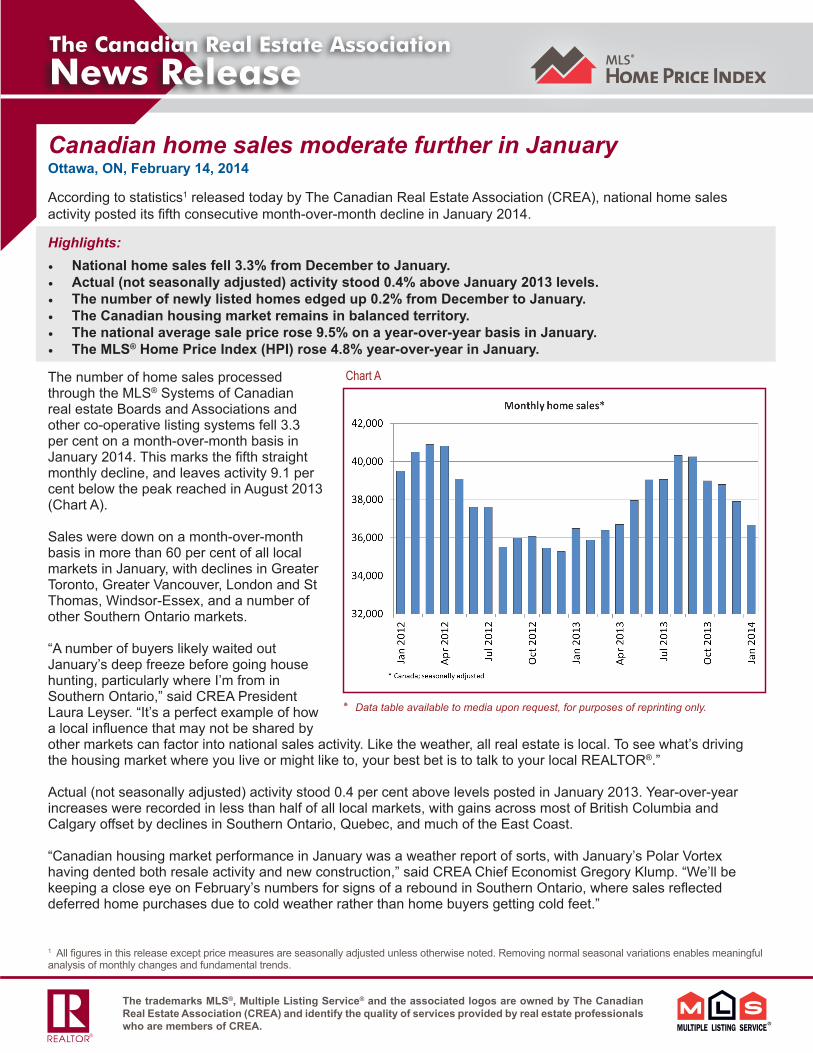
The number of home sales processed through the MLS® Systems of Canadian real estate Boards and Associations and other co-operative listing systems fell 3.3 per cent on a month-over-month basis in January 2014. This marks the fifth straight monthly decline, and leaves activity 9.1 per cent below the peak reached in August 2013 (Chart A).
Sales were down on a month-over-month basis in more than 60 per cent of all local markets in January, with declines in Greater Toronto, Greater Vancouver, London and St Thomas, Windsor-Essex, and a number of other Southern Ontario markets.
“A number of buyers likely waited out January’s deep freeze before going house hunting, particularly where I’m from in Southern Ontario,” said CREA President Laura Leyser. “It’s a perfect example of how a local influence that may not be shared by other markets can factor into national sales activity. Like the weather, all real estate is local. To see what’s driving the housing market where you live or might like to, your best bet is to talk to your local REALTOR®.”
Actual (not seasonally adjusted) activity stood 0.4 per cent above levels posted in January 2013. Year-over-year increases were recorded in less than half of all local markets, with gains across most of British Columbia and Calgary offset by declines in Southern Ontario, Quebec, and much of the East Coast.
“Canadian housing market performance in January was a weather report of sorts, with January’s Polar Vortex having dented both resale activity and new construction,” said CREA Chief Economist Gregory Klump. “We’ll be keeping a close eye on February’s numbers for signs of a rebound in Southern Ontario, where sales reflected deferred home purchases due to cold weather rather than home buyers getting cold feet.”
Canadian home sales moderate further in JanuaryOttawa, ON, February 14, 2014
1 All figures in this release except price measures are seasonally adjusted unless otherwise noted. Removing normal seasonal variations enables meaningful analysis of monthly changes and fundamental trends.
.Data table available to media upon request, for purposes of reprinting only ٭
Chart A

News ReleaseThe Canadian Real Estate Association
The trademarks MLS®, Multiple Listing Service® and the associated logos are owned by The Canadian Real Estate Association (CREA) and identify the quality of services provided by real estate professionals who are members of CREA.
The number of newly listed homes edged up 0.2 per cent on a month-over-month basis in January. New supply was up in just over half of all local markets, led by Edmonton, Regina, Ottawa, and Montreal and offset by declines in Greater Vancouver, Calgary, and Greater Toronto.
With sales down and new listings little changed, the national sales-to-new listings ratio eased back to 52.4 per cent in January compared to 54.2 per cent in December. This remains well within balanced territory marked by the range from 40 to 60 per cent, as has been the case since early 2010. Just under two-thirds of all local markets posted a sales-to-new listings ratio in this range in January.
The number of months of inventory is another important measure of balance between housing supply and demand. It represents the number of months it would take to completely liquidate current inventories at the current rate of sales activity.
There were 6.4 months of inventory at the national level at the end of January 2014, up from 6.3 months at the end of December. As with the sales-to-new listings ratio, the current level of the months of inventory measure indicates that the Canadian housing market remains well balanced.
The actual (not seasonally adjusted) national average price for homes sold in January 2014 was $388,553, an increase of 9.5 per cent from the same month last year. The size of year-over-year average price gains continues to reflect the decline in sales activity at this time last year among some of Canada’s most active and pricey markets, which dropped the national average at that time.
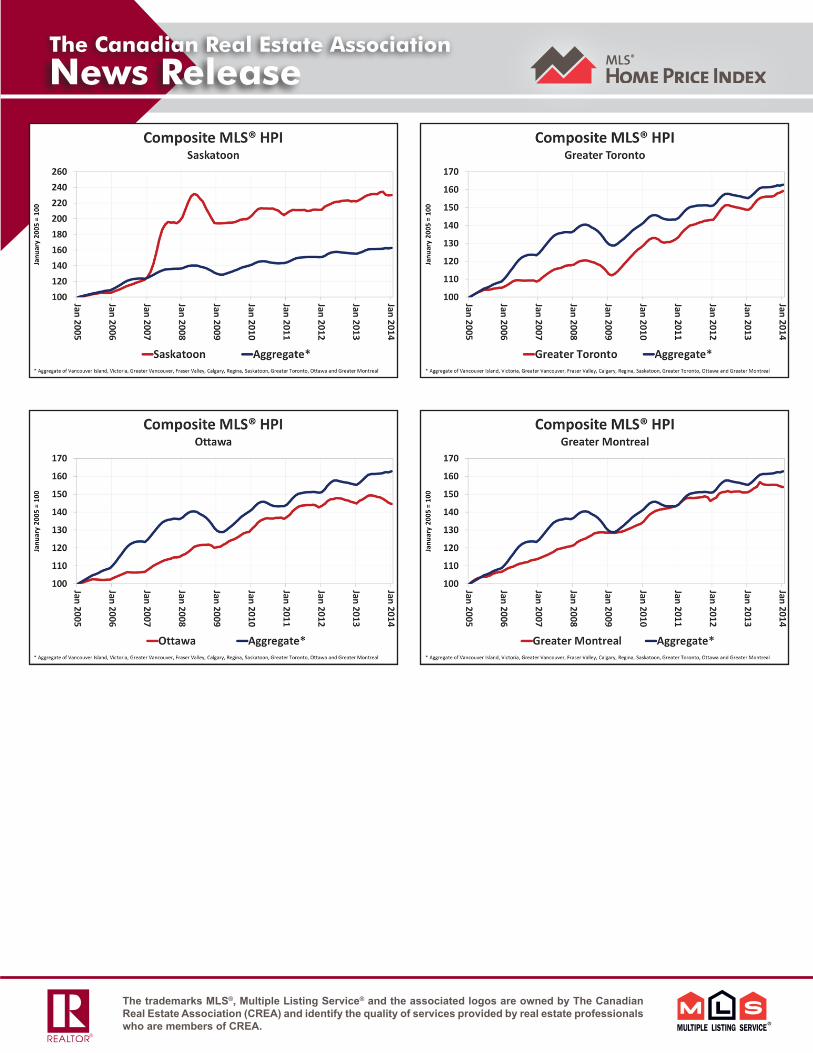
The MLS® Home Price Index (MLS® HPI) provides a better gauge of price trends because it is not affected by changes in the mix of sales activity the way that average price is.
The Aggregate Composite MLS® HPI rose 4.83 per cent on a year-over-year basis in January 2014, up from a 4.31 per cent gain in December. Year-over-year price growth picked up among all property types tracked by the index.
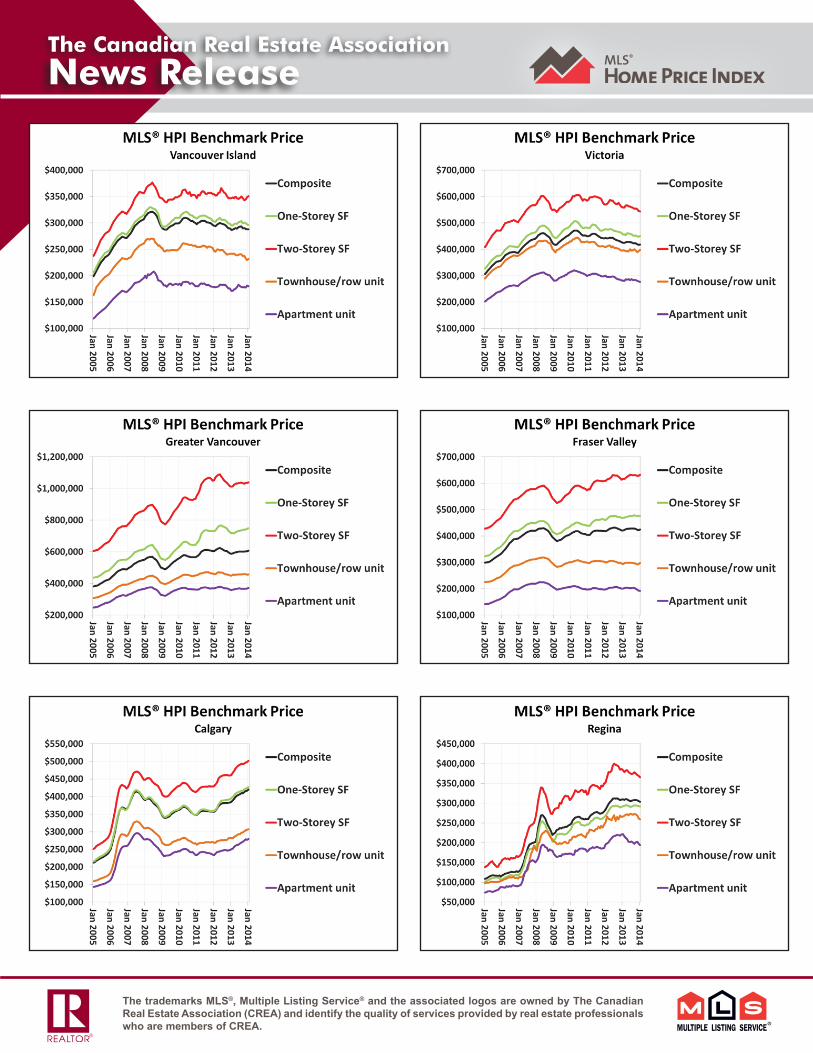
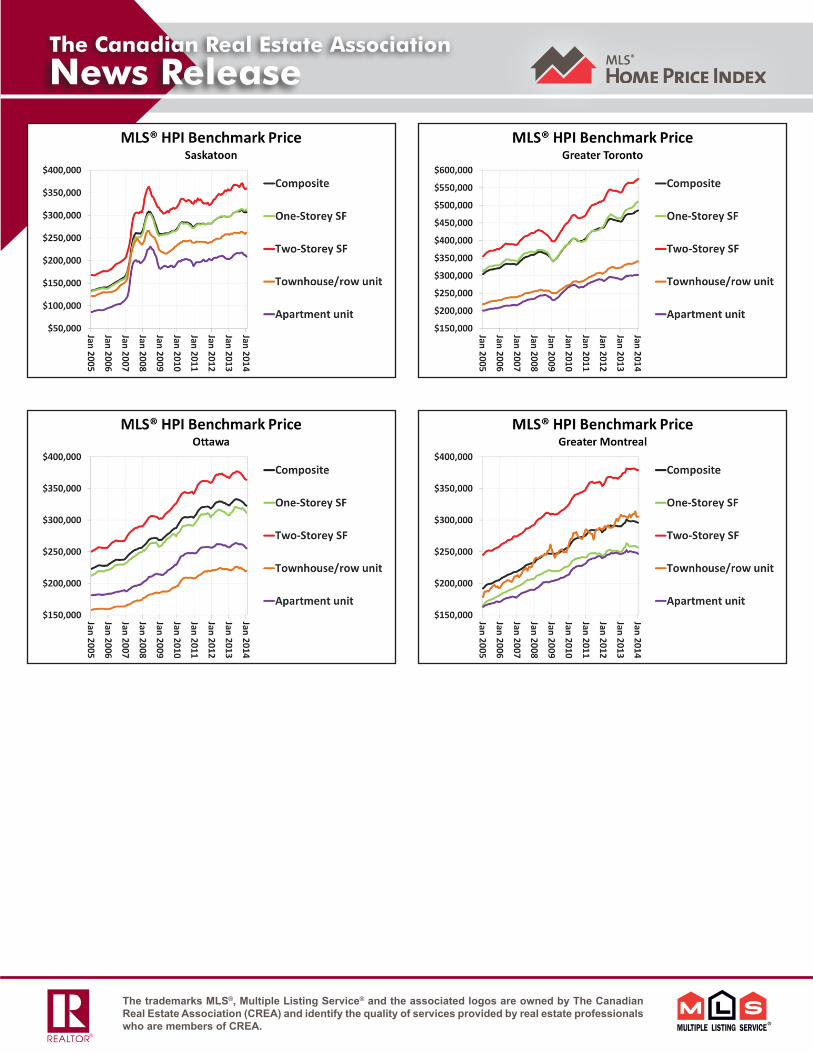
Year-over-year price gains were led by two-storey single family homes (+5.57 per cent). This was closely followed by one-storey single family homes (+5.32 per cent), townhouse/row units (+3.94 per cent) and apartment units (+3.35 per cent).
Year-over-year price growth in the MLS® HPI was mixed across housing markets tracked by the index. Calgary (+8.98 per cent) and Greater Toronto (+7.06 per cent) again posted the biggest price gains.
Greater Vancouver recorded a third consecutive year-over-year increase (+3.18 per cent) after more than a year of declines between late 2012 and late 2013. While prices in Victoria remained lower than year-ago levels, January’s decline (-1.37 per cent) was the smallest in more than three years (Table 1).
.Data table available to media upon request, for purposes of reprinting only ٭
Chart B

News ReleaseThe Canadian Real Estate Association
The trademarks MLS®, Multiple Listing Service® and the associated logos are owned by The Canadian Real Estate Association (CREA) and identify the quality of services provided by real estate professionals who are members of CREA.
- 30 -
Interactive tables and charts for MLS® Home Price Index data on Composite, Single family homes (including separate indices for one- and two-storey homes), Townhouse/row units, and Apartment units are available at www.homepriceindex.ca/hpi_tool_en.html.
Data table available to media upon request, for purposes of reprinting only.
MLS® Home Price Index
January 2005 = 100 Percentage Change vs.
Composite HPI: January 2014
1 month ago
3 months ago
6 months ago
12 months ago 3 years ago 5 years ago
Aggregate 162.8 0.37 0.62 0.93 4.83 12.90 25.71
Lower Mainland 153.6 0.59 0.59 0.33 2.47 5.79 17.61
Greater Vancouver 159.1 0.57 1.02 0.82 3.18 6.35 21.92
Fraser Valley 142.1 0.57 -0.35 -0.77 0.85 4.95 8.64
Vancouver Island 144.8 0.00 -0.82 -1.63 0.35 -3.27 -0.69
Victoria 136.5 0.22 -1.09 -1.94 -1.37 -7.08 -0.22
Calgary 197.9 0.71 1.64 3.18 8.98 20.89 21.63
Regina 279.4 -0.68 -1.41 -0.85 -1.96 16.71 36.03
Saskatoon 230.4 0.26 -1.66 -0.48 3.64 11.14 18.82
Greater Toronto 159.2 0.51 1.66 2.05 7.06 19.25 41.13
Ottawa 144.6 -0.48 -1.97 -3.02 -0.14 5.32 20.00
Greater Montreal 154.0 -0.26 -0.77 -0.77 1.92 6.80 19.75
Table 1

News ReleaseThe Canadian Real Estate Association
The trademarks MLS®, Multiple Listing Service® and the associated logos are owned by The Canadian Real Estate Association (CREA) and identify the quality of services provided by real estate professionals who are members of CREA.
PLEASE NOTE: The information contained in this news release combines both major market and national sales information from MLS® Systems from the previous month.
CREA cautions that average price information can be useful in establishing trends over time, but does not indicate actual prices in centres comprised of widely divergent neighbourhoods or account for price differential between geographic areas. Statistical information contained in this report includes all housing types.
MLS® Systems are co-operative marketing systems used only by Canada’s real estate Boards to ensure maximum exposure of properties listed for sale.
The Canadian Real Estate Association (CREA) is one of Canada’s largest single-industry trade associations, representing more than 106,000 REALTORS® working through some 90 real estate Boards and Associations.
Further information can be found at http://crea.ca/statistics.
For more information, please contact:
Pierre Leduc, Media RelationsThe Canadian Real Estate Association
Tel.: 613-237-7111 or 613-884-1460E-mail: [email protected]

News ReleaseThe Canadian Real Estate Association
The trademarks MLS®, Multiple Listing Service® and the associated logos are owned by The Canadian Real Estate Association (CREA) and identify the quality of services provided by real estate professionals who are members of CREA.
Chart 1 Chart 2
Chart 3 Chart 4
Chart 5 Chart 6

News ReleaseThe Canadian Real Estate Association
The trademarks MLS®, Multiple Listing Service® and the associated logos are owned by The Canadian Real Estate Association (CREA) and identify the quality of services provided by real estate professionals who are members of CREA.
News ReleaseThe Canadian Real Estate Association
The trademarks MLS®, Multiple Listing Service® and the associated logos are owned by The Canadian Real Estate Association (CREA) and identify the quality of services provided by real estate professionals who are members of CREA.
News ReleaseThe Canadian Real Estate Association
The trademarks MLS®, Multiple Listing Service® and the associated logos are owned by The Canadian Real Estate Association (CREA) and identify the quality of services provided by real estate professionals who are members of CREA.
News ReleaseThe Canadian Real Estate Association
The trademarks MLS®, Multiple Listing Service® and the associated logos are owned by The Canadian Real Estate Association (CREA) and identify the quality of services provided by real estate professionals who are members of CREA.

January 2014
Jan 2014 Dec 2013monthly
percentage change
Jan 2014 Jan 2013year-over-year
percentage change
Jan 2014 Dec 2013monthly
percentage change
Jan 2014 Jan 2013year-over-year
percentage change
Fraser Valley 606.7 634.4 -4.4 378.9 270.7 40.0 567.6 602.7 -5.8 358.2 250.5 43.0Vancouver 2,170.2 2,468.3 -12.1 1,497.2 1,062.5 40.9 2,209.1 2,411.0 -8.4 1,465.8 1,028.6 42.5Victoria 242.5 255.3 -5.0 160.7 124.5 29.1 241.7 248.1 -2.6 159.8 119.8 33.4Calgary 1,250.2 1,176.8 6.2 867.0 721.0 20.2 1,136.8 1,066.3 6.6 800.4 658.6 21.5Edmonton 638.2 647.4 -1.4 400.5 406.5 -1.5 534.2 553.3 -3.4 339.1 347.8 -2.5Regina 99.1 108.9 -9.0 65.3 57.0 14.6 90.8 98.6 -8.0 58.7 54.2 8.1Saskatoon 164.5 146.2 12.5 110.7 94.3 17.4 161.7 143.6 12.6 106.6 91.8 16.2Winnipeg 278.8 293.2 -4.9 146.0 147.0 -0.6 273.1 293.2 -6.9 139.0 140.5 -1.1Hamilton-Burlington 457.3 478.1 -4.3 308.8 276.2 11.8 428.8 449.8 -4.7 286.7 251.6 14.0Kitchener-Waterloo 161.6 180.5 -10.5 113.5 134.6 -15.7 149.7 159.7 -6.3 105.2 113.0 -6.9London and St Thomas 154.5 183.9 -16.0 104.0 114.8 -9.4 148.3 177.2 -16.3 96.9 104.3 -7.1Ottawa 401.5 412.7 -2.7 211.2 213.2 -0.9 390.2 404.1 -3.5 207.4 209.5 -1.0St. Catharines 65.8 77.3 -14.8 41.6 41.6 0.2 61.0 72.1 -15.4 38.0 35.5 7.3Sudbury 49.7 52.5 -5.3 31.6 31.4 0.6 46.0 47.3 -2.9 29.6 29.5 0.5Thunder Bay 38.7 34.1 13.5 22.5 18.3 23.2 40.6 31.6 28.4 22.2 14.9 48.3Toronto† 3,744.4 3,903.5 -4.1 2,177.2 2,111.6 3.1 3,727.3 3,879.5 -3.9 2,177.2 2,111.6 3.1Windsor-Essex 68.1 85.9 -20.7 49.0 64.3 -23.8 61.6 81.1 -24.0 42.9 58.0 -26.1Trois Rivières CMA‡ 16.2 15.2 6.5 13.1 9.3 40.2 15.0 14.2 5.4 12.3 8.7 40.6Montreal CMA 991.6 1,023.8 -3.1 678.6 685.4 -1.0 943.4 952.0 -0.9 642.8 638.2 0.7Gatineau CMA 73.7 70.3 4.9 48.6 43.4 12.0 75.3 70.5 6.8 47.8 39.9 19.7Quebec CMA 144.4 146.3 -1.3 117.3 129.6 -9.5 139.1 138.9 0.1 110.3 121.5 -9.2Saguenay CMA 18.2 20.2 -9.6 11.9 13.4 -11.1 17.1 19.7 -12.9 11.5 12.7 -9.0Sherbrooke CMA 35.7 33.8 5.6 26.7 32.3 -17.2 32.6 32.8 -0.5 24.0 28.4 -15.4Saint John 20.9 27.6 -24.1 11.6 12.1 -3.7 18.3 22.0 -16.7 10.9 11.9 -7.9Halifax-Dartmouth 104.3 121.6 -14.2 64.0 90.7 -29.5 96.8 118.3 -18.1 58.5 86.7 -32.5Newfoundland & Labrador 98.3 98.6 -0.3 60.6 68.0 -10.8 89.1 94.3 -5.5 53.3 63.6 -16.2Canada 15,291.6 16,187.9 -5.5 9,706.5 8,925.0 8.8 14,586.4 15,282.9 -4.6 9,183.8 8,358.0 9.9
* in millions of dollars†Detailed data for the Toronto Real Estate Board (TREB) market area can be found at http://www.torontorealestateboard.com/consumer_info/market_news/index.htm‡ Includes non-member data1 Total = Residential + Non-residential2 Seasonally adjusted3 Not seasonally adjusted
Source: The Canadian Real Estate Association; data for non-members in Quebec provided by QFREB’s Centris SystemNote: Due to changes in local market boundaries and data collection in the province of Quebec, local market and provincial totals for Quebec and Canada after 2002 are not directly comparable with earlier years.
Dollar Volume over MLS® Systems of Select Canadian Real Estate Boards & Associations
Dollar Volume*
Total1 Residentials.a.2 nsa3 s.a.2 nsa3

January 2014
Jan 2014 Dec 2013monthly
percentage change
Jan 2014 Jan 2013year-over-year
percentage change
Jan 2014 Dec 2013monthly
percentage change
Jan 2014 Jan 2013year-over-year
percentage change
Fraser Valley 1,178 1,257 -6.3 772 617 25.1 1,142 1,177 -3.0 729 576 26.6Vancouver 2,770 2,876 -3.7 1,858 1,424 30.5 2,691 2,800 -3.9 1,804 1,374 31.3Victoria 491 525 -6.5 342 294 16.3 467 487 -4.1 325 284 14.4Calgary 2,653 2,467 7.5 1,885 1,648 14.4 2,487 2,334 6.6 1,802 1,572 14.6Edmonton 1,725 1,715 0.6 1,112 1,217 -8.6 1,532 1,535 -0.2 987 1,075 -8.2Regina 263 320 -17.8 182 189 -3.7 261 316 -17.4 175 181 -3.3Saskatoon 482 446 8.1 331 298 11.1 482 429 12.4 321 286 12.2Winnipeg 1,052 1,046 0.6 565 614 -8.0 998 1,004 -0.6 529 565 -6.4Hamilton-Burlington 1,129 1,204 -6.2 781 763 2.4 1,076 1,137 -5.4 742 719 3.2Kitchener-Waterloo 482 527 -8.5 345 394 -12.4 465 501 -7.2 321 352 -8.8London and St Thomas 616 709 -13.1 423 475 -10.9 585 688 -15.0 395 451 -12.4Ottawa 1,117 1,142 -2.2 613 637 -3.8 1,096 1,121 -2.2 596 610 -2.3St. Catharines 236 280 -15.7 158 158 0.0 228 254 -10.2 148 147 0.7Sudbury 209 208 0.5 136 138 -1.4 186 185 0.5 123 125 -1.6Thunder Bay 198 188 5.3 117 98 19.4 187 162 15.4 111 83 33.7Toronto† 6,781 7,111 -4.6 4,135 4,375 -5.5 6,812 7,114 -4.2 4,135 4,375 -5.5Windsor-Essex 363 449 -19.2 269 379 -29.0 339 424 -20.0 249 351 -29.1Trois Rivières CMA‡ 105 85 23.5 83 59 40.7 89 81 9.9 78 55 41.8Montreal CMA 3,079 3,052 0.9 2,128 2,186 -2.7 2,982 2,958 0.8 2,054 2,087 -1.6Gatineau CMA 330 319 3.4 202 195 3.6 310 288 7.6 190 180 5.6Quebec CMA 574 571 0.5 443 486 -8.8 545 541 0.7 427 461 -7.4Saguenay CMA 109 110 -0.9 70 71 -1.4 107 107 0.0 67 66 1.5Sherbrooke CMA 156 146 6.8 121 152 -20.4 142 131 8.4 109 135 -19.3Saint John 123 147 -16.3 75 86 -12.8 98 122 -19.7 62 80 -22.5Halifax-Dartmouth 379 449 -15.6 240 319 -24.8 359 429 -16.3 221 298 -25.8Newfoundland & Labrador 355 357 -0.6 224 251 -10.8 308 332 -7.2 191 224 -14.7Canada 38,956 40,386 -3.5 25,286 25,335 -0.2 36,658 37,904 -3.3 23,636 23,547 0.4
†Detailed data for the Toronto Real Estate Board (TREB) market area can be found at http://www.torontorealestateboard.com/consumer_info/market_news/index.htm‡ Includes non-member data1 Total = Residential + Non-residential2 Seasonally adjusted3 Not seasonally adjusted
Source: The Canadian Real Estate Association; data for non-members in Quebec provided by QFREB’s Centris SystemNote: Due to changes in local market boundaries and data collection in the province of Quebec, local market and provincial totals for Quebec and Canada after 2002 are not directly comparable with earlier years.
Sales Activity over MLS® Systems of Select Canadian Real Estate Boards & Associations
Sales Activity
Total1 Residentials.a.2 nsa3 s.a.2 nsa3

January 2014
Jan 2014 Dec 2013monthly
percentage change
Jan 2014 Jan 2013year-over-year
percentage change
Jan 2014 Dec 2013monthly
percentage change
Jan 2014 Jan 2013year-over-year
percentage change
Fraser Valley 2,514 2,428 3.5 2,676 2,643 1.2 2,255 2,201 2.5 2,376 2,378 -0.1Vancouver 5,181 5,705 -9.2 5,782 5,569 3.8 4,920 5,453 -9.8 5,498 5,258 4.6Victoria 1,066 1,072 -0.6 1,090 1,080 0.9 972 966 0.6 968 971 -0.3Calgary 3,696 3,754 -1.5 3,581 3,793 -5.6 3,297 3,426 -3.8 3,174 3,272 -3.0Edmonton 3,175 2,753 15.3 2,844 2,837 0.2 2,502 2,292 9.2 2,282 2,172 5.1Regina 705 584 20.7 579 465 24.5 665 515 29.1 542 435 24.6Saskatoon 1,047 1,114 -6.0 958 848 13.0 986 1,014 -2.8 906 797 13.7Winnipeg 1,701 1,746 -2.6 1,246 1,164 7.0 1,508 1,571 -4.0 1,078 998 8.0Hamilton-Burlington 1,631 1,502 8.6 1,496 1,626 -8.0 1,494 1,387 7.7 1,349 1,459 -7.5Kitchener-Waterloo 1,126 1,145 -1.7 1,236 1,198 3.2 925 941 -1.7 1,003 1,024 -2.1London and St Thomas 1,539 1,632 -5.7 1,428 1,491 -4.2 1,321 1,395 -5.3 1,196 1,259 -5.0Ottawa 2,697 2,535 6.4 2,185 2,128 2.7 2,555 2,421 5.5 2,047 2,001 2.3St. Catharines 419 417 0.5 382 394 -3.0 361 371 -2.7 316 341 -7.3Sudbury 452 471 -4.0 362 330 9.7 354 349 1.4 264 248 6.5Thunder Bay 298 260 14.6 218 231 -5.6 259 207 25.1 173 151 14.6Toronto† 11,539 11,993 -3.8 8,822 10,624 -17.0 11,542 12,016 -3.9 8,822 10,624 -17.0Windsor-Essex 848 947 -10.5 858 982 -12.6 682 752 -9.3 679 784 -13.4Trois Rivières CMA‡ 164 146 12.3 184 204 -9.8 147 136 8.1 172 182 -5.5Montreal CMA 6,820 6,570 3.8 8,251 8,273 -0.3 6,430 6,285 2.3 7,835 7,837 0.0Gatineau CMA 711 726 -2.1 744 756 -1.6 650 644 0.9 680 694 -2.0Quebec CMA 1,205 1,115 8.1 1,392 1,267 9.9 1,085 1,033 5.0 1,297 1,163 11.5Saguenay CMA 251 217 15.7 273 265 3.0 218 227 -4.0 256 247 3.6Sherbrooke CMA 339 339 0.0 376 354 6.2 301 290 3.8 345 296 16.6Saint John 478 447 6.9 499 495 0.8 366 312 17.3 357 357 0.0Halifax-Dartmouth 1,001 976 2.6 964 976 -1.2 880 904 -2.7 829 855 -3.0Newfoundland & Labrador 1,060 1,084 -2.2 997 861 15.8 825 819 0.7 766 710 7.9Canada 79,562 78,782 1.0 75,282 78,030 -3.5 69,977 69,872 0.2 65,635 67,892 -3.3
†Detailed data for the Toronto Real Estate Board (TREB) market area can be found at http://www.torontorealestateboard.com/consumer_info/market_news/index.htm‡ Includes non-member data1 Total = Residential + Non-residential2 Seasonally adjusted3 Not seasonally adjusted
Source: The Canadian Real Estate Association; data for non-members in Quebec provided by QFREB’s Centris SystemNote: Due to changes in local market boundaries and data collection in the province of Quebec, local market and provincial totals for Quebec and Canada after 2002 are not directly comparable with earlier years.
New Listings over MLS® Systems of Select Canadian Real Estate Boards & Associations
New Listings
Total1 Residentials.a.2 nsa3 s.a.2 nsa3

January 2014
Jan 2014 Dec 2013monthly
percentage change
Jan 2014 Jan 2013year-over-year
percentage change
Jan 2014 Dec 2013monthly
percentage change
Jan 2014 Jan 2013year-over-year
percentage change
Fraser Valley 514,320 501,986 2.5 490,830 438,752 11.9 517,595 497,623 4.0 491,415 434,876 13.0Vancouver 793,772 825,306 -3.8 805,818 746,105 8.0 805,430 824,738 -2.3 812,536 748,651 8.5Victoria 476,708 466,516 2.2 469,913 423,304 11.0 503,751 479,842 5.0 491,772 421,939 16.6Calgary 469,977 469,909 0.0 459,965 437,518 5.1 455,785 449,530 1.4 444,153 418,938 6.0Edmonton 369,997 378,535 -2.3 360,169 333,994 7.8 355,034 356,916 -0.5 343,545 323,541 6.2Regina 372,371 339,742 9.6 358,804 301,625 19.0 340,045 303,046 12.2 335,213 299,700 11.8Saskatoon 334,388 328,737 1.7 334,388 316,477 5.7 337,605 332,369 1.6 332,133 320,812 3.5Winnipeg 269,465 286,209 -5.9 258,424 239,348 8.0 275,212 294,144 -6.4 262,683 248,720 5.6Hamilton-Burlington 404,767 396,350 2.1 395,445 362,023 9.2 398,619 396,890 0.4 386,451 349,943 10.4Kitchener-Waterloo 328,962 365,004 -9.9 328,962 341,538 -3.7 327,864 316,744 3.5 327,864 321,071 2.1London and St Thomas 251,587 252,014 -0.2 245,967 241,748 1.7 253,830 251,424 1.0 245,416 231,252 6.1Ottawa 351,064 350,743 0.1 344,565 334,627 3.0 353,888 355,756 -0.5 348,001 343,382 1.3St. Catharines 263,584 268,150 -1.7 263,584 263,085 0.2 266,963 273,264 -2.3 256,951 241,175 6.5Sudbury 238,128 249,912 -4.7 232,397 227,559 2.1 247,072 251,207 -1.6 240,798 235,665 2.2Thunder Bay 199,755 181,431 10.1 192,225 186,247 3.2 209,647 199,176 5.3 199,646 180,003 10.9Toronto† 547,768 542,123 1.0 526,528 482,648 9.1 547,583 542,076 1.0 526,528 482,648 9.1Windsor-Essex 187,658 187,352 0.2 182,015 169,584 7.3 180,080 186,459 -3.4 172,108 165,293 4.1Trois Rivières CMA‡ 157,319 187,423 -16.1 n/a n/a - 156,507 175,363 0.0 156,507 156,702 -0.1Montreal CMA 331,727 347,568 -4.6 n/a n/a - 329,619 321,856 0.0 318,374 313,381 1.6Gatineau CMA 242,614 227,161 6.8 n/a n/a - 254,387 244,845 0.0 250,752 224,855 11.5Quebec CMA 271,220 276,579 -1.9 n/a n/a - 266,162 256,836 0.0 260,721 264,762 -1.5Saguenay CMA 169,784 190,523 -10.9 n/a n/a - 171,776 183,985 0.0 174,110 193,472 -10.0Sherbrooke CMA 236,330 251,768 -6.1 n/a n/a - 237,551 250,272 0.0 221,676 213,164 4.0Saint John 154,852 198,391 -21.9 154,852 140,280 10.4 176,351 190,728 -7.5 176,351 148,320 18.9Halifax-Dartmouth 267,644 266,513 0.4 266,473 284,423 -6.3 271,405 273,212 -0.7 264,780 291,044 -9.0Newfoundland & Labrador 268,501 266,598 0.7 270,749 270,918 -0.1 277,340 277,937 -0.2 279,236 284,028 -1.7Canada 393,775 395,152 -0.3 383,868 352,279 9.0 400,222 398,894 0.3 388,553 354,951 9.5
* Weighted residential average prices for Quebec (provided by Québec Federation of Real Estate Boards); does not affect weighted and unweighted national average price calculations. Information on Quebec's weighted average price calculation can be found at: http://www.fciq.ca/immobilier-statistiques-definitions.php†Detailed data for the Toronto Real Estate Board (TREB) market area can be found at http://www.torontorealestateboard.com/consumer_info/market_news/index.htm‡ Includes non-member data1 Total = Residential + Non-residential2 Seasonally adjusted3 Not seasonally adjusted
Source: The Canadian Real Estate Association; data for non-members in Quebec provided by QFREB’s Centris SystemNote: Due to changes in local market boundaries and data collection in the province of Quebec, local market and provincial totals for Quebec and Canada after 2002 are not directly comparable with earlier years.
Average Sale Price over MLS® Systems of Select Canadian Real Estate Boards & Associations
Average Price*
Total1 Residentials.a.2 nsa3 s.a.2 nsa3

January 2014
Jan 2014 Dec 2013 monthly change Jan 2014 Jan 2013 year-over-year change Jan 2014 Dec 2013 monthly change Jan 2014 Jan 2013 year-over-year
change
Fraser Valley 46.9 51.8 -4.9 47.2 44.5 2.7 50.6 53.5 -2.9 50.3 46.6 3.7Vancouver 53.5 50.4 3.1 50.6 41.6 9.0 54.7 51.3 3.4 51.9 42.5 9.4Victoria 46.1 49.0 -2.9 47.2 40.2 7.0 48.0 50.4 -2.4 50.2 42.3 7.9Calgary 71.8 65.7 6.1 66.6 59.6 7.0 75.4 68.1 7.3 70.9 63.9 7.0Edmonton 54.3 62.3 -8.0 58.3 50.7 7.6 61.2 67.0 -5.8 64.6 57.1 7.5Regina 37.3 54.8 -17.5 49.5 59.0 -9.5 39.2 61.4 -22.2 50.8 61.0 -10.2Saskatoon 46.0 40.0 6.0 47.2 51.1 -3.9 48.9 42.3 6.6 48.5 52.5 -4.0Winnipeg 61.8 59.9 1.9 62.7 69.4 -6.7 66.2 63.9 2.3 66.0 72.6 -6.6Hamilton-Burlington 69.2 80.2 -11.0 69.2 67.2 2.0 72.0 82.0 -10.0 72.1 70.1 2.0Kitchener-Waterloo 42.8 46.0 -3.2 51.6 51.4 0.2 50.3 53.2 -2.9 57.4 55.4 2.0London and St Thomas 40.0 43.4 -3.4 44.9 46.5 -1.6 44.3 49.3 -5.0 49.4 51.2 -1.8Ottawa 41.4 45.0 -3.6 45.7 49.0 -3.3 42.9 46.3 -3.4 46.9 50.4 -3.5St. Catharines 56.3 67.1 -10.8 54.2 55.1 -0.9 63.2 68.5 -5.3 58.8 58.6 0.2Sudbury 46.2 44.2 2.0 44.0 51.5 -7.5 52.5 53.0 -0.5 51.7 59.3 -7.6Thunder Bay 66.4 72.3 -5.9 64.9 66.1 -1.2 72.2 78.3 -6.1 72.1 73.3 -1.2Toronto† 58.8 59.3 -0.5 57.1 55.0 2.1 59.0 59.2 -0.2 57.1 55.0 2.1Windsor-Essex 42.8 47.4 -4.6 49.3 47.9 1.4 49.7 56.4 -6.7 56.4 54.7 1.7Trois Rivières CMA‡ 64.0 58.2 5.8 45.6 54.2 -8.6 60.5 59.6 0.9 48.0 57.4 -9.4Montreal CMA 45.1 46.5 -1.4 46.1 50.1 -4.0 46.4 47.1 -0.7 47.3 51.5 -4.2Gatineau CMA 46.4 43.9 2.5 42.8 47.4 -4.6 47.7 44.7 3.0 44.7 49.2 -4.5Quebec CMA 47.6 51.2 -3.6 46.7 54.5 -7.8 50.2 52.4 -2.2 48.7 57.1 -8.4Saguenay CMA 43.4 50.7 -7.3 43.5 50.5 -7.0 49.1 47.1 2.0 45.2 56.3 -11.1Sherbrooke CMA 46.0 43.1 2.9 45.9 49.2 -3.3 47.2 45.2 2.0 48.3 51.0 -2.7Saint John 25.7 32.9 -7.2 32.2 32.2 0.0 26.8 39.1 -12.3 37.2 36.6 0.6Halifax-Dartmouth 37.9 46.0 -8.1 43.3 54.4 -11.1 40.8 47.5 -6.7 47.0 58.9 -11.9Newfoundland & Labrador 33.5 32.9 0.6 37.0 44.6 -7.6 37.3 40.5 -3.2 42.2 49.9 -7.7Canada 49.0 51.3 -2.3 49.7 48.7 1.0 52.4 54.2 -1.8 53.0 51.9 1.1
*Actual (not seasonally adjusted) data for sales-to-new listings ratios are based on a 12-month moving average†Detailed data for the Toronto Real Estate Board (TREB) market area can be found at http://www.torontorealestateboard.com/consumer_info/market_news/index.htm‡ Includes non-member data1 Total = Residential + Non-residential2 Seasonally adjusted3 Not seasonally adjusted
Source: The Canadian Real Estate Association; data for non-members in Quebec provided by QFREB’s Centris SystemNote: Due to changes in local market boundaries and data collection in the province of Quebec, local market and provincial totals for Quebec and Canada after 2002 are not directly comparable with earlier years.
Sales as a Percentage of New Listings over MLS® Systems of Select Canadian Real Estate Boards & Associations
Sales as a Percentage of New Listings*
Total1 Residentials.a.2 nsa3 s.a.2 nsa3

January 2014
Jan 2014 Dec 2013monthly
percentage change
Jan 2014 Jan 2013year-over-year
percentage change
Jan 2014 Dec 2013monthly
percentage change
Jan 2014 Jan 2013year-over-year
percentage change
British Columbia 3,778.9 4,142.6 -8.8 2,517.2 1,863.0 35.1 3,675.9 3,964.5 -7.3 2,398.0 1,753.2 36.8Alberta 2,389.9 2,297.0 4.0 1,584.6 1,405.9 12.7 2,122.3 2,026.7 4.7 1,428.5 1,260.3 13.3Saskatchewan 348.6 359.9 -3.1 228.3 203.2 12.4 323.7 324.4 -0.2 207.3 187.6 10.5Manitoba 308.9 332.9 -7.2 163.1 165.8 -1.6 302.7 328.2 -7.8 155.0 157.1 -1.3Ontario 6,499.1 7,018.8 -7.4 3,867.2 3,862.5 0.1 6,308.6 6,734.1 -6.3 3,740.0 3,687.9 1.4Quebec‡ 1,591.4 1,636.9 -2.8 1,121.0 1,153.6 -2.8 1,511.4 1,533.0 -1.4 1,053.3 1,062.5 -0.9New Brunswick 88.5 98.6 -10.3 51.5 51.3 0.4 81.0 87.0 -6.9 47.7 48.5 -1.7Nova Scotia 156.8 172.3 -9.0 94.9 124.3 -23.6 143.3 163.1 -12.2 84.3 113.3 -25.6Prince Edward Island 20.1 19.6 2.7 11.4 13.4 -14.9 17.1 15.4 11.1 10.1 11.3 -11.1Newfoundland & Labrador 98.3 98.6 -0.3 60.6 68.0 -10.8 89.1 94.3 -5.5 53.3 63.6 -16.2Northwest Territories 3.1 2.7 16.4 1.9 4.9 -60.4 3.6 3.8 -6.4 1.9 4.9 -60.4Yukon 7.9 8.0 -1.4 4.7 9.2 -49.4 7.7 8.3 -7.2 4.5 7.9 -42.9Canada 15,291.6 16,187.9 -5.5 9,706.5 8,925.0 8.8 14,586.4 15,282.9 -4.6 9,183.8 8,358.0 9.9
Jan 2014 Dec 2013monthly
percentage change
Jan 2014 Jan 2013year-over-year
percentage change
Jan 2014 Dec 2013monthly
percentage change
Jan 2014 Jan 2013year-over-year
percentage change
British Columbia 6,971 7,183 -3.0 4,588 3,675 24.8 6,493 6,646 -2.3 4,244 3,410 24.5Alberta 5,875 5,615 4.6 3,963 3,768 5.2 5,373 5,171 3.9 3,681 3,486 5.6Saskatchewan 1,096 1,179 -7.0 741 741 0.0 1,058 1,105 -4.3 693 684 1.3Manitoba 1,199 1,236 -3.0 652 711 -8.3 1,133 1,172 -3.3 609 650 -6.3Ontario 15,716 16,984 -7.5 9,809 10,522 -6.8 15,091 16,206 -6.9 9,298 9,905 -6.1Quebec‡ 6,219 6,225 -0.1 4,374 4,601 -4.9 5,875 5,856 0.3 4,123 4,255 -3.1New Brunswick 566 609 -7.1 345 353 -2.3 495 521 -5.0 297 316 -6.0Nova Scotia 784 848 -7.5 489 575 -15.0 683 767 -11.0 418 505 -17.2Prince Edward Island 140 120 16.7 81 100 -19.0 115 96 19.8 63 76 -17.1Newfoundland & Labrador 355 357 -0.6 224 251 -10.8 308 332 -7.2 191 224 -14.7Northwest Territories 10 6 66.7 6 12 -50.0 10 6 66.7 6 12 -50.0Yukon 25 24 4.2 14 26 -46.2 24 26 -7.7 13 24 -45.8Canada 38,956 40,386 -3.5 25,286 25,335 -0.2 36,658 37,904 -3.3 23,636 23,547 0.4
* in millions of dollars‡ Includes member and non-member data1 Total = Residential + Non-residential2 Seasonally adjusted3 Not seasonally adjusted
Source: The Canadian Real Estate Association; data for non-members in Quebec provided by QFREB’s Centris SystemNote: Due to changes in local market boundaries and data collection in the province of Quebec, local market and provincial totals for Quebec and Canada after 2002 are not directly comparable with earlier years.
Dollar Volume & Sales Activity over MLS® Systems of Canadian Real Estate Boards & Associations
Dollar Volume*
s.a.2 nsa3
ResidentialTotal1
s.a.2 nsa3
s.a.2 nsa3 s.a.2 nsa3
Sales Activity
Total1 Residential

January 2014
Jan 2014 Dec 2013monthly
percentage change
Jan 2014 Jan 2013year-over-year
percentage change
Jan 2014 Dec 2013monthly
percentage change
Jan 2014 Jan 2013year-over-year
percentage change
British Columbia 14,481 14,478 0.0 14,824 14,682 1.0 12,464 12,630 -1.3 12,756 12,609 1.2Alberta 9,600 9,068 5.9 9,017 9,453 -4.6 8,212 8,026 2.3 7,670 7,779 -1.4Saskatchewan 2,602 2,643 -1.6 2,190 2,060 6.3 2,360 2,323 1.6 1,976 1,840 7.4Manitoba 1,972 2,034 -3.0 1,466 1,358 8.0 1,746 1,825 -4.3 1,264 1,172 7.8Ontario 31,129 31,331 -0.6 26,312 29,285 -10.2 28,022 28,296 -1.0 23,129 25,961 -10.9Quebec‡ 14,468 13,959 3.6 16,393 16,232 1.0 12,984 12,732 2.0 14,995 14,765 1.6New Brunswick 1,645 1,597 3.0 1,714 1,716 -0.1 1,312 1,142 14.9 1,276 1,260 1.3Nova Scotia 2,068 2,076 -0.4 1,895 1,942 -2.4 1,690 1,753 -3.6 1,497 1,492 0.3Prince Edward Island 476 436 9.2 430 370 16.2 303 262 15.6 266 235 13.2Newfoundland & Labrador 1,060 1,084 -2.2 997 861 15.8 825 819 0.7 766 710 7.9Northwest Territories 13 25 -48.0 8 24 -66.7 13 18 -27.8 8 23 -65.2Yukon 48 51 -5.9 36 47 -23.4 46 46 0.0 32 46 -30.4Canada 79,562 78,782 1.0 75,282 78,030 -3.5 69,977 69,872 0.2 65,635 67,892 -3.3
Jan 2014 Dec 2013monthly
percentage change
Jan 2014 Jan 2013year-over-year
percentage change
Jan 2014 Dec 2013monthly
percentage change
Jan 2014 Jan 2013year-over-year
percentage change
British Columbia 550,155 558,657 -1.5 548,644 506,934 8.2 566,047 576,313 -1.8 565,036 514,134 9.9Alberta 407,708 405,103 0.6 399,859 373,108 7.2 397,266 389,693 1.9 388,073 361,524 7.3Saskatchewan 309,958 299,951 3.3 308,072 274,178 12.4 303,846 284,594 6.8 299,081 274,253 9.1Manitoba 261,624 275,921 -5.2 250,157 233,203 7.3 265,924 290,251 -8.4 254,481 241,652 5.3Ontario 410,157 408,467 0.4 394,248 367,085 7.4 418,545 414,643 0.9 402,239 372,330 8.0Quebec‡ 265,459 270,641 -1.9 n/a n/a - 271,352 261,784 0.0 262,729 258,220 1.7New Brunswick 154,307 158,187 -2.5 149,324 145,346 2.7 164,852 168,594 -2.2 160,451 153,368 4.6Nova Scotia 194,894 200,255 -2.7 194,123 216,204 -10.2 208,262 213,061 -2.3 201,714 224,322 -10.1Prince Edward Island 145,560 154,149 -5.6 140,620 133,791 5.1 159,972 149,021 7.3 159,972 149,218 7.2Newfoundland & Labrador 268,501 266,598 0.7 270,749 270,918 -0.1 277,340 277,937 -0.2 279,236 284,028 -1.7Northwest Territories 321,250 444,817 -27.8 321,250 405,483 -20.8 321,250 444,817 -27.8 321,250 405,483 -20.8Yukon 332,170 353,068 -5.9 333,618 354,700 -5.9 355,218 361,787 -1.8 345,954 328,425 5.3Canada 393,775 395,152 -0.3 383,868 352,279 9.0 400,222 398,894 0.3 388,553 354,951 9.5
* Provincial weighted residential average price for Quebec (provided by Québec Federation of Real Estate Boards); does not affect weighted and unweighted national average price calculations. Information on Quebec's weighted average price calculation can be found at: http://www.fciq.ca/immobilier-statistiques-definitions.php‡ Includes member and non-member data1 Total = Residential + Non-residential2 Seasonally adjusted3 Not seasonally adjusted
Source: The Canadian Real Estate Association; data for non-members in Quebec provided by QFREB’s Centris SystemNote: Due to changes in local market boundaries and data collection in the province of Quebec, local market and provincial totals for Quebec and Canada after 2002 are not directly comparable with earlier years.
Average Price*
Total1 Residentials.a.2 nsa3 s.a.2 nsa3
nsa3 s.a.2 nsa3
New Listings
New Listings and Average Sale Price over MLS® Systems of Canadian Real Estate Boards & Associations
Total1 Residentials.a.2

January 2014
Jan 2014 Dec 2013 monthly change Jan 2014 Jan 2013 year-over-year change Jan 2014 Dec 2013 monthly change Jan 2014 Jan 2013 year-over-year
change
British Columbia 48.1 49.6 -1.5 46.5 39.7 6.8 52.1 52.6 -0.5 50.1 42.5 7.6Alberta 61.2 61.9 -0.7 59.7 53.9 5.8 65.4 64.4 1.0 64.6 59.2 5.4Saskatchewan 42.1 44.6 -2.5 47.1 52.1 -5.0 44.8 47.6 -2.8 49.0 54.4 -5.4Manitoba 60.8 60.8 0.0 61.4 69.0 -7.6 64.9 64.2 0.7 64.5 72.1 -7.6Ontario 50.5 54.2 -3.7 52.4 51.7 0.7 53.9 57.3 -3.4 55.1 54.4 0.7Quebec‡ 43.0 44.6 -1.6 43.4 46.7 -3.3 45.2 46.0 -0.8 45.6 49.1 -3.5New Brunswick 34.4 38.1 -3.7 36.3 36.7 -0.4 37.7 45.6 -7.9 41.3 41.4 -0.1Nova Scotia 37.9 40.8 -2.9 38.6 44.6 -6.0 40.4 43.8 -3.4 43.5 51.0 -7.5Prince Edward Island 29.4 27.5 1.9 32.2 42.1 -9.9 38.0 36.6 1.4 39.6 48.4 -8.8Newfoundland & Labrador 33.5 32.9 0.6 37.0 44.6 -7.6 37.3 40.5 -3.2 42.2 49.9 -7.7Northwest Territories 76.9 24.0 52.9 54.7 78.5 -23.8 76.9 33.3 43.6 54.9 80.1 -25.2Yukon 52.1 47.1 5.0 49.1 48.6 0.5 52.2 56.5 -4.3 52.8 50.5 2.3Canada 49.0 51.3 -2.3 49.7 48.7 1.0 52.4 54.2 -1.8 53.0 51.9 1.1
Jan 2014 Dec 2013 monthly change Jan 2014 Jan 2013 year-over-year change Jan 2014 Dec 2013 monthly change Jan 2014 Jan 2013 year-over-year
change
British Columbia 6.9 6.8 0.1 9.9 11.3 -1.5 7.4 7.3 0.1 8.0 9.4 -1.3Alberta 3.5 3.6 -0.1 5.0 6.1 -1.1 3.8 3.9 -0.1 3.8 4.7 -0.9Saskatchewan 6.9 6.6 0.3 7.3 6.3 1.0 7.2 7.1 0.1 6.5 5.5 1.0Manitoba 3.0 3.0 0.0 3.7 3.1 0.6 3.2 3.1 0.1 3.0 2.6 0.4Ontario 4.0 3.7 0.3 5.0 4.9 0.0 4.1 3.9 0.2 4.0 4.0 0.0Quebec‡ 11.8 11.8 0.0 13.6 11.6 2.0 12.5 12.5 0.0 12.0 10.2 1.9New Brunswick 11.2 10.5 0.7 16.6 15.2 1.4 12.8 12.2 0.6 12.1 11.2 0.9Nova Scotia 11.9 11.0 0.9 16.7 13.6 3.1 13.6 12.2 1.4 11.8 9.2 2.6Prince Edward Island 12.4 15.7 -3.3 24.3 19.8 4.5 15.1 19.6 -4.5 14.8 12.8 2.0Newfoundland & Labrador 8.2 8.2 0.0 10.8 8.9 1.9 9.5 8.9 0.6 8.0 6.5 1.4Northwest Territories 3.3 6.8 -3.5 5.0 2.5 2.5 3.3 6.8 -3.5 4.7 2.1 2.6Yukon 10.4 11.0 -0.6 13.1 11.4 1.7 10.8 10.1 0.7 11.7 10.2 1.5Canada 6.1 5.9 0.2 7.7 7.6 0.0 6.4 6.3 0.1 6.3 6.2 0.0
*Actual (not seasonally adjusted) data for sales-to-new listings ratios and months of inventory are based on a 12-month moving average‡ Includes member and non-member data1 Total = Residential + Non-residential2 Seasonally adjusted3 Not seasonally adjusted
Source: The Canadian Real Estate Association; data for non-members in Quebec provided by QFREB’s Centris SystemNote: Due to changes in local market boundaries and data collection in the province of Quebec, local market and provincial totals for Quebec and Canada after 2002 are not directly comparable with earlier years.
nsa3 s.a.2 nsa3
Months of Inventory and Sales as a Percentage of New Listings over MLS® Systems of Canadian Real Estate Boards & Associations
Sales as a Percentage of New
Listings*
Total1 Residentials.a.2
Months of Inventory*
Total1 Residentials.a.2 nsa3 s.a.2 nsa3