the brushstroke and materials of amadeo de souza-cardoso
TRANSCRIPT

Cristina Montagner
Mestre em Ciências Químicas para a Conservação e Restauro
The brushstroke and materials of Amadeo de Souza-Cardoso combined in an
authentication tool
Dissertação para obtenção do Grau de Doutor em Conservação e Restauro,
especialidade de Ciências da Conservação
Orientador: Prof. Doutora Maria João Seixas de Melo, FCT-UNL
Co-orientadores: Prof. Doutor Rui Manuel Feliciano de Jesus, ISEL-IPL Prof. Doutora Márcia Vilarigues, FCT-UNL
Fevereiro 2015
Júri:
Presidente: Professor Doutor Fernando Manuel Anjos Henriques
Arguentes: Prof. Doutor João Pedro Martins de Almeida Lopes
Doutora Jilleen Nadolny
Vgais: Prof. Doutora Maria Raquel Henriques da Silva
Prof. Doutora Leslie Anne Carlyle

The brushstroke and materials of Amadeo de Souza-Cardoso combined in an authentication tool
Copyright © Cristina Montagner, Faculdade de Ciências e Tecnologia, Universidade Nova de Lisboa.
A Faculdade de Ciências e Tecnologia e a Universidade Nova de Lisboa têm o direito, perpétuo e sem
limites geográficos, de arquivar e publicar esta dissertação através de exemplares impressos
reproduzidos em papel ou de forma digital, ou por qualquer outro meio conhecido ou que venha a ser
inventado, e de a divulgar através de repositórios científicos e de admitir a sua cópia e distribuição com
objectivos educacionais ou de investigação, não comerciais, desde que seja dado crédito ao autor e
editor.

i
ACKNOWLEDGEMENTS
This thesis was written in three different countries, Italy, Portugal and The Netherlands. These counties
represent my origin, my recent past and my future. In the same way, I would like to thank all the people who
have shared with me these last four years and with whom I will create my future.
First, I want to thank my supervisor Professor Maria João Melo for introducing me with enthusiasm into the
world of Amadeo and also for helping me to recognize my limits. I am also very grateful to my co-
supervisors: Professor Márcia Vilarigues, for her support and the ideas that we have shared in these four
years. Professor Rui Jesus for the dedication and patience with which he introduced me to computer
science, but also for his constructive criticism towards my work.
Thanks to Professor Fernando Pina for receiving me at the Department of Conservation and Restoration
and in the Photochemistry group and for his kind chats about Italy.
I am very grateful to all team members of Centro de Arte Moderna da Fundação Gulbenkian for the fruitful
collaboration, in particular to director Isabel Carlos and curator Ana Vasconcelos e Melo. Thanks to Helena
de Freitas for her contribution in the selection of the artworks studied and for her suggestions during my
research.
I would like to thank Professor Nuno Correia of Center for Informatics and Technologies (CITI) of UNL for
receiving me in the Department of Informatics and for his contribution to this project. I am very grateful to
Professors Sérgio Nascimento, João Linhares and their colleagues at the Department of Physics of the
University of Minho, for their work and the time spent together in the missions in Lisbon and Minho.
To Professor Rita Macedo for her contributions in the research and for the positive attitude and interest in
my work. Many thanks to Ana Maria, thanks for making me feel home. I am very grateful to Professor Leslie
Carlyle for her support during the research and for the inexhaustible enthusiasm and passion that she
transmitted me during all our chats.
I am grateful to all the people that I met in these four years. I can imagine the effort you have made to
understand my own Portuguese dialect, and you know that I appreciate this effort. Thanks to Ana
Margarida, Marta, Ângela, Elia, Solange, Augusta, Andreia, Ana Isabel, Catarina, Emanuele and Joana.
Thanks also to Sara and Isabel: I learned so much with you but also found two good friends. Thank you
Joana: it was a pleasure working with you, I'm proud of you. I shared this journey, the laboratory, and the
aquário with some important friends. They have supported me when I have needed it. With them I have
never spent a single day without a smile. They are the people on whom I could always count on, and they
will be also part of my future: Rita, Tatiana, Diogo and Vanessa, thank you.
Thanks to Ughetta and Renato for their friendship and for the "Italian" moments that we shared in Lisbon. I
have to thank my supporters from abroad, thanks to Eleonora for encouraging me to finish this experience
that we started together several years ago. I also thank Chiara, who has patiently waited for me to get a real
job. Thanks for your support in the last 28 years.
Everything I've lived in the last four years in Portugal has been shared with Jorge. He was my main support,
he has always encouraged me to do my best and with him I am making our future.
A special thanks to my family: thank you for your support and for teaching me to work to achieve my
dreams. This thesis is dedicated to you.
*** This is a revised version of my thesis. I have benefited much from the suggestions and comments from
my examiners: Prof. João Pedro Martins de Almeida Lopes, Dr. Jilleen Nadolny, Prof. Maria Raquel
Henriques da Silva and Prof. Leslie Anne Carlyle.

ii

iii
RESUMO
Hoje em dia, os estudos de autenticação de pinturas requerem a utilização de uma abordagem
multidisciplinar, baseada não apenas na contribuição feita pela análise de características visuais, mas
também na caracterização dos materiais e técnicas. Para além disso, é importante que a atribuição
da autoria de uma pintura seja confirmada através de estudos técnicos realizados num determinado
número de obras de arte originais que percorra toda a carreira do artista.
Esta dissertação está relacionada com o trabalho do pintor modernista Amadeo de Souza-Cardoso,
encontrando-se dividida em três partes. Na primeira parte, propomos uma ferramenta baseada no
processamento de imagem, que relaciona informação acerca da pincelada de Amadeo com
informação sobre os materiais utilizados na sua obra. O sistema resultante proporciona uma
avaliação qualitativa e quantitativa acerca da autoria da pintura; o elemento quantitativo é
particularmente relevante, uma vez que pode ser crucial para a resolução de controvérsias
relacionadas com a autoria de obras de arte, como por exemplo disputas judiciais. A análise de
pinceladas foi efectuada através da combinação de dois algoritmos utilizados para detectar
características, nomeadamente Gabor Filter e Scale Invariant Feature Transform. Devido a esta
combinação (e ao uso do modelo Bag-of-Features), o método proposto revela uma precisão superior
a 90% ao distinguir entre imagens de pinturas de Amadeo e imagens de obras de arte de outros
artistas contemporâneos. De modo a incluir a análise molecular, implementámos um sistema semi-
automático que utiliza imagiologia hiperespectral e análise elementar. Este sistema apresenta como
resultado final uma imagem que representa o mapeamento dos pigmentos presentes, juntamente
com as áreas realizadas com materiais não coerentes com a paleta de Amadeo, caso estas existam.
Este resultado visual constitui uma forma simples e eficaz de confirmar os resultados do sistema. A
ferramenta proposta baseada na combinação de pinceladas e informação molecular foi testada em
doze pinturas, tendo-se obtido resultados prometedores.
A segunda parte da tese apresenta um estudo sistemático de quatro pinturas seleccionadas, feitas
por Amadeo em 1917. Apesar de não terem título, três destas pinturas são comummente conhecidas
como BRUT, Entrada e Coty; estas pinturas são consideradas as obras melhor sucedidas e mais
genuínas deste artista. Porém, os materiais e as técnicas destas obras de arte nunca foram
estudados. As pinturas foram estudadas através de uma abordagem multi-analítica, que envolveu a
utilização das técnicas micro-espectroscopia de fluorescência de raio-X dispersiva de energias, micro-
espectroscopias de infravermelho e Raman, micro-espectrofluorimetria e microscopia electrónica de
varrimento. A caracterização dos materiais e técnicas utilizados por Amadeo nas suas últimas
pinturas, assim como a investigação de alguns dos problemas de conservação que afectam estas
obras, é essencial para enriquecer o conhecimento obtido acerca do artista. Para além disso, o
estudo dos materiais das quatro pinturas revela semelhanças entre as pinturas BRUT e Entrada. Esta
observação é também comprovada pela análise dos elementos presentes numa fotografia de uma
colagem (pertencente à Biblioteca de Arte da Fundação Calouste Gulbenkian), a única prova
existente de uma suposta maquete destas pinturas.

iv
A parte final da tese descreve a aplicação da ferramenta de processamento de imagem desenvolvida
na primeira parte do trabalho a um conjunto de casos de estudo; esta experiência demonstra o
potencial da ferramenta para apoiar a análise de pinturas e estudos de autenticação. A análise de
pinceladas foi utilizada como análise adicional durante o processo de avaliação de quatro pinturas
atribuídas a Amadeo, e o sistema baseado na análise das imagens hiperespectrais foi aplicado na
pintura datada de 1917. Os casos de estudo servem portanto como uma ponte entre as duas
primeiras partes da dissertação.
Palavras-chaves- Autenticação; Amadeo de Souza-Cardoso; análise de pinceladas;
processamento de imagem; mapeamento de imagens hiperespectrais; análise de pinturas.
v
ABSTRACT
Nowadays, authentication studies for paintings require a multidisciplinary approach, based on the
contribution of visual features analysis but also on characterizations of materials and techniques.
Moreover, it is important that the assessment of the authorship of a painting is supported by technical
studies of a selected number of original artworks that cover the entire career of an artist.
This dissertation is concerned about the work of modernist painter Amadeo de Souza-Cardoso. It is
divided in three parts. In the first part, we propose a tool based on image processing that combines
information obtained by brushstroke and materials analysis. The resulting tool provides qualitative and
quantitative evaluation of the authorship of the paintings; the quantitative element is particularly
relevant, as it could be crucial in solving authorship controversies, such as judicial disputes. The
brushstroke analysis was performed by combining two algorithms for feature detection, namely Gabor
filter and Scale Invariant Feature Transform. Thanks to this combination (and to the use of the Bag-of-
Features model), the proposed method shows an accuracy higher than 90% in distinguishing between
images of Amadeo’s paintings and images of artworks by other contemporary artists. For the
molecular analysis, we implemented a semi-automatic system that uses hyperspectral imaging and
elemental analysis. The system provides as output an image that depicts the mapping of the pigments
present, together with the areas made using materials not coherent with Amadeo’s palette, if any. This
visual output is a simple and effective way of assessing the results of the system. The tool proposed
based on the combination of brushstroke and molecular information was tested in twelve paintings
obtaining promising results.
The second part of the thesis presents a systematic study of four selected paintings made by Amadeo
in 1917. Although untitled, three of these paintings are commonly known as BRUT, Entrada and Coty;
they are considered as his most successful and genuine works. The materials and techniques of these
artworks have never been studied before. The paintings were studied with a multi-analytical approach
using micro-Energy Dispersive X-ray Fluorescence spectroscopy, micro-Infrared and Raman
Spectroscopy, micro-Spectrofluorimetry and Scanning Electron Microscopy. The characterization of
Amadeo’s materials and techniques used on his last paintings, as well as the investigation of some of
the conservation problems that affect these paintings, is essential to enrich the knowledge on this
artist. Moreover, the study of the materials in the four paintings reveals commonalities between the
paintings BRUT and Entrada. This observation is supported also by the analysis of the elements
present in a photograph of a collage (conserved at the Art Library of the Calouste Gulbenkian
Foundation), the only remaining evidence of a supposed maquete of these paintings.
The final part of the thesis describes the application of the image processing tools developed in the
first part of the thesis on a set of case studies; this experience demonstrates the potential of the tool to
support painting analysis and authentication studies. The brushstroke analysis was used as additional
analysis on the evaluation process of four paintings attributed to Amadeo, and the system based on

vi
hyperspectral analysis was applied on the painting dated 1917. The case studies therefore serve as a
bridge between the first two parts of the dissertation.
Keywords- Authentication; Amadeo de Souza-Cardoso; brushstroke analysis; image processing;
hyperspectral imaging; painting analysis.
PUBBLICATIONS
C. Montagner, D. Sanches, J. Pedroso, M. J. Melo and M. Vilarigues. « Ochres and earths: matrix and
chromophores characterization of 19th and 20th century artist materials » Spectrochimica Acta Part A,
103 (2013) 409–416.
V. Otero, D. Sanches, C. Montagner, M. Vilarigues, L. Carlyle, J. A. Lopes and M. J. Melo
« Characterisation of metal carboxylates by Raman and infrared spectroscopy in works of art »
Journal of Raman Spectroscopy (published online: 10 JUL 2014 DOI: 10.1002/jrs.4520).
C. Montagner, R. Jesus, N. Correia, M. J. Melo, M. Vilarigues, R. Macedo and H. de Freitas.
« Unveiling the hand of a 19th Century artist with binary image classification and Bag-of-Features »
International Conference On Systems, Signals and Image Processing (IWSSIP), April, 2012.
C. Montagner, P. Almeida, R. Jesus, N. Correia, M. J. Melo, M. Vilarigues, R. Macedo, H. de Freitas
and S. Nascimento « Behind the surface - Hyperspectral image spectroscopy for artist
authentication » 12th International AIC Congress, UK, 2013.
C. Montagner, S. M.C. Nascimento, J. M.M. Linhares, M. J. Melo, M. Vilarigues and R. Macedo
« Assessing the power of colour in Amadeo’s paintings » 12th International AIC Congress, UK, 2013.
P. Almeida, C. Montagner, R. Jesus, N. Correia, M. Vilarigues, M.J. Melo and S. Nascimento
« Analysis of paintings using multi-sensor data » 21th European Signal Processing Conference
(Eusipco), Marrocco, 2013.

vii
SYMBOLS AND NOTATIONS
Ap. Appendix
δ Bending vibration
p(B=Am) Brushstroke probablitiy
CAM Centro de Arte Moderna da Fundaçao Calouste Gulbenkian (Center for Modeon art of Calouste Gubenkian’s Foundation)
DCR-FCT Department Conservation and Restoration- Faculdade de Ciências e Tecnologia
DoG Difference-of-Gaussian
EMD Euclidean Minimum distance
ESRF European Synchrotron Radiation Facility
HPLC-DAD High Performance Liquid Chromatography – Diode Array Detector
HART Historically Accurate Reconstruction Techniques
Ia(Am) Indicator for authenticity considering brushstroke and material analysis.
Ia(M=Am) Indicator for authenticity considering material analysis
Inv. Inventory number: it refers to the inventory number used at CAM and reported on
the Catalogue Raisonné of the painting of Amadeo, unless otherwise stated.
µ-EDXRF Micro-Energy Dispersive X-Ray Fluorescence spectroscopy
µ- FTIR Micro-Fourier Transform Infrared spectroscopy
µ-Raman Micro-Raman spectroscopy
µ-SPEX Micro-spectrofluorimetry
µ-XANES Micro-X-ray Absorption Near-Edge spectroscopy
RLSC Regularized Least Squared Classifier
SAM Spectral Angle Mapper
SIFT Scale Invariant Feature Transform
SEM-EDS Scanning Electron Microscopy and Energy Dispersive X-ray Spectrometry
νas Stretching vibration (asymmetric)
νs Stretching vibration (symmetric)
SVM Support Vector Machine
SR Synchrotron Radiation
TF-IDF Term Frequency– Inverse Document Frequency
W&N Winsor & Newton

viii
ix
CONTENTS
CONTEXT OF THE WORK 1
PART I: DIGITAL IMAGE PROCESSING FOR OIL PAINTING ANALYSIS
INTRODUCTION TO PART I 7
CHAPTER 1: AUTHENTICATION AND COMPUTER VISION 11
1.1 Authenticity issues 11
1.1.1 The authentication process 12
1.2 Computer vision in the conservation field 14
1.2.1 Digital image processing 14
1.2.2 Challenges in art conservation 16
1.2.3 Imaging processing for brushstroke analysis 17
1.2.4 Hyperspectral imaging for pigment identification 19
1.3 Our contributions 21
CHAPTER 2: METHODOLOGY AND RESULTS 23
2.1 Features combination for painting authentication 23
2.2 Brushstroke Analysis 24
2.2.1 Image pre-processing and features extraction 25
2.2.2 Bag-of-Features 29
2.2.3 Classifier 30
2.2.4 Parameters setting and evaluation of the strategy proposed 31
2.3 Molecular Analysis 34
2.3.1 Painting system 36
2.3.2 Paint data and pre-processing step 39
2.3.3 Pigment analysis 40
2.3.4 Image mapping 43
2.3.5 Setting up the parameters 44
2.3.6 Evaluation of the strategy proposed 46
2.4 Features combination: results 50
2.5 Final remarks 54
x
PART II: MATERIALS AND TECHINIQUES OF AMADEO’S PAINTINGS DATED 1917
INTRODUCTION TO PART II 57
CHAPTER 1: AMADEO DE SOUZA-CARDOSO 59
1.1 Amadeo: an artist in his time 59
1.1.1 Paris (1906-1914) 60
1.1.2 Back to Portugal (1914-18) 62
1.1.3 Looking at Amadeo’s paintings 65
1.2 Dealing with ageing: conservation issues 72
1.2.1 Drying and ageing of the oil binder 73
1.2.2 Metal soaps in paint formulations and the Ripolin case study 75
1.2.3 Pigment alteration 77
CHAPTER 2 ANALYSIS OF THE PAINTINGS 83
2.1 The paintings of 1917 83
2.1.1 Unconventional materials 87
2.1.2 Preparation layer 90
2.1.3 Amadeo's colour language 91
2.1.4 Chrome yellow samples 100
2.2 Conservation issues 105
2.2.1 Metal carboxylates 107
2.2.2 Fading 115
2.2.3 Cracking and darkening of the green area 119
2.3 Final remarks 121
PART III: CASE STUDIES
1.1 Brushstroke analysis to support authentication processes 125
1.1.1 The methodology 125
1.1.2 Results and discussion 127
1.1.3 Final remarks 135
1.2 Hyperspectral imaging analysis 136
1.2.1 The system proposed 136

xi
1.2.2 Results and discussion 136
1.2.3 Final remarks 141
CONCLUSION AND FUTURE WORKS 143
REFERENCES 149
APPENDICES PART I
Appendix I: k-means method 165
Appendix II: Term Frequency–Inverse Document Frequency (TF-IDF) 166
Appendix III: Hyperspectral imaging 167
Appendix IV: Analysis of the painting Mucha using hyperspectral imaging and µ-EDXRF 168
Appendix V: Paint tubes samples database 174
APPENDICES PART II
Appendix I: Paintings cited in the main text 179
Appendix II: Experimental Section, Instrumentation 181
Appendix III: Colorimetric analysis of Amadeo’s paintings. 184
Appendix IV: Area of analysis 189
IV.1. BRUT 189
IV.2. Entrada 191
IV.3. Coty 193
IV.4.Untitled 195
Appendix V: Representative spectra of BRUT, entrada, Coty and Untitled. 197
V.1 µ-EDXRF 201
V.2 µ-FTIR 218
V.3 µ-Raman 227
V.4 µ-SPEX 235
V.5 Reflectance spectroscopy (hyperspectral imaging) 238
Appendix VI: SEM-EDS analysis on cross-sections and micro-samples 243
VI.1 Sampling areas 243
VI.2 Cross-sections 245
VI.3 Micro-samples 254

xii
Appendix VII: Chrome yellow samples analysis 258
VII.1 SEM-EDS analysis of Entrada, BRUT and Untitled samples 258
VII.2 µ-FTIR 260
VII.3 Synchrotron analysis 264
Appendix VIII: Oil paint tubes 269
Appendix IX: Ripolin chart 272
APPENDICES PART III
Appendix I: Images painting Collage 275
Appendix II: Area of analysis case studies paintings. 276
II.1 Painting A: Collage 276
II.2 Painting B: geometric composition 277
II.3 Painting C: the embroiderers 278
II.4 Painting D: the café 279
Appendix III: Analysis and representative spectra of the case studies paintings 280
III.1 Results 280
III.2 µ-EDXRF 283
III.3 µ-FTIR 290
III.4 µ-Raman 295
III.5 FORS 304
Appendix IV: Image documentation 305
Appendix V: Paintings cited in the main text 308

xiii
LIST OF FIGURES
PART I Figure 1. An example of spontaneity, in this case the rapidity of the movements may be related to the
absence of inhibition (Image taken from www.ascuoladiguggenheim.it)
13
Figure 2. Fusion data system overview
23
Figure 3. System architecture for the brushstroke analysis.
24
Figure 4. Bank of 24 Gabor’s filters used in this work with 6 orientations and 4 scales.
25
Figure 5. Gabor filter processing, A RGB image of the painting Ar livre nù, Amadeo de Souza-Cardoso (1914); B scale 4 and 45° filter; C representation of the convolution of the image with the filter (scale 4, 45°); D resulted image filtered with 24 filters.
26
Figure 6. Image processing of RGB image Ar livre nù, Amadeo de Souza-Cardoso, (1914), using
SIFT (left) and Gabor filter (right).
27
Figure 7. Representation of Gabor (3); A Identification of the keypoints localization and orientation; B Selection of a area around the keypoint; C Rotation of the area in accordance with the orientation detected by SIFT; D Selection of an area of 64x64 pixels around the keypoint.
28
Figure 8. Representation of the construction of the vocabulary used for Bag-of-Features, positive and
negative patches are collected from the images of the training set belongs to the corresponding classes. Image adapted from [Maaten and Postma 2009].
29
Figure 9. The performance of the classifier while changing the number of positive images in the
training set, %Hits means the number of painting images correctly classified: the images of the positive class (Amadeo) correctly classified are represented by the black lines; the negative class (Not Amadeo) by the dot lines. A The texture features are extracted using Gabor filter; B the features are
extracted by SIFT using the Bag-of-Features model.
32
Figure 10. Rapresentation of the hyperspectral imaging data-cube, the hyperspectral analysis
includes the visible range between 400 to 720 nm. For each painting 33 images with a spectral resolution of 10 nm were acquired. In this way, a data-cube of 1344 x 1024 x 33 is created, where the first two dimensions are the spatial resolution of the images (expressed in pixels) and the third dimension is the reflectance value of each pixel in the 33 images. From the data-cube it is possible to extract a reflectance spectra for each one of the pixels of the image.
34
Figure 11. System overview of the combination of hyperspectral imaging and elemental analysis.
37
Figure 12. System overview of the step 1 where are mapped the areas that could not painted by
Amadeo (violet) and those were the analysis was not performed (pink). The other pigments are considered unclassified and will be analysed in Step 2.
41
Figure 13. System overview of Step 2, where by comparing the reflectance spectra form the painting
with those in the reflectance database we compute the first pigment attribution. This attribution can be confirmed if the elements detected on the paint area are coherent with those corresponding to the proposed pigment. If the attribution is not confirmed then the pixel is considered unclassified and goes to Step 3.
41
Figure 14. Representation of the measure of the distance between two vectors using Euclidian
Minimum Distance (left) and Spectral Angle Mapper (right).
42
Figure 15. System overview of Step 3. The reflectance spectrum of the unknown pixels is compared
with a set of spectra of mixtures.
43
Figure 16. A Selection of a pixel (291; 304) in the segmented image; B mapping of the areas where it
was detected vermilion and chrome yellow.
44
Figure 17. Tests performed to define the best values for the interval of colour tolerance (c) in the pre-
processing step. The two points (orange and blue), indicated in the coloured image of the painting Mucha (1915-16) were used as samples in the tests. In white are mapped the pixels that satisfied the Equation10 considering the different values of c indicated close to the image. The ¢E ¤ indicates the
46

xiv
difference between the sample pixel and those mapped in white. The percentage indicates the portion of the area mapped in white. Figure 18. Mucha painting (1915-16) and DCR (2013) C and E RGB images of the paintings; k-means cluster analysis of Mucha using A 15 clusters; B 70 clusters; segmented image obtained with our system D Mucha F DCR, the No Analyzed is coloured in pink and the No Amadeo in purple.
48
Figure 19. Comparison between the measured reflectance spectra on Mucha hyperspectral image
(solid lines) and estimated proposed by our system (dot-dashed lines). The sample points are indicated in Figure 17C; A spectrum of Cobalt blue pigment sample B1; B spectrum of mixture of viridian and chrome yellow sample G1; C spectrum of mixture of chrome yellow and vermilion sample point O1; D spectrum of vermilion sample point R1.
49
Figure 20. Relation between the percentage of the Analysed area and the Indicator of authenticity for
molecular analysis.
51
Figure 21. Paintings analysed by fusion data. The paintings of Amadeo de Souza-Cardoso belong to the Centro de Arte Moderna, Fundação Calouste Gulbenkian [Freitas et al. 2008]. The painting DCR was made by the DCR-FCT.
52
PART II Figure 1. Alexandre Ferraz de Andrade, Luice e Amadeo (seated), Brussels 1910. Image from [Alfaro
2007, pg 118].
61
Figure 2. La Légend de St Julien L’Hospitalier, illustrated manuscript version of Gustave Flaubert’s
book, 1912. Collection of Centro de Arte Moderna, Fundação Calouste Gulbenkian (Inv.DP1822) [Freitas 2008 et al. pg. 208]
62
Figure 3. Paintings of Amadeo de Souza-Cardoso dated 1917. Collection of Centro de Arte Moderna, Fundação Calouste Gulbenkian. A Untitled (Entrada), 93 x 76 cm. Collection of CAM (Inv. 77P9); B Untitled (Coty), 93 x 76 cm. Collection of CAM (Inv. 68P11); C Untitled (Máquina registadora - Cash Register) (P198), 93 x7 6cm. Collection of CAM (Inv. 68P10); D Untitled, 93.5 x 93.5 cm. Collection of CAM (Inv. 77P8); E Untitled, 100 x 70.3 cm. Collection of CAM (Inv. 86P19); F Untitled (BRUT 300 TSF), 85.8 x 66.2 cm. Collection of CAM (Inv. 77P20) and G Untitled (Zinc), Private collection. [Freitas
et al. 2008, pgs. 355, 356, 358, 360, 362, 364, 367, 355].
64
Figure 4. Oil paint tubes form the box of Amadeo, from left to right: carminic red (Bourgeois); viridian (Lefranc), chrome yellow (Lefranc) and vermilion (Winsor & Newton) [Melo et al. 2008]
66
Figure 5. The pigment palette of Amadeo between 1912 and 1916, with details from his paintings. Image adapted from Melo et al. 2008.
67
Figure 6A. Paintings of Amadeo de Souza-Cardoso on cardboard. A Untitled (1914), 18 x 33 cm. Collection CAM (Inv. 77P5); B Untitled (1914) 10.7 x 41.2 cm. Collection CAM (Inv.91P219); C Ar livre nú (1914) 18.8 x 13 cm. Collection CAM (Inv.91P217); D Untitled (1914) 18.7 x 12.5 cm. Collection CAM (Inv.91P220); E Untitled (1914) 17.4 x 13.3 cm. Collection CAM (Inv.87P158); F Untitled (Cabeça) (1914) 18.6 x 16.2 cm. Collection CAM (Inv.91P218); G Untitled (1914) 20.1 x 12.9 cm. Private Collection; H Untitled (1914) 18.7 x 12.8 cm. Private Collection; I Untitled (1913) 14.6 x 17.9 cm. Collection CAM (Inv. 91P225); L Untitled (1914) 26.8 x 32.9 cm. Collection CAM (Inv. 91P224); M Untitled (1913) 34.4 x 28.2 cm Collection CAM (Inv. 92P209) [Freitas 2008, pgs. 228, 229, 236, 237,
239, 264, 268, 269, 286, 285, 287].
68
Figure 6B. Paintings of Amadeo de Souza-Cardoso on canvas. Collection of Centro de Arte Moderna, Fundação Calouste Gulbenkian A Untitled (O Jockey) (1913) 61 x 50 cm. (Inv. 77P5) [Freitas 2008, pg. 209]; B (Paysagem figura negra) (1914-15) 50 x 50 cm (Inv. 86P23) [Freitas 2008, pg. 297]; C Gemälde G /Quadro G (1912) 51 x 29.5 cm (Inv. 77P2) [Freitas 2008, pg. 182]; D Untitled, 100 x 70.3 cm. (Inv. 86P19) [Freitas 2008, pg. 362]; E Mucha (1915-16) 27.3 x 21.4 cm. (Inv. 86P21) [Freitas 2008, pg. 322]; F (Janellas do pescador) (1915-16) 27.4 x 34.8 cm. (Inv. 77P16) [Freitas 2008, pg. 318]; G Untitled (undated) 99.6 x 64.6 cm. (Inv. 91P222) [Freitas 2008, pg. 373]
69
Figure 7. Paintings of Amadeo de Souza-Cardoso Collection CAM. Untitled (1913) (Inv. 92P209) A visible light photograph; B X-ray image [Melo et al. 2009]; C Untitled (1914) (Inv. 88P159); D Infrared
photograph [Melo et al. 2008].
70
xv
Figure 8. Amadeo de Souza-Cardoso A Mucha, Oil painting (1915-16), 27.3 x 21.4 cm. Collection CAM (Inv. 86P21); B and C Untitled, watercolour 25 x 16 cm. and 28 x 18 cm. Private collection; C Oil painting A casita clara – paysagem (The clear little house-landscape) (1915-16) 30.5 x 40.5 cm. Collection CAM (Inv. 77P15); D (Maisonatte), watercolour (1915-16), 14.7 x 23.8 cm. Collection CAM
(Inv. 87DP340) [Freitas 2008, pgs. 322, 323, 316].
71
Figure 9. Macro images of different texture patterns in the paintings of Amadeo de Souza-Cardoso. Collection of Centro de Arte Moderna, Fundação Calouste Gulbenkian A Untitled, (1912-13) (Inv. 77P3); B A chalupa (1914-15), (Inv. 77P22); C Untitled (Entrada) (1917) (Inv. 77P9); D Untitled (1914) (Inv. 92P210); E Mucha (1915-16) (Inv. 86P21); F Untitled (1913-14) (Inv. 87P158) [Freitas 2008, pgs.
179, 237, 241, 285, 322, 364].
72
Figure 10. Hydrolysis of a triglyceride composed of two unsaturated acids, (a) linolenic and (b)
linoleic, and one saturated acid, (c) stearic.
74
Figure 11. Schematic model of the different stages of the drying of the oil A fresh oil; B representation of the polyanionic network (after curing); C after hydrolysis of the ester bond due to the ageing processes (after maturation). Image adapted from [Boon et al. 1996].
74
Figure 12. Example of darkening of chrome yellow pigments in Vincent van Gogh painting. Bank of
the Seine (F 293s 77v/1962) (mid 1887), oil on canvas (32 x 46 cm); Van Gogh Museum, Amsterdam (Vincent van Gogh Foundation). Painting analysed by Monico et al. in [Monico et al. 2011b].
77
Figure 13. Detection of Cr (VI) and Cr (III) species using K-edge XANES spectra. In black the
spectrum of Cr(III) oxide (Cr2O3) and in orange the reference Crocoite mineral (Department of Conservation and Restoration of the Universidade NOVA de Lisboa).
78
Figure 14. Molecular structures of fluorescein, eosin and erythrosine, image adapted from [Geldof et
al. 2013].
80
Figure 15. iPad application of the digital reconstruction of van Gogh painting The bedroom (1888).
The user can observe the differences between the present state of the painting and it colour reconstruction [Vet 2014].
81
Figure 16. Paintings of Amadeo de Souza-Cardoso dated 1917. Collection of Centro de Arte Moderna, Fundação Calouste Gulbenkian. Untitled (BRUT 300 TSF) Inv. 77P20; Untitled (Entrada) Inv. 77P9; Untitled (Coty) Inv. 69P11; Untitled Inv. 77P8.
84
Figure 17. A Image of the Collage (Art Library of the Calouste Gulbenkian Foundation ASC09/16); B Headline of the Madrid’s edition of the newspaper “La correspondencia de España”; C Flyer included
in the album “12 Reproductions” (1916) (Art Library of the Calouste Gulbenkian Foundation ASC 221). Image of the flyer from [Alfaro 2007, pg 235].
85
Figure 18. Image details of the word ZINC on (top) the maquette and on (down) Untitled (ZINC), c.
1917, 59 x 49 cm. Private Collection [Freitas 2008, pg. 355].
85
Figure 19. Image details (from left to right) of the rag doll in: the maquette; Canção popular a Russa e o Figaro, 1916, 80 x 60 cm. Collection of Centro de Arte Moderna, Fundação Calouste Gulbenkian (Inv. 77P18) [Freitas et al. 2008, pg. 333] and Trou de la serrure PARTO DA VIOLA Bon ménage Fraise avant garde, 1916, 70 x 58 cm. Collection of Centro de Arte Moderna, Fundação Calouste Gulbenkian (Inv. 68P17) [Freitas et al. 2008, pg. 336]. Appendix Part II Ap.I. shows the images of the paintings
86
Figure 20. Comparison between maquette (upper part) and Entrada painting (lower part) A Images details of the word ENTRADA B word BRUT 300 KK and C advertising of the lamp Wotan.
87
Figure 21. Mapping of ● silica, sand, calcium carbonate; ● glass and mirrors; ● day-by-day materials,
hair clips, matches and box of matches; ● starch.
88
Figure 22. Image details of found objects on Coty paintings, from left to right: mirrors; paint glass and
one mirror; pearl necklace; hair clips.
89
Figure 23. A Image detail of the representation of the matches in Entrada (7x) B Image detail of the wax matches and C of the box label applied on Untitled painting D wood matchbox like this in the painting Untitled conserved by the Portuguese Association of Phillumenism.
90

xvi
Figure 24. SEM image in BSE mode of the preparation layers A Coty (µ6); B Entrada (µ 33); C BRUT (µ12); D Untitled (µ6), (Appendix Part II Ap.IV.1 shows the sampling areas).
91
Figure 25. Red layer in BRUT A Detail image from the back of the painting; B Photomicrographs of the paint surface (10x); C Cross-section of the sample µ12 where it is possible to observe the red
layer (the sampling area indicated in Fig. IV.2 Appendix Part II Ap.IV.1).
91
Figure 26. Colours distribution on the CIE(a*b*) colour space. The CIEL*a*b* values were calculated
by the spectral reflectance of the hyperspectral images of the 4 paintings.
92
Figure 27. Violet sample (µ13) from Coty painting; A Infrared spectrum () cobalt violet pigment; B
Raman spectrum.
94
Figure 28. Green sample (µ19) from Untitled painting; A Infrared spectrum (●) viridian pigment; B
Raman spectra from the sample (black) and from the reference strontium yellow (grey).
95
Figure 29. Blue sample (Bl2) from Untitled painting; A reflectance spectrum; B EDXRF spectrum.
95
Figure 30. Yellow sample (µ3) from Coty painting; A Infrared spectrum (●) cobalt yellow pigment; B
Raman spectrum.
97
Figure 31. Yellow sample (µ3) from Coty painting SEM image in BSE mode.
97
Figure 32. A Infrared spectra of the red sample µ6 from Coty B section of A between 1800 and 650
cm-1: sample µ6 (black line), cochineal carmine lake reproduction (grey line), carminic acid (red line) and (●) barium sulphate.
98
Figure 33. Sample µRed1 from BRUT: A Cross-section; B and C SEM image in BSE mode details of
the white particles present in the top layer, in the area Z1 was PbSO4 and in area Z2 BaSO4.
98
Figure 34. (Left) Raman spectrum of Coty µ2; in black the bands attributed to PR49 -naphthol
pigment, in orange those attributed to minium and in blue the characteristic band of the barium sulphate. (Right) Molecular structure of Lithol red (PR49) [Scherren et al. 2009].
99
Figure 35. Percentage of the use of lead and zinc white in the paintings analysed.
99
Figure 36. White sample (µ14) from Entrada painting; A Infrared spectra of the sample (black) and reference SrSO4 (Alfa Aesar); B Raman spectra of the sample (black) and reference SrSO4 (●) lead
carbonate.
100
Figure 37. CIE(a*b*) colour values for the chrome yellow samples: pure lead chromate (in blue) and mixed-crystals of lead chromate and lead sulphate (in grey). E = Entrada; B= BRUT and U= Untitled.
101
Figure 38. SEM image in BSE mode of the pure chrome yellow sample A Entrada µ32; B sample of
paint tube of Chrome deep (µ17_3128) of W&N.
102
Figure 39. Infrared spectra of the sample µ8 Entrada. In the inset, comparison with a chrome deep pigment reconstruction, M3 (based on W&N process) (in grey) ●PbCrO4; CaCO3; ♦ kaolinite.
103
Figure 40. Infrared spectra of the sample µ17 Entrada. In the inset, comparison with a Lemon chrome
yellow pigment reconstruction, L3b (based on W&N process) (in grey); ● Pb(Cr,S)O4.
103
Figure 41. XRF chromium map intensity with the XANES points of analysis () A BRUT and C Entrada; average XANES spectrum B BRUT and D Entrada.
105
Figure 42. Conservation problems detected in BRUT: A localization of the areas; image details B crack (10x); C network of cracks, macro image acquired with transmitted light; D network of cracks (10x); E cracks and lacuna of the paint and preparation layer (25x); F cracking (32x); G delamination
of the white and green paint (16x).
106
Figure 43. Photomicrographs of the white and dark green areas in the word BRUT A delamination of
the white area in the letter “R”, sample µ4 (10x); B delamination of the green area in the letter “R”,
sample µ5 (32x); C sampling area in the letter “T” where no delamination was observed, sample µ25
(20x); D identification of the sampling area in the word “BRUT”.
108
xvii
Figure 44. Infrared spectra of samples collected from the word “BRUT” in the painting BRUT; A from
yellow area under the letter “R” (µ4); B white area in the letter “T” (µ25).
108
Figure 45. (Top) Mapping of the carboxylates areas in painting BRUT and Entrada: the pink area
corresponds to the samples of the group 1, characterized by the presence of IR defined bands at 1551, 1534 cm-1 (spectrum Fig. 44A). The green area corresponds to the samples of the group 2, characterized by the presence of IR broad band centred ad 1589 cm-1 (spectrum Fig. 44B); (Down) Identification of the samples analysed for each type of carboxylates group.
109
Figure 46. Infrared spectra of µ-samples collected from the paint tube Lefranc Zinc white applied on
glass slide, the samples were collected on the dried surface (external) and from the not-completed dried paint (internal).
110
Figure 47. Infrared spectra of reference zinc carboxylates synthetized in DCR laboratory, details in [Otero et al. 2014].
110
Figure 48. Infrared spectra of the tube samples Lefranc Zinc White, the white of Ripolin and the white BRUT µ4.
110
Figure 49. A Optical microscope image of cross-section from Lefranc zinc white paint sample; B SEM image in BSE mode of cross-section from Lefranc zinc white paint sample; C Optical microscope
image of cross-section from Blanc Ripolin sample.
112
Figure 50. Raman spectra A ASC8 zinc white inside the area delimitated with red dashed line in the cross-section image. In blue the contribuition of the resin used to prepare the cross-section; B zinc
azelate reference.
112
Figure 51. Raman spectra of Ripolin blanc sample on diamond cell, the region between 1320 and
1350 cm-1 was excluded because it corresponds to the diamond band; in red the band attributed to azelaic acid.
113
Figure 52. SEM image in BSE mode of A zinc white Lefranc (ASC8). The EDS analysis detected the presence of: Zn (Z6) and Si (Z5); B Blanc Ripolin sample. The EDS analysis detected the presence
of: Zn (Z2) and Al in (Z3).
113
Figure 53. SEM image in BSE mode of A zinc white by Lefranc (ASC8); B Blanc by Ripolin; C BRUT sample µ4; D BRUT sample µ5.
114
Figure 54. Cross-section (µ19), A visible light; B Ultraviolet light (filter 5); C Ultraviolet light (filter 8).
116
Figure 55. Cross-section of the sample BRUT µ19 A MO image; B SEM image in BSE mode; C distribution of aluminium (Al line K); D distribution of the cobalt (Co line K); E distribution of the zinc
(Zn line K).
117
Figure 56. A Reflectance spectrum acquired with hyperspectral camera; B Infrared spectrum of purple BRUT μ-19 () cerulean blue; (●) zinc carboxylate; () magnesium carbonate.
117
Figure 57. µ-EDXRF spectrum acquired on the BRUT painting in the purple area.
118
Figure 58. A BRUT (µ19) Emission spectra (λex = 490 nm; df = 500 nm) and excitation (λem = 610 nm; df = 600 nm) from the purple (violet line) and bluish (blue line); B Eosin in MeOH:H2O (70:30, v/v) with
Al3+ at pH 2.9, applied on filter paper [Claro 2009].
118
Figure 59. Image detail using ranking light of the green area at the botton right corner in the painting BRUT (Left); A Photomicrographs of the light green area (10x); B Photomicrographs of the dark green
area (25x).
119
Figure 60. Infrared spectra of the green sample (µ33) from BRUT painting (green line); barium
sulphate (orange line) and starch (grey line).
120
Figure 61. Cross-section dark green sample µ33 A OM image; B and C SEM image in BSE mode.
120
Figure 62. The pigment palette of Amadeo for the paintings dated 1917, with details from his
paintings.
121

xviii
PART III Figure 1. The pigment palette of Amadeo between 1912 and 1916, with details from his paintings.
Image adapted from Melo et al. 2009
126
Figure 2. Images of the four paintings assigned Amadeo de Souza-Cardoso but that were not included in the Catalogue Raisonné of his paintings [Freitas et al. 2008].
127
Figure 3. Image documentation of the Painting B (Left) X-ray image (Right) Infrared image, in orange
the line used as sketch to create the composition.
129
Figure 4. Photomicrographs of the brushstroke details from: A and B painting Geometric (10x); C and D Amadeo de Souza-Cardoso, Quadro G (7x), dated 1912, collection of Centro de Arte Moderna,
Fundação Calouste Gulbenkian (Inv. 77P2).
130
Figure 5. Painting C Embroiderers; visible light photograph (left); X-ray image of the, the red rectangle
indicates the region that has no correspondence to that of the surface of the painting (right).
131
Figure 6. Detail image of the group of women, here the brushstroke is used to create the figures more
that fill it and the colours seem mixed directly on the support.
132
Figure 7. Mapping performed on the x-ray image: () lacune filled probably during the first
conservation treatment; () chromatic integrations made over the varnish layer.
133
Figure 8. Image of the painting and in detail the four areas selected for the brushstroke analysis and
the relative brushstroke probability, where 1 is the probability to be painted by Amadeo e 0 by another artist; the accuracy of the answer is 91%.
134
Figure 9. A Image Coty painting; B segmented image; C mapping of Not-Amadeo area.
137
Figure 10. A Image Entrada painting; B segmented image; C mapping of the emerald green pigment.
138
Figure 11. Comparison between the reflectance spectra acquired on the A Entrada painting in the green area (a) with a mixture of viridian and Prussian blue; B from the oil paint tube samples viridian
and emerald green, used as reference materials in the data-base.
138
Figure 12. A BRUT painting (a), (b) black areas, (c) Prussian blue with whiteness surface, (c) area of fading; B segmented image.
139
Figure 13. Photomicrographs of the area with problems of colour alteration: (left) the blue area,
indicated with the letter (c) in Figure 12A, shows a whiteness due to the delamination of the varnish; (right) violet area, indicated with the letter (d) in Figure 12A, the fading of the eosin lake leaved visible the bluish tone of the cerulean blue pigment present.
139
Figure 14. A Image Untitled painting; B segmented image; mapping of C vermilion; D chrome yellow.
140
APPENDICES PART I Figure I.1 A k centroids of K-clusters are chosen randomly; B Each sample is assign to the nearest centroid; C For each cluster a new centroid is calculated. Move the centroid to the new position. If
centroids are unchanged, the clustering is done. Otherwise, go to step A and new centroids are computed.
165
Figure IV.1 Mucha painting A EDXRF points of analysis; B segmented image made by the system.
168
Figure IV.2. Comparison between reflectance spectrum acquired on one pixel (red line) and the mean
spectra obtained using an area of 9x9 pixels (black line).
169
Figure IV.3 A Reflectance spectrum acquired on yellow (Y1); orange (O1) and red (R1) area. Mapping of the pigments identified by the system: B chrome yellow; C mixture chrome yellow and vermilion and D vermilion.
170
Figure IV.4 A first derivative of the reflectance spectra from the painting Y1, R1, O1; B reflectance
spectra acquired on the Amadeo’s paint tubes Jaune de Chrome foncé – Lefranc (ASC17) and French Vermilion - Winsor & Newton (MG3).
171

xix
Figure IV.5 A Reflectance spectra from the painting; B Reflectance spectra acquired form the paint
tube samples of Amadeo Cobalt Blue - Winsor & Newton (MG4) and Cerulean Blue – Winsor & Newton (ACS7); C mapping of the area B2.
172
Figure IV.6 A Reflectance spectra from the painting; B Reflectance spectrum acquired form the paint tube sample of Amadeo Vert Emerald – Lefranc (ASC20) C mapping of the area G1.
173
Figure V. Reflectance spectra from the samples used to as reference materials in the hyperspectral
imaging analysis. *Spectra acquired by hyperspectral camera.
176
APPENDICES PART II Figure I.1 Amadeo de Souza-Cardoso, Canção popular a Russa e o Figaro (P180), 1916, 60x80 cm,
Centro de Arte Moderna, Fundação Calouste Gulbenkian
179
Figure I.2 Amadeo de Souza-Cardoso, Trou de la serrure PARTO DA VIOLA Bon ménage Fraise avant garde (P182), 1916, 58x 80 cm, Centro de Arte Moderna, Fundação Calouste Gulbenkian.
179
Figure I.3. Amadeo de Souza-Carodoso, Untitled (ZINC), (P195), c. 1917, 59 x 49 cm, Centro de Arte
Moderna, Fundação Calouste Gulbenkian.
180
Figure III.1. The paintings of Amadeo de Souza-Cardoso from the collection of Center of Modern Art
of Calouste Gulbenkian Foundation in Lisbon digitalized by hyperspectral imaging and used in this study. Images by courtesy of CAM [Freitas et al. 2008].
185
Figure III.2 Lightness distribution of Amadeo paintings.
186
Figure III.3 Average CIE(a*,b*) value and chronologic distribution of the paintings
186
Figure III.4 Numbers of discernible colours.
187
Figure III.5 A Amadeo de Souza-Cardoso, Untitled (O jockey), 1913, 61 x 50 cm. Collection of Centro
de Arte Moderna, Fundação Calouste Gulbenkian (Inv. 77P5) [Freitas 2008, pg. 208] and B Colour distribution; C Amadeo de Souza-Cardoso, Untitled, 1917, 93,5 x 93,5 cm. Collection of Centro de Arte Moderna, Fundação Calouste Gulbenkian (Inv. 77P8) [Freitas 2008, pgs. 358] and D Colour distribution Untitled.
188
Figure IV.1 Painting Untitled (BRUT 300 TSF), area where it was performed EDXRF analysis (●).
189
Figure IV.2 Painting Untitled (BRUT 300 TSF) samples for FTIR and Raman analysis (●).
190
Figure IV.3 Painting Untitled (Entrada), area where it was performed EDXRF analysis (●).
191
Figure IV.4 Painting Untitled (Entrada), samples for FTIR and Raman analysis (●)
192
Figure IV.5 Painting Untitled (Coty) area where it was performed EDXRF analysis (●).
193
Figure IV.6 Painting Untitled (Coty), samples for FTIR and Raman analysis (●).
194
Figure IV.7 Painting Untitled, area where it was performed EDXRF analysis (●).
195
Figure IV.8 Painting Untitled, samples for FTIR and Raman analysis (●)
196
Figure V.1 Representative µ-EDXRF spectra of preparation layer and white, black, violet, blue, green, yellow, ochre, brown, pink, red areas from BRUT painting.
204
Figure V.2 Representative µ-EDXRF spectra of preparation layer and white, black, violet, blue, green, yellow, orange, brown, pink, red, glass, mirror, golden areas from Entrada painting.
208
Figure V.3 Representative µ-EDXRF spectra of preparation layer and white, black, grey, violet, blue,
green, yellow, orange, brown, pink, red, golden, areas and glass, pearl, metal hair clip from Coty painting.
212
Figure V.4 Representative µ-EDXRF spectra of preparation layer and white, black, grey, violet, blue,
green, yellow, orange, brown, red, pink, golden areas and matches from Untitled painting.
216

xx
Figure V.5 Representative infrared spectra of preparation layer and white, violet, blue, green, yellow, red areas from BRUT painting.
219
Figure V.6 Representative infrared spectra of preparation layer and white, violet, blue, green, yellow areas from Entrada painting.
221
Figure V.7 Representative infrared spectra of varnish, preparation layer and white, violet, blue,
yellow, red areas from Coty painting.
222
Figure V.8 Representative infrared spectra of varnish, preparation layer and white, black, violet, dark blue, green, light green, yellow, red areas and transparent sphere from Untitled painting.
224
Figure V.9 Representative Raman spectra of red, yellow, green blue areas from BRUT painting.
228
Figure V.10 Representative Raman spectra of yellow, brown, green areas from Entrada painting.
229
Figure V.11 Representative Raman spectra of violet, blue, green, red, orange, brown areas from Coty
painting.
230
Figure V.12 Representative Raman spectra of green, yellow, white, areas and transparent sphere
from Untitled painting.
231
Figure V.13 Representative spectra of Emission and excitation spectra (λexc = 490 nm; dichroic = 500 nm; λem = 610 nm; dichroic = 600 nm) acquired on pink, red and violet samples from BRUT
painting.
236
Figure V.14 Representative spectrum of Emission and excitation spectra (λexc = 490 nm; dichroic = 500 nm; λem = 610 nm; dichroic = 600 nm) acquired on pink sample from Entrada painting.
237
Figure V.15 Representative spectra of Emission and excitation spectra (λexc = 490 nm; dichroic = 500 nm; λem = 610 nm; dichroic = 600 nm) acquired on pink and red samples from Untitled painting.
237
Figure V.16 Representative Reflectance (hyperspectral imaging) spectra of violet, blue, green, yellow, red areas from BRUT painting.
239
Figure V.17 Representative Reflectance (hyperspectral imaging) spectra of violet, blue, green, yellow,
orange, red areas from Entrada painting.
240
Figure V.18 Representative Reflectance (hyperspectral imaging) spectra of violet, blue, green, yellow, red areas from Coty painting.
241
Figure V.19 Representative Reflectance (hyperspectral imaging) spectra of violet, blue, green, yellow, red, pink, areas from Untitled painting.
242
Figure VI.1 BRUT, areas of sampling of cross-section () and micro-samples ()
243
Figure VI.2 Entrada, areas of sampling of cross-section () and micro-samples ()
243
Figure VI.3 Coty, areas of sampling of cross-section () and micro-samples ()
244
Figure VI.4 Untitled, areas of sampling of cross-section () and micro-samples ()
244
Figure VII.1. Infrared spectra sample µ8 Entrada; Columbano Tube T17_3128 and 735.5
reconstruction ●PbCrO4; ♦ CaCO3; ♦ kaolinite.
260
Figure VII.2 Infrared spectra sample µ32 Entrada; Columbano Tube T17_3128 and 735.5
reconstruction. ● PbCrO4; ♦ CaCO3; ♦ kaolinite
260
Figure VII.3. Infrared spectra sample µ19 Entrada; Columbano Tube T17_3128 and 735.5
reconstruction. ● PbCrO4; ♦ Gypsum; CaCO3; ● SrSO4
261
Figure VII.4. Infrared spectra sample µ37 Entrada; Columbano Tube T17_3128 and magnesium
sulfate heptahydrate. ● PbCrO4; ♦ CaCO3; ♦ MgSO4 7H2O
261
Figure VII.5. Infrared spectra sample µ17 Entrada; Columbano tube T24_3128 and CR.C7 0.4 Molar
fraction chromate and 0.6 sulphate. ● Pb(Cr,S)O4.
262

xxi
Figure VII.6. Infrared spectra sample µ3 BRUT; CR.C.8 with 0.3 Molar fraction chromate and 0.7
sulphate ● Pb(Cr,S)O4; ♦ BaSO4; ● MgCO3.
262
Figure VII.7. Infrared spectra sample µ4 BRUT; ● BaSO4; ♦ gypsum; * quartz.
263
Figure VII.8. Infrared spectra sample µ16 BRUT, CR.C7 0.4 Molar fraction chromate and 0.6
sulphate.● MgCO3
263
Figure VII.9. Visible light microscope with the mapping area marked in red; RGB composite images obtained by μ-IR: B mixed lead chromate (975-966 cm-1); C Quartz (1170-1157 cm-1); D MgCO3 (1500-1398 cm-1); E broad band centred at 1580 cm-1; F Carboxylate (1525-1560 cm-1).
265
Figure VII.10. XRF Chromium map intensity; RGB composite images obtained by μ-XRF at a primary beam energy of 6.12 keV B Ba in green, Cr in red; C Mg in blue; D Si in green.
265
Figure VII.11. Infrared spectra sample am17 BRUT acquired with SR-µIR in BaF2 cell (top) and
sample am15 BRUT acquired with µ-FTIR in diamond cell (down); ● MgCO3; ♦ Quartz.
266
Figure VII.12. XRF chromium map intensity with the XANES points of analysis; B average XANES
spectrum.
266
Figure VII.13. RGB composite images obtained by μ-XRF at a primary beam energy of 6.12 keV with K in green, Ba in red and Cr in blue; B XRF Chromium map intensity in black the area used to create the calculate the intensity profile reported in C; C intensity profile of Cr K line on the XRF maps at beam energy of 6.12 keV (black) and 6.02 keV (red); D XANES points of analysis; E average XANES
spectrum.
267
Figure IX.1 Front of the Ripolin’s colour chart: Glacis Ripolin a Finir Spécial Pour Voitures, dated
1925.
272
Figure IX.2 Inside of the Ripolin’s colour chart: Glacis Ripolin a Finir Spécial Pour Voitures, dated
1925. In the red squared is identified the swatch Blanc 1401.
272
APPENDICES PART III Figure I.1. Painting (A) Collage, assigned Amadeo de Souza-Cardoso.
275
Figure I.2 A Image of Painting (A) Collage with normal light; B mapping of the areas painted with
pigments not included in the Amadeo’s palette: () copper phthalocyanine and dioxazine violet; () β-
naphthol; () dioxazine violet and β-naphthol; () Hansa yellow and red β-naphthol; () dioxazine violet
and copper phthalocyanine; () red β-naphthol and yellow ochre. The green line indicates the papers glued.
275
Figure II.1 Painting (A) Collage, points where it was performed EDXRF analysis (○).
276
Figure II.2 Painting (A) Collage, samples for FTIR (●) and Raman analysis (○).
276
Figure II.3 Painting (B) Geometric, points where it was performed EDXRF analysis (●).
277
Figure II.4 Painting (B) Geometric, samples for FTIR (●) and Raman analysis (●)
277
Figure II.5 Painting (C) Embroiderers, points where it was performed EDXRF and FORS analysis (); Raman in-situ (); points of sampling for FTIR and Raman (●); samples for cross-sections (●).
278
Figure II.6 Painting (C) Embroiderers, points where it was performed EDXRF analysis (); points of
sampling for FTIR and Raman (●); samples for cross-sections (●).
279
Figure III.1 Representative µ-EDXRF spectra of the paper support; blue; green; red; yellow; violet; brown; white; black areas and the signature from Painting (A) Collage.
284
Figure III.2 Representative µ-EDXRF spectra of white; blue; green; red; pink; yellow; brown areas from Painting (B) Geometric.
285
Figure III.3 Representative µ-EDXRF spectra of the support; blue; green; red; yellow; pink; brown; white areas; signature and preparation layer from Painting (C) Embroiderers.
287
Figure III.4 Representative µ-EDXRF spectra of the support; blue; green; red; yellow; violet; brown; white; black areas and preparation layer from Painting (D) Café.
289

xxii
Figure III.5 Representative µ-FTIR spectra of the red and yellow areas from Painting (A) Collage and
the reference pigments -naphthol PR4 (Clariant) and Hansa yellow PY1 (Clariant).
290
Figure III.6 Representative µ-FTIR spectra of the white and brown areas from Painting (B) Geometric.
291
Figure III.7 Representative µ-FTIR spectra of the grey, red, green and blue areas from Painting (C) Embroiderers.
292
Figure III.8 Representative µ-FTIR spectra of the varnish and the green; white; yellow; blue and violet
areas from Painting (D) Café.
293
Figure III.9 Representative µ-Raman spectra of the blue; red; yellow painted areas and blue area on paper B from Painting (A) Collage and the reference pigments Copper phthalocyanine blue PB15
(Aldrich); dioxazine violet PV23 (Clariant); -naphthol PR4 (Clariant), Hansa yellow PY1 (Clariant) and indigo (Thermo Database).
297
Figure III.10 Representative µ-Raman spectra of the yellow; brow and red from Painting (B) Geometric.
298
Figure III.11 Representative µ-Raman spectra of the preparation layer and white area from Painting (C) Embroiderers.
289
Figure III.12 Representative µ-Raman spectra of the white; blue; green and yellow areas from
Painting (D) Café.
299
Figure III.13 Representative FORS spectra of the support; blue; green; red; pink; yellow; brown areas from Painting (C) Embroiderers.
304
Figure IV.1. Infrared photography Painting (A) Collage, attributed Amadeo de Souza-Cardoso.
305
Figure V.2. Infrared photography Painting (C) Embroiderers, attributed Amadeo de Souza-Cardoso.
306
Figure V.3. Ultraviolet photograph (covered in black and white) Painting (D) Café, attributed Amadeo
de Souza-Cardoso.
307
Figure V.4. X-ray image Painting (D) Café, attributed Amadeo de Souza-Cardoso.
307
Figure VI.1 Amadeo de Souza-Cardoso, Untitled, 1910, graphite on paper. 36 x 24.7 cm. Collection of
Centro de Arte Moderna, Fundação Calouste Gulbenkian (Inv. 92DP1586).
308
Figure VI.2 Amadeo de Souza-Cardoso, Untitled, 1910, graphite on paper. 25 x 35 cm. Collection of
Centro de Arte Moderna, Fundação Calouste Gulbenkian (Inv. 86DP372).
309

xxiii
LIST OF TABLES
PART I Table 1. Strategies adopted in the features extraction block.
25
Table 2. Number of keypoints detected with SIFT and with Gabor (3) on SIFT keypoint analysing an
area of 64x64 and 128x128 pixels
28
Table 3. Number of positive images in the training and test sets.
32
Table 4. Evaluation of the performance of the classifier using: SIFT; Gabor (1) in a global approach;
Gabor (2) in regular points and Gabor (3) in the localization of SIFT keypoints. Hits refers the percentage of Amadeo’s paintings correctly classified.
33
Table 5. Evaluation of the role of the number of clutters in the construction of the vocabulary in bag-
of-features strategy. The value indicated is the sum of the positive and negative word with the same proportion 50:50.
34
Table 6. Set of oil paint tube used to create the database of reference materials.
38
Table 7. Example of the Excel file used to introduce the chemical elements and the corresponding
L*a*b* values.
39
Table 8. Percentage of areas detected by pigment analysis on Mucha and DCR paintings.
47
Table 9. Indicator of authenticity that the paintings were made by Amadeo, considering brushstroke
and materials analysis separately, and joined together by the fusion data. The value range is 0-1 where 0 is Not Amadeo and 1 Amadeo.
53
PART II Table 1. Percentage area of paintings busy with unusual materials and glass and mirrors.
89
Table 2A. Colour construction in the BRUT and Entrada paintings.
93
Table 2B. Colour construction in the Coty and Untitled paintings.
93
Table 3. Characteristic infrared and Raman bands assigned to cobalt yellow (K3[Co(NO2)6],)
pigment [Cornman 1986; Hitchman and Rowbottom 1982; Miller and Wilkins 1952; Vendilo et al. 2011].
96
Table 4. Characterization of micro-samples of chrome yellows.
101
PART III Table 1. Palette of pigments detected in the Painting Geometric.
130
Table 2. Percentage of Not-analysed and Not-Amadeo area in BRUT, Entrada, Coty and Untitled
paintings.
137
Table 3. Colorimetric analysis on the BRUT blue areas.
140
APPENDICES PART I Table IV.1. Elements detected for each area and the attribution performed by the system combining
hyperspectral imaging and EDRF.
168
Table IV.2 Colorimetric values acquired on the yellow, orange and red areas of the painting Mucha
and on the paint tube samples.
171
Table. IV.3 Colorimetric values acquired on three blue areas of the painting Mucha and on the paint
tube samples.
172

xxiv
Table IV.4 Colorimetric values acquired on two green areas of the painting Mucha and on the paint
tube sample.
173
APPENDICES PART II Table V.1 Colour areas analysed on BRUT by µ-EDXRF; µ-FTIR; µ-Raman; µ-SPEX; Reflectance
spectroscopy (hyperspectral imaging) and SEM-EDS.
197
Table V.2 Colour areas analysed on Entrada by µ-EDXRF; µ-FTIR; µ-Raman; µ-SPEX; Reflectance
spectroscopy (hyperspectral imaging) and SEM-EDS.
198
Table V.3 Colour areas analysed on Coty by µ-EDXRF; µ-FTIR; µ-Raman; µ-SPEX; Reflectance
spectroscopy (hyperspectral imaging) and SEM-EDS.
199
Table V.4 Colour areas analysed on Untitled by µ-EDXRF; µ-FTIR; µ-Raman; µ-SPEX; Reflectance
spectroscopy (hyperspectral imaging) and SEM-EDS.
199
Table V.5. Characteristic energies of the X-rays (KeV) used to identify the elements in the EDXRF
analysis.
217
Table V.6. Characteristic bands of FTIR spectra of the pigments identified.
225
Table V.7. Raman band assignments cobalt violet pigment.
232
Table VII.1 Roi region in cm-1 used for IR mapping.
268
Table VII.2 X-ray adsorption edges and X-ray line energies (KeV) used for XRF mapping.
268
Table VIII.1 Oil pain tubes analysed in Melo et al. 2009, relative code and label’s transcription
269
APPENDICES PART III Table III.1 Colour areas analysed on Painting (A) Collage by µ-EDXRF; µ-Raman and µ-FTIR.
280
Table III.2 Colour areas of the paper analysed on Painting (A) Collage by µ-EDXRF and µ-Raman.
280
Table III.3 Colour areas analysed on Painting (B) Geometric by µ-EDXRF; µ-Raman and µ-FTIR.
281
Table III.4 Colour areas analysed on Painting (C) Embroiderers by µ-EDXRF; FORS; µ-Raman and
µ-FTIR.
281
Table III.5 Colour areas analysed on Painting (D) Café by µ-EDXRF; µ-Raman and µ-FTIR.
282
Table III.6. Characteristic energies of the X-rays (KeV) used to identify the elements in the EDXRF
analysis.
289
Table III.7. Characteristic bands of FTIR spectra of the pigments identified.
294
Table III.8. Characteristic bands of Raman spectra of the pigments identified.
300

1
CONTEXT OF THE WORK This thesis is inserted in the multidisciplinary project “Crossing Borders: History, Materials, and
Techniques of Portuguese Painters from 1850 to 1918 (Romanticism, Naturalism and Modernism)”
which has been supported by the Portuguese Foundation for Science and Technology (FCT). The
objective of the project was to analyse three important periods of the history of Portuguese art from the
perspective of the materials and the painting techniques. A particular effort was done to relate art history
with the analysis of the paining materials. As its name suggests, the project aimed at crossing the
borders between areas such as conservation science, art history, and computer science. In fact, the
work presented in this thesis was developed at the NOVA University of Lisbon through a collaboration
between the Department of Conservation and Restoration and Professor Nuno Correia’s group at the
Center for Informatics and Information Technologies (CITI). The Crossing Borders project involved also
important museums in Lisbon, namely Casa Museu Anastácio Gonçalves, the Center for Modern Art of
Calouste Gulbenkian Foundation, and Museu Nacional de Arte Contemporânea - Museu do Chiado.
Furthermore, the section of the Portuguese police in charge of art crimes was a project participant. The
analysis of selected artworks was followed by investigations on bibliographical and archival sources; the
objective of such investigations was to shed light on how art was taught in Portugal and on the materials
used by the artists and the providers of such materials. A number of projects were carried out in parallel
to the study of the paintings; these activities were aimed at the analysis of conservation problems and
at the development of new analytical methodologies.
Amadeo de Souza-Cardoso (1887-1918), the artist studied in this thesis, could be considered as an
“unconventional representative” of Portuguese modernism. His education and career took place mainly
in Paris, a city whose artistic offering he exploited fully; this is clearly recognizable in the influence that
international artists had in his artworks [Freitas at al. 2006]. Unfortunately, the critics’ attention on
Amadeo arrived rather late, through the studies of art historian José Augusto França [França 1956].
This late discovery, together with the absence of a Catalogue Raisonné (which was published only in
2008), could be considered among the reasons why the art market (in Portugal and elsewhere) is full of
forgeries of Amadeo’s artworks. The edition of the Catalogue Raisonné motivated the first systematic
study of the materials and techniques used by Amadeo in artworks dated between 1912 and 1917 [Melo
et al. 2008]. Art historical analyses as well as scientific examination of the paintings provided the basis
for and against being including in the catalogue a set of ambiguous paintings.
Attribution and authenticity are challenging issues in art conservation. The lucrative business of forging
art is the fourth largest world criminal enterprise [Kaplan 2010]. The section of the Portuguese police in
charge of art crimes highlights how the current economic crisis opens new opportunities for illicit
activities. As referred by João Oliveira, coordinator of criminal investigation of Judicial Police, Portugal
is already situated in the major international routes of painting falsification. In general, addressing
authentication issues calls for a multidisciplinary approach.

2
This recent multidisciplinary approach to authentication is to be contrasted with a more traditional view,
mostly related to historical and aesthetic aspects—this view is referred to as a whole as
connoisseurship: the expert knowledge of style and techniques that art historians develop through the
course of a career [Barrett 1995]. Even today the formal analysis of the artworks and connoisseurship
play a significant role in the authentication process. The detailed and systematic observation of a set of
artworks of a given artist allows the identification of markers that could be used to assess the artworks’
authorship [Dantzig Foundation 1973; Morelli 1893].
The artist’s brushstroke is a natural feature for observation in a painting. This may be well considered
as the artist’s signature marks, for it captures the personal movements performed during the act of
painting. Similar to handwriting, the brushstroke of an artist may change during his/her life; however, the
defining characteristics of the personality of the artist remain uniform and visible [Morelli 1893]. Recent
progresses in the realm of machine learning have allowed the simulation of the formal analyses of
artworks through computer vision techniques. In particular, given an image of the artwork, the application
of algorithms of image segmentation and feature extraction allows the detection of texture information
which can be used to classify the image. In fact, this process enables computation of the probability that
a given artist produced the painting. A notable work in this direction, focused on van Gogh’s paintings,
was carried out by Professor Rick Johnson Jr of Cornell University and Professor Eric Postma (1961)
at Tilburg University [Johnson et al. 2008].
Nevertheless, Dantzig himself [Dantzig Foundation 1973] demonstrated that the visual aspect of an
artwork cannot be considered independently from its constituent materials. Dantzig’s studies on van
Gogh’s paintings showed that brushstrokes are related to the materials’ properties and handling, but
also that the choice of the support and of the kind of preparation have an influence on the final
appearance of the surface. Recently, these aspects have been studied in the context of the HART
project (Historically Accurate Paint Reconstruction Techniques), which was supported by the NWO
(Netherlands Organization for Scientific Research) [Carlyle and Witlox 2005].
Based on the above observations, and the work done in collaboration with art historian Helena de Freitas
(curator of the most important exhibition of Amadeo and co-author of his Catalogue Raisonné), raised
the need for carrying out a study which integrates visual and molecular information in Amadeo’s artwork,
i.e., information derived from the study of the constituent materials of the artwork. The goal of this study
is to use the information on Amadeo’s materials and techniques to create a tool based on image
processing to support authentication processes. It is important to note that the authentication of an
artwork can also base on the use of the detailed knowledge of the artist’s materials and techniques, and
the developmental evolution throughout the artist’s career [Barrett 1995]. To follow the evolution of
Amadeo’s career we studied his last paintings. These artworks were made in Portugal in 1917 and are
considered as a homogenous core, different from all his previous works.

3
In this context, this dissertation has two main objectives: (i) the development of a tool, based on image
processing, supporting the authentication of Amadeo’s artworks, and (ii) the analysis of his artworks
produced in Portugal in 1917. Given that this work involves separate areas, the thesis is presented in
three separate yet interrelated parts.
PART I focuses on the work developed on image processing. Chapter 1 includes the
presentation of some aspect of the authentication process and the recent contribution of
computer vision techniques in the conservation field. Chapter 2 presents the tool developed for
the study for the paintings of Amadeo: the method combines brushstroke analysis performed
by two algorithms of image processing (Gabor filter and Scale Invariant Feature Transform) and
the molecular analysis using hyperspectral imaging and elemental analysis (µ-EDXRF).
PART II introduces Amadeo de Souza-Cardoso and his works (Chapter 1). The analysis of the
paintings of Amadeo produced in Portugal in 1917 and the main important conservation
problems are given in Chapter 2. According to art historians, the paintings studied in this part
constitute a homogeneous core [França 1992] and are among his best work [Silva 1995; Freitas
2008b]. The materials and techniques of these paintings (namely, Untitled (Brut 300 TSF),
Untitled (Entrada), Untitled (Coty) and Untitled) are studied for the first time in this thesis. The
results obtained thus enrich the study performed previously in 2008 [Melo et al. 2008]. The
experimental style that Amadeo adopts in these artworks (in particular, the use of new materials)
constitutes new challenges for their conservation.
In PART III the contributions and results of Parts I and II are jointly exploited in the analysis of
2 set of paintings. The aim of this part is to assess the potentialities and the limitations of the
proposed systems; the results obtained by the application of the tools developed in Part I are
compared with those obtained by the multi-analytical approach described and used in Part II:
(1) Four paintings attributed to Amadeo de Souza-Cardoso but not included in his
Catalogue Raisonné were studied in order to assess their authenticity. The paintings
are called Collage; Geometric; Embroiderers and Café. The results obtained by the
materials and techniques characterization were compared with the classification
obtained by the brushstroke analysis performed using image processing.
(2) The system based on the combination of hyperspectral imaging and elemental analysis
was applied on the paintings of Amadeo dated 1917, BRUT, Entrada, Coty, and Untitled
studied in Part II. The aim of this analysis is evaluate the capacity of the system
developed in the characterization of the pigments present in the paintings.

4

5
PART I: DIGITAL IMAGE PROCESSING
FOR OIL PAINTING ANALYSIS

6

7
INTODUCTION TO PART I In 2007, the Calouste Gulbenkian Foundation published the first volume of the Catalogue Raisonné of
Amadeo de Souza Cardoso - the photo biography [Freitas et al. 2007]. One year after, the second
volume was published: the Catalogue Raisonné of Amadeo’s paintings [Freitas et al. 2008]. The
second volume includes 201 paintings of Amadeo. The research made by Helena de Freitas and her
team to prepare the edition of the Catalogue Raisonné of paintings took 8 years. In these years a large
set of material1 was collected and organized [Alfaro 2008]. A significant part of the investigation studies
the relation of Amadeo with his contemporary artistic context; this research resulted in the exhibition
Amadeo de Souza-Cardoso Diálogo de Vanguardas-Avant-Garde Dialogues, at the Gulbenkian
Foundation between November 2006 and January 2007. The exhibition was attended by over 700.000
visitors in four mounts. The exhibition and the associated catalogue [Freitas et al. 2006] present a sort
of dialogue between a selection of Amadeo’s paintings and artworks from other artists that influenced
the Portuguese painter. Such artists include Gino Severini, August Macke, Amedeo Modigliani, Liubov
Popova, Kazimir Malevitch, Albert Gleizes, Lyonel Feininger, Jean Metzinger, Otto Freundlich, Pablo
Picasso, Ivan Puni, and Olga Rozanova. Moreover, the Catalogue documents how Amadeo become
familiar with these artists, their friendship or exhibitions in which Amadeo had the opportunity to see
their paintings. During the edition of the Catalogue Raisonné of paintings Helena de Freitas and her
team asked to the DCR-FCT to analyse 5 ambiguous paintings attributed to Amadeo. Before analysing
these paintings, a systematic study of the materials and techniques of Amadeo was developed; this
study covered artistic materials that belonged to Amadeo as well as a selection of 19 paintings
representative of the Amadeo’s production between 1912 and 1917. Such materials include a palette
and a box of paint tubes (from the CAM collection) and 31 oil paint tubes from two paint boxes conserved
in the Family house of Amadeo in Manhufe2. The paint tubes were from the French Lefranc and
Bourgeois and the English Winsor & Newton (W&N) [Melo et al. 2009]. The analysis of the oil paint
tubes and of the paintings made it possible to reconstruct the palette of pigments used by Amadeo
between 1912 and 1916 [Melo et al. 2008]. During the analysis of the paintings it appeared clear that
the visual investigation of the painting surface carried out by the team of art historians and curators and
the analysis of the materials were often in agreement, complementing each other.
Based on the experience of the Catalogue Raisonné it was decided to address the challenging topic of
the Amadeo’s painting authentication. Specifically, it was decided to create a model based on the
modus operandi used in laboratory for the evaluation of the authenticity of a painting attribute to
Amadeo. The aim of the model was to combine two information: (i) brushstroke information (visual
1 The research was based on the analysis of documentary sources: catalogs of exhibitions, album “12
Reproductions” (publish by Amadeo in 1916, Porto), Amadeo’s agendas, published articles, photographs of the
time and personal correspondence of Amadeo [Alfaro 2006].
2 In the Family house of Amadeo are conserved 6 boxes, 3 of which contain materials that would be used by
Amadeo: a box assigned “Amadeo Cardoso” with 60 crayons. A box assigned “Amadeo” with 21 oil paint tubes and
a box with the name “Maria da Graça 34” with 18 oil paint tubes. The oil tube paints were studied in [Melo et al.
2009].

8
analysis), were extracted from RGB images; (ii) molecular information (pigments’ characterization) were
extracted by the analysis of hyperspectral images and by elemental analysis (performed by µ-EDXRF).
The combination of these two information (fusion analysis) provides a qualitative and quantitative
evaluation of the authenticity of the paintings attributed to Amadeo. For different reasons Amadeo de
Souza-Cardoso resulted the perfect subject for developing the authentication tool: (i) previous art
historian studies highlighted the unique features belonging to Amadeo’s works (brushstroke and colour)
used in the developed system. (ii) The Catalogue Raisonné offered a base of information on which the
system was built on. (iii) Amadeo used a restricted and consistent palette of pigments that was used as
reference database for the mapping the pigments in the hyperspectral images.
The use of image processing for brushstroke analysis was successfully applied in van Gogh’s
paintings [Johnson et al. 2008; Li et al. 2012]. The methodologies used on the analysis of van Gogh’s
brushstrokes were the starting point in the definition of Amadeo’ system. At the same time,
complementing the brushstroke analysis with information on the materials (molecular analysis) made
the system more robust and helped to overcome problems when distinguishing similar or ambiguous
brushstroke. In this thesis was used one of the algorithms applied with positive results on the study of
van Gogh’s paintings, namely the Gabor filter [Johnson et al. 2008]. In Amadeo’s system, Gabor was
combined with an algorithm for feature detection, called Scale Invariant Features Transform (SIFT). This
algorithm was chosen because it is able to detect features present in different images also when they
are in different scale and position. The system developed for brushstroke analysis is based on a binary
classification. This means that the features extracted from images of Amadeo’s paintings (called positive
class) were compared with the features extracted from image of not Amadeo’s paintings (called negative
class). For the positive class 200 images of paintings of Amadeo present in his Catalogue Raisonné
were used. As for the negative class paintings of artists as close as possible to Amadeo were chosen:
these include 109 images from the paintings present in the Catalogue Diálogo de Vanguardas-Avant-
Garde Dialogues described above [Freitas et al. 2006] and from paintings of artists that belonged to
Amadeo’s circle, such as Sonia and Robert Delaunay, Eduardo Viana, Mario Eloy and José Almada
Negreiros from the CAM collection. The images in these two classes are divided in two sets called
training and test. The training set is used to create the model, while the test set is used to evaluate the
performance of the classifier. To provide a statistically significant evaluation of the classifier’s
performance, the test set should be as large as possible. The selection of the images for the training
and test sets is therefore a crucial step. On the one hand, the positive images in the training set should
be as representative as possible of the different brushstrokes of the artist. On the other hand, to enhance
the performance of the classifier, the images of paintings by not Amadeo should have a brushstroke
similar to that present in Amadeo’s paintings. The selection of the images in both sets was carried out
in collaboration with Helena de Freitas.
The molecular analysis was performed by hyperspectral imaging technique combined with and
elemental analysis (µ-EDXRF). To perform this analysis, a database of 16 reference materials was
created. The selection of the materials in the database was based on the analysis of the 19 paintings

9
and of the paint materials made at the time of the Catalogue Raisonné of Amadeo’ paintings [Melo et
al. 2008] described above. The hyperspectral imaging technique was selected because it provides
molecular information but also colour information that together with brushstroke is considered a relevant
feature in Amadeo’s paintings. By analysing the hyperspectral images, the system produces a mapping
of the pigments but also identifies the areas that could have been painted with materials different from
those in the database. These areas are quantified and used as information in authentication studies.
Moreover, the detection of these areas helps to better focus the use of methods that require sampling.
The system shows a limitation in the characterization of the pigments in areas affected by colour
changing; such as in the case of the analysis of the paintings by Amadeo BRUT dated 1917.
The combination of brushstroke and molecular analysis provides a quantitative indicator for
authenticity with a value between 0 (considered not Amadeo) and 1 (considered Amadeo). The model
developed for brushstroke analysis was created specifically for Amadeo’s paintings. Due to this
specificity, the performance evaluation of the classifier cannot be calculated using standard existing
databases, as done in other works in computer vision. For this reason, this evaluation was done using
test sets and case studies. The best results obtained have an accuracy of 93% in the classification of
198 images from Amadeo and not Amadeo paintings. The classifier gave a correct answer for 133 of
the 138 images of Amadeo’s paintings tested. Moreover, the brushstroke analysis was used as an
additional analysis on the evaluation of 4 paintings (called Collage, Geometric, Embroiderers and Café)
attributed to Amadeo but not included in the Catalogues Raisonné. The brushstroke analysis provided
results coherent with those achieved by the analysis of the materials and techniques. In one case (Café)
it was observed that the presence of a varnish layer can reduce the detection of the brushstroke by the
image process and can compromise the performance of the classifier. The brushstroke and the
molecular models were also tested in a set of 12 paintings, 11 of which by Amadeo and a deliberate
falsification of an Amadeo’s painting. The same 12 paintings were used to evaluated the behaviour of
the system combining the two information (brushstroke and molecular) by SUM-Combination technique.
The combination technique chosen is simple: the two analyses are weighted and summed. To the two
analysis has been given the same weight because are considered equally relevant to the authentication
study. In the case of the molecular and fusion analysis the 12 paintings were correctly classified. In the
case of the brushstroke analysis the classifier gave a correct answer for 10 of the 11 images of Amadeo’s
paintings tested.

10

11
CHAPTER 1: AUTHENTICATION AND COMPUTER VISION
This chapter introduces some concepts that are central to the research developed in this thesis. This
introduction does not aim at giving a detailed overview of the history of connoisseurship and falsification;
rather, it intends to offer essential information on how the different disciplines involved in this thesis
address the problem of painting authenticity. In the first part of the chapter, the formal analysis and the
notion of connoisseurship are presented using the approach proposed by Giovanni Morelli (1816-1891)
and Maurits M. van Dantzig (1903-1960). Their studies on the use of visual features to prove authenticity
are at the heart of recent applications on painting classification developed by computer vision. The
second part of the chapter introduces the challenges posed by the conservation community to computer
science. The state of the art in the use of digital image processing for brushstroke analysis and the use
of hyperspectral imaging for painting analysis complete this section. Finally, the last section presents
the contribution given by this work to the authentication process of paintings attributed to Amadeo.
1.1 Authenticity issues “Yesterday, this painting was worth millions of guilders and experts and art lovers would come from all
over the world and pay money to see it. Today, it is worth nothing and nobody would cross the street to
see it for free. But the picture has not changed. What has?”- Hans van Meegeren, 1947- [Todd 2008].
Hans van Meegeren (1889-1947) was one of the well-known forgers of all time. He became famous for
producing, among others, a dozen fake Vermeers which were sold to museums and private collectors
[Coremans 1948]. His most famous painting is Christ and the Disciples at Emmaus, discovered by
Professor Abraham Bredius at the Boymans Museum in Rotterdam in 1937. The size and the religious
theme made the painting an “unusual Vermeer”; still, Bredius defined it as quite different from all his
other paintings and yet every inch a Vermeer” [Dutton 2009, pg.177]. Within a few days after the end of
the Second World War, van Meegeren was arrested, since he sold one of his Vermeer paintings to the
German politician and military leader Reichsmarshall Hermann Görind he was accused of treason. In
prison van Meegeren confessed to the falsification of the Vermeer paintings. From that moment all his
paintings present in museum collections, including the The Disciples, were relegated to basement
storage. So, what had changed in the magnificent painting and in the splendid luminous effect so
appreciated by Bredius after the van Meegeren’s confession? It is generally assumed that artistic forgery
is related to the absence of aesthetic values but the story of the van Meegeren paintings demonstrated
that forgery is not only a matter of aesthetic; in other words, pure aesthetics cannot explain forgery
[Lessing 1983]. The term authenticity is still one of the most elusive and debated qualities to be
associated with cultural work [Matero 2007]. Moreover, the concept of authenticity is never absolute, it
varies from place to place, over time, and with context [Lowenthal 1994]. One of the aspects of attribution
in determining authenticity is related to the identification of the origins, authorship, or provenance of the
object, which Dutton calls nominal authenticity. However, when we evaluate an artwork we deal with an

12
object’s character as a true expression of an individual’s or a society’s values and beliefs3 [Dutton 2003,
pg. 259] for that reason we can consider a work of art a forgery if it does not allow you to answer a series
of questions related to its creation by the artist, to the cultural context and to the audience experience;
all of this information is usually considered in the frame work of the artist’s intentions [Dutton 2003].
In spite of the elusiveness of the term, in contemporary conservation practice authenticity4 is a
requirement to be deemed the Outstanding Universal Value of UNESCO. The conditions of authenticity
are discussed in the Nara document (1994). The term authenticity was introduced, for the first time in
the international heritage community, by the Venice Charter5 in 1964: It is our duty to hand them [historic
monuments] on in the full richness of their authenticity [Hassard 2006, pg.147]. In the Venice Charter,
the term authenticity is used without any definition or contextualization; some decades will be necessary
to fully understand the complexity of this concept [Hassard 2006, pg.147]. In 1994 the Nara Document
defined authenticity as the essential qualifying factor concerning values. This document was drafted at
the Conference on Authenticity6 with the aim of extending the Venice Charter in response to the
expanding scope of cultural heritage concerns and interests in our contemporary world. The
preservation of authenticity is considered in the Nara Document as a way to protect local cultural
identities from being increasingly subject to the forces of globalization and homogenization and to the
aggressive nationalism. The Nara Document attributed to technical and the political institutional sectors
(such as museums and universities) a key role in authenticity research: “The understanding of
authenticity plays a fundamental role in all scientific studies of the cultural heritage, in conservation and
restoration planning, as well as within the inscription procedures used for the World Heritage Convention
and other cultural heritage inventories7”.
1.1.1 The authentication process
Attribution and authenticity analyses were for a long time related to matters of aesthetics, identified as
connoisseurship. The eighteenth-century French term connoisseur initially carried broad connotations
of discrimination which were implicitly the prerogatives of a culture’s upper class [Sutton 2004, pg.30].
In the twenty-first century the term connoisseurship was related to the process that, involving intuitive
recognition of an artist’s hand, allowed the determination of authorship of an artwork [Sutton 2004]. In
3 “Set of distinctive spiritual, material, intellectual and emotional features of society or a social group, that
encompasses, not only art and literature, but lifestyles, ways of living together, value systems, traditions and
beliefs”, definition of Culture in UNESCO Framework for Cultural Statistics (2009). 4 “A property must also meet the conditions of integrity and/or authenticity and must have an adequate protection
and management system to ensure its safeguarding". Operational Guidelines for the Implementation of the World
Heritage Convention, UNESCO, 2011. 5 International Charter for the Conservation and Restoration of Monuments and Sites: ‘The Venice Charter’, Venice,
1964. 6 Nara Conference on Authenticity in relation to the World Heritage Convention in Nara, Eighteenth session, Phuket,
Thailand 12-17 December 1994. 7 Point 10 of Values and authenticity in Information note: Nara Document on Authenticity. Experts meeting, 1-6
November 1994. http://whc.unesco.org/archive/nara94.htm, last access 3/3/2015.

13
the English edition of Morelli [Morelli 1893] he explain the parallelism that exist between speaking and
painting “as most men, both speakers and writers, make use of habitual modes of expression, favourite
words and saying, which they often employ involuntarily […] so almost every painter has his own
peculiarities, which escape him without his being aware of it” [Morelli 1893, pg.75]. Morelli in his visual
glossary, included material aspects: disembodied, hands, ears and other body parts from different
Renaissance masters and suggests: The study of all the individual part, which go to make up “form” in
a work of art, is what I would recommend to those who are […] really desire to find a way through the
intricacies of the history of art, and to attain, if possible, to a scientific knowledge of art [Morelli 1893,
pg.75]. As discussed by Hendriks [Hendriks et al. 2009], the consistency of an artist’s hand, as proposed
by Morelli, formed the basis of the Pictology method developed by Maurits M. van Dantzig (1903-1960)
[Dantzig Foundation 1973]. The Pictology method has two functions: the identification of markers and
the use of these marker to define the quality of the work. Through the qualitative8 classification proposed
by Dantzig, he developed a systematic method to identify a list of the painting characteristics. Dantzig
observed that these characteristics were more common in the artworks of the great masters and less
common in the work of their followers [Dantzig Foundation 1973]. Dantzig related the spontaneity with
the speed of the stroke and with the confidence that the artist has when he/she is going to draw a line
(which is important in drawings and underdrawings): a true work of art maintains a high degree of
spontaneity; an inferior work, or a forgery, is full of inhibitions [Dantzig Foundation 1973, pg.3].
Figure 1. An example of spontaneity, in this case the rapidity of the movements may be related to the absence of
inhibition (Image taken from www.ascuoladiguggenheim.it)
The presence of pentimenti is another feature usually related with the creative process of an original
artwork. In general, the visual analysis of the painting surface developed by Dantzig is closely related to
the manipulation of the materials: The artist has a nearly infinite number of choices- not just his materials,
colours, composition but the direction, width, and length of each stroke-all of which he handles in a way
specific for him [Dantzig Foundation 1973, pg.4]. Besides this Dantzig shows how the physical properties
8 Dantzig used the term superior for the authentic and inferior for the forgery art works.

14
of the materials affect the visual appearance of the surface. The analysis that Dantzig developed for the
van Gogh paintings and, in particular the analysis of the brush work, is a clear example of how the
materials properties and their handling can lead to surface characteristics. Dantzig identified 93 constant
features for van Gogh’s paintings, including 25 related to brush work. The selection of the support, a
smooth surface instead a rough one, such as the choice of slow-drying and quick-drying paint influence
the appearance of the painting surface [Dantzig Foundation 1973, pg.14].
From his analysis, Dantzig concluded that van Gogh combined long and very short brush strokes;
sometimes the contours of the figures are formed by long brush strokes obtained with one movement.
The horizontal brushstroke is applied from left to right and the vertical in a downward direction. The
pressure varies and heavy pressure is mainly observed in thick layers of paint. The brush was handled
sometimes obliquely and sometimes at a right angle with respect to the canvas [Dantzig 1952, pg.69].
Van Gogh did not mix his paint on the canvas, but applied the colours just as they come out of the tube;
sometimes he squeezed the paint direct from the tube on to the canvas, causing little “worms” or rolls
of paint, the height and size of which varied according to the thickness of the layer of paint [Dantzig
1952, pg.79].
Dantzig argued with his studies on the paintings of van Gogh that the visual appearance of a painting
cannot be considered separately from the materials of the work of art. The warning given by Giovanni
Urbani, former director of the Istituto Centrale del Restauro in Rome, is clear: the determination of the
authenticity exercised only with the appreciation of aesthetic qualities, delegating to the science to
provide simple confirmations, is open to objection and concern [Urbani 2000]. Considering that in art as
well as in archaeology the evidence from the past are not constituted by verbal testimony, but mainly
from objects, the authentication process must verify both the sensitive experience stimulated by the
objects themselves and the characterization of the material dell’arte [Brandi 1977] using experimental
methods [Urbani 2000].
1.2 Computer vision in the conservation field
The application of image processing in the conservation field and in particular, in terms of painting
analysis is quite recent, in the following sub-sections the concept of image processing and the most
important applications of this discipline in the art-historian domain will be introduced.
1.2.1 Digital image processing
The research developed in the first part of the dissertation concerns the application of computer vision
methods in the conservation field. The goal of computer vision research is to provide computers with
humanlike perception capabilities, that means that the computers can understand the sensed data, take
appropriate actions and learns from their experiences to enhance future performance [Sebe et al. 2005].
Machine learning offers methods for computer vision for automating the model acquisition and updating

15
the process: the aims of machine learning is that computer algorithms and systems can improve their
own performance with time [Sebe et al. 2005]. The integration of machine learning techniques in image
processing gives a great benefit to the field. Image processing develops methods that include the
acquisition, the processing and the analysis of digital images. An image may be represented with a two-
dimensional function, f(x; y), where x and y are spatial (plane) coordinates, and the amplitude of f at
any pair of coordinates (x; y) is the intensity or the grey level of the image at that point. We have a digital
image when x;y and the amplitude values of f are discrete quantities [Gonzales and Woods 2001].
Gonzalez and Woods in their book [Gonzales and Woods 2001, pgs.1-2] classified the image processing
into three levels:
Low-level processing, characterized by the fact that both inputs and outputs are images. In this level
are simple operations, called pre-processing, such as the reduction of the noise, contrast
enhancement, and image sharpening.
Mid-level processing is characterized by the fact that its inputs are images, but its outputs are features
extracted from those images, such as image segmentation (partitioning an image into regions or
objects). These kind of processes reduce the image to a form suitable for computer classification.
Higher-level processing involves the objects recognition that in the final stage can lead the program
to perform the cognitive functions normally associated with vision.
The studies performed on painting brushstrokes (Section 1.2.3) are based on the concept of texture,
for that it is important to define the visual texture and the image texture. An image of a real object often
exhibits regions with different intensities. An example could be the image of a wooden surface, it
contains variations in intensities which form repeated patterns; the presence of this non-uniform intensity
defines the visual texture [Rosenfeld 1975; Tamura et al.1978]. The physical meaning of visual texture
include all the characteristics that define the surface properties (such as roughness); often the surface
properties have a tactile quality. On the other hand image texture is defined as a function of the spatial
variation in pixel intensities (grey values) [Tuceryan and Jain 1998]. The Image texture of an image can
be extracted and used to perform a texture classification. The aim of this process is to produce a map
where each uniform textured region is identified with the texture class it belongs to [Varma and
Zisserman 2005]. An image can be also be segmented in terms of the texture information present in it.
Most of the algorithms for texture segmentation are based on two properties of intensity values:
discontinuity and similarity. In the first approach the image is segmented based on abrupt changes in
intensity, such as edge detection; in the second one the image is divided into regions that present
similarity according to a set of predefined criteria [Gonzales and Woods 2001; Awate et al. 2006]. Finally
the textures can be synthetized, this is an important topic in computer graphics where the goal is to
render object surfaces as realistic looking as possible [Tuceryan and Jain 1998].

16
1.2.2 Challenges in art conservation
Large database of artworks are always more common in museum and cultural-institute [Berezhnoy et
al. 2009]. Image documentation of artworks includes, in addition to the digitalization process introduced
in the past years, the use of widespread methods based on a specific range of the electromagnetic
spectrum, such as X-ray images; infrared photography; fluorescence and ultra-violet and the more
recent hyperspectral imaging. All these methods are used to extract information about the painting
materials and techniques. In such techniques, the resulting image is generally interpreted by an art
scholar [Stork 2008] but in the past few years, thanks to the advances in image segmentation, object
recognition and scene analysis, it has been possible to use computer vision to extract information from
the image documentation [Stork 2006].
Stork in his work [Stork 2008] gives an overview of the most recent computer vision techniques and how
they have been used to support research in art. Colour and texture are the two main features used in
painting authentication, the colour and texture features analysed by content-based image-retrieval
techniques allow to express the contents of an image with a vector, simplifying the calculation of the
similarity between images (e.g., Euclidean distance) [Berezhnoy et al. 2009].
As reported by Cornelis [Cornelis et al. 2009] the challenges in the conservation field explored by
computer vision tools were:
Author attribution and authentication, this issues was mainly addressed through the extraction
of texture and colour features that can be used for classification [Lyu et al. 2004; Hendriks et al.
2009; Li et al. 2012; Irfan and Stork 2009; Jafarpour et al. 2009; Polatkan et al. 2009];
Dating, proposing a date or at least a chronology according to a stylistic evolution identified by
the analysis of the brushstroke (see previous point) [Li and Wang 2004; Li et al. 2012];
Object detection, development of an automatic search of an object, such as a person or other
figurative entities, in a large historical image database [Bergboer et al. 2005];
Image enhancement, fusion of information extracted by images acquired using different
wavelengths (such as visible, infrared and X-ray) with the aim to enhance features related to
damage, painting techniques, or historical documentation [Dik et al. 2008; Johnson et al. 2013];
Inpainting, consisting of on the digitally reconstructing missing areas within an artwork
[Fornasier et al. 2009].
In addition to the brushstroke analysis used in classification issues (attribution, authentication and
dating) that will be discussed in the following sub-section, there are two recent applications of computer
vision methods based on art connoisseurship: the first one is related to the detection and analysis of
craquelure. Similar to the case of the brushstroke, in the paintings construction there are many
elements such as support type, ground layer thickness, pigments particle size and type of binder used
in the ground layer that may be inferred from craquelure patterns. For that reason variations in
craquelure may provide information on the nature of the painting [Bucklow 1997]. Automatic methods to
extract craquelure patterns from digital images were developed in a project carried out at the Uffizi
Gallery in Florence where the automatic classification of the craquelure in paintings was used to support

17
damage assessment [Berezhnoy et al. 2009] and more recently in Abas’s work [Abas 2004], where he
used craquelure patterns visible at the surface to classify paintings. The second application concerns
the measure of weave densities in the painting’s canvas. Usually the measurement of weave density
(threads/cm) is performed manually from a radiographic image. Johnson at al. [Johnson et al. 2013]
proposed an algorithm to perform automatic measuring from radiographs of the weaving densities of the
horizontal and vertical threads that comprise the canvas. The results obtained from the analysis of a set
of radiography of van Gogh paintings provide evidence to determine which paintings’ support could have
been cut from the same piece of canvas.
1.2.3 Image processing for brushstroke analysis
As introduced below, the traditional painting surface is characterized by a large number of brushstroke
patterns, created by a series of touches arranged in a specific way. Based on connoisseurship, the
orientation, shape, and distribution of brushstrokes are identified as unique signatures of the painter.
The work of Taylor et al. [Taylor et al. 1999] was of the first in the use of computerized fractal analysis
to detect features from the painting surface and use them to support the authentication process. Taylor
et al. worked on a specific class of paintings, the dripped paintings of the American abstract
expressionist, Jackson Pollock. The analyses developed were based on fractals, a mathematical
structure that exhibits regularities at different scales or sizes. Dripped paintings by Pollock were also
studied by Al-Ayyoub et al. [Al-Ayyoub et al. 2011] through the application of traditional image
measurements for the analysis of Pollock’s works, for instance curvature and fractality features. Al-
Ayyoub et al. applied supervised classification techniques on a data set of 42 paintings by Pollock and
38 by other artists, the best result (85% accuracy) was achieved using a conjunction of six texture
features. Concerning the classified, AdaBoost algorithm showed better results compared with the use
of Support Vector Machine (SVM).
The AUTHENTIC project (2003-2007) funded by the Netherlands Organization for Scientific Research
(NWO) was developed by Igor Berezhnoy, Eric Postma, and Jaap van den Herik with the aim of creating
software tools to support art experts in their assessments of the authenticity of van Gogh’s paintings
[Berezhnoy et al. 2005]. An important contribution to the study ---and in general, in the development of
a new application of computer vision tools in art--- was given by Professor Rick Johnson Jr. at Cornell
University. In 2005, Johnson invited three researchers who were using statistics for image analysis:
Ingrid Daubechies at Princeton University, James Wang at Penn State University, and Eric Postma at
Maastricht University to work on images of van Gogh’s paintings [Sipics 2009]. The goal of the project
was to generate a mathematical and computational characterization of the technique of the Dutch artist,
including brushwork, composition, and colour choices. The results of the project were presented in a
series of workshops with the title IP4AI- Image Processing for Artist Identification, from 2006 to 2010. A
database of 101 high-resolution grey-scale film scans of 82 van Gogh paintings (vG), 6 non-van Gogh,
and 13 which were currently questioned by experts was given to the three mathematical teams [Johnson
et al. 2008]. The groups worked on a patch of images with a size of 512x512, 128x128 or 256x256

18
pixels. To detect texture, geometry, style and fluency of the painting surface, the three groups used
different kinds of wavelets transform and different classifiers. The Penn State group worked on 78
images: 59 images from vG and 19 images of paintings belonging to the other two classes. Textured
features were extracted by 4D wavelets; the classifier that they selected was the Maximum Likelihood
classifier which works with only one class in the training set (the training set was composed by 23 vG
paintings). The classification of the images in the test set was performed considering the distance
between the tested image and the images of the training set: a low average distance indicates a measure
of stylistic proximity to the work of van Gogh. Among the five least similar to vG paintings they correctly
identified 3 images, while among the most similar ones they correctly identified 4 images. The Princeton
group used complex wavelets with a Multidimensional Scaling classifier on a set of 75 images, 65 of
which were vG paintings. They represented all paintings in a 3D space, and calculated the center in the
van Gogh cluster (called CvG): 55 of the 65 paintings by van Gogh were represented close to the CvG,
as well as 2 of the images from no-van Gogh paintings. Gabor filter and Support Vector Machine
classifier were tested by the Maastricht group. They were able to detect dissimilarities in the brushstroke
texture of paintings, and to correctly identify four of the six non-van Gogh paintings included in the
database at the cost of incorrectly classifying two van Gogh paintings [Johnson et al. 2008].
The Gabor filter was used also by Shen [Shen 2009] to perform an automatic classification of a large
western painting image collection (including paintings of Caravaggio, Rubens, Vermeer, Tiepolo, Monet,
Turner and Goya). Shen tested two strategies for feature extraction: the first one, a global visual feature
which include colour analysis, using a colour histogram, texture using the Gabor filter and shape with
the Canny edge detector. The second strategy included the analysis of local visual features; each image
was partitioned into 16 sub-blocks and the Gabor filter was extracted. The best result in terms of
identification accuracy (69.7%) was obtained by joining together the global and local strategies. In this
work the classification was based on RBF (Radial Basis Function) a neural network. In the same year,
Berezhnoy et al. developed an interesting approach to extract brushstroke orientation [Berezhnoy et al.
2009]. The model proposed was based on the Prevailing Orientation Extraction Technique (POET).
Their strategy consists of two stages: a filtering stage and an orientation-extraction stage. That work
analysed 169 digitalized reproductions of paintings by van Gogh, obtained by scanning Ektachronies at
a resolution of 2000 dpi with 48 bits colour depth. The results obtained showed that POET has the same
capacity to distinguish the brushstroke orientation as the observation of the paintings by human
participants.
In 2012 Li et al. [Li et al. 2012] continued the investigation on van Gogh’s brushstrokes and developed
a novel extraction method using an integration of edge detection and clustering-based segmentation.
The analysis of the repetitive and patterned impression of the brushstroke allowed the definition of
features that distinguish between van Gogh’s paintings produced in separate periods in his career: Paris
and the Arles, and Saint-Rémy. The strategy proposed distinguishes his work from those of his
contemporaries. This result is relevant to attribution studies because there are paintings made by artists,
also included in his circle, that were not made as deliberate copies or forgeries but have become

19
mistakenly attributed to van Gogh. While the strategies described achieved good performance for
brushstroke detection, the study of authentication remains a challenge: “the computer doesn’t show
clear separation between the real [van Gogh] and the fake paintings, which is logical because the forgers
really intend to mimic the van Gogh brushstroke”9. For this reason, authenticity studies must be
complemented with analytical characterization of his materials. Given this approach, in this thesis it was
decided to explore the combination of brushstroke information extracted by image processing with the
materials analysis performed using hyperspectral imaging techniques.
1.2.4 Hyperspectral imaging for pigment identification Hyperspectral imaging consists of the collection of a set of images using narrow spectral bands in the
UV, visible and NIR range (imaging spectroscopy). By assembling the images in a data-cube, it is
possible to extract a reflectance spectrum for each pixel of the image. For this reason imaging
spectroscopy may be considered as an extension of Fiber Optic Reflectance Spectroscopy (FORS).
Thanks to the development of Fiber optic technology in the last 20 years, it has been possible to improve
the use of portable instruments in the UV-Vis, NIR and more recently, in the Mid-Infrared regions of the
electromagnetic spectrum. FORS has been widely used in examination of artwork, in particular for
pigment identification [Bacci et al. 2006; Leona et al. 2004], dyes [Montagner et al. 2011] and paintings
[Bacci et al. 2003]. At the same time, significant contributions have been made by the group of John
Delaney at the National Gallery of Washington combining FORS and multispectral imaging for paintings
[Delaney et al. 2010] and illuminated manuscripts [Ricciardi et al. 2011; Delaney et al. 2014].
The characterization of coloured matter by reflectance spectroscopy is usually performed by comparing
the unknown spectra with a database of reference materials. The spectra in the database must be
collected on mock-up paintings prepared following the techniques and pictorial materials used by the
artist as closely as possible [Boselli et al. 2011]. In the case of painting materials, the particle size of the
pigments, the concentration and types of binders could influence the shape of the reflectance spectrum
[Feller 2004]. The absence of a comprehensive database is one of the main limitations of this analysis.
A number of groups have their own reference pigment sets; however, few have a comprehensive set
that has been systematically prepared and measured, such as the online database of CNR-IFAC10,
which contains a collection of a reflectance spectra in the 270-820 nm, 350-100 and 980-1700 nm
ranges.
Considering the extensive number of spectra that can be obtained with hyperspectral cameras, it was
necessary to develop an automatic strategy to analyse it. Chemometric methods for spectral analysis
were proposed by Baronti et al. [Baronti et al. 1997] for the study of 16th-century Italian painting and
9 Mentioned on the on the video “Digital analysis of van Gogh paintings” of Laurens van der Maaten and Eric
Postma, based on the work [Maaten et al. 2009]. The video winner the Most Innovative video Award at AAAI
Conference on Artificial Intelligence in 2008.[http://www.quizover.com/oer/course/2-digital-analysis-of-van-gogh-
paintings-by-laurens-der-videolectures, last login 26-08-214] 10 http://fors.ifac.cnr.it/

20
Comelli et al. [Comelli et al. 2011] for the study of the Italian Renaissance paintings by Masolino da
Panicale. Delaney et al. [Delaney et al. 2010] applied standard remote sensing software (ENVI) to
analyse the multispectral image of Picasso’s Harlequin Musician. ENVI decomposes the spectra into
mutually independent end members. The method described proved to be efficient for identifying groups
of materials based on their spectroscopic characteristics. Since the end members do not necessarily
have any physical meaning, they cannot therefore be compared to the spectra of reference materials
[Liang 2012].
Spectral Angle Mapper (SAM) and Euclidian Minimum Distance (EMD) have been also applied to
compare reflectance spectra with the aim of classifying pigments [Keshava 2004; Pelagotti et al. 2008;
Deborah et al. 2014]. Deborah et al. [Deborah et al. 2014] compared the classification accuracy
achieved by SAM and Spectra Correlation Mapper (SCM). SCM was found to be superior to SAM, as it
enabled the detection of negative correlations between spectra; nevertheless, the SCM method results
were suitable only for homogeneous regions and failed to classify mixed regions.
The analysis of a mixture of pigments is another problem in the interpretation of reflectance data. The
investigation based on the Kubelka–Munk theory provided good results [Zhao 2008] but the method
proposed requires measurement of pigment mixtureswith materials whose absorption and scattering
coefficients are known. Spectral unmixing was developed for the analysis of hyperspectral imaging of
soil. Using the unmixing algorithm, the unknown spectrum is decomposed into a collection of constituent
spectra, called end members, and a set of relative abundances. The term end members corresponds to
familiar macroscopic objects in the scene, such as water, soil, vegetation, etc. The decomposition of the
unknown spectrum can be performed using both linear and nonlinear combination of the end members,
however the linear combination cannot be applied when the components are intimately associated, that
is, when multiple scatterings are involved [Keshava and Mustard 2002].
An important line of research concerns the combination of multispectral imaging with other spectroscopic
techniques. An example is the recent work proposed by Cesaratto et al. [Cesaratto et al. 2013] for the
analysis of a painting on paper by van Gogh. In this work, multispectral imaging is combined with
portable Raman spectroscopy; the analysis of multispectral imaging data was performed with the
Sequential Maximum-Angle Convex Cone (SMACC) and the spectral angle mapper (SAM). The
complementarity of reflectance spectroscopy with the X-ray fluorescence is also well-known [Liang
2012]. This technique allows the determination of the elements present in the painting based on the
interaction of the materials with X-ray; local analysis is performed on an area of a few microns (µ) of
diameter. Some studies have used the combination of hyperspectral images with Energy Dispersive X-
ray Fluorescence (EDXRF) [Liang 2012; Delaney et al. 2014]. Still, to date the correlation between
reflection imaging spectroscopy and EDXRF is performed by the user without an automatic process.

21
1.3 Our Contributions
This work proposes for the first time a method based on data fusion to support authentication processes
of Amadeo’s paintings. The information that are combined concern: the brushstroke and materials
analysis (molecular information). The basic idea of the system used in this work originated from
experience in 2008 [Melo et al. 2008] during the edition of Amadeo’s Catalogue Raisonné [Freitas et al.
2008]. On that occasion, a group of ambiguous paintings were analysed; the visual and technical
information were correlated with the analysis of the materials to aid the decision about their authorship.
That experience defined the key features in Amadeo’s work: brushstroke, colour and materials.
The brushstroke information is extracted from RGB images by Gabor filter. Gabor filter was already used
for the analysis of van Gogh brushstroke [Johnson et al. 2008; Shen 2009] but in this work Gabor was
combined with Scale Invariant Feature Transform (SIFT). By combining these two algorithms we
focused the texture analysis (Gabor) on the relevant keypoint detected by SIFT. Moreover the use of
this localized version of Gabor allowed the application of the Bag-of-feature method, which resulted
appropriate to reduce the problems of having a training set with a small number of images (this problem
is frequent in analysing images from painting collections).
The analysis of the pigments is performed using hyperspectral imaging combined with the analysis of
the elements by X-ray fluorescence analysis (µEDXRF). The use of hyperspectral imaging in painting
documentation is evolving and this technique is increasingly being coupled with other analytical
techniques. X-ray fluorescence analysis has always been considered one of the techniques that best
complement the image spectroscopy, and even more so today with the development of systems of
macro-XRF11. Until now, users would have to manually correlate the results obtained by these two
techniques. For this reason, the semi-automatic method proposed in this thesis offers an important
contribution in this line of research. As introduced above, one of the limitations in the use of reflectance
spectroscopy (FORS or hyperspectral imaging) for pigments characterization is the need of a database
of reference materials as close as possible to the analysed materials; in this work this limitation has
been exceeded using as reference historical paint samples. The reflectance and the elemental data
acquired on the painting are compared with a database collected from samples of paint tubes belong to
the artist. The system develop is also able to detect areas were not perfect match- between the data
collected in the painting and those present in the database- is found. These areas can be related with
the use of pigments not consistent with the pigment palette of Amadeo and therefore areas that may be
not original. The quantification of these areas is combined with the probability of authenticity calculated
by the brushstroke analysis.
11 Macro-XRF allows to perform the scanning X-ray fluorescence analysis [Alfeld et al. 2013].

22

23
CHAPTER 2: METHODOLOGY AND RESULTS
This chapter present the system developed based on the combination of brushstroke and molecular
analysis (Section 2.1). The system was developed using Matlab® programming language. The following
two sections present the strategies proposed for each one of the analysis: the brushstroke detection,
was developed by a combination of Gabor filter and Scale Invariant Feature Transform (Section 2.2);
the molecular examination was performed combining hyperspectral imaging with elemental analysis
(Section 2.3). The results obtained by features combination analysis of 12 paintings are presented at
the end of this Chapter.
2.1 Features combination for painting authentication
As introduced in the previous chapter, the texture of the painting is directly related with the materials
and the techniques used by the artist. For this reason, the tool proposed to support the authentication
process of paintings attributed to Amadeo combines information on texture and materials. Figure 2
shows the overview of the system proposed, where RGB images are used to extract information
concerning the brushstroke [Montagner et al. 2012] and hyperspectral images are analysed to extract
information on the materials (molecular analysis) used in the painting [Almeida et al. 2013; Montagner
et al. 2013].
Figure. 2 Fusion data system overview.
The results obtained by the two analyses are combined using SUM-Combination:
Ia(Am) =® p(B=Am)+(1¡®)Ia(M=Am) (1)
That is, Ia(Am) is a quantitative indicator for authenticity, the value range of the indicator is 0-1 where
0 is Not Amadeo and 1 Amadeo. The indicator is obtained by a weighted sum of the brushstroke
probability p(B=Am) and the quantitative indicator for molecular analysis Ia(M=Am). The coefficient ®
may be chosen by the user considering the weight attributed for each analysis or estimated using the
cross validation method [Browne 2000]. For the Amadeo’s system was chosen a coefficient of 0.5 for

24
each component, this means that the two analysis are considered equally relevant for the authentication
study of Amadeo’ paintings.
2.2 Brushstroke Analysis
The strategy proposed to perform the brushstroke analysis is based on binary classification and depicted
in Figure 3, where the block Paintings represents the database of images used. The selection of the
images was performed in collaboration with Helena de Freitas, art historian expert of Amadeo’s works
and curator in the Calouste Gulbenkian Foundation. The database is composed of two classes, called
positive and negative. The positive class includes 200 images from Amadeo’s paintings from his
Catalogue Raisonnè [Freitas et al. 2008]; the negative class includes 109 images of paintings of
Amadeo’s contemporary artists. In the negative class are included paintings presented at the exhibition
Amadeo de Souza-Cardoso - Diálogo de Vanguardas [Freitas et al. 2006]. This exhibition featured a
large number of international artists that had stylistic correlations with Amadeo, such as Gino Severini,
August Macke, Liubov Popova, Kazimir Malevitch, Albert Gleizes, Lyonel Feininger, Jean Metzinger,
Otto Freundlich, Pablo Picasso, Sonia and Robert Delaunay, Ivan Puni, Olga Rozanova and Franz Marc.
In the negative class are also included images from paintings by Eduardo Viana, Mario Eloy and José
Almada Negreiros, these artists belonged to the Amadeo’s circle.
Figure 3. System architecture for the brushstroke analysis.
To train the classifier and to validate its performance, the database is divided in two sub-sets called
training and the test set, respectively (Fig.3). The training set is used in the learning stage to build the
model, whereas the test set is used in the classification stage. In this stage the image, for which the
model does not know the label, is processed to test the capacity of the model in recognize the class that
the image belongs to. The Feature extraction block (Fig. 3) represents the step where each image of
the datasets is processed to extract texture features. Table 1 presents the four strategies tested in this
step: (1) Gabor filter; (2) Scale Invariant Feature Transform (SIFT) and in addition, two localized
variations of Gabor filter: (3) Gabor in regular point and (4) Gabor in the localization of the keypoints.
Wavelength analysis was used with good results in related work [Johnson et al. 2008; Shen 2009] and
SIFT was chosen because it has been already used with success in image classification [Nowak et al.
2006]. SIFT and the two localized variations of Gabor allowed the employment of the Bag-of-Features

25
model (presented in Section 2.2.2), that demonstrably improved the performance of the classifier. The
classifier used was Regularized Least Squared Classifier (RLSC) (presented in section 2.2.3).
Table 1. Strategies adopted in the features extraction block.
Strategy Feature extractor Bag-of-Features
1. Gabor (1) Gabor -
2. SIFT SIFT
3. Gabor (2) in regular points Gabor
4. Gabor (3) in keypoints SIFT+ Gabor
2.2.1 Image pre-processing and feature extraction
From the literature it is known that images of equal size are more easily compared [Cornelis et al. 2009].
For this reason, before the texture extraction, the size of all the images was reduced so that the smallest
dimension was equal to 512 pixels. In order to preserve the texture information the ratio between the
number of lines and columns of each image was not changed.
Gabor (1)
A Gabor filter is defined as the product of a sinusoid times a Gaussian kernel. The Gabor function is
named after Dennis Gabor who used it in the 1940s for edge detection [Gabor 1946]; later on, John
Daugman [Daugman 1988] proposed this function to describe the spatial response of cells in visual
stimuli experiments and in 1996 Manjunath et al. [Manjunath et al. 1996] proposed the use of Gabor for
texture analysis. In this work a bank of 24 filters with 4 scales and 6 directions, as represented in Figure
4 was used.
Figure 4. Bank of 24 Gabor’s filters used in this work with 6 orientations and 4 scales.

26
Figure 5 shows a representation of the result obtained (C) by the application of the filter at 45° (B) on
the image of the painting Ar livre nù of Amadeo (A) as well as the final convolution of the images obtained
by the application of the 24 filters (D).
Given an image I(x;y), its Gabor wavelet transform is defined to be [Jesus 2009]:
Wx;y =
Z
I(x1; y1)gmn ¤ (x¡ x1; y ¡ y1)dx1dy1 (2)
where gnm indicates the Gabor filter. The image I(x1; y1) will be represented by the mean (¹o;s) and the
standard deviation (¾2o;s) of the modulus of the filtered image, Ww;x. For each orientation o and scale s
the vector
xk =¥¹1;1;¾
21;1; :::;¹Norientation;Nscale
;¾2Norientation;Nscale
¦T (3)
is obtained from the filtered image. The texture features extracted with Gabor are represented as 48-
dimension vectors.
Figure 5. Gabor filter processing, A RGB image of the painting Ar livre nù, Amadeo de Souza-Cardoso (1914); B
scale 4 and 45° filter; C representation of the convolution of the image with the filter (scale 4, 45°); D resulted image
filtered with 24 filters.
Scale Invariant Feature Transform (SIFT)
Lowe proposed this method in 1999 [Lowe 1999] as a way of extracting distinctive invariant features
from images. These features were used to perform reliable matching between different views of an
object or scene. One of the most important properties of this algorithm is that the extracted features are
invariant to image scale and rotation. The algorithm provides robust matching across a substantial range
of distortion: change in viewpoint, addition of noise and change in illumination of the object. SIFT has
been successfully used in several areas [Nowak et al. 2006; Lew et al. 2006; Jesus et al. 2010]. The
strategy proposed by Lowe can be summarized in four steps:

27
(1) Scale-space extreme detection consists in a search over all the scales of the image. It is implemented
by using a difference-of-Gaussian (DoG) function. The aim of this step is to identify potential interest
points that are invariant to scale and orientation.
(2) Keypoint localization: at each candidate interest point (keypoint) a detailed model is built to determine
the stability of this point at the different scales.
(3) Orientation assignment: one or more orientations are assigned to each keypoint location based on
local image gradient directions.
(4) Keypoint descriptor: the local image gradients are measured at the selected scale in the region
around each keypoint. For each image of the database around 2000 keypoints are calculated.
For this work the SIFT descriptor is computed in a region of 16x16 pixels which is divided in 4x4 pixels
blocks. An orientation histogram is calculated with 8 directions in each block. This results in a
representation vector of 128 dimensions (4x4x8). Figure 6 shows the same RGB image processed with
SIFT (left) and Gabor filter (right).
Figure 6. Image processing of RGB image Ar livre nù, Amadeo de Souza-Cardoso, (1914), using SIFT (left) and
Gabor filter (right).
Gabor (2) in regular points
To increase the amount of texture information extracted, each image of the database was divided into
squares of 128 pixels with an overlap of 64 pixels. In case that the dimension of the image was not a
multiple of 128, the remaining part was equally divided in the left and in the right part. The analysis was
performed on each of these parts with the same condition described previously (Gabor (1)).
Gabor (3) in the localization of the keypoint
SIFT was used to detect the keypoints of each image (Figure 7A). Then, an area of NxN pixels around
each key point was selected (Fig.7B) and rotated according to the orientation assignment by SIFT

28
(Fig.7C). Finally, the area was processed with the Gabor filter bank (Gabor (1)) (Fig.7D). It is important
to take into account that not all the keypoints detected with SIFT can be used in this strategy. Indeed, it
is necessary that the distance from the edge of the image and the key point localization should be
greater or equal than N2
. Table 2 shows the number of keypoints detected with SIFT and the number of
keypoints which can be used with Gabor (3) considering an area of 64x64 and 128x128 pixel around
the keypoint. For this work the larger area was chosen for comparison with the strategy Gabor (2).
Table 2. Number of keypoints detected with SIFT and with Gabor (3) on SIFT keypoint analysing an area of
64x64 and 128x128 pixels.
Number of keypoints
SIFT Gabor (3) 64 x 64 128 x 128
Positive Set 384237 246423 184248
Negative Set 174537 122634 93612
Tot 558774 369057 277860
Figure 7. Representation of Gabor (3); A Identification of the localization and orientation of the keypoints; B
Selection of an area around the keypoint; C Rotation of the area in accordance with the orientation detected by
SIFT; D Selection of an area of 64x64 pixels around the keypoint.

29
2.2.2 Bag-of-Features
An intermediate step between the extraction of features and the classification stage is the use of Bag-
of-Features, called also Bag-of-Words. This model was developed in the field of Natural Language
Processing to study the interactions between computers and human (natural) languages and was later
applied to image classification. In the Bag-of-Features each image is considered as a loose collection
of patches (features) collected from both the classes used (positive and negative12).
Figure 8. Representation of the construction of the vocabulary used for Bag-of-Features, positive and negative
patches are collected from the images of the training set belongs to the corresponding classes. Image adapted from
[Maaten and Postma 2009].
The Bag-of-features model requires the creation of a vocabulary using the features extracted from the
images of the training set. The vocabulary must contain positive and negative words (Fig. 8). In this
work the vocabulary was created using clustering analysis, (K-means method which will be presented
in Appendix Part I Ap.I). The number of clusters was selected based on tests presented in the following
section. The features extracted from the images of the test set are compared with the features presented
in the vocabulary; in this way, it is possible to count, how many positive and negative words (features)
are present in each unknown image. Bag-of-Features considers the possibility that a positive image
presents some features that may also be present in a negative image and vice versa.
It is possible to formalize the Bag-of-Features model as follows: given a data-set composed of a set of
N images DB = fI1; :::; INg and a vocabulary Vw = fw1; :::;wMg of words, the Bag-of-Features for an
12 In this work the positive class includes all the paintings of Amadeo and the negative class all the not Amadeo
paintings.

30
image Ik is represented by a histogram that counts the occurrences, of each Wl;k of each w l word in
the Ik picture [Nowak et al. 2006]:
xk(l) =
M¡1X
i=0
Wi;k±(l¡ i) (4)
where ±(l) is the impulse unitary function. To normalize the vector of occurrence, the Term Frequency–
Inverse Document Frequency was applied (more information about TF-IDF in Appendix Part I Ap.II)
[Robertson 2004]:
Wjk =Nl;k
PNl;k
log
µN
nl
¶
(5)
where nl denotes the number of images in which the term l is present and Nl;k is the number of
occurrences of the term l in the k image. Bag-of-Features is very useful in the case of SIFT keypoints
because it reduces the number of features that will go then to the classifier and reduces the imbalance
between the two classes. Using SIFT approximately 2000 key points, with 128 dimensions can be
calculated; Bag-of-Features allows the reduction of this number and the performance of a sort of
normalization, because all the images are described with the same number of features, that is, the
number of words of the vocabulary. Furthermore, this strategy takes into account that an image can
have both negative and positive features. The presence of characteristic features from both of the
classes is expected in paintings made by artists that belong to the same entourage.
2.2.3 Classifier
For the classification stage we used Regularized Least Squared Classifier (RLSC) [Poggio and Smale
2003], a simplified variant of the popular Support Vector Machines (SVM) [Müller et al. 2001], which
provides comparable results. Given a training set:
Sm = f(xi; yi)mi=1g (6)
where y is a label with a value -1 for the negative class and 1 for the positive one, yi 2 f¡1;1g and xi
are the feature vector. This feature vector comes from the algorithms of feature extraction by Gabor and
SIFT. The discriminant function used to define the boundary between the two classes is:
f(x) =
mX
i=1
ciK(xi; x) (7)
K(xi; x) = ekx¡xik
2
2¾2 is a Gaussian kernel; m is the number of training points and c = [c1; :::; cm]T ,
is a vector of coefficients obtained by the least squares method. The minimization of (7) leads to
(m°l+K)c= y where, l is the identity matrix, K is a square positive definite matrix with the elements,

31
Ki;j =K(xi; xj) and y is a vector with coordinates yj. To choose the optimal values for ° and ¾ cross-
validation method was used. The points fxig with f(xi) · 0 are classified in the Negative class and
label as Not Amadeo (yi =¡1), whereas the points with f(xi)> 0 are classified in Positive class and
label as Amadeo (yi = 1) .
2.2.4 Parameters setting and evaluation of the strategy proposed
Due to the specificity of the system developed, based on Amadeo’s features, the evaluation of the
performance of the classifier cannot be calculated using standard existing databases, as done in other
works in computer vision. For this reason, this evaluation was done using test sets and case studies13.
The number of the images used in the database is limited to the number of the paintings made by
Amadeo. Besides that, Amadeo changed brushstroke several times along his career; for this reason,
the selection of the images for the training set was a crucial step. The images selected for the training
set should represent all the different periods of the artist. We selected this set with the help of Helena
de Freitas, an expert on Amadeo’s work. To reduce the number of used images to a minimum, and to
optimize the performance of the classifier, we developed a series of tests based on the following
questions:
(1) The unbalanced number of positive (200) and negative (109) images may influence the
performance? May the number of positive class images used in the training set influence the
performance of the classifier?
(2) The use of Bag-of-Features may improve the performance of the classifier?
(3) Which one of the four strategies (Gabor filter; SIFT and the two localized versions of Gabor) allows
the best discrimination between the images of Amadeo and Non-Amadeo painting?
The first test performed aims to evaluate the role of the number of the positive images (Amadeo’s
paintings) in the training set. Nine training sets were built keeping the number of the negative images
constant (60) and changing the number of positive images (from 62 to 105). The other images were
used in test sets to evaluate the performance of the classifier. Figure 8 shows the performance of the
classifier expressed as a percentage of correct answers (% Hits) versus the number of the positive
images in the training set. The green lines indicate the percentage of the images of Amadeo’s paintings
that were correctly classified, while the red lines the Not Amadeo images correctly classified. In Figure
8A the texture features were detected using Gabor filter and in Figure 8B using SIFT. It is important to
remember that by using SIFT it was possible to apply the Bag-of-Features strategy.
13 Four paintings attributed to Amadeo but not included in his Catalogue Raisonné were used as case studies in
Part III of this thesis.

32
Figure 9. The performance of the classifier while changing the number of positive images in the training set, %Hits
means the number of painting images correctly classified: the images of the positive class (Amadeo) correctly
classified are represented by the black lines; the negative class (Not Amadeo) by the dot lines. A The texture
features are extracted using Gabor filter; B the features are extracted by SIFT using the Bag-of-Features model.
The test performed using Gabor (Fig. 9A) shows by increasing the number of positive images in the
training set the classifier increases the number of positive images correctly classified; however, at the
same time, it reduces the capacity to classify negative images. That may be explained as a sort of over
fitting due to the large number of images of Amadeo’s paintings used, compared to the number of Not
Amadeo. The over fitting produces an excess of false positives (that is, images belonging to the negative
class classified as positive). In the case of the tests performed using SIFT (Fig. 9B) the number of
positive images in the training set does not influence the performance of the classifier directly because
the Bag-of-Feature model, based on a vocabulary of words, allows the reduction of the unbalance
between the two classes. The performance obtained with the four strategies proposed (Gabor filter;
SIFT and the two localized versions of Gabor) were tested through the second test. Also in this set of
tests, the number of the negative images was kept constant: 60 images for the training set and 49 for
the test set, while the number of positive images was changed according to Table 3. The performance
of the classification is expressed with accuracy, as follows:
Ac =Tp + Tn
(Tp + Tn + Fp + Fn) (8)
where Tp is true positive; Tn is true negative; Fp is false positive and Fn is false negative.
Table 3. Number of positive images in the training and test sets.
Test Training set Test set
#1 62 138
#2 84 116
#3 105 95

33
Table 4 shows the results obtained using the four strategies for feature extraction. In the Table, “Hits”
refers to the percentage of Amadeo’s images correctly classified. From the tests it is clear that the use
of localized variants of the Gabor filter (Gabor (2) and (3)) improves the performance of the classifier,
obtaining an accuracy > 90%. The test performed using Gabor (2) and (3) give results slightly better
than those performed with SIFT and Gabor (1), with an accuracy between 91% and 94%.
Comparing the different test sets (# 1, 2, 3) we can see, as expected, that the increment of the positive
images in the training set in Gabor (1) improves the classification of the images of Amadeo’s painting
but at the same time increases the number of false positives. In the case of Gabor (1), to correctly detect
the textures in Amadeo’s paintings, the classifier requires a large set of images in the training set. In the
three cases where we used the Bag-of-Features strategy (SIFT, Gabor (2) and Gabor (3)) the classifiers
seem to be more invariant to the learning stage. These results confirm those obtained in the previous
one, as showed in Figure 8.
Table 4. Evaluation of the performance of the classifier using: SIFT; Gabor (1) in a global approach; Gabor (2) in
regular points and Gabor (3) in the localization of SIFT keypoints. Hits refers to the percentage of Amadeo’s
paintings correctly classified.
Test % SIFT* Gabor (1) Gabor (2)* Gabor (3)*
#1
Hits 91 65 97 97
False Positive 24 20 14 10
Accuracy 83 73 92 93
#2
Hits 95 87 99 97
False Positive 29 43 12 12
Accuracy 84 72 94 93
#3
Hits 98 97 100 99
False Positive 25 61 18 14
Accuracy 86 68 91 92
* Use of bag-of-features model, choosing 1000 positive and 1000 negative words.
The third test performed concerns the selection of the best number of features that can be used to create
the vocabulary. The number of features is determined by the number of clusters used in the K-means
method. Table 5 shows the results obtained with this set of tests: we always used the same training and
test sets and the number of clusters were changed to select the positive and the negative words in the
Gabor (3) strategies. The results obtained show that the performance of the classifier is partially
influenced by the number of features used by the Bag-of-Features; increasing the numbers of features
the accuracy increase until it reaches a plateau around 95%. After this value by increasing the number
of features does not increase the accuracy of the classifier.

34
Table 5. Evaluation of the role of the number of clutters in the construction of the vocabulary in bag-of-features
strategy. The value indicated is the sum of the positive and negative word with the same proportion 50:50.
Words
100
200
400
1000
1200
1400
1600
2000
Accuracy (%)
67
74
82
90
95
93
94
95
Based on the tests performed, it is possible to give some answer to the question formulated at the
beginning of this sub-section: the number of the positive images in the training set has a role in the
accuracy of the classifier; the performance of the classifier can be improved using the Bag-of-Feature
strategy by choosing a balanced number of positive and negative words. In the case of Gabor (1)
increasing the number of images of Amadeo’s paintings increases also the number of false positive,
which do not happen using the SIFT strategy; for that reason it can be seen that Bag-of-Features
improves the correct distinction between positive and negative class images reducing the number of
false positives. The selection of the number of features to be used in the Bag also has an influence on
the classification; a larger number of features does not necessarily mean better results. Finally, the two
localized variants of Gabor, that Gabor analysis performed in regular points and in the localization of
SIFT keypoints, show better results when compared with Gabor (1) and SIFT.
2.3 Molecular Analysis
Besides texture, colour is considered as one of the most relevant features in the works of Amadeo: the
impact of his [Amadeo’s] paint stems, largely, from the combination of the maximum energy of the forms
with the maximum power of colours [Gonçalves 2006]. Hyperspectral imaging in the visible range
allows for an accurate reproduction of the colours of the painting. Moreover, this technique performs a
spectroscopic analysis over all the surface of the painting. Based on the spectral features is possible
the characterization of the pigments present in the painting. The camera used for this work is a low-
noise Peltier-cooled digital camera (Hamamatsu) of the Centre of Physics of the University of Minho in
Portugal. The camera works in the visible range between 400 and 720 nm, with a resolution step of 10
nm, which means that for each painting are acquired 33 images. Assembling these images are obtained
a data-cube (Fig. 10). The third dimension of the cube is the intensity assumed by the 33 pixels with the
same coordinates in the 33 images. This intensity is used to calculate a reflectance spectra (one for
each pixel). The RGB colours used to visualize the final image are calculated from the reflectance
spectra that guarantee a colour reproduction more accurate comparing with the normal digital camera.

35
Figure 10. Representation of the hyperspectral imaging data-cube, the hyperspectral analysis includes the visible
range between 400 to 720 nm. For each painting 33 images with a spectral resolution of 10 nm were acquired. In
this way, a data-cube of 1344 x 1024 x 33 is created, where the first two dimensions are the spatial resolution of
the images (expressed in pixels) and the third dimension is the reflectance value of each pixel in the 33 images.
From the data-cube it is possible to extract a reflectance spectra for each one of the pixels of the image.
In the developed system the hyperspectral imaging data are combined with the information concerning
the chemical elements present in the paint. This information is extracted by X-ray fluorescence
technique (µ-EDXRF). The elemental analysis was chosen as a complementary technique to
hyperspectral imaging. µ-EDXRF is an in-situ technique that allows a rapid analysis on different areas
of the painting. This technique is quite effective to detect or to exclude the presence of elements that
may be related to the use of pigments not coherent with those used by Amadeo. The use of elemental
analysis overcomes some limitations in the use of hyperspectral imaging to perform pigment
characterization; such as the difficult in the discrimination between vermilion and cadmium orange or
between blue cobalt based pigments. Another limitation in the use of hyperspectral imaging (and in
general in reflectance spectroscopy techniques) is that the interpretation of the spectra is usually
performed by comparing the unknown spectra with a database of reference materials. To solve this
problem it was used a database of reference materials most representative as possible of the materials
used by Amadeo. The database is composed by 16 samples from historic oil paint tubes. The selection
of the reference materials was based on the previous study on the materials and techniques of Amadeo
[Melo et al. 2008; Melo et al. 2009]. Comparing the information extracted from the painting with that
collected in the database of reference materials it is possible to detect the pigments present in the
painting but also the areas made using pigments not included in the database. In the features
combination step (Section 2.4) the quantification of the areas where the system detected the presence
of pigments don’t included in the database of reference materials is used to calculate the indicator of

36
authenticity Ia(M=Am) based on the materials information. This indicator is add (in Equation 1) to the
probability of authenticity calculated from the brushstroke analysis.
One of the outputs produced by of the system is a mapping of the pigments detected in the painting.
The mapping image is in false colours: in areas with the same colour the system detected the same
pigment or mixture of pigments. The user can select a pixel from the mapping image and see which
pigment(s) the system detected in it or the user can visualize the distribution of a specific pigment(s)
selected from a list.
The results obtained by the developed system were compared with those obtained by K-means cluster
method14 (an unsupervised strategy) that is used to perform the analysis of the hyperspectral image
(Section 2.3.6).
2.3.1 Painting system
Figure 11 shows the overview of the system proposed, the input data used by the system are: the
hyperspectral images and the chemical elements (acquired by µ-EDXRF) of the paintings and of 16
samples used as database of reference materials. The database represents the materials used by
Amadeo (more information below). The core of the system is composed of 3 steps. In step 1 the
algorithm detected: (i) the areas painted with materials that are not present in the database of reference
materials (these areas are called the Not Amadeo areas); (ii) the areas where the elemental analysis is
missing15 (these areas are called the Not analysed area); (iii) the black and white areas. In steps 2 and
3 to each pixel of the hyperspectral image is attributed a pigment or a mixture of pigments. That part is
performed by comparing the reflectance data and the elemental information acquired on painting with
those present in the database of reference materials. To compare the unknown reflectance spectra with
the database we used a combination of two popular metrics [Keshava 2004; Pelagotti et al. 2008]
Spectral Angle Mapper (SAM) and Euclidian Minimum Distance (EMD).
The output of the system is mapping image where the areas painted with the same pigments are
represented with the same colour. Besides that, is reported in a table jointly with the image the
percentage of the area occupied by each pigment or mixture as well as the areas that may not be original
(Not Amadeo) or where part of the data are missing (Not analysed). The percentages of these areas
are used in Equation (1) to calculate the quantitative indicator for molecular analysis Ia(M=Am).
14 More information on K-means cluster method in Appendix Part I. Ap.I 15 The selection of the points for the elemental analysis is preceded by the observation of the painting by naked eye
and by microscope. Some areas may not be included because they are considered consistent with other areas
already selected.

37
Figure 11. System overview of the combination of hyperspectral imaging and elemental analysis.
Paint tubes samples database
As referred before to characterize the pigments present in the paintings is used a database of reference
materials from paint tubes. The paint tube samples were digitalized by hyperspectral camera and
analyzed by µ-EDXRF. Table 6 shows the 16 oil paint tubes16 chosen to create the database. The
database represents the paint materials used by Amadeo between 1912 and 1916. The selection of the
pigments used as reference materials was based on the analysis of 19 selected paintings produced by
Amadeo between 1912 and 1917; as well as 31 oil paint tubes from two paint boxes belong to Amadeo
and preserved in Manhufe at the Family house of the artist. The paintings and the paint tubes were
analysed at the time of the edition of the Catalogue Raisonné of Amadeo (more information in Part II,
Chapter 1, Section 1.1.3) [Melo et al. 2008; Melo et al. 2009]. The reflectance spectra from the selected
paint tube samples (acquired by hyperspectral camera) were compared with those collected on the
Amadeo’s paintings to guarantee that the spectral features extracted were comparable. The reflectance
spectroscopy analysis in the visible range is not able to detect the presence of fillers or additives in the
16 The paint tubes were previously analyzed also by FORS; µ-FTIR, µ-Raman and HPLC in [Melo et al. 2009; Silva
et al. 2011 Montagner et al. 2013b].

38
paint. The spectra features used to characterize the samples are related to transitions that occur
between energy levels that interest the metal atoms (for inorganic) or molecular orbitals (for organic) of
the pigments. For these reasons, even if there are differences in term of paint formulation, between the
paints of the database and those used in the paintings, these differences do not affect the identification
of the pigments used by the artist. From the 16 oil paint tubes used as reference materials (Table 6): 13
were selected from those conserved in the Amadeo’s house and 3 are from a paint box that has been
used by the Portuguese painter Columbano Bordalo-Pinheiro (Lisbon 1857-1929). The Columbano’s
tubes belong to the collection of the Museu Nacional de Arte Contemporânea do Chiado in Lisbon and
were analysed in the context of the Crossing Borders project at DCR-FCT; part of the analyses are
published in Silva et al. [Silva et al. 2011] and Montagner et al. [Montagner et al. 2013b]. The reflectance
spectra acquired on the 16 reference materials are presented in Appendix Part I Ap.V.
Table 6. Set of oil paint tube used to create the database of reference materials.
Pigment Paint tube*
Cobalt violet ASC13 – Lefranc §
Vermillion MG6 - Winsor & Newton §
Carmine lake ASC14 – Lefranc §
Terra rossa MG18 - Rembrandt Oil Colors §
Raw Siena MG7- Winsor & Newton §
Ochre yellow MG11 - Winsor & Newton §
Chrome yellow ASC17- Lefranc §
Cadmium orange MG2 - Winsor & Newton §
Cobalt blue MG4 - Winsor & Newton §
Cerulean blue ASC7 - Winsor & Newton §
Prussian blue ASC19 - Winsor & Newton §
Ultramarine 21_3130 - Winsor & Newton
Viridian ASC20 – Lefranc §
Emerald green 20_3128 - Morin et Janet
Lead white 10_3130 - Paul Denis
Ivory Black MG17- Winsor & Newton §
* Paint tube samples from the Family house of Amadeo studied in [Melo et al. 2008]. With ASC the samples take
from the oil pant tubes from the box with the ‘Amadeo’. With MG the samples take from the oil pant tubes from the
box with the ‘Maria da Graça’ [Melo et al. 2009].
§ Samples studied in [Melo et al. 2008].
Paint tubes belonged to the Portuguse artist Columbano Bordalo Pinheiro (1857-1929), the paint tubes are from
the collection of the Museu Nacional de Arte Contemporânea do Chiado (Lisbon). The paint tubes were analysed
at DCR-FCT, part of the characterization was published in [Silva et al. 2011].
39
2.3.2 Painting data and pre-processing step
Each painting was digitalized using hyperspectral camera in the range 400–720 nm, with a resolution
step of 10 nm. The data for each painting can be represented in a matrix M x N x W, where M and N
are the spatial resolution of the images and W represents the 33 values of reflectance over the spectral
range (Fig.10). The samples used as reference materials (each sample was applied on a glass slide)
were digitalized using the same set-up described above. For samples we calculated the average
spectrum considering an area of 5x5 pixels. To improve the comparison between the reflectance spectra
acquired from the painting and those present in the database it was used the first derivative. The first
derivative allows us to point out the inflection point of the reflectance bands; that is usually an important
feature in the interpretation of this type of spectra. Because spectra are acquired stepwise, usually they
must be smoothed for the calculation of their derivatives. Various algorithms are available for this
purpose; we selected the method of Savitzky and Golay [Savitzky and Golay 1964]. This method uses
a least-squares methodology to fit a polynomial curve into a set of contiguous data points (usually from
13 to 31, in our case 9 points were used) and calculates the ordinate at the central value of the abscissa
(wavelength).
Relating to the elemental analysis, each samples used as reference materials was analysed in three
points. The number of points of analysis for a painting change depending on the number of colours and
the dimension. In the paintings studied in this work were collected between 30-100 points for each
painting. One on the main problems in combining hyperspectral and elemental analysis was that µ-
EDXRF is a local analysis; for this reason, it was necessary to define a strategy that allowed the
extension of the results obtained by the analysis of a limited number of points over the entire painting
surface. We thus created a matrix where the user introduces the elements detected by the µ-EDXRF
jointly with the colour parameters (CIEL*a*b*). The colour parameters are calculated from the
reflectance spectra (extracted by the hyperspectral image) in the same area of analysis17. The user
introduces in an Excel file only the elements responsible for providing the colour of the pigment; this
means that elements that could be related to the preparation layer or to the presence of fillers. Table 7
shows an example of the table produced by the user to introduce the data.
Table 7. Example of the Excel file used to introduce the chemical elements and the corresponding L*a*b* values.
Point Elements L* a* b*
Am 1c Cr 74,6 -3,22 53,7 Az 1a Fe,S 25,7 6,89 -27,1 C1 a Cr,Fe 54,5 13,6 49,2 … … … … …
17 The colour parameter are calculated by the reflectance spectra assuming the CIE D65 illuminant and a 10° standard observer (CIE 1964) [Feller 2004]. More information in Appendix Part I Ap.III.

40
The elemental information is then organized in the following structure:
XRFel = fel1; el2; :::; elPg (9)
where P is the number of points where the analysis was performed and elp= fsq1; sq2; sqkg is the list
of the chemical elements detected on the painting. To extend the local chemical analysis introduced by
the user to all the painting surface, we assume that pixels of the hyperspectral image with the same
(CIELAB) values are made with the same material: the list of the elements detected for each point of
analysis was considered valid for all the pixels of the image with close colorimetric data, following:
9x 2XRFlab : Labi ¸ (x¡c)^Labi · (x+c) (10)
where c is a constant that defines the interval of the colour margin. The selection of the value of c is a
crucial step in the strategy proposed below. For this reason its value was selected based on
experimental tests (Section 2.3.4). In addition, in the fragment image obtained at the end of the analysis
all the areas in which the elemental analysis has not been done or where there is a mismatch between
the colour of the pixels and the colorimetric values introduced by the user in the matrix, will be highlighted
(Not analysed area in Section 2.3.3). In that way, the user can check and analyse what type of error
was made. In the meantime these faulty areas will not be considered in the analysis of the pigment.
2.3.3 Pigment analysis
Step 1: Area identification
Figure 12 shows the diagram of the first step, in which the algorithm detects three areas: (1) called Not
analysed area, corresponds to the pixels in which the X-ray fluorescence analysis was not performed
(in pink in Fig.12). That selection avoids performing the classification based on incomplete analytical
data. The area (2) called Not Amadeo, includes the area painted with pigments that are not included in
the Amadeo database, that is, probably not the original areas (in violet in Fig.12). The area (3) includes
the white and black pixels (in black and white in Fig.12).
To detect the white and black areas all the reflectance spectra of the hyperspectral image are compared
with two reference spectra of white and black sample from the paint tubes: lead white and carbon black
respectively. The comparison is performed using SAM, Spectral Angle Mapper (more details in Step 2).
SAM computes the angle between the unknown spectra and the reference and then all the unknown
pixels whose angle is lower than a threshold defined by the user are classified in agreement with the
reference spectra (black or white); the others are considered unclassified, that is, coloured pixels. The
threshold was defined experimentally by a parameter sweep; that is, the value of the threshold was
adjusted by sweeping the parameter values through a user defined range. The tests are presented in

41
Section 2.3.5. All the pixels that do not belong to Not Amadeo, Not analysed and black and white areas
will not be further classified. The other pixels (shown in grey in Fig. 11) will be analysed in Step 2.
Figure 12. System overview of Step 1 where the areas are mapped that could not have been painted by Amadeo
(violet) and those where the analysis was not performed (pink). The other pigments are considered unclassified
and will be analysed in Step 2.
Step 2: Pigment Identification
In this step (Fig. 13) and in the following, each pixel of the hyperspectral image will be classified
according to its similarity with the spectra of a pigment that constitute the reference database or with a
mixture of those. The similarity between the derivative of the unknown spectra and those present in the
reference database is calculated using a combination of Spectral Angle Mapper (SAM) and Euclidian
Minimum Distance (EMD) (Fig. 14).
Figure 13. System overview of Step 2, where by comparing the reflectance spectra form the painting with those in
the reference reflectance database we compute the first pigment attribution. This attribution can be confirmed if the
elements detected in the paint area are consistent with those corresponding to the proposed pigment. If the
attribution is not confirmed then the pixel is considered unclassified and goes to Step 3.
SAM and EMD are two of the most popular metrics used to compare reflectance spectra [Pelagotti et
al. 2008]. In both cases, the spectrum is considered as a vector: EMD measures the distance between
the two vectors (blue line in Fig. 14), while SAM considers the dimension of the angle between them. In

42
both cases, it is possible to impose a threshold to define the limit of similarity. It is important to take into
account that SAM is insensitive to illumination changes because it uses only the vector direction and
not the vector length [Pelagotti et al. 2008]. On the other hand, the sensitivity of EMD to illumination
changes may provide an excessive number of clusters, thus making their interpretation quite difficult.
Figure 14. Representation of the measure of the distance between two vectors using Euclidian Minimum Distance
(left) and Spectral Angle Mapper (right).
The combination of SAM and EMD is based on the method of matching proposed by Lowe [Lowe 2004].
The first step consists of calculating the angle ® between the spectrum of the pixel p of the HS image
and the reflectance spectra for each reference material r present in the database:
®p;r = cos¡1
2
4
Pn
i=1 Rp;iRr;iqPn
i=1 R2p;i
Pn
i=1 R2r;i
3
5 (11)
Where n is the number of values in the reflectance spectra (in our case 33); Rr;i is the value of the
derivative of the reference spectrum r in the wavelength i .Then, we sort all the materials by ascending
order; finally the pixel p is labelled according to material 𝑟1 if the angle ®p;r1 is inferior to a percentage
Px of the second lower angle ®p;r2 :
®p;r1 <Px ®p;r2 (12)
The pixel is labelled according to the material whose spectrum is lower or equal to the threshold;
otherwise, the pixel will be labelled as unclassified. For the pixels not classified by SAM, the similarity
will be re-calculated using the Euclidean Minimum Distance, as described above:
EMDp;r =
vuut
nX
i=1
(Rp;i ¡Rr;i)2 (13)

43
The first attribution based on the reflectance spectra will be confirmed by relying on elemental analysis
performed on the painting. The algorithm compares the elements that characterize the pigment
proposed (first attribution) with the elements detected by X-ray fluorescence in the corresponding area
on the painting. If the hypothesis proposed is consistent, that is, if the element(s) detected on the painting
are the same as the pigment proposed, then the pixel will classified according to the given assignment;
otherwise, if this condition is not satisfied, the pixel is defined unclassified and passes to Step 3.
Step 3: Mixture Identification
In this step (Fig. 15), the algorithm classifies the pixels that belong to a mixture of pigments. Based on
the elemental analysis performed on the painting, the algorithm makes a selection of pigments and
calculates all the possible mixtures considering the following proportions 100%:0%; 90%:10%;
80%:20%; 70%:30%; 60%:40%; and 50%:50%. For each mixture, hypothetical reflectance spectra of
the mixture are computed as a linear sum of the spectra of the pigments. The mixture and their
hypothetic reflectance spectra constitute a new database, which will be used to classify the pixels
hitherto unclassified. The similarity between the spectra and the database of mixtures is calculated using
SAM.
Figure 15. System overview of Step 3. The reflectance spectrum of the unknown pixels is compared with a set of
spectra of mixtures.
2.3.4 Image mapping
Based on the analysis performed on the three previously described steps, the system is able to
associate one label to each pixel in the hyperspectral image. The possible labels are: black; white; Not
analysed and Not Amadeo; one of the pigments presented in the database or one of the mixture made
by the pigments presented in the database. The output of our system consists of an RGB image in which
all the pixels within the same label are represented with the same colour. Therefore, the colours of the
segmented image do not aim to reproduce the colours of the painting; the goal of the RGB image is to
map the distribution of the different materials. The RGB colours used in the false colour image are
selected as follows: the pixels labelled as black and white are represented by the corresponding RGB
values (0 0 0 and 255 255 255); the Not analysed and Not Amadeo pixels can represented with colours
selected by the user. Colours are chosen that are easily recognizable and different from those present

44
in the painting. All those pixels labelled according to a pigment present in the database are represented
by the RGB values calculated from the reflectance spectrum of the corresponding pigment. The same
method is used in the case of mixtures of pigments.
In addition to the image, the system produces:
- A table that reports the pigments or mixtures and the percentage of the area they occupy
considering the area of the painting analysed.
- The percentage value of the Not Amadeo and Not analysed areas.
- The user has the possibility of visualizing the mapping of the areas where the system detected
the presence of specific pigments or specific mixtures of two or three pigments.
- The user can select a pixel and check which pigment(s) was detected in it.
Figure 16. A Selection of a pixel (291; 304) in the segmented image; B mapping of the areas where vermilion and
chrome yellow were detected.
Through the coloured image the user can made a preliminary check of the answer proposed by the
system. The user also has the possibility of selecting a specific pixel and of checking which pigments
were detected in it (Fig.16A) or, can chose a pigment or a mixture (with a maximum 3 pigments) and
visualize the distribution of these pigments in the painting (Fig.16B).
2.3.5 Setting up the parameters
In the system developed there are two parameters that may significantly influence the classification of
the pixels of the hyperspectral image. The values for these parameters were chosen through tests
presented below:
(1) the value c in the pre-processing data, Equation (10);
(2) the threshold (Px) for the SAM analysis used in Step 1, Equation (12).

45
(1) The parameter c (Equation 10) is used in the pre-processing step to extend the elemental analysis
(EDXRF) to over all the surface of the painting, assuming the same elements for the pixels with close
L¤a¤b¤ values. The value c defines the interval of colour tolerance. Considering Equation 10, it is
possible to write the colorimetric values of two candidate pixels as:
L¤2 = L¤1 + c ; a¤2 = a¤1 + c ; b¤2 = b¤1 + c
the difference (∆𝐸) between two colours in the 𝐿∗𝑎∗𝑏∗space is calculated as [Feller 2004]:
∆𝐸 = √(𝐿2∗ − 𝐿1
∗ )2 + (𝑎2∗ − 𝑎1
∗)2 + (𝑏2∗ − 𝑏1
∗)2 (14)
To define the parameter c it was selected a set of pixels from the Mucha hyperspectral image; their
𝐿1∗ 𝑎1
∗𝑏1∗ values were introduced in Equation (10); then 20 values of 𝐿2
∗ 𝑎2∗ 𝑏2
∗ it were calculated changing
the parameter c in the range from 1 to 20. Figure 17 shows two examples of the tests performed, using
two pixels from orange and blue areas; Figure 17 shows the mapping of the pixels that satisfied the
Equation (10) changing the value c from 13 to 18. The percentage of the area mapped in each image
and the corresponding ∆𝐸 (calculated from Equation 14) is also presented. The value chosen for c was
14: that value allowed the selection of only the pixels with a colour very close to the test sample. The
value was selected by comparing the mapping obtained using different coloured samples.
(2) In Step 1 the white and black areas are selected by comparing all the reflectance spectra of the
hyperspectral image with two reference spectra of white and black from the paint tubes: lead white and
carbon black, respectively. The comparison between the spectra is performed using SAM (Section
2.3.3). The threshold (Px) in Equation (12), used to define the similarity between the angles is crucial
to avoid coloured pixels being classified as white or black and excluded from Steps 2 and 3. The
threshold (Px) was adjusted by a sweeping parameter method: from 14 paintings of Amadeo we
selected 122 areas of 3x3 or 5x5 pixels from known white, black and coloured areas. 61 of these areas
were used as a training set; the value of the threshold was changed from 0.01 to 5 with a step of 0.01.
The values that allowed the correct classification of larger number of white, black and coloured pixels
were used in a set of 122 areas (test set) selected from the same paintings. The test was performed on
1722 pixels: 400 white; 425 black and the remaining coloured. The best threshold was 4: it allows a
correct classification of 100% of the black and white areas and 87% of the coloured areas.

46
Figure 17. Tests performed to define the best values for the interval of colour tolerance (c) in the pre-processing
step. The two points (orange and blue), indicated in the coloured image of the painting Mucha (1915-16) were used
as samples in the tests. In white are mapped the pixels that satisfied the Equation10 considering the different values
of c indicated close to the image. The ∆𝐸 indicates the difference between the sample pixel and those mapped in
white. The percentage indicates the portion of the area mapped in white.
2.3.6 Evaluation of the strategy proposed
To evaluate the out-put made by the proposed system we used the analysis of Amadeo’s painting Mucha
(1915-16), the mapping obtained by our system was compared with those obtained using k-means
cluster strategy (more information about k-means method in Appendix Part I Ap.I. The analysis of the
reflectance spectra and the elemental data acquired in Mucha painting is presented in Appendix Part I
Ap.IV). Along with this, will be presented the analysis of the false painting called DCR (2013). This
second painting was prepared in our laboratory using both materials present in the Amadeo’s palette
and pigments introduced in to the market after the death of the artist.
Figure 18C shows the original RGB image of the Mucha paintings that was analysed using k-means
clustering method (Figs 18A and B) and using our segmented method proposed in this chapter (Fig.
18D). With k-means clustering, SAM was used to calculate the spectra angle between each centroid of
the clusters and the pixels of the images. All the angles calculated were sorted by ascending order. If
the first and the second angles follow the condition in Equation (12) then, the pixel is included in the
cluster corresponding to the first angle. The algorithm produces an image mapping in which all pixels
that belong to the same cluster are visualized with the same RGB values. The RGB values are calculated
from the reflectance spectra of the centroid of the cluster. Observing Figures 18A and B it is clear that
the classification based on k-means is strongly influenced by the number of clusters chosen, 15 and 70
clusters, respectively. The image obtained using 70 clusters shows a region segmentation closer to the

47
original image when compared to that obtained using 15 clusters. This method performs a mapping of
the pixels with similar reflectance spectra but it does not provide information about the pigments present
in the painting. Comparing the segmented image calculated with our method (Fig. 18D) we can see that
it is closer to the original by comparing with those obtained by the cluster analysis. It is important to
remember that the RGB values used in our segmented image are computed starting from the reflectance
spectra proposed by the classifier; in that way, the visual output is a simple and efficient way to evaluate
the results obtained by the system and it is accessible for people with different background. We chose
pink to colour the Not Analysed area and purple to colour the Not Amadeo area. Figures 18E and F are
another example of the segmented image obtained by the analysis of a painting prepared in our
laboratory, DCR (2013). In this case, by analysis of the materials a large area was detected
corresponding to Not Amadeo (coloured in purple in Fig.18F). The percentage of the areas are
presented in Table 8.
Table 8. Percentage of the coloured areas detected by pigment analysis on Mucha and DCR paintings.
Area (%) Mucha DCR*
Not Analysed 4.2 3.5
Not Amadeo 0.0 41.5
Amadeo 95.8 55

48
Figure 18. Mucha painting (1915-16) and DCR (2013) C and E RGB images of the paintings; k-means cluster
analysis of Mucha using A 15 clusters; B 70 clusters; segmented image obtained with our system D Mucha F DCR,
the Not Analysed is coloured in pink and the Not Amadeo in purple.
To evaluate the quality of the reflectance spectra proposed by the classifier for the analysis of Mucha
we selected a few spectra and compared them with those acquired from the painting. More information
on the results of the analysis of this painting are presented in Appendix Part I Ap.IV.

49
Figure 18C shows the point where it were collected the spectra presented in Figure 19. According to
our analysis the yellow, orange and red shades (indicated in Fig.18C with the letters Y, O and R) were
painted using different amount of chrome yellow (PbCrO4) mixed with vermilion (HgS) (Fig. 19C and D).
Figure 19C gives an example of reflectance spectrum measured in the area Y (solid line) and the
spectrum proposed by our method (dashed line). Chrome yellow is also used in mixture with viridian
(Cr2O3.H2O) to obtain the green tone of the area G (Figure 18C). The spectrum collected in the green
area of the painting and that proposed by the system are show in Fig. 19B.
Figure 19. Comparison between the measured reflectance spectra on Mucha hyperspectral image (solid lines) and
proposed by our system (dashed lines). The point of analysis are indicated in Figure 18C; A Cobalt blue pigment
detected in area B1; B Mixture of viridian and chrome yellow detected in area G1; C Mixture of chrome yellow and
vermilion detected in area Y; D Mixture of vermilion and chrome yellow detected in area R.
As described before the system developed combine the elemental and the molecular information
acquired using EDXRF and reflectance spectroscopy (hyperspectral imaging), the combination of these
two techniques overcomes the limitations of the two techniques when they are used alone. An example
of limitation concern the discrimination of chrome yellow from viridian using EDXRF in our system. That
limitation is related with the element that are introduced in the system; both of the pigments are
characterized by the presence of Chromium (Cr). This sort of limitation in the use of the EDXRF data is
overcomes by the analysis of the reflectance spectra: the spectral features of the two pigment are
sufficient to obtain a correct identification.

50
The example of the analysis of the Blue area, B in Figure 18C, shows the opposite case: in this area the
reflectance spectroscopy (Fig. 19A) indicated the presence of a cobalt based pigment, but it is not able
to discriminate between cerulean blue (CoO.nSnO2) and cobalt blue (CoO). The reflectance spectra of
these two pigments are characterized by the presence of a broad reflectance band between 430-550
nm [Boselli 2010]. On the other hand the elemental analysis allows the discrimination of the two
pigments thanks to the presence or to the absence of the tin element (Sn). In this case the elemental
information guarantees a correct identification of the materials present in the blue area.
2.4 Features combination: results
The fusion data is computed using SUM-Combination technique (as shows in Equation 1):
Ia(Am) =® p(B=Am)+(1¡®)Ia(M=Am)
That is, Ia(Am) is a quantitative indicator for authenticity, the value range of the indicator is 0-1 where
0 is No Amadeo and 1 Amadeo. The indicator is obtained by a weighted sum of the brushstroke
probability p(B=Am) and the quantitative indicator for molecular analysis Ia(M=Am).
The probability based on the brushstroke analysis is calculated as follows:
p(B=Am) =1
1 + e¡Af(x)B (14)
The function f (x) represents the discriminant function of the classifier: Regularized Least Squared
Classifier (RLSC) expressed in Equation 7.
The indicator of authenticity based on molecular analysis is calculated considering the area where the
system detected pigments coherent with the Amadeo’s palette (Am), considered proportionally with the
full analysed area (1¡NotAn) :
Ia(M=Am) =Am¤ (1¡NotAn) (15)
Where NotAn (Not analysed) is the percentage of the area where the elemental analysis was not
performed. That means all the pixels of the hyperspectral image which do not satisfy Equation 10; Am
(Amadeo) is the percentage of the area where the results obtained are consistent with those present in
the database. In Equation 16 the percentage of area not analysed (NotAn) has subtracted in the
calculation of indicator of authenticity as no information can be extracted from it. Figure 20 shows the
relation between the percentage of the analysed area, and the indicator of authenticity (expressed in %)

51
of the painting to be classified as authentic. Different curves were calculated considering different
percentage of Not Amadeo area detected.
Figure 20. Relation between the percentage of the Analysed area and the indicator of authenticity for molecular
analysis.
As shown in Figure 20, the relation between Analysed area and Indicator of authenticity is not linear.
Considering the simplest case, where all the pigments found in the painting are consistent with
Amadeo’s palette (Not Amadeo area = 0%), to obtain an Indicator of authenticity higher than 50% it is
necessary to analyse at least 75% of the area of the painting. The other curves represent cases in which
the Not Amadeo percentage is higher than 0% (using steps of 10% from 10 to 50%). These curves show
the influence of the Not Amadeo area in the analysis and which is the level of accuracy in the analysis
necessary to achieve at least 50% of authenticity.
For a set of 12 paintings, shown in Figure 21, we calculated their indicator of authenticity of being painted
by Amadeo considering the brushstroke analysis, the material information and through the fusion of the
data from both. The first 11 paintings belong to Amadeo, while the last was made by the DCR-FCT as
a deliberate falsification of a painting by Amadeo.
0 10 20 30 40 50 60 70 80 90 1000
10
20
30
40
50
60
70
80
90
100
0%
10%
20%
30%
40%
50%
I a(M
/Am
) (%
)
Analysed area (%)
% Not Amadeo area (Not Am)

52
Figure 21. Paintings analysed by fusion data. The paintings of Amadeo de Souza-Cardoso belonging to the Centro de Arte Moderna, Fundação Calouste Gulbenkian [Freitas et al. 2008]. The painting DCR was made at DCR-FCT.
Table 9 shows the quantitative indicator for authenticity that each painting was made by Amadeo
considering the brushstroke, the molecular analysis and with both (fusion data). The fusion data was
calculated giving the same weight to for each analysis (Equation 1 ®= 0:5). The accuracy of the answer
of the brushstroke analysis, calculated as in Equation (8) is 88% (94% true positive; 89% true negative
and 20% false positive answers). Using the same formula to calculate the accuracy of the molecular
analysis (Table 9) we obtain 100% of accuracy, considering the limited number of paintings analysed
with this strategy, it seems more appropriate to report the percentage of the area correctly identified in
the 11 original paintings of Amadeo---this value is 94%.

53
Table 9. Indicator of authenticity that the paintings were made by Amadeo, considering brushstroke and materials
analysis separately, and joined together by the fusion data. The value range is 0-1 where 0 is Not Amadeo and 1
Amadeo.
# Paintings Brushstroke Materials Fusion data
1 77P2* Quadro G 0.8 0.99 0.89
2 77P5 O jockey 0.95 1 0.97
3 92P209 Untitled 0.98 0.97 0.97
4 86P23 Paisagem,figura negra 0.98 0.84 0.91
5 77P16 Janellas do pescador 0.99 1 0.99
6 86P21 Mucha 0.7 0.91 0.8
7 77P20 Untitled (BRUT 300 TFS) 0.71 1 0.83
8 77P8 Untitled 0.82 0.99 0.91
9 86P19 Untitled (Medico) 0.73 0.74 0.73
10 77P9 Untitled (Entrada) 0.35 1 0.67
11 68P11 Untitled (Coty) 0.89 0.91 0.9
12 DCR painting 0.42 0.49 0.45
*the numbers refer to the inventory code at CAM [Freitas et al. 2008]
Considering the results of the materials and the fusion data analysis all the paintings were correctly
classified, including the negative case study (12). Observing the results of the brushstroke analysis we
can see that the paintings 6-9 and 11 show close values. This sort of cluster may be explain by the
presence in composition of these paintings of similar elements. Moreover, the values of these paintings
are also lower comparting with the paintings 1-5, in particular for the case of the painting 10 Entrada.
This result may be related with the missing in the database of element such as the letters (see for
example the word “ENTRADA” in the painting 10 and the word “MUCHA” in 6). Additionally it is possible
that the letters are not well identified by SIFT because this algorithm is not considered apt for text
analysis. To note that paintings between 7 and 11 are dated 1917 and are considered by art historians
as a homogeneous nucleus, different from previous works. The analysis of their materials and
techniques show a use of similar palate of pigments, moreover the paintings 7, 8, 10 and 11 are
characterized for the presence of founded materials such as mirrors, glasses, and sand (See Part II
Section 2.1.1). The painting 6 (Mucha) dated 1915, is not usually associated to the group of painting
dated 1917, identified above, anyway the brushstroke analysis associates this painting with the number
7 and 9. To confirm the relation of Mucha with the other paintings it was performed a test in which 3 of
the paintings dated 1917 (7, 10 and 11) were included in the training set. By introducing these paintings
the brushstroke probability of Mucha increases to 0.91. This result confirm the influence of the selection
of the images in the training set on the performance of the classifier and suggests a similarity between
the brushstroke of Mucha and those of the paintings dated 1917.

54
2.5 Final remarks
The brushstroke strategy proposed which used a combination of Gabor filter and SIFT was able to
discriminate between images of paintings of Amadeo (positive class) and paintings of other
contemporaneous artists (negative class) with an accuracy higher than 90%; the classifier gave a correct
answer for 133 of the 138 images of Amadeo’s paintings tested (please see Table 4 Section 2.2.3). The
use of Bag-of-Features model reduced the problems of the unbalance between the numbers of images
included in each one of the class.
The system proposed to extract the molecular information using hyperspectral and elemental analysis
provides reasonable results in terms of image mapping and in the detection of areas that could be no
painted by Amadeo works as expected (please see Figure 18D). The image produced as output of the
system is an easy way to confirm the results obtained. The performance of the system is influenced by:
the number of points of µ-EDXRF analysis and by the threshold (c ) used in the pre-processing to extend
the elemental analysis over all the painting surface. In our work the same threshold was used for all of
the paintings, this value was chosen empirically. In the future it would be useful to implement a method
that defines a specific threshold for each painting. An alternative solution would be to run the elemental
analysis using macro-XRF, which extend the examination over the whole surface of the painting.
The test performed on the 12 paintings using the data-fusion strategy demonstrated the usefulness of
the integration of material analysis to solve a problem of a false negative obtained by the classifier using
only the brushstroke analysis.

55
PART II: MATERIALS AND TECHINIQUES OF
AMADEO’S PAINTINGS DATED 1917

56

57
INTRODUCTION TO PART II At the time of the edition of the Catalogue Raisonné of Amadeo de Souza-Cardoso [Freitas et al. 2008]
19 selected paintings were systematically studied1 with the aim of defining the materials and techniques
used by the artist. 18 of these paintings are dated between 1912 and 19162 (the other is dated 1917);
all the paintings belong to the CAM’s collection [Melo et al. 2008]. The selection of these paintings was
made by the teams of the DCR-FCT and CAM led by Helena de Freitas. The selection privileged:
paintings representing different periods of Amadeo’s artistic production in the timeframe described
above; paintings that had not been restored, and similar (in terms of dating and/or style) to the 5 doubtful
paintings analyzed in the same mission [Melo et al. 2009]. The analysis of these paintings and the
analysis of artist materials that belonged to Amadeo (31 samples from oil paint tubes conserved in the
artist’s Family house as well as the painter’s palette from the CAM’s collection) were the basis to define
the palette of pigments representative of Amadeo’s production between 1912 and 19163 [Melo et al.
2008; Melo et al. 2009]. It was decided to restrict the data of the pigment’s palette to 1916, even if the
painting Untitled (Inv. CAM 86P19, dated 1917) was analyzed. This decision is related to the fact that
art historians consider the period between the end of 1916 and the end of 1917 as a homogeneous
nucleus inside the career of Amadeo [França 1992; Silva 1995; Freitas 2008]. These nucleus of
paintings were made in Portugal where Amadeo has been forced to remain due to the World War I. In
Manhufe Amadeo found a sort of productive isolation that allowed him to create his most successful
paintings [Silva 1995]. Due to the isolation that Amadeo experienced while in Portugal, to his difficulties
in obtaining artists' materials in his homeland,4 and also to the evident experimentation of materials5 that
he made in the last paintings, it was decided to dedicate a separate study for the paintings dated 1917.
Part II of this thesis presents the study on the materials and techniques of 4 selected paintings of
Amadeo dated 1917; these paintings are untitled but 3 of them are known with the names BRUT,
Entrada and Coty6. These paintings are characterized by the presence of founded objects such as
glasses, mirror, sand and matches. The analysis of the pigments used in these paintings confirmed the
palette defined for the period 1912-1916 [Melo et al. 2008] and included also some new elements such
1 The analyses included investigation by images (X-ray; UV and IR images); observation of the paintings under
microscope; in-situ elemental analysis by µ-EDXRF; spectroscopic analysis of micro-samples by µ-FTIR and µ-
Raman spectroscopy and HPLC analysis for the identification of organic dyes [Melo et al. 2009]. 2 Form the 18 paintings: 3 are dated between 1912 and 1913; 11 are dated between 1913 and 1914; 3 are dated
between 1915 and 1916; 1 is undated. 3In the palette are included: cobalt blue (CoO.Al2O3); ultramarine blue (Na8[Al6Si6O24]Sn); cerulean blue
(CoO.nSnO2); viridian (Cr2O3.2H2O); vermilion (HgS); carmine lake (cochineal lake); chromium yellow (PbCrO4);
cadmium yellow (CdS); lead white (2PbCO3.Pb(OH)2) and barium sulfate (BaSO4) [Melo et al. 2008]. 4 Amadeo in the letters to Robert Delaunay (dated January 9 and March 18 of 1916) referred about his difficult trip
to Porto to buy artist materials, the letters are transcript by Ferreira in [Ferreira 1972, pgs. 97-98]. 5 An example of experimentation in term of materials is the inclusion it the paintings composition of founds materials. 6 To simplify the text, in this thesis the 4 paintings are identified with the attributed name BRUT for the painting
Untiled, (BRUT 300 TSF) Inv. 77P20; Entrada for the painting Untiled, (Entrada) Inv. 77P9; Coty for the painting
Untiled, (Coty) Inv. 68P11 and Untitled for the painting Untiled, Inv. 77P8 [Freitas et al. 2008].

58
as the use of golden and silver tones (in Entrada, Coty and Untitled); these tones were detected only in
La Légend de St Julien L’Hospitalier (the manuscript illustrated by Amadeo in 1912) but they were never
found in his oil paintings. Moreover, it was found red organic dyes that belong to the β- naphthol class
(in Coty) and cobalt yellow used alone and in mixture with chrome yellow (in Coty and Untitled). In BRUT
and Entrada the hue violet was obtained by the mixture of blue pigment and a red lake. With respect to
the palette defined for the period 1912-1916, these differences are localized in restricted areas of the
paintings or in some cases to a specific painting. A relevant difference that was found in the pigments’
palette of Amadeo before and after 1916 was the use of zinc white, alone and in mixture with the other
pigments. In the paintings before 1916 the white used by Amadeo was lead white. Zinc white had already
been found but in a small area in the painting the painting dated 1917 Untitled (Inv. 86P19) studied in
2008 [Melo et al. 2009]. In BRUT and Entrada zinc carboxylates were found associated with the use of
this pigments.
In addition to the pigments characterization, it was performed a comparative study of the colorimetry
properties of 24 selected paintings by Amadeo dated between 1911 and 1917. The paintings were
digitized by hyperspectral imaging with the aim of comparing their colour properties. The number of
discriminable colours and the colour distribution in the CIE(a*b*) colour space of the paintings dated
1917 show very close values, different from his previous paintings. This analysis, together with the
pigments characterization, are now qualitative data that can support the art historians’ thesis that this
paintings should be considered as a nucleus; in the 4 paintings analysed Amadeo was developing a
new research on the use of colour7. Moreover the analyses described above show a relation between
the paintings BRUT and Entrada that seems also visible in the elements of the composition represented
in the photograph (conserved at archive of the Art Library of the Calouste Gulbenkian Foundation Inv.
ASC09/16). This is the photograph of a collage work made by Amadeo and that probably was a
maquette for these paintings.
7 Personal communication by Helena de Freitas.

59
CHAPTER 1: AMADEO DE SOUZA-CARDOSO
In the Second Part of the thesis, the focus is on Amadeo’s last artworks dated 1917. This chapter
introduces the artist Amadeo de Souza-Cardoso (1887-1918), his works and the paintings dated 1917
that are analysed in detail in the next chapter. Chapter 1 presents: a short biographical account of
Amadeo considering two periods (i) his experience in Paris from 1906 to 1914 and (ii) the period that
Amadeo spent in Portugal between 1914 and 1918. The chapter also presents a description of the main
characteristics of his painting techniques and the materials that he used; these information are based
on the analysis of 19 paintings and a set of artist materials performed by DCR-FCT in 2008 [Melo et al.
2008; Melo et al. 2009]. In the second part of the chapter are introduced the paintings produced by
Amadeo at the end of the Portuguese period (1917). Secondly, this chapter introduces the main
problems of conservation that have been encountered in Amadeo’s paintings dated 1917 (Section 1.2.)
1.1 Amadeo: an artist in his time
Amadeo was born in 1887 in Manhufe, near Amarante in Northern Portugal and died at the age of 30
years, in Espinho in 1918, a victim of the Spanish flu [Freitas 2008b]. The critical reception of Amadeo
was uneven, in which the attention on this artist appeared and disappeared in accordance with the
irregular rhythm of exhibitions [Freitas 2008c]. This could be also related with the absence in Portugal
of a proper museum of contemporary art. Only in 1942 two paintings by Amadeo entered in The Museu
Nacional de Arte Contemporânea do Chiado (National Museum of Contemporary Art - Museu do
Chiado) collection [Freitas 2008c]
Amadeo was selected to be one of the artists to represent modern art by the Secretariado da
Propaganda Nacional (SPN - the Portuguese regime’s propaganda office of the Estado Novo8). The role
of the SPN was to disseminate nationalist ideas and organize culture and the arts. In 1935, the SPN
created the Amadeo de Souza-Cardoso Prize; in 1958 and 1959, a series of exhibitions were organized
in Paris, Lisbon and Porto. The first monograph dedicated to the artist was written by José Augusto
França in 1956 [França 1956]. In his work, França made for the first time made an analysis of Amadeo’
artworks.
A number of documents related to Amadeo, including a collection of photographs, was donated by his
widow, Lucie Cardoso, and his friend Paulo Ferreira at the end of the 1980s to the Calouste Gulbenkian
Foundation (FCG). The Center of Modern Art (CAM)9 -- conserves 200 of Amadeo’s artworks including
6310 paintings; 136 drawings and watercolours and 1 illustrated manuscript. The FCG developed an
important role in the promotion and preservation of Amadeo’s work. In 1987, the centenary of the birth
8 Estado Novo (New State) was the dictatorial regime that ruled Portugal during 1933 and 1974. 9 CAM was created in the 1983. 10 There are 201 paintings included in the Catalogue Raisonné of Amadeo de Souza-Cardoso.

60
of Amadeo, the CAM presented his major retrospective. More recently, in 2006, CAM organized an
exhibition entitled Amadeo de Souza-Cardoso. Avant-Garde Dialogues. The aim of the exhibition,
curated by Helena de Freitas, was to establish a reunion between the works of Amadeo and the works
of international contemporary artists, inside and outside of his circle of friends, which had an influence
on his career.
The research developed for the exhibition Amadeo de Souza-Cardoso. Avant-Garde Dialogues,
presented in the catalogue of the exhibition [Freitas et al. 2006], enabled significant progress in the
recognition of Amadeo relations with the international culture of his time. The Portuguese origins of
Amadeo and his European experience have been well described by different generations of artists and
critics. The first one was the Portuguese painter José de Almada Negreiros; in 1916, during the
exhibition of Amadeo in Lisbon, Negreiros defined Amadeo as Portugal’s first discovery in 20th Century
Europe [França 1992]. José Augusto França and José Escada underlined the desirable international
relevance of this artist, França described him as reluctant Portuguese, while Escada excluded the
nationalism aspect by defining him as a European painter [Freitas 2008b].
The Gulbenkian Foundation promoted the edition of the Catalogue Raisonné of Amadeo, which was
published in two volumes: the first one is a photo-biography of the artist [Freitas et al. 2007] and the
second is the catalogue of his painted artworks [Freitas et al. 2008]. A Catalogue Raisonné of his
drawings has not been published as yet.
1.1.1 Paris (1906-1914)
In 1906, Amadeo left Portugal for Paris to study architecture. Very quickly, however, he become more
interested in the emerging artistic energies irradiation from the city [Freitas 2008b] and left his studies.
At the time Paris offered the best of contemporary art; Amadeo had the opportunity to visit the most
important exhibition, such as Cézanne’s retrospective at the Salon d'Automne (1907).
The caricature was, probably, the way by which Amadeo approached the art world; he started this
practice in Portugal in 1905 and continued it until about 1910. Out of his original country, Amadeo made
close friendships with several Portuguese artists, including Thomaz Costa, Francis Smith, Acacio Lino,
Alberto Nunes Cardoso, and Eduardo Viana [Alfaro 2007] (Fig.1). Very soon, he widened his circle of
friends. His friendship with Italian artist Amedeo Modigliani was well-known. Modigliani had also arrived
in Paris in 1906; in 1911, the two artists organized an exhibition at Cardoso’s studio in Paris. Picasso,
Guillaume Apollinaire, Max Jacob and Ortiz de Zárate were invited to the event [Freitas 2008b]. The
contact with Russian culture was very influential for Amadeo’s artistic production. It is known that
Amadeo saw the first performance of Serge Diaghilev’s Ballets Russes and that the Russian artists
Zadkine, Archipenko and Sonia Delaunay entered also in his circle of friends. According to Ferreira
[Ferreira and Pernes 1972], in 1911 Amadeo appeared at the home of Robert and Sonia Delaunay in
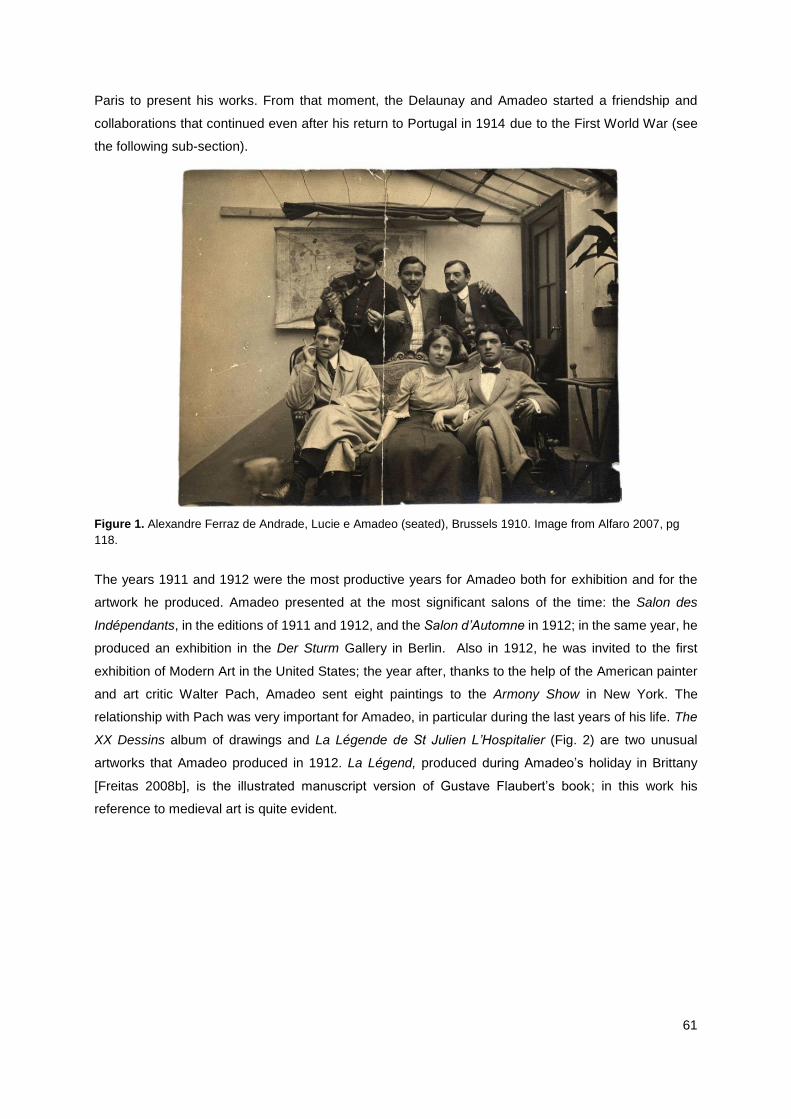
61
Paris to present his works. From that moment, the Delaunay and Amadeo started a friendship and
collaborations that continued even after his return to Portugal in 1914 due to the First World War (see
the following sub-section).
Figure 1. Alexandre Ferraz de Andrade, Lucie e Amadeo (seated), Brussels 1910. Image from Alfaro 2007, pg
118.
The years 1911 and 1912 were the most productive years for Amadeo both for exhibition and for the
artwork he produced. Amadeo presented at the most significant salons of the time: the Salon des
Indépendants, in the editions of 1911 and 1912, and the Salon d’Automne in 1912; in the same year, he
produced an exhibition in the Der Sturm Gallery in Berlin. Also in 1912, he was invited to the first
exhibition of Modern Art in the United States; the year after, thanks to the help of the American painter
and art critic Walter Pach, Amadeo sent eight paintings to the Armony Show in New York. The
relationship with Pach was very important for Amadeo, in particular during the last years of his life. The
XX Dessins album of drawings and La Légende de St Julien L’Hospitalier (Fig. 2) are two unusual
artworks that Amadeo produced in 1912. La Légend, produced during Amadeo’s holiday in Brittany
[Freitas 2008b], is the illustrated manuscript version of Gustave Flaubert’s book; in this work his
reference to medieval art is quite evident.

62
Figure 2. La Légend de St Julien L’Hospitalier, illustrated manuscript version of Gustave Flaubert’s book, 1912. Collection of Centro de Arte Moderna, Fundação Calouste Gulbenkian (Inv.DP1822) [Freitas et al. 2008 pg. 208].
1.1.2 Back to Portugal (1914-18)
In July of 1914, Amadeo and Lucie left Paris travel to Rocamadour in the south-west of France, and
from there to London and subsequently to Barcelona. At the Salon of the Allied Artist’s Association
(London) Amadeo presented the paintings Le Jardinier, Musiciens de Nuit, Les Oeillets which received
enthusiastic reviews [Alfano 2008]. In Barcelona, Amadeo and Lucie joined their friend Leon Solá [Alfaro
2006] who introduced Amadeo to the architect Antoni Gaudí. Then their travel continued to Porto (north
of Portugal); while there the war between France and German was declared of the (August 3); this
forced Amadeo and Lucie to stay in Portugal more time than they desired [Alfaro 2006]. In 1915 Sonia
and Robert Delaunay arrived at Vila do Conde, in the north of Portugal [Freitas 2008b]. During the time
spent in Portugal, the couple developed an artistic project on the light and on the local culture features
as pottery, traditional dolls in textile [Alfaro 2006]. They created the Corporation Nouvelle which also
involved Portuguese artists Almada Negreiros, Eduardo Viana, José Pacheco and also Amadeo, as well
as poets the Guillaume Apollinaire and Blaise Cendrars. The relation between Sonia and Robert
Delaunay with Portuguese artists is well documented in the works of Paulo Ferreira [Ferreira and Pernes
1972] and in the book of correspondence between this group of artists11 [Ferreira 1972]. One of the
projects of the Corporation Nouvelle was the edition of an album produced with pochoir (stencil).
According to the correspondence between Amadeo and the Delaunays, Amadeo declared his disinterest
in the pochoir technique, considering himself absolutely mediocre in the use of gouache, pigmented wax
also. Despite his initial rejection, Amadeo worked on the album’s project and started to use the pochoir
to sign his oil paintings [Alfaro 2006]. The projects of the Corporation Nouvelle as well as the ambitious
project for the second exhibition in New York were not successful: America is our great market […] if
11 Correspondence of Almada-Negreiros, José Pacheco, Amadeo de Souza-Cardoso, Eduardo Vianna, Robert
and Sonia Delaunay.

63
the war had not started I could have achieved […] one of my dreams: to exhibit one of my paintings on
board of a large transatlantic-including the return trip. How beautiful that would be!12
Amadeo showed his works in Portugal for the first time in 1916, in Porto (November) and in Lisbon
(December). Before the exhibition in Porto Amadeo published an album entitled 12 Reproductions to
promote his works; the album included a flyer where he announces the cities of the future exhibitions:
Munich, Paris, Berlin, London, Colonia, Hamburg, New York and Chicago. The exhibition in Porto was
entitled Exposição de Pintura (Abstraccionismo) Amadeo de Souza Cardoso [Alfaro 2007, pg.238],
Amadeo described to Walter Pach the exhibition with these words: over thirty thousand people visited
the exhibition, it was the first exhibition of modern painting in Portugal. People were overwhelmed by
this new expression of art, by the new techniques and process13. This exhibition surprised the visitors
and local media and promoted controversial reactions. Amadeo was also physically assaulted [Alfaro
2007, pg. 243]. The second exhibition was in Lisbon at the Liga Naval’s Palace; the Portuguese
newspaper A Nação defined the exhibition in Lisbon as an excellent exhibition of abstractionist painting
[…] The exhibition was indeed an event in our tiny art world, not only due to the quality of the people
from our social elite that visited it, but also because of the number of painting that were bought14.
Despite these results in Portugal, Amadeo waited anxiously to return to Paris, in a letter that he sent to
Sonia Delaunay he imagines the streets of Paris through postcards sent by Eduardo Viana: I do from
time to time my trip to Paris, the Galeries Lafayette and get some provisions, while our brave soldiers
fighting gloriously15. At the end of 1916, everything seemed ready and Amadeo wrote to Walter Pach:
send the cards to Portugal, where I will be until the 1st January. [..] But after that I will be in Paris, I am
planning to leave at the latest on January 3 - the latest! Or even before Christmas [Freitas 2008b].
Unfortunately he could not embark into this trip, as he died in October 1918 victim of the Spanish flu
pandemic.
12 “A América é o nosso grande Mercado […] se a guerra não houvesse estalado teria eu conseguido, […] realizar
um dos meus sonhos: fazer uma exposição de um mês dos meus quadros a bordo de um grande transatlântico -
na viagem de ida e de regresso. Como isso seria bello!” Amadeo's interview to the newspaper O Dia, 4 December
1916 [Freitas 2008b]. 13 “Mais de 30 mil pessoas visitaram a exposição, que causou um grande ruido, foi a primeira grande exposição
de pintura moderna em Portugal. As pessoas ficaram abismadas pela nova expressão da arte, pelas técnicas e
processo novos.” Letter of Amadeo to Walter Pach, November 1916 [Alfaro 2007, pg 243] 14 A Nação, December 19, 1916 [Alfaro 2006, pg. 487]. 15 “Je travaille et reçoit des cartes postales de Vianna, et ça me fait rappeler l’élémi et le petit pharmacien. Je fais
de temps en temps mon voyage d'agrément à Paris ; aux Galeries Lafayette je fais quelques provisions - pendant
que nos braves soldats se battent glorieusement…” Letter to Sonia Delauney 19 May 1916 [Ferreira 1972, pgs
134-135].

64
Figure 3. Paintings of Amadeo de Souza-Cardoso dated 1917. Collection of Centro de Arte Moderna, Fundação
Calouste Gulbenkian. A Untitled (Entrada), 93 x 76 cm. Collection of CAM (Inv. 77P9); B Untitled (Coty), 93 x 76
cm. Collection of CAM (Inv. 68P11); C Untitled (Máquina registadora - Cash Register) (P198), 93 x7 6cm. Collection
of CAM (Inv. 68P10); D Untitled, 93.5 x 93.5 cm. Collection of CAM (Inv. 77P8); E Untitled, 100 x 70.3 cm. Collection
of CAM (Inv. 86P19); F Untitled (BRUT 300 TSF), 85.8 x 66.2 cm. Collection of CAM (Inv. 77P20) and G Untitled
(Zinc), Private collection. [Freitas et al. 2008, pgs. 355, 356, 358, 360, 362, 364, 367, 355].
Art historians have recognized the paintings realized in 1917 as the most successful of his career: in
Manhufe Amadeo come back to the productive isolation, he perform his most qualified paintings [Silva
1995]. In Portugal Amadeo developed an increasingly profound and complex pictorial research [Freitas
2008b]. According to França, between 1916 and 1917, Amadeo painted at least 6 or 7 untitled
paintings16, three of these with the same dimensions (93x76 cm) that form a homogenous nucleus (Fig.3
A, B and C) [França 1992]. In these three paintings we find figure elements already present in previous
works, such as violins and lithographic letters and numbers. França has suggested that Amadeo realized
these group of artworks after the paintings reproduced on the album 12 Reproductions of 1916 and
before the publication of the Futurist Portugal manifest (late 1917) [França 1992]. The images of
paintings indicated by França as the last works of Amadeo are reported in Figure 3; paintings A, B and
C are the three works with the same dimension. The materials and the techniques of the paintings A, B,
D and E have been studied in this thesis. The painting in Figure 3E was already studied at the
Conservation and Restoration Department in 2008 [Melo et al. 2008].
16 For more information about the art of Amadeo between 1915 and 1917 [França 1986].

65
1.1.3 Looking at Amadeo’s paintings
The materials and the techniques of Amadeo17 all within in the context of modern art of the twentieth
century. Amadeo himself defined his art as far from the academism and in general not classifiable: I do
not follow any school. The schools died. [...] I'm an impressionist, cubist, futurist, or abstractionist? A bit
of everything18. The palette used by Amadeo (Fig.4) is characterized by the presence of traditional
pigments, such as lead white19, vermilion red and Cochineal lake and the brown tones of the ochres
(iron and manganese oxide), with new colours introduced in the XIX century artist’s palette. I'm currently
studying the wonderful technique from the ancient monk painters, which I adapted to modern chemistry,
because the ancients did not know for example the colours cedenio [Selenium?20], which are wonderful,
and the emerald green, [….]. Their techniques adapted to modern chemistry can be used today!"21 In
these words we can appreciate the passion for experimentation and for the relation between antiquity
and modernity expressed by the artist. Amadeo introduced in his palette pigments discovered by
inorganic chemistry at the time, and that had quickly entered as material for artists. As we will see, he
essentially used inorganic pigments of chromium, cadmium, cobalt, copper and arsenic.
During the edition of the Catalogue Raisonné the team of the DCR that worked in collaboration with
Helena de Freitas analysed a group of materials that belong to Amadeo. In the Amadeo’s house in
Manhufe were found three boxes containing artist materials that should be used by Amadeo. The box
n° 1 show the inscription “Amadeo Cardoso” and contained 60 crayons22; the box n°2 with the inscription
“Amadeo” and contained 21 oil paint tubes, the box n°3 with the inscription “Maria da Graça 34”
contained 18 oil paint tubes. The paint tubes were from French Lefranc and Bourgeois and the English
Winsor & Newton (W&N) [Melo et al. 2009]. Thanks to the analysis of the labels and the shape of the
tubes, W&N identified these paint tubes as earlier than 191423 [Melo et al. 2008; Melo et al. 2008]. Figure
4 shows four of the 39 paint tubes.
17 Data based on the study of 18 painting between 1913 and 1916 and 1 painting dated 1917; a palette and 31 paint
tubes belonging to him [Melo et al. 2008; Melo et al. 2009].
18 Amadeo's interview to the journal O Dia (1916) [Alfaro 2006].
19 Lead white is used alone or mixed with barium sulphate. The use of the zinc white is localized in a small detail of
the painting Untitled (86P19) in 1917.
20 It is possible that the term cedenio is a typing error. The term Selénio (Selenium in English) was already present
in a Portuguese dictionary in 1898 [Almeida 1898, p.1834] "Selénio, chim. Corpo simples, metállico, avermelhado,
muito friável." (“Selenium, chem. Simple body metallic red, very friable.")
21 “Eu estou até atualmente estudando a técnica maravilhosa dos antigos frades pintores, que, adaptada à química
moderna, porque os antigos não conheciam por exemplo as cores de cedénio, que são maravilhosas, e o verde
esmeralde, que nem sequer se encontra nos verdes profusos do Grego, que, adaptada à química moderna, repito,
se pode usar hoje” Amadeo's interview to the journal O Jornal de Coimbra (1916) [Ferreira and Ribeiro 1987].
22 The crayons were not analysed. 23 Information provided by Jessica Montgomery, of Winsor & Newton [Melo et al. 2008].

66
Figure 4. Four of the oil paint tubes analysed by DCR in 2008. From left to right: red carmine (Bourgeois); viridian
(Lefranc), chrome yellow (Lefranc) and vermilion (Winsor & Newton) [Melo et al. 2008]
From the 39 oil paint tubes, it was possible to collect samples from 31 tubes; the samples were analysed
by µ-EDXRF, µ-FTIR, µ-Raman and HPLC was used for the organic dyes. In Appendix Part II Ap. VIII
the transcription of the 31 labels from the oil paint tubes analysed from the box n°2 and n°3, for more
details please see Melo et al. 2008. The results of the analysis of the tube samples were compared with
the analysis of 19 selected paintings representative of the Amadeo’s production between 1912 and 1917
(Fig. 6A and 6B). This comparison shows that these tubes are representative of the materials used by
the artist. Considering that at the time of the Catalogue Raisonné it was studied only one painting dated
1917 (CAM Inv. 86P19), the palette of pigments presented in Figure 5 should be considered valid for the
period 1912-1916. Moreover, the information acquired on the paintings and the paint tubes was
compared with those found on five doubt paintings attributed to Amadeo [Melo et al. 2009]. Three of
these paintings resulted forged [Melo et al. 2009], while two are presented as Case Studies at the end
of the Catalogue Raisonné, because technical analysis and the art historian investigation were not able
to prove the authorship of these paintings [Freitas et al. 2008].
Cobalt blue, is the most common blue in Amadeo’s paintings; it is used pure and in mixture with
ultramarine. Amadeo made a limited use of the purple tones that were usually obtained with Cobalt violet
pigment. Viridian can be considered as the green of Amadeo; it is used pure or mixed with chrome
yellow to obtain the light tones, or with Prussian blue for the dark green tones; emerald green is less
common. The chemical element chromium was discovered in 1797 by Vauquelin and thanks to its
synthesis of lead chromate (1809) the artists enjoyed not only a brilliant yellow but also variance of
orange and reddish hues [Schaefer et al. 2008]. Amadeo used chrome yellow to achieve a specific hue;
this pigment is present in many mixtures, with viridian, with vermilion and with the ochre. The presence
of cadmium in the yellow and orange tones is limited. Finally, the use of a pure black pigment, such

67
carbon black, is less frequent in the paintings of Amadeo. To obtain the black tones Amadeo used
mixtures of viridian, vermilion, ultramarine and Prussian blue.
Figure 5. The pigment palette of Amadeo between 1912 and 1916, with details from his paintings. Image adapted
from Melo et al. 2008.
For his oil paintings Amadeo chose two types of support: cardboard and canvas. Figures 6A and B show
the paintings analysed [Melo et al. 2008] divided according to their support. Unlike the canvas paintings,
which always present a preparation layer24 (usually thin, made of gypsum, lead white and barium
sulphate), the artworks on cardboard may or may not present this layer; when it exists, the layer is a
commercial preparation of lead white. In the cardboard works without preparation layer the colour of the
support itself is used as a colour in the composition.
The infrared image technique allows us to see that Amadeo sketched a few lines to organize the space
of his paintings (Fig. 7D). The absence of pentimenti is also remarkable as well as the absence of
overlapping between the figures of the composition; this becomes evident by using an X-ray image
technique (Fig. 7B). All these features may be achieved only with a precise planning of the painting
before its execution [Melo et al. 2008].
24 The role of the preparation layer is to create a proper surface to be paint. The untreated canvas is absorbent and has a texture, the excessive absorption of the canvas may promote the extraction of the binder from the paint, as consequence of that the painting surface appears very mat with and in some case it may induce poor paint adhesion [Kirby 2011]. To reduce the absorbency of the canvas usually it is also apply a layer, called sizing, in general prepared with a solution of glue, between the canvas and the preparation layer.

68
Figure 6A. Paintings of Amadeo de Souza-Cardoso on cardboard. A Untitled (1914), 18 x 33 cm. Collection CAM
(Inv. 77P5); B Untitled (1914) 10.7 x 41.2 cm. Collection CAM (Inv.91P219); C Ar livre nú (1914) 18.8 x 13 cm.
Collection CAM (Inv.91P217); D Untitled (1914) 18.7 x 12.5 cm. Collection CAM (Inv.91P220); E Untitled (1914)
17.4 x 13.3 cm. Collection CAM (Inv.87P158); F Untitled (Cabeça) (1914) 18.6 x 16.2 cm. Collection CAM
(Inv.91P218); G Untitled (1914) 20.1 x 12.9 cm. Private Collection; H Untitled (1914) 18.7 x 12.8 cm. Private
Collection; I Untitled (1913) 14.6 x 17.9 cm. Collection CAM (Inv. 91P225); L Untitled (1914) 26.8 x 32.9 cm.
Collection CAM (Inv. 91P224); M Untitled (1913) 34.4 x 28.2 cm Collection CAM (Inv. 92P209) [Freitas et al. 2008,
pgs. 228, 229, 236, 237, 239, 264, 268, 269, 286, 285, 287].
However, there exist only a few examples of drawings that can be considered as sketches of Amadeo’s
paintings. Figure 8 shows two examples of this: one example concerns the Mucha painting (1915-16),
probably the most emblematic of Amadeo’s artworks; the second one concerns A casita clara–
paysagem (The clear little house-landscape) (1915). The use of patches of colours, called tache25, is a
25 This term, introduced by Zola in his study of Manet’s paintings, was used to describe the Impressionist’s use of
coloured patch or stoke in contrast the Academic techniques. In Impressionist paintings the forms are not

69
characteristic of Amadeo’s technique. Overall the texture is a relevant element in his compositions and
is complemented by the use of the colour.
Figure 6B. Paintings of Amadeo de Souza-Cardoso on canvas. Collection of Centro de Arte Moderna, Fundação
Calouste Gulbenkian A Untitled (O Jockey) (1913) 61 x 50 cm. (Inv. 77P5); B (Paysagem figura negra) (1914-15)
50 x 50 cm (Inv. 86P23); C Gemälde G /Quadro G (1912) 51 x 29.5 cm (Inv. 77P2); D Untitled, 100 x 70.3 cm. (Inv.
86P19); E Mucha (1915-16) 27.3 x 21.4 cm. (Inv. 86P21); F (Janellas do pescador) (1915-16) 27.4 x 34.8 cm. (Inv.
77P16); G Untitled (undated) 99.6 x 64.6 cm. (Inv. 91P222) [Freitas et al. 2008, pg. 209, 297, 182, 362, 322, 318,
373]
represented by the shape of the objects themselves but using differentiated patches of colour, which gives the effect
of light surrounding the object [Bomford et al. 1990].

70
Figure 7. Paintings of Amadeo de Souza-Cardoso Collection CAM. Untitled (1913) (Inv. 92P209) A visible light
photograph; B X-ray image [Melo et al. 2009]; C Untitled (1914) (Inv. 88P159); D Infrared photograph [Melo et al.
2008].
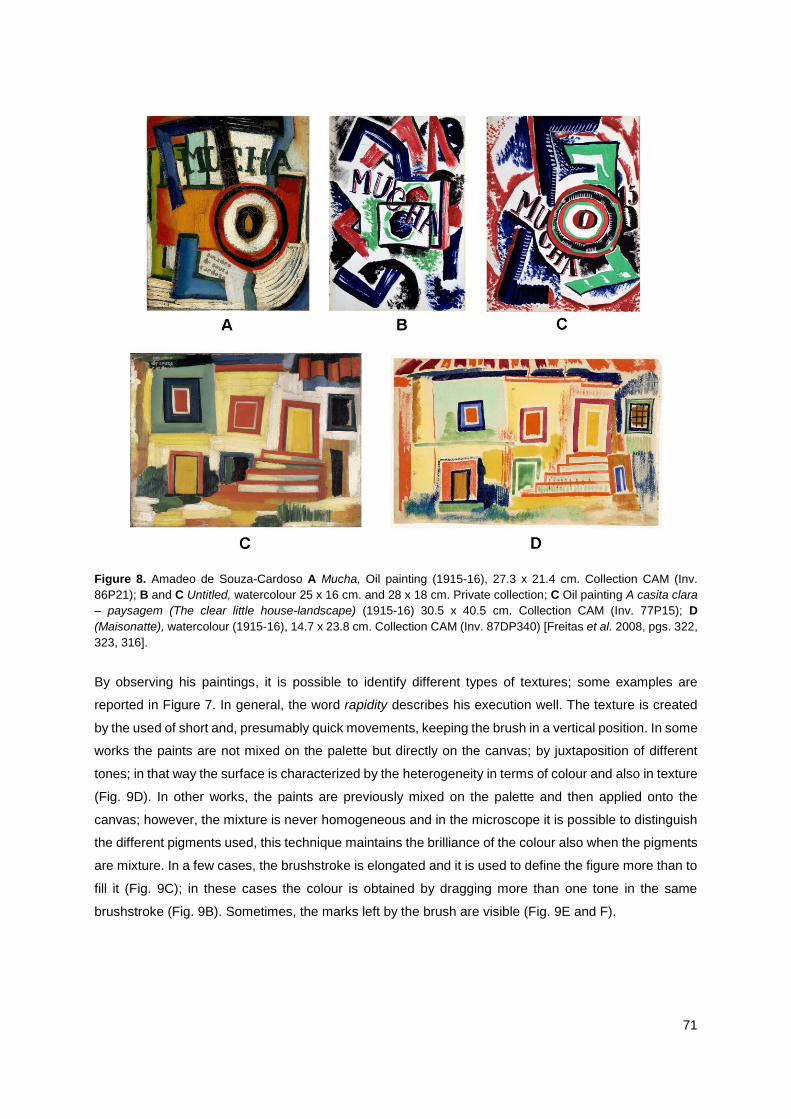
71
Figure 8. Amadeo de Souza-Cardoso A Mucha, Oil painting (1915-16), 27.3 x 21.4 cm. Collection CAM (Inv.
86P21); B and C Untitled, watercolour 25 x 16 cm. and 28 x 18 cm. Private collection; C Oil painting A casita clara
– paysagem (The clear little house-landscape) (1915-16) 30.5 x 40.5 cm. Collection CAM (Inv. 77P15); D
(Maisonatte), watercolour (1915-16), 14.7 x 23.8 cm. Collection CAM (Inv. 87DP340) [Freitas et al. 2008, pgs. 322,
323, 316].
By observing his paintings, it is possible to identify different types of textures; some examples are
reported in Figure 7. In general, the word rapidity describes his execution well. The texture is created
by the used of short and, presumably quick movements, keeping the brush in a vertical position. In some
works the paints are not mixed on the palette but directly on the canvas; by juxtaposition of different
tones; in that way the surface is characterized by the heterogeneity in terms of colour and also in texture
(Fig. 9D). In other works, the paints are previously mixed on the palette and then applied onto the
canvas; however, the mixture is never homogeneous and in the microscope it is possible to distinguish
the different pigments used, this technique maintains the brilliance of the colour also when the pigments
are mixture. In a few cases, the brushstroke is elongated and it is used to define the figure more than to
fill it (Fig. 9C); in these cases the colour is obtained by dragging more than one tone in the same
brushstroke (Fig. 9B). Sometimes, the marks left by the brush are visible (Fig. 9E and F).
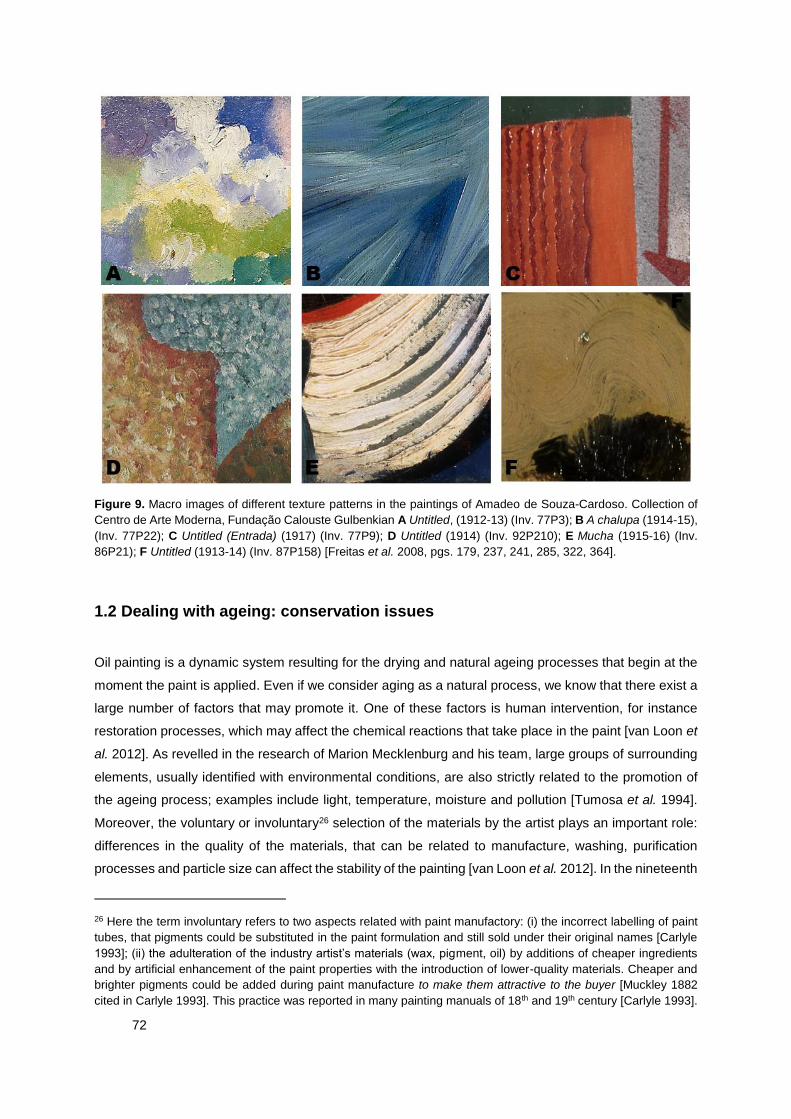
72
Figure 9. Macro images of different texture patterns in the paintings of Amadeo de Souza-Cardoso. Collection of
Centro de Arte Moderna, Fundação Calouste Gulbenkian A Untitled, (1912-13) (Inv. 77P3); B A chalupa (1914-15),
(Inv. 77P22); C Untitled (Entrada) (1917) (Inv. 77P9); D Untitled (1914) (Inv. 92P210); E Mucha (1915-16) (Inv.
86P21); F Untitled (1913-14) (Inv. 87P158) [Freitas et al. 2008, pgs. 179, 237, 241, 285, 322, 364].
1.2 Dealing with ageing: conservation issues
Oil painting is a dynamic system resulting for the drying and natural ageing processes that begin at the
moment the paint is applied. Even if we consider aging as a natural process, we know that there exist a
large number of factors that may promote it. One of these factors is human intervention, for instance
restoration processes, which may affect the chemical reactions that take place in the paint [van Loon et
al. 2012]. As revelled in the research of Marion Mecklenburg and his team, large groups of surrounding
elements, usually identified with environmental conditions, are also strictly related to the promotion of
the ageing process; examples include light, temperature, moisture and pollution [Tumosa et al. 1994].
Moreover, the voluntary or involuntary26 selection of the materials by the artist plays an important role:
differences in the quality of the materials, that can be related to manufacture, washing, purification
processes and particle size can affect the stability of the painting [van Loon et al. 2012]. In the nineteenth
26 Here the term involuntary refers to two aspects related with paint manufactory: (i) the incorrect labelling of paint
tubes, that pigments could be substituted in the paint formulation and still sold under their original names [Carlyle
1993]; (ii) the adulteration of the industry artist’s materials (wax, pigment, oil) by additions of cheaper ingredients
and by artificial enhancement of the paint properties with the introduction of lower-quality materials. Cheaper and
brighter pigments could be added during paint manufacture to make them attractive to the buyer [Muckley 1882
cited in Carlyle 1993]. This practice was reported in many painting manuals of 18th and 19th century [Carlyle 1993].

73
century, British instruction books on oil painting advised artists to anticipate changes in their materials,
such as the yellowing of the binder. To offset this they were advised to use the more coloured in linseed
oil, with dark pigment and the lighter poppy and nut oils for the light colours. Very often, the manuals
also offered advice and methods to avoid material changes [Carlyle 1990].
The oil painting is a product of a natural aging process also associated with the drying of the oil binder.
The research developed in the last 20 years, by the group led by Professor Boon at the FOM Institute
AMOLF (Foundation for Fundamental Research on Matter) has clarified many aspects of the drying
process of the oil and its interaction with pigments. In the oil paint, pigments, additives and binders may
interact to form new compounds such as metal salts or soaps (metal carboxylates). The drying oils, the
metal soaps formation and their impact on the state of preservation of the paint, are introduced in the
following sub-section. However, the presence of metal soaps cannot be attributed only to a degradation
process. In fact, they were introduced at the end of the 19th century, in the enamel paint industry to
modify the oil paint properties. Sub-section 1.2.2 presents a brief history of metal soaps in paint
formulations, and in particular the Ripolin case study. Finally, two cases of pigment alteration (of chrome
yellow and eosin based lake) will be presented.
1.2.1 Drying and ageing of the oil binder
A drying oil is a natural product composed mainly of triglycerides, i.e., esters of glycerol linked to three
long-chain carboxylic acids (Fig. 10). The fatty acid portion of the drying oils generally used in oil paints
is mostly composed of C18 polyunsaturated acids: oleic acid (C18 : 1), linoleic (C18 : 2) and linolenic
(C18 : 3); and a small percentage of saturated fatty acids with 12–18 carbon atoms, e.g., palmitic (C16
: 0) and stearic (C18 : 0) [Lazzari and Chiantore1999; van den Berg 2002].
During the drying process it is possible to identify three main stages, represented in Fig. 9: curing,
maturation and degradation stage [Boon et al. 1996]. The reactivity of the double bonds of the
unsaturated fatty acids promotes the initiation of the process, which is manly based on photoxidation
and autoxidation reactions (Fig.11) [Meilunas et al. 1990; Boon et al.1996; van den Berg and Boon 1999;
van der Mallégol et al. 1999; Weerd et al. 2005; Cotte et al. 2006]. The curing stage is rapid and involves
the formation of hydroperoxide, followed by the breakdown of hydroperoxide giving rise to highly reactive
radicals, and subsequent cross-linking. The breakdown of the hydroperoxide is accelerated by the
presence of transition metals form pigments and driers. This process results in a complex three-
dimensional polyanionic network (Fig.11B) [van den Berg and Boon 1999]. The network is based on the
glycerol ester with a cross-linked fraction of carboxylate anions and it is stabilised by metal cations from
the pigments or the driers (e.g., lead oxide or acetate) (Fig. 11C) [Osawa 1988; van den Berg 2002; van
der Weerd et al. 2005; Tumosa and Mecklenburg 2005]. Painters and paint manufactures used to
promote the drying by pre-heating the oil, in order to (pre)polymerize it or by using alkaline washing
steps [van den Berg and Boon 1999]. During the maturation stage, in addition to the cross-linking,

74
degradation reactions that transform the triglyceride radicals into low weight molecular products also
occur: a variety of carboxylic acid, aldehydes, ketones, alcohols and hydrocarbons. Most of these
smaller molecules will leave the paint film by evaporation, although short chain of fatty acids may be
trapped within the paint film for a long time [van den Berg and Boon 1999]. This volatile fraction, called
the mobility phase, determines the flexibility of the film. Unlike the polyanionic network, the volatile
fractions can move and diffuse through the paint layers. However, the paint system has been recently
characterised as capable of a self-repair mechanism [Boon 2006; Boon at al. 2007]. Mono and
dicarboxylic acids that are not incorporated in the network may migrate to react with metal cations,
leading to the formation of an increased proportion of metal carboxylates (metal soaps). In some cases,
metal soaps form aggregates within the paint film (predominantly in the preparation layers). Their
formation is still not fully understood, but it appears that aggregation depends on the paint composition
(pigments, extenders and driers), the availability of free fatty acids, the build-up of the layers, the
environmental conditions (temperature, relative humidity, etc.) and the conservation history of the
painting [Robinet and Corbeil 2003; Plater et al. 2003; van der Weerd et al. 2005; Boon 2006].
Figure 10. Hydrolysis of a triglyceride composed of two unsaturated acids, (a) linolenic and (b) linoleic, and one
saturated acid, (c) stearic.
Figure 11. Schematic model of the different stages of the drying of the oil A fresh oil; B representation of the
polyanionic network (after curing); C after hydrolysis of the ester bond due to the ageing processes (after
maturation). Image adapted from [Boon et al. 1996].
The formation of a metal soap may promote the dissolution of an original pigment [Weerd 2002] with a
consequent increment in volume [Boon et al. 2002]. The mass formed may protrude through the paint
layers to the surface of the painting (protrusions). Protrusions are visually evident as whitish masses

75
that give to the painting surface a granular texture [Keune 2005; Weerd 2002]. As well, the presence of
metal soaps may also increase the transparency or darkening of paint [Keune 2005; Noble et al. 2005;
Shimadzu et al. 2008].
1.2.2 Metal soaps in paint formulations and the Ripolin case study
Mayer describes three classes of materials added to colours by manufacturers I order to keep the
pigment in suspension; to avoid the separation of oil and pigment and in order to impart the desirable
short (buttery) [Mayer 1982, pg.147]. The classes of materials described by Mayer are: (1) waxes or
waxes-like materials, which produce a colloidal or gelatinous condition in the oil/pigment system; (2)
water or aqueous solutions, which produce emulsifying effect and (3) certain inert pigments, such as
alumina hydrated, which produce very short pastes. The addition of beeswax, or aluminium27 and zinc
stearates or palmitates, will results in good buttery pastes, and when are used in vary small amount
there is probably little danger on the structural strength of the film.
Mayer advised that the use if used in sufficient quantity, metallic soap will tend to cause the oil film
become spongy and to get brittle with age […] two per cent by volume in the total amount of oil color is
usually considered permissible [Mayer 1982, pg.148].
Lead compounds28, were recommended in the artists' literature not only as driers: lead-treated oils, in
the presence of certain resins, will gelatinize. These buttery transparent gels were used to enhance the
paint's brushability and to achieve greater transparency [Carlyle 1999]. Gardner in the test protocols of
1911 [Gardner 1911] describes the tendency of lead and zinc to form metal linoleates. In the edition of
1930 [Gardner 1930] he describes the use of aluminium stearate to coat the surface of pigment particles
and helped prevent settling as well as reducing the amount of oil needed to wet. Aluminium stearate
was ground with the pigment before the bulk of the oil was added [Tumosa 2001] and it is still used as
coating for titanium dioxide in order to control dispersion in the oil [Terry et al. 2005].
The zinc soaps used in the paint industry [Stanley 1946] were linoleate; naphthenate; oleate, resinate
and stearate, the last defined as the most usual soap. Zinc soaps are considered quite effective when
are incorporated in the oil before grinding the pigments29. Zinc stearate has long been one of the most
widely used compounds to produce matte or flat finishes in varnish and lacquers [Stanley 1946].
27 The use of aluminium stearate in the paint formulation was patent in 1920 [Tumosa 2001]. The use of "linoleate
or oleate of alumina" in vermilion tubes was mentioned by Church27 in 1901 [Church 1901, pg.67].
28 Lead acetate was the only metallic drier, offered in artists' colormen catalogues until the last decades of the 19 th
century and the most mentioned in the artists' instruction books and handbooks. Litharge, white lead, and red lead
were mention as additions to slow-drying pigments to enhance their drying properties [Carlyle 1999] 29 To a careless manufacture, the metal soaps present a simple solution of all colour-grinding problems and because
they have great bulk and are comparatively inexpensive, they are well suited for use as deliberate adulterants or
cheapeners [Mayer 1982, pg.148].

76
Ripolin30 was the first company to use zinc-oxide31 enamel paints on a large scale [Casadio and Rose
2013a]. The presence of high concentration of ZnO is considered an indicator of enamel paint; anyway
zinc white emerges as an artist’s pigment in the second quarter of the 19th century and its use increased
simultaneously with the rise of the use of the house paint [Arslanoglu et al. 2013].
Compared to artist’s oil paint, commercial prepared enamel paint offered the artist different visual and
handling properties, including a unique range of surface gloss and colours, great fluidity, and relatively
short drying times [Gautier et al. 2009]. High gloss exterior paints could be achieved by including zinc
stearate, among other methods [Standeven 2011]. The research ledl32 by The Art Institute of Chicago
(AIC) characterized the Ripolin enamel products and its use as an artist’s materials in the works of
Picasso [Muir et al. 2013; Casadio et al. 2013c; Arslanoglu et al. 2013] Picabia [King et al. 2013], Sidney
Nolan [Dredge et al. 2013], and Kandinsky [Mcmillan et al. 2013]. Based on the work of Gautier et al.
[Gautier et al. 2009] the presence of metal soaps is defined as one of the features that indicates the
presence of enamel paint. They has suggested that zinc carboxylates are products of interaction
between zinc white and oil, as well as the presence of driers based on cobalt and lead [Gautier et al.
2009]. However, it is meaningful that Standeven reports the addition of zinc stearate in gloss exterior
paint formulations [Standeven 2011]. However, the distinction between oil paint tubes and enamel paints
is not straightforward [Mcmillan et al. 2013]. Arslanoglu et al. [Arslanoglu et al. 2013] report that the
characterization of the binder by mass spectrometry could be affected by the addition of metal soaps in
the manufacture process, because it changes the ratios of the fatty acid used to characterize the oil.
Based on the literature, there exist other features that can be used to differentiate Ripolin from artist’s
tube paint: (1) the dominance of zinc-based whites instead of the basic lead carbonate [Gautier et al.
2009]; (2) French Ripolin contains only trace amount of fillers [Mcmillan et al. 2013]; (3) small particle
size (150-300 nm length/diameter range) [Mcmillan et al. 2013]; (4) absence of many common
pigments33 used in artists’ tube paints [Mcmillan et al. 2013; Gautier et al. 2009]; (5) the use of mixtures
of primary colours (yellow, blue and red) to achieve secondary (orange, violet, green) and tertiary colours
(yellow-orange; red-orange; red-violet; blue-violet; blue-green; yellow-green) [Gautier et al. 2009].
30 Ripolin was developed in the Netherlands in the early 1890s by Carl Julius Ferdinand Riep. In 1897 Riep’s
Briegleb paint company formed a partnership with the French artist’s paint manufacture, Lefranc. The merged
company was called Ripolin with the first factory opening in France in that year [Standeven 2013].
31 Zinc white replaced the lead white in the preparation of the house paints. Lead white is toxic and has a tendency
to darken when exposed to polluted atmospheres rich in sulphur [Casadio and Rose 2013a].
32 Recent interest on enamel paint was reflected in the popularity of conference such as “Issues in Contemporary
Oil paint” (Amersfoort, The Netherlands March 2013) and “From Can to Canvas: Early uses of house paints by
Picasso and his contemporaries in the first half of the 20th century” (Marseille and Antibes, France, May 2011)
[Casadio et al. 2013b].
33 Cadmium pigments, cobalt–based blue pigments, emerald green, and cobalt violets.

77
1.2.3 Pigment alteration
The darkening of Chrome yellow
Luis Nicolas Vauquelin identified the chromium element in 1797, and his first synthesis of the lead
chromate is dated 1809 [Kühn and Curran 1986]. Process modifications such as the pH condition in the
synthesis of the lead chromate result in different crystal structures and different hues: the hues change
from the orange-red tone, of the basic lead chromate (Pb2CrO5) obtained in alkaline condition to a deep
lemon yellow (mixed-crystals of lead chromate and lead sulphate34, Pb(Cr,S)O4) if the synthesis is
carried out in acidic conditions.. The yellow-orange pure lead chromate (PbCrO4) is obtained using a
neutral pH [Harley 2001; Erkens et al. 2001].
Figure 12. Example of darkening of chrome yellow pigments in Vincent van Gogh painting. Bank of the Seine (F
293s 77v/1962) (mid 1887), oil on canvas (32 x 46 cm); Van Gogh Museum, Amsterdam (Vincent van Gogh
Foundation). Painting analysed by Monico et al. [Monico et al. 2011b].
The lower stability of the lead chromate pigments were discussed by 19th century chemists and artist’s
colourmen. Vibert in The science of painting [Vibert 1892], classified chrome yellow as bad pigment:
Lead, in combination with other bodies, furnishes many yellow colours more or less bad. Such as […]
Chrome yellows (chromate of lead) […]. All these colours get black or decompose the metallic
combinations with which they are associated [Vibert 1892, pg.166]. Nowadays, the darkening of the
34 A mixed-crystal is a solid solution, i.e., a crystalline structure in which one or more atoms are substituted by others
that can assume the same geometry, without changing the structure. The term mixed-phase pigment is also
commonly used [Buxbaum 1998; Erkens et al. 2001].

78
chromate pigments affects important oil artworks such as some van Gogh (Fig.12) [Monico et al. 2011a]
and Georges Seurat [Zanella et al. 2011] paintings.
The inconsistency35 of this phenomenon may be related to numerous variables (such as ambient
conditions and/or related to restoration procedures) that are part of the history of painting. Moreover,
the diversity of chrome yellow formulations and the complexity of the ageing process in an oil matrix
play a relevant role [Otero et al. 2012]. Recently, important contributions have been made to further our
understanding of the degradation processes involved in the darkening of chromate based pigments.
Analysis of degraded paint samples from painting by George Seurat and van Gogh, using µ-X-ray
Absorption Near Edge Structure (µ-XANES), demonstrated that the alteration of chromate pigments:
zinc yellow (zinc potassium chromate K2O.4ZnCrO4·3H2O) [Zanella et al. 2011] and chrome yellow
[Monico et al. 2011a; Monico et al. 2013], is associated with the reduction of the original Cr (VI) of the
chromate based pigments to Cr (III) (Fig.13).
Figure 13. Detection of Cr (VI) and Cr (III) species using K-edge XANES spectra36. In black the spectrum of Cr(III)
oxide (Cr2O3) and in orange the reference Crocoite mineral, Cr(VI) (Department of Conservation and Restoration
of the Universidade NOVA de Lisboa).
Zanella et al. [Zanella et al. 2011] studied the degradation of zinc yellow (zinc potassium chromate)
using artificial aging of paint samples containing modern Zn yellow in oil. This work proposes two
different degradation processes depending on the relative humidity conditions. They observed a
changing of the colour of the paint sample from yellow to ochre after aging in the presence of SO2 and
under low relative humidity (50%). On the other hand a dark green tone was observed in the samples
aged under high relative humidity (90%) and in the presence of SO2. By artificial aging of historical 19th
35 Degradation phenomenon was not observed in all the paintings of van Gogh, even where this problem appeared
it doesn’t affect all areas uniformly where chrome yellow pigment is used. Fortunately, in the works of Amadeo that
we have studied, chrome yellows appear to be unchanged [Melo et al. 2008; Otero et al. 2012]. 36 The pre-edge peak around 5.993 Kev for the Cr K-edge is caused by a bound state 1s to 3d transition. It is
allowed in the non-centrosymmetric tetrahedral coordination, such as Cr(VI) compounds. In the case of Cr(III)
compounds that commonly exist in a centrosymmetric octahedral geometry the same pre-edge have a low intensity
[Pantelouris et al. 2004].

79
century oil paint tube samples, Monico et al. [Monico et al. 2011a] observed a relation between the
structure of the pigment and its tendency to darkening. Solid solutions of lead chromate and lead
sulphate shows more tendency to degradation compared with pure lead chromate. Moreover, a high
amount of lead sulphate in the solid solution promotes the instability of the pigment. Samples from van
Gogh paintings37 that show brown degradation of chrome yellow layer were analysed by synchrotron
techniques, in these samples the reduction of Cr appears to be associated with the presence of (one or
more) sulphate compounds. Moreover the alteration was especially evident in areas rich in Ba, S, and/or
Al/Si [Monico et al. 2011b].
Based on the fitting of a combination of XANES spectra of several chromium reference compounds with
the spectra of degraded paint samples, Casadio et al. [Casadio et al. 2011] and Monico et al. [Monico
et al. 2013] suggested that the degradation products may be chromium oxide (Cr2O3) and viridian
(Cr2O32H2O), chromium(III) acetate (Cr(C2H3O2)3) or potassium sulphate dodecahydrate
[KCr(SO4)2.12H2O]. Artificial ageing using UVA/Vis light of a paint sample from a 19th century oil-paint
tube was also investigated in nanoscale by Tan et al. [Tan et al. 2013]. The model proposed is based
on a core-shell structure, where the lead chromate degrades by the dissolution of CrO4-2 ions, which
react with the organic binder of the paint at the interface with micro-droplets of aqueous solution. This
results in the reduction of Cr(VI) to Cr(III), Cr2O3 precipitates at the surface of pigment particles. This
model is based on different behaviours for the pure chrome yellow sample and the solid solution of
chromate and lead sulphate: after that the samples were taken out of the paint tubes, the particles
gradually evolved to PbCrO4–Cr2O3 core–shell and PbCrO4–PbSO4 core–shell, respectively. Artificial
aging leads them to the formation of Cr2O3 and PbCrO4–PbSO4–Cr2O3.
In order to develop a model able to explain this phenomenon, it is essential to have an accurate
characterization of the chrome yellow in the paintings as well as aging tests on samples prepared by
Historically Accurate Reconstructions Technique (HART). This methodology is currently being used at
the Department of Conservation and Restoration of the Universidade NOVA de Lisboa38; in April 2014
a mission to the European Synchrotron Radiation Facility (ESRF) in Grenoble took place. During this
mission unaged and aged paint reconstructions and painting samples, including two samples from the
paintings studied in this thesis (BRUT and Entrada) were analysed by µ-XANES and µ-FTIR. The results
obtained by the analysis of artificially aged HART samples confirmed the reduction of Cr(VI) to Cr(III) in
the degraded samples. The preliminary analysis of the HART samples reveals that pigments based on
mixed-crystals (Primrose and Lemon) show a higher relative stability than those composed of pure lead
chromate in mixture with calcium carbonate and gypsum (Middle Chrome Yellow). These results may
37 Identified in the samples from the van Gogh paintings was monoclinic PbCrO4, monoclinic PbCr1-xSxO4, and
mixtures of monoclinic and orthorhombic PbCr1-xSxO4 species [Monico et al. 2013].
38 Research developing under the PhD thesis project of Vanessa Otero «Bright colours: historically accurate
reconstructions of Amadeo's palette » at DCR-UNL.

80
be explained by the pigment absorption in the formulation, which we consider to be lower for the mixed
crystals, and by the light effect on fillers such as calcium carbonate [Otero et al. 2014c].
The fading of Eosin based lake
Lake pigments based on eosin were synthetized in the 19th century and with the name Geranium Lake
very early became popular among the impressionist painters. A large number of studies show that this
class of pigments is responsible for the fading of many of van Gogh’s paintings [Peres et al. 1991; Rioux
1999; Burnstock et al. 2005; Claro et al. 2010; Geldof and Steyn 2013].
In 1860 the German chemist Adolf Baeyer synthetized the first compound of the hydroxy-phthalein
group, the fluorescein (Fig. 14). The sodium salt of the fluorescein was introduced very soon in the
market by the Badische Anilin & Soda Fabrik (BASF) and other German companies. In 1873 the
research director of BASF, Heinrich Caro, discovered that by bromination of fluorescein was possible to
obtain a red dye, that he called Eosin (Fig. 14). Eosin was introduced in the marked the year after. The
iodination of fluorescein, named erythrosin (Fig.14) was synthetized in 1875 by the chemist Emilio
Nölting. The Eosin-based lake pigments are obtained by precipitating the soluble dyes with aluminium
and lead salts, the colour range of the pigment is from orange scarlet to bluish-red [Geldof and Steyn
2013]. The instability of this pigment was known already in the 19th century, Jehan-Georges Vibert
(1892) advised against the use of synthetic reds that had recently become available for artists. Adolf
Lehne (1893) described that the pigment “appeared pale only 5 days after and completely faded after
18 days”. Van Gogh in 1888 wrote to his brother about the fading that was occurring in his paintings and
explained that he intended to overcome the problem by the application of excessively pronounced
colours [Rioux 1999; Geldof and Steyn 2013].
Figure 14. Molecular structures of fluorescein, eosin and erythrosine, image adapted from [Geldof and Steyn 2013].
Aside from the light exposure other factors are recognized to accelerate this phenomenon, such as high
conditions of humidity, or the gaseous pollutants [Salmon and Cass 1993]. The method of extraction, in
the case of the natural lake, the substrate used for the precipitation can also influence in the lightfastness
of the lake. Burnstock et al. [Burnstock et al. 2005] tested the stability39 of lakes made from cochineal,
39 The lakes were light aged at 25 °C and 60% relative humidity, using 36 W Philips colour 96 fluorescent lamps
(10,000 lux) for 2850 hours [Burnstock et al. 2005].

81
brazilwood (on aluminium- and tin-containing substrates), eosin, madder, and Kopp’s purpurine. The
paint was prepared with water-washed linseed oil. Each paint was also mixed with lead white paint, zinc
white paint, Megilp or chalk. The study suggests that cochineal and madder lake paints are more stable
comparing with brazilwood/madder combinations, and that brazilwood and eosin lakes are the most
fugitive. Comparable results was obtained by Saunders and Kirby [Saunders and Kirby 1994]. Lakes
with a tin-containing substrate are usually less stable than those on an aluminium-containing substrate.
Fading is also influenced by the thickness of the layer and by the concentration of the dyestuff. The
presence of lead white in the mixture accelerates the fading. Lead white and zinc white were also found
in the two van Gogh’s paintings with the most evident problem of fading.
Recently digital colour reconstruction was applied for van Gogh paintings, such as the case of The
bedroom (1888). Van Gogh described this painting to his brother Theo “[…] the walls are of a pale violet.
The floor — is of red tiles […] the doors lilac. And that’s all — nothing in this bedroom, with its shutters
closed40. Actually, this colour turned into pale blue tone due to fading of the lake pigment leaving the
cobalt blue alone visible [Geldof and Steyn 2013].
Figure 15. iPad application of the digital reconstruction of van Gogh painting The bedroom (1888). The user can
observe the differences between the present state of the painting and it colour reconstruction [Vet and van Kregten
2014].
A digital reconstruction of the original colours of van Gogh’s paintings was carring out by Dr. Roy Berns.
The reconstruction of the colour was based on reflectance spectroscopy analysis in the visible region
performed on the painting where colour changes were not observed and when possible, on protected
regions. When these areas were not available for measurement, reference samples were prepared
using materials to the original. By the application of a linear algebra model, the original colour was
recalculated and shown as a RGB image [Berns 2005]. This research was part of the eight years project
on the study of the materials and techniques of van Gogh that culminated with the exhibition Van Gogh
40 Letter from Vincent van Gogh to his brother Theo, Arles, 16 October 1888. From Vincent van Gogh The Letters
archive available on line http://vangoghletters.org/vg/ (last accessed October 2014)

82
at Work. For this exhibition, installed tactile supports were installed (as iPads) that offered to the visitor
the possibility to see “underneath the visible paint layer”. An example of this application is the colour
reconstruction of The bedroom painting showed in Figure 15.

83
CHAPTER 2: ANALYSIS OF THE PAINTINGS
This chapter presents the main results on the study of the materials and techniques of four of the last
paintings produced by Amadeo in 1917, including a description of what we consider to be the maquette
of his last works. The selection of the four paintings, between those dated 1917, was performed with the
help of the art historian Helena de Freitas. These paintings were chosen because they have the whole
colour palette that Amadeo uses in his oil works, but at the same time show the peculiar elements of his
last period such as the use of unconventional and found materials such as sand, mirrors and glass.
Particular attention will be given to the analysis of Amadeo’s colour language comparing it with that used
in his previous works (Section 2.1.3). This chapter also presents the main important conservation issues
related to these paintings (Section 2.2). Part of the analysis and the sampling of the paintings took place
in situ at the Center of Modern Art of the Gulbenkian Foundation in Lisbon in April 2013. The analysis
of these paintings enriches the study of Amadeo’s techniques developed by DCR-FCT in 2008 [Melo et
al. 2009; Melo et al. 2009]. The details on the analytical techniques used are presented in Appendix
Part II, Ap. II. The areas of analysis, the main representative spectra and the results obtained by the
analysis of micro-samples are presented in Appendices of the Part II from Ap. IV to VII.
2.1 The paintings of 1917
The four paintings dated 1917 studied in this thesis are presented in Figure 16. Although these paintings
are untitled, three of them are usually known as BRUT 300 TSF, Entrada, and Coty1. These paintings
were exhibited for the first time in Paris after the death of Amadeo (BRUT, Entrada and Coty in 1925;
Untitled in 1958). These works are considered as a homogenous nucleus and probably the most relevant
and innovative art works by Amadeo (Section 1.1.2).
The archive of Amadeo at the Art Library of the Calouste Gulbenkian Foundation includes a photograph
that represents a collage work, Figure 17A. This collage shows many similarities with some of the
Amadeo’s oil paintings and in particular with BRUT and Entrada; for this reason we suggest the
hypothesis that it is a maquette made before these paintings were executed. This photograph, probably
taken by Amadeo himself, is the only evidence of this work that has ever been found. The collage was
likely made by gluing pieces of paper and objects onto a support. The collage shows half of the headline
of the Madrid edition of the newspaper “La correspondencia de España” (Fig. 17B), which was published
in Spain between October 19, 1912 and December 31, 19182. In the collage also visible are two portions
of the flyer that Amadeo included in the album “12 Reproductions” (Fig. 17C) which was published at
the time of his Porto exhibition in November 1916 (Section 1.1.2). This flyer might suggest a date after
1 To simplify the text, the 4 paintings are called BRUT for the painting Untiled, (BRUT 300 TSF) Inv. 77P20; Entrada
for the painting Untiled, (Entrada) Inv. 77P9; Coty for the painting Untiled, (Coty) Inv. 68P11 and Untitled for the
painting Untiled, Inv. 77P8 [Freitas et al. 2008]. 2 Personal communication with the Spanish newspaper archive.

84
which this work was performed. Comparing the dimension of the headline of the newspaper with that
present in the collage it is possible to deduce that maquette could measure 100x70 cm.
Figure 16. Paintings of Amadeo de Souza-Cardoso dated 1917. Collection of Centro de Arte Moderna, Fundação
Calouste Gulbenkian. Untitled (BRUT 300 TSF) Inv. 77P20 (85.8 x 66.2 cm); Untitled (Entrada) Inv. 77P9 (93 x 76
cm); Untitled (Coty) Inv. 69P11 (93 x 76 cm); Untitled Inv. 77P8 (93.5 x 93.5 cm).

85
Figure 17. A Image of the Collage (Art Library of the Calouste Gulbenkian Foundation ASC09/16); B Headline of
the Madrid edition of the newspaper “La correspondencia de España”; C Flyer included in the album “12
Reproductions” (1916) (Art Library of the Calouste Gulbenkian Foundation ASC 221). Image of the flyer from Alfaro
2007, pg. 235.
Figure 18. Image details of the word ZINC on the maquette (top) and on Untitled (ZINC), c. 1917, 59 x 49 cm.
Private Collection (down) [Freitas et al. 2008, pg. 355].
In the collage are visible four pochoirs of the letters Z, I, N and C. Figure 18 shows the comparison
between these four letter and the word ZINC, in the painting Untitled ZINC (1917) (Appendix Part II

86
Ap.I). The dimension of the letters of the pochoirs3 and those in the painting are comparable. This
suggest that the pochoirs in the collage were used for the painting ZINC. Based on this hypothesis it is
possible that the painting ZINC (or at least the word in the painting) was completed before the collage
and therefore before the paintings BRUT and Entrada.
Figure 19. Image details (from left to right) of the rag doll in: the maquette; Canção popular a Russa e o Figaro,
1916, 80 x 60 cm. Collection of Centro de Arte Moderna, Fundação Calouste Gulbenkian (Inv. 77P18) [Freitas et
al. 2008, pg. 333] and Trou de la serrure PARTO DA VIOLA Bon ménage Fraise avant garde, 1916, 70 x 58 cm.
Collection of Centro de Arte Moderna, Fundação Calouste Gulbenkian (Inv. 68P17) [Freitas et al. 2008, pg. 336].
Appendix Part II Ap.I. shows the images of the paintings.
The maquette presents also other elements reproduced in the oil paintings of Amadeo: Figure 19 shows
the comparison between the rag doll4 applied in the maquette and its representation in two of Amadeo’s
paintings. The relation between the collage and the paintings BRUT and Entrada is exemplified by the
presence in the maquette of the words that give the titles of these two artworks (Fig. 20A, B). The
meaning of the word ENTRADA was explored by Rui Mario Gonçalves [Gonçalves 2006, pg. 27] who
related it to the sign for a bullring. Rui Afonso Santos suggested that it could be the indication of a
theatre entrance [Lapa 1999]. More recently, Cunha Leal [Cunha 2010] identified in the painting Entrada
a few elements related to Portugal and the United States entering in the First World War (1914-1918).
The representation of the guitar is another element common to the collage and Amadeo’s paintings. The
piece present in the up left corner of the collage (probably of wallpaper) is accurately reproduced in the
same position in the painting Entrada. The construction of the black lines visible in the maquette is
interesting: they are obtained with wire fixed with nails and they seem to reproduce the mechanism
represented in Untitled. In maquette we also find what seems to be a tambourine which is represented
3 The dimensions (h. 4.3 cm) of the letters Z, I, N and C were calculated considering the 100 x 70 cm proposed as
dimension of the collage. 4 The rag doll is a handcraft product of the north of Portugal. The collection of Modern Art Centre of the Calouste
Gulbenkian Foundation conserves an example of a doll that belonged to Amadeo.

87
stylized in the painting BRUT. Another stylized element, reproduced in Entrada, is the lamp Wotan
whose advertisement is glued in the maquette (Fig.20C).
Figure 20. Comparison between maquette (upper part) and Entrada painting (lower part) A Images details of the
word ENTRADA B word BRUT 300 KK and C advertising of the lamp Wotan.
As mentioned in Section 1.1.3, the absence of pentimenti and overlaps between the figures of the
composition, together with the alla prima technique used by Amadeo, suggests that the artist precisely
planned the painting before its execution. In the case of the last paintings, the existence of the
photograph of the collage strongly suggest that the collage may have been a maquette for his last works.
2.1.1 Unconventional materials
One of the main differences between the paintings analysed for this thesis and those analysed in
previous works [Melo et al. 2008] is the use of unconventional and found materials. Figure 21 shows the
mapping of these materials, while Table 1 shows the percentage of the area occupied for each class of
object. Unconventional materials such as spheres of silica or calcium carbonate and sand were added
to the paint to create a new texture, while the found objects seem to be used with a narrative meaning.
Coty is the painting in which Amadeo developed this technique the most: in this painting the artist applied
a pearl necklace and hair clips (Fig. 22) but also potash-silicate mirrors and painted glasses (µ-EDXRF
analysis in Appendix Part II Ap.V.1). An example is the glass painted with the silhouette of a bottle of
the perfume5 that gives the name to the painting (Coty) glued in the lower left corner of the painting.
This glass is applied to the canvas using oil mixture of calcium carbonate and gypsum; on the surface
of the white dirty mass was found traces of a golden layer; EDS-SEM analysis detected the presence
zinc and copper (µ11) (please see Appendix Part II Ap.VI.3) that suggest the surface originally have
been gilded with foils. Unfortunately, at present this golden effect is no longer evident visually.
5 The advertisement of the perfume Coty appears in the futuristic poem Apotheosis written by Sá-Carneiro in
Orpheus 2 in 1915.

88
Entrada
BRUT
Coty
Untitled
Figure 21. Mapping of ● silica, sand, calcium carbonate; ● glass and mirrors; ● found materials, hair clips, matches
and a box of matches; ● starch.

89
Table 1. Percentage area of paintings with unusual materials and with glass and mirrors.
Unusual materials (% area) Glass and mirrors (% area)
BRUT 5,3 --
Entrada 12,6 1,15
Coty 29,2 8
The use of four mirrors on the top of Coty is interesting: they are glued at the same height of the stylized
face of the female figure. Rui Mario Gonçalves [Gonçalves 2006] assigns two functions to the use of
mirrors in that painting: the first one is related to the "impossibility of visually reproducing a mirrored
surface" and the second related to the "creation of a virtual space, beyond or below the plane of the
screen [...] also a willingness to subvert the position of voyeur: the observer who ends up watching
himself 6".
Figure 22. Image details of found objects in Coty, from left to right: mirrors; painted glass and one mirror; necklace;
hair clips.
In the lower right corner of the paintings Entrada and Untitled some matches are represented: in the first
case the matches are painted (Figs. 23A and B) while in the second case 13 wax matches are glued
onto the surface together with a piece of the wooden matchbox. The matchbox is covered with spheres
of calcium carbonate and a thin golden layer. Thanks to the help of the Portuguese Association of
Phillumenism it was possible to discover the origin of the matchbox. It was produced between 1895 and
1911 by the Companhia Portugueza de Phosphoros7 (Portuguese’s matches company). Figure 23
compares the label present in the painting (C) and an example of the same box conserved by the
Association (D).
6 [...] A presença de espelhos é frequente na fase final [...] noa tem apenas a função de resolver dois problemas
pictóricos: um, a impossibilidade pictórica de reproduzir visualmente uma superfície espelhada; outra a criação de
um espaço virtual, para além ou para aquém do plano da tela. A presença de fragmentos de espelhos corresponde
também a uma vontade de subverter a posição de voyeur: o observador acaba por se observar a se próprio
[Gonçalves 2006].
7 The matchbox present in the Untitled was produced by the Company of Portugueza Phosphoros between 1895
and 1911. In 1895, Francisco Borges created a consortium that included six match companies of Porto and Lisbon
[Sottomayor 2011, pgs.59-60]. The matchbox found in the painting was produced in the factory of Lordelo (north of
Portugal). The monopoly remained until 1925, when the deregulation of the matches manufacture was instituted.

90
Figure 23. A Detail of the painted representation of the matches in Entrada (7x) B Detail of the wax matches and
C of the box label applied on Untitled D Wooden matchbox very similar to that in Untitled which is in the collection
of the Portuguese Association of Phillumenism.
2.1.2 Preparation layer
FTIR, Raman and SEM-EDS analyses show that the preparation layers of the four paintings are a
mixture of lead white (Dutch process) and calcium carbonate, with oil as binder. Figure 24 shows a SEM
image in BSE mode of the 4 cross-sections from the paintings: in the samples taken the thickness of
the preparation layers is around 140 µm for BRUT; 100 µm for Entrada and between 42 e 30 µm for
Coty and Untitled.
In BRUT a red layer has been applied over the preparation layer; this is the only case of coloured layer
in Amadeo’s artworks studies. Figure 25A shows the back of the painting where the red layer is visible;
the presence of white spot where the red layer was not applied suggests that it was applied when the
canvas was fixed with round nails, probably before the application on the current frame (the actual frame
is not original). As mentioned before, Amadeo did not made overlaps between the elements of the
composition; for this reason the red layer is visible also in the front of the painting (Figure 25B). The thin
red layer (around 6 µm) appears in the cross-section in Figure 25C and is composed of a mixture of
vermilion, ochre and barium sulphate (Raman analysis of µ1 presented in Appendix Part II Ap.V.3.
Cross-section (µ12) analysis presented in Appendix Part II Ap.VI.2).

91
Figure 24. SEM image in BSE mode of the preparation layers A Coty (µ6); B Entrada (µ 33); C BRUT (µ12); D
Untitled (µ6), (Appendix Part II Ap.IV.1 shows the sampling areas).
Figure 25. Red layer in BRUT A Detail image from the back of the painting; B Photomicrographs of the paint surface
(10x); C Cross-section of the sample µ12 where it is possible to observe the red layer (the sampling area indicated
in Fig. IV.2 Appendix Part II Ap.IV.1).
2.1.3 Amadeo's colour language
Twenty four paintings by Amadeo were digitalized by hyperspectral imaging with high spectral and
spatial resolution. The paintings were chosen considering different periods of the Amadeo’s career,
between 1911 and 1917. The reflectance spectrum of each pixel of the hyperspectral image was
estimated and its colour was computed assuming the D65 standard illumination. The colorimetric data
obtained was represented in the CIEL*a*b* uniform colour space. The analysis of the 24 paintings is
presented in Appendix Part II Ap.III, here is presented the analysis of the four analysed paintings dated

92
1917. The colorimetric analysis shows that the four paintings have a similar number of discernible
colours 8 and a similar distribution. The paintings dated 1917 are characterized by a higher number of
discernible colours (80.000) compared with previous works, where a mean average of 53.000 colours
was calculated (Appendix Part II Ap.III). Figure 26 shows the colour range of each painting represented
in the CIE(a*b*) plot, where the blue area is the sum of the colorimetric coordinates of each pixel of the
hyperspectral image. In general the colour range goes between -30>a*<40 and -40>b*<60 with lightness
(L*) values uniformly distributed around 50 (±15). In these paintings, in contrast to those dated before
1917, Amadeo used a palette of saturated hues; the tones used almost reach the limit of the CIE(a*b*)
colour space. As well, the shape of island-like colour distribution suggests the use of patches of colours.
The distribution of the colours shows a high similarity between the paintings BRUT and Entrada. This
similarity, suggested also by the analysis of images in the maquette (Section 2.1.1) was also detected
by the paint materials used (presented below).
Figure 26. Colour distribution on the CIE(a*b*) colour space. The CIEL*a*b* values were calculated from the
spectral reflectance of the hyperspectral images of the 4 paintings.
The analysis of the four paintings shows the use of an oil binder. In the case of BRUT and Entrada the
presence of zinc carboxylates suggested the addition of metal soaps to the paint; this point will be
discussed in Section 2.2.1. Tables 2A and 2B present the pigments identified in the four paintings dated
1917. The representative spectra for each pigment acquired using multi-analytical techniques are
presented in Appendix Part II.V.1-5.
8 The number of discernible colours were estimated assuming the CIE 1931 standard observer by segmenting the
CIEL*a*b* colour volume into unitary volumes; the just noticeable difference (JND) was assumed to be ΔE=1 in
CIEL*a*b*.
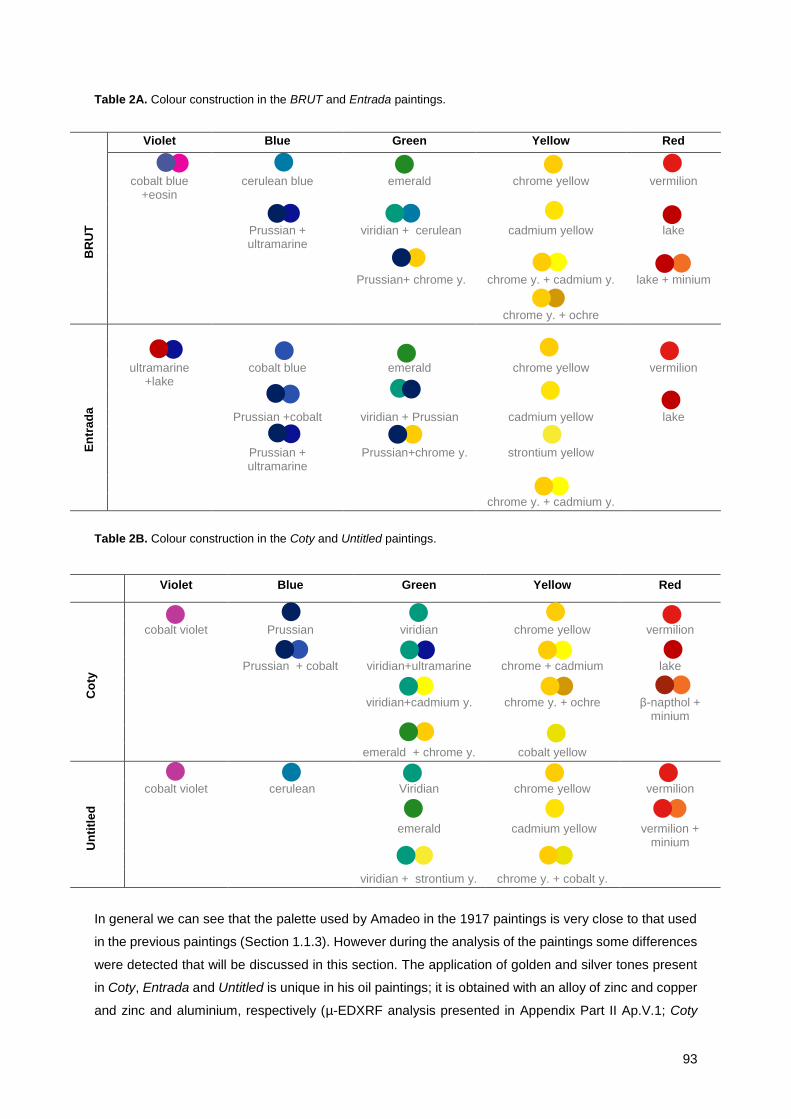
93
Table 2A. Colour construction in the BRUT and Entrada paintings.
Table 2B. Colour construction in the Coty and Untitled paintings.
In general we can see that the palette used by Amadeo in the 1917 paintings is very close to that used
in the previous paintings (Section 1.1.3). However during the analysis of the paintings some differences
were detected that will be discussed in this section. The application of golden and silver tones present
in Coty, Entrada and Untitled is unique in his oil paintings; it is obtained with an alloy of zinc and copper
and zinc and aluminium, respectively (µ-EDXRF analysis presented in Appendix Part II Ap.V.1; Coty
Violet Blue Green Yellow Red
BR
UT
cobalt blue +eosin
cerulean blue emerald chrome yellow vermilion
Prussian + ultramarine
viridian + cerulean cadmium yellow lake
Prussian+ chrome y. chrome y. + cadmium y. lake + minium
chrome y. + ochre
En
tra
da
ultramarine +lake
cobalt blue emerald chrome yellow vermilion
Prussian +cobalt viridian + Prussian cadmium yellow lake
Prussian + ultramarine
Prussian+chrome y. strontium yellow
chrome y. + cadmium y.
Violet Blue Green Yellow Red
Co
ty
cobalt violet Prussian viridian chrome yellow vermilion
Prussian + cobalt viridian+ultramarine chrome + cadmium lake
viridian+cadmium y. chrome y. + ochre β-napthol + minium
emerald + chrome y. cobalt yellow
Un
titl
ed
cobalt violet cerulean Viridian chrome yellow vermilion
emerald cadmium yellow vermilion + minium
viridian + strontium y. chrome y. + cobalt y.

94
micro-samples analysis in Appendix Part II Ap.VI.1-3). These metallic tones were found only in La
Légend de St Julien L’Hospitalier, the illustrated manuscript dated 1912 (Part II, Section 1.1.1). In this
work they were obtained with foils of gold and silver, respectively9.
The analysis of the violet samples10 collected from the four paintings show that Amadeo obtained this
colour using cobalt violet pigment in Coty (samples µ13,15) and Untitled (sample µ9) and using a mixture
of blue and red in BRUT and Entrada. Cobalt violet (Co3(AsO4)2) was also present in the palette before
1917; in contrast, the mixture of blue and red pigment was not detected in previous artworks. FTIR
spectra of cobalt violet is characterized by the strong absorption band at 878 cm-1 attributed to anti-
symmetric As-O stretching [Casadio at al. 2012]. Cobalt violet was also confirmed by Raman
spectroscopy based on its characteristic bands at 842 and 872 cm-1 attributed to the anti-symmetric and
symmetric As-O stretching, respectively [Casadio at al. 2012; Martens at al. 2003] (Figure 27A and B).
In BRUT the purple tone is obtained with a mixture of cobalt blue (CoO.Al2O3) and eosin (sample µ19)
and in Entrada with a mixture of Prussian blue (Fe4[Fe(CN)6]3) and Madder lake (sample µ20). The
instability of eosin is well known [Claro et al. 2010; Geldof and Steyn 2013]; this instability is visible in
BRUT where the fading of the eosin-based lake revealed the bluish of the cobalt blue pigment; this point
will be presented in more detail in Section 2.2.2.
Figure 27. Violet sample (sample µ13) from Coty painting; A Infrared spectrum () cobalt violet pigment; B
Raman spectrum.
Viridian (Cr2O3.2H2O) was the main green pigment in Amadeo’s palette before 1917; in Coty and
Untitled, it continues to be the most frequently used green pigment; alone (in Coty, sample µ14 and in
Untitled sample µ14) and in mixture with ultramarine (Coty sample µ14); with the cadmium yellow (Coty
area of EDXRF analysis Gr6 and Gr8) and strontium yellow SrCrO4 (Untitled sample µ19). Figure 28A
9 Result obtained in the PhD thesis ongoing project of Ana Margarida Cruz da Silva «Crossing Borders. History,
materials and techniques of Amadeo de Souza-Cardoso and Eduardo Viana» at DCR-UNL.
10 The samples (identified with the letter µ) collected from the paintings BRUT, Entrada, Coty and Untitled are
indicated in the Figs. IV.2; IV.4; IV.6; IV.8, respectively in the Appendix Part II Ap.IV.1-4.

95
shows the FTIR spectra of Untitled sample µ19 with the characteristic bands of viridian at 3630–2630,
1288, 1064, 794 and 650 cm-1 [Zumbuehl et al. 2009]. Figure 28B shows the Raman analysis performed
on the same samples compared with the spectra of a reference SrCrO4 synthetized in laboratory. The
bands detected in the sample are the anti-symmetric CrO42- stretching at 892 and 864 cm-1 and the
bending at 399, 372 and 347 cm-1 [Frost 2004]. In the case of BRUT and Entrada viridian was substituted
by emerald green (Cu(C2H3O2)2.3Cu(AsO2)2) (BRUT samples µ6, µ7 and µ33; Entrada sample µ5). In
these two paintings the dark green tones were obtained also with a mixture of Prussian blue and chrome
yellow (BRUT samples µ3 and µ5; Entrada EDXRF analysis on area Gr3) or Prussian blue and viridian
(Entrada sample µ31). In the emerald green samples from BRUT the presence of starch was detected
(discussed in Section 2.2.3).
Figure 28. Green sample (µ19) from Untitled; A Infrared spectrum (●) viridian pigment; B Raman spectra from
the sample (black) and from the reference strontium yellow (grey).
Figure 29. Blue sample (Bl2) from Untitled; A reflectance spectrum; B EDXRF spectrum.
The blue tones are mainly obtained by cobalt pigments used pure (BRUT sample µ18; Entrada EDXRF
analysed Bl4, Bl9 and Bl10) or in mixture with Prussian blue (Fe4[Fe(CN)6]3) (Entrada EDXRF analysis
on the areas Bl11-15). In Entrada it is also used the mixture of Prussian and ultramarine
(Na8[Al6Si6O24]Sn) (Entrada samples µ2 and µ3).

96
In Coty and Untitled the mixture of blue pigments is less common; Prussian blue (Coty sample µ12;
EDXRF analyses Bl10-11and Bl15) and cerulean blue (CoO·nSnO2) (Untitled EDXRF analyses Bl1-6)
are mainly used pure. Figure 29A and B shows the characterization of the cerulean pigment using
reflectance spectra in the visible region and µ-EDXRF. The discrimination between cobalt (CoAl2O4)
and cerulean blue using reflectance spectroscopy is not straightforward: both pigments are
characterized by three absorption bands between 550 and 670 nm related to the crystal field transition
between in the orbital d-d of Co(II) ion [Boselli 2010]. In the case of cobalt blue the three bands are
usually less visible, and in the case of the cerulean the bands are shifted to higher wavelengths of about
20 nm [Bacci et al. 2009].
In the paintings analysed in this chapter the yellow tones occupy a large percentage of the surface:
24% in Untitled, 11% in Entrada and BRUT, and only 9% in Coty. Chrome yellow continues to be the
main yellow pigment in Amadeo’s palette followed by cadmium yellow. The proportion between the use
of chrome and cadmium yellow pigments is 2:1 in BRUT and Entrada; 3:1 in Coty and 4:1 in Untitled.
Due to the tendency of chrome yellow to degrade, all samples were fully characterised and two of these
were analysed by µ-XANES and µ-FTIR at European Synchrotron Radiation Facility (ESRF) in
Grenoble, France. The results are presented in Section 2.1.5. In addition to the chrome and the cadmium
yellow, strontium and cobalt yellow were occasionally detected. Cobalt yellow is used alone in the base
of the neck of the female figure in Coty (sample µ3) and in mixture with chrome yellow in Untitled (sample
µ33). In previously analysed paintings this pigment was found in Untitled (O Jockey) (Inv. 77P5, Fig.
5B). Cobalt yellow, called Aureolin, is a potassium cobaltnitrite K3[Co(NO2)6], but the related compound
also exists, dipotassium monosodium hexanitrocobalt(III) K3[NaCo(NO2)6] [Gates 1995]. This pigment
was introduced as an artists’ material in 1851 [Cornman 1986]. Figure 30 shows the characterization of
Coty sample µ3 using (A) FTIR and (B) Raman. Table 3 lists the band wavenumbers and the relative
assignments for FTIR and Raman analysis of cobalt yellow.
Table 3. Characteristic infrared and Raman bands assigned to cobalt yellow (K3[Co(NO2)6],) pigment [Cornman
1986; Hitchman and Rowbottom 1982; Miller and Wilkins 1952; Vendilo et al. 2011].
FTIR Raman
cm-1 Assignment cm-1 Assignment
2704 (w) -- 1326 (s) as (N-O)
2649 (w) -- 836 (m) (N-O)
1390 (vs) as (NO2) 821 (s) (N-O)
1334 (vs) s (NO2) 302 (vs) (Co-N)
827 (m) δ(ONO) 178 (w) --
w=weak; m=medium; s=strong; vs= very strong.
The BSE mode images of Coty sample µ3 show rhomb’s particles, in the particles surface it is possible
to observe small holes (Fig. 31). SEM-EDS analysis detected the presence of cobalt associated with
the presence of potassium and sodium, which suggest the presence of the potassium-sodium

97
compound. However, the amount of sodium in the sample is very low because no band shifts in the
stretching and bending bands are visible.
Figure 30. Yellow sample (µ3) from Coty; A Infrared spectrum (●) cobalt yellow pigment; B Raman spectrum.
Figure 31. Yellow sample (µ3) from Coty SEM image in BSE mode.
In the paintings previously analysed Amadeo used mainly vermilion (HgS) for a red hue and less
frequently, cochineal lake. In these last paintings vermilion continues to be used but at the same time
the use of lakes of alizarin and purpurin appears. In BRUT, 7% of the surface is painted with red lakes.
FTIR analysis shows a good match of the BRUT samples µRed1, µ11, µ26, µ28 and µ30 and the paint
tube of Brown Madder11 of Winsor & Newton (identified with the code MG1). From the same painting
the sample µ14 shows a good match with the oil paint sample of Laque Andrinople12 by Lefranc
(identified with the code MG10). Figure 32 shows the comparison between the FTIR analysis of the red
sample µ6 from Coty (black line); the spectrum of cochineal carmine lake reproduction based on a recipe
from the W&N archive (grey line) and the spectrum of carminic acid (red line).
11 HPLC analysis of the paint tube sample detected the presence of alizarin and purpurin [Melo et al. 2009]. 12 HPLC analysis of the paint tube sample detected the presence of alizarin [Melo et al. 2009].
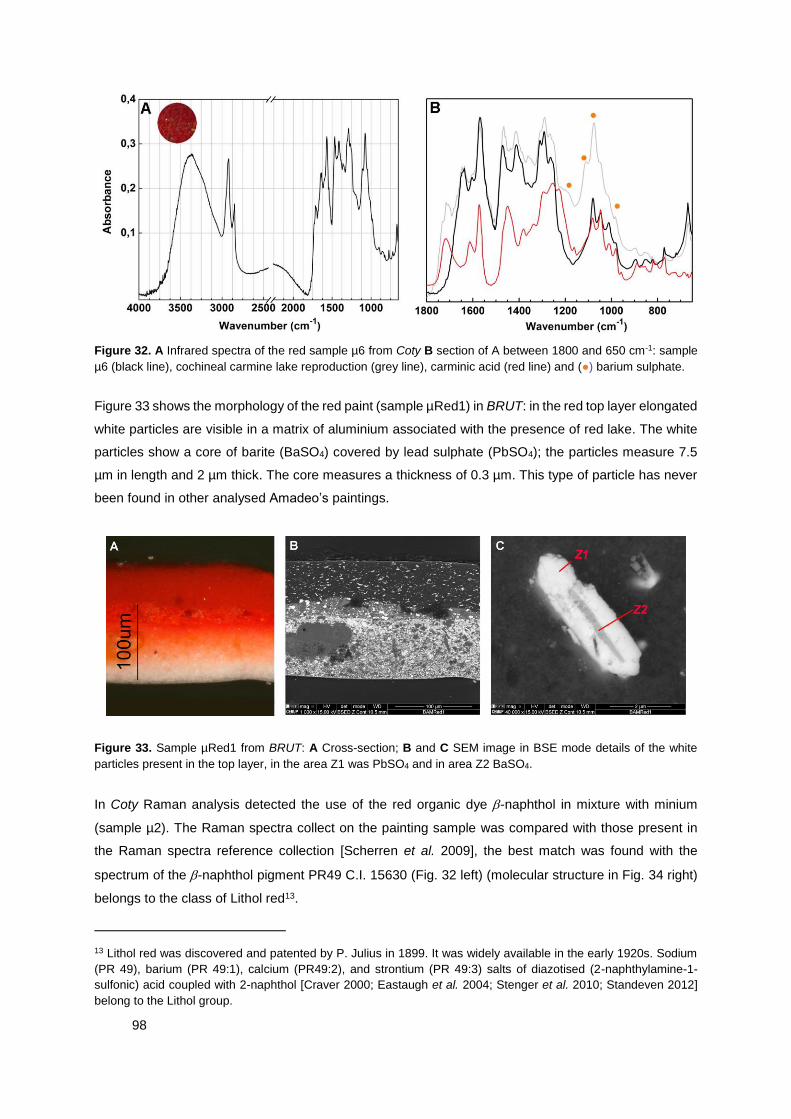
98
Figure 32. A Infrared spectra of the red sample µ6 from Coty B section of A between 1800 and 650 cm-1: sample
µ6 (black line), cochineal carmine lake reproduction (grey line), carminic acid (red line) and (●) barium sulphate.
Figure 33 shows the morphology of the red paint (sample µRed1) in BRUT: in the red top layer elongated
white particles are visible in a matrix of aluminium associated with the presence of red lake. The white
particles show a core of barite (BaSO4) covered by lead sulphate (PbSO4); the particles measure 7.5
µm in length and 2 µm thick. The core measures a thickness of 0.3 µm. This type of particle has never
been found in other analysed Amadeo’s paintings.
Figure 33. Sample µRed1 from BRUT: A Cross-section; B and C SEM image in BSE mode details of the white
particles present in the top layer, in the area Z1 was PbSO4 and in area Z2 BaSO4.
In Coty Raman analysis detected the use of the red organic dye -naphthol in mixture with minium
(sample µ2). The Raman spectra collect on the painting sample was compared with those present in
the Raman spectra reference collection [Scherren et al. 2009], the best match was found with the
spectrum of the -naphthol pigment PR49 C.I. 15630 (Fig. 32 left) (molecular structure in Fig. 34 right)
belongs to the class of Lithol red13.
13 Lithol red was discovered and patented by P. Julius in 1899. It was widely available in the early 1920s. Sodium
(PR 49), barium (PR 49:1), calcium (PR49:2), and strontium (PR 49:3) salts of diazotised (2-naphthylamine-1-
sulfonic) acid coupled with 2-naphthol [Craver 2000; Eastaugh et al. 2004; Stenger et al. 2010; Standeven 2012]
belong to the Lithol group.
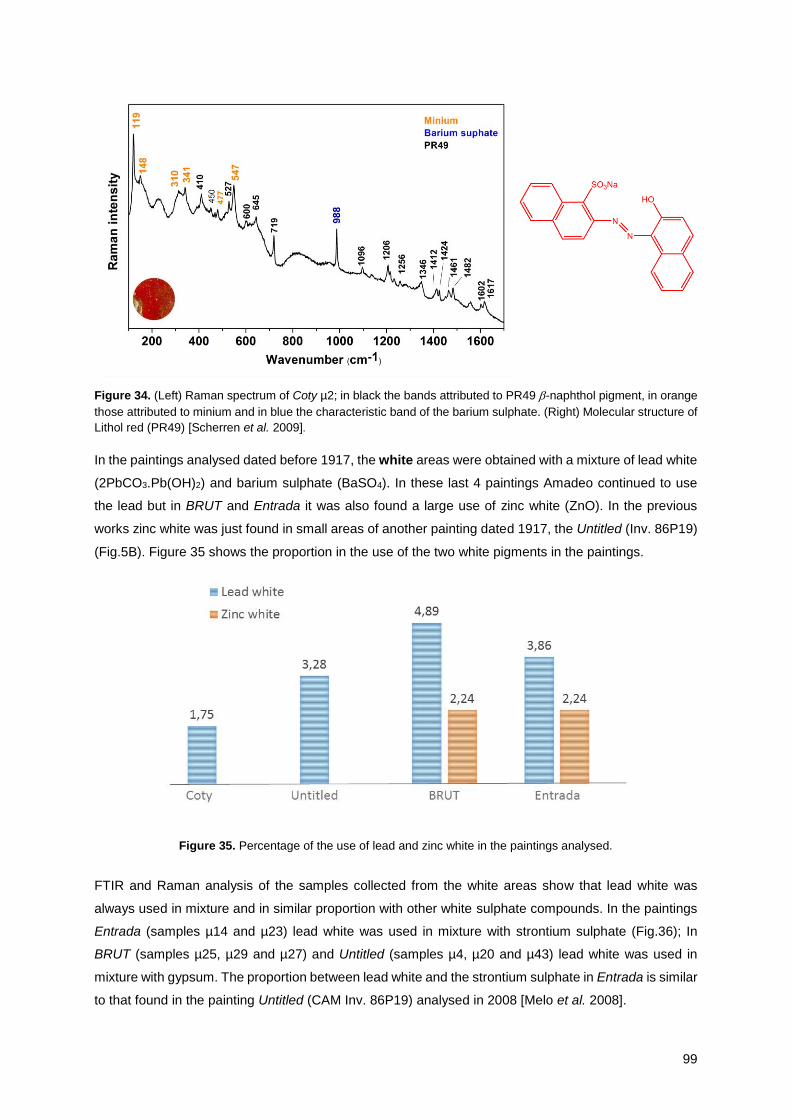
99
Figure 34. (Left) Raman spectrum of Coty µ2; in black the bands attributed to PR49 -naphthol pigment, in orange
those attributed to minium and in blue the characteristic band of the barium sulphate. (Right) Molecular structure of
Lithol red (PR49) [Scherren et al. 2009].
In the paintings analysed dated before 1917, the white areas were obtained with a mixture of lead white
(2PbCO3.Pb(OH)2) and barium sulphate (BaSO4). In these last 4 paintings Amadeo continued to use
the lead but in BRUT and Entrada it was also found a large use of zinc white (ZnO). In the previous
works zinc white was just found in small areas of another painting dated 1917, the Untitled (Inv. 86P19)
(Fig.5B). Figure 35 shows the proportion in the use of the two white pigments in the paintings.
Figure 35. Percentage of the use of lead and zinc white in the paintings analysed.
FTIR and Raman analysis of the samples collected from the white areas show that lead white was
always used in mixture and in similar proportion with other white sulphate compounds. In the paintings
Entrada (samples µ14 and µ23) lead white was used in mixture with strontium sulphate (Fig.36); In
BRUT (samples µ25, µ29 and µ27) and Untitled (samples µ4, µ20 and µ43) lead white was used in
mixture with gypsum. The proportion between lead white and the strontium sulphate in Entrada is similar
to that found in the painting Untitled (CAM Inv. 86P19) analysed in 2008 [Melo et al. 2008].

100
Figure 36. White sample (µ14) from Entrada painting; A Infrared spectra of the sample (black line), SrSO4 (grey
line); B Raman spectra of the sample (black line), SrSO4 (grey line) and lead carbonate (●).
The first attempt to introduce zinc with was introduced as artists’ material was in 1780 [Kühn and Curran
1986]. W&N started to sell it in watercolour in 1834 and the French producer Leclaire produced oil zinc
white in industrial scale in 1845 [Kühn and Curran 1986]. This pigment was also the white of the enamel
paint brand Ripolin (Section 1.2.2). It is well known the predisposition of zinc to form metal carboxylates
due to the interaction of the metal ions with the free fatty acids of the oil (Section 1.2.2). In BRUT, in the
areas where the use of zinc white was found, FTIR analysis detected a large amount of metal soaps.
For that reason a full characterization was performed of the zinc white samples to evaluate the state of
preservation of the paint and to see if there is the possibility that Amadeo used enamel paints in his last
artworks; the results of the analysis is presented in Section 2.2.1.
2.1.4 Chrome yellow samples
The colour range of chrome yellow pigments varies from light yellow (mixed crystals of lead chromate
and lead sulphate, Pb(Cr,S)O4) to yellow (lead chromate, PbCrO4) and orange-red (basic lead chromate,
Pb2CrO5). In the paintings presented in this chapter Amadeo used different yellow tones, obtained using
pure lead chromate and mixed crystals of lead chromate and lead sulphate. This was also found in the
paintings previously studied [Otero et al. 2012]. These pigments were also mixed with cadmium yellow,
ochre and in one case with cobalt yellow to achieve specific hues.
Figure 37 shows the different CIE(a*b*) values of some of the chrome yellow samples form the paintings
BRUT, Entrada and Untitled; as expected the pure lead chromate (PbCrO4) (blue squares) has a more
reddish tone (higher a* values) compared with the mixed crystals of lead chromate and lead sulphate
(Pb(Cr,S)O4) formulation (grey squares). The mixed crystals of lead chromate and lead found in
Amadeo's paintings are characterized by a similar proportion between the two components.

101
Figure 37. CIE(a*b*) colour values for the chrome yellow samples: pure lead chromate (in blue) and mixed-crystals
of lead chromate and lead sulphate (in grey). E = Entrada; B= BRUT and U= Untitled paintings.
Table 4 shows the characterization of the samples analysed in the paintings of Amadeo, dated 1917.
Recently, a comprehensive study of the W&N 19th century manufacture of their yellow lead chromate
based pigments was carried out [Otero et al. 2014b]. It was possible to conclude that W&N used a
limited number of manufacturing processes to produce their chrome yellow and chrome deep colours.
Lemon and Pale production records were used to produce chrome yellow and Middle and Deep to
produce their chrome deep. In blue are indicated the related W&N processes with the pigment
composition identified in Amadeo's works [Otero et al. 2014b].
Table 4. Characterization of micro-samples of chrome yellows.
Pigments Composition Samples
Pu
re
PbCrO4 + CaCO3
(Chrome Deep) Process M3a*
No fillers Untitled µ29, 40
Gypsum SrSO4 Entrada µ19
Kaolin Entrada µ8, 32
MgSO4 7H2O CdS Entrada µ37
Mix
ed
cry
sta
ls
Pb(Cr,S)O4
(Chrome Yellow)
No fillers Lemon
Process L3b* Entrada µ17
Barite
Process L3a*
-- Untitled µ1
MgCO3 BRUT µ 3
MgCO3, Quartz BRUT µ16
* The codes of the processes are L = Lemon/Pale and M = Middle. When process variations exist, the main pathway
presents the letter a and the process variation the letter b.
In the paint samples with the pure lead chromate (Entrada samples µ8, µ19; µ32 and µ37 and Untitled
sample µ29 and µ40) it was detected the presence of calcium carbonate used as filler, the proportion of
the calcium carbonate and lead chromate are constant in all the painting samples. SEM-EDS analysis
on these yellow samples show the presence coccolith shells of the CaCO3, which indicates that the
material was formed by organogenic sedimentation (Fig.38) [Gysau 2006, pg.21].

102
Figure 38. SEM image in BSE mode of the pure chrome yellow sample A Entrada µ32; B sample of paint tube of
Chrome deep (µ17_3128) of W&N.
Comparing the pigment reconstruction based on the W&N archive [Otero et al. 2014b] a correlation was
found between the pure lead chromate samples with calcium carbonate and the middle process M3a14.
As stated, this process is associated with the W&N chrome deep colour. This composition corresponds
to what found in a W&N oil paint tube labelled Chrome Deep (µ17-3128) that belonged to the painter
Columbano Bordalo Pinheiro15 (1857–1929) [Silva et al. 2011]. Figure 39 shows the FTIR spectra of the
Entrada sample µ8 and a M3 pigment reconstruction, where the characteristic bands of the CaCO3 are
visible at 1422 cm-1 and 875 cm-1. This second band shows an overlapping with the band of the
asymmetric stretching of the CrO42- group and the shoulders at 831 and 820 cm-1.
Also for the sample characterized by the presence of a solid solution of lead chromate and lead sulphate
(Pb(Cr,S)O4) were compared with the reconstruction based on the W&N archive. A good match was
found between the sample from Entrada µ17 and the Lemon chrome yellow, W&N process L3b16 (in this
process no fillers were added). The samples from Untitled µ1 and BRUT µ3, µ16 can be correlated with
the W&N process L3a43 (characterized by the presence of barium sulphate). As noted, these methods
are associated with the W&N chrome yellow colour and this type of composition also corresponds to
what found in a W&N oil paint tube labelled Chrome Yellow (µ26-3130) that also belonged to Columbano
[Silva et al. 2011]. Figure 40 shows the comparison of the FTIR spectrum from the sample Entrada µ17
with a pigment reconstruction based on the W&N archive (L3b).
14 In this process the chromate source is obtained from K2Cr2O7 and Na2CO3; the lead source is Pb(NO3)2 and
CaCO3 is used as extender. However, in this particular formulation, M3, Na2CO3 was not added [Otero et al. 2012]. 15 Two boxes with 63 oil paint tubes belonged to the Portuguese painter Columbano Bordalo-Pinheiro (Lisbon 1857-
1929) and conserved at the Museu Nacional de Arte Contemporânea do Chiado in Lisbon were analysed in the
context of the Crossing Borders project at DCR-FCT; part of the analyses are published in Silva et al. [Silva et al.
2011] and Montagner et al. [Montagner et al. 2013b]. The tubes belong to several companies: 32 from Winsor &
Newton; 14 from Morin et Janet; 10 from P. Denis (C. Bourgés – Maison Merlin); 5 from Lefranc. Two tubes are not
labelled. 16 In L3a process the chromate source is obtained from K2Cr2O7 and Na2CO3; the lead source is Pb(NO3)2; the
sulphate source is sodium sulphate (Na2SO4) with sulphuric acid (H2SO4) and BaSO4 is used as extender. In L3b
no extender is added [Otero et al. 2012].

103
Figure 39. Infrared spectra of the sample µ8 Entrada. In the inset, comparison with the chrome deep pigment
reconstruction, M3 (based on W&N process) (in grey) ●PbCrO4; CaCO3; ♦ kaolinite.
Figure 40. Infrared spectra of the sample µ17 Entrada. In the inset, comparison with a Lemon chrome yellow
pigment reconstruction, L3b (based on W&N process) (in grey); ● Pb(Cr,S)O4.
Other additives, such as gypsum, kaolin, the barium and the strontium sulphate and magnesium
sulphate heptahydrate (Table 4). The presence of magnesium carbonate is associated to the W&N 19th
century oil paint manufacture [Otero et al. 2014b]. No correlations were found between the additives
indicated below and the recipes of chrome yellow pigment in the W&N archive; this should be suggest
the used by Amadeo of a different manufacturer. SEM-EDS and FTIR analysis of the other chrome

104
yellow samples collected from the analysed paintings are presented in Appendixes of Part II Ap.VII.1
and Ap.VII.2, respectively.
The tendency to darkening of the chrome yellow is well-known (Section 1.2.3); for this reason a set of 4
samples from 19th century oil paint tubes and 5 historically accurate reconstructions (HART)17 samples
(powders, unaged and artificially aged oil paints) and 14 micro-samples from Amadeo's paintings,
including two samples from BRUT and Entrada, were analysed by synchrotron radiation (SR)-based
techniques, X-ray Absorption Near Edge Structure (µXANES), X-ray fluorescence microspectrometry
(µXRF) and Fourier transform infrared microspectroscopy mapping (µFTIR), at the ESRF during a
mission of April 2014. Unaged and aged18 paint reconstructions were analysed with the aim of
understanding which pigment and/or paint formulation shows more tendency to change colour and what
are the degradation products. The painting samples were analysed to see if there are any signs of
degradation process in Amadeo’s artwork.
Both Entrada and BRUT samples are composed of mixed crystals of lead chromate and lead sulphate;
in the first one no filler was detected. While in the BRUT sample magnesium carbonate was found, along
with barite, quartz and zinc azelate (the characterization of the metal soap will be developed in Section
2.2.1).
The absorption of the carboxylate is homogenous in all the samples, no aggregates are visible. As
introduced in section 1.2.3 the degradation of the chrome yellow is related to the reduction of the original
species Cr(VI) to Cr(III). To evaluate the presence or not of Cr(III) species compared the profile of the
Cr K line obtained from the XRF maps performed at different beam energies (Fig. VII.13 Appendix Part
II Ap.VII.3). In both samples, no alteration was found and consequently, we can assume that no
degradation has occurred. To confirm this result in each sample a set of analysis was performed using
µ-XANES, Figure 41A and C show the points where the analysis was performed; in all points the µ-
XANES spectra obtained are very similar with that of lead chromate (crocoite) reference spectra,
supporting the conclusion that no degradation is occurring. Figure 41B and D show the average XANES
spectra. More information of the SR analysis in Appendix Part II Ap.VII.3
17 Result obtained in the ongoing PhD thesis project of Vanessa Otero «Bright colours: historically accurate
reconstructions of Amadeo's palette» at DCR-UNL. 18 The samples were irradiated for 1500 hours using a Xenon-light apparatus (λirr>310 nm).

105
Figure 41. XRF chromium map intensity with the XANES points of analysis () A BRUT and C Entrada; average
XANES spectrum B BRUT and D Entrada.
2.2 Conservation issues
From the studied paintings, BRUT was the one where more problems of conservation were detected.
Figure 42 shows the problems detected and their location. Cracks were detected in the red area close
to the up left corner (Fig. 42B). The detail images in Figure 42C in the brown and red areas were
acquired using transmitted light, these image shows that the paint layer is very thin, and characterized
by the presence of network of micro-cracks network. The light (Fig. 42D) and the dark green areas in
the lower-right angle also show the presence of a network of cracks but in this case the paint layer is
very thick. In this area was detected the presence of starch mixed with emerald green (discussed in
2.2.3). In the same dark green area a lacuna is present that leaves the canvas visible (Fig. 42E). The
white and the green paint (Fig. 42C) of the letter R shows problems of adhesion, part of the letter was
already loss. FTIR analysis in this area detected the presence of zinc carboxylate (discussed in 2.2.1).
In BRUT also two areas were detected with colour alteration: part of the dark blue area around the guitar
silhouette (Fig.42H) shows whitish tone due to the delamination of the varnish (ketone resin). In the area
of the head of the guitar (Fig. 42I) it was detected a fading of the purple dyes (eosin-based lake), that
caused the colour change from purple to blue given by the presence of cobalt blue pigment (discussed
in 2.2.2).

106
B - Area 1
A C - Area 2
D - Area 2 E - Area 3
F - Area 4 G - Area 5
Figure 42. Conservation problems detected in BRUT: A localization of the areas. Image details B crack (10x); C
network of cracks (macro image acquired with transmitted light); D network of cracks (10x); E cracks and lacuna of
the paint and preparation layer (25x); F cracking (32x); G delamination of the white and green paint (16x).

107
H - Area 6 I - Area 7
Figure 42 (continued). H White patches on the surface (50x); I fading (40x).
2.2.1 Metal carboxylates
The word “BRUT” in the BRUT painting (Fig. 43D) shows problems of adhesion that in some cases
involve the loss of paint. To note that the problems of adhesion are visible in the letter “R” (Fig.43A and
B) but not in the letter “T” (Fig. 43C). FTIR analysis in the samples collected in the letters “R” and “T”
(Fig. 43D) detected a large amount of zinc carboxylates. Based on the spectral features the FTIR spectra
were divided in two groups. Figure 44 shows a representative spectrum of each group:
(1) In the FTIR spectrum in Figure 44A, are visible the characteristic absorption bands of the zinc
soaps: stretching C-H at 2919, 2850 cm-1, stretching COO- (as 1551, 1534 cm-1 and s 1402
cm-1); bending CH2 at 1461 cm-1 and rocking CH2 at 745 cm-1, bending COO- at 669 cm-1. Based
on these spectral features it was suggest the presence of a zinc carboxylate with a well-defined
molecular structure. The well structure identified by the spectroscopic analysis may be related
to the presence of a compound add to the paint and not formed in it, such as an additive in the
paint. This type of carboxylate was found in the samples µ4 and µ5 from the letter “R” (Fig.43A
and B)
(2) FTIR spectrum in Figure 44B shows the presence of lead white, gypsum and a broad band
centred at 1582 cm-1 related to a not-defined structure of carboxylate compounds, may related
to an ongoing process, such as a degradation process between the zinc and the oil. This type
of carboxylate was found in the sample µ25 from the letter “T”

108
Figure 43. Photomicrographs of the white and dark green areas in the word “BRUT” A delamination of the white
area in the letter “R”, sample µ4 (10x); B delamination of the green area in the letter “R”, sample µ5 (32x); C
sampling area in the letter “T” where no delamination was observed, sample µ25 (20x); D identification of the
sampling area in the word “BRUT”.
Figure 44. Infrared spectra of samples collected from the word “BRUT” in the painting BRUT; A from yellow area
under the letter “R” (µ4) (group 1); B white area in the letter “T” (µ25) (group 2).
The two types of carboxylates described for the letter “R” and “T” were found also in other BRUT
samples. FTIR analysis was performed on of 71 samples collected on the BRUT and Entrada. Figure
45 shows the mapping of the areas where the two types of carboxylates were found. In pink the areas
where it were detected carboxylates form the group (1) characterised by the presence of a defined

109
structure (Fig. 44A). These areas were quantified in 15.5% of the surface of the painting BRUT. In green
the areas where it were detected carboxylates form the group (2) characterised by the broad band at
1589 cm-1 (Fig. 44A). These areas were quantified in 18.3% of the surface of the painting BRUT.
Figure 45. (Top) Mapping of the carboxylates areas in painting BRUT and Entrada: the pink area corresponds to
the samples of the group 1, characterized by the presence of IR defined bands at 1551, 1534 cm-1 (spectrum Fig.
44A). The green area corresponds to the samples of the group 2, characterized by the presence of IR broad band
centred ad 1589 cm-1 (spectrum Fig. 44B); (Down) Identification of the samples analysed for each type of
carboxylates group.
To better characterize the samples collected from the paintings BRUT and Entrada their FTIR spectral
features were compared with spectra collected on (i) reference zinc soap synthetized at DCR; (ii)
samples collected from oil paint tube ASC8 “Blanc de Zinc” by Lefranc Paris that was found in the box
in preserved in the Amadeo’s house in Manhufe (please see Part II, Section 1.1.3) and (iii) a sample

110
from a swatch of “Blanc 1401” by Ripolin colour chart dated 192519 belong to DCR (Image of the Ripolin
chart in Appendix Part II Ap.IX).
A paint from the Lefranc zinc white tube (ASC8) was applied in 2008 on a microscope glass slide, the
slide was leaved opened in a box protected by the light. In 2014 FTIR analysis was performed sampling
different areas of the paint: a dried area (external surface) and in a not complete dried area (on the
internal of the paint). Figure 46 shows the FTIR spectra from these two areas, the figure is divided in
the 3 part to help the identification of the characteristic regions: (i) 2919, 2850 cm-1 ν(C-H); (ii) 1547,
1527 νas(COO-) and 1398 cm-1 νs(COO-); (iii) 745, 721 cm-1 δ(CH3) and 681 cm-1 δ(COO-). It is interesting
to note that the samples from the zinc tube show the same types of IR features identified in the BRUT
and Entrada samples (Fig.44). The sample from the surface shows a broad band at 1580 cm-1, while
the sample from the internal area show peaks at 1549 and 1534 cm-1. These peaks may suggest the
presence of zinc azelate and/or oleate. Figure 47 shows FTIR spectra of the zinc carboxylate
synthetized at DCR [Otero et al. 2014a] and used as a reference in this work. Zinc azelate and oleate
are characterized by the presence of the doublet absorption at 1556/1535 cm-1 and at 1547/1527 cm-1.
Zinc oleate (and palmitate) are characterized also by the two bands 743, 722 cm-1 δ(CH3).The oleates
present an additional characteristic band around 3005 cm-1 due to the C=C-H stretching vibrations. This
absorption is not visible in the spectrum of the samples from the Lefranc tube.
Observing the FTIR spectra form the BRUT samples with a well-defined structure. It was possible to
identify: zinc stearate or palmitare in the sample µ5 and zinc zinc azelate and/or oleate in the samples
µ4, 15-16 and 31.
The swatch Blanc by Ripolin was sampled in 3 areas from the surface to the internal of the swatch. All
the spectra acquired show the same features. Figure 48 shows an example of FTIR spectrum collected
from the swatch Blanc. FTIR spectrum shows a broad band centred at 1580 cm-1 similar to the dried
sample of the Lefranc paint and in the samples of the group (2) in the painting BRUT. Casadio et al.
2013 and Hanspach-Bernal and Bezur show the same IR spectral features in samples collected from
Ripolin’s swatch on different colour charts from the collection of the Art Institute of Chicago [Casadio et
al. 2013c; Hanspach-Bernal and Bezur 2013]. The authors identified the presence of metal carboxylates
but they didn’t characterize the type of acid involved. Moreover, Dredge et al. analysed samples from
Ripolin’s cans dated 1927 by the Infrared Beam-line at the Australian Synchrotron. They identified two
types of zinc carboxylate: (i) characterized by doublet peaks at 1551 and 1533 cm-1 and a shoulder at
1597 cm-1 attribute to zinc oleate; (ii) characterized by a broad non-specific carboxylate peak in the area
1650-1500 cm-1 [Dredge et al. 2013]. The authors doesn’t provide a characterization for the second type
of carboxylate.
19 Ripolin’s colour chart: Glacis Ripolin a Finir Spécial Pour Voitures, dated 1925.

111
Figure 46. Infrared spectra of µ-samples collected from the paint tube by Lefranc Zinc white applied on glass slide,
the samples were collected on the dried surface (external) and from the not-completed dried paint (internal).
Figure 47. Infrared spectra of reference zinc carboxylates synthetized in DCR laboratory, details in [Otero et al.
2014a].
Figure 48. Infrared spectra of the tube samples Lefranc Zinc white tube; the Blanc by Ripolin and the white sample
from BRUT µ4.

112
To cross-sections where prepared rom of the Lefranc zinc white oil paint tube (Fig. 49A) sample the
Blanc Ripolin sample (Fig. 49C). In the cross-section of the oil samples the presence of an aggregated
it is visible, delimited by the red dashed line in Fig. 49A). The cross-section from the Ripolin sample
does not show any aggregate (Fig. 49C).
Figure 49. A Optical microscope image of cross-section from Lefranc zinc white paint sample; B SEM image in
BSE mode of cross-section from Lefranc zinc white paint sample; C Optical microscope image of cross-section
from Blanc Ripolin sample.
Raman analysis performed inside the aggregate in zinc white oil sample in the area delimited by the red
dashed line in Figure 49A. The Raman spectrum collected in the sample (Fig.50A) was compared with
those collected on the carboxylic acids and the zinc carboxylates synthetized at the DCR [Otero et al.
2014a], the best match was found with the zinc azelate (Fig.50B). In the surrounding area (delimited by
the blue in Figure 49A) no Raman signal was obtained due to the high fluorescence.
Figure 50. Raman spectra A ASC8 zinc white inside the area delimitated with red dashed line in the cross-section
image. In blue the contribuition of the resin used to prepare the cross-section; B zinc azelate reference.
The Blanc Ripolin sample was analysed by Raman (Fig.51) and also compared with the reference
spectra from carboxylic acids and the zinc carboxylates [Otero et al. 2014a] in this case the best match
found was with the azelaic acid. The Raman spectrum of azelaic acid is characterized by the presence

113
of band and 664 cm-1 δ(COO-); at 905 cm-1 ν(C-C); 1060 and 1097 cm-1 of the δ(C-C-C) and at 1412
and 1440 cm-1δ (CH2) [Otero et al. 2014a].
Figure 51. Raman spectra of Ripolin blanc sample on diamond cell, the region between 1320 and 1350 cm-1 was
excluded because it corresponds to the diamond band; in red the band attributed to azelaic acid.
The cross-section from the zinc white oil paint; the Blanc Ripolin and the samples µ4 and µ5 from BRUT
were analysed by SEM-EDS. The sample from Lefranc (Fig. 52A) and Ripolin (Fig. 52B) show
morphological differences, such as the shape and the dimension of the particles20: the particles of the
oil pant tube sample show non-homogenous dimension with a medium size of 0.152 µm (± 0.341) while
the particles on Ripolin’s sample have 0.071 µm (± 0.212). Casadio and Rose [Casadio and Rose 2013a]
relates the reduction of the dimension (high concentration of particles in the 0.15–0.3 µm
length/diameter range) of the ZnO particles in Ripolin paint to the grinding process used by the industry.
Figure 52. SEM image in BSE mode of A zinc white Lefranc (ASC8). The EDS analysis detected the presence of:
Zn (Z6) and Si (Z5); B Blanc Ripolin sample. The EDS analysis detected the presence of: Zn (Z2) and Al in (Z3).
20 The size of the particles was measured using the open source program for image processing ImageJ
(http://imagej.net). For the analysis the SEM images in BSE mode were used.

114
The EDS analysis detected the presence of silicon (that suggest the presence of silica) in the Lefranc
paint sample; while in the sample from Ripolin it was detected aluminium (that suggest the presence of
aluminium oxide).
Figure 53. SEM image in BSE mode of A zinc white by Lefranc (ASC8); B Blanc by Ripolin; C BRUT sample µ4;
D BRUT sample µ5.
The data acquired from Lefranc and Ripolin were compared with those from the paint samples. The
morphology and the size of the pigment particles of zinc white in samples from BRUT is closer to that
of the oil paint tube sample. In the SEM image from the painting samples (Fig. 53 C and D) rounded
and acicular particles are visible. The size of the particles identified as ZnO in the painting’s samples
show a ranges from 0.6 to 1.5 µm.
In conclusion, the spectral features of the FTIR spectra from 71 samples collected from the paintings
BRUT and Entrada suggest the presence of the two types of carboxylates: the first is characterized by
a well-defined structure may be related with the presence of an additive. In the areas where problems

115
of paint adhesion are visible (Fig.43 A and B) it were detected zinc stearate or palmitate (in sample µ5)
and zinc azelate and/or oleate (in sample µ4). Zinc azelate and/or oleate were also detected on the
samples µ15-16 and µ31. The second type of carboxylate is characterized by a broad IR band centred
on 1580 cm-1. It was not possible a complete characterization of the carboxylates. The not-defined
structure of the carboxylate suggest the presence of a compound formed in the paint and not added to
it. It could be the case of the product of an ongoing degradation process between the metal of the
pigment and the oil. Based on the analysed samples 18.3% of the area of the painting present this type
of carboxylate. To note that this type was detected also in the BRUT sample µ25. This sample was
collected from the letter “T” where no signal of delamination are visible (Fig.43 C).
The same two types of carboxylates described for the BRUT samples were found in the Lefranc paint
tube of zinc white used by Amadeo. Raman analysis performed in an aggregate in an oil zinc white
sample detected the presence of zinc azelate.
The FTIR analysis of the samples collected from the Blanc swatch from of Ripolin’s colour chart (dated
1925) detected only the presence of the broad band around 1580 cm-1 as in the case of the Lefranc
sample and the second group of BRUT samples. This band was detected also in [Casadio et al. 2013c;
Dredge et al. 2013; Hanspach-Bernal and Bezur 2013] by the analysis of Ripolin samples from different
production. The band at 1580 cm-1 cannot be considered as an unequivocal signature of the presence
of enamel paint. In the Ripolin cross-section no aggregates were detected and the Raman analysis
suggest the presence of azelaic acid.
On the other hand, the particle size of the Ripolin sample (calculated from SEM image) is smaller
compared with the Lefranc zinc white sample. The samples from the painting BRUT (µ4 and µ5) are in
the same range of size of those calculated in the oil paint tube sample.
2.2.2 Fading
In BRUT the head of a guitar presents a purple-bluish tone; by micro sampling the area it was clear that
the colour at the surface was different from the colour in the internal part of the layer, which characterized
by a strong pink tone. In the cross-section of the sample (µ19) collected in that area, the purple-bluish
tone has a thickness of 15 μm (Fig. 54A). The pink area in the visible light image shows an orange
fluorescence under ultraviolet illumination (Fig.54B). This fluorescence is not visible at the surface of
the paint layer that had been in contact with the light. The orange fluorescence is one of the features in
the identification of the eosin based lakes [Geldof and Steyn 2013]. In Figure 54C it visible the
fluorescence of the zinc particles, homogeneously distributed throughout the layer. The distribution of
the zinc is also confirmed by the mapping performed by SEM-EDS (Fig. 55E).

116
A B C
Figure 54. Cross-section (µ19), A visible light; B Ultraviolet light (filter 5); C Ultraviolet light (filter 8).
SEM-EDS performed on the same cross-section (Fig.55B) shows the homogenous distribution of the
zinc in the layer; besides that, BSE image does not show a separation between the pink and blue layers
as it is visible in the image with visible light. Aluminium21 is clearly associated to the presence of dark
purple, blue and red crystals (Fig. 55C). In the dark purple and blue crystal the presence of cobalt was
also detected (Fig. 55D). The results obtained suggest the presence of a mixture of cobalt based
pigment with a lake.
FTIR detected a large amount of zinc carboxylate, characterized by the presence of a broad band
corresponding of the COO- stretching, at 1580 cm-1 (Fig. 56B). The presence of zinc carboxylates are
discussed in Section 2.2.1. FTIR and reflectance spectroscopy confirmed the presence of a cobalt blue
based pigment by the absorption band at 680 cm-1 corresponding to the stretching Co-O. In the
reflectance spectrum (Fig. 56A) is visible the absorption bands between 550-560 nm of the d-d transition
of the Co(II) (Section 2.1.3). The detection of aluminium by SEM-EDS in the correspondence to the blue
crystals confirms the presence of Cobalt blue.
As introduced in Section 1.2.3, eosin was discovered by Hofmann and marketed by BASF in 1874. Eosin
derives from the bromination of fluorescein and erythrosin from its iodination; the presence of bromine
or iodine supports the discrimination between bromination and fluorescein. In the van Gogh paintings
bromine was still detected after discolouration of the lake [Geldof and Steyn 2013]. X-ray fluorescence
performed on BRUT in the correspondence with the purple area detected the presence of Zn, Co, Pb
Hg and Fe. The presence of Hg is related to the red layer of vermilion, iron oxide pigments applied over
the ground, In the EDXRF spectrum (Fig. 57) the presence of the K line of the Hg (11.82 keV) overlaps
with the K of the Br (11.87 keV) and for that reason the attribution of the presence of Br may by
suggested only based on the K peak at 13.3 keV. It was not possible to confirm or exclude the presence
of Br by SEM-EDS due to the overlapping between the L line of the Br (1.52 keV) and the K of the Al.
21 Aluminium can be related to the presence of a lake pigment. Metal salt, such as alum is used to precipitate the
lake pigment from the chromophore in solution.
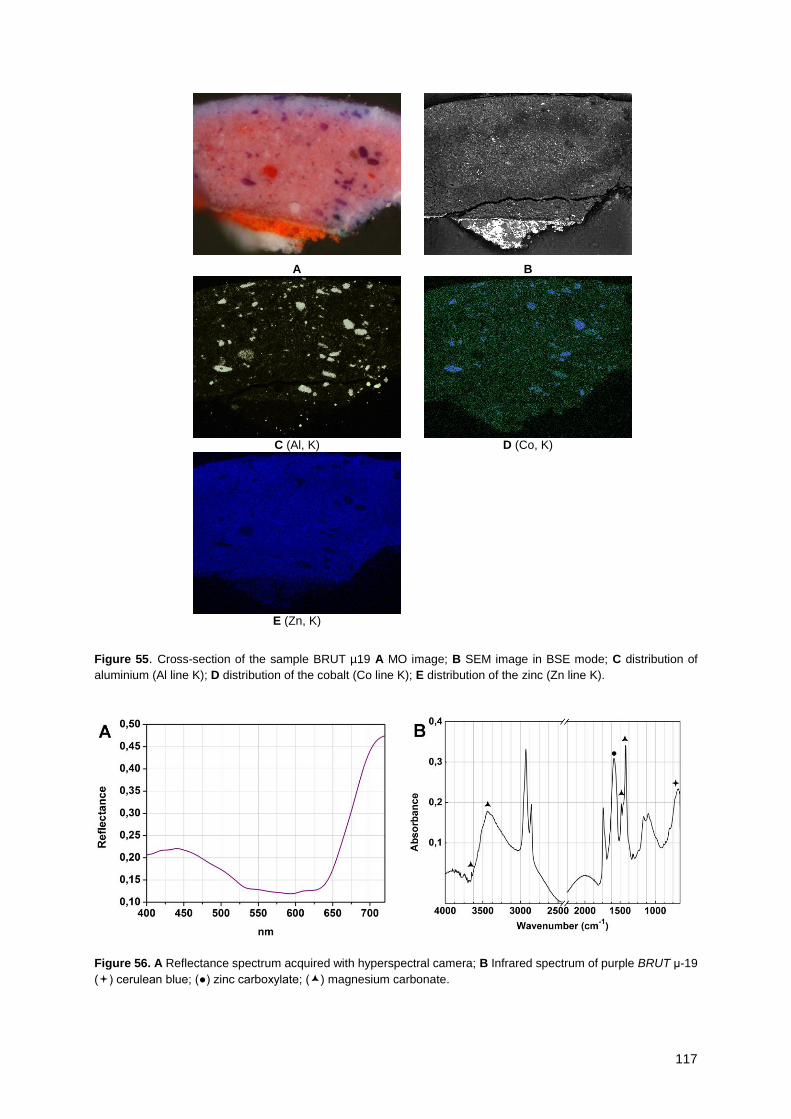
117
A B
C (Al, K) D (Co, K)
E (Zn, K)
Figure 55. Cross-section of the sample BRUT µ19 A MO image; B SEM image in BSE mode; C distribution of
aluminium (Al line K); D distribution of the cobalt (Co line K); E distribution of the zinc (Zn line K).
Figure 56. A Reflectance spectrum acquired with hyperspectral camera; B Infrared spectrum of purple BRUT μ-19
() cerulean blue; (●) zinc carboxylate; () magnesium carbonate.

118
Figure 57. µ-EDXRF spectrum acquired on the BRUT painting in the purple area.
Microspectrofluorimetry offers high sensitivity, selectivity, and good spatial resolution that make this
technique invaluable in the identification of dyes and lake pigments in art work [Melo et al. 2009]. Figure
58A shows the emission and excitation spectrum acquired on the cross-section BRUT (µ19); in Figure
58B the spectrum acquired on a reference sample of eosin complexed with Al3+ applied on paper filter
[Claro 2009]. The sample from the painting shows an excitation maxima at 528 nm and the emission
maxima at 544 nm (collected in the violet area) and 556 nm (in the bluish area). As reported in Claro
[Claro 2009] the metal ion used as complexing agent in the preparation of the lake influence the intensity
and the position of the emission maxima. Based on the intensity and the position of the excitation and
the emission band we can suggest a presence of an eosin based lake complexed with aluminium.
Figure 58. A BRUT (µ19) Emission spectra (λex = 490 nm; df = 500 nm) and excitation (λem = 610 nm; df = 600 nm)
from the purple (violet line) and bluish (blue line); B Eosin in MeOH:H2O (70:30, v/v) with Al3+ at pH 2.9, applied on
filter paper [Claro 2009].

119
2.2.3 Cracking and darkening of the green area
Figure 59 shows detail images of a green area in the bottom right corner of BRUT. In this area the
surface presents an extended craquelé, with a local loss in the paint layer. The dark colour visible in the
green area seems restricted to the surface: the photomicrographs acquired in correspondence to the
lacuna (Fig.59B) shows that the green colour in the bulk of the paint layer is lighter than the colour at
the paint surface. EDXRF analysis performed in the light and dark green areas detect copper and
arsenic (Areas of analysis G9a-c; Bk9a-b in Fig. IV.1 Appendix Part II Ap. IV; EDXRF spectra in Fig. V.1
Appendix Part II Ap.V.1).
Figure 59. Image detail using raking light of the green area at the botton right corner in the painting BRUT (Left); A
Photomicrographs of the light green area (10x); B Photomicrographs of the dark green area (25x).
FTIR analysis detected the presence of emerald green (mixed with barium sulphate) in the light green.
In the dark area FTIR analysis (samples µ6, µ33 and µ34) it was detected the presence of starch22 and
barium sulphate. Figure 60 shows IR spectrum of a green sample where it is visible the absorption
bands of the starch at 1152, 1180 and 1030 cm-1 of the absorption of the C-O bond stretching [Stuart
and Ando 1997]. In the same spectrum it is also visible the contribution of the barium sulphate with the
increase of the absorption at 1180 cm-1, the presence of a shoulder at 1080 and the weak band at 985
cm-1, all related to the stretching of the SO42- group. Form the FTIR analysis no signal of oil as binder.
No further analyses were done to identify the origin of the starch.
22 As reported by Carlyle in [Carlyle 2001, pg. 110] Field (in the edition 1841, pg. 350) listed starch as material used
to gelatinise oil paint “Indeed starch, as prepared by the laundress, has been lately recommended with high
encomiums for this purpose”. The use of starch mixed with oil paints was reported by various art magazines from
1839 and 1841 [Carlyle 2001, pg. 110]. The only one other reference is related to the use of medium containing
starch for dead colouring on an absorbent white ground [Carlyle 2001, pg.110].
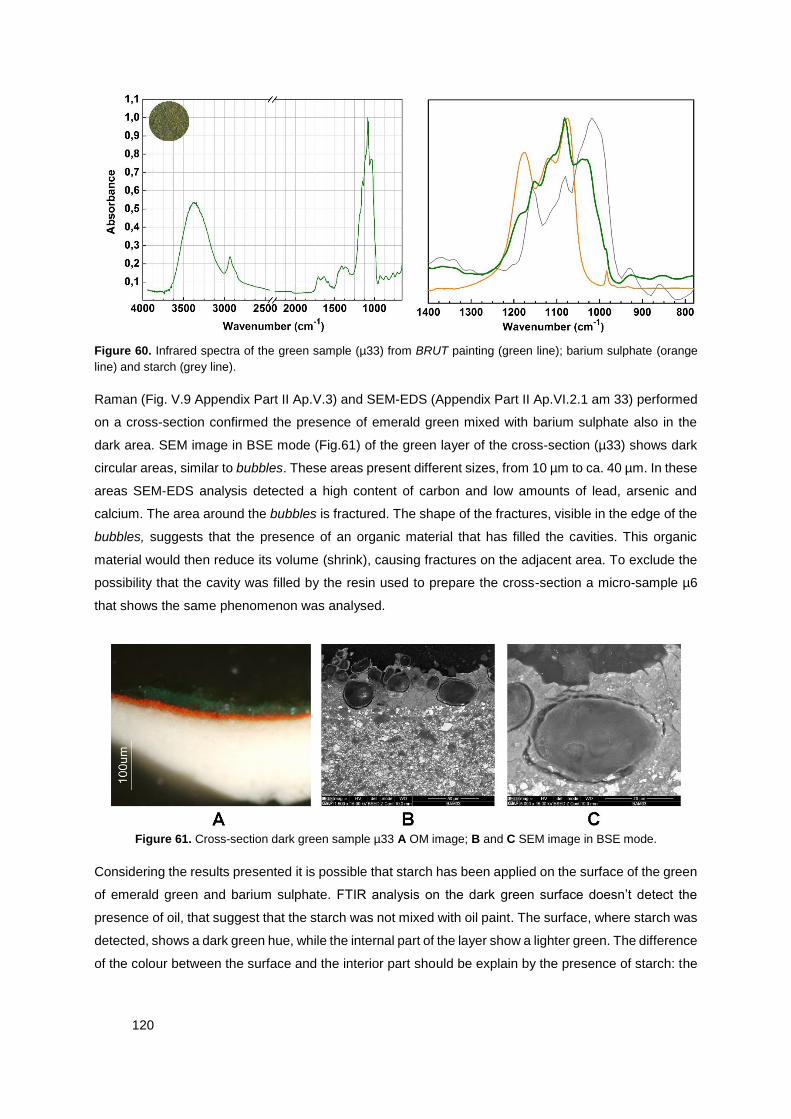
120
Figure 60. Infrared spectra of the green sample (µ33) from BRUT painting (green line); barium sulphate (orange
line) and starch (grey line).
Raman (Fig. V.9 Appendix Part II Ap.V.3) and SEM-EDS (Appendix Part II Ap.VI.2.1 am 33) performed
on a cross-section confirmed the presence of emerald green mixed with barium sulphate also in the
dark area. SEM image in BSE mode (Fig.61) of the green layer of the cross-section (µ33) shows dark
circular areas, similar to bubbles. These areas present different sizes, from 10 µm to ca. 40 µm. In these
areas SEM-EDS analysis detected a high content of carbon and low amounts of lead, arsenic and
calcium. The area around the bubbles is fractured. The shape of the fractures, visible in the edge of the
bubbles, suggests that the presence of an organic material that has filled the cavities. This organic
material would then reduce its volume (shrink), causing fractures on the adjacent area. To exclude the
possibility that the cavity was filled by the resin used to prepare the cross-section a micro-sample µ6
that shows the same phenomenon was analysed.
Figure 61. Cross-section dark green sample µ33 A OM image; B and C SEM image in BSE mode.
Considering the results presented it is possible that starch has been applied on the surface of the green
of emerald green and barium sulphate. FTIR analysis on the dark green surface doesn’t detect the
presence of oil, that suggest that the starch was not mixed with oil paint. The surface, where starch was
detected, shows a dark green hue, while the internal part of the layer show a lighter green. The difference
of the colour between the surface and the interior part should be explain by the presence of starch: the

121
starch filled the space between the pigment particles, reducing the scattering of the light promoting the
darkening of the surface.
2.3 Final remarks
The analyses of the four paintings dated 1917 enrich the knowledge on the materials and techniques of
Amadeo de Souza-Cardoso created at the time of the edition of his Catalogue Raisonné [Melo et al.
2008; Melo et al. 2009]. In these paintings Amadeo experimented with the use of found materials. In
Coty and in Untitled Amadeo seems to be more faithful to his classic palette but at the same time it is
curious that Coty is the painting where he experimented more the use of founded materials in almost
30% of the paint area.
Figure 62. The pigment palette of Amadeo for the paintings dated 1917, with details from his paintings.
The characterization of the pigments allow the identification of the palette for the paintings dated 1917
(Fig.62). Moreover, the analysis of the colour distribution (based on the colour data acquired using
hyperspectral imaging) shows that in the last paintings Amadeo developed a coherent colour language
different from that used in the previous works. I the last works Amadeo used saturated tones applied as
patches without colour gradient. It is very interesting to see that the artist achieved this effect basically
using the same palette of the previous works. To note the localized use of golden and silver tones in
particular in Coty and Entrada. The difference that were detected from the palette of pigments before
(Fig. 5) and after 1917 (Fig. 62) are the use of mixture of blue pigments and red lake to achieve the
purple hue. Before 1917 the main important green pigment used by Amadeo was viridian; in the case
of BRUT and Entrada it was detected viridian but the main areas were painted by emerald green. Cobalt
yellow was already detected mixed with chrome yellow in a sample from the painting Untitled (O Jockey)
Inv. 77P5 dated 1913. In these last paintings cobalt yellow was found alone and in mixture with chrome
yellow in Coty and Untitled. The main relevant difference between the two palette of pigments if the use
of zinc white in particular in BRUT and Entrada.
The analysis of a photograph of a supposed maquette shows a correlation between the collage
represented in the photograph and the oil paintings, in particular with BRUT and Entrada. These two

122
paintings show a very similar colour distribution and construction, such as the use of the same proportion
of chrome yellow and cadmium yellow, and the use of zinc white. The maquette should be realize before
the paintings BRUT and Entrada and after the edition of the album “12 Reproductions” (November
1916). Taking into consideration the interpretation of some elements present in the maquette and the
pochoirs of the letters Z, I, N, and C it is suggested that the artwork Untitled (ZINC) was completed
before the maquette and therefore before the paintings BRUT and Entrada.
In the analysis of the paintings particular attention was given to the chrome yellow samples. Thanks to
the parallel investigation developed within the project Crossing Borders on the W&N 19th archive it was
possible to correlate the results obtained from the painting analysis with the industrial synthesis of the
chrome yellow. Two samples of chrome yellow from BRUT and Entrada were analysed by Synchrotron
radiation techniques; in these samples not signs of degradation process were detected. The data
obtained from the samples characterization will be very important to continue the study on the process
of alteration of this pigment.
In general these paintings are well conserved, however BRUT shows more problems comparing with
the others. It was detected the presence of craquelé and micro-craquelé that in some cases compromise
the stability of the paint layer. Related with the use of zinc white FTIR analysis detected a large amount
of zinc carboxylates. Based on infrared analysis, and in particular observing the carboxylic region
between 1530 and 1580 cm-1 two types of metal soaps were identified: (i) is characterized by the
presence of a broad band centred at 1580 cm-1. This not defined structure of the carboxylate suggest
the presence of a compound formed in the paint and not added to it, such as the case of an alteration
product between the zinc and the oil. (ii) The second type is characterized by the presence of a doublet
absorption at 1551-1534 cm-1, the well-defined structure of the zinc carboxylate suggest that it is a
compound add to the paint more than a product of degradation. This second type of zinc carboxylate
was detected in the samples from the area with conservation problems: paint delamination in white and
green area of the letter “R” of the word “BRUT” (samples µ4 and µ5). In the sample µ5 FTIR detected
the presence of zinc stearate or palmitate and in the sample µ4 of zinc azelate and/or oleate. In BRUT
it was also detected a fading problem related to the presence of an eosin-based lake used in mixture
with cobalt blue that caused the change of the colour in the figure of the head of guitar. For the first time
in Amadeo’s paintings it was detected the presence of starch in the green areas of the painting BRUT;
the presence of the starch may be related with the dark tone of the area.

123
PART III:
CASE STUDIES

124

125
In this part of the thesis the image processing tools described in Part I are applied to two sets of
painting case studies (described below). The goal of this chapter is to compare the results obtained
using the image tools with the results obtained by the analysis of the painting materials, performed
using multi-analytical approach.
The first set of paintings (Section 1.1) are called here as Collage; Geometric; Embroiderers and Café.
These paintings are attributed to Amadeo de Souza-Cardoso but not included in the Catalogue
Raisonné and they were studied at the DCR-UNL in order to assess their authenticity. These paintings
were used to evaluate the brushstroke analysis based on image processing (please see Part I,
Section 2.2) as tool to support authentication processes. The answer provide by the materials
examination was compared with the answer provide by the tool developed to perform brushstroke
analysis. To evaluate the authenticity of the paintings their materials and techniques were compared
with those used by Amadeo in the paintings studied until now (including the 19 paintings analysed in
[Melo et al. 2008] and the four paintings: BRUT, Entrada, Coty and Untitled studied in this these and
presented in Part II Chapter 2).
The second group of paintings (Section 1.2) are the paintings of Amadeo dated 1917 BRUT, Entrada,
Coty and Untitled. The study of the materials of these paintings is presented in Part II of this thesis.
The system that perform the analysis of the materials based on hyperspectral images and elemental
data (please see Part I, Section 2.3) was applied in these four paintings. The results obtained by the
system are then compared with the results obtained by the analysis of paintings, this comparison is
useful to appreciate the success and limitations of the system proposed.
1.1 Brushstroke analysis to support authentication processes
1.1.1 The methodology
The study performed on 191 selected paintings of Amadeo’s at the time of the edition of his Catalogue
Raisonné [Melo et al. 2008] allows to reconstruct the palette of colours used by the artist between
1912 and 1916 (Fig.1). For more details please see Part I, Section 1.1.3.
The characterization of the materials includes also the evaluation of the mixtures used. During the
evaluation of a painting it is also studied the technique used by the artist; this includes the stratigraphy
of the painting, the presence of underdrawings, the way in which the colour is constructed, and the
brushstroke. The analysis of the painting technique and its structure is performed by combining the
information extracted by image documentation (infrared, ultraviolet, normal and raking light and X-ray
images), by the observation of the painting under microscope, and by the analysis of the cross-
sections. This part of the Chapter summarizes the main results obtained by the analysis of the 4
1 During the edition of the Catalogue Raisonné were analyzed 19 paintings of Amadeo, 18 of these dated
between 1912 and 1916 and 1 dated 1917 [Melo et al. 2009].

126
paintings with a focus on the elements that are in agreement or not with the features of Amadeo’s
technique defined in the previous work [Melo et al. 2008; Melo et al. 2009]. More details on the
analyses are presented in the Appendices of Part III, the areas of analysis of each case study are
presented in Ap.II and the results in Ap.III.1: The representative spectra of: µ-EDXRF in Ap.III.2; µ-
FTIR in Ap.III.3; µ-Raman in Ap.III.4 and FORS in Ap.III.5.
Figure 1. The pigment palette of Amadeo between 1912 and 1916, with details from his paintings. Image adapted
from Melo et al. 2009.
As noted below, the results obtained by the analysis and the materials and the techniques used in the
four paintings is compared with the analysis of the brushstroke performed using image processing.
The shape, orientation and distribution of brushstrokes are considered as distinctive markers left by
the artist on the surface of a painting; the recent application of image processing allows to develop an
algorithm to detect these features (for more information in Part I, Section 1.2.3). In the case of
Amadeo a method that combines two algorithms used in texture analysis was developed: Scale
Invariant Feature Transform (SIFT) and Gabor filter. To summarize from Part I, the first one is used to
detect points of interest (called key-points) in the image. Usually the key-points are related to the
presence of texture patterns. The second algorithm is applied in a selected region of 64x64 pixels
around each key-point. Gabor filter allows extract texture information, representing it as a vector of 24
values; the vectors of each image (ca. 1200) are used to perform a binary classification. The classifier
(Regularized Least Squared Classified-RLSC) is previously trained to recognise images of Amadeo’s
paintings (called positive class) and images of paintings from other contemporaneous artists (called
negative class). The aim of the classification is to attribute to each unknown painting a value between
0 and 1, where 0 indicates the similarity of the painting with the negative class and 1 with the positive
class. For more details please see Part I Section 2.2.

127
1.1.2 Results and discussion Figure 2 shows the images of three of the paintings that were used as case studies. The painting (A)
Collage is subject of a legal dispute. For this reason the images of the painting are not presented in
the main text but can be found in the Appendix PIII.I. Paintings (A) is a collage on paper, while (B)
Geometric and (C) Embroiderers are oil paintings on cardboard. The painting (D) Café is an oil
painting on paper that was lining on a canvas. The following is a summary of the main results
regarding the analysis of four paintings.
Figure 2. Images of the four paintings assigned Amadeo de Souza-Cardoso but that were not included in the
Catalogue Raisonné of his paintings [Freitas et al. 2008].

128
Painting (A) Collage The artwork (A) presents collage of three papers; based on our knowledge this is the only paper
collage attributed to Amadeo, with the exception of the drawing L' Athlète (1913) conserved at CAM
(Inv. DP3339) which is a collage and ink on paper and cardboard. The pigment characterization was
performed using as much as possible in-situ techniques. Raman analysis shows that a large part of
the artwork is made with pigments not included in Amadeo’s palette; these areas are mapped in
Figure I.2 in Appendix Part III Ap.I. The blue tone is a mixture of ultramarine blue, copper
phthalocyanine and dioxazine violet. Dioxazine violet is used also in the dark brown tone and in the
violet one. The red area is made with β-naphthol: this red organic pigment is also used in mixture with
the orange tone and with yellow ochre in the brown-orange tone. The ochre tone is made by iron
based pigments and carbon black.
Three of the four organic pigments found in the painting were introduced as materials for artists after
the dead of Amadeo:
- Copper phthalocyanine: discovered in 1927 [Herbst and Hunger 1997] and patented in 1929
[Lomax 2005];
- Dioxazine violet: discovered in the 1920s [Keijzer 1990] and patented in 1935 [Lomax and
Learner 2006].
- Hansa yellow: used on textile since 1909 and introduces as artist materials since 1925
[Ropret 2008; Lomax and Learner 2006].
Considering that an important area of the collage was painted with pigments introduced after the dead
of the artist, this indicates that the painting could not be authored by Amadeo
Due to the presence of a varnish2 layer applied over the papers glued on the artwork it was not
possible to obtain a Raman signal. Only indigo was identified in the blue tone in the paper (b)
indicated in Figure I.2 in Appendix Part III Ap.I. EDXRF on the green area of the paper (a) detected
arsenic and copper; these results suggest the presence of a copper-based pigment such as emerald
green or Scheel’s green. The latter was used in wall paper in the XVII and XIX centuries [Fiedler and
Bayard 1997].
The brushstroke analysis of this painting gives a value of 0.21 - where 1 is the probability to be painted
by Amadeo and 0 by another artist; the accuracy of the answer is 91%. This result support the
conclusions made based on the analysis of the materials.
2 The varnish was not analysed.

129
Painting (B) Geometric
The X-ray image acquired for this painting (Fig.3) does not show overlapping between the figures of
the composition. Besides this, the infrared photography shows few lines used to define the space
(Fig.3), these lines are not used as preliminary drawing but just to sketch the outline of the
composition. Both these features were also detected in the Amadeo’s paintings analysed in previous
work [Melo et al. 2008]. The cardboard used as support is also not unusual in his artworks of small
dimension (Part II, Section 1.1.3).
Figure 3. Image documentation of the Painting B (Left) X-ray image (Right) Infrared photography, in orange the
line used as sketch to create the composition.
Figure 4 compares two photomicrographs from the painting B and two from the painting Quadro G
(1912) (this panting belongs to the CAM collection, Inv. 77P2): the shape, the texture and the density
of the brushstrokes of the painting Geometric are very similar to those observed in the CAM’s painting
of Amadeo dated 1912-14. As indicated by the X-ray image there are no overlaps between the
different geometric figures, observing the painting surface at the microscope, in few point it is possible
to see the white preparation layer, this feature is quite also not unusual in the Amadeo’s technique.

130
Figure 4. Photomicrographs of the brushstroke details from: A and B painting Geometric (10x); C and D Amadeo
de Souza-Cardoso, Quadro G (7x), dated 1912, collection of Centro de Arte Moderna, Fundação Calouste
Gulbenkian (Inv. 77P2).
The palette of pigments used in painting is Geometric restricted (Table 1): FTIR and Raman analysis
detected the presence of viridian, cobalt blue, vermilion and ochre. Chrome yellow (solid solution of
chromate and sulphate) was detected only by Raman and in mixture with ochre. All these pigments
are consistent with Amadeo’s palette based on previous study [Melo et al. 2008].
Table 1. Palette of pigments detected in the Painting Geometric.
Cobalt blue Viridian Vermilion Chrome
yellow Ochre yellow Lead white
CoO.Al2O3 Cr2O3.2H2O HgS Pb(Cr,S)O4 Fe2O3.H2O 2PbCO3.Pb(OH)2
Brushstroke analysis based on image processing gives a value of 0.9, where 1 is the probability to be
painted by Amadeo and 0 by another artist; with an accuracy of 91%. In contrast to what was
observed in the case of the collage (Painting (A) Collage), both technical and brushstroke analysis did
not identified any elements that suggest that this painting could have not been painted by Amadeo.
Painting (C) Embroiderers
The painting support used is a cardboard with a preparation layer of lead white and barium sulphate.
No underdrawings or even lines to orient the composition were observed with IR photography
(Appendix Part III Ap.IV).

131
X-ray image (Fig.5, left) shows only a difference between the compositions visible with normal light
(Fig. 5, right) in correspondence with the windows in top of the painting. Nevertheless, it seems more
a pentimento of the artist than an underpainting.
Figure 5. Painting C Embroiderers; visible light photograph (left); X-ray image of the, the red rectangle indicates
the region that has no correspondence to that of the surface of the painting (right).
Also in this painting the palette of colour is restricted: the blue tone is obtained with a mixture of cobalt
blue and iron oxide pigments (goethite and hematite); viridian and chrome yellow were also identified.
All these pigments belong to the Amadeo’s palette, less common is the use of -naphthol red pigment.
This organic pigment was detected by µ-Raman in the red area. FORS analysis suggest the presence
of an organic pigment also in the pink tone, anyway it was not confirmed by other examination. The -
naphthol red pigment was only found in the painting Coty (1917) in mixture with minium (Pb3O4) (Part
II, Section 2.1.4) and in the illustrated manuscript version of Gustave Flaubert’s book La Légend de St
Julien L’Hospitalier (1912) (Part II, Section 1.1.1). The first -naphthol pigment (PR1) was introduced
in the artistic market in 1895; most of the other pigments of this family were introduced in the early
1900s [Lomaxa and Learner 2006]. For this reason, it cannot be considered as an evidence that the
painting is forged. However, it is important to stress that this would be the first painting of Amadeo in
which the vermilion has been completely replaced by an organic red.

132
The texture of the painting is quite evident: the paint layer is thick and the brushstroke is used to
create the figure more than to fill it, this characteristic is clearly visible in the standing female figure
(Fig. 6).
Figure 6. Detail image of the group of women, here the brushstroke is used to create the figures more that fill it.
In addition, these observations are supported by the analysis of the brushstroke using image
processing: the probability of the brushstroke to be of Amadeo is 0.92 (where 0 is not Amadeo and 1
Amadeo), with an accuracy of 91%.
To conclude, the analysis performed did not detect elements indicating that this painting could not
have been painted by Amadeo, except to the extensive use of organic pigments belongs to the class
of -naphthol instead of his usual vermilion. Pigments from the -naphthol class has been found only
in Flaubert’s book La Légend de St Julien L’Hospitalier (1912) and in Coty (1917).
Painting (D) Café The scene represented in this work appears related to drawing and the caricatures3 that Amadeo
made at the beginning of his career more than to oil paintings. The painting was realize on paper and
then lining on the actual canvas; moreover a thick layer of varnish cover the painting surface.
Combining the information acquired by the X-ray and the UV photograph4 we can see that the painting
underwent at least two important conservation treatments (these are mapped in Figure 7 in green and
in red). The X-ray image show areas with low radiopacity, these areas do not show any relation with
3 Appendix Part II Ap. V shows an example of drawing and a caricature by Amadeo present in the Collection of
Centro de Arte Moderna, Fundação Calouste Gulbenkian. 4 The X-ray image and the UV photograph are presented in Appendix Part III Ap.IV

133
the figures represented in the composition and were probably filled in the past (mapped with red in
Fig. 7). The UV photograph shows areas with a fluorescence less intense comparing with that of the
varnish. These areas seems related with a chromatic integrations was made over the varnish layer
(mapped with green in Fig. 7).
Figure 7. Mapping of the conservation treatments, based on the X-ray image the UV photograph () in these
areas the X-ray image shows the presence of a material less radiopaque comparing with the rest of the painting.
() In the UV photograph are visible areas where the chromatic integrations was made over the varnish layer.
Concerning the material analysis, Raman and FTIR analysis detected viridian, vermilion and chrome
yellow, all found frequently in Amadeo’s paintings. The violet tone is a mixture of ultramarine blue,
vermilion and a red lake (not identified) with lead white and barium sulphate. The creation of a purple
hue by the mixture of a blue inorganic pigment and a red organic dyes was found only in the painting
Entrada of 1917; in the earlier works, as well as in Coty and Untitled (both of 1917), Amadeo used
cobalt violet (Part II, Section 2.1.4). The white area analysed are a mixture of lead white and barium
sulphate, this mixture was found also in the painting on cardboard5 analysed in 2008 [Melo et al.
2009]. Concerning the blue hue, EDXRF analysis detected the presence of cobalt but it was no
possible to confirm the presence of cobalt blue pigments by other spectroscopic techniques; Raman
detected the presence of ultramarine (Appendix Part III Ap.III.1 and III.3).
5 Paintings form the CAM collection: Inv. 77P5; Inv. 91P219; Inv. 91P224; Inv. 91P225; Inv. 88P159; Inv. 91P220;
Inv. CP0143 and Inv. CP0137 [Melo et. al. 2009].

134
The overall image processing analysis gives a value of 0.35 (where 0 is not Amadeo and 1 Amadeo,
with an accuracy of 91%), this result inserts the painting in the negative class (Not Amadeo). However
we note that the presence of the layer of varnish compromise the observation of the brushstroke of the
painting, which can be appreciated only at the microscopic level. For that reason four areas, where no
conservation treatments were detected and in which the brushstroke was evident, were photographed
and used as additional information in the brushstroke analysis (Fig. 8). The brushstroke analysis was
also performed on the images acquired in these areas. Figure 8 shows the four areas analysed and
the results obtained by the brushstroke analysis: in these areas the analyses give values higher than
0.85. This result can be explain in two ways: (i) the analysis of the overall image was influenced by the
presence of the varnish; (ii) in this painting there are the contributions of two artists (at least) one of
these used a brushstroke with features similar to that used by Amadeo. It is important to take into
account that the application of image processing on images collected on areas of the painting was
made for the first time on the painting Café. This method was not tested on other Amadeo’s paintings
because it was beyond the scope of this thesis, for that reason this result must be considered as a
suggestion and in the future will be important to evaluate this strategy.
Figure 8. Image of the painting and in detail the four areas selected for brushstroke analysis and the relative
brushstroke probability (Brus. Prob.), where 1 is the probability to be painted by Amadeo e 0 by another artist; the
accuracy of the answer is 91%.
The contrast between the results obtained by the analysis of the painting with those obtained in the
selected areas could be related to the presence of the varnish and/or the conservation treatment that

135
compromised the analysis of the texture. Another hypothesis is that the painting was partially made by
Amadeo and completed later on by another artist.
1.1.3 Final Remarks The case studies presented show that the analysis of the brushstroke using image processing, are in
agreement with observations of the painting surface (with the naked eye and by the microscope) and
with the conclusion made by the analysis of the pigments. In the first two paintings (Collage and
Geometric) the technical investigation and the image processing analysis give the same unambiguous
result. In the case of the painting Embroiderers representing the embroiderers, the brushstroke
analysis clearly includes the artwork in the positive class (Amadeo) and material analysis did not
detect pigments introduce after the 1918. The pigments used in the painting Embroiderers are the
same found in previous analysed paintings of Amadeo [Melo et al. 2009] to note the use of the red
pigment belongs to -naphthol class has been found only in Flaubert’s book La Légend de St Julien
L’Hospitalier (1912) and in Coty (1917). The study of the painting Café show the limitation of this
technique in the case of painting with varnish layer that reduce the visibility of the brushstroke. By the
analysis of this painting it was possible to identify the presence of pigments frequently used by
Amadeo: viridian, vermilion and chrome yellow. The purple hue is obtained by a mixture of ultramarine
blue, vermilion and a red lake (not identified). The use of a mixture of blue pigment and red lake was
found only in the paintings BRUT and Entrada dated 1917, while in the earlier works, as well as in
Coty and Untitled (both of 1917), it was found cobalt violet pigment. The analysis of the brushstroke of
the painting Café classified this painting as Not Amadeo, while the brushstroke analysis performed on
four selected areas of the painting given positive results (high similarity with the brushstroke of
Amadeo). This experience identify an important limitation in the use of the classifier based on image
processing: the presence of varnish can compromise the identification of the brushstroke and
consequently the classification of the painting. The analysis of images acquired on selected areas of
the painting, was used for the first time here, in the future this method should be tested on more
known painting to evaluate its efficiency. Moreover this method should be test to identify the
contribution of more than one artist in the same painting.

136
1.2 Hyperspectral imaging analysis
In this following section the system based on the combination hyperspectral imaging and elemental
analysis is used to analyse of the four paintings dated 1917 (BRUT, Entrada; Coty and Untitled). This
analysis is useful to evaluate the potentialities and limitations of the system developed.
1.2.1 The system proposed
In Part I Chapter 2 of this thesis it is presented the system based on the combination hyperspectral
imaging and elemental analysis. To resume, it provides the characterization of the pigments present in
the painting and identifies areas painted that may not painted by Amadeo. The system was developed
based on the information acquired by the analysis of 19 selected paintings of Amadeo: 18 dated
between 1912 and 1916; 1 dated 1917 and a set of 16 oil paint tubes (tube database) used as
reference materials (more information of the paint tube in Part I Section 1.1.3 and Part II Section 2.3.1)
[Melo et al. 2008; Melo et al. 2009]. The identification of the pigment is performed by comparing the
data (reflectance spectra and elemental data) acquired on the painting and those present in the tube
database. The elemental analysis is performed by μ-Energy Dispersive X-ray Fluorescence (μ-
EDXRF), an in-situ technique used for the identification of chemical elements with atomic number
higher than sodium. The comparison of reflectance spectra is achieved using a combination of
Spectral Angle Mapper (SAM) and Euclidian Minimum Distance (EMD). Besides that, the system
indicates the areas made with materials that are not consistent with those present in the tube
database (this area is labelled as Not Amadeo area) and the areas where it was not possible to
perform the analysis due to the missing of the elemental information (labelled Not Analysed area).
The output image created by the system is an easy way to check the attributions proposed by the
system. The RGB values used to create the output image are computed from the reflectance spectrum
according with the classification of the area; while the colours for the other two areas (Not Amadeo
and Not Analysed) are pink and grey, respectively.
1.2.2 Results and discussion
Table 2 shows the percentage of the Not Analysed and Not Amadeo areas in the four paintings
analysed. As expected the percentage of Not Amadeo area is always 0 with the exception of the Coty,
where the percentage is 7.5%. This percentage corresponds to the area with cobalt yellow pigment.
Cobalt yellow pigment is present alone and in mixture with chrome yellow (Fig.9); this pigment was not

137
included in the Amadeo’s paint database6 because it was found in a relevant amount for the first time
in the painting Coty.
Table 2. Percentage of Not analysed and Not Amadeo area in BRUT, Entrada, Coty and Untitled paintings.
Not Analysed area (%)
Not Amadeo area (%)
BRUT 2.7 0 Entrada 0 0
Coty 0 7.5 Untitled 0.5 0
Figure 9. A Image Coty painting; B segmented image; C mapping of Not-Amadeo area based on the reference
pigments from the previous study [Melo et al. 2008].
It is worth noticing that the mirrors present in the paintings (Coty and Entrada) appeared black in the
hyperspectral images and the resulting segmented images. This is due to the way in which the data
are acquired7.
The mapping image obtained by the analysis of the hyperspectral image of the painting Entrada
shows good results (Fig.10). Anyway, in the mapping of the emerald green pigment (Fig. 10C) the
system includes the area indicated with the letter (a), where µ-Raman and µ-FTIR detected the
presence of viridian and Prussian blue.
6 The tube database of reference materials includes: cobalt violet; vermillion; carmine lake; terra rossa; raw Siena;
ochre yellow; chrome yellow; cadmium orange; cobalt blue; cerulean blue; Prussian blue; ultramarine blue;
viridian; emerald green; lead white; ivory black.
7 For each painting 33 images are acquired in the range 400-720 nm, as well other two images are acquired and
used to correct (i) the noise signal of the detector and (ii) the eventually non-homogeneous distribution of the light
intensity from the centre to the periphery of the acquired image. The first image is taken with the lens camera
corked; while the “light-reference” image is taken using a uniform diffuse surface. On the mirrored surface the
intensity of the reflected radiation is very close to that reflected by the “light-reference” surface for that reason,
after the correction, the reflectance spectra in the mirror area is close to 0 (black).

138
Figure 10. A Image of Entrada; B segmented image; C mapping of the emerald green pigment.
In Figure 11 the reflectance spectra of this mixture is compared with those from the emerald green
and viridian oil paint tubes include in the database of reference materials. In the spectra acquired from
the painting the reflectance absorption band in the region 600-720 nm shows low values comparing to
the spectrum of viridian, probably due to the presence of the Prussian blue. Which would account for
the misclassification.
Figure 11. Comparison between the reflectance spectra acquired on A Entrada in the green area (a) with a
mixture of viridian and Prussian blue; B from the oil paint tube samples viridian and emerald green, used as
reference materials in the data-base.
The mapping of BRUT shows a differentiation between the black areas indicated in Figure 12A with
the letters (a) and (b). The reflectance values of the area (a) are higher than the area (b) with E = 20.
Raman analysis in area (b) detected the presence of hematite, vermilion and carbon black; the
EDXRF analysis in the two areas shows a higher amount of iron in the area (a) comparing in the area
(b). The different proportion of iron based-pigments and vermilion in the mixture used in the two areas
could explain the difference in the reflectance values and the resulting difference in the mapping.

139
Figure 12. A BRUT (a), (b) black areas, (c) Prussian blue with whiteness surface, (d) area of fading; B
segmented image.
In the painting BRUT we found two areas where it appears that the original colours have changed:
(i) The blue area, indicated by (c) in Figure 12A, is made by Prussian blue but the delamination of the
varnish induced white patches on the surface. A photomicrograph of the area is in Figure 13.
(ii) The area of the head of the guitar, indicated with (d) in Figure 12A and presented in Part II,
Section 2.2.2, shows a bluish tone though to be due to the fading of the eosin-based lake used in
mixture with cobalt blue (Fig. 13).
Figure 13. Photomicrographs of the area with problems due to colour alteration: (left) the blue area, indicated with
the letter (c) in Figure 12A, shows a whiteness due to the delamination of the varnish; (right) violet area, indicated
with the letter (d) in Figure 12A, the fading of the eosin lake left a bluish tone from cerulean blue visible.
Hyperspectral analysis associated with the blue area (i) shows the presence of cobalt blue pigment.
This error could be explained due to the current colour of the surface. Table 3 shows the colorimetric
values of three points in the paintings: Prussian blue area altered and not altered and a cobalt blue
area. The colorimetric values of the altered area are closer to cobalt blue (E=11) than the unchanged
Prussian blue (E=37).

140
Table 3. Colorimetric analysis on the BRUT blue areas.
Colour area L* a* b* E
Prussian blue not altered 28 5.99 -34.5 37
Prussian blue altered 31.8 0.2 -12.3 11
Cobalt blue 33 -7.05 -15.3
In the case of the violet area (ii) the hyperspectral analysis is associated with the presence of cerulean
blue, since the eosin-based lake does not contribute at the surface colour.
The mapping image (Fig. 14B) produced by the analysis of the Untitled hyperspectral image shows
good results. In Figure 14C the example of the mapping of vermilion, in the red areas this pigment was
used alone or in mixture with ochre and chrome yellow. This last pigment is mapped in Figure 14D.
Figure 14. A Images of Untitled; B segmented image; mapping of C vermilion; D chrome yellow.
141
According with the paintings previously analysed, Amadeo rarely used pure black pigment in the black
areas; usually this tone was achieved using a mixture of carbon black, blue pigments (such as cobalt
or Prussian blue), vermilion and iron-based pigments; the identification of these mixtures by
reflectance spectroscopy is challenging, and in the proposed system it is mainly performed using
colorimetric values and elemental analysis. It is notable that in Untitled a problem appeared similar to
that observed in the black areas in BRUT: the rectangle close to the left edge of the painting is
mapped as a blue hue (Fig.14B) because the system identified a mixture of cerulean, cobalt violet and
vermilion; EDXRF analysis in this area (Bk10b) detected Hg; Fe, Zn, Pb and Ca (Appendix Part II
Ap.V.1). In the hyperspectral image in the black area, and in black part we observed a stray-light8 of
the surface.
1.2.3 Final remarks The analysis of the paintings dated 1917 by the system based on hyperspectral imagining and
elemental data show the potentialities but also some limitations of the system. The case study Coty
shows the role of the database of reference materials used to characterize the pigments in the
painting; Coty was analysed using a database built using the information collected by the analysis of
the 19 paintings dated (1912-1917) and the set of paint tube samples (Part I Section 2.3.1) where the
cobalt yellow was not included. By the analysis of the hyperspectral and elemental data acquired on
Coty the system identified the area painted with cobalt yellow (alone and in mixture with chrome
yellow) as a Not Amadeo area. In the future will be important to extend the database of reference
materials including the pigments found in the paintings dated 1917 and analysed in this thesis. In this
case the system results useful as preliminary screening tool that can help the user to identify areas of
interest were it is necessary to perform further analysis requiring micro-sampling.
The analysis of the BRUT painting shows that the presence of conservation problems related with
colour alteration can affect the performance of the system. This problem affects mainly the pre-
processing step (presented in Part I, Section 2.3.2), where the colorimetric values (CIEL*a*b*) are
used to extend the localized information obtained by µ-EDXRF to all the painting surface. The system
associates to areas with the same colour the same chemical elements selected from a list of points
analysed by µ-EDXRF. It was note that in presence of fading or colour alteration this association can
be uncorrected; this error may have repercussions in the next steps and then in the characterization of
the pigments. This problem could be reduced using a macro-XRF [Alfeld et al. 2013] that allows to
perform the elemental analysis directly over all the painting surface. Using macro-XRF each pixel of
the hyperspectral image should directly associated to the elemental analysis performed in the same
area, this will avoid the pre-processing step and reduce the error related to the association between
colour and elements.
8 Stray-light, gives reflections and light scatter usually resulting from the presence of imperfections, dust, or other
particles or similar [Hunt 1991].

142
To improve the system it could be useful to extend it with a function that allows the possibility of
enabling manual intervention from an expert user. The aim of the manual intervention could be “to
force” the results of the mapping in the most challenging areas, such as those with pigments which are
too dark and/or too light.

143
CONCLUSIONS
AND FUTURE WORK

144
The unique features belonging to an artist are a fundamental factor in assessing painting attribution. It
is possible to define these features as those features that remain invariant in his/her work even when
the artist changes subject or period. These features can be identified only after a systematic study of a
selected set of paintings, so as to cover the longest period possible in his/her career.
Based on previous work made at the DCR-FCT in cooperation with Helena de Freitas [Melo et al.
2008], it appeared clear that authentication issues in the case of Amadeo de Souza-Cardoso could
only be addressed by combining the information extracted from his brushstrokes and from the analysis
of his painting materials. The system developed in this thesis is promising for addressing this
requirement: it shows potential to provide a quantitative answer concerning painting authorship. The
system is based on the fusion of the (i) texture analysis performed using two algorithms (namely,
Gabor and Scale Invariant Feature Transform) in combination with the Bag-of-Features model, and (ii)
molecular analysis performed using hyperspectral imaging and micro-Energy Dispersive X-ray
Fluorescence spectroscopy (µ-EDXRF). The image output (produced by the analysis of the
hyperspectral images) maps those areas made with the same pigments (or mixture of pigments). The
resulting images can also indicate the areas where (i) the system detected the presence of pigments
not consistent with Amadeo’s palette (called Not Amadeo) and (ii) where analyses were not carried out
(called Not analysed). The Not Amadeo area is useful to identify the portions of the painting where
further or complementary analysis are required; the Not analysed option alerts the user about the
presence of areas where the µ-EDXRF was not performed yet. The RGB values used to create the
output mapping image are not meant to reproduce the original colours of the painting; they are
calculated starting from the reflectance spectrum of the pigment (or the mixture of pigments) detected
by the system in each pixel. In this way, the user may perform a “visual check” on the quality of the
system response. For a more accurate analysis, the user can choose a specific pixel and check which
pigments were detected in it; the user may also request the mapping of a single pigment or a mixture.
The system based on the combination of brushstroke and molecular information was tested with
promising results on 12 paintings. In the future, it would be useful to use the system on additional case
studies; in particular, paintings of artists in Amadeo’s circle who may have shared techniques and
materials with him.
The analysis of the brushstroke using image processing achieved an accuracy higher than 90% in
distinguishing between images of Amadeo’s paintings and images of artworks by other contemporary
artists. The classifier give a correct answer for 133 of the 138 images of Amadeo’s paintings tested.
This technique was also used to evaluate the authorship of four paintings attributed to Amadeo (called
here as Collage, Geometric, Embroiderers and Café); the obtained results were consistent with those
acquired by the analysis of the materials and techniques. The application of the texture analysis on the
four case studies shows also that the performance of this technique could be influenced by the
presence of varnish or previous conservation treatments, as these reduce the visibility of the painting
texture (case study painting Café). An interesting future work consists in exploring the application of
this analysis on detailed images taken from the paintings (as tested for the analysis of Café); this

145
approach could be useful in settings with limited brushstroke visibility and when there is the hypothesis
that more than one artist could have worked on the painting.
In the case of molecular analysis using hyperspectral imaging and µ-EDXRF spectroscopy, the
mapping of the pigments could be compromised by the presence of change that affect the colour of
the surfaces (e.g., fading or bleaching). Alterations in the colour of the painting surface interfered
mainly with the pre-processing step; in this step the colorimetric values (L*a*b*) calculated by the
reflectance spectra are used to extend the localized information obtained by µ-EDXRF to the whole
painting surface. If it is known a priori which areas are affected by colour alteration, she could
minimize the problem by introducing data (L*a*b* and detected elements) acquired on the altered
areas. In that way the pre-processing step could make the correct association between colour and
elements. Another solution should be the use of a macroXRF to perform the elemental analysis
directly over the whole painting [Alfeld et al. 2013]; in that case a pre-processing step would no longer
be necessary. Moreover, a trained user must confirm the results proposed by the system; for this
reason, in the future it could be very useful to create a user interface to make the system accessible
also to users with no background in informatics.
The analysis of the paintings dated 1917, usually known as BRUT, Entrada, and Coty and the
Untitled, complements the knowledge on Amadeo developed in previous work [Melo et al. 2008].
These paintings are characterized by the presence of unconventional and found materials; in fact, in
Coty this type of materials are used in almost 30% of the painting surface. Thanks to the application of
colorimetric analysis based on hyperspectral images of 24 paintings of Amadeo, it was possible to
compare the colour distribution of these paintings with the previous works of Amadeo. In his paintings
dated 1917 Amadeo used a consistent colour language characterized by the presence of saturated
tones mainly applied by patches of colours without colour gradient9. The colour distribution shows an
equilibrium between the greens and the reds (-30<a*<60) and a slight predominance of yellow tones
when compared to blue tones (-40<b*<65). This results, together with the characterization of the
pigments used in this group of paintings dated 1917 are a qualitative data that can support the art
historian’s studies. The research performed by Helena de Freitas and her team on these paintings and
their documentary sources indicate these paintings as nucleus where Amadeo was developing a new
research on the use of colour10. The results obtained by the analysis of the materials and techniques,
suggest a relation between the works BRUT and Entrada: these two paintings show characteristics
that separate them from the other two. BRUT and Entrada show a very close colour distribution and
the same pigment palette (e.g., the use of chrome and cadmium yellow in the same proportion and the
extensive use of zinc white). Moreover, the analysis of objects, and the elements present in a collage
(undated) made by Amadeo (the only document of this object is a photograph conserved at the Art
Library of the Calouste Gulbenkian Foundation) supports this hypothesis. The photographed object
9 In this context colour gradient means that the colours vary continuously producing smooth colour transitions.
10 Personal communication by Helena de Freitas.

146
should be a maquette that Amadeo made before the realization of BRUT and Entrada. The presence
in the collage of the headline of the newspaper “La Correspondencia de España” allowed to calculate
the original dimension of the object: 100x70 cm. In the collage are also visible 4 pochoirs with the
letters Z, I, N and C. The dimensions of the letters (calculated considering the dimensions of the
collage proposed above) suggest that the painting Untitled (ZINC11, 1917) or at least the word “ZINC”
could have been completed before the maquette; while BRUT and Entrada should be realized after
the maquette.
FTIR analysis performed on BRUT and Entrada detected the presence of metal carboxylates related
with the use of zinc white. Differently from the painting, dated 1912-1916, analysed in the previous
work [Melo et al. 2008; Melo et al. 2009] where Amadeo used only lead white, in the paintings (BRUT,
Entrada; Coty and Untiled) Amadeo used zinc white alone and in mixture with other pigments. To note
that in the paint tube box conserved by the family and analysed in 2008 [Melo et al. 2008] only a tube
of zinc white was found. Considering the infrared features of 71 samples collected on the BRUT and
Entrada two types of metal soaps were identified: (i) the first type is characterized by the presence of a
doublet absorption 1551/1534 cm-1, the well-defined structure of the zinc carboxylate suggest that it is
a compound add to the paint more than a product of degradation; (ii) the second type is characterized
by the presence of a broad band centred at 1580 cm-1. The not-defined structure of the carboxylate
suggest the presence of a compound formed in the paint, such as the case of an alteration product
between the zinc and the oil. The first type of zinc carboxylate was detected in the areas with more
conservation problems, such as the letter “R” of the word “BRUT”, where in the sample µ5 it was
detected zinc stearate or palmitate and in the sample µ4 zinc azelate and/or oleate.
The conservation of chrome yellow in Amadeo’s paintings is a major concern. This pigment is very
important in his palette and also in these last paintings it is still the principal yellow pigment: it covers
19% Untitled’s paint surface. For this reason, a change in the colour of this pigment, similar to what
happened in the painting of van Gogh [Monico et al. 2011b], would compromise the appearance of the
painting, losing the original colour balance. The samples of chrome yellow were fully characterized
and compared with the paint reconstruction based on the W&N archive [Otero et al. 2012]. Two
chrome yellow painting samples from BRUT and Entrada were analysed by Synchrotron radiation
techniques; the analysis of the painting samples does not show any signal of degradation. In the
context of colour alteration phenomenon in BRUT, we detected fading and a colour changing at the
paint surface. The fading of the paint is associated with the use of an eosin-based lake; the fading of
this pigment causes the changing of the paint layer from pink to bluish-purple. The blue tone is related
to the presence of cobalt blue present in mixture with the lake. In a dark green area of the painting it
was detected the presence of starch. Starch was detected in the surface of the layer made by emerald
green, under the surface it is still visible the original colour of the green pigment. Observing the SEM
11 Amadeo de Souza-Cardoso, Untitled (ZINC), 1917, 59 x 49 cm. Private collection [Freitas et al. 2008, pg. 355].

147
images seems that the starch has filled the space between the particles of the pigment with the
consequent reduction of the light scattering that due the darkening of the surface.
The drawings, water colours and caricatures of Amadeo are important elements in his career;
however, a Catalogue Raisonné has not yet been produced. In the future, it could be important to
develop an approach similar to that developed for the oil paintings, applied to the study of the
drawings and watercolours. Moreover, the application of the tool developed by combining
hyperspectral imaging and µ-EDXRF would made an important contribution on the characterization of
the pigments used.

148
149
REFERENCES
Abas, F.S. 2004. “Analysis of craquelure patterns for content-based retrieval”. Ph.D. Dissertation, University of Southampton, UK. Al-Ayyoub, M.; Irfan, M. and Stork, D.G. 2011. “Computer Vision and Image Analysis of Art II”. Proceedings SPIE Vol. 7869. Alfaro, C. 2006. “Amadeo de Souza-Cardoso: 1887-1918” in Catalogue Diálogo de Vanguardas-Avant-Garde Dialogues. Assírio & Alvim and Fundação Calouste Gulbenkian, Lisbon. Alfaro, C. 2007. “Fotobiografia” in Catalogo Raisonné V1. Amadeo de Souza Cardoso fotobiografia. Assírio & Alvim and Fundação Calouste Gulbenkian, Lisbon.
Alfaro, C. 2008. “Criterios e metodologia” in Catálogo Raisonné V.2 – Amadeo de Souza-Cardoso,
pintura. Assírio & Alvim and Fundação Calouste Gulbenkian, Lisbon. Alfeld, M.; Pedroso Vaz, P.; van Eikema Hommes, M.; Van der Snickt, G.; Tauber, G.; Blaas, J.; Haschke, M.; Erler, K.; Dik, J. and Janssens, K. 2013. “A mobile instrument for in situ scanning macro-XRF investigation of historical paintings”, Journal of Analytical Atomic Spectrometry, 28:760-767. Almeida, F. and Henrique, B. 1898. Diccionario Illustrado da Lingua Portugueza Histórico, Geográphico, Scientífico, Mythológico, Biográphico, Bibliographico, etc., Lisboa: Francisco Pastor. Almeida, P.; Montagner, C.; Jesus, R.; Correia, N.; Vilarigues ,M.; Melo, M.J. and Nascimento, S. 2013. ”Analysis of paintings using multi-sensor data”. 21th European Signal Processing Conference (Eusipco), Marrocco. Arslanoglu, J.; Centeno, S.A.; Digney-Peer, S. and Duvernois, I. 2013. “Picasso in the Metropolitan Museum of Art”: An investigation of materials and techniques, Journal of the American Institute for Conservation, 52:140-155. Awate, S. P.; Tasdizen, T. and Whitaker, R.T. 2006 “Unsupervised Texture Segmentation with Nonparametric Neighborhood Statistics”, Proc. European Conference on Computer Vision, 2:494-507 Bacci, M.; Casini, A.; Cucci, C.; Picollo, M.; Radicati, B. and Vervat, M. 2003. "Non-invasive spectroscopic measurements on the Il ritratto della figliastra by Giovanni Fattori: identification of pigments and colourimetric analysis". Journal of Cultural Heritage, 4:329-336. Bacci, M.; Magrini, D.; Picollo, M.; Radicati, B.; Trumpy, G.; Tsukada, M. and Kunzelman, D. 2006. "Modern white pigments: their identification by means of non-invasive ultraviolet, visible and infrared fiber optic reflectance spectroscopy". Congress Modern Paints Uncovered, London. Bacci, M.; Magrini, D.; Picollo, M. and Vervat, M. 2009. “A study of the blue colors used by Telemaco Signorini (1835–1901)”. Journal of Cultural Heritage, 10: 275–280. Baronti, S.; Casini, A.; Lotti, F. and Porcinai S. 1997. ‘‘Principal component analysis of visible and near-infrared multispectral images of work of art’’. Chemom. Intell. Lab. Syst, 39(1): 103-114. Berezhnoy, I.E.; Postma, E.O. and Herik van den, H.J. 2005. “Computerized visual analysis of paintings“ in XVI international conference of the Association for History and Computing, Amsterdam, 14-17 September. Berezhnoy, I.E.; Postma, E.O. and Herik, H.J. van den 2009. “Automatic extraction of brushstroke orientation from paintings. POET: prevailing orientation extraction technique”. Machine Vision and Applications, 20: 1–9.

150
Berg, van den, J. D. and Boon, J. J. 1999. “Chemical changes in curing and ageing oil paints”, proceedings ICOM-CC Triennial 12th Conference, Lyon. Berg, van den, J.D. 2002. Analytical chemical studies on traditional linseed oil paints, PhD Dissertation, University of Amsterdam. Bergboer, N.; Postma, E.O. and Herik, H.J. van den 2005. “Visual object detection for the cultural heritage”, proceedings of the XVI international conference of the Association for History and Computing, Amsterdam.
Berns, R.S. 2005 Rejuvenating the appearance of cultural heritage using color and imaging science techniques, proceedings 10th Congress of the International Colour Association, AIC Colour 05, Granada, Andalucia, Spain, 369-375. Bersani, D.; Lottici, P.P. and Montenero, A. 1999. “Micro-Raman investigation of iron oxide films and powders produced by Sol–Gel syntheses”. Journal of Raman Spectroscopy 30:355–360. Bomford, D.; Kirby, J.; Leighton, J. and Roy, A. 1990. Art in the making, Impressionism, National Gallery Publications Limited. Boon, J.J; Peulvé, S.; Brink, O. F. van den; Duursma, M. C. and Rainford, D. 1996. “Molecular aspects of mobile and stationary phases in ageing tempera and oil paint films in Early Italian Paintings”, proceedings Techniques and Analysis Symposium, Maastricht. Boon, J.J.; Weerd, J. van der; Keune, K.; Noble, P. and Wadum, J. 2002. “Mechanical and chemical changes in Old Master paintings: dissolution, metal soap formation and remineralization processes in lead pigmented ground/intermediate paint layers of 17th century paintings”, proceedings ICOM-CC Triennial 13th Conference, Rio de Janeiro. Boon, J.J. and Ferreira, E.S.B. 2006. Reporting Highlights of the De Mayerne Programme, Netherlands Organisation for Scientific Research (NWO), The Hague, The Netherlands. Boon, J.J.; Hoogland, F. G. and Keune, K. 2007. “Chemical processes in aged oil paints affecting metal soap migration and aggregation”, in AIC paintings specialty group Postprints, Washington. Boselli, L. 2010. Non-invasive spectroscopic study of 19th century artists' materials. PhD Dissertation in Scienze e Tecnologie per l'archeologia e i beni culturali, Università degli Studi di Ferrara, 2010 Boselli, L.; Picollo, M. and Radicati, B. 2011. “UV, Vis, NIR Fibre Optic Reflectance Spectroscopy (FORS)” in Practical handbook on diagnosis of paintings on movable support, Editors D. Pinna, R. Mazzeo, B. Brunetti, European Project ARTECH. Bouchard, M.; Rivenc, R.; Menke, C. and Learner, T. 2009. “micro-FTIR and micro-Raman study of paints used by Sam Francis, e-PRESERVATIONScience 6:27-37. Bouchard, M. and Gambardella, A. 2010. “Raman microscopy study of synthetic cobalt blue spinels used in the field of art”, Journal Raman Spectroscopy 41(11): 1477–1485. Brandi, C. 1977. Teoria del restauro, Edizioni di Storia e Letteratura, Roma, Einaudi, Torino.
Browne, M.W. 2000. “Cross-Validation Methods”, Journal of Mathematical Psychology, 44(1):108–
132. Bucklow, S. 1997. “The Description of Craquelure Patterns,” Studies in Conservation, 42(3):129-40.

151
Burnstock, A.; Lanfear, I.; van der Berg, K.J.; Carlyle, L.; Clarke, M. and Hendricks, E. 2005. “Comparison of the fading and surface deterioration of red lake pigments in six paintings by Vincent van Gogh with artificially aged paint reconstructions”, in: A.B. Paterakis, M. Cassar, D. Thickett, C. Villers, J.Wouters (Eds.), Preprints of the 14th Triennial Meeting of the ICOM Committee for Conservation, 1:459–466. Buxbaum, G. 1998. Industrial Inorganic Pigments, 1998, pg. 58 and 116–119.
Carlyle, L. 1990. "The artists' anticipation of change as discussed in British nineteenth century instruction books for oil painting", preprints Appearance, Opinion, Change: Evaluating the Look of Paintings, United Kingdom Institute of Conservation, London, 62-67. Carlyle, L. 1993. "Authenticity and Adulteration: What Materials Were Nineteenth-Century Artists Really Using?" The Conservator, United Kingdom Institute for Conservation, Number 17:56-60. Carlyle, L. 1999. “Paint driers discussed in 19th-century British oil painting manuals”, JAIC, 38(1):69-82. Carlyle, L. 2001. The Artist’s Assistant. Oil Painting Instruction Manuals and Handbooks in Britain 1800–1900. With Reference to Selected Eighteenth-century Sources. London: Archetype Publications. Carlyle, L. and Witlox, M. 2005. HART Project Report. Report of the De Mayerne Programme project: Historically Accurate Reconstructions of Oil Paint and Painting Composites. De Mayerne Programme, Netherlands Organisation for Scientific Research (NWO). Casadio, F.; Xie,S.; Rukes, S. C.; Myers, B.; Gray, K. A.; Warta, R. and Fiedler, I. 2011. “Electron energy loss spectroscopy elucidates the elusive darkening of zinc potassium chromate in Georges Seurat’s A Sunday on La Grande Jatte—1884”, Anal. Bioanal. Chem., 399:2909–2920. Casadio, F.; Bezúr, A.; Fiedler, I.; Muir, K.; Trad, T. and Maccagnola, S. 2012. “Pablo Picasso to Jasper Johns: a Raman study of cobalt-based synthetic inorganic pigments”, Journal Raman Spectrosc., 43: 1761–1771. Casadio, F. and Rose, V. 2013a. “High-resolution fluorescence mapping of impurities in historical zinc oxide pigments: hard X-ray nanoprobe applications to the paints of Pablo Picasso”, Applied Physics A, 111:1-8. Casadio, F.; Muir, K. and Bezur, A. 2013b. “Introduction part two of special issue: From Can to Canvas”, Journal of the American Institute for Conservation, 52(4):211-212. Casadio, C.; Miliani, C.; Rosi, F.; Romani, A.; Anselmi, C.; Brunetti, B.; Sgamellotti, A.; Andral, J.-L. ans Gautier, G. 2013c. “Scientific investigation of an important corpus of Picasso paintings in Antibes: New insights into technique, condition, and chronological sequence”, Journal of the American Institute for Conservation, 52(3):182-204. Cesaratto A.; Nevin, A.; Valentini, G.; Brambilla, L.; Castiglioni, C.; Toniolo, L.; Fratelli, M. and Comelli, D. 2013. “A novel classification method for multispectral imaging combined with portable Raman spectroscopy for the analysis of a painting by Vincent Van Gogh”, Appl Spectrosc., 67(11):1234-41. Church, A.H. 1901. The Chemistry of Paints and Painting, 3rd Edition, Seeley and Co. Ltd, London. Claro, C. 2009. An interdisciplinary approach to the study of the colour in Portuguese manuscripts illuminations. PhD Dissertation. Lisboa: Universidade NOVA de Lisboa. Claro, A.; Melo, M.J.; Seixas de Melo, J.S.; van den Berg, K.J.; Burnstock, A.; Montague, M. and Newman, R. 2010. “Identification of red colorants in van Gogh paintings and ancient Andean textiles by microspectrofluorimetry”, Journal of Cultural Heritage, 11:27–34.

152
Comelli, D.; Nevin, A.; Valentini, G.; Osticioli, I.; Castellucci, E.M.; Toniolo, L.; Gulotta, D.; and Cubeddu, R. 2011. ‘‘Insights into Masolino’s Wall Paintings in Castiglione Olona: Advanced Reflectance and Fluorescence Imaging Analysis’’, Journal Cultural Heritage, 12(1):11-18. Coremans, P. 1948. Van Meegeren's faked Vermeers and De Hooghs, a scientifica examination, Cassel & Co. LTD Amsterdam. Cornelis, B.; Dooms, A.; Daubechies I. and Schelkens, P. 2009. “Report on Digital Image Processing for Art Historians”, proceedings International conference on Sampling Theory and Applications, Marseille, France. Cornman, M. 1986. 'Cobalt Yellow (Aureolin),' in Artists' Pigments. A Handbook of their History and Characteristics, vol 1, National Gallery of Art. Cotte, M.; Checroun, E.; Susini, J.; Dumas, P.; Tchoreloff, P.; Besnard, M. and Walter, Ph. 2006. “Kinetics of oil saponification by lead salts in ancient preparations of pharmaceutical lead plasters and painting lead mediumsOriginal Research Article”, Talanta, 70(5):1136-1142 Craver, C. 2000. Applyed polymer science 21th century, Edited by Clara D. Craver, Charles E. Carraher, Jr. Elsevier. Cunha Leal, J. 2010. “Uma entrada para Entrada. Amadeo, a historiografia e os territórios da pintura”, Intervalo, 4:133-153. Dantzig van, M.M. 1952. Vincent? A new method of identifying the artist and his work and of unmasking the forger and his products, publisher: Keesing, Amsterdam. Dantzig van, M.M. Foundation 1973. Pictology, Edit by van Dantzig Foundation, The Netherlands. Daugman, J. G. 1988. “Complete Discrete 2-D Gabor Transforms by Neural Networks for Image Analysis and Compression”, IEEE Transactions on Acoustics, Speech, and Signal processing,
36(7):1169-1179
Deborah, H.; George, S. and Hardeberg, J.Y. 2014. “Pigment mapping of the Scream (1893) based on hyperspectral imaging”, proceedings of International Conference on Image and Signal Processing, Cherbourg, France, 247-256. Delaney, J. K.; Zeibel, J.G.; Thoury, M.; Littleton, R.; Palmer, M.; Morales, K. M.; Rene, E. and Hoenigswald, A. 2010. “Visible and infrared imaging spectroscopy of Picasso’s Harlequin musician: mapping and identification of artist materials in situ,” Applied Spectroscopy, 64(6):584–594. Delaney, J. K.; Ricciardi, P.; Deming Glinsman, L.; Facini, M.; Thoury, M.; Palmer, M. and de la Rie, R. E. 2014. "Use of imaging spectroscopy, fiber optic reflectance spectroscopy, and X-ray fluorescence to map and identify pigments in illuminated manuscripts", Studies in Conservation, 59(2): 91-101. Derrick, M.R.; Stulik, D. and Landry, J.M. 1999. Infrared Spectroscopy in Conservation Science, –Scientific Tools for Conservation. Los Angeles: The Getty Conservation Institute.
Dik, J.; Janssens, K.; van der Snickt, G.; van der Loeff, L.; Rickers, K. and Cotte, M. 2008. “Visualization of a lost painting by Vincent van Gogh using synchrotron radiation based X-ray fluorescence elemental mapping”, Analytical Chemistry, 80:6436-6442. Dredge, P.; Schilling, M. R.; Gautier, G.; Mazurek, J.; Learner, T. and Wuhrer, R. 2013. “Lifting the Lids off Ripolin: a collection of paint from Sidney Nolan’s studio”, Journal of the American Institute for Conservation, 52(4):213-226. Dutton, D. 2003. “Authenticity in Art” in The Oxford Handbook of Aesthetics, edited by Jerrold Levinson, New York: Oxford University Press. 258-274

153
Dutton, D. 2009. The art instinct, Oxford University Press, Oxford. Eastaugh, N.; Walsh, V.; Chaplin, T. and Siddall, R. 2004. Pigment Compendium: A Dictionary and Optical Microscopy of Historical Pigments, Elsevier, Amsterdam. Erkens, L.J.H.; Hamers, H.; Hermans, R. J. M.; Claeys, E. and Bijnens, M. 2001. “Lead chromates: areview of the state of the art in 2000”. Surface Coatings International Part B: Coatings Transactions, 84(3):169-176. Feller, R.J. 2004. Color science in the examination of museum objects: non-destructive procedures, Los Angeles: The Getty Conservation Institute. Ferreira, P. 1972. Correspondance de quatre artistes Portugais : Almada-Negreiros, José Pacheco, Souza-Cardoso, Eduardo Vianna Avec Robert et Sonia Delaunay, Fundação Calouste Gulbenkian, Lisbon. Ferreira, P. and Pernes, P. 1972. Sónia e Robert Delaunay em Portugal: e os seus amigos Eduardo Vianna, Amadeo De Souza-Cardoso, José Pacheco, Almada Negreiros, Fundação Calouste Gulbenkian, Lisbon. Ferreira, P. and Ribeiro, J. S. 1987. Centenário de Nascimento de Amadeo de Souza-Cardoso. Lisboa: Fundação Calouste Gulbenkian, Lisbon. Fiedler, I. and Bayard, M. 1997. “Emerald Green and Scheele’s Green” in Artists’ pigments. a handbook of their history and characteristics, 3. Fitzhugh, Elisabeth (Ed.) 1ª ed. Washington: National Gallery of Art. Fornasier, M.; Ramlau, R. and Teschke, G. 2009. “The application of joint sparsity and total variation minimization algorithms to a real-life art restoration problem”, Advances in Computational Mathematics, 31:157-184. França, J.A. 1956. Amadeo de Souza-Cardoso, Lisbona:Sul, Lisbon. França, J.A. 1986. “A Febre da vida Moderna” in Amadeo & Almada, Venda Nova:Bertand, Lisbon, 87-145 França, J.A. 1992. “As últimas pinturas de Amadeo de Souza-Cardoso” in Amadeo de Souza-Cardoso 1887-1918, Porto Ed. Fundação de Serralves, 23-26. Freitas, H.; Alfaro, C. and Rosa, M. 2006. Diálogo de Vanguardas-Avant-Garde Dialogues. Assírio & Alvim and Fundação Calouste Gulbenkian, Lisbon. Freitas, H.; Alfaro, C. and Miranda, A.T. 2007. Catalogo Raisonné V1. Amadeo de Souza-Cardoso fotobiografia. Assírio & Alvim and Fundação Calouste Gulbenkian, Lisbon. Freitas, H. and Alfaro, C. 2008. Catálogo Raisonné V.2 – Amadeo de Souza-Cardoso, pintura. Assírio & Alvim and Fundação Calouste Gulbenkian, Lisbon. Freitas, H. 2008b. “Amadeo de Souza-Cardoso 1887-1918” in Catálogo Raisonné V.2 – Amadeo de Souza-Cardoso, pintura. Assírio & Alvim and Fundação Calouste Gulbenkian, Lisbon. Freitas, H. 2008c. “Elements on the critical reception of Amadeo de Souza-Cardoso.” in Catálogo Raisonné V.2 – Amadeo de Souza-Cardoso, pintura. Assírio & Alvim and Fundação Calouste Gulbenkian, Lisbon. Frausto-Reyes, C.; Ortiz-Morales, M.; Bujdud-Pérez, J.M.; Magãna-Cota, G.E. and Mejía-Falcón, R. 2009. “Raman spectroscopy for the identification of pigments and color measurement in Dugès watercolours”, Spectrochimica Acta Part A, 74(5):1275–1279.

154
Frost, R. L. 2004. “Raman microscopy of selected chromate minerals”, Journal of Raman Spectroscopy, 35(2):153-158.
Frost, R.L.; Bahfenne, S. and Keeffe, E.C. 2010. “Raman spectroscopic study of the mineral gerstleyite Na2(Sb,As)8S13·2H2O and comparison with some heavy-metal sulphides”, Journal of Raman Spectroscopy, 41(12):1779-1783. Gabor, D. 1946. “Theory of communication”, Electrical Engineers - Part III: Radio and Communication Engineering, 93(26):429 – 441 Gardner, H. A. 1911. Paint Technology and Tests, McGraw-Hill Book Co., New York.
Gardner, H. A.1930. “Physical and Chemical Examination of Paints, Varnishes, Lacquers, and Colors”, 5th Edition, pp. 884-896.
Gates, G. 1995. “A Note on the Artists' Pigment Aureolin”, Studies in Conservation, 40(3): 201-206. Gautier, G.; Bezur, A., Muir, K., Casadio, F. and Fiedler, I. 2009. “Chemical fingerprinting of ready-mixed house paints of relevance to artistic production in the first half of the twentieth century. Part I: Inorganic and organic pigments”, Applied Spectroscopy, 63(6):597-603. Geldof, M.; Keijzer de, M.; Bommel van, M.; Pilz, K.; Salvant J.; Keulen van, H. and Megens, L. 2013. “Van Gogh’s Geranium lake”, in van Gogh Studio practice, Mercatorfonds, Brussels.
Geldof, M. and Steyn, L. 2013b. “Van Gogh’s Cobalt blue”, in van Gogh Studio practice, Mercatorfonds, Brussels.
Genestar, C. and Pons, C. 2005. “Earth pigments in painting: characterization and differentiation by means of FTIR spectroscopy and SEM-EDS microanalysis”, Analytical Bioanalytical Chemistry, 382 (2):269–274. Gonçalves, R.M. 2006. Amadeo de Souza-Cardoso: A ânsia de originalidade, Caminho Ed., Lisbon. 25-28 Gonçalves, M.T. 2013. Fakes in Art. PhD Dissertation, Estudos in Literatura e Cultura Teoria da Literatura, Facultade de Letras, Universidade de Lisboa.
Gonzalez, R.C. and Woods, R.E. 2001. Digital Image Processing, 2nd Edition. Prentice Hall Upper Saddle River, New Jersey 07458.
Gysau, D. 2006. Fillers for Paints: Fundamentals and Applications, Hannover: Vincentz Network. Hanspach-Bernal, E. and Bezur, A. 2013. “Mixed media: an example of Pablo Picasso’s combination of non-artist’s paints with tube colors from the Menil collection”, Journal of the American Institute for Conservation;52(3):173-183. Harley, R.D. 2001, Artists’ Pigments c. 1600-1835, London: Archetype Publications, 10-102. Hassard, F. 2006. Heritage, Hermeneutics and Hegemony A Study of Ideological Division in the field of Conservation-Restoration, PhD Dissertation Faculty of Creativity and Culture Buckinghamshire Chilterns University College Brunel University. Hendriks, E. and Hughes, S. 2009. “Van Gogh’s brushstrokes: marks of authenticity?”, in Art, conservation and authenticities: material, concept, context International conference, Archetype, London, 143-154. Herbst, W. and Hunger, K. 1997. Industrial Organic Pigments. Production, properties, application, Second, completely revised, WILEY-VCH Verlag GmbH & Co. KGaA.

155
Hitchman, M.A. and Rowbottom, G.L., 1982. “Transition metal nitrite complexes”, Coordination Chemistry Reviews, 42(1):55-132.
Humel, D.O. 2002. Atlas of plastics additives - Analysis by spectrometric methods. Verlag Berlin Heidelberg New York: Springer.
Hunt, R. W. G. 1991. Measuring Colour, Ellis Horwood. Irfan, M. and Stork, D.G. 2009. “Multiple visual features for the computer authentication of Jackson Pollock’s drip paintings: Beyond box-counting and fractals”, in Niel; David Fofi, Editor(s) SPIE Electronic Imaging: Machine vision application II, 7251. Jafarpour, S.; Polatkan, G.; Brevdo, E.; Hughes, S.; Brasoveanu, A. and Daubechies, I. 2009. “Stylistic analysis of paintings using wavelets and Machine Learning”, Proceedings 16th IEEE international conference on Image processing, Cairo, Egypt. Jesus, R. 2009. Recuperação de Informação Multimédia em Memórias Pessoais, PhD Dissertation, Universidade Nova de Lisboa, Faculdade de Ciências e Tecnologia. Jesus, R.; Abrantes, A. and Correia, N. 2010. “Methods for automatic and assisted image annotation”, Multimedia Tools and Applications, 1-20. Johnson, C. R.; Hendriks, E.; Berezhnoy, I.J.; Brevdo, E.; Hughes, S.M.; Daubechies, I; Li, J.; Postma, E.O. and Wang, J. Z. 2008. “Image Processing for Artist Identification Computerized analysis of Vincent van Gogh’s painting brushstrokes”, IEEE Signal Processing Magazine, 37:37-48. Johnson, D.H.; Johnson Jr, C.R and Erdmann, R.G. 2013. “Weave analysis of paintings on canvas from radiographs”, Signal Processing, 93:527–540. Kaplan, B. 2010. “Forgeries: as seen on TV! Art crimes are on the rise, and Canada”, National Post, 8 April. Keijzer, de, M.1990. "Microchemical analysis on synthetic organic artists pigments discovered in the Twentieth Century" in ICOM preprints, Dresden, 221-225.
Keshava N. and Mustard, J.F. 2002. “Spectral unmixing”. IEEE Signal Processing Magazine, 19(1):44-57. Keshava, N. 2004. “Distance metrics and band selection in hyperspectral processing with applications to material identification and spectral libraries,” IEEE Transactions On Geoscience And Remote Sensing, 42(7):1552-1565. Keune, K. 2005. Binding medium, pigments and metal soaps characterised and localised in paint cross-sections, PhD Dissertation MOLART (Project); Universiteit van Amsterdam. King, A.; Townsend, J. H.; Ormsby, B. and Gautier, G. 2013. “The use of Ripolin by Picabia in “The Fig Leaf (1922)”, Journal of the American Institute for Conservation, 52(4):246-257. Kirby, J. 2011. A closer look techniques of painting, National Gallery Company Limited. Kühn, H. and Curran, M. 1986. Artists’ Pigments: a handbook of their history and characteristics, vol. 1:170-172; 187–200; 208–211. Lapa, P. 1999. “A modernist through the memory of a distant present” in At the edge: a Portuguese futurist. Lisboa: GRI, Corcondan Gallery. 101-109. Lazzari, M. and Chiantore, O. 1999. “Drying and oxidative degradation of linseed oil”, Polymer Degradation and Stability, 65:303-313.

156
Leona, M.; Casadio, F.; Bacci, M. and Picollo, M. 2004. “Identification of the pre-Columbian pigment Maya blue on works of art by non-invasive UV-Vis and Raman spectroscopic techniques”, Journal of the American Institute for Conservation, 43(1):39-54. Lessing, A. 1983. “What is wrong with forgery?”, in The forger's art, Edit by Denis Dutton, University of California Press, London. 58-76 Lew, M. S.; Sebe, N.; Djeraba, C. and Jain. R. 2006. “Content-based multimedia information retrieval: State of the art and challenges”. ACM Transactions on Multimedia Computing, Communications and Applications, 2(1):1–19. Li J. and Wang, J. Z. 2004. “Studying digital imagery of ancient paintings by mixtures of stochastic models”, IEEE Transactions on Image Processing 13(3):340–353. Li, J.; Yao, L.; Hendriks. L. and Wang, J.Z. 2012 “Rhythmic brushstrokes distinguish van Gogh from his contemporaries: findings via automated brushstroke extraction”, Pattern Analysis and Machine Intelligence, IEEE Transactions, 34(6). Liang, H. 2012. “Advances in multispectral and hyperspectral imaging for archaeology and art conservation”, Applied Physic A, 106:309-323. Likas, A.; Vlassis, N. and Verbeek, J. J. 2003. “The global k-means clustering algorithm”, Pattern Recognition 36:451-461. Lomax, S.Q. 2005. “Phthalocyanine and quinacridone pigments: their history, properties and use”, Reviews in Conservation, 6:19-29. Lomax, S.Q. and Learner, T. 2006. “A review of the classes, structures and methods of analysis of synthetic organic pigments”, Journal of the American Institute for Conservation (JAIC), 45:107-125. Lowe, D.G. 1999. "Object recognition from local scale-invariant features," International Conference on Computer Vision, Corfu, Greece, 1150-1157. Lowe, D.G. 2004. “Distinctive image features from scale-invariant keypoints”, International Journal of Computer Vision, 91-110. Lowenthal, D. 1994. “Changing criteria of authenticity” in Nara conference on authenticity, proceedings published by UNESCO World Heritage Centre, Japan. 121-135 Loon, van, A.; Noble, P. and Burnstock, A. 2012. “Ageing and deterioration of traditional oil and tempera paints” in Conservation of Easel Paintings, edit by Joyce Hill Stoner, Rebecca Rushfield. Routledge, Oxford. 214-241 Lyu, S.; Rockmore, D. and Farid, H. 2004. “A digital technique for art authentication”, Proceedings of National Academy of Sciences (PNAS), 101(49):17006-17010. Maaten, van der, L. and Postma, E. 2009. “Identifying the real van Gogh with Brushstroke Textons”, Technical Report TiCC TR. Mallégol, J.; Gardette, J. and Lemaire, J. 1999. Journal of the American Oil Chemists' Society, 76:967-976 Manjunath, B.S. and Ma, W.Y. 1996. “Texture Features for Browsing and Retrieval of Image Data”. IEEE Transactions on Pattern Analysis And Machine Intelligence, 18(8): 837-842. Martens, W.; Frost, R. L. and Kloprogge, J. T. 2003. “Raman spectroscopy of synthetic erythrite, partially dehydrated erythrite and hydrothermally synthesized dehydrated erythrite”, Journal of Raman Spectroscopy, 34(1):90–95.

157
Matero, F.G. 2007. “Loss, Compensation, and authenticity: the contribution of Cesare Brandi to architectural conservation in America”, in Future Anterior: Journal of Historic Preservation History Theory, 4(1):45-63. Mayer, R. 1982. The Artist's handbook of materials and techniques. 4th Edition, Revised and Up, Faber & Faber. Mcmillan, G.; Casadio, F.; Fiedler, I. and Sorano-Stedman, V. 2013. “An investigation into Kandinsky’s use of Ripolin in his paintings after 1930”, Journal of the American Institute for Conservation, 52(4): 258-277. Meilunas, R. J.; Bentsen, J. G. and Steinberg, A. 1990. “Analysis of ages FTIR spectroscopy”, Studies in Conservation, 35:33-51. Melo, M.J.; Vilarigues, M.; Babo, S.; Alfaro, C.; Freitas, H. and Sandu, I. 2008. “Uma mão cheia de cores, o Seculo XX e o nascimento da arte Moderna” in Amadeo de Souza-Cardoso, Catalogue Raisonné, Pintura, V.2, 81–104. Melo, M.J.; Vilarigues, M.; Babo, S.; Alfaro, C.; Freitas, H. and Sandu, I.; 2009. “Estudo dos materiais e técnicas de Amadeo de Souza-Cardoso”, technical report Departamento de Conservação e Restauro da Faculdade de Ciências e Tecnologia Universidade Nova de Lisboa. Miller, F. A. and Wilkins, C. H. 1952. “Infrared Spectra and Characteristic Frequencies of Inorganic Ions”, Analytical Chemistry, 24(8):1253-1294. Monico, L.; Snickt, G.; Janssens, K.; Noft, W.; Miliani, C.; Verbeeck, J.; Tian, H.; Tan, H.; Dik, J.; Radepont, M. and Cotte, M. 2011a. “Degradation process of lead chromate in paintings by Vincent van Gogh studied by means of synchrotron X-ray spectromicroscopy and related methods. 1. Artificially aged model samples”, Analytical Chemical, 83:1214–1223. Monico, L.; Snickt, G.; Janssens, K.; W. Noft, W.; Miliani, C.; Verbeeck, J.; Tian, H.; Tan, H.; Dik, J.; Radepont, M. and Cotte, M. 2011b. “Degradation process of lead chromate in paintings by Vincent van Gogh studied by means of synchrotron X-ray spectromicroscopy and related methods 2. Original paint layer samples”, Analytical Chemical, 83, 1224–1231. Monico, L.; Janssens, K.; Miliani, C.; Snickt, G.; Brunetti, B. G.; Cestelli Guidi, M.; Radepont, M. and Cotte, M. 2013. “Degradation process of lead chromate in paintings by Vincent van Gogh studied by means of synchrotron X-ray spectromicroscopy and related methods 4. Artificial aging of model samples of co-precipitates of lead chromate and lead sulfate”, Analytical Chemical, 85:860-867. Montagner, C.; Bacci, M.; Bracci, S.; Freeman, R. and Picollo, M. 2011. “Library of UV–Vis–NIR reflectance spectra of modern organic dyes from historic pattern-card coloured papers”, Spectrochimica Acta Part A, 79:1669-1680
Montagner, C.; Jesus, R.; Correia, N.; Melo, M.J.; Vilarigues, M,; Macedo, R. and de Freitas, H. 2012. “Unveiling the hand of a 19th century artist with binary image classification and bag-of-features,” International Conference On Systems, Signals and Image Processing (IWSSIP), Vienna, Austria. Montagner, C.; Almeida, P.; Jesus, R.; Correia, N.; Melo, M.J.; Vilarigues, M.; Macedo, R.; Freitas, H. and Nascimento, S. 2013. “Behind the surface - Hyperspectral image spectroscopy for artist authentication”, proceedings 12th International AIC Congress, UK. Montagner, C., Sanches, D., Pedroso, J. Melo, M.J. and Vilarigues, M. 2013b. “Ochres and earths: matrix and chromophores characterization of 19th and 20th century artist materials”, Spectrochimica Acta Part A, 103:409–416. Morelli, G. 1893. Italian painters: critical studies of their works. With an introduction by A. H. Layard. Translated from the German by Constance Jocelyn Ffoulkes. 2nd impression. John Murray, 1900. London.

158
Muckley, W.L. 1882. A Handbook for painters and art students, London. Muir, K.; Langley, A.; Bezur, A.; Casadio, F.; Delaney, J. and Gautier, G. 2013. “Scientifically investigating Picasso’s suspected use of Ripolin house paints in still life, 1922 and the Red Armchair, 1931”, Journal of the American Institute for Conservation, 52(3):156-172. Müller, K. R.; Mika, S.; Rätsch, G.; Tsuda, K. and Schölkopf, B. 2001. “An Introduction to Kernel-based Learning Algorithms”, IEEE Neural Networks, 12(2):181-201. Noble, P.; van Loon, A. and Boon, J. J. 2005. “Chemical changes in old master paintings II: darkening due to increased transparency as a result of metal soap formation processes”, proceedings ICOM-CC Triennial 14th Conference, The Hague, Holland, (Ed. I. Verger). James & James, London. 496-503 Nowak, E.; Jurie, F. and Triggs, B. 2006. “Sampling strategies for bag-of features image classification”. Proceedings European Conference on Computer Vision, Graz, Austria, Springer, 3954:490-503. Osawa Z. 1988. “Role of metals and metal-deactivators in polymer degradation”, Polymer Degradation and Stability, 20(3-4):203–36. Plater, M.J.; De Silva, B.; Gelbrich, T.; Hursthouse, M.B.; Higgitt, C. L. and Saunders, D.R. 2003. “The characterisation of lead fatty acid soaps in ‘protrusions’ in aged traditional oil paint”, Polyhedron, 22(24): 3171-3179. Otero, V.; Carlyle, L.; Vilarigues, M. and Melo, M.J. 2012. “Chrome yellow in nineteenth century art: historic reconstructions of an artists’ pigment”, RSC Advances, 2:1798–1805 Otero, V.; Sanches, D.; Montagner, C.; Vilarigues, M.; Carlyle, L.; Lopes J.A. and Melo, M.J. 2014a. “Characterisation of metal carboxylates by Raman and infrared spectroscopy in works of art”, Journal of Raman Spectroscopy, published online: 10 JUL 2014 DOI: 10.1002/jrs.4520. Otero, V.; Carlyle, L.; Vilarigues, M.; Cotte, M. and Melo, M.J. 2014b. "19th century chrome yellow and chrome deep from Winsor & Newton", to be submitted.
Otero, V.; Montagner, C.; Carlyle, L.; Vilarigues, M.; Cotte, M. and Melo, M.J. 2014c. Synchrotron Radiation and Historically Accurate Reconstruction for the preservation of chrome yellow in 19th c. works of art, User Report ESRF. Pantelouris, A.; Modrow, H.; Pantelouris, M.; Hormes, J. and Reinen, D. 2004. “The influence of coordination geometry and valency on the K-edge absorption near edge spectra of selected chromium compounds”, Chemical Physics, 300(1–3):13–22. Pelagotti, A.; Del Mastio, A.; de Rosa, A. and Piva, A. 2008. “Multispectral imaging of paintings, a way to material identification,” IEEE Signal Processing Magazine, 36:27-36. Peres, C.; Hoyle, M. and van Tilborgh, L. 1991. A Closer Look: Technical and Art-Historical Studies on Works by Van Gogh and Gauguin, Zwolle: Waanders Publishers. Poggio, T. and Smale, S. 2003. “The mathematics of learning: Dealing with data”, Notice of American Mathematical Society, 50(5):537-544. Polatkan, G.; Jafarpour, S.; Brasoveanu, A.; Hughes, S. and Daubechies, I. 2009. “Detection of forgery in painting using supervised learning”, proceedings IEEE International Conference on Image Processing, Cairo.
Prasad, P.S.R.; Chaitanya, K.V.; Prasad, K.S. and Rao, D.N. 2005. “Direct formation of the -CaSO4 phase in dehydration process of gypsum: in situ FTIR study”, American Mineralogist, 90:672–678. Quilès, F. and Burneau, A. 1998. “Infrared and Raman spectra of alkaline-earth and copper II/acetates in aqueous solutions”, Vibrational Spectroscopy, 16:105-117.

159
Ricciardi, P. and Delaney, J. K. 2011. “New trends in the study of medieval illuminated manuscripts: combining visible and infrared imaging spectroscopy with site specific, in-situ techniques for material identification and mapping”, Revista de Historia da Arte, 254-263 (available online: http://revistadehistoriadaarte.wordpress.com). Rioux, J.P. 1999. “The discolouration of pinks and purples in Van Gogh’s paintings from Auvers”, in Cézanne to Van Gogh: the collection of Doctor Gachet, New York, 104-14. Robertson, S. 2004, “Understanding Inverse Document Frequency: On theoretical arguments for IDF”, Journal of Documentation, 60(5):503–520. Robinet L. and Corbeil, M.C. 2003. “The characterization of metal soaps”, Studies in Conservation, 48:23-40. Roncaglia, D. I.; Botto, I. L. and Baran, E. J. 1985 “Vibrational spectrum of Pb2CrO5”, Journal of Materials Science Letters, 4(11):1427-1428.
Ropret, P.; Centeno, S.A. and Bukovec, P. 2008. “Raman identification of yellow synthetic organic pigments in modern and contemporary paintings: Reference spectra and case studies”, Spectrochimica Acta Part A, 69:486-497. Rosenfeld, A. 1975. Visual texture analysis: An overview, Computer Science Center, Univ. Maryland, College Park, Technical Report TR-406. Salmon, L.G. and Cass, G.R. 1993 “The fading of artist’s colorants by exposure to atmospheric nitric acid”, Studies in Conservation, 38:73-91. Salton, G. and McGill, M. 1986. Introduction to modern information retrieval, McGraw-Hill, Inc., New York, NY, USA. Saunders, D. and Kirby J. 1994. “Light-induced colour changes in red and yellow lake pigments”, National Gallery Technical Bulleting, 15. Savitzky, A. and Golay, M. J. E. 1964. “Smoothing and differentiation of data by simplified least squares procedures,” Analytical Chemistry, 36:1627-1639. Schaefer, I.; von Saint-George, C. and Lewerentz, K. 2008. Painting light the hidden techniques of the Impressionists, Skira editore, Milano, Italy. Scherren, F.; Brzeninka, K.; Lutzenberger, K.; Stege, H. and Panne, U. 2009. “Synthetic organic pigments of the 20th and 21th century relevant to artist’s paints: Raman spectra reference collection”, Spectrochimica Acta A, 73:505-524. Schulte, F.; Brzezinka, K-W.; Lutzenberger, K.; Stege, H. and Panne, U. 2008. “Raman spectroscopy of synthetic organic pigments used in 20th century works of art”, Journal of Raman Spectroscopy, 39:1455-1463.
Sebe, N.; Cohen, I.; Garg, A.; and Huang, T.S. 2005. Machine Learning in Computer Vision Springer
Verlag. Shebanova, O.N. and Lazor, P. 2003. “Raman spectroscopic study of magnetite (FeFe2O4): a new assignment for the vibrational spectrum”, Journal of Solid State Chemistry, 174:424-430.
Shen, J. 2009. “Stochastic modeling western paintings for effective classification”, Pattern Recognition 42:293-301. Shimadzu, Y.; Keune, K.; Boon, J. J.; Townsend, J. H. and van den Berg, K. J. 2008. “The effects of lead and zinc white saponification on surface appearance of paint”, proceedings ICOM-CC Triennial 15th Conference, New Delhi.

160
Silva, A.M.; Sanches, D.; Montagner, C.; Vilarigues, M.; Melo, M.J. and Picollo, M. 2011. “The palette of Columbano Bordalo Pinheiro (1857-1929): characterization of oil paint colours from his tubes”, proceedings Science for Contemporary Art, AiAr conference, Florence (Italy). Silva, R. H. 1995. “Os anos do Orpheus e de Portugal futurista”, in História da Arte Portuguesa, ed. Paulo Pereira, Círculo de Leitores, Lisbon 372-377 Sipics, M. 2009. “The van Gogh project: art meets mathematics” in Ongoing international study, in SIAM News, 42(4). Sottomayor, F.A. 2011. Indústria dos Fósforos: das Origens ao Monopólio (1862-1926). O caso do Porto, Dissertação de Mestrado em História Contemporânea, Departamento de História e de Estudos Políticos e Internacionais. Porto. Standeven, H.A. L. 2011. House paints 1900-1960, ed. T. Ball, Research in Conservation.The Gettty Conservation Institute, Publications, Los Angeles. Standeven, H.A. L. 2012. “The history and manufacture of Lithol red, a pigment used by Mark Rothko in his Seagram and Harvard murals of the 1950s and 1960s”, Tate’s Online Research Journal, ISSN 1753-9854. Standeven, H.A.L. 2013. “Oil-based house paints from 1900 to1960: an examination of their history and development, with particular reference to Ripolin enamels”, Journal of the American Institute for Conservation, 52(3):127-139. Stenger, J.; Kwan, E.E.; Eremin, K.; Speakman, S.; Kirby, D.; Stewart, H.; Huang, S.G.; Kennedy, A.R.; Newman, R. and Khandekar, N. 2010. “Lithol red salts: characterization and deterioration”, e-PRESERVATIONScience, 7:147-157. Stanley B.E. 1946. The alkaline-earth and heavy metal soaps, American Chemical Society Monograph series, Reinhold publishing corporation. Stork, D.G. 2006. “Computer Vision, Image Analysis, and Master Art: Part 1,” IEEE MultiMedia, 13(3):16-20. Stork, D.G. 2008. “Computer image analysis of paintings and drawings: An introduction to the literature," Proceedings Image processing for artist identification workshop, van Gogh Museum, Amsterdam, The Netherlands. Stuart, B.; George, B. and Mcintyre, P. 1996. Modern Infrared Spectroscopy, John Wiley & Sons, England. Stuart, B. and Ando, D.J. 1997. Biological Application of Infrared Spectroscopy. New York: John Wiley and Sons. Sutton, P.C. 2004. “Rembrandt and brief history of connoisseurship” in The expert versus the object - judging fakes and false attributions in the visual arts, Edit by Ronald D. Spencer, Oxford University Press. 29-38. Tamura, H.; Mori, S. and Yamawaki, Y. 1978. “Textural Features Corresponding to Visual Perception”, IEEE Transactions on Systems, Man, and Cybernetics, SMC-8, 460-473. Tan, H.; Tian, H.; Verbeeck, J.; Monico, L.; Janssens, K. and van Tendeloo, G. 2013. “Nanoscale investigation of the degradation mechanism of a historical chrome yellow paint by quantitative electron energy loss spectroscopy mapping of chromium species, Angewandte Chemie International Edition, 52:1-5. Taylor, R. P.; Micolich, A. P. and Jonas, D. 1999. Fractal analysis of Pollock drip paintings. Nature, 399, 422.

161
Terry, A.E.; Everall, N.J. and Tooley, I.R. 2005. “Characterization of TiO2 nanoparticles surface modified with aluminium stearate”, Langmuir, 21:3172-3178. Todd, R. 2008. The thing itself: on the search for authenticity, Riverhead books, New York. Tuceryan, M. and Jain, A. K. 1998. Texture Analysis, The handbook of pattern recognition and computer vision (2nd Edition), World Scientific Publishing Co. Tumosa, C.S., Erhardt, W.D.; Marion F.M and McCormick-Goodhart, M.H. 1994. “The effects of relative humidity and temperature on exhibited objects”, Special ICOM Study Series, 9. Tumosa, C.S. 2001. “A brief history of aluminium stearate as a component of paint”, WAAC Newsletter 23(3) [on line http://cool.conservation-us.org/waac/wn/wn23/wn23-3/wn23-304.html (March 2014)]. Tumosa, C.S. and Mecklenburg, M. F. 2005. “The influence of lead ions on the drying of oils”, Reviews in Conservation, 6:39-47. Urbani, G. 2000. “Il restauro tra scienza e estetica” in Intorno al restauro, Edit by Bruno Zanardi, Skira editor Milan. 65-68 Varma, M. and Zisserman, A. 2005. “A statistical approach to texture classification from single images”, International Journal of Computer Vision: Special Issue on Texture Analysis and Synthesis, 62:61-81. Vandenabeele, P.; Moens, L.; Edwards, H.G.M. and Dams, R. 2000. “Raman spectroscopic database of azo pigments and application to modern art studies”, Journal of Raman Spectroscopy, 31:509-517. Vendilo, A.G.; Kovaleva, N.E.; Chistov, V.I. and Retivov, V.M. 2011. “Potassium cobaltinitrite”, Russian Journal of Inorganic Chemistry, 56(4):501-505. Vet, de, M. and van Kregten, J. 2014. “Touch van Gogh and Be Touched – How New Media Are Transforming the Way We Present Complex Research”, Conference of Museums and the Web, Baltimore, MD, USA. Vibert, J. G. 1892. The science of painting, translation from 8th revised edition by Percy Young.
Weerd, van der, J. 2002. Microspectroscopic analysis of traditional oil paint, PhD Dissertation Faculty of Science, University of Amsterdam. Weerd, van der, J.; van Loon, A. and Boon, J. J. 2005. “FTIR Studies of the effects of pigments on the aging of oil”, Studies in Conservation, 50(1):3-22. Yang, J.J.; Martens, W.N. and Frost, R.L. 2010. “Transition of chromium oxyhydroxide nanomaterials to chromium oxide: a hot stage Raman spectroscopic study”, Journal of Raman Spectroscopy, 42(5):1142-1146. Zanella, L.; Casadio, F.; Xie, S.; Gray, K. A.; Warta, R.; Ma, Q. and Gaillard, J. 2011. “The darkening of zinc yellow: XANES speciation of chromium in artist’s paints after light and chemical exposures”, Journal of Analytical Atomic Spectrometry, 26:1090-1097. Zhao, Y. 2008. Image segmentation and pigment mapping of Cultural Heritage based on spectral imaging, PhD. Dissertation, Rochester, New York, United States. Zumbuehl, S.; Scherrer, N.C.; Burger, A. and Eggenberger, U. 2009. “Early viridian pigment composition characterization of a (hydrated) chromium oxide borate pigment”, Studies in Conservation, 54(3):149-159.

162

163
APPENDICES PART I

164

165
Appendix I: K-means method
The goal of a cluster method is to divide a set of objects into a number (k) of clusters. Suppose a data
set X = fx1; :::;xNg and xn 2 Rd, the M-clustering problem aims at partitioning this data set into M
disjoint subsets (clusters) C1; :::;CM, such that a clustering criterion is optimized.
The most widely used clustering criterion is the sum of the squared Euclidean distances between each
data point x i and the centroid mk (cluster center) of the subset Ck which contains x i.
E(m1; :::;mM) =
NX
i=1
MX
i=1
l(xi 2 Ck kxi ¡mkk)2
Where l(x) = 1 if x is true and 0 otherwise [Likas et al. 2003].
The clustering algorithm works as represented in the figure below:
A B C
Figure I.1 A k centroids of K-clusters are chosen randomly; B Each sample is assign to the nearest centroid; C For
each cluster a new centroid is calculated. Move the centroid to the new position. If centroids are unchanged, the
clustering is done. Otherwise, go to step A and new centroids are computed.

166
Appendix II: Term Frequency–Inverse Document Frequency (TF-IDF)
Consider a collection of objects in which each object is characterized by one or more properties, each
property could be weighted to reflect its importance in the representation of the given object [Salton and
McGill 1986]. Salton proposed the concept of term frequency (TF) using a text as examples. The TF
weighting system is based on the notion that constructs (words, phrases, word groups) that frequency
occur in the text of documents have some bearing on the content of the texts. Hence the weight of term
k in document i, WEIGHTik might be set equal to the frequency of occurrence of word construct k in
the document i: WEIGHTik =FREQik
The term weighting function known as Inverse Document Frequency (IDF) was proposed in 1972, and
has since been extremely widely used, usually as part of a TF-IDF function. Karen Spärck Jones
introduced the concept of IDF: it is based on counting the number of documents in the collection being
searched which contain (or are indexed by) the term in question. The intuition was that a query term
which occurs in many documents is not a good discriminator, and should be given less weight than one
which occurs in few documents [Salton and McGill 1986].
With the Bag-of-Features each image I is represented by a vector of occurrence of words:
di = [W1;i;W2;i; :::;WNt;i]T
to normalize this vector, the Term Frequency–Inverse Document Frequency is applied,
Wl;k =Ni;k
PNl;k
log
µN
nl
¶
with nl denotes the numbers of images where the term l is present and Nl;k is the number of
occurrences of the term l in the k image.

167
Appendix III: Chromatic values
Reflectance spectra can be related to colour using established international conventions developed by
Commission International d'Eclairage (CIE)1. The tristimulus values (X,Y ,Z) in the 400 ≤ ʎ ≤ 700 nm
spectral range for the 10° standard observer (CIE 1964) are computed as follows [Feller 2004]:
X10 =K § S(¸)x10( )R( ); Y10 =K § S(¸)y10( )R( ); Z10 =K § S(¸)z10(¸)R(¸)
where: K = 100§S(¸)y10R(¸)
;
¸ indicates the wavelength at a 10 nm pitch;
S(¸) is the relative spectral power distribution of the illuminant;
x(¸), x10(¸), y(¸), y10(¸), z(¸) and z10(¸) are colour-matching functions;
R(¸) is the spectral reflectance of the specimen.
Several colour spaces have been defined based on the tristimulus values X , Y , Z . For this work we
chose the L¤a¤b¤ colour space. This space can be visualized as a spherical space in which the axis is
the lightness (L¤), ranging from 0% to 100% and the radius are the chromaticity variables a¤ and b¤.
Variable a¤ is the green (negative) to red (positive) axis and variable b¤ is the blue (negative) to yellow
(positive) axis. The variables are defined as follows [Feller 2004]:
L¤ = 116(Y=Yn)1=3 ¡ 16 ; a¤ = [500(X=Xn)1=3 ¡ (Y=Yn)1=3]; b¤ = [200(Y=Yn)1=3 ¡ (Z=Zn)1=3]
where Xn, Yn, Zn are the CIE tristimulus values of the illuminant.
1 Information concerning the activities of The International Commission on Illumination and the and the technical
report can be found in www.cie.co.at/

168
Appendix IV: Analysis of the painting Mucha give date using hyperspectral
imaging and µ-EDXRF
This appendix shows the analysis of the results produced by the system of molecular analysis (Part I
Chapter 2) obtained combining hyperspectral image and elemental analysis on the painting Mucha.
Results and discussion
Figure IV.4.A show the points where the elemental analysis was performed, the elements detected are
resumed in Table IV.1. Figure IV.1B show the segmented image obtained by the system.
A B
Figure IV.1 Mucha painting A EDXRF points of analysis; B segmented image made by the system.
Table IV.1. Elements detected for each area and the attribution performed by the system combining hyperspectral imaging and EDXRF.
Colour EDXRF Attribution made by the system
Yellow Pb, Ba, (Zn) Ca, Cr, Hg, (Fe) Chrome Yellow + Vermilion
Orange Pb, Ba, (Zn), Ca, Cr, Hg, (Fe) Vermilion + Chrome Yellow
Red Pb, Ba, Zn, Hg, (Cr, Fe) Vermilion + Chrome Yellow
Light brown Pb, Ba, Zn, Cr, Fe, Hg Yellow Ochre + Chrome Yellow + Vermilion
Green Pb, Ba, Zn, Cr (Fe) Cr Yellow +Viridian + Yellow ochre
Blue Pb, Zn, Ba, (Cr, Fe) Cerulean blue
Pb, Zn, Ba, Co, Ni, Sn, (Fe) Cerulean -- n.a.
White Pb, Ba --
Black Pb, Ba, Zn, Hg, Ca, Cr, Fe,
Co
--

169
The results obtained by the system are compared with the analysis of the reflectance spectra. Besides
that Spectra Angle Mapped (SAM) was used to visualize the distribution of the pigments in the
hyperspectral imaging.
Base on the dimension of the detector used to acquire the hyperspectral image and the distance
between the camera and the painting it was calculated that each pixel of the image represent 0,2 mm
of the painting surface. All the spectra presented in this appendix are the mean of a 9x9 pixels. The use
of a mean value, instead of the single pixel, allows the reduction of the noise of the reflectance spectrum
(Fig. IV.2).
Figure IV.2. Comparison between reflectance spectrum acquired on one pixel (red line) and the mean spectra
obtained using an area of 9x9 pixels (black line).
Yellow, orange and red areas
The spectrum of the point Y1 (Fig. IV.3A) show a maximum of absorption in the between 400 and 500
nm. The first derivative of point Y1 (Fig. IV.4A) showed a well-defined maximum peak at around 524 nm
and another less intense at 580 nm. It is visible a good correlation between the spectrum Y1 and the
spectrum form the chrome yellow paint tube sample ASC17 (Fig. IV.4B). The strong absorption band,
around 460 nm, of the chrome yellow (PbCrO4) is due to electronic transition metal-ion. In the region
580 -720 nm the spectrum of the ASC17 show a linear increase of the reflectance, in different way the
spectrum of Y1 shows a shoulder at 580 ca. nm. The two inflection points of the spectrum are clearly in
the first derivative (Fig. IV.4A), the presence of inflection point suggest the presence of contribution of a
red tone.
Concerning the point R1 the spectrum shows high reflectance values between 400 to 550 nm (Fig.
IV.3A). The first derivative (Fig. IV.4A) shows a maximum at 600 nm and a shoulder at 580 nm similar
to that observed in Y1. The reflectance spectrum of the vermilion (HgS) (Fig. IV.4B) shows a typical
shape, called “S”, with an inflection point at 600 nm. The absorption band of this due to the electronic
transition band to band [Boselli 2010].
400 450 500 550 600 650 7000,0
0,1
0,2
0,3
0,4
0,5
0,6 mean of 9x9 pixels
one pixel
Re
fle
cta
nc
e
nm

170
A B
C D
Figure IV.3 A Reflectance spectrum acquired on yellow (Y1); orange (O1) and red (R1) area. Mapping of the
pigments identified by the system: B chrome yellow; C mixture chrome yellow and vermilion and D vermilion.
Concerning the orange (Fig. IV.3A) the spectrum shape suggests the presence of yellow (Y1) and red
(R1). The curve of the first derivative (Fig. IV.4A) of O1 show two peaks at 515 nm, 584 the maximum
and a shoulder at 609 nm. In this case the peak around 580 nm is the maximum. The XRF analysis
presented in Table IV.1 confirms the presence of vermilion and chromium in the orange tones. Table
IV.2 shows the L*a*b* values acquired in the 3 areas of the painting and in the paint tube samples.
400 450 500 550 600 650 7000,0
0,1
0,2
0,3
0,4
0,5
0,6
Re
fle
cta
nc
e
nm
Y1
O1
R1

171
Figure IV.4 A first derivative of the reflectance spectra from the painting Y1, R1, O1; B reflectance spectra acquired
on the Amadeo’s paint tubes Jaune de Chrome foncé – Lefranc (ASC17) and French Vermilion - Winsor & Newton
(MG3).
Table IV.2 Colorimetric values acquired on the yellow, orange and red areas of the painting Mucha and on the
paint tube samples.
Y1 O1 R1 ASC17 MG3
L* 59,03 ± 1,9 48,76 ± 0,58 39,6 ± 0,61 77,42 ± 4,73 71,38 ±7,15
a* 21,16± 1,5 32,3 ± 2,1 44,63 ± 1,069 12,52 ± 4,32 49,64 ±13,54
b* 64,4± 4,53 50,53 ± 0,4 35,03 ± 0,85 32,59 ± 12,14 30,28±13,19
Blue areas
The reflectance spectrum of B2 (Fig. IV.5A) show as maximum of reflectance a broad band centred
around 477 nm with a shoulder at 510 nm. Associated to this reflectance band is visible an absorption
band between 550-670 nm due to the overlaps of three bands at around 567, 606 and 667 nm. This
spectrum is comparable with the spectrum of MG4 and ASC7 Cobalt (CoAl2O4) and Cerulean blue
(CoO.nSbnO2) respectively (Fig. IV.5B). In the case of Cobalt blue (MG4) the three absorption bands
between 550 and 670 nm are less visible comparing with the cerulean blue due to the dark tone of the
sample. The absorption bands in the visible region of the cobalt based pigments is related to the crystal
field transition between the orbital d-d of Co(II) ion [Boselli 2010]. The reflectance spectrum of cerulean
blue shows spectral features similar to Cobalt blue, but its absorption bands are shifted at higher
wavelengths of about 20 nm [Bacci et al. 2009]. The sample B1 (Fig. IV.5A) shows a reflectance band
at 474 nm, associated with an absorption band centred at 620 nm. The spectrum shows a good
correlation with the ultramarine spectra. Ultramarine blue (Na8[Al6SiO6O24]Sn spectrum is characterized
by a strong absorption band centred at about 600 nm, which is caused by the charge transfer of the ion
S-3 and a maximum of reflectance at 475 nm [Boselli et al. 2011; Bacci et al. 2009]. Table IV.3 shows
the L*a*b* values acquired in the 3 areas of the paintings and in the paint tube samples.
400 450 500 550 600 650 700
D'
nm
Y1
O2
R1
A
400 450 500 550 600 650 700
0,2
0,3
0,4
0,5
0,6
0,7
0,8
0,9
1,0
Refl
ec
tan
ce
nm
ASC17
MG3
B

172
C
Figure IV.5 A Reflectance spectra from the painting; B Reflectance spectra acquired form the paint tube samples
of Amadeo Cobalt Blue - Winsor & Newton (MG4) and Cerulean Blue – Winsor & Newton (ACS7); C mapping of
the area B2.
Table. IV.3 Colorimetric values acquired on three blue areas of the painting Mucha and on the paint tube
samples.
B1 B2 B3 MG4 Cobalt blue ASC7 Cerulean
L* 38,46 ± 0,65 45,16± 1,1 68,63 ± 1,61 53,68 ±18,23 49,23±4,85
a* -7,13± 0,54 -15,46± 2,06 -18,9 ± 1,73 2,95±3,7 -14,29±0,04
b* -15,86± 2,17 -16,06± 1,02 6,73 ± 1,61 -27,96±11,73 -30,18±1,1
Green areas
Figure IV.6 shows the comparison between the reflectance spectra in the points G1 and G2 from the
painting and that acquired on the paint tubes sample ASC20. That tube is labelled as Vert Emerald but
FTIR and Raman analysis confirmed the presence of viridian (Cr2O3.2H2O). The maximum of reflectance
of tube sample is 524 nm, with an absorption band centered on 630 nm. In the cases of Mucha points
the maximum reflectance is shifted of about 20 nm comparing with the paint tube. Moreover the
400 450 500 550 600 650 700
0,1
0,2
0,3
0,4
R
efl
ec
tan
ce
nm
B1
B2
A
400 450 500 550 600 650 700
0,1
0,2
0,3
0,4
0,5
0,6
0,7
Refl
ec
tan
ce
nm
MG4- Cobalt blue
ASC7-Cerulean Blue
B

173
absorption band in the region around 630 nm is less intense comparing with the viridian sample. The
green tones in the painting are significantly more yellow (high b*) comparing with the tube sample (Table
IV.4). The system developed proposed the presence of a mixture of viridian and chrome yellow, the
hypothesis was confirmed by the analysis a cross-section collect in this area [Melo et al. 2009].
Table IV.4 Colorimetric values acquired on two green areas of the painting Mucha and on the paint tube sample.
G1 G2 ASC20
L* 49,3 ± 1,5 43,26 ± 0,2 49,37±14,69
a* -23,16 ± 3,45 -26,33 ± 2,13 -10,98±7,18
b* 43,2 ± 5,08 34,5 ± 1,49 2,66±1,52
C
Figure IV.6 A Reflectance spectra from the painting; B Reflectance spectrum acquired form the paint tube sample
of Amadeo Vert Emerald – Lefranc (ASC20) C mapping of the area G1.
400 450 500 550 600 650 700
0,05
0,10
0,15
0,20
0,25
Refl
ec
tan
ce
nm
G1
G2
A
400 450 500 550 600 650 700
0,20
0,25
0,30
0,35
0,40
Refl
ec
tan
ce
nm
ASC20
B

174
Appendix V: Paint tubes samples database
This appendix present the reflectance spectra (collected by FORS) paint tube samples used to create
the database of reference materials. The system use only the reflectance values between 400 and 720
nm.
Reflectance spectra
Cobalt violet, ASC13 - Lefranc Vermillion, MG6 - Winsor & Newton
Carmine lake, ASC14 - Lefranc Terra rossa, MG18 - Rembrandt Oil Colors
Raw Siena, MG7- Winsor & Newton Ochre yellow, MG11 - Winsor & Newton
400 500 600 700 800 90010
20
30
40
50
60
70
80
90
100
R%
nm400 500 600 700 800 900
20
30
40
50
60
70
80
90
100
R%
nm
400 500 600 700 800 900
20
40
60
80
100
120
140
160
R%
nm400 500 600 700 800 900
10
20
30
40
50
R%
nm
400 500 600 700 800 900
20
30
40
50
R%
nm400 500 600 700 800 900
20
23
25
28
30
33
35
38
40
43
45
R%
nm

175
Chrome yellow, ASC17- Lefranc Cadmium orange, MG2 - Winsor & Newton
Cobalt blue, MG4 - Winsor & Newton Cerulean blue, ASC7 - Winsor & Newton
Prussian blue, ASC19 - Winsor & Newton Ultramarine Blue, 21_3130 - Winsor & Newton
Viridian, ASC20 - Lefranc Emerald green, 20_3128 - Morin et Janet
400 500 600 700 800 900
20
30
40
50
60
70
80
90
100R%
nm
400 500 600 700 800 900
10
20
30
40
50
60
70
80
90
100
R%
nm
400 500 600 700 800 9005
10
15
20
25
30
35
40
45
50
55
60
65
70
75
R%
nm400 500 600 700 800 900
10
20
30
40
50
60
70
80
90
100
110
R%
nm
400 500 600 700 800 90084
85
85
86
86
87
87
88
88
89
89
90
90
R%
nm400 500 600 700 800 900
5
8
10
13
15
18
20
23
R%
nm
400 500 600 700 800 900
20
25
30
35
40
45
50
55
60
R%
nm400 500 600 700 800 900
10
15
20
25
30
35
40
45
50
55
R%
nm

176
Lead white, 10_3130 - Paul Denis Ivory Black, MG17- Winsor & Newton*
Figure V. Reflectance spectra from the samples used to as reference materials in the hyperspectral imaging
analysis. *Spectra acquired by hyperspectral camera.
400 500 600 700 800 90075
78
80
83
85
88
90
93
95
98
100
103
105
R%
nm400 500 600 700
0.00
0.01
0.02
0.03
0.04
0.05
0.06
0.07
0.08
0.09
0.10
R%
nm

177
APPENDICES PART II

178

179
Appendix I: Paintings cited in the main text
This section presents the paintings cited in the main text but that are not shown in it.
Figure I.1 Amadeo de Souza-Cardoso, Canção popular a Russa e o Figaro, 1916, 80 x 60 cm. Collection of Centro
de Arte Moderna, Fundação Calouste Gulbenkian (Inv. 77P18) [Freitas et al. 2008, pg. 333].
Figure I.2 Amadeo de Souza-Cardoso, Trou de la serrure PARTO DA VIOLA Bon ménage Fraise avant garde,
1916, 70 x 58 cm. Collection of Centro de Arte Moderna, Fundação Calouste Gulbenkian (Inv. 68P17) [Freitas et
al.2008, pg. 336].

180
Figure I.3. Amadeo de Souza-Cardoso, Untitled (ZINC), 1917, 59 x 49 cm. Private collection [Freitas et al. 2008,
pg. 355].

181
Appendix II: Experimental Section, Instrumentation
Digital X-ray image
The digital radiography system used is ArtXRay from NTB GmbH. X-ray Generator Y.MBS/160-F01 with
directional beam type. Focal Spot size of 1,9 mm. The system works with a voltage of 40-160 kV and
X-ray account of 0.2-5 mA. The digital camera hasradiation sensibility range from 10 kV to 160 kV. A
minimum of pixelsize of 0.083 mm and a resolution of 12 pixel / mm.
The condition of acquisition were 62kV; 2.2mA with an integration time of 100ms.
Infrared photography
Infrared photograph acquired using Sony DSC-F828 camera, infrared filter, Hoya Filter, Infrared (R72).
Stereo microscope
Model Leica MZ16 (7.1x to 115x), equipped with digital camera Leica IC D and a fiber optics system of
illumination (Leica Kl 1500 LCD).
Optical Microscope (OM)
Axioplan 2ie Zeiss microscope equipped with transmitted and incident halogen light illuminator (tungsten
light source, HAL 100); UV light (mercury light source, HBO 100 illuminator); and a digital Nikon camera
DXM1200F, with Nikon ACT-1 application program software, for microphotographs. Samples can be
analysed with 10x ocular lenses and 5x/10x/20x/50x objective Epiplan lenses (giving total optical
magnification of 50x, 100x, 200x, and 500x). For the incident and transmitted light the samples were
analysed under crossed polars –polariser and analyser filters; for UV light the Zeiss filter set 05 [BP 395-
440, FT 460, LP 470], with this filter the excitation is at 395-440 nm and the emission is from 470 nm
onwards. The set 8 [G365; FT395; LP420] were also used, with this filter the excitation is at 365 nm and
emission from 420 nm onwards. The scales for all objectives were calibrated within the Nikon ACT-1
software. For all the images on this thesis, acquired with ultraviolet illumination, was used the filter set
8, otherwise the filter is reported in the caption of the figure.
µ-EDXRF
X-Ray fluorescence spectra were obtained using an ArtTAX spectrometer from Intax GmbH. Operating
with a molybdenum (Mo) X-ray tube, focusing polycapillary lens and silicon drift electro-thermally cooled
detector and a xFlash (Si drift) detector, with 170 eV resolution. The accurate positioning system and
polycapillary optics enable a small area of primary radiation (∅ ~70 μm) at the sample. Elemental
compositions were obtained from the average of three independent spots, analysed with a tube voltage
of 40KV and a current intensity of 300µA and live time 200s.

182
µ-Raman
Raman microscopy was carried out using a Labram 300 Jobin Yvon spectrometer, equipped with a
HeNe laser 17mW operating at 632.8nm and a solid state laser operating at 532 nm. Spectra were
recorded as an extended scan. The laser beam was focused with 50× and 100× Olympus objective
lens.The laser power at the surface of the samples was varied with the aid of a set of neutral density
filters (optical densities 0.3, 0.6 and 1).
µ-FTIR
Infrared analyses were carried out with a Nicolet Nexus spectrophotometer coupled to a
Continuμmmicroscope (15× objective) with a MCT-A detector cooled by liquid nitrogen. Spectra were
obtained in transmission mode, between 4000 and 650 cm-1, resolution of 8 cm-1 and 256 scans.
Samples were previously compressed using a Thermo diamond anvil compression cell. Spectra are
shown here as acquired, without corrections or any further manipulations, except for the occasional
removal of the CO2 absorption at ~2300–2400 cm-1.
µ-SPEX
Measurements were obtained with a microSPEX instrument using a setup where the Spex Fluorog
apparatus 3-2.2 is connected to an Olympus BX51 M confocal microscope. Standard dichroic filters of
600 nm and 500 nm were used to collect the excitation and emission spectra, respectively. Excitation
spectra (M) were performed collecting the signal at 610 nm and emission spectra (X) were acquired
exciting at 490 nm. All spectra were acquired in a 30 μm area, using a pinhole 8 with a 50x lens, and
the following slits set: emission slits = 3 / 3 / 3 mm and excitation slits = 5 / 3 / 0.8 mm. In each micro-
sample, at least six analyses were performed.
Fiber optical reflectance spectroscopy
Reflectance spectra were acquired using an Ocean Optics equipment composed by a single-beam
dispersive fibre optic spectrometer (model MAYA 200 PRO) equipped with 2048- linear silicon CCD
array detector (Sony ILX511B). The MAYA 200 PRO has a spectral response from 200 nm to 1050 nm.
The illumination is an Ocean Optics HL-200-HP with 20 Watt halogen light source in a single optical
path covering the 360-2400 nm range. Spectra were obtained with integration time of 8 ms and 15 scans
to average. The measuring head, in a 45°/45° (illumination/acquisition angles) configuration, gives a
diameter of analysis of about 2 mm. As reference a Spectralon® standard was used.
Hyperspectral imaging
The paintings and the paint samples were imaged from 400 to 720 nm in 10 nm intervals using a fast-
tunable liquid-crystal filter (Varispec, model VS-VIS2-10-HC-35-SQ, Cambridge Research &
Instrumentation, Inc., Massachusetts) and a low-noise Peltier-cooled digital camera (Hamamatsu, mod.
C4742-95-12ER, Hamamatsu Photonics K. K., Japan), capable of a spatial resolution of 1344 × 1024

183
pixels and 12 bit output. The spectral reflectance of each pixel of each scene was estimated from a grey
reference, presented at the scene at the time of acquisition after corrections for dark noise, spatial non-
uniformities and stray light.
SEM-EDS
SEM images were obtained using a FEI Quanta 400 FEG ESEM, which uses a Schottky emitter field
emission gun, operating at low vacuum conditions and at 15 kV, equipped with an EDAX Genesis X4M
detector. Images were acquired using secondary (SE) and backscattered (BSE) electron detectors.
Synchrotron Radiation μ-XRF and μ-XANES
High resolution SR μ-XRF maps (at 6.12 and 6.02 keV) were collected on the µ-samples to identify the
elemental composition of the samples. SR μ-XANES analyses at the Cr K-edge were performed on
selected areas of each paint sample. μ-XANES spectra were acquired by scanning the primary energy
around the Cr K-edge (5.96-6.09 keV). The energy calibration was performed using a metallic Cr foil.
Synchrotron Radiation μ-IR
Infrared analyses were carry out with Nicolet Nexus spectrophotometer coupled to a Continuμm
microscope (15x objective) with a MCT-A detector cooled by liquid nitrogen. Spectra were obtained in
transmission mode, between 4000–700 cm-1, resolution of 8 cm-1 and 100 or 150 scans. The mapping
was performed using step size of 10 nm with an aperture of the beam of 10 nm also. Only for the map
of the sample BRUT am17 in BaF2 the aperture was reduced to 8 nm and step size to 6 nm.
184
Appendix III: Colorimetric analysis of Amadeo’s paintings.
This Appendix shows the colorimetric analysis performed on 24 paintings digitalized by hyperspectral
imaging with high spectral and spatial resolution.
This work was presented at 12th International AIC Congress, UK, 2013. C. Montagner, S. M.C.
Nascimento, J. M.M. Linhares, M. J. Melo, M. Vilarigues and R. Macedo, “Assessing the power of colour
in Amadeo’s paintings”.
III.1 Materials and Method
Paintings
Twenty four paintings belonging to Amadeo (Fig. III.1) were digitalized by hyperspectral imaging at the
Center of Modern Art (CAM) of Calouste Gulbenkian Foundation in Lisbon. The paintings were chosen
considering different period of the Amadeo’s career, between 1911 and 1917. The code used to
identified the paintings (P#) refer to the numeration used in the Catalogue Raisonné [Freitas et al. 2008]
in which the paintings are presented in chronological order.
Hyperspectral imaging technique
The paintings and the paint samples were imaged from 400 to 720 nm in 10 nm intervals using a fast-
tunable liquid-crystal filter (Varispec, model VS-VIS2-10-HC-35-SQ, Cambridge Research &
Instrumentation, Inc., Massachusetts) and a low-noise Peltier-cooled digital camera (Hamamatsu, mod.
C4742-95-12ER, Hamamatsu Photonics K. K., Japan), capable of a spatial resolution of 1344 × 1024
pixels and 12 bit output. The spectral reflectance of each pixel of each scene was estimated from a grey
reference, presented at the scene at the time of acquisition after corrections for dark noise, spatial non-
uniformities and stray light. The spectral radiance of each pixel of the paintings was estimated from the
correspondent reflectance assuming the CIE D65 illuminant. The colorimetric properties of the paintings
were analyzed in the CIELAB colour space. Also, the colorimetric analyses performed on the paintings
were correlated with that performed on a set of 22 oil paint tube samples which belonged to Amadeo
and which were digitalized using the same technique.

185
Figure III.1. The paintings of Amadeo de Souza-Cardoso from the collection of Center of Modern Art of Calouste
Gulbenkian Foundation in Lisbon digitalized by hyperspectral imaging and used in this study. Images by courtesy of CAM [Freitas et al. 2008].
III.2 Results and discussion
Lightness
Figure III.2 represents the lightness values for all paintings analysed. Results show that Amadeo’s
paintings have a lightness value uniformly distributed around the mean value L* 50 with a variation of
about L* ±15.

186
Figure III.2 Lightness distribution of Amadeo paintings.
Correlation between artistic period and average colour
Figure III.3 shows the average values of the Amadeo paintings in the CIE(a*,b*) representation. The 24
analysed paintings are set in the 2 upper quadrants of the colour space. The of the paintings have a a*
values between -5 and 5; this means that they cover an area equilibrated divided between red and green
components. By correlating their colorimetric properties and the chronology of the artworks, it is possible
to see that the group of paintings dated 1911-12 (indicated in red by the numbers 29-41) is characterised
by lower a* values, so more close to the green comparing with the others. Otherwise the paintings of
the last period, 1917 (in orange) are characterized by higher a* values, so more close to the red. The
paintings dated 1913-14 (in blue) are set at high yellow component (b* between 20 and 27). In general,
a shift is evident from the green-yellow tone of the first period to a reddish tonality in the last period.
Figure III.3 Average CIE(a*,b*) value and chronologic distribution of the paintings.

187
Numbers of discernible colours
Figure III.4 shows the number of discernible colours calculated for each analysed painting. Paintings
are arranged by chronological order from P29 to P201. The number of discernible colours are estimated
assuming the CIE 1931 standard observer by segmenting the CIELAB colour volume into unitary
volumes; the just noticeable difference (JND) was assumed to be ΔE=1 in CIELAB.
Figure III.4 Numbers of discernible colours.The code P# indicates the paintings in Figure III.1
It was found that Amadeo’s paintings have about 8.700 to 80.000 discernible colours, with a mean value
of 53.000. Observing the number of discernible colours it is possible to identify two subgroups: i) the
paintings from P29 to P168 (dated between 1911 and 1916) displaying a random distribution of the
number of discernible colours, and ii) the painting from P172 to P201 may be considered as a cluster
with a mean value of 72.200. In the second subgroup are included artworks produced by Amadeo in
1917 (P196-P201), which are considered by art historians as a homogenous groups. These paintings
show a similar number of discernible colours higher than the others paintings (with the exception of
P38). In this second group it is also included the painting P172 Mucha dated 1915-16, produced during
the artist's last creative period and therefore it may be related with his last works.
Colour distribution
Using colour distribution analysis it is possible to visualize each pixel of the hyperspectral image using
its colorimetric values. Considering the 24 paintings analysed we can identify two types of distributions;
Figure III.5 reports one example for each type: (i) all the pixels occupy an elliptical area extended along
the a* axis, with values between -20 and 60 (Fig. III.5B). The pixels present contiguous values; this
suggests the use that the colours were applied by a gradient that vary continuously, producing smooth
colour transitions. (II) The area occupied by the second type, represented by the painting P197 (Fig.
III.5C) does not show a regular form, but an island like shape, where most of the shades are used pure
without a colour gradient. The area of the colour gamut in this second type is larger compared to that of
the first one, it is particular noticeable in the yellow tones. This distribution suggests the use of more
saturated colours when compared with those observed in the first type. The second type of distribution
was observed only for the paintings of the period 1916-1917.

188
III.3 Conclusions
The colorimetric analysis performed on 24 paintings of Amadeo disclosed that the colour analysis on
the paintings of the last period (from P196 to 201) differ from the others concerning the numbers of
discernible colours and their distribution. The distribution of colours calculated for each painting in the
CIE(a* b*) colour space revealed two characteristic shapes: one elliptic shape distributed along the CIE
b* axes; and a second one characterized by an island like shape, characterized by the presence of
higher saturation colours. This second type of distribution is associated with the paintings of the
Amadeo’s last period (1917) where a larger number of discernible colours was also observed.
A B
C D
Figure III.5 A Amadeo de Souza-Cardoso, Untitled (O jockey), 1913, 61 x 50 cm (P58). Collection of Centro de
Arte Moderna, Fundação Calouste Gulbenkian (Inv. 77P5) [Freitas et al. 2008, pg. 208] and B Colour distribution;
C Amadeo de Souza-Cardoso, Untitled, 1917, 93,5 x 93,5 cm (P197). Collection of Centro de Arte Moderna,
Fundação Calouste Gulbenkian (Inv. 77P8) [Freitas et al. 2008, pgs. 358] and D Colour distribution Untitled.

189
Appendix IV: Area of analysis
IV.1. BRUT
Figure IV.1 Painting Untitled (BRUT 300 TSF), areas where EDXRF analysis was performed (●).

190
Figure IV.2 Painting Untitled (BRUT 300 TSF) samples for FTIR and Raman analysis (●).

191
IV.2 Entrada
Figure IV.3 Painting Untitled (Entrada), areas where EDXRF analysis was performed (●).

192
Figure IV.4 Painting Untitled (Entrada), samples for FTIR and Raman analysis (●)

193
IV.3 Coty
Figure IV.5 Painting Untitled (Coty), areas where EDXRF analysis was performed (●).

194
Figure IV.6 Painting Untitled (Coty), samples for FTIR and Raman analysis (●).

195
IV.4 Untiled
Figure IV.7 Painting Untitled, areas where EDXRF analysis was performed (●).

196
Figure IV.8 Painting Untitled, samples for FTIR and Raman analysis (●)
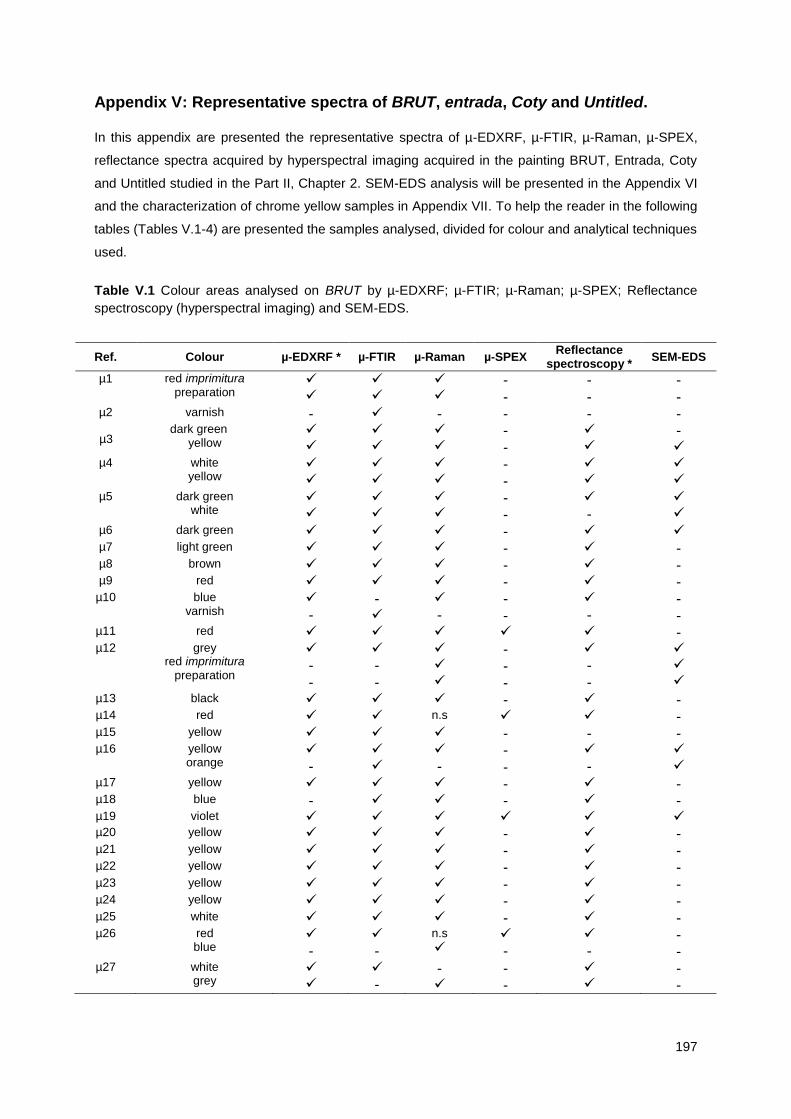
197
Appendix V: Representative spectra of BRUT, entrada, Coty and Untitled.
In this appendix are presented the representative spectra of µ-EDXRF, µ-FTIR, µ-Raman, µ-SPEX,
reflectance spectra acquired by hyperspectral imaging acquired in the painting BRUT, Entrada, Coty
and Untitled studied in the Part II, Chapter 2. SEM-EDS analysis will be presented in the Appendix VI
and the characterization of chrome yellow samples in Appendix VII. To help the reader in the following
tables (Tables V.1-4) are presented the samples analysed, divided for colour and analytical techniques
used.
Table V.1 Colour areas analysed on BRUT by µ-EDXRF; µ-FTIR; µ-Raman; µ-SPEX; Reflectance
spectroscopy (hyperspectral imaging) and SEM-EDS.
Ref. Colour µ-EDXRF * µ-FTIR µ-Raman µ-SPEX Reflectance
spectroscopy * SEM-EDS
µ1 red imprimitura preparation
- -
- -
- -
µ2 varnish - - - - -
µ3 dark green
yellow
- -
-
µ4 white yellow
- -
µ5 dark green white
- -
-
µ6 dark green - µ7 light green - - µ8 brown - - µ9 red - -
µ10 blue varnish
-
-
-
- -
-
- -
µ11 red - µ12 grey
red imprimitura preparation
- -
- -
- - -
- -
µ13 black - - µ14 red n.s - µ15 yellow - - - µ16 yellow
orange -
-
- -
-
µ17 yellow - - µ18 blue - - - µ19 violet µ20 yellow - - µ21 yellow - - µ22 yellow - - µ23 yellow - - µ24 yellow - - µ25 white - - µ26 red
blue -
-
n.s
-
-
- -
µ27 white grey
-
-
- -
- -

198
Table V.1 (continued)
µ28 red - µ29 white - - µ30 red - µ31 red n.s - - µ32 brown - - - µ33 dark green - - - µ34 dark green -
µRed1 red *Acquired on the painting surface; n.s. No signal
Table V.2 Colour areas analysed on Entrada by µ-EDXRF; µ-FTIR; µ-Raman; µ-SPEX; Reflectance
spectroscopy (hyperspectral imaging) and SEM-EDS.
Ref. Colour µ-EDXRF * µ-FTIR µ-
Raman µ-
SPEX Reflectance
spectroscopy * SEM-EDS
µ1 brown -
µ2 orange - -
µ3 dark blue - - -
µ4 blue - -
µ5 light green - - -
µ7 pink -
µ8 yellow - - -
µ11 brown - -
µ12 brown - - -
µ14 white green
- -
- -
-
- -
µ15 red black
-
- -
-
- -
µ16 brown - -
µ17 yellow -
µ19 yellow -
µ20 violet n.s -
µ21 red n.s -
µ22 red n.s -
µ23 white - -
µ24 violet - - µ25 violet - - µ26 blue
yellow -
-
- -
- -
µ27 green - -
µ28 blue - -
µ29 white - -
µ30 preparation brown
- -
- -
- -
µ31 white green
- -
- -
- -
µ32 yellow -
µ33 preparation -
µ34 dark blue - -
µ35 light blue - - -
µ36 dark blue - -
µ37 yellow - -
*Acquired on the painting surface; n.s. No signal

199
Table V.3 Colour areas analysed on Coty by µ-EDXRF; µ-FTIR; µ-Raman; µ-SPEX; Reflectance
spectroscopy (hyperspectral imaging) and SEM-EDS.
Ref. Colour µ-XEDRF * µ-FTIR µ-Raman µ-SPEX Reflectance
spectroscopy * SEM-EDS
µ1 brown preparation
-
-
-
- -
-
varnish - - - - - µ2 red - µ3 yellow - µ4 yellow - µ5 yellow
brown
-
- -
-
µ6 red preparation
-
-
n.s
n.s
- -
µ7 red - µ8 brown
transparent sphere -
-
- -
-
-
µ9 glue - - - - - µ10 white - - - - µ11 golden - - n.s. - - µ12 dark blue - - µ13 violet - - µ14 green - - µ15 violet - -
*Acquired on the painting surface; n.s. No signal
Table V.4 Colour areas analysed on Untitled by µ-EDXRF; µ-FTIR; µ-Raman; µ-SPEX; Reflectance
spectroscopy (hyperspectral imaging) and SEM-EDS.
Ref. Colour µ-EDXRF * µ-FTIR µ-Raman µ-SPEX Reflectance
spectroscopy * SEM-EDS
µ1 yellow blue
preparation
- -
-
-
- - -
µ2 preparation - - -
µ3 black - - -
µ4 white - -
µ5 green - - -
µ6 light green - -
µ7 white - -
µ8 red - - -
µ9 violet - -
µ10 yellow - -
µ11 matches - - -
µ12-13 varnish - - - - -
µ14 white - - -
µ15 golden - - - - -
µ16 Transparent sphere - - - -
µ17 paper - - - - -
µ18 fiber of the matches - - - - -
µ19 green yellow
- -
-
- -
*Acquired on the painting surface. n.s. No signal

200
Table V.4 (continued)
Ref. Colour µ-EDXRF * µ-FTIR µ-Raman µ-SPEX Reflectance
spectroscopy * SEM-EDS
µ20 white red
-
-
- -
-
- -
µ21 pink - -
µ22-23 varnish - - - - -
µ24-25 pink preparation
-
-
-
-
µ26 black - - -
µ27 yellow - -
µ28 red n.s - -
µ29 yellow - -
µ30 yellow - - -
µ31 light green n.s - -
µ32 dark blue - - -
µ33 yellow - -
µ34 yellow - -
µ35 violet - -
µ36 blue n.s - -
µ37 yellow - -
µ38 orange - - -
µ39 yellow - -
µ40 yellow - - -
µ41 light green - - -
µ42 orange - - -
µ43 white - -
µ44 black - - -
*Acquired on the painting surface. n.s. No signal

201
V.1 µ-EDXRF
Representative µ-EDXRF spectra from BRUT painting
Preparation layer (Pl1a) White (Wh1a)
White (Wh1b) Black (Bk1a)
Black (Bk7a) Black (Bk10b)
2 4 6 8 10 12 14
Pb
Pb
Fe
Pb
Ca
Hg
Pb
Pb
Ba
Hg PbZn
Fe
Inte
nsit
y (
u.a
.)
Energy (KeV)
2 4 6 8 10 12 14
Energy (KeV)
Pb
Pb
Fe
Pb
Pb
Sr
Pb
Ca
Pb
Inte
nsit
y (
u.a
.)
2 4 6 8 10 12 14
Inte
nsit
y (
u.a
.)
Energy (KeV)
Pb
Zn
Pb
Pb
Zn
Ca
Pb
2 4 6 8 10 12 14
Energy (KeV)
Inte
nsit
y (
u.a
.)
Ba
Hg
Pb
Hg
Fe
Pb
Hg
Hg
PbPb
Zn
Fe
Ca
2 4 6 8 10 12 14
Energy (KeV)
Inte
nsit
y (
u.a
.)
Pb Ba
Ba
Cr
Zn
Ba
Pb
Fe
Hg
Hg
Pb
Pb
ZnFe
K
2 4 6 8 10 12 14
Pb
Hg
Energy (KeV)
Inte
nsit
y (
u.a
.)
Fe
Pb
ZnBa
Hg Pb
Hg
Ca
PbFe

202
Violet (Vi1a)
Blue (Bl1a)
Blue (Bl2a) Green (G5a)
Green (G9a)
Yellow (Y2a)
2 4 6 8 10 12 14
Inte
nsit
y (
u.a
.)
Energy (KeV)
Co
Pb
Co Zn
Hg
BaPb Hg
Pb
Ni
Zn
CaPb
Fe
2 4 6 8 10 12 14
Energy (KeV)
Inte
nsit
y (
u.a
.)
Pb Ba
Cr
Zn
Hg
Pb
Fe
Hg
HgCu
Pb
Pb
Fe
Ca
2 4 6 8 10 12 14
Energy (KeV)
Inte
nsit
y (
u.a
.)
Pb
Fe
Pb Ba
Hg
Hg
Pb
Fe
Hg
Hg
Pb
Pb
Ca
2 4 6 8 10 12 14
Energy (KeV)
Inte
nsit
y (
u.a
.)
Hg
Pb
Zn
CrFe
Zn
Cr
Ba
Hg
Pb
Hg
Ca
Pb
Pb
Fe
2 4 6 8 10 12 14
Energy (KeV)
Inte
nsit
y (
u.a
.)
Fe
AsCuCu
Ba
Hg
Pb
Ca
Pb
PbFe
2 4 6 8 10 12 14
Energy (KeV)
Inte
nsit
y (
a.u
.)
PbPb
Cr
Pb
Cr
Ba
Pb
Pb
SrZn
Ca
Pb

203
Dark green (Bk9a)
Yellow (Y6b)
Ochre (Oc3a)
Brown (Br2a)
Pink (Pk1b)
Red (R4a)
2 4 6 8 10 12 14
Energy (KeV)
Inte
nsit
y (
u.a
.)
Fe
As
Cu
Cu
Ba
Hg
Pb
Ca
PbFe
2 4 6 8 10 12 14
Energy (KeV)
Inte
nsit
y (
a.u
.)
Hg
Hg
Zn
PbPb
Cr
Pb
Cr
Ba
Pb
Zn
Pb
Fe
Hg
Pb
Cd
Ca
Pb
2 4 6 8 10 12 14
Energy (KeV)
Inte
nsit
y (
a.u
.)
Hg
CaHg
PbCr
Fe
Pb
ZnCr
Ba
Pb
Hg
Ca
Pb
Pb
Zn
Fe
2 4 6 8 10 12 14
Energy (KeV)
Inte
nsit
y (
a.u
.)
Pb
Fe
Pb Ba
Hg
Hg
Pb
Fe
Hg
Hg
Pb
Pb
Ca
2 4 6 8 10 12 14
Energy (KeV)
Inte
nsit
y (
a.u
.)
Fe PbHg
Ca Hg
Zn
Pb
Zn
Ba
Pb
Fe
2 4 6 8 10 12 14
Energy (KeV)
Inte
nsit
y (
a.u
.)
Pb
Pb
Pb
Hg
Ba
Hg
Pb
Pb
Hg
CaPb
Fe

204
Signature (As1a)
Figure V.1 Representative µ-EDXRF spectra of preparation layer and white, black, violet, blue, green,
yellow, ochre, brown, pink, red areas from BRUT painting.
Representative µ-EDXRF from Entrada painting.
Preparation (Pl1a)
White (Wh1b)
Black(Bk1a)
Violet (Vi1b)
2 4 6 8 10 12 14
Inte
nsit
y (
u.a
.)
Energy (KeV)
HgHg
Pb
KFe
HgHg
Zn
Pb
Pb
Zn
Fe
Ba
2 4 6 8 10 12 14
Energy (KeV)
Inte
nsit
y (
a.u
.)
ZnPb
Fe PbPb
Pb
Fe
Pb
Ca
Pb
2 4 6 8 10 12 14
Energy (KeV)
Inte
nsit
y (
a.u
.)
Zn
Zn
PbPb
Sr
Ba
PbPb
Pb
Ca
Pb
2 4 6 8 10 12 14
Inte
nsit
y (
a.u
.)
Energy (KeV)
Co
Sn
Zn
PbPbFe
Pb
Ca
Pb
Pb
Co
Ni
Pb
Sn
Pb
2 4 6 8 10 12 14
Energy (KeV)
Inte
nsit
y (
a.u
.)
SnCo
ZnZn
Pb
Pb
Fe SrBaPb
Co
Ni
Pb
Ca
Pb

205
Blue (Bl1a)
Blue (Bl11b)
Green (Gr1a)
Green (Gr3b)
Green (Gr6b)
Yellow (Y2a)
2 4 6 8 10 12 14
Energy (KeV)
Inte
nsit
y (
a.u
.)
SnCa
Ni
ZnZn
Pb
Pb
Co
Pb
Ba
Pb
Pb
Co
Pb
Sn
Pb
2 4 6 8 10 12 14
Energy (KeV)
Inte
nsit
y (
a.u
.)
K
Zn
Pb Pb
Fe
Pb
Ba
Pb
Pb
FeCo
Pb
Ca
Pb
2 4 6 8 10 12 14
Energy (KeV)
Inte
nsit
y (
a.u
.)
Zn
As
Cu
Pb
Pb
Ca
2 4 6 8 10 12 14
Energy (KeV)
Inte
nsit
y (
a.u
.)
Pb
Zn
Zn
Pb
PbFe
Ba
Pb
PbFe
Pb
Cr
Ca
Pb
2 4 6 8 10 12 14
Energy (KeV)
Inte
nsit
y (
a.u
.)
Cd
Cr
Zn
Zn
Pb
PbFe
Pb
Cd
Pb
Cr
2 4 6 8 10 12 14
Energy (KeV)
Inte
nsit
y (
a.u
.)
Zn Pb
Fe
PbPbCr
Cr
Pb
Fe
Pb
Ca
Pb

206
Yellow (Y8a)
Yellow (Y13b)
Orange (O2a)
Orange (O2d)
Brown (Br1a)
Brown (Br3a)
2 4 6 8 10 12 14
Energy (KeV)
Inte
nsit
y (
a.u
.)
Cd
ZnZn
Pb Pb
Pb
PbFe
Pb
Ca
Pb
2 4 6 8 10 12 14
Energy (KeV)
Inte
nsit
y (
a.u
.)
Ca
CrZn
Pb
PbFe
Pb
PbPb
Pb
Cr
Cd
Pb
2 4 6 8 10 12 14
Energy (KeV)
Inte
nsit
y (
a.u
.)
HgHg
Hg
Pb
Pb
Pb
PbPb
Hg
Ca
Pb
2 4 6 8 10 12 14
Energy (KeV)
Inte
nsit
y (
a.u
.)
Ca
Pb
Hg
Se
FeBaPbCd
Hg
Hg
Pb
Hg Pb
Pb
2 4 6 8 10 12 14
Energy (KeV)
Inte
nsit
y (
a.u
.)
CuZn Pb Pb
Fe
BaPb
Mn
K
Ca
2 4 6 8 10 12 14
Energy (KeV)
Inte
nsit
y (
a.u
.)
ZnPb Pb
Fe
PbPb
Pb
Fe
Pb
Ca
Pb

207
Red (R2a)
Red (R6b)
Signature (Sg1b)
Pink (Pk1a)
White paint number “2” (Ltwh1a)
Blue paint number “2” (Ltbl1a)
2 4 6 8 10 12 14
Energy (KeV)
Inte
nsit
y (
a.u
.)
Cd
Zn
PbFe
SrBa
Zn
Pb
Pb
Ca
Pb
2 4 6 8 10 12 14
Energy (KeV)
Inte
nsit
y (
a.u
.)
Hg
Zn
Hg
PbFe
Pb
Ba
Zn
Pb
Hg
Ca
Pb
2 4 6 8 10 12 14
Energy (KeV)
Inte
nsit
y (
a.u
.)
Sr
Zn
Zn
Pb
Pb
Sr
Ba
Pb
Pb
Fe
Pb
Ca
Pb
2 4 6 8 10 12 14
Energy (KeV)
Inte
nsit
y (
a.u
.)
Hg
ZnZn
Pb
Pb
FeCaPb
Hg
Ca
2 4 6 8 10 12 14
Energy (KeV)
Inte
nsit
y (
a.u
.)
Zn
Zn
PbSr
Pb
Ba
Pb
Pb
Pb
PbCa
Pb
2 4 6 8 10 12 14
Energy (KeV)
Inte
nsit
y (
a.u
.)
Zn
Zn
PbPb
Co
Pb
BaPb
Co
Pb
Sn FeNi
Pb
SrCa
Pb

208
Glass (Gl1a)
Mirror #1 (GlG1a)
Green paint on glass #3 (GlG3a)
Red paint on glass #1 (GlR1a)
Golden (Gd1a)
Figure V.2 Representative µ-EDXRF spectra of preparation layer and white, black, violet, blue, green,
yellow, orange, brown, pink, red, glass, mirror, golden areas from Entrada painting.
2 4 6 8 10 12 14
Energy (KeV)
Inte
nsit
y (
a.u
.)
Fe
CaSi
FeK
Ca
2 4 6 8 10 12 14
Energy (KeV)
Inte
nsit
y (
a.u
.)
Zn
Ba
Pb
Pb
Fe
Mn Pb
Pb
Fe
K
Pb
Cr
Ca
Pb
2 4 6 8 10 12 14
Energy (KeV)
Inte
nsit
y (
a.u
.)
Zn
Cu
As
Fe
Ba
Cu
FeK
As
Ca
2 4 6 8 10 12 14
Energy (KeV)
Inte
nsit
y (
a.u
.)
BaSe
Zn
Zn
Pb HgFe
Hg
Ba
Hg
Hg
Cd Se
2 4 6 8 10 12 14
Energy (KeV)
Inte
nsit
y (
a.u
.)
Cl
Cu
Cu
Pb
Fe Pb
Zn
Pb PbCa
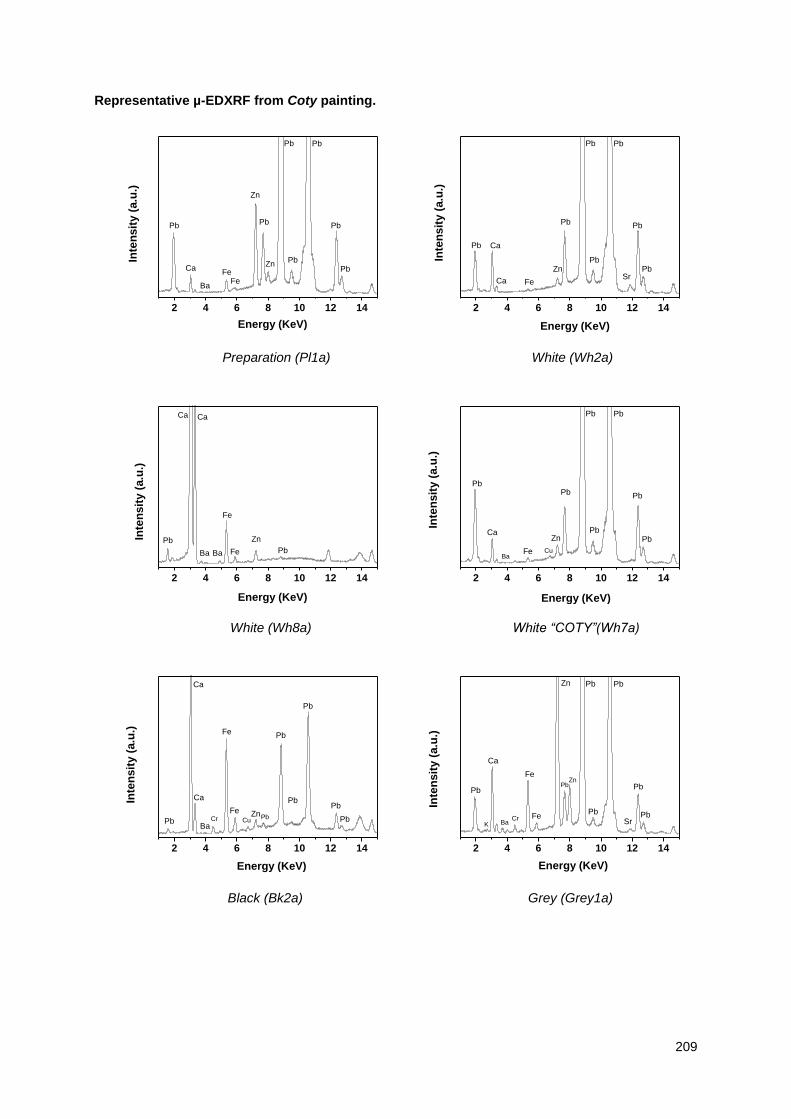
209
Representative µ-EDXRF from Coty painting.
Preparation (Pl1a)
White (Wh2a)
White (Wh8a)
White “COTY”(Wh7a)
Black (Bk2a)
Grey (Grey1a)
2 4 6 8 10 12 14
Inte
nsit
y (
a.u
.)
Energy (KeV)
Zn
Zn
PbPbFe
Pb
Ba
PbPb
Fe
Pb
Ca
Pb
2 4 6 8 10 12 14
Inte
nsit
y (
a.u
.)
Energy (KeV)
ZnPb
Pb
Pb
Ca
Pb
Fe
Pb
Pb
Sr
Ca
Pb
2 4 6 8 10 12 14
Inte
nsit
y (
a.u
.)
Energy (KeV)
Ba Fe
Zn
Pb
Ca
Ba
Fe
Pb
Ca
2 4 6 8 10 12 14
Inte
nsit
y (
a.u
.)
Energy (KeV)
ZnPb
Pb
Fe
Pb
Ba
PbPb
Cu
Pb
Ca
Pb
2 4 6 8 10 12 14
Inte
nsit
y (
a.u
.)
Energy (KeV)
Ca
Zn
PbPb
Fe
PbBa
PbCrPb
FeCu
Pb
Ca
Pb
2 4 6 8 10 12 14
Inte
nsit
y (
a.u
.)
Energy (KeV)
Pb
Zn
Zn
Pb
Pb
Fe
SrBa
Pb
Cr
Pb
FeK
Pb
Ca
Pb

210
Violet (Vi3b)
Blue (Bl1a)
Blue (Bl8a)
Green (Gr2a)
Green (Gr11a)
Yellow (Y4a)
2 4 6 8 10 12 14
Inte
nsit
y (
a.u
.)
Energy (KeV)
Co
ZnZn
AsPb
Co
Pb
Ba
Pb
Pb Fe
Pb
Ca
Pb
2 4 6 8 10 12 14
Energy (KeV)Energy (KeV)
Inte
nsit
y (
a.u
.)
Co
Pb
Co
Pb
Cr
Pb
Ni
PbFe
ZnSi
Pb
Zn
Sn
Pb
2 4 6 8 10 12 14
Energy (KeV)
Inte
nsit
y (
a.u
.)
Zn
Zn
Pb
PbFe
Pb
Ba
Pb
K
Pb
Fe
Pb
Ca
Pb
2 4 6 8 10 12 14
Inte
nsit
y (
a.u
.)
Energy (KeV)
Cr
Zn
Cr
Pb PbFe
Pb
Ba
Pb
Fe
Pb
Cd
Pb
2 4 6 8 10 12 14
Energy (KeV)
Inte
nsit
y (
a.u
.)
Cu Cu Pb
Ca
As
2 4 6 8 10 12 14
Energy (KeV)
Inte
nsit
y (
a.u
.)
CrZn
Zn
Pb PbFe
Pb
Pb
Cr
Pb
Pb
Ca
Pb

211
Yellow (Y15a)
Yellow (Y16a)
Orange (O2a)
Brown (Br9a)
Pink (Pk2b)
Red (R4a)
2 4 6 8 10 12 14
Inte
nsit
y (
a.u
.)
Energy (KeV)
K
Zn
Co
Pb Pb
Pb
CoK
Ba
Pb
Zn
Pb
Pb
2 4 6 8 10 12 14
Inte
nsit
y (
a.u
.)
Energy (KeV)
Zn
Zn
Pb
Pb
Pb
PbCd
Cd
Ni
Pb
Ca
Pb
Pb
2 4 6 8 10 12 14
Energy (KeV)
Inte
nsit
y (
a.u
.)
Cd
Hg
Zn
Sr
Hg
PbPb
Ca
Hg
2 4 6 8 10 12 14
Energy (KeV)
Inte
nsit
y (
a.u
.)
Zn
Zn
Pb
Pb
Fe
Pb
Pb
K
Mn
Pb
Fe Pb
Ca
Pb
2 4 6 8 10 12 14
Energy (KeV)
Inte
nsit
y (
a.u
.)
Ca
Zn
Zn
PbPbFe
PbPb
Sr
Pb
Fe
Pb
Ca
Pb
2 4 6 8 10 12 14
Inte
nsit
y (
a.u
.)
Energy (KeV)
PbPb
Fe
Pb
Ba
HgPb
FeMn
Hg
Ca
Hg

212
Golden (Gd1a)
Glass (Gl2a)
Pearl (Co2a)
Metal hair clip
Figure V.3 Representative µ-EDXRF spectra of preparation layer and white, black, grey, violet, blue,
green, yellow, orange, brown, pink, red, golden, areas and glass, pearl, metal hair clip from Coty
painting.
Representative µ-EDXRF from Untitled painting.
Preparation (Pl1a)
White (Wh1a)
2 4 6 8 10 12 14
Energy (KeV)
Inte
nsit
y (
a.u
.)Cu
Cu
ZnPbFe
Zn
NiCa Pb
2 4 6 8 10 12 14
Energy (KeV)
Inte
nsit
y (
a.u
.) Ca
PbFe
SnBa
K
Si
Fe
Pb
Pb
Ca
2 4 6 8 10 12 14
Energy (KeV)
Inte
nsit
y (
a.u
.)
K
Zn
Cu
Cu
Pb
PbFe
PbBa
Zn
PbFeBa
Pb
Ca
2 4 6 8 10 12 14
Energy (KeV)
Inte
nsit
y (
a.u
.)
Zn
Pb
K
Cu
Cu Pb
Pb
Fe
Pb
BaCr
Fe
Pb
Mn
Ca
2 4 6 8 10 12 14
Energy (KeV)
Inte
nsit
y (
a.u
.)
ZnPb Pb
Fe
Ca
PbPb
Fe
Pb
Ca
Pb
2 4 6 8 10 12 14
Energy (KeV)
Inte
nsit
y (
a.u
.)
Pb
ZnPb
PbPb
Pb
Fe
Pb Pb

213
Black (Bk1a)
Black (Bk3a)
Violet (Vi2a)
Blue (Bl2a)
Blue (Bl8a)
Green (G1a)
2 4 6 8 10 12 14
Energy (KeV)
Inte
nsit
y (
a.u
.)
Ca
Pb
ZnPb
Pb
Ca
Pb
Mn
Pb Fe
Pb Pb
2 4 6 8 10 12 14
Energy (KeV)
Inte
nsit
y (
a.u
.)
CoCa
PbZn
Co
AsPb
Ca
Pb
Ba
Pb
Fe
Ni
Pb Pb
2 4 6 8 10 12 14
Energy (KeV)
Inte
nsit
y (
a.u
.)
Co
Pb
PbCa
PbZn
Pb
Ni
MnPb
Co Pb
As
2 4 6 8 10 12 14
Inte
nsit
y (
u.a
.)
Energy (KeV)
Co
PbPb
Ca
PbZn
Sn
Pb
Ni
Fe
Co
Pb
2 4 6 8 10 12 14
Energy (KeV)
Inte
nsit
y (
a.u
.)
CoCa
PbZn
Co
AsPb
Ca
Pb
Ba
Pb
Fe
Ni
Pb Pb
2 4 6 8 10 12 14
Energy (KeV)
Inte
nsit
y (
a.u
.)
Ba
Cu As
SnPb
Pb
Ba
Ba
PbCu

214
Green (G2a)
Green (G9a)
Yellow (Y1b)
Yellow (Y3a)
Yellow (Y7a)
Yellow (Y15c)
2 4 6 8 10 12 14
Energy (KeV)
Inte
nsit
y (
a.u
.)
Pb
PbPb
Cr
SeFe
Cd
Pb
PbCr Pb
Zn
2 4 6 8 10 12 14
Energy (KeV)
Inte
nsit
y (
a.u
.)
FePb
PbPb
Cr
Fe
CaPb
Pb
Ba
Cr
K
Pb
Zn
2 4 6 8 10 12 14
Energy (KeV)
Inte
nsit
y (
a.u
.)
Pb
Cd
ZnPb
Pb
Pb
Cd Pb
Pb
Zn
Se
2 4 6 8 10 12 14
Energy (KeV)
Inte
nsit
y (
a.u
.)
Cr Fe
Pb
Pb
ZnPb
Pb
Cd
Pb
Fe
Pb
Zn
Sr
2 4 6 8 10 12 14
Energy (KeV)
Inte
nsit
y (
a.u
.)
Ca
Cr
Co PbPb
PbPb
Ca
Pb
Fe
Pb
Zn Zn
2 4 6 8 10 12 14
Energy (KeV)
Inte
nsit
y (
a.u
.)
Ca Cr Fe PbPb
PbPb
Pb
Pb
Fe
Pb
Zn
Zn

215
Orange (O2a)
Orange (O3b)
Brown (Br3a)
Red (R2a)
Red (R3a)
Pink (Ro1a)
2 4 6 8 10 12 14
Energy (KeV)
Inte
nsit
y (
a.u
.)
Ca FePbPb
Cd
PbPb
Pb
PbPb
Zn
Zn
2 4 6 8 10 12 14
Energy (KeV)
Inte
nsit
y (
a.u
.)
Hg
HgPb
Ca FePbPb Pb
Pb
Hg
Zn
2 4 6 8 10 12 14
Energy (KeV)
Inte
nsit
y (
a.u
.)
Fe
Ba
Pb
Ca
Fe
Pb
PbPb
Pb
Zn
2 4 6 8 10 12 14
Energy (KeV)
Inte
nsit
y (
a.u
.)
Hg
Hg
Fe
Hg Pb
CaPb
PbPb
Pb
Zn
2 4 6 8 10 12 14
Energy (KeV)
Inte
nsit
y (
a.u
.)
Hg
Hg
Fe
Hg Pb
CdPb
Pb
Zn
Pb
Pb
Zn
2 4 6 8 10 12 14
Energy (KeV)
Inte
nsit
y (
a.u
.)
Co
Zn
Hg
Hg
Fe
Pb
CaPb
Pb
Pb
Ni
PbZn

216
Matches (Fosf1c)
Matches box (Fosf1d)
Golden over matches box (Fosf1e)
Figure V.4 Representative µ-EDXRF spectra of preparation layer and white, black, grey, violet, blue,
green, yellow, orange, brown, red, pink, golden areas and matches from Untitled painting.
2 4 6 8 10 12 14
Energy (KeV)
Inte
nsit
y (
a.u
.)
Mn
KFe
Zn
Fe
Pb
CaPb
Pb
P
Pb
Pb
Cu
Zn
2 4 6 8 10 12 14
Energy (KeV)
Inte
nsit
y (
a.u
.)
Pb
Pb
MnK
Fe
Zn
Pb
Ca
Cu
Pb
Pb
Zn
Pb
2 4 6 8 10 12 14
Energy (KeV)
Inte
nsit
y (
a.u
.)
Pb
Zn
Fe
Cu
Zn
Ca Pb

217
Table V.5. Characteristic energies of the X-rays (KeV) used to identify the elements in the EDXRF
analysis.
Elements K K L L1 L2 L1 M
15P 2,014 2,139
19K 3,314 3,590
20Ca 3,690 4,012
24Cr 5,414 5,946
26Fe 6,396 7,057
27Co 6,922 7,648
28Ni 7,477 8,264
29Cu 8,040 8,904
30Zn 8,630 9,570
33As 10,543 11,725
56Ba 4,467 4,828 5,156 5,531
80Hg 9,987 11,823 11,923 13,828
82Pb 10,550 12,812 12,621 14,782 2,342

218
V.2 µ-FTIR
Representative from BRUT painting.
Preparation (µ1), () calcium carbonate;
(●) lead white.
White (µ25), (●) lead white;
() zinc carboxylate.
White (µ29), (●) lead white;
() gypsum.
Violet (µ19), () cerulean blue;
(●) zinc carboxylate; () magnesium carbonate.
Blue (µ18), () cobalt blue; () barium sulphate.
(●) magnesium carbonate;
Green (µ7),(●) emerald green;
() barium sulphate.
4000 3500 3000 2500 2000 1500 1000
0,3
0,5
0,8
1,0
Wavenumber (cm-1
)
Ab
so
rba
nc
e
4000 3500 3000 2500 2000 1500 1000
0,1
0,2
0,3
0,4
0,5
0,6
Ab
so
rba
nc
e
Wavenumber (cm-1
)
4000 3500 3000 2500 2000 1500 1000
0,3
0,5
0,8
1,0
1,3
1,4
Ab
so
rba
nc
e
Wavenumber (cm-1
)
4000 3500 3000 2500 2000 1500 1000
0,1
0,2
0,3
0,4
Ab
so
rba
nc
e
Wavenumber (cm-1
)
4000 3500 3000 2500 2000 1500 1000
0,1
0,2
0,3
0,4
Wavenumber (cm-1
)
Ab
so
rba
nc
e
4000 3500 3000 2500 2000 1500 1000
0,3
0,5
0,8
1,0
1,3
1,5
Wavenumber (cm-1
)
Ab
so
rba
nc
e

219
Green, starch (µ6).
Red (µ11),(●) sulfato de bário.
Red (µ14), (●) alizarin;
() calcium phosphate.
Yellow (µ3),(●) chrome yellow; () barium sulphate;
() magnesium carbonate.
Figure V.5 Representative infrared spectra of preparation layer and white, violet, blue, green, yellow,
red areas from BRUT painting
Representative from Entrada painting.
Preparation (µ33),
() calcium carbonate; (●) lead white.
White (µ23),
(●) lead white; () strontium sulphate.
4000 3500 3000 2500 2000 1500 1000
0,3
0,5
0,8
1,0
1,3
1,4
Wavenumber (cm-1
)
Ab
so
rban
ce
4000 3500 3000 2500 2000 1500 1000
0,3
0,5
0,8
1,0
1,1
Wavenumber (cm-1
)
Ab
so
rban
ce
4000 3500 3000 2500 2000 1500 1000
0,3
0,5
0,8
1,0
1,1
Wavenumber (cm-1
)
Ab
so
rban
ce
4000 3500 3000 2500 2000 1500 1000
0,2
0,4
0,6
0,8
1,0
Wavenumber (cm-1
)
Ab
so
rban
ce
4000 3500 3000 2500 2000 1500 1000
0,3
0,5
0,8
1,0
1,2
Wavenumber (cm-1
)
Ab
so
rban
ce
4000 3500 3000 2500 2000 1500 1000
0,2
0,4
0,6
0,8
0,9
Wavenumber (cm-1
)
Ab
so
rban
ce

220
Violet (µ24), (●) ultramarine blue;
() gypsum; () zinc carboxylate.
Violet (µ20),
Madder lake.
Blue (µ3), (●) Prussian blue;
() ultramarine blue.
Light green (µ5),
(●) emerald green; () gypsum.
Green (µ14), (●) chrome yellow; () gypsum; ()
Prussian blue; () barium sulphate.
Yellow (µ17),
(●) chrome yellow.
4000 3500 3000 2500 2000 1500 1000
0,1
0,2
0,3
0,4
0,50,5
Wavenumber (cm-1
)
Ab
so
rban
ce
4000 3500 3000 2500 2000 1500 1000
0,1
0,2
0,3
0,3
Wavenumber (cm-1
)
Ab
so
rba
nc
e
4000 3500 3000 2500 2000 1500 1000
0,1
0,2
0,3
0,4
0,5
0,6
Wavenumber (cm-1
)
Ab
so
rba
nc
e
4000 3500 3000 2500 2000 1500 1000
0,2
0,4
0,6
0,8
1,0
1,2
Wavenumber (cm-1
)
Ab
so
rba
nc
e
4000 3500 3000 2500 2000 1500 1000
0,1
0,2
0,3
0,4
0,5
0,6
0,70,7
Wavenumber (cm-1
)
Ab
so
rba
nc
e
4000 3500 3000 2500 2000 1500 1000
0,1
0,2
0,3
0,4
0,5
Wavenumber (cm-1
)
Ab
so
rba
nc
e

221
Yellow (µ19), (●) chrome yellow;
() gypsum; () strontium sulphate.
Yellow (µ26),
(●) strontium yellow; () lead white.
Figure V.6 Representative infrared spectra of preparation layer and white, violet, blue, green, yellow
areas from Entrada painting.
Representative infrared spectra from Coty painting.
Varnish (µ2),
ketone resin varnish.
Preparation (µ6),
() calcium carbonate; (●) lead white.
Violet (µ13), () cobalt violet.
Blue (µ12), (●) ultramarine blue.
4000 3500 3000 2500 2000 1500 1000
0,1
0,2
0,3
0,4
0,5
0,6
Wavenumber (cm-1
)
Ab
so
rban
ce
4000 3500 3000 2500 2000 1500 1000
0,2
0,4
0,6
0,8
1,0
1,2
Wavenumber (cm-1
)
Ab
so
rban
ce
4000 3500 3000 2500 2000 1500 1000
0,2
0,4
0,6
0,8
1,0
Wavenumber (cm-1
)
Ab
so
rba
nc
e
4000 3500 3000 2500 2000 1500 1000
0,1
0,2
0,3
0,4
Wavenumber (cm-1
)
Ab
so
rba
nc
e
4000 3500 3000 2500 2000 1500 1000
0,1
0,2
0,3
0,4
0,5
0,6
Wavenumber (cm-1
)
Ab
so
rba
nc
e
4000 3500 3000 2500 2000 1500 1000
0,05
0,10
0,15
0,20
0,25
Wavenumber (cm-1
)
Ab
so
rba
nc
e

222
Yellow (µ3), (●) cobalt yellow.
Yellow (µ4), () chrome yellow; (●) kaolin; () iron
oxide.
Red (µ6), (●) carminic acid.
White mass round the glass (µ10),
() gypsum; () calcium carbonate.
Figure V.7 Representative infrared spectra of varnish, preparation layer and white, violet, blue, yellow,
red areas from Coty painting.
Representative infrared spectra from Untitled painting.
Preparation (µ2),
() calcium carbonate; (●) lead white.
White (µ7),
(●) lead sulphate
4000 3500 3000 2500 2000 1500 1000
0,3
0,5
0,8
1,0
1,3
1,4A
bs
orb
an
ce
Wavenumber (cm-1
)
4000 3500 3000 2500 2000 1500 1000
0,1
0,3
0,4
0,6
0,8
0,9
1,0
Wavenumber (cm-1
)
Ab
so
rba
nc
e
4000 3500 3000 2500 2000 1500 1000
0,1
0,2
0,3
0,4
Wavenumber (cm-1
)
Ab
so
rba
nc
e
4000 3500 3000 2500 2000 1500 1000
0,3
0,5
0,8
1,0
Ab
so
rba
nc
e
Wavenumber (cm-1
)
4000 3500 3000 2500 2000 1500 1000
0,3
0,5
0,8
1,0
1,1
Wavenumber (cm-1
)
Ab
so
rba
nc
e
4000 3500 3000 2500 2000 1500 1000
0,2
0,4
0,6
0,8
1,0
1,2
Wavenumber (cm-1
)
Ab
so
rba
nc
e

223
White (µ43),
(●) lead white; () gypsum.
Black (µ3),
() carbon black
Varnish over black area (µ3),
beeswax.
Violet (µ9),
() cobalt violet.
Dark blue (µ32),
(●) ultramarine blue.
Green (µ19),
(●) viridian.
4000 3500 3000 2500 2000 1500 1000
0,2
0,4
0,6
0,8
1,0
Wavenumber (cm-1
)
Ab
so
rban
ce
4000 3500 3000 2500 2000 1500 1000
0,2
0,4
0,6
0,8
1,0
Wavenumber (cm-1
)
Ab
so
rban
ce
4000 3500 3000 2500 2000 1500 1000
0,1
0,2
0,3
0,4
0,5
Wavenumber (cm-1
)
Ab
so
rba
nc
e
4000 3500 3000 2500 2000 1500 1000
0,2
0,4
0,6
0,8
1,0
1,2
Wavenumber (cm-1
)
Ab
so
rba
nc
e
4000 3500 3000 2500 2000 1500 1000
0,2
0,4
0,6
0,8
0,9
Wavenumber (cm-1
)
Ab
so
rba
nc
e
4000 3500 3000 2500 2000 1500 1000
0,1
0,2
0,3
0,4
Wavenumber (cm-1
)
Ab
so
rba
nc
e

224
Light green (µ31),
(●) emerald green; () barium sulphate.
Yellow (µ1),
(●) chrome yellow; () barium sulphate.
Yellow (µ29),
(●) chrome yellow; () calcium carbonate.
Pink (µ23),
(●) gypsum; () lead white.
Transparent sphere of calcium carbonate (µ16).
Figure V.8 Representative infrared spectra of varnish, preparation layer and white, black, violet, dark
blue, green, light green, yellow, red areas and transparent sphere from Untitled painting.
4000 3500 3000 2500 2000 1500 1000
0,2
0,4
0,6
0,8
0,9
Wavenumber (cm-1
)
Ab
so
rban
ce
4000 3500 3000 2500 2000 1500 1000
0,2
0,4
0,6
0,8
1,0
Wavenumber (cm-1
)
Ab
so
rban
ce
4000 3500 3000 2500 2000 1500 1000
0,2
0,4
0,6
0,8
0,9
Wavenumber (cm-1
)
Ab
so
rba
nc
e
4000 3500 3000 2500 2000 1500 1000
0,2
0,4
0,6
0,8
Wavenumber (cm-1
)
Ab
so
rba
nc
e
4000 3500 3000 2500 2000 1500 1000
0,5
1,0
1,5
2,0
Wavenumber (cm-1
)
Ab
so
rban
ce

225
Table V.6. Characteristic bands of FTIR spectra of the pigments identified.
Pigment Bands (cm-1) and
intensity Assignment*
Lead white
2PbCO3.Pb(OH)2
3536, medium 1400, strong and broad
1047, weak 686, medium
(OH)
as (CO32-)
(OH)
as (CO32-)
Barium sulphate
BaSO4
1200-1050, strong and broad
983, weak
as (SO4)
as (SO4)
Quartz
SiO2 1164, 1063, forte e weak
799, 781, weak
as (Si-O-Si)
(-O-Si-)
Gypsum
CaSO4.2H2O
3404, medium 1618, weak
1140, 1116, strong 669, weak
(HO)
(H2O)
νas (SO42-)
δas (SO42-)
Carbon black
C+Ca3(PO4)2+MgSO4+CaCO3
1457, medium and broad 1031, strong 873, weak 700, weak
as (CO32-)
as (PO42-) e as (SO4
2-)
as (CO32-)
as (CO32-)
Cobalt violet
Co3(AsO4)2 878, strong as (As-O)
Ultramarine blue
Na8[Al6Si6O24]Sn
1150-950, strong and broad
696, weak
(Si-O-Si e Si-O-Al)
(-O-Si-)
Prussian Blue
Fe4[Fe(CN)6]3 2082, strong (CN)
Emerald green
Cu(C2H3O2)2.3Cu(AsO2)2
1557, strong 1454, weak
820, medium 768, media 647, strong
carboxylate “
(As-O) (As-O) (As-O)
Viridian
Cr2O3.2H2O
3630-2630, very broad 1288, medium 1064, strong
794, medium/ strong 650, strong
(OH) - - -
(OH)
Cobalt yellow
K3[NaCo(NO2)6]
2704, weak 2649, weak
1390, very strong 1334, very strong
827, medium
- -
as (NO2)
as (NO2)
as (NO2)
Chrome yellow
PbCrO4 857/830, strong and broad as (CrO4
2-)
Strontium yellow
SrCrO4 911/888/874/843, strong
and broad as (SrO4
2-)
Ochre
Fe2O3.H2O
3689, 3670, 3650, 3622 medium
1036 strong 917 medium 800 medium
(OH)
as (Si-O-Si)
(Al-O-H)
(Fe-O-H) goethite and (-
O-Si-) kaolin

226
Table V.6. (continued)
Pigment Bands (cm-1) and intensity Assignment*
Purpurine
1627, 1614, strong 1581, medium 1066, medium 719, 709, weak
(CO3-2)
(aromatic ring)
H- aromatic ring
H- aromatic ring
Alizarin
1662, 1633, strong 1587, 1286, medium
1047, medium 713, weak
(CO3-2)
(aromatic ring)
H- aromatic ring
H- aromatic ring
Carminic acid
3424, strong 1717, medium 1572, strong 1448, strong
1285 should, 1255 strong, 1229 shoulder
1083, 1045 forte 983, 888, weak 820, 768 weak
(OH)
acid (C=O)
(CC)/ (C8OH)/ (OH)
(CC)/ (CH3)/ (OH)
(CC)/ (COH)
(CC)/ (COH)
(CH3)/(CCC)
(COH)
* Assignment based on [Derrick et al. 1999; Genestar and Pons 2005; Humel 2002; Hitchman 1982; Vendilo 2011;
Weerd et al. 2005; Prasad et al. 2005; Stuart and Ando 1996]
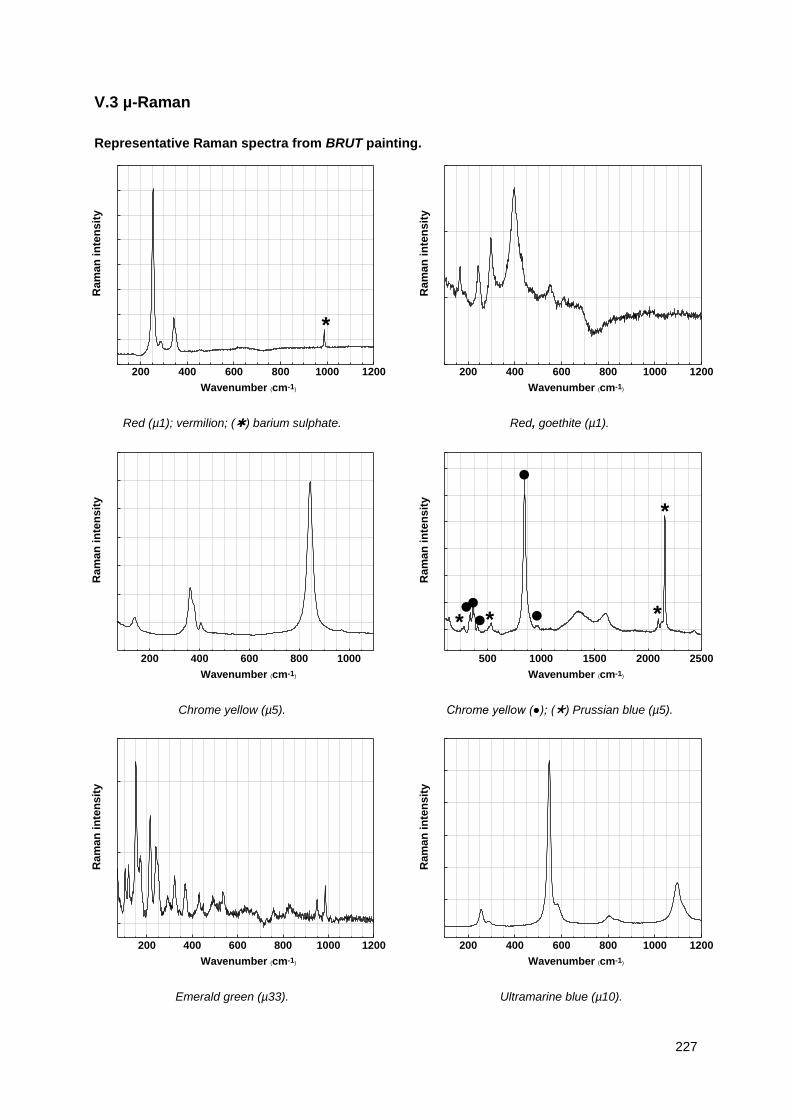
227
V.3 µ-Raman
Representative Raman spectra from BRUT painting.
Red (µ1); vermilion; () barium sulphate.
Red, goethite (µ1).
Chrome yellow (µ5).
Chrome yellow (●); () Prussian blue (µ5).
Emerald green (µ33).
Ultramarine blue (µ10).
200 400 600 800 1000 1200
Wavenumber (cm-1)
Ra
ma
n i
nte
ns
ity
*
200 400 600 800 1000 1200
Wavenumber (cm-1)
Ra
ma
n i
nte
ns
ity
200 400 600 800 1000
Wavenumber (cm-1)
Ra
ma
n i
nte
ns
ity
500 1000 1500 2000 2500
** *
Wavenumber (cm-1)
Ra
ma
n i
nte
ns
ity
*
200 400 600 800 1000 1200
Wavenumber (cm-1)
Ra
ma
n i
nte
ns
ity
200 400 600 800 1000 1200
Wavenumber (cm-1)
Ra
ma
n i
nte
ns
ity

228
Cerulean blue (); lead carbonate (); (µ27).
Figure V.9 Representative Raman spectra of red, yellow, green blue areas from BRUT painting.
Representative Raman spectra from Entrada painting.
Chrome yellow (µ8).
Brown, goethite (µ11).
Green, strontium sulphate (µ14).
Yellow (µ26), strontium yellow (●); lead white().
200 400 600 800 1000
Wavenumber (cm-1)
Ra
ma
n i
nte
ns
ity
*
200 400 600 800 1000 1200
Wavenumber (cm-1)
Ra
ma
n i
nte
ns
ity
200 400 600 800 1000 1200
Wavenumber (cm-1)
Ra
ma
n i
nte
ns
ity
200 400 600 800 1000 1200
Wavenumber (cm-1)
Ra
ma
n i
nte
ns
ity
200 400 600 800 1000
Wavenumber (cm-1)
Ra
ma
n i
nte
ns
ity

229
Magnesium sulphate (µ37).
Figure V.10 Representative Raman spectra of yellow, brown, green areas from Entrada painting.
Representative Raman spectra from Coty painting.
Cobalt violet (µ13).
Cobalt yellow (µ3).
Viridian (µ14).
Minium (µ2)
200 400 600 800 1000 1200
Wavenumber (cm-1)
Ra
ma
n i
nte
ns
ity
200 400 600 800 1000 1200
Wavenumber (cm-1)
Ram
an
in
ten
sit
y
200 400 600 800 1000 1200
Wavenumber (cm-1)
Ram
an
in
ten
sit
y
200 400 600 800 1000 1200
Wavenumber (cm-1)
Ram
an
in
ten
sit
y
200 400 600 800
Wavenumber (cm-1)
Ram
an
in
ten
sit
y

230
Cadmium orange (µ1).
Brown, hematite (µ1).
Transparent sphere, quartz (µ8).
Figure V.11 Representative Raman spectra of violet, blue, green, red, orange, brown areas and a
transparent sphere from Coty painting.
300 600 900
Wavenumber (cm-1)
Ra
ma
n i
nte
ns
ity
100 200 300 400 500 600 700 800
Wavenumber (cm-1)
Ra
ma
n i
nte
ns
ity
100 200 300 400 500 600
Wavenumber (cm-1)
Ra
ma
n i
nte
nsit
y

231
Representative Raman spectra from Untitled painting.
Viridian (µ19).
Yellow strontium (µ19).
Chrome yellow (µ29).
White, lanarkite (µ7).
Transparent sphere of calcium carbonate (µ16).
Figure V.12 Representative Raman spectra of green, yellow, white, areas and calcium carbonate
sphere from Untitled painting.
100 200 300 400 500 600 700 800
Wavenumber (cm-1)
Ra
ma
n i
nte
ns
ity
300 600 900 1200 1500
Wavenumber (cm-1)
Ra
ma
n i
nte
ns
ity
200 400 600 800 1000 1200
Wavenumber (cm-1)
Ra
ma
n i
nte
nsit
y
200 400 600 800 1000 1200
Wavenumber (cm-1)
Ra
ma
n i
nte
nsit
y
200 400 600 800 1000 1200
Wavenumber (cm-1)
Ram
an
in
ten
sit
y

232
Table V.7 Raman band and assignments of the pigments identified on the paintings.
Pigment Band wavenumber (cm-1) Assignment*
Ultramarine blue
3Na2O.3Al2O3.6SiO2.2Na2S
258 weak (S3-)
548 (vs) s (S3-)
822 (w)
1096 (m) overtone
Prussian blue
Fe4[Fe(CN)6]3
277, very weak (C-Fe-C)
531, strong (Fe-C≡N)
2092, weak (C≡N)
2127, weak, shoulder (C≡N)
2154, very strong (C≡N)
Cerulean blue
CoO.nSnO2
482 (m,sh) s (Sn-O)
532 (s) (Co-O)
670 (vs) as (Sn-O)
Cobalt blue CoO.Al2O3
202, very strong
520, very strong (Co-O)
Viridian
Cr2O3.2H2O
266, weak (O-CrIII-O)
490, very weak s (O-CrIII-O)
552, very weak as (O-CrIII-O)
585, very weak as (O-CrIII-O)
Emerald Green
Cu[C2H3O2].3Cu[AsO2]2
117, very weak
151, medium (O-Cu-O)
171, medium (O-Cu-O)
214, very strong (O-Cu-O)
241, strong (O-Cu-O)
292, weak (Cu-O)
321, weak (As-O) or (Cu-O)
365, weak s (As-O)
427, very weak (Cu-O)
489, medium (Cu-O)
536, medium (Cu-O) or bridge (As-O)
633, very weak s (COO)
683, very weak s (COO)
760, weak s (As-O)
835, weak, broad as (As-O)
948, strong (C-C)
1440, weak, broad s (COO-)
1556, weak as (COO-)
2926, strong s (CH3)
Chrome yellow
PbCrO4
134, weak lattice mode
325, very weak (CrO42-)
337, weak-medium (CrO42-)
347, weak (CrO42-)
357, medium (CrO42-)
375, medium (CrO42-)
39, very weak (CrO42-)
839, very strong s (CrO42-)

233
Table V.7. (continued)
Pigment Band wavenumber (cm-1) Assignment*
Cobalt yellow K3[Co(NO2)6].nH2O
178, weak
302, very strong (Co-N)
821, strong (N-O)
836, medium (N-O)
1326, strong as (N-O)
Strontium chromate
SrCrO4
338, weak
347, weak (CrO42-)
373, medium (CrO42-)
399, weak (CrO42-)
403, weak
861, strong
865, very strong as (CrO42-)
894, strong as (CrO42-)
915, weak
931, very weak
Cadmium yellow
CdS
304, very strong (Cd-S)
609, strong (Cd-S)
Goethite
α-FeOOH
242, very weak
297, weak s (Fe-O)
394, very strong s (Fe-O)
477, very weak as (Fe-O)
554, weak as (Fe-O)
Vermilion
HgS
253, very strong (S-Hg-S)
282, weak-shoulder (S-Hg-S)
343, medium (Hg-S)
β-naphthol
165, medium
204, weak
310, media
356, weak
405-418, weak
592, weak
628, media Aromatic ring deformation
69, weak
711, weak
735, weak
773, weak
895, weak δ (NO2)
986, weak
1039, weak
1092, shoulder ν azobenzene
1121, media ν azobenzene
1186, media ν azobenzene
1226-1236, weak ν azobenzene
1315, shoulder ν azobenzene
1334, strong ν azobenzene

234
Table V.7. (continued)
Pigment Band wavenumber (cm-1) Assignment*
β-naphthol (continued)
1394, medium ν azobenzene
1453, weak ν azobenzene
1488, medium ν azobenzene
1558, shoulder ν (NO2)
Haematite
α-Fe2O3
224, very strong
291, strong s (Fe-O)
407, medium s (Fe-O)
610, weak s (Fe-O)
1315, medium broad
Cobalt violet
Co3(AsO4)2
204, very weak (As-O) in the plane
351, weak, broad (As-O) out of plane
375, weak, shoulder (As-O) out of plane
420, weak, broad (As-O) out of plane
508, weak (As-O) out of plane
738, very weak s/s(As-O)
765, very weak s/s(As-O)
837, medium, shoulder s/s(As-O)
865 very strong s/s(As-O)
Lead carbonate or Lead White
PbCO3 or 2PbCO3.Pb(OH)2
665, very weak s (CO32-)
687, very weak s (CO32-)
829, very weak as (CO32-)
1050, very strong s (CO32-)
Barium sulphate
BaSO4
453, médium (SO42-)
461, médium, should (SO42-)
616, weak out-of-plane (SO42-)
647, weak out-of-plane (SO42-)
987, very strong s (SO42-)
Calcium Carbonate
CaCO3
157, weak lattice mode
281, weak lattice mode
711, very weak s (CO32-)
1085,very strong s (CO32-)
Lanarkite**
Pb2(SO4)O
103, medium
146, very strong
285, medium, broad
426, medium
440, medium
602, weak
978, very strong
1055, very weak
1072, very weak
* Assignment based on [Bersani et al. 1999; Bouchard et al. 2010; Casadio et al. 2011; Frausto-Reyes et al. 2009; Frost 2004; Frost et al. 2010; Quilès and Burneau 1998; Roncaglia et al. 1985; Shebanova and Lazor 2003; Vandenabeele et al. 2000; Yang et al. 2010; Zumbuehl et al. 2009]. ** Attribuition made by comparison with the mineral.

235
V.4 µ-SPEX
Representative spectra of Emission and excitation spectra BRUT painting.
Pink areas (µRed1).
Red areas (µRed1).
Pink areas (µ11).
Pink areas (µ11).
Red areas (µ11).
Red areas (µ14).

236
Pink and violet areas (µ19).
Pink areas (µ28).
Red areas (µ26).
Red areas (µ30).
Figure V.13 Representative spectra of Emission and excitation spectra (λexc = 490 nm; dichroic = 500
nm; λem = 610 nm; dichroic = 600 nm) acquired on pink, red and violet samples from BRUT painting.

237
Representative spectrum of Emission and excitation spectra from Entrada painting.
Pink areas (µ20).
Figure V.14 Representative spectrum of Emission and excitation spectra (λexc = 490 nm; dichroic =
500 nm; λem = 610 nm; dichroic = 600 nm) acquired on pink sample from Entrada painting.
Representative spectrum of Emission and excitation spectra from Untitled painting.
Pink areas (µ21).
Pink areas (µ28).
Red areas (µ28).
Figure V.15 Representative spectra of Emission and excitation spectra (λexc = 490 nm; dichroic = 500
nm; λem = 610 nm; dichroic = 600 nm) acquired on pink and red samples from Untitled painting.

238
V.5 Reflectance spectroscopy (hyperspectral imaging)
Representative Reflectance (hyperspectral imaging) spectra from the painting BRUT.
Violet area Blue area
Blue area Green area
Green area Yellow area
400 450 500 550 600 650 7000,10
0,15
0,20
0,25
0,30
0,35
0,40
0,45
0,50
Re
fle
cta
nc
e
nm
400 450 500 550 600 650 7000,04
0,06
0,08
0,10
0,12
0,14
0,16
0,18
0,20
Refl
ecta
nce
nm
400 450 500 550 600 650 7000,04
0,05
0,06
0,07
0,08
0,09
0,10
0,11
Refl
ecta
nce
nm
400 450 500 550 600 650 7000,06
0,07
0,08
0,09
0,10
0,11
0,12
0,13
Refl
ecta
nce
nm
400 450 500 550 600 650 7000,06
0,08
0,10
0,12
0,14
0,16
0,18
0,20
Refl
ecta
nce
nm
400 450 500 550 600 650 7000,05
0,10
0,15
0,20
0,25
0,30
0,35
0,40
0,45
0,50
0,55
Refl
ecta
nce
nm

239
Red area Red area
Figure V.16 Representative Reflectance (hyperspectral imaging) spectra of violet, blue, green, yellow,
red areas from BRUT.
Representative Reflectance (hyperspectral imaging) spectra from the painting Entrada.
Violet area Blue area
Blue area Green area
400 450 500 550 600 650 7000,0
0,1
0,2
0,3
0,4
0,5
Refl
ecta
nce
nm
400 450 500 550 600 650 7000,00
0,05
0,10
0,15
0,20
0,25
0,30
0,35
Refl
ecta
nce
nm
400 450 500 550 600 650 700
0,20
0,25
0,30
0,35
0,40
0,45
Refl
ecta
nce
nm
400 450 500 550 600 650 7000,02
0,04
0,06
0,08
0,10
0,12
0,14
0,16
0,18
0,20
Refl
ecta
nce
nm
400 450 500 550 600 650 7000,00
0,05
0,10
0,15
0,20
0,25
0,30
0,35
Refl
ecta
nce
nm
400 450 500 550 600 650 7000,04
0,06
0,08
0,10
0,12
0,14
0,16
0,18
Refl
ecta
nce
nm
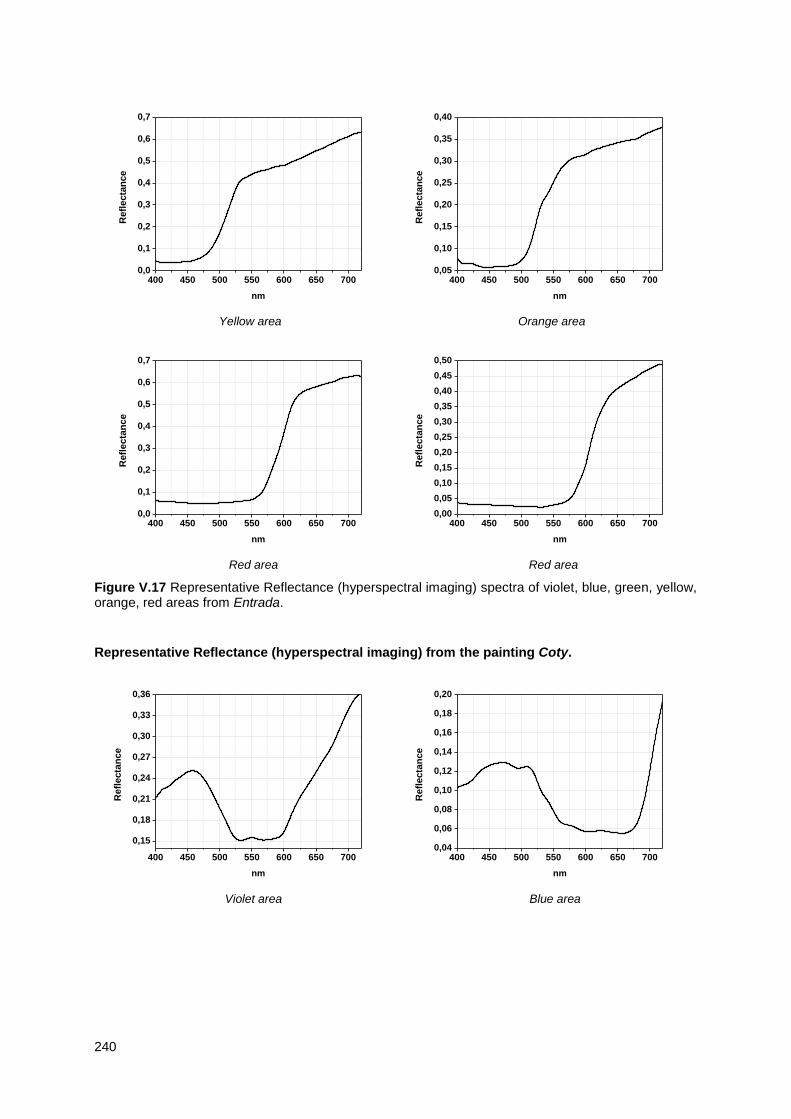
240
Yellow area Orange area
Red area Red area
Figure V.17 Representative Reflectance (hyperspectral imaging) spectra of violet, blue, green, yellow, orange, red areas from Entrada.
Representative Reflectance (hyperspectral imaging) from the painting Coty.
Violet area Blue area
400 450 500 550 600 650 7000,0
0,1
0,2
0,3
0,4
0,5
0,6
0,7
Refl
ecta
nce
nm
400 450 500 550 600 650 7000,05
0,10
0,15
0,20
0,25
0,30
0,35
0,40
Refl
ecta
nce
nm
400 450 500 550 600 650 7000,0
0,1
0,2
0,3
0,4
0,5
0,6
0,7
Refl
ecta
nce
nm
400 450 500 550 600 650 7000,00
0,05
0,10
0,15
0,20
0,25
0,30
0,35
0,40
0,45
0,50
Refl
ecta
nce
nm
400 450 500 550 600 650 700
0,15
0,18
0,21
0,24
0,27
0,30
0,33
0,36
Refl
ecta
nce
nm
400 450 500 550 600 650 7000,04
0,06
0,08
0,10
0,12
0,14
0,16
0,18
0,20
Refl
ecta
nce
nm

241
Blue area Green area
Yellow area Yellow area
Red area Red area
Figure V.18 Representative Reflectance (hyperspectral imaging) spectra of violet, blue, green, yellow,
red areas from Coty
400 450 500 550 600 650 7000,02
0,04
0,06
0,08
0,10
0,12
0,14
0,16
0,18
0,20
Refl
ecta
nce
nm
400 450 500 550 600 650 7000,05
0,06
0,07
0,08
0,09
0,10
0,11
Refl
ecta
nce
nm
400 450 500 550 600 650 700
0,1
0,2
0,3
0,4
0,5
0,6
Refl
ecta
nce
nm
400 450 500 550 600 650 7000,05
0,10
0,15
0,20
0,25
0,30
0,35
Refl
ecta
nce
nm
400 450 500 550 600 650 7000,05
0,10
0,15
0,20
0,25
0,30
0,35
0,40
0,45
0,50
Refl
ecta
nce
nm
400 450 500 550 600 650 700
0,05
0,10
0,15
0,20
0,25
Re
fle
cta
nce
nm

242
Representative Reflectance (hyperspectral imaging) spectra from the painting Untitled.
Violet area Blue area
Green area Yellow area
Red area Pink area
Figure V.19 Representative Reflectance (hyperspectral imaging) spectra of violet, blue, green, yellow,
red, pink, areas from Untitled.
400 450 500 550 600 650 7000,00
0,05
0,10
0,15
0,20
0,25
0,30
Refl
ecta
nce
nm
400 450 500 550 600 650 7000,00
0,05
0,10
0,15
0,20
0,25
Refl
ecta
nce
nm
400 450 500 550 600 650 7000,00
0,05
0,10
0,15
0,20
0,25
0,30
Refl
ecta
nce
nm
400 450 500 550 600 650 7000,0
0,1
0,2
0,3
0,4
0,5
0,6
Refl
ecta
nce
nm
400 450 500 550 600 650 7000,0
0,1
0,2
0,3
0,4
0,5
Refl
ecta
nce
nm
400 450 500 550 600 650 7000,1
0,2
0,3
0,4
0,5
Refl
ecta
nce
nm

243
Appendix VI: SEM-EDS analysis on cross-sections and micro-samples
VI.1 Sampling areas
Figure VI.1 BRUT, areas of sampling of cross-section () and micro-samples ()
Figure VI.2 Entrada, areas of sampling of cross-section () and micro-samples ()

244
Figure VI.3 Coty, areas of sampling of cross-section () and micro-samples ()
Figure VI.4 Untitled, areas of sampling of cross-section () and micro-samples ()

245
VI.2 Cross-sections
BRUT
µ12
Gypsum; dark crystal pyrite (FeS2); zinc oxide; cerulean blue.
Vermilion; hematite; magnetite; baryte; lead white; SiO2.
Lead white; calcium carbonate; SiO2 (SEM).
UV light Visible light
Ground layer lead white and calcium carbonate.
The red layer is composed by vermilion, iron
based pigment with the presence of Mg, Na, Al
and BaSO4. The top layer (thickness ca. 50 µm)
is characterized by the presence of large
agglomerates of lead white (Z2) and large
particles of gypsum (Z3). It also visible zinc white
(c) with difference particle shape (tripod and
rounded) and size (0.33-15 µm). On the blue
particle it was detected Co and Sn (Z1) that
suggest the presence of cerulean blue.

246
µ19
Cobalt blue, zinc white.
Lead sulphate ; zinc white; Al in dark purple and red; Eosine based lake (SPEX); cobalt blue;
Vermilion; hematite; magnetite; baryte; lead white; SiO2.
Lead white; calcium carbonate.
Visible light
Over the red layer it is visible a thin layer of
spherical particle of Pb (b). Purple (thickness ca.
130 µm). BSE image does not show a separation
between the purple and blue layer. Al is clearly
associated to the presence of dark purple, blue
and red crystals. In the dark purple and blue
crystal it was detected also the presence of
cobalt, as for example in Z8, Z9, Z12 (dark
purples) and Z14 (blue). This distribution could
suggest the use of cobalt blue pigments and red
lake. Finally magnesium was detected in
correspondence with dark red crystals as for
example Z7. Zn is homogenous distributed.

247
µ33
Emerald green; barite. Starch (FITR)
Vermilion; hematite; magnetite; barite; lead white; SiO2.
Lead white; calcium carbonate
Visible light
Green layer was detected Cu and As (Z3 and Z8),
BaSO4 (Z4 and Z7). On the green to layer are
visible dark circular areas, similar to bubbles.
These areas show different sizes from less than
10 µm to ca. 40 µm. In these areas SEM-EDS
analysis detected high content of carbon and
lower amount of Pb, As and Cu (Z5). The
fractures, around the bubbles, suggest that the
organic material that has filled the cavities
reduced in the volume causing breakage of the
adjacent area. FTIR analysis in this area and in
the area am6 detected high amount of starch.
The presence of the same kind of bubbles in the
am6 excluded the possibility that the cavity were
filled by the resin used to prepare the cross-
section.

248
µ5
Prussian blue; chrome yellow; lead white; calcium carbonate
Zinc oxide; lead white; zinc soap;
UV light Visible light
In the white layer (thickness ca.100 µm) was
detected particle aggregates of lead white. SEM-
EDS analysis detected the presence of zinc with
the particles size from 0,24 and 1.3 µm (c) .
In the green layer it was detected Cr, Fe, K (Z6
and Z7) that results support those obtained by
Raman in the identification of Prussian blue and
chrome yellow. The chrome yellow particles have
rod-like shape. Calcium and phosphate were
detected in the same particle that suggest the
presence of carbon black. In all the cross-section
it was detected aluminium.

249
µRed1
Visible light
Alizarine; purpurine (SPEX, FTIR). Al in the matrix (SEM) and elongates white particles of barium sulphate covered with lead.
Vermilion; hematite; magnetite; baryte; lead white; SiO2 (SEM).
Lead white; calcium carbonate.
The ground layer (thickness ca.75 µm) is
composed by lead white and calcium carbonate.
The red layer show a uniformed thickness (min.
5 µm and max. 20 µm). The layer is composed by
vermilion, iron oxide, manganese and silica.
In the top layer it is visible elongated white
particles on a “dark matrix”. In the matrix was
detected Al and a small amount of Pb ( Z16). The
Al could be associated to the presence of a red
lake. The lead is probably related with the
surrounding particles. The white particles show a
core of BaSO4 (Z14) covered by Pb (Z15),
possibly PbSO4. The particles measure 7.5 µm in
length and 2 µm of thinness. The core measures
a thinness of 0.3 µm

250
Entrada
µ33
Visible light
Lead white, calcium
carbonate. Black crystal:
carbon black; yellow crystal:
silica (SiO2); hematite.
This cross-section include only the ground and it
is partial covered by the resin. The maximum
thickness is ca. 100 µm. Similar to the other
ground layer it is visible an agglomerate of lead
white particle Dutch method, (b). It is present
particles of CaCO3 with different sizes, the
biggest one measures ca. 30 µm. Al was
detected in Z1, Z2 and Z4 associated to Ca. In Z4
was detected also a small amount of Mg.
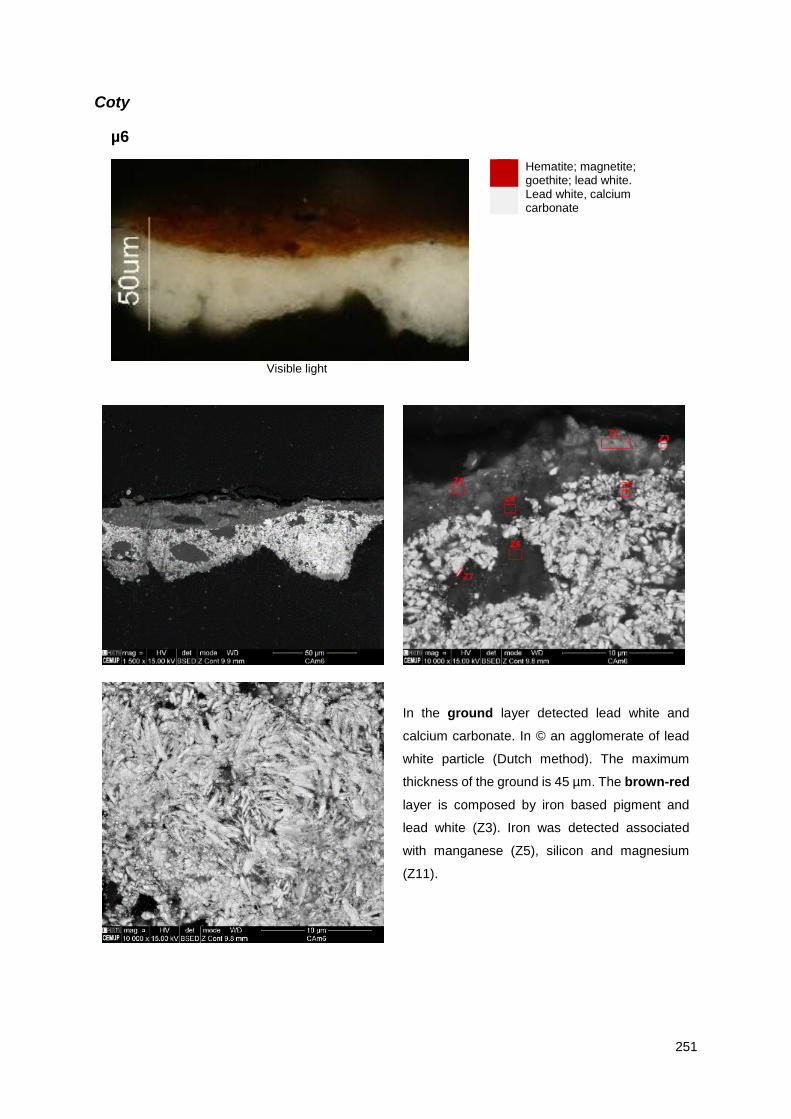
251
Coty
µ6
Visible light
Hematite; magnetite; goethite; lead white.
Lead white, calcium carbonate
In the ground layer detected lead white and
calcium carbonate. In © an agglomerate of lead
white particle (Dutch method). The maximum
thickness of the ground is 45 µm. The brown-red
layer is composed by iron based pigment and
lead white (Z3). Iron was detected associated
with manganese (Z5), silicon and magnesium
(Z11).

252
Untitled
µ1
Visible light
Mixed chrome yellow; barite; zinc soap.
Lead white; gypsum. Ultramarine blue; ivory
black; zinc white (SEM) Lead white; calcium
carbonate
In the ground layer (max. thickness 22 µm) was
detected lead white and calcium carbonate. In the blue
particles (Z3) was detected Na, Al, S and Si that
confirm the presence of Ultramarine blue detected by
Raman. In the same particles were detected small
amount of Fe and K. In the Z4 it was detected calcium
and phosphorus that suggest the presence of ivory
black. Zinc was detected in all the point of analysis
performed in the blue layer. The maximum thickness of
the layer is ca. 75 µm. Between the blue and the yellow
layer it is visible a white layer composed by lead white
and gypsum.In the yellow layer was detected lead
chromate (Z6) rod-like particles with different
dimensions, 0.4 - 4 µm in length and 0.07-0.4 µm in
width. Large aggregates of BaSO4 (Z7) sub-rounded
particles are also observed.
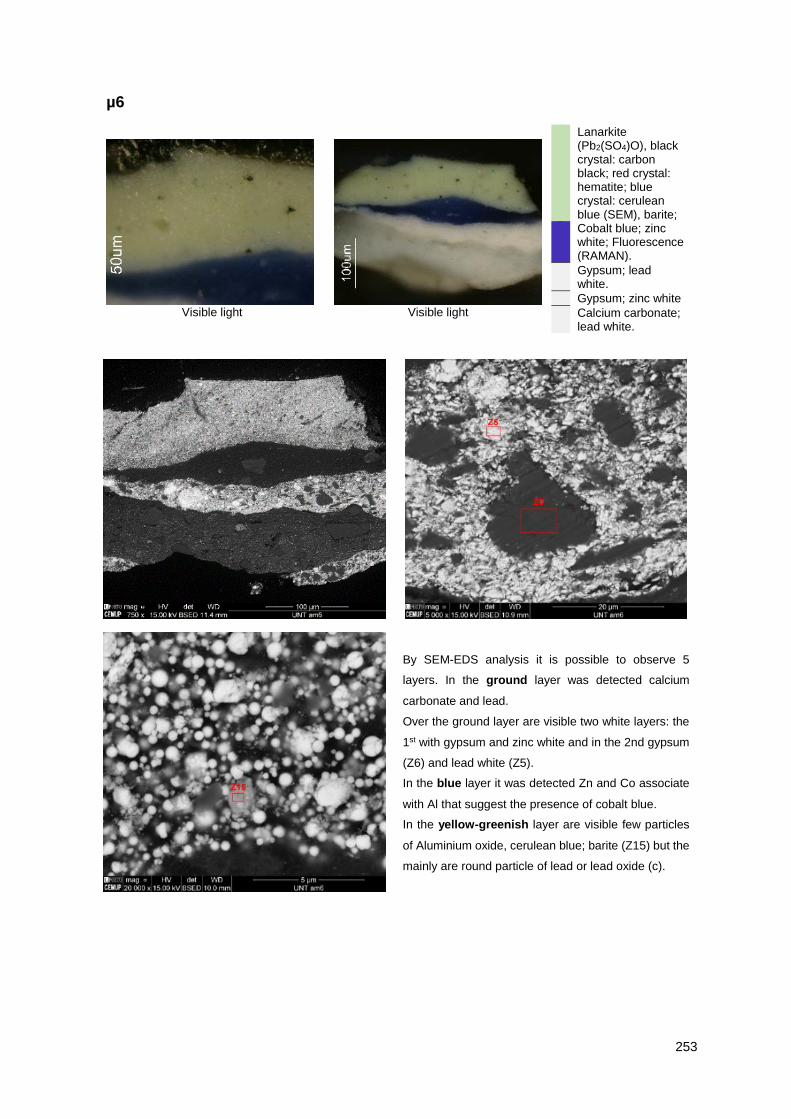
253
µ6
Visible light
Visible light
Lanarkite (Pb2(SO4)O), black crystal: carbon black; red crystal: hematite; blue crystal: cerulean blue (SEM), barite;
Cobalt blue; zinc white; Fluorescence (RAMAN).
Gypsum; lead white.
Gypsum; zinc white
Calcium carbonate; lead white.
By SEM-EDS analysis it is possible to observe 5
layers. In the ground layer was detected calcium
carbonate and lead.
Over the ground layer are visible two white layers: the
1st with gypsum and zinc white and in the 2nd gypsum
(Z6) and lead white (Z5).
In the blue layer it was detected Zn and Co associate
with Al that suggest the presence of cobalt blue.
In the yellow-greenish layer are visible few particles
of Aluminium oxide, cerulean blue; barite (Z15) but the
mainly are round particle of lead or lead oxide (c).

254
VI.3 Micro-samples
BRUT
µ6 Starch (FTIR); emerald green; aluminium-silicate and iron based pigments; barite; lead spheres.
SEM-EDS analysis detected the presence of Cu associated with As, that suggest the use of emerald green.
In this sample are visible dark circular bubbles, similar those present in the cross-section BRUT am33. SEM-
EDS analysis detected high amount of C and low amount of Cu, As and Pb. In few particles it was detected
Si, Al associated with Fe iron (Z12) and with titanium (Z1 and Z13). These elements suggest the presence of
aluminium-silicate and iron based pigments. On all the sample spherical particles of lead (Z7, Z8 and Z9)
were present. Few particles of BaSO4 were also detected.
Coty
µ1 Brown: hematite, barite. Silver: Al, Zn.
The BSE image doesn’t allow to understand the morphology of the silver coloured materials. SEM-EDS analysis
detected Al, Zn, Ca and Pb. Ca and Pb are related to the preparation layer where the silver coloured material was
applied (Z1).

255
µ3 Cobalt yellow
The BSE image shows a tetrahedron –like particles. The elemental maps show a uniform distribution of Co, Na and K.
The distribution of the Al is not uniform but localised, it was not possible to make a correlation between the map of the
distribution of Al and the presence of particles shape different from those of the yellow cobalt. In the surface of the
particles are visible small hole.
µ8 Brown: hematite, manganese oxide, gypsum, lead white. Sphere: silica (SiO2)
SEM-EDS analysis confirm the presence of silica. The silica shows a round shape with a diameter around 530 µm. The
elements Fe, Mn and Pb are related with the presence of iron and manganese based pigments used in the brown paint
that covered the silica particles

256
µ11 White: calcium carbonate, gypsum. Gold: copper and zinc.
From the BSE image seems that the gold coloured material was applied as foil. The thickness of the foil is around 350
nm. SEM-EDS analysis detected copper and Zn (Z1). Also in this case the Ca and Pb (Z2) could be related to the
preparation layer.
Untitled
µ11
This sample comes from the heat of the matches applied in the painting. The samples is extremely porous. The SEM-
EDS analysis revealed CaCO3 and Al2O3 that are usually used as inert materials in matches.
Pb, P, Sb, Cl and K were also detected. It is possible suggest presence of antimony trisulphide (SbS3) and potassium
chlorate as ignite materials. The presence of phosphorus can be attributed to the presence of white phosphorous or
to phosphorus sesquisulfide (P4S3). The phosphorus sesquisulfide was introduced in France in the 1897 to replace
the toxic white phosphorus (P4). Berne Convention (1906) with which the European countries banned the 'use matches
made with white phosphorus.

257
µ24 Pink
SEM-EDS analysis detected the presence of gypsum (Z1) and a mixture of vermilion (HgS) and zinc white (Z3).

258
Appendix VII: Chrome yellow samples analysis
This appendix presents the charaterization of the chrome yellows samples collected on the paintings
BRUT, Entrada and Untitled.
VII.1 SEM-EDS analysis of Entrada, BRUT and Untitled samples
Entrada
BRUT
µ 17
µ3
Mixed-crystals of lead chromate and lead sulphate rod-
like particles (0.3 - 3 µm in length and 0.07 - 0.4 µm in width).
Sub-rounded particles probably corresponds to a
phoenicochroite. No fillers were detected.
Lead chromate rod-like particles (0.3 - 3 µm in length
and 0.07 - 0.3 µm in width). Possibly a particle of
phoenicochroite. BaSO4 rough and irregular shape.
Al and Mg were detected in all analysed areas
µ19
µ4
A small content of lead chromate rod-like particles (0.4 -2
µm in length and 0.07-0.3 µm in width). High content of
CaSO4 and several rounded, rod-like and tetrapod-like,
particles of ZnO. Rough and irregular shape of SrSO4 and
an aggregate of CaCO3.
Small particles lead chromate rod-like particles (0.4 -
3 µm in length and 0.1 - 0.6 µm in width).
High content of BaSO4, CaSO4 and Si-based particle.
µ32
µ16 orange and yellow
SEM-EDS analysis shows a high content of lead chromate
rod-like particles (Z2) with dimensions between 0.3 and 2
µm in length and 0.07 and 0.3 µm in width.
SEM-EDS analysis revealed the presence of a high
content of spherical lead particles (Z2) together with
lead chromate rod-like particles (Z3) with dimensions

259
SEM-EDS analysis shows the presence of remained of the
coccolith shell of calcium carbonate particles (Z3 and Z4),
appearing aggregated.
between 0.3 and 2 µm in length and 0.1 and 0.2 µm in
width (same size as identified in am16 orange).
Barium sulphate particles (Z1) were also identified.
µ37
Lead chromate rod-like particles (0.1 - 1 µm in length and
0.07 - 0.2 µm in width) and rounded particles of CdS. As
fillers it was detected CaCO3 and lamellar particles of
MgSO4 (confirmed by Raman).
Untitled
µ1
In the top yellow layer, SEM-EDS analysis revealed the
presence of lead chromate (Z6) rod-like particles with
different dimensions, between 0.4 and 4 µm in length and
0.07 and 0.4 µm in width. Large aggregates of BaSO4 (Z7)
sub-rounded particles are also observed.

260
VII.2 µFTIR
Entrada
Figure VII.1. Infrared spectra sample µ8 Entrada; Columbano Tube T17_3128 and 735.5 reconstruction
●PbCrO4; ♦ CaCO3; ♦ kaolinite.
Figure VII.2 Infrared spectra sample µ32 Entrada; Columbano Tube T17_3128 and 735.5 reconstruction.
● PbCrO4; ♦ CaCO3; ♦ kaolinite
4000 3500 3000 2500 2000 1500 1000
Wavenumber (cm-1)
Ab
so
rban
ce
Kaolinite
[735.3]
Am32
1300 1200 1100 1000 900 800 700
Wavenumber (cm-1)
Ab
so
rban
ce
Kaolinite
[735.3]
Am32
4000 3500 3000 2500 2000 1500 1000
Wavenumber (cm-1)
Ab
so
rban
ce
[735.3]
T17_3128
Am8
1300 1200 1100 1000 900 800 700
Wavenumber (cm-1)
Ab
so
rban
ce
[735.3]
T17_3128
Am8

261
Figure VII.3. Infrared spectra sample µ19 Entrada; Columbano Tube T17_3128 and 735.5 reconstruction.
● PbCrO4; ♦ Gypsum; CaCO3; ● SrSO4.
Figure VII.4. Infrared spectra sample µ37 Entrada; Columbano Tube T17_3128 and magnesium sulphate
heptahydrate. ● PbCrO4; ♦ CaCO3; ♦ MgSO4 7H2O
4000 3500 3000 2500 2000 1500 1000
Wavenumber (cm-1)
Ab
so
rban
ce
Strontium sulphate
[735.3]
Am19
1300 1200 1100 1000 900 800 700
Wavenumber (cm-1)
Ab
so
rban
ce
Strontium sulphate
[735.3]
Am19
4000 3500 3000 2500 2000 1500 1000
Wavenumber (cm-1)
Ab
so
rban
ce
Magnesium sulphate
T17_3128
Am37
1300 1200 1100 1000 900 800 700
Wavenumber (cm-1)
Ab
so
rban
ce
Magnesium sulphate
T17_3128
Am37

262
Figure VII.5. Infrared spectra sample µ17 Entrada; Columbano tube T24_3128 and CR.C7 0.4 Molar fraction chromate
and 0.6 sulphate. ● Pb(Cr,S)O4.
BRUT
Figure VII.6. Infrared spectra sample µ3 BRUT; CR.C.8 with 0.3 Molar fraction chromate and 0.7 sulphate
● Pb(Cr,S)O4; ♦ BaSO4; ● MgCO3.
4000 3500 3000 2500 2000 1500 1000
Wavenumber (cm-1)
Ab
so
rban
ce
CR.C7
T24_3128
Am17
1200 1100 1000 900 800 700
Wavenumber (cm-1)
Ab
so
rban
ce
CR.C7
T24_3128
Am17
4000 3500 3000 2500 2000 1500 1000
Wavenumber (cm-1)
Ab
so
rban
ce
Gypsum
CR.C.8
Am3
1300 1200 1100 1000 900 800 700
Wavenumber (cm-1)
Ab
so
rban
ce
Gypsum
CR.C.8
Am3

263
Figure VII.7. Infrared spectra sample µ4 BRUT; ● BaSO4; ♦ gypsum; * quartz.
Figure VII.8. Infrared spectra sample µ16 BRUT, CR.C7 0.4 Molar fraction chromate and 0.6 sulphate.● MgCO3
4000 3500 3000 2500 2000 1500 1000
Am4
Wavenumber (cm-1)
Zinc azelate
Ab
so
rban
ce
1800 1600 1400 1200 1000 800
*
*
Am4
Wavenumber (cm-1)
Zinc azelate
Ab
so
rban
ce
4000 3500 3000 2500 2000 1500 1000
Wavenumber (cm-1)
Ab
so
rban
ce
CR.C7
Quartz
Am16
1300 1200 1100 1000 900 800 700
Wavenumber (cm-1)
Ab
so
rban
ce
CR.C7
Quartz
Am16

264
VII.3 Synchrotron analysis
Two sample from the paintings BRUT and Entrada were analyzed by SR μ-IR spectroscopy, SR μ-XRF
and μ-XANES. Both of the samples are a solid mixed phase crystal of lead chromate and lead
sulfate,Pb(Cr,S)O4. In the BRUT sample it was detected the presence of magnesium carbonate, barytes
and quartz. Metal carboxylates were also found, comparing the IR spectra with reference carboxylate
suggests the presence of zinc azelate. The absorption of the carboxylate is homogenous in all the
sample, no aggregates are visible. The intensity profile of Cr K line calculated from the XRF maps at
6.12 and 6.02 keV beam energies in the Entrada sample suggests that no degradation has occurred.
XANES analysis performed in both the samples identified Cr(VI) compound(s), supporting that no
degradation is visible.
Post-processing data
PyMca program was used to fit the different absorption region for the IR spectra and the different
elemental contribution in the fluorescence spectra. The same program was used as a batch fitting
procedure for IR and XRF maps.
All XANES spectra were normalized using ATHENA software program. Edge-step normalization of the
data was carry out by means of linear pre-edge substraction and by regression of a quadratic
polynominal beyond the edge. ATHENA was also used to perform a linear combination fitting of the
unknown XANES spectra with a library of Cr-species compounds. The best fitting was selected from a
large number of different combination of the reference spectra.
Results
BRUTam17
μ-IR spectroscopy and μ-XRF analysis of BRUT a17 samples confirmed the presence a solid mixed
phase crystal, Pb(Cr,S)O4. Barium was detected in few points of the sample otherwise, MgCO3 was
found almost homogeneously distributed in the entire sample (Figure VII.9).
In the region between 1250 and 950 cm-1 it is visible the contribution of the νSO42- of barite as well as
the sulphate of the chrome mixed crystal. The widening of the band suggest also the presence of quartz.
Elemental analysis detected the presence of Si that is mapped on Figure VII.10. The IR spectra of quartz
is characterized for the absorption bands at 1094 cm-1, 790, 780 and 696 cm-1. Unfortunately the low
ration S/N of the SR-IR spectra difficult the identification of these absorptions.
Figure VII.11 compares two spectra acquired from the same paint area, one obtained by SR-µIR in BaF2
cell and one by µ-FTIR in diamond cell with the range 4000-650 cm-1 (µ15 BRUT) where it is visible the
absorption bands of the quartz at lower wavenumbers. The characteristic bands of metal carboxylates
are visible in the region 1550-1537 cm-1 and in the broad band centred at 1581 cm-1 these two regions
are mapped in the Figure VII.9 E and F, respectively and are attributed to the presence of zinc azelate.
Similar spectroscopic features were detected in the zinc white sample tube (ASC8).

265
Figure VII.9. Visible light microscope with the mapping area marked in red; RGB composite images obtained by
μ-IR: B mixed lead chromate (975-966 cm-1); C Quartz (1170-1157 cm-1); D MgCO3 (1500-1398 cm-1); E broad
band centred at 1580 cm-1; F Carboxylate (1525-1560 cm-1).
Figure VII.10. XRF Chromium map intensity; RGB composite images obtained by μ-XRF at a primary
beam energy of 6.12 keV B Ba in green, Cr in red; C Mg in blue; D Si in green.

266
Figure VII.11. Infrared spectra sample am17 BRUT acquired with SR-µIR in BaF2 cell (top) and sample am15
BRUT acquired with µ-FTIR in diamond cell (down); ● MgCO3; ♦ Quartz.
XANES analysis was performed on 9 points over the sample indicated in Figure VII.12, the comparison
of the spectra with the Cr-species compounds allow to see that the main spectra feature belong to Cr(VI)
compound, therefore no degradation signal are visible.
Figure VII.12. XRF chromium map intensity with the XANES points of analysis; B average XANES spectrum.
Entrada am17
Two IR maps, in diamond cell and BaF2, were carry out on the am 17 µ-sample of Entrada
painting. The IR analysis confirm the presence a solid mixed phase crystal, Pb(Cr,S)O4.
The XRF analysis detected the presence of Ba and K in few points, marked in the Figure VII.13A, barium
sulphate were no identify in the IR spectrum. Figure VII.13C shows the profile obtained comparing the
intensity of the Cr peak in the XRF maps acquired at 6.12 (black) and 6.02 (red) keV. The profile
correspond to and area of the average value calculated in the area marked with the black grid in the
4000 3500 3000 2500 2000 1500 1000
Ab
so
rban
ce
Wavenumber (cm-1)
BRUT am15-FTIR
BRUT am17SR-IR
2000 1800 1600 1400 1200 1000 800
Ab
so
rban
ce
Wavenumber (cm-1)

267
Figure VII.13B This profile indicates that no species of Cr(III) are present in the sample, in other words
there is no degradation signal. XANES analysis was performed on 12 points on the samples, marked in
Figure VII.13D, also that analysis confirmed the presence of Cr(VI).
Figure VII.13. RGB composite images obtained by μ-XRF at a primary beam energy of 6.12 keV with K in
green, Ba in red and Cr in blue; B XRF Chromium map intensity in black the area used to create the calculate
the intensity profile reported in C; C intensity profile of Cr K line on the XRF maps at beam energy of 6.12
keV (black) and 6.02 keV (red); D XANES points of analysis; E average XANES spectrum.

268
Table VII.1 Roi region in cm-1 used for IR mapping.
ROI From To ROI From To
Quartz 1 807 790
MgCO3
1 1450 1380
2 1170 1157 2 1540 1450
CaCO3 1 890 860 3 3480 3410
2 1805 1785 Zinc Soap
1 1525 1560
Chromate 940 800 2 1563 1650
PbSO4 / CrO4 975 960 COO- Soaps 1600 1475
BaSO4 1 990 975
Gypsum 1 1600 1635
2 1050 1090 2 3460 3360
SrSO4 1005 980 C=O Acid 1725 1685
PbSO4 1200 1140 C=O Ester 1760 1725
Viridian 1 1270 1240 Prussian Blue 2130 2050
2 1300 1270 CH stretching 2980 2830
Oxalates 1 1350 1300 Lead White 3580 3500
2 1600 1650 Kaolin 3720 3610
Cobalt Yellow 1 1360 1300
2 1440 1360
Table VII.2 X-ray adsorption edges and X-ray line energies (keV) used for XRF mapping.
Element Line Energy (keV)
S K KLIII 2.308 K K KLIII 0.293
Ca K KLIII 3.692 Cr K KLIII 5.415 Ba L LIIINV 5.158 Pb M MIIINI; M MIIINV 2.658

269
Appendix VIII: Oil paint tubes
In the following Table the transcription of the labels from the 31 oil tubes sampled during the analysis
made by DCR at the time of the edition of the Catalogue Raisonné of Paintings of Amadeo de Souza-
Cardoso. For more details on the analysis of the paint tube samples please see Melo et al. 2009.
Table VIII.1 Oil pain tubes analysed in Melo et al. 2009, relative code and label’s transcription.
CODE LABEL CODE LABEL
ASC2
TEMPERA FARGE
Chromgelb dunkel
Jaune de chrome foncé
Chrome yellow deep
(...) Neisli & Co, Dresden (?)
ASC3
ROUGE DE CADMIUM
FONCÉ (…)
Cadmium red deep Cadmiumrot dunkel
--- LEFRANC PARIS
On the back: SÉRIE P
ASC7
WINSOR & NEWTON
(LIMITED) ----
CERULEAN BLUE Bleu Cerulean
Coelin Blau ---
Rathbone Place, London, England
ASC8
BLANC DE ZINC OXIDE DE ZINC
Zinc White Zinkweiss
--- LEFRANC – PARIS
ASC10
Bourgeois
GOMME-GUTTE 1re Série
GAMBOGE
ASC13
VIOLET DE COBALT (…) COBALT
--- LEFRANC – PARIS
ASC14
CARMI(…)
(…) LEFRANC – PARIS
ASC15
Bourgois VERT DE COBALT
(...)me Série COBALT GREEN
ASC16
Bourgois JAUNE DE (…) Naples (?) (…)
ASC17
J. DE CHROME FONCÉ
CHROMATE DE PLOMBE Chrome yellow deep Chromgelb dunkel
--- LEFRANC – PARIS
ASC18
VERT DE CADMIUM (…)CADMI(…)
--- LEFRANC - PARIS
ASC19
WINSOR & NEWTON
(LIMITED) ---
ANTWERP BLUE Blue Mineral
Antwerpen Blau ---
Rathbone Place, London, England.

270
Table VIII.1 (continued)
CODE LABEL CODE LABEL
ASC20
VERT EMERALD
OXIDE DE CHROME Emerald oxide of chrome
Smaragdg(...) ---
LEFRANC – PARIS
MG1
WINSOR & NEWTON (LIMITED)
--- BROWN MADDER
--- Rathbone Place London, England
MG2
WINSOR & NEWTON
(LIMITED) ---
CADMIUM ORANGE Jaune de cadmium orange
Cadmium Orange ---
Rathbone Place London, England
MG3
WINSOR & NEWTON (LIMITED)
---- FRENCH VERMILION Vermillion Française
Franzosishen Zinnber ----
Rathbone Place, London, England
MG4
WINSOR & NEWTON
Rathbone Place, London, England ----
OIL COLOUR COBALT BLUE Bleu de cobalt Kobalt Blaut
Bleu di Cobalto Azul Cobalto
MG5
ROUGE DE CADMIUM CLAIRE
SELENIO SUL(…) DE CADMIUM Cadmium red pale
Cadmium ret bell (?) LEFRANC – PARIS
MG6
WINSOR & NEWTON
(LIMITED) ---
CHINESE VERMILION Vermillion de Chine
(…) (tradução em alemão) ---
Rathbone Place London, England
MG7
WINSOR & NEWTON (LIMITED)
--- RAW SIENNA
--- Rathbone Place London, England
MG8
WINSOR & NEWTON
(LIMITED) MOIST COLOUR
38, Rathbone Place LONDON W.
OLIVE GREEN
MG10
CARMINE FINE (…) Andrinople
(…) alumina chau(…) (…) lake permanent
Andrinopler Lack LEFRANC – PARIS
MG11
MG12
WINSOR & NEWTON
Rathbone Place, London, England ----
OIL COLOUR YELLOW OCHRE
Ocre jaune Lichter Ochre Ocria Giallo
Ocre Amarillo
MG13
WINSOR & NEWTON (LIMITED)
---- CASSEL EARTH.
--- Rathbone Place, London, England.

271
Table VIII.1 (continued)
CODE LABEL
CODE LABEL
MG14
WINSOR & NEWTON
(LIMITED) ----
INDIGO ---
Rathbone Place, London, England.
MG15
WINSOR & NEWTON (LIMITED)
---- (…) vert
--- Rathbone Place, London, England.
MG16 (…)
MG17
WINSOR & NEWTON (LIMITED)
---- IVORY BLACK
--- Rathbone Place, London, England.
MG18
REMBRANDT
Oil Color Talens & Son I(…) Ington
Apeldor N.J. Holland U.S.A. TERRA ROSA
With ASC the samples take from the oil pant tubes from the box with the ‘Amadeo’.
With MG the samples take from the oil pant tubes from the box with the ‘Maria da Graça’ [Melo et al. 2009].

272
Appendix IX: Ripolin chart
Figure IX.1 Front of the Ripolin’s colour chart: Glacis Ripolin a Finir Spécial Pour Voitures, dated 1925.
Figure IX.2 Inside of the Ripolin’s colour chart: Glacis Ripolin a Finir Spécial Pour Voitures, dated 1925. In the red
squared is identified the swatch Blanc 1401.

273
APPENDICES PART III

274

275
Appendix I: Images painting (A) Collage
Image not available
Figure I.1. Painting A, “The collage”, assigned Amadeo de Souza-Cardoso.
Image not available
Figure I.2 A Image of the collage with normal light; B mapping of the areas painted with pigments not included in
the Amadeo’s palette: () copper phthalocyanine and dioxazine violet; () β-naphthol; () dioxazine violet and β-
naphthol; () Hansa yellow and red β-naphthol; () dioxazine violet and copper phthalocyanine; () red β-naphthol
and yellow ochre. The green line indicates the papers glued.

276
Appendix II: Area of analysis case studies paintings.
II.1 Painting (A) Collage
Image not available
Figure II.1 Painting (A) Collage, points where it was performed EDXRF analysis (○).
Image not available
Figure II.2 Painting (A) Collage, samples for FTIR (●) and Raman analysis (○).
● ●
C1 ●
●
●
V1
●
V2
●
●
●
●
●
● ●
● ●
●
●
●
●
●
● ●
● ●
●
● ●
●
●
●
●
●
●
●
●
●
●
● Viol2
Pr2

277
II.2 Painting (B) Geometric
Figure II.3 Painting (B), points where it was performed EDXRF analysis (●).
Figure II.4 Painting (B), samples for FTIR (●) and Raman analysis (●)

278
II.3 Painting (C) Embroiderers
Figure II.5 Painting (C) points where it was performed EDXRF and FORS analysis (); Raman in-situ (); points
of sampling for FTIR and Raman (); samples for cross-sections ().

279
II.4 Painting (D) Café
Figure II.6 Painting C, points where it was performed EDXRF analysis (); points of sampling for FTIR and Raman
(); samples for cross-sections ().

280
Appendix III: Analysis and representative spectra of the case studies paintings
In this appendix are presented the representative spectra of µ-EDXRF, µ-FTIR, µ-Raman, FORS
acquired in the paintings studied in the chapter Case Studies. In this appendix are also presented the
cross-sections prepared. To help the reader in the following tables (Tables II.1-4) are presented the
samples analysed, divided for colour and the result obtained by each analytical techniques used.
III.1 Results
Table III.1 Colour areas analysed on Painting (A) Collage by µ-EDXRF; µ-Raman and µ-FTIR.
Colour µ-EDXRF µ-Raman µ-FTIR
BLUE (Al), Si, S, (Cl), K, Ca, Fe,
Cu, (Zn), (Sr), Ba
ultramarine blue,copper phthalocyanine, dioxazine violet
ultramarine blue,
Prussian blue
RED (Si), (S), Cl, K, Ca, Fe, (Cu),
(Zn), (Sr), Ba red β-naphthol red β-naphthol
VIOLET (Al), Si, (P), S, (Cl), K, Ca,
Fe, Cu, (Zn), Sr, Ba
ultramarine blue, copper phthalocyanine, dioxazine violet, red
β-naphthol,
carbon black
n.a.
ORANGE Si, S, (Cl), K, Ca, Fe, (Cu),
(Zn), Se‡, (Sr), Cd, Ba red β-naphthol, yellow Hansa yellow Hansa
BROWN
(Si), (S), K, Ca, Ti, Fe,
(Cu), (Zn), (Sr), Ba
goethite, titanium dioxide
n.a.
(Al), (Si), (P), (S), (Cl), K, Ca, Ti, Fe, (Cu), (Zn), (Sr), Ba
Goethite, dioxazine violet, copper phthalocyanine
n.a.
(Al), (Si), (P), (S), (Cl), K, Ca, Ti, Cr, Fe, (Cu), (Zn), (Sr), Ba
goethite, red β-naphthol, carbon black
n.a.
BLACK (Si), (P), (S), (Cl), (K), Ca, Ti,
Cr, Fe, (Ni), (Cu), (Zn), (Sr), Ba
carbon black n.a.
SIGNATURE (Si), P, (S), (Cl), K, Ca, Fe,
(Cu), Zn, (Sr), Ba carbon black n.a.
‡ Selenium (Se) was detected in large amount in the dark orange areas; Titanium (Ti) and chromium (Cr) was detected in the mixtures of black and brown; n.a. No analysed by FTIR
Table III.2 Colour areas of the paper analysed on Painting (A) Collage by µ-EDXRF and µ-Raman.
Paper Colour µ-EDXRF µ-Raman
Paper A Green
(Si), S, K, Ca, Cr, Fe, Cu, (Zn), (Hg?),
(Pb?), (As?),(Sr), Ba n.s.
White (Si), (S), (Cl),K, Ca, Fe, (Cu), (Zn), (Sr),Ba n.s.
Paper B Blue (Si), (P), (S), (Cl), K, Ca, Mn, Fe, (Cu), (Zn), (Sr), Ba Indigo
Yellow (Si), (P), (S), (Cl), K, Ca, Mn, Fe, (Cu), (Zn), (Sr), Ba n.s.
Support --- (Si), (P), (S), (Cl), K, Ca, Mn, Fe, (Cu), (Zn), (Sr), Ba n.s.
n.s. No Raman signal

281
III.2 Painting (B) Geometric
Table III.3 Colour areas analysed on Painting (B) Geometric by µ-EDXRF; µ-Raman and µ-FTIR.
Colour µ-EDXRF µ-Raman µ-FTIR
WHITE Ca, Pb, (Ba), (Cr), (Fe) lead white lead white
YELLOW Ca, Pb, Ba, Fe, Cr, (Hg) ochre, vermilion yellow ochre
RED Ca, Pb, Ba, Hg, Cr, Fe vermilion n.a
PINK Ca, Pb, Ba, Cr, Fe, (Hg) vermilion, lead white n.a
BROWN Ca, Pb, Ba, Hg, Cr, Fe vermilion yellow ochre
LIGHT GREEN Ca, Pb, (Ba), Fe, Cr Viridian n.a
DARK GREEN Ca, Pb, Ba, Cr, Co, Ni, Fe Viridian n.a
BLUE Ca, Pb, Fe, Cr, Co,(Ni) viridian + cobalt blue cobalt blue
GREEN ON THE BACK
Ca, Pb, Ba, Fe, Cu, As emerald green n.a
n.a. No analysed by FTIR
III.3 Painting (C) Embroiderers Table III.4 Colour areas analysed on Painting (C) Embroiderers by µ-EDXRF; FORS; µ-Raman and µ-
FTIR.
Colour µ-EDXRF FORS µ-Raman µ-FTIR
BLUE Co, Ni, (Cr, Hg), Pb
(Ba, Fe, Ca, Sr, Zn)
cobalt or cerulean blue
cobalt and cerulean blue, goethite,
hematite
cobalt based blue. Silicate
matrix ¤
GREEN Cr, Co, Ni, Fe, Pb
(Ba, Ca, Sr, Zn) viridian n.a
viridian
RED Ba, Co, Ni, Pb
Ba, (Fe, Ca, Sr, Zn)
organic pigments n.i.
red β-naphthol,
barium sulphate
organic pigment,
barium sulphate
YELLOW Fe, Cr, Cd, Pb, Co, Ni,
(Ba, Ca, Sr, Zn) n.i.
chrome yellow, barium
sulphate, quartz n.a.
WHITE Pb, (Cr, Co)
(Ba, Ca, Sr, Zn) n.a. lead white lead white
PINK Pb, (Cr, Co)
(Ba, Ca, Sr, Zn)
organic pigments n.i.
n.a n.a
BROWN Fe, Co, Ni, Cr, Pb
(Ba, Fe, Ca, Sr, Zn) n.i. n.a. n.a.
PREPARATION Pb, Co, Fe, Zn, Cr, Ca,
(Sr, Ba) n.a.
lead white, barium sulphate
n.a.
SUPPORT§ Ba, Fe, Ca, Sr,
(Pb, Cu, Zn) n.a. n.a. n.a
# in italic the elements associated to the millboard support; ¤ Usually associate to earth pigments; § Elements form
the preparation layer could be detected; n.a. No analysed; n.i No identified

282
III.4 Painting (D) Café
Table III.5 Colour areas analysed on Painting (D) Café by µ-EDXRF; µ-Raman and µ-FTIR.
Colour µ-EDXRF µ-Raman µ-FTIR
BLUE Co, Pb, Ba, (Sr), (Ni)
Zn Cu, Fe, (Ca)
ultramarine blue, barium sulphate, lead white
GREEN Cr, Pb, Co, Ba Hg, Ni, Sr
Zn, Fe, Cu, Ca, (K)
viridian
ultramarine blue, lead white,
vermilion
viridian
ultramarine blue barium
sulphate, lead white
RED Hg, Pb, Zn, Ba, Cr, Sr,
Fe,Cu,(Ca) vermilion n.a.
YELLOW Pb, Cr, Ba, Hg, (Sr)
Fe, Zn, (Cu), (Ca)
chrome yellow,
barium sulphate,
lead white, vermilion
chrome yellow,
barium sulphate,
WHITE Pb, Ba, Hg, Sr, Cr
Cu, Fe, Zn, (Ca)
lead white, barium sulphate,
vermilion
lead white,
barium sulphate
VIOLET Pb, Fe, Hg, Ba, Cr, Co, Sr
Zn, Cu, (Ca), (K)
Lead white, barium sulphate,
ultramarine blue, vermilion
Lead white, barium
sulphate, ultramarine blue,
BROWN Pb, Fe, Ba, Hg, Co,
Cr, (Sr), Zn, Cu (Ca) n.a. n.a.
BLACK Fe, Pb, Hg, Cr, Ba, Sr
Zn Ca, Cu K n.a. n.a.
SIGNATURE Pb, Cr, Ba, Co, Hg, Sr,
Zn, Fe, Cu, Ca, (K) n.a. n.a.
SUPPORT Zn, Fe, Ca, Pb,
Ba, Cu, Cl, (K) n.a. n.a.
# in italic the elements associated to the millboard support;
n.a. No analysed
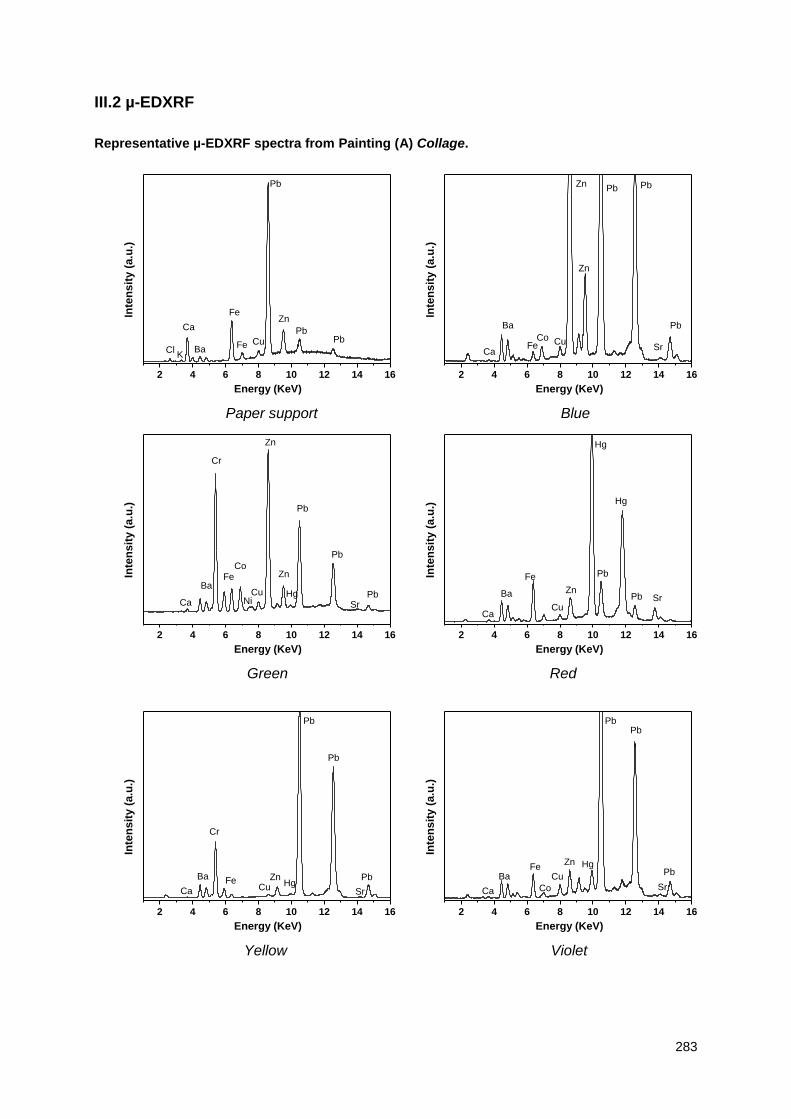
283
III.2 µ-EDXRF
Representative µ-EDXRF spectra from Painting (A) Collage.
Paper support Blue
Green Red
Yellow Violet
2 4 6 8 10 12 14 16
Ca
BaK
ClFe
Fe
Cu
Zn
PbPb
Energy (KeV)
Inte
ns
ity
(a
.u.)
Pb
2 4 6 8 10 12 14 16
Sr
Pb
PbPb
Ca
Ba
CoFe Cu
Zn
Energy (KeV)
Inte
ns
ity
(a
.u.)
Zn
2 4 6 8 10 12 14 16
HgNi
Cr
SrPb
Pb
Pb
Ca
Ba
CoFe
Cu
Zn
Energy (KeV)
Inte
ns
ity (
a.u
.)
Zn
2 4 6 8 10 12 14 16
CuSrPb
Hg
Pb
Ca
Ba
Fe
Zn
Energy (KeV)
Inte
ns
ity (
a.u
.)
Hg
2 4 6 8 10 12 14 16
Cr
Cu Sr
Pb
Pb
HgCa
Ba Fe Zn
Energy (KeV)
Inte
ns
ity
(a
.u.)
Pb
2 4 6 8 10 12 14 16
Co
CuSr
Pb
Pb
Hg
Ca
BaFe
Zn
Energy (KeV)
Inte
ns
ity
(a
.u.)
Pb

284
Brown White
Black
Signature
Figure III.1 Representative µ-EDXRF spectra of the paper support; blue; green; red; yellow; violet;
brown; white; black areas and the signature from Painting A (the collage).
Representative µ-EDXRF spectra from Painting (B) Geometric.
White Blue
2 4 6 8 10 12 14 16
Cr Co
Cu
Sr
Pb
Pb
Hg
Ca
BaFe
Zn
Energy (KeV)
Inte
ns
ity (
a.u
.)Pb
2 4 6 8 10 12 14 16
CrCu Sr
Pb
Pb
Hg
Ca
Ba
Fe
Zn
Energy (KeV)
Inte
ns
ity (
a.u
.)
Pb
2 4 6 8 10 12 14 16
Fe
Co
Hg
Cr
Cu SrPb
Pb
Hg
CaBa Fe
Zn
Energy (KeV)
Inte
ns
ity (
a.u
.)
Pb
2 4 6 8 10 12 14 16
Cr
Co
Hg
CuSr
Pb
Pb
HgCa
BaFe
Zn
Energy (KeV)
Inte
ns
ity (
a.u
.)
Pb
0 2 4 6 8 10 12 14
HgFe
Pb
Pb
Cr
Inte
nsit
y (
u.a
.)
Energy (KeV)
Ca
0 2 4 6 8 10 12 14
Ni Co
Cr
Ba
Co
Fe
Pb
Pb
Cr
Inte
ns
ity
(u
.a.)
Energy (KeV)
Ca
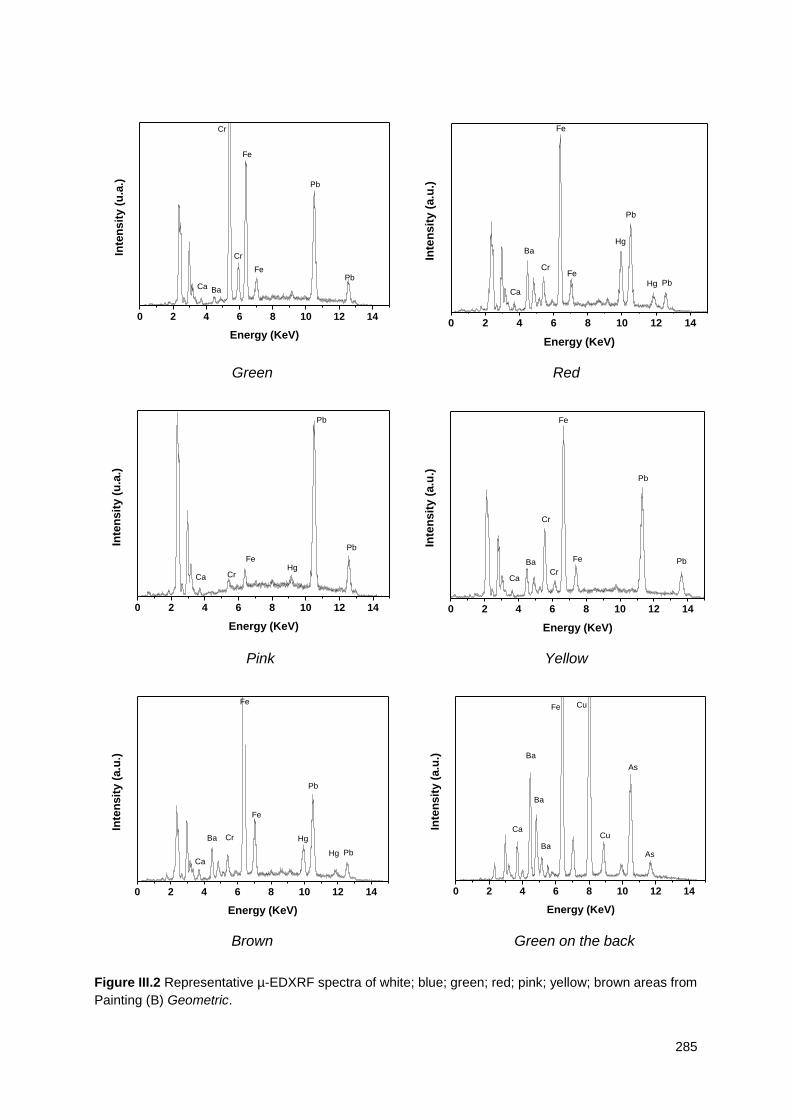
285
Green Red
Pink Yellow
Brown Green on the back
Figure III.2 Representative µ-EDXRF spectra of white; blue; green; red; pink; yellow; brown areas from
Painting (B) Geometric.
0 2 4 6 8 10 12 14
Cr
Ba
Fe
Fe
Pb
Pb
Cr
In
ten
sit
y (
u.a
.)
Energy (KeV)
Ca
0 2 4 6 8 10 12 14
Hg
Ba
Fe
Hg
Fe
Pb
Pb
Cr
Inte
nsit
y (
a.u
.)
Energy (KeV)
Ca
0 2 4 6 8 10 12 14
HgFe
Pb
Pb
Cr
Inte
nsit
y (
u.a
.)
Energy (KeV)
Ca
0 2 4 6 8 10 12 14
Cr
Fe Pb
Pb
Fe
Cr
Ba
Inte
nsit
y (
a.u
.)
Energy (KeV)
Ca
0 2 4 6 8 10 12 14
Hg
Ba
Fe
Hg
Fe
Pb
Pb
Cr
Inte
nsit
y (
a.u
.)
Energy (KeV)
Ca
0 2 4 6 8 10 12 14
AsBa
Ba
Cu
Ba
CuFe
As
Inte
nsit
y (
a.u
.)
Energy (KeV)
Ca

286
Representative µ-EDXRF spectra from Painting (C) Embroiderers.
Paper support Blue
Green Red
Yellow Pink
2 4 6 8 10 12 14 16
Fe
Ba
Ba
Pb Sr
Fe
Cu
PbCa
Ba
Zn
Energy (KeV)
Inte
ns
ity (
a.u
.)
2 4 6 8 10 12 14 16
Ni
FeCa
Pb
Sr
Co
Hg
Pb
Pb
Ba Cr Zn
Energy (KeV)
Inte
ns
ity (
a.u
.)
2 4 6 8 10 12 14 16
Cr
Ni
Fe
Ca
Pb
Sr
CoPb
Pb
Cr
Zn
Energy (KeV)
Inte
ns
ity (
a.u
.)
2 4 6 8 10 12 14 16
Ba
NiFeCa
Pb
Sr
Co
Pb
Pb
Ba
Zn
Energy (KeV)
Inte
ns
ity (
a.u
.)
2 4 6 8 10 12 14 16
CdCr
Ni
Fe
Ca
Pb
Sr
Co Pb
Pb
BaZn
Energy (KeV)
Inte
ns
ity (
a.u
.)
2 4 6 8 10 12 14 16
Cr FeCa
Pb
SrCo
Pb
Pb
Ba
Zn
Energy (KeV)
Inte
ns
ity (
a.u
.)

287
Brown White
Signature
Preparation
Figure III.3 Representative µ-EDXRF spectra of the support; blue; green; red; yellow; pink; brown; white
areas; signature and preparation layer from Painting (C) Embroiderers.
Representative µ-EDXRF spectra from Painting (D) Café.
Support Blue
2 4 6 8 10 12 14 16
Cr
Fe
Ca
Pb
Sr
Co
Pb
Pb
Ba Zn
Energy (KeV)
Inte
ns
ity (
a.u
.)
2 4 6 8 10 12 14 16
Cr Fe
Pb
SrCoPb
Pb
BaZn
Energy (KeV)
Inte
ns
ity (
a.u
.)
2 4 6 8 10 12 14 16
Cr NiFe
Ca
Pb
Sr
Co Pb
Pb
BaZn
Energy (KeV)
Inte
ns
ity (
a.u
.)
2 4 6 8 10 12 14 16
Cr FeCa
Pb
SrCo
Pb
Pb
BaZn
Energy (KeV)
Inte
ns
ity (
a.u
.)
2 4 6 8 10 12 14 16
KFe
Fe
CuPb
PbCa
Ba
Zn
Energy (KeV)
Inte
ns
ity (
a.u
.)
Zn
2 4 6 8 10 12 14 16
NiPbFe
Cu
Pb
Pb
CaBa
Zn
Energy (KeV)
Inte
ns
ity (
a.u
.)
Zn

288
Green Red
Yellow Violet
Brown
White
2 4 6 8 10 12 14 16
Co
Cr
Hg
NiPb
Fe
Cu
Pb
Pb
Ca
Ba
Zn
Energy (KeV)
Inte
ns
ity (
a.u
.)Zn
2 4 6 8 10 12 14 16
Hg
Sr
Fe
Cu
Pb
Pb
Ca
Ba Zn
Energy (KeV)
Inte
ns
ity (
a.u
.)
Hg
2 4 6 8 10 12 14 16
Cr
HgSr
FeCu
Pb
Pb
CaBa Zn
Energy (KeV)
Inte
ns
ity (
a.u
.)
Pb
2 4 6 8 10 12 14 16
Cr
Hg
Sr
Fe
CuPb
Pb
CaBa
Zn
Energy (KeV)
Inte
ns
ity (
a.u
.)
Pb
2 4 6 8 10 12 14 16
CoCrHg
Sr
Fe CuPb
Pb
CaBa
Zn
Energy (KeV)
Inte
ns
ity (
a.u
.)
Pb
2 4 6 8 10 12 14 16
HgSr
FeCu Pb
Pb
CaBa
Zn
Energy (KeV)
Inte
ns
ity (
a.u
.)
Pb

289
Black
Signature
Figure III.4 Representative µ-EDXRF spectra of the support; blue; green; red; yellow; violet; brown;
white; black areas and preparation layer from Painting (D) Café
Table III.6. Characteristic energies of the X-rays (KeV) used to identify the elements in the EDXRF
analysis.
Elements K K L L1 L2 L1 M
15P 2,014 2,139
19K 3,314 3,590
20Ca 3,690 4,012
24Cr 5,414 5,946
26Fe 6,396 7,057
27Co 6,922 7,648
28Ni 7,477 8,264
29Cu 8,040 8,904
30Zn 8,630 9,570
33As 10,543 11,725
56Ba 4,467 4,828 5,156 5,531
80Hg 9,987 11,823 11,923 13,828
82Pb 10,550 12,812 12,621 14,782 2,342
2 4 6 8 10 12 14 16
Co
CrHg
Hg
Sr
Fe
Cu Pb
Pb
CaBa
Zn
Energy (KeV)
Inte
ns
ity (
a.u
.)Pb
2 4 6 8 10 12 14 16
Co
CrHg
Sr
FeCu
Pb
Pb
CaBa
Zn
Energy (KeV)
Inte
ns
ity (
a.u
.)
Pb

290
III.3 µ-FTIR
Representative µ-FTIR spectra from Painting (A) Collage and the reference pigments.
Red sample (a) and -naphthol PR4 (Clariant) (b).
Yellow sample (a) and Hansa PY1 (Clariant).
Figure III.5 Representative µ-FTIR spectra of the red and yellow areas from Painting (A) Collage and
the reference pigments -naphthol PR4 (Clariant) and Hansa yellow PY1 (Clariant).
4000 3500 3000 2500 2000 1500 1000Wavenumber (cm-1)
b)
a)
Ab
so
rba
nc
e
4000 3500 3000 2500 2000 1500 1000Wavenumber (cm-1)
Ab
so
rba
nc
e
b)
a)

291
Representative µ-FTIR spectra from Painting (B) Geometric.
White sample, oil () and lead white ().
White sample, oil (); lead white () and barium sulphate ().
Brown sample, kaolin ()and iron oxide ().
Figure III.6 Representative µ-FTIR spectra of the white and brown areas from Painting (B) Geometric.
4000 3500 3000 2500 2000 1500 1000
0,3
0,7
1,0
1,4
Wavenumber (cm-1
)
Ab
so
rba
nc
e
4000 3500 3000 2500 2000 1500 1000
0,1
0,2
0,3
0,4
Wavenumber (cm-1
)
Ab
so
rba
nc
e
4000 3500 3000 2500 2000 1500 1000
0,2
0,3
0,3
0,4
0,4
0,5
0,5
0,6
0,6
0,7
0,7
Wavenumber (cm-1
)
Ab
so
rba
nc
e
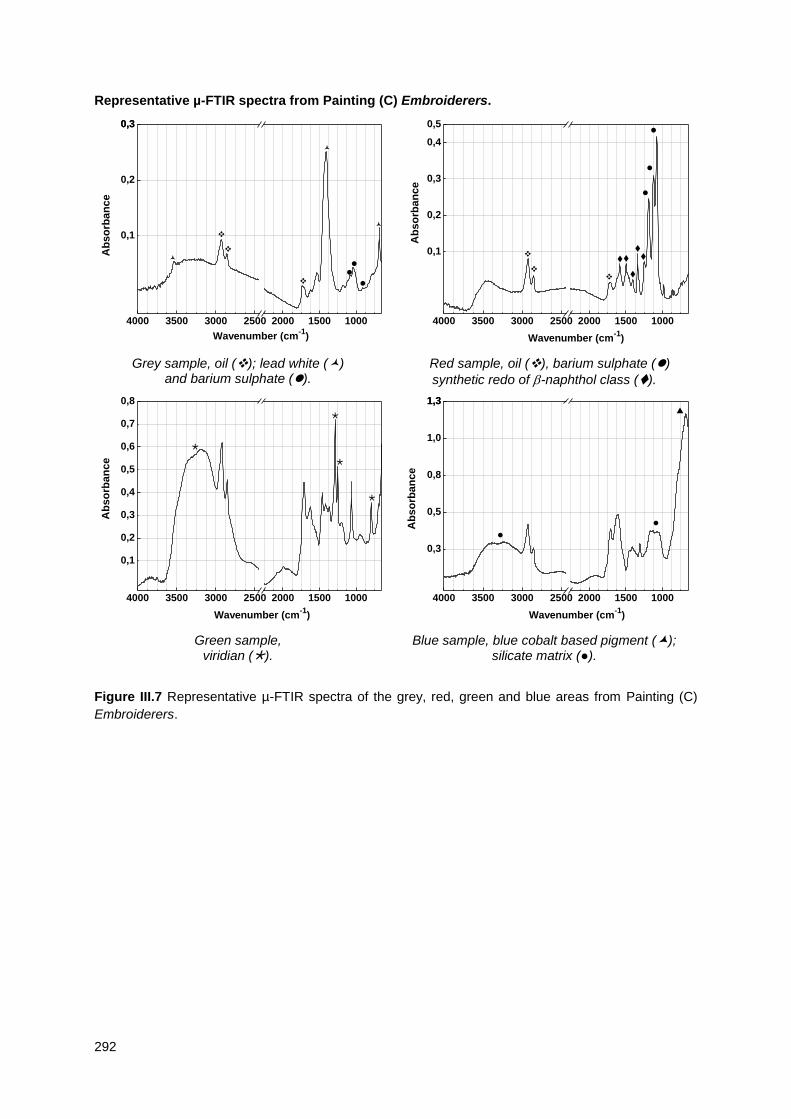
292
Representative µ-FTIR spectra from Painting (C) Embroiderers.
Grey sample, oil (); lead white () and barium sulphate ().
Red sample, oil (), barium sulphate ()
synthetic redo of -naphthol class ().
Green sample, viridian ().
Blue sample, blue cobalt based pigment (); silicate matrix (●).
Figure III.7 Representative µ-FTIR spectra of the grey, red, green and blue areas from Painting (C)
Embroiderers.
4000 3500 3000 2500 2000 1500 1000
0,1
0,2
0,30,3
Wavenumber (cm-1
)
Ab
so
rba
nc
e
4000 3500 3000 2500 2000 1500 1000
0,1
0,2
0,3
0,4
0,5
Ab
so
rba
nc
e
Wavenumber (cm-1
)
4000 3500 3000 2500 2000 1500 1000
0,1
0,2
0,3
0,4
0,5
0,6
0,7
0,8
Wavenumber (cm-1
)
Ab
so
rba
nc
e
4000 3500 3000 2500 2000 1500 1000
0,3
0,5
0,8
1,0
1,31,3A
bs
orb
an
ce
Wavenumber (cm-1
)

293
Representative µ-FTIR spectra from Painting (D) Café.
Varnish sample. Green sample, oil (); lead white ();
ultramarine blue () and viridian ().
White sample, oil (); lead white () and barium sulphate ().
Yellow sample, barium sulphate () and chrome yellow ().
Blue sample, lead white (); barium sulphate () and ultramarine ().
Violet sample, lead white (); barium sulphate () and ultramarine ().
Figure III.8 Representative µ-FTIR spectra of the varnish and the green; white; yellow; blue and violet areas from
Painting (D) Café.
4000 3500 3000 2500 2000 1500 1000
0,3
0,7
1,0
1,4
1,7
Wavenumber (cm-1
)
Ab
so
rba
nc
e
4000 3500 3000 2500 2000 1500 1000
0,3
0,7
1,0
1,4
1,5
Wavenumber (cm-1
)
Ab
so
rba
nc
e
4000 3500 3000 2500 2000 1500 1000
0,3
0,7
1,0
1,4
1,7
Wavenumber (cm-1
)
Ab
so
rba
nc
e
4000 3500 3000 2500 2000 1500 1000
0,1
0,2
0,3
0,4
0,5
0,6
Wavenumber (cm-1
)
Ab
so
rba
nc
e
4000 3500 3000 2500 2000 1500 1000
0,1
0,2
0,3
0,4
0,50,5
Wavenumber (cm-1
)
Ab
so
rba
nc
e
4000 3500 3000 2500 2000 1500 1000
0,3
0,5
0,8
1,0
1,1
Wavenumber (cm-1
)
Ab
so
rba
nc
e

294
Table III.7. Characteristic bands of FTIR spectra of the pigments identified.
Pigment Bands (cm-1) and intensity Assignment*
Lead white
2PbCO3.Pb(OH)2
3536, medium 1400, strong and broad
1047, weak 686, medium
(OH)
as (CO32-)
(OH)
as (CO32-)
Barium sulphate
BaSO4 1200-1050, strong and broad
983, weak as (SO4)
as (SO4)
Ultramarine blue
Na8[Al6Si6O24]Sn 1150-950, strong and broad
696, weak
(Si-O-Si e Si-O-Al)
(-O-Si-)
Viridian
Cr2O3.2H2O
3630-2630, very broad 1288, medium 1064, strong
794, medium/ strong 650, strong
(OH) - - -
(OH)
Chrome yellow PbCrO4 857/830, strong and broad as (CrO4
2-)
Hansa Yellow
1666, medium (C=O)
1599, weak -
1560, weak -
1506, media as (NO2)
1493, media -
1449, weak (N=N)
1386, weak -
1358, weak as (NO2)
1292, weak -
1270, weak -
1175, strong -
951, weak -
914, weak -
702, weak -
Goethite
Fe2O3.H2O
3689, 3670, 3650, 3622 medium 1036, strong 917, medium 800, medium
(OH)
as (Si-O-Si)
(Al-O-H)
(Fe-O-H) goethite and (-O-Si-)
-naphthol
red
2929, medium broad -
1572, medium -
1509, strong as (NO2)
1453, weak -
1400, weak -
1337, forte s (NO2)
1199, medium -
1129, weak -
984, weak -
891, weak -
867, weak -
837, weak -
742, weak -
708, weak -
* Assignment based on [Bouchard et al. 2009; Derrick et al. 1999; Genestar and Pons 2005; Humel 2002; Weerd
et al. 2005; Prasad et al. 2005; Stuart et al. 1996]

295
III.4 µ-Raman
Representative µ-Raman spectra from Painting (A) Collage and the reference pigments.
Blue; copper phthalocyanine blue (); dioxazine violet (); ultramarine blue ()
Copper phthalocyanine blue PB15 (Aldrich) (a) and dioxazine violet PV23 (Clariant)(b);
200 400 600 800 1000 1200 1400 1600 1800
Wavenumber (cm-1
)
Ram
an
In
ten
sit
y
200 400 600 800 1000 1200 1400 1600 1800Wavenumber (cm
-1
)
Ra
ma
n I
nte
ns
ity
a)
b)

296
Red area (a) and red -naphthol PR4 (Clariant) (b).
Yellow area (a) and Hansa yellow PY1 (Clariant) (b).
200 400 600 800 1000 1200 1400 1600 1800Wavenumber (cm
-1
)
Ra
ma
n I
nte
ns
ity
a)
b)
200 400 600 800 1000 1200 1400 1600 1800
Wavenumber (cm-1
)
Ra
ma
n I
nte
ns
ity
a)
b)

297
Blue area on paper B (a) and indigo (Thermo Database) (b).
Figure III.9 Representative µ-Raman spectra of the blue; red; yellow painted areas and blue area on
paper B from Painting (A) Collage and the reference pigments Copper phthalocyanine blue PB15
(Aldrich); dioxazine violet PV23 (Clariant); -naphthol PR4 (Clariant), Hansa yellow PY1 (Clariant) and
indigo (Thermo Database).
Representative µ-Raman spectra from Painting (B) Geometric.
Yellow; chrome yellow
Brown; goethtie.
200 400 600 800 1000 1200 1400 1600 1800Wavenumber (cm
-1
)
Ra
ma
n I
nte
ns
ity
a)
b)
200 400 600 800 1000 1200 1400 1600 1800
Wavenumber (cm-1)
Ra
ma
n I
nte
ns
ity
200 400 600 800 1000
Ra
ma
n I
nte
ns
ity
Wavenumber (cm-1)

298
Red; vermilion.
Figure III.10 Representative µ-Raman spectra of the yellow; brow and red from Painting (B) Geometric.
Representative µ-Raman spectra from Painting (C) Embroiderers.
Preparation layer; () lead white; (●) barium sulphate
White;
() lead white.
Figure III.11 Representative µ-Raman spectra of the preparation and white area from Painting (C)
Embroiderers.
200 400 600 800 1000 1200 1400
Wavenumber (cm-1)
Ra
ma
n I
nte
ns
ity
800 850 900 950 1000 1050 1100
Ra
ma
n I
nte
ns
ity
Wavenumber (cm-1
)
800 850 900 950 1000 1050
Ra
ma
n I
nte
ns
ity
Wavenumber (cm-1
)
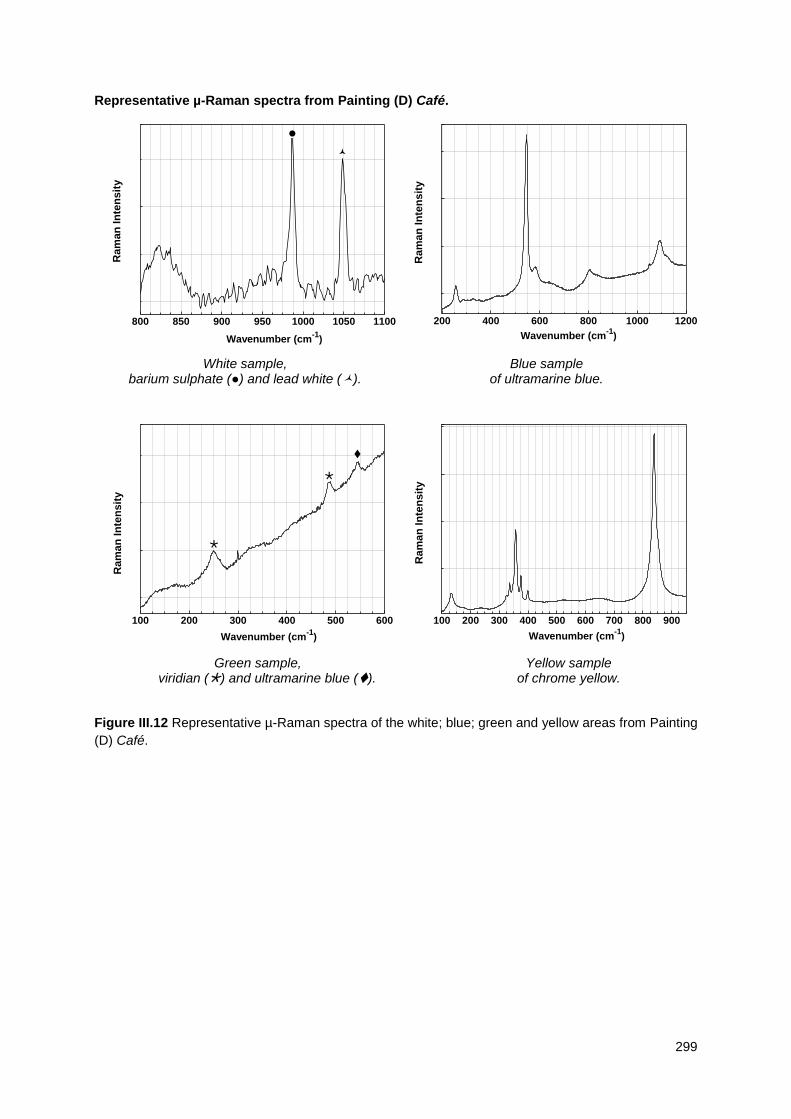
299
Representative µ-Raman spectra from Painting (D) Café.
White sample, barium sulphate (●) and lead white ().
Blue sample of ultramarine blue.
Green sample, viridian () and ultramarine blue ().
Yellow sample of chrome yellow.
Figure III.12 Representative µ-Raman spectra of the white; blue; green and yellow areas from Painting
(D) Café.
800 850 900 950 1000 1050 1100
Wavenumber (cm-1
)
Ram
an
In
ten
sit
y
200 400 600 800 1000 1200
Wavenumber (cm-1
)
Ra
ma
n I
nte
ns
ity
100 200 300 400 500 600
Ra
ma
n I
nte
ns
ity
Wavenumber (cm-1
)
100 200 300 400 500 600 700 800 900
Wavenumber (cm-1
)
Ra
ma
n I
nte
ns
ity
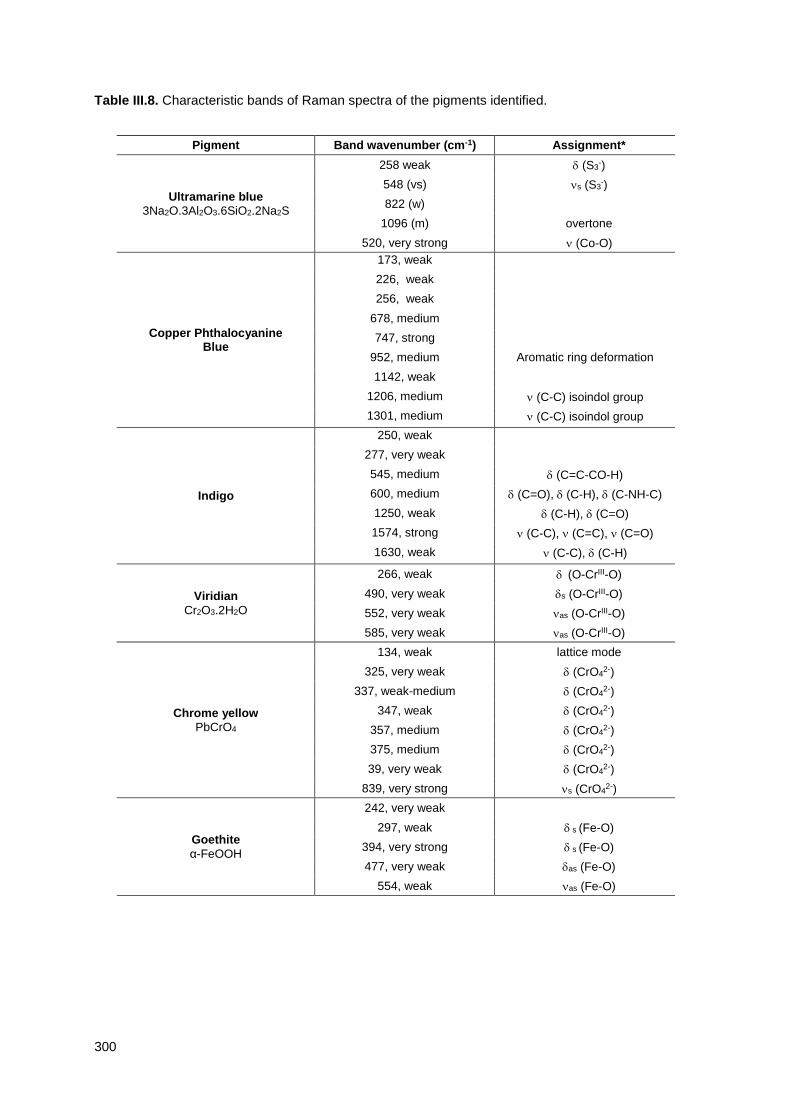
300
Table III.8. Characteristic bands of Raman spectra of the pigments identified.
Pigment Band wavenumber (cm-1) Assignment*
Ultramarine blue
3Na2O.3Al2O3.6SiO2.2Na2S
258 weak (S3-)
548 (vs) s (S3-)
822 (w)
1096 (m) overtone
520, very strong (Co-O)
Copper Phthalocyanine Blue
173, weak
226, weak
256, weak
678, medium
747, strong
952, medium Aromatic ring deformation
1142, weak
1206, medium (C-C) isoindol group
1301, medium (C-C) isoindol group
Indigo
250, weak
277, very weak
545, medium (C=C-CO-H)
600, medium (C=O), (C-H), (C-NH-C)
1250, weak (C-H), (C=O)
1574, strong (C-C), (C=C), (C=O)
1630, weak (C-C), (C-H)
Viridian
Cr2O3.2H2O
266, weak (O-CrIII-O)
490, very weak s (O-CrIII-O)
552, very weak as (O-CrIII-O)
585, very weak as (O-CrIII-O)
Chrome yellow
PbCrO4
134, weak lattice mode
325, very weak (CrO42-)
337, weak-medium (CrO42-)
347, weak (CrO42-)
357, medium (CrO42-)
375, medium (CrO42-)
39, very weak (CrO42-)
839, very strong s (CrO42-)
Goethite
α-FeOOH
242, very weak
297, weak s (Fe-O)
394, very strong s (Fe-O)
477, very weak as (Fe-O)
554, weak as (Fe-O)

301
Table III.8 (continued).
Pigment Band wavenumber (cm-1) Assignment*
Hansa Yellow
168, medium
240, medium
354, weak ρ(OCC)
361, weak
387, weak
400, weak
454, medium (C=O)
509, medium
538, weak
593, weak
616, strong Aromatic ring deformation
679, medium
789, strong
823, medium
842, medium
922, medium
950, medium
996, medium
1077, weak
1135, strong
1166, weak
1190, medium
1214, medium
1253, medium (CONH), Amide III
1308, strong
1322, medium
1335, medium
1385, strong
1422, weak
1448, medium
1483, strong
1533, medium
1567, weak (NO2)
1597, medium
1622, strong Aromatic ring
1670, medium
Goethite
α-FeOOH
242, very weak
297, weak s (Fe-O)
394, very strong s (Fe-O)
477, very weak as (Fe-O)
554, weak as (Fe-O)
Vermilion
HgS
253, very strong (S-Hg-S)
282, weak-shoulder (S-Hg-S)
343, medium (Hg-S)

302
Table III.8 (continued).
Pigment Band wavenumber (cm-1) Assignment*
β-naphthol
165, medium
204, weak
310, media
356, weak
405-418, weak
592, weak
628, media Aromatic ring deformation
69, weak
711, weak
735, weak
773, weak
895, weak δ (NO2)
986, weak
1039, weak
1092, shoulder
ν azobenzene
1121, media
1186, media
1226-1236, weak
1315, shoulder
1334, strong
1394, medium
1453, weak
1488, medium
1558, shoulder ν (NO2)
Cobalt violet
Co3(AsO4)2
204 very weak (As-O) in the plane
351 weak, broad As-O) out of plane
375 weak shoulder As-O) out of plane
420 weak, broad As-O) out of plane
508 weak (As-O) out of plane
738 very weak s/s(As-O)
837 medium s/s(As-O)
865 very strong s/s(As-O)
Dioxazine violet
482, weak
592, weak
617, weak
1106, medium
1207, medium
1337, medium s (naphthalene)
1387, medium (C=N); (C=C)
1431, shoulder aromatic ring
Lead carbonate
or Lead White
PbCO3 or 2PbCO3.Pb(OH)2
665, very weak s (CO32-)
687, very weak s (CO32-)
829, very weak as (CO32-)
1050, very strong s (CO32-)

303
Barium sulphate
Barite
BaSO4
453, medium (SO42-)
461, medium, should (SO42-)
616, weak out-of-plane (SO42-)
647, weak out-of-plane (SO42-)
987, very strong s (SO42-)
* Assignment based on [Bersani et al. 1999; Bouchard et al. 2010; Casadio et al. 2011; Frausto-Reyes et al. 2009;
Frost 2004; Frost et al. 2010; Quilès and Burneau 1998; Roncaglia et al. 1985; Ropret et al. 2008; Scherren et al.
2009; Shebanova and Lazor 2003; Schulte et al. 2008; Vandenabeele et al. 2000; Yang et al. 2010; Zumbuehl et
al. 2009].

304
III.5 FORS
Representative FORS spectra from Painting (C) Embroiderers.
Blue Green
Red Pink
Yellow Brown
Figure III.13 Representative FORS spectra of the support; blue; green; red; pink; yellow; brown areas
from Painting (C) Embroiderers.
400 500 600 700 800 9000
10
20
30
40
R%
nm400 500 600 700 800 900
10
20
30
40
50
60
R%
nm
400 500 600 700 800 9000
10
20
30
40
50
60
R%
nm400 500 600 700 800 900
10
20
30
40
50
60
70
R%
nm
400 500 600 700 800 90010
20
30
40
50
60
70
R%
nm400 500 600 700 800 900
5
10
15
20
25
30
35
40
45
50
R%
nm

305
Appendix IV: Image documentation
Figure IV.1. Infrared photography Painting (A), Collage, attributed Amadeo de Souza-Cardoso.

306
Figure V.2. Infrared photography Painting (C), Embroiderers, attributed Amadeo de Souza-Cardoso.

307
Figure V.3. Ultraviolet photograph (covered in black and white) of the Painting (D), Café, attributed Amadeo de
Souza-Cardoso.
Figure V.4. X-ray image of the Painting (D), Café, attributed Amadeo de Souza-Cardoso.

308
Appendix V: Paintings cited in the main text
Figure VI.1 Amadeo de Souza-Cardoso, Untitled, 1910, graphite on paper. 36 x 24.7 cm. Collection of Centro de
Arte Moderna, Fundação Calouste Gulbenkian (Inv. 92DP1586).

309
Figure VI.2 Amadeo de Souza-Cardoso, Untitled, 1910, graphite on paper. 25 x 35 cm. Collection of Centro de
Arte Moderna, Fundação Calouste Gulbenkian (Inv. 86DP372).

310