the bright future of the palladium market - lbma 2017/s5_ds.pdf · 3 palladium has become a...
TRANSCRIPT

Denis SharypinHead of Market Research, Nornickel
OCTOBER 16, 2017
BARCELONATHE LBMA/LPPM PRECIOUS METALS CONFERENCE 2017
The Bright Future of the Palladium Market

2
Stagnating Pd Mine Supply

3
Palladium has Become a Co-product of Platinum and Base Metals Mining
Source: Company estimates, Official reports
64%56%
7% 27%
18%7%1% 3%
1% 2%
8% 5%
2005 1H2017
South Africa PGM Miners
Pt Pd Rh Au Cu Ni
51%
27%
23%
26%
13%
30%
12%8%
1%9%
2005 1H2017
Nornickel
Ni Cu Pd Pt Other
Nornickel now is
neither copper,
“Nor Nickel”,
but PGMs
Pd share is equal to
the Ni share for NN
Revenues split by metal
Drivers:• African Pt:Pd output ratio has shifted from 2.0:1 to 1.7:1 in 10 years due to the shift from the Western
Limb to the Eastern and Northern Limbs coupled with higher Zimbabwean output• Higher share of disseminated ores in Norilsk with relatively higher PGM content• Lower Ni and Pt prices, but higher Pd prices

4
2017: Pd Primary Supply is Likely to be Flat or Decrease Slightly
2 618
161 2636 - 2732
2016 2017E
Production Stocks sales Production guidance
-50…-150 koz
NN sales, koz
Guidance range
Sale ofstocks
accumulatedin 2015*
Lower Pd sales by NN in 2017 due to destocking in 2016Flat SA output in 1H 2017. 2H 2017 should be impacted by Bokoni and Maseve closures
Source: Company estimates, SA Statistics Bureau
0
20
40
Jan Feb Mar Apr May Jun Jul Aug Sep Oct Nov Dec
SA PGM production, excl. concentrate from Zimbabwe
2015 2016 2017
tonnes
-1%
Jan-Jul 2017 Y-o-Y
* Metal reserves, created to smooth out the transition to the new configuration of smelting and refining capacities (shutdown of Nickel Plant, increased shipments of nickel matte for processing to Kola MMC and to Harjavalta in Finland) scheduled in 2016, which is expected to result in a one-off increase in work-inprogress in transit and lower output of saleable metals(Nornickel Annual Report 2016)

5
Going Forward: NN – Flat Production Profile, SA – High Risk of Pd Supply Disruptions
0
5
10
15
20
2014 2015 2016 2017 2018 2019 2020
Nornickel CAPEX by mine
Oktyabrskiy mine
Zapolyarniy mine
Komsomolskiy mine (excluding Skalistiy)
Skalisity mine
Taimyrskiy mine
Base production without "expansion" CAPEX
mn
Source: NN estimates as of 2015
0
5
10
15
20
25
FY2008 FY2009 FY2010 FY2011 FY2012 FY2013 FY2014 FY2015 FY2016
SA Producers capital expenditure, billion ZAR
Amplats Impala Lonmin Northam
-12bn ZAR
* Excluding Bystrinsky greenfield copper project with no PGMs; including assets reconfiguration and environmental projectsSource: Company estimates, reports
Nornickel ‘Expansion’ CAPEX ($400 million in 2016*) allows to keep the output profile flat
Deferred CAPEX in SA will lead to a deterioration of the production base

6
Quartile 1 Quartile 2 Quartile 3 Quartile 4
0
5 000
10 000
15 000
20 000
25 000
2017 Producer Operating Costs - ZAR/4E oz CAPEX NCC
2017 YTD Basket (4E) Price - 12 700 ZAR
Additional Pd Supply From SA Would Result in Higher Pt Supply
Source: SFA Oxford, Company data, Consensus forecast (5 participants)
~50% of South African PGM Production is Unprofitable or on the Edge of Loss-Making … but the Pt market is more balanced than the Pd
• SA Producers cannot deliver additional Pd ounces without impacting Pt market• The risk of closures in SA is high
Market Balance Forecast Consensus(before Bokoni and Maseve closing announcements)
-200
-500
240120 150 140
280
-50
-350
-900-1000
-850-950
-1400
2015 2016 2017E 2018E 2019E 2020E 2021E
Pt Pdkoz

7
Palladium Production Growth Opportunities in North America are Limited
Source: Company estimates, Sibanye-Stillwater, NAP official statements
180 koz
-80 koz
Pd-drivenproducers
Pd production asby-product
• Pd output in N. America remains marginal
(14% of global mine production)
• Incremental supply of Pd-driven producers
partly offset by decreasing Pd by-production
from Ni mines

8
Not Only the Operation Cost That Matters
• It takes about 10 years and over US$1 bn to build a sizeable underground mine from scratch
• Increasing capital is required just to maintain production levels due to the ever-deepening nature of the
resources and decreasing metal contents in ore
• Excluding operational costs, producers have a wide range of implicit costs:
• Nornickel Sulphur project is expected to cost up to 3.5 bn USD in 2017-2023
• The new edition of the Mining Charter in South Africa might be enacted by the end of 2017:
• BEE redistribution of the capital
• Revenue taxes for the black communities development
• Procurement via BEE
• REACH and other legislation challenges
9
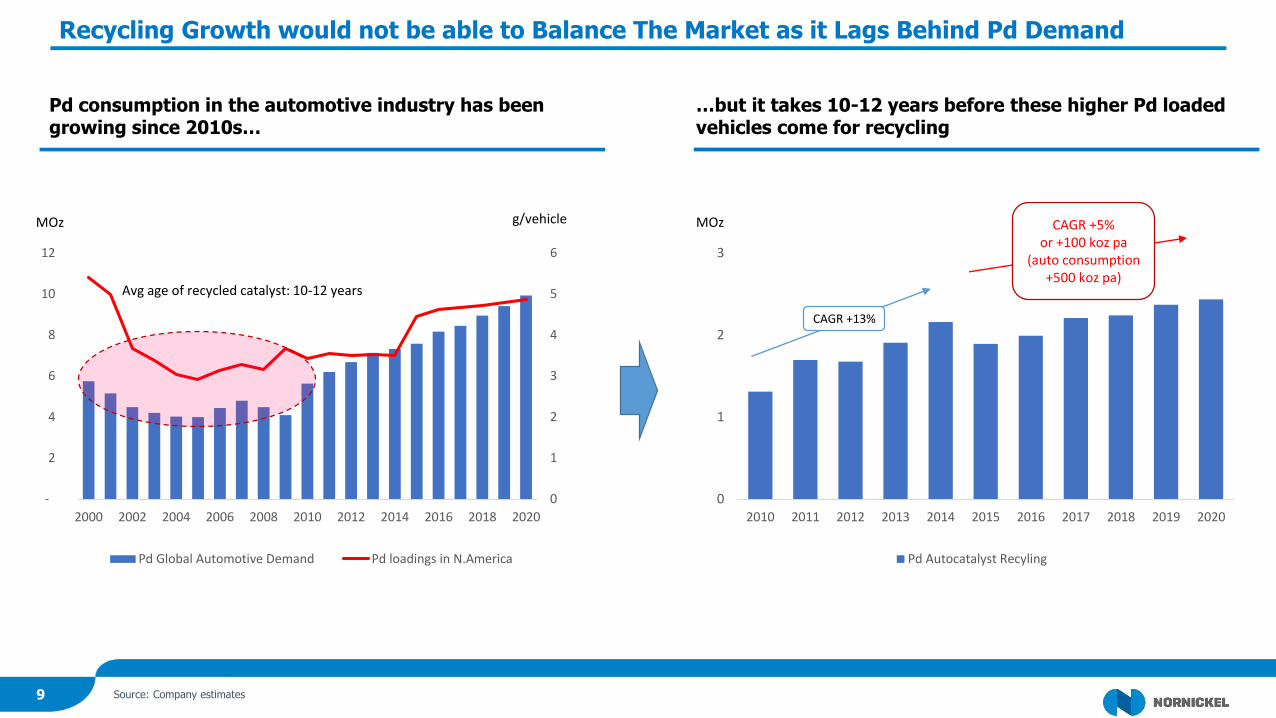
Recycling Growth would not be able to Balance The Market as it Lags Behind Pd Demand
0
1
2
3
4
5
6
-
2
4
6
8
10
12
2000 2002 2004 2006 2008 2010 2012 2014 2016 2018 2020
Pd Global Automotive Demand Pd loadings in N.America
MOz g/vehicle
Avg age of recycled catalyst: 10-12 years
0
1
2
3
2010 2011 2012 2013 2014 2015 2016 2017 2018 2019 2020
Pd Autocatalyst Recyling
MOz
CAGR +13%
CAGR +5%or +100 koz pa
(auto consumption +500 koz pa)
Source: Company estimates
Pd consumption in the automotive industry has been growing since 2010s…
…but it takes 10-12 years before these higher Pd loaded vehicles come for recycling

10
Supply
Growing Pd Demand

11
Global Vehicle Production Growth, Emission Legislation and Powertrain Shifts Drive Pd Demand
Production of Pd consuming vehicles to grow +18% by 2025
New environmental regulations, especially in
China, push automakers to increase PGM loadings
Hybridization is a key solution to meet stricter CO2 targets as the diesel
share is falling
Low oil prices and growing share of SUVs result in
engine downsizing termination. Hybrid
displacements are growing
Hybrids contain more Pd per vehicle vs conventional gasoline engines with the
same engine size
BEV is growing from a low base, penetration is limited
(Consensus FC: 5% production share in 2025)
+ 2.5 MOz of additional Pd consumption in auto industry by 2025

12
Supply
Stocks Depleted

13
Available for Consumption Palladium Stocks are Depleting
-2
0
2
4
6
8
1988 1991 1994 1997 2000 2003 2006 2009 2012 2015
Swiss & UK Palladium net trade
CH UK Cumulative total
MOz
outflow
inflow
200
400
600
2012 2013 2014 2015 2016
Palladium NYMEX Stockskoz
Potentially available stocks(price determinant)
Low-elastic stocks
Non-elastic stocks
Source: Swiss Federal Customs Administration, HM Revenue & Customs, Bloomberg, Company estimates
A very clear trend, seen since 2010, confirms that the Pd usage exceeds supply and requires involvement of the stockpiles
Palladium NYMEX stock movement also reflects depletion of on-ground stocks
Existing global stockpiles are not uniformGokhran stocks have depleted*
2013 2014 2015 2016 2017YTD
Deliveries by Gokhran
* According to Analytical agencies reports

14
PGM Market Balance
Metal Stocks, days of consumption Market Balance ForecastMedium-termFundamentals
Palladium
Platinum
(300)
(1000)
(1750)
2016 2017E 2018E
Koz
(480)
(140)(10)
2016 2017E 2018E
Koz Deficit
Balanced
81 51
Jan 2016 Aug 2017
ETF stocks Other non-elastic stocks Other elastic
-2.7moz
122 128
Jan 2016 Aug 2017
ETF stocks Other stocks
+260koz
Source: Company data

15
SupplyNN Palladium Jewellery Program is Suspended

16
Palladium Has Everything to Become a Widely-used Jewellery Metal
Source: Company estimates
Palladium has distinctively strong physical/consumer
characteristics as a jewellery material:
• Established hallmarking
• Hypoallergenic
• No lose of whiteness in everyday wear
• Stronger than gold
• Easy handling
• Easy and quickly removable surface wear
• Lower density
Nornickel’s Palladium Jewellery project was suspended due to:
• The Palladium market has experienced a structural shift since the Jewelry
project was initiated – deficit has become evident, the Pd price is at a
premium to Platinum
• Taking into account the evident market deficits, Nornickel has decided to fully
focus on supplying to the existing customer base
• The Project may be relaunched in case of the appropriate market environment
58%
35%
2%
Au Pt Pd
Share of metals used in jewellery, %
Non-jewellery Jewellery
Range in the last 20 years 50-60% 30-50% 2-20%

17
Thank you!