platinum group minor metals & palladium: this is where the ......platinum group minor metals...
TRANSCRIPT
Platinum Group Minor Metals
& Palladium:
This Is Where The Action IsMatt Watson
Precious Metals Commodity Management LLCJune 16, 2019
Platinum Group Minor Metals & Palladium; Where the Action Is June 16, 2019 Slide 2
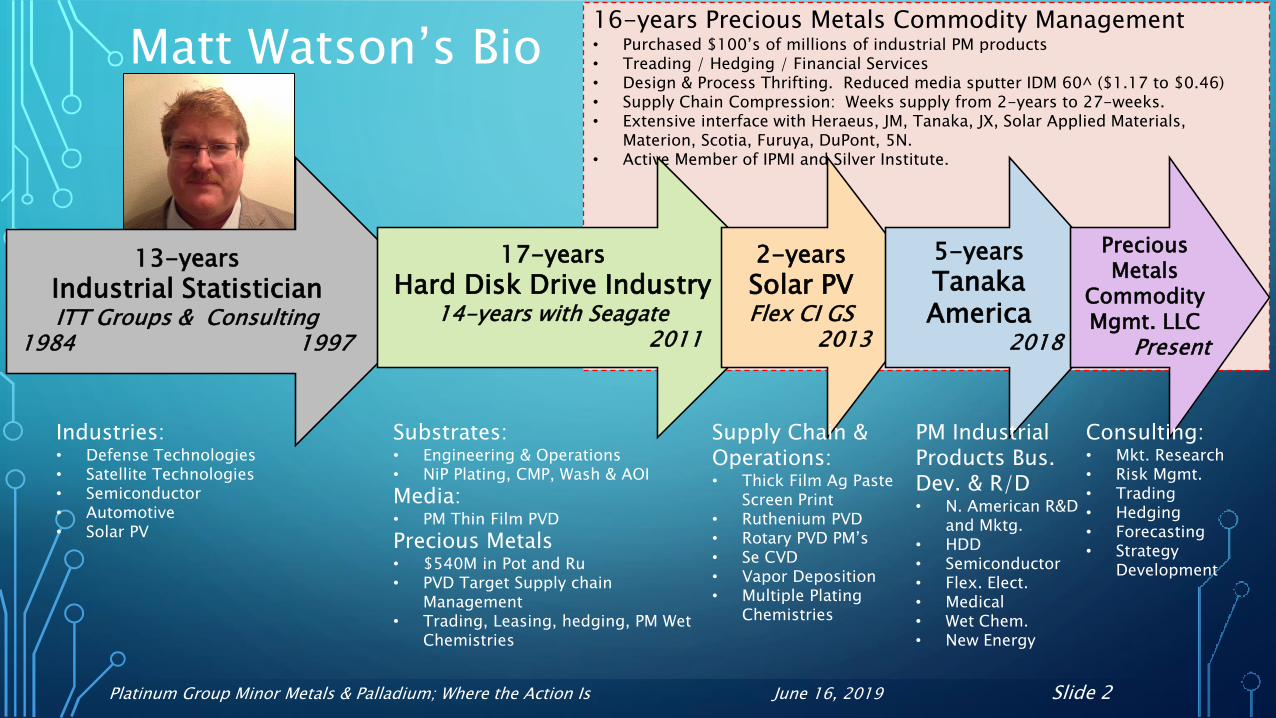
16-years Precious Metals Commodity Management• Purchased $100’s of millions of industrial PM products• Treading / Hedging / Financial Services• Design & Process Thrifting. Reduced media sputter IDM 60^ ($1.17 to $0.46)• Supply Chain Compression: Weeks supply from 2-years to 27-weeks.• Extensive interface with Heraeus, JM, Tanaka, JX, Solar Applied Materials,
Materion, Scotia, Furuya, DuPont, 5N.• Active Member of IPMI and Silver Institute.
Matt Watson’s Bio
13-years
Industrial StatisticianITT Groups & Consulting
1984 1997
Industries:• Defense Technologies• Satellite Technologies• Semiconductor• Automotive• Solar PV
17-years
Hard Disk Drive Industry14-years with Seagate
2011
Substrates:• Engineering & Operations• NiP Plating, CMP, Wash & AOI
Media:• PM Thin Film PVD
Precious Metals• $540M in Pot and Ru• PVD Target Supply chain
Management• Trading, Leasing, hedging, PM Wet
Chemistries
2-years
Solar PVFlex CI GS
2013
Supply Chain & Operations:• Thick Film Ag Paste
Screen Print• Ruthenium PVD• Rotary PVD PM’s• Se CVD• Vapor Deposition• Multiple Plating
Chemistries
5-years
Tanaka America
2018
PM Industrial Products Bus. Dev. & R/D• N. American R&D
and Mktg.• HDD• Semiconductor• Flex. Elect.• Medical• Wet Chem.• New Energy
Precious Metals
Commodity Mgmt. LLC
Present
Consulting:• Mkt. Research• Risk Mgmt.• Trading• Hedging• Forecasting• Strategy
Development
Platinum Group Minor Metals & Palladium; Where the Action Is June 16, 2019 Slide 3
Precious metals Commodity management
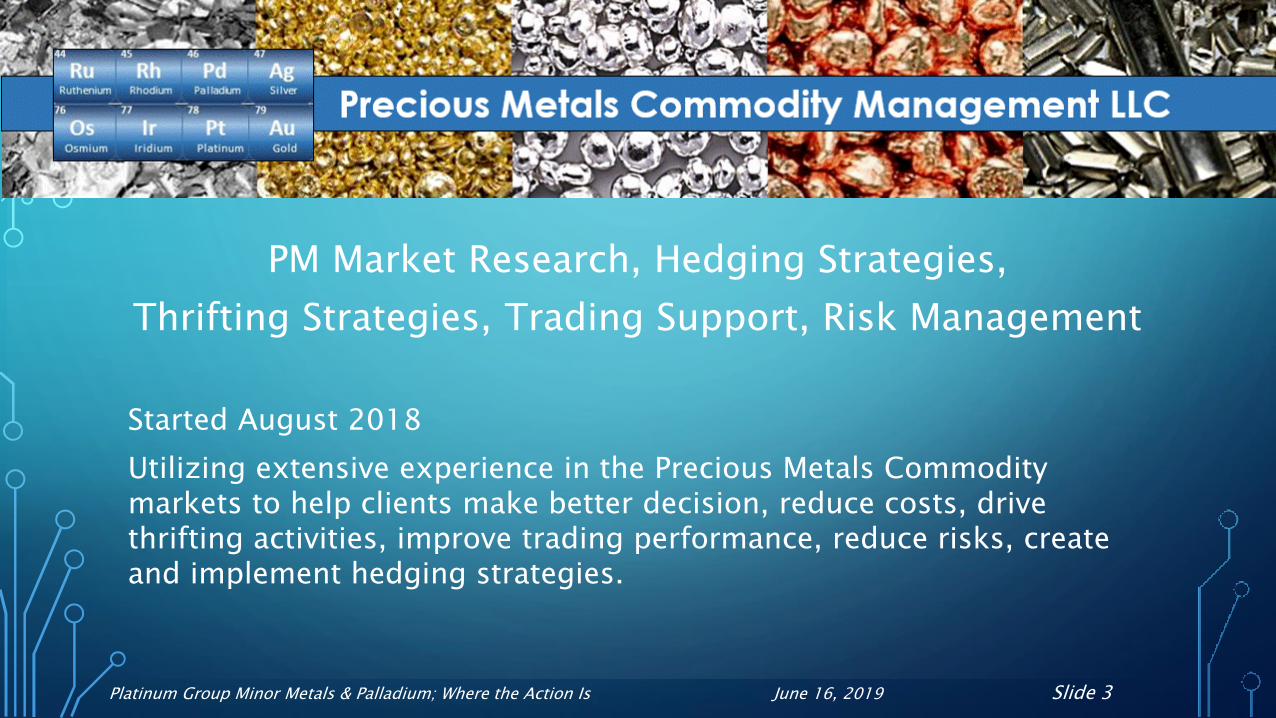
PM Market Research, Hedging Strategies,
Thrifting Strategies, Trading Support, Risk Management
Started August 2018
Utilizing extensive experience in the Precious Metals Commodity markets to help clients make better decision, reduce costs, drive thrifting activities, improve trading performance, reduce risks, create and implement hedging strategies.
Platinum Group Minor Metals & Palladium; Where the Action Is June 16, 2019 Slide 4
-100%
0%
100%
200%
300%
400%
500%
600%
Jan-
17
Apr
-17
Jul-1
7
Oct
-17
Jan-
18
Apr
-18
Jul-1
8
Oct
-18
Jan-
19
Apr
-19
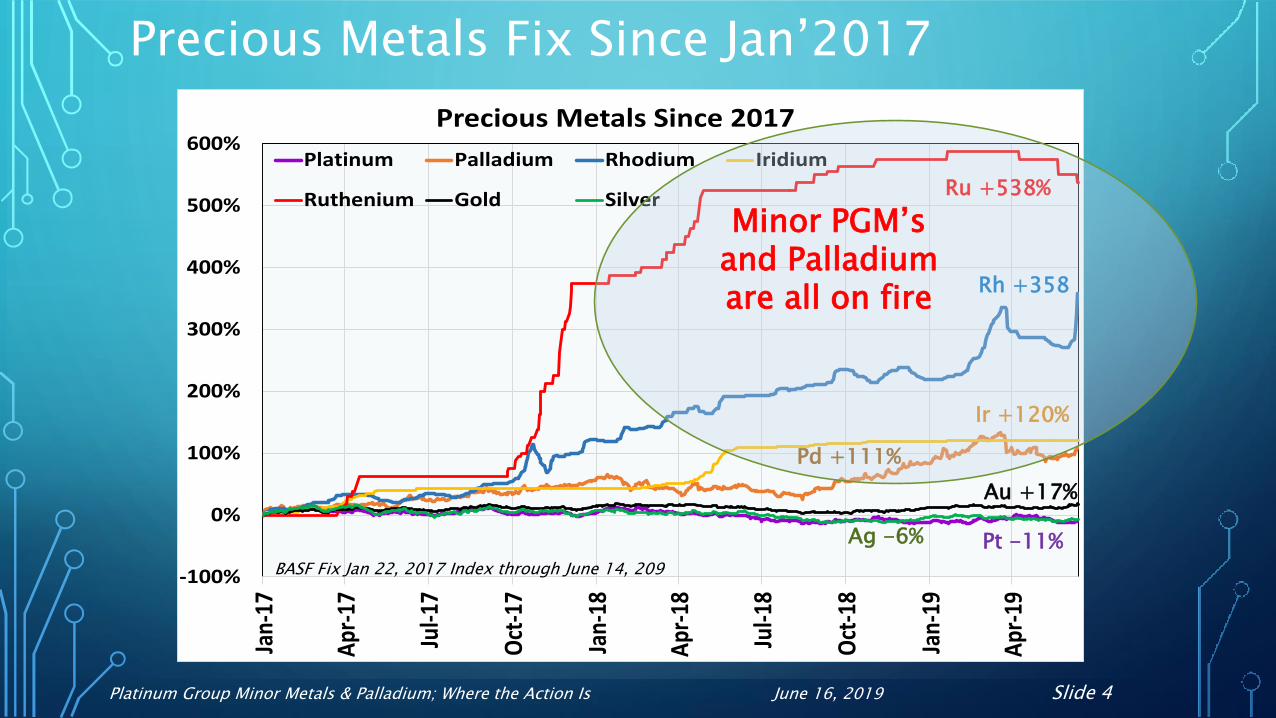
Precious Metals Since 2017
Platinum Palladium Rhodium Iridium
Ruthenium Gold Silver
Ag -6% Pt -11%
Ru +538%
Rh +358
Ir +120%
Pd +111%
Au +17%
Minor PGM’s and Palladium are all on fire
Precious Metals Fix Since Jan’2017
BASF Fix Jan 22, 2017 Index through June 14, 209

Platinum Group Minor Metals & Palladium; Where the Action Is June 16, 2019 Slide 5
-
200
400
600
800
1,000
1,200
20
10
20
11
20
12
20
13
20
14
20
15
20
16
20
17
20
18
20
19
f
Mill
ion
s To
z
Global Mined Precious Metals (Toz)
Gold Silver Platinum Paladium Rhodium Ruthenium Iridium Osmium
Silver #1 Abundance
Gold #2 Abundance
All 6 PGM’s Combined – Trivial Abundance
-
10
20
30
40
50
60
70
80
90
100
2010 2011 2012 2013 2014 2015 2016 2017 2018 2019f
Mil
lio
ns
Toz
Global Precious Metals Recycle (Toz)
Gold Silver Platinum Paladium Rhodium Ruthenium Iridium Osmium
Silver Recycle
Gold Recycle Volume
Mined Volume Recycled Volume
Mined & Recycle Precious Metals Volume
PGM’s Recycle
Platinum Group Minor Metals & Palladium; Where the Action Is June 16, 2019 Slide 6
-
2,000
4,000
6,000
8,000
10,000
12,000
14,000
16,000
18,000
2010 2011 2012 2013 2014 2015 2016 2017 2018 2019f
Tho
usa
nd
s
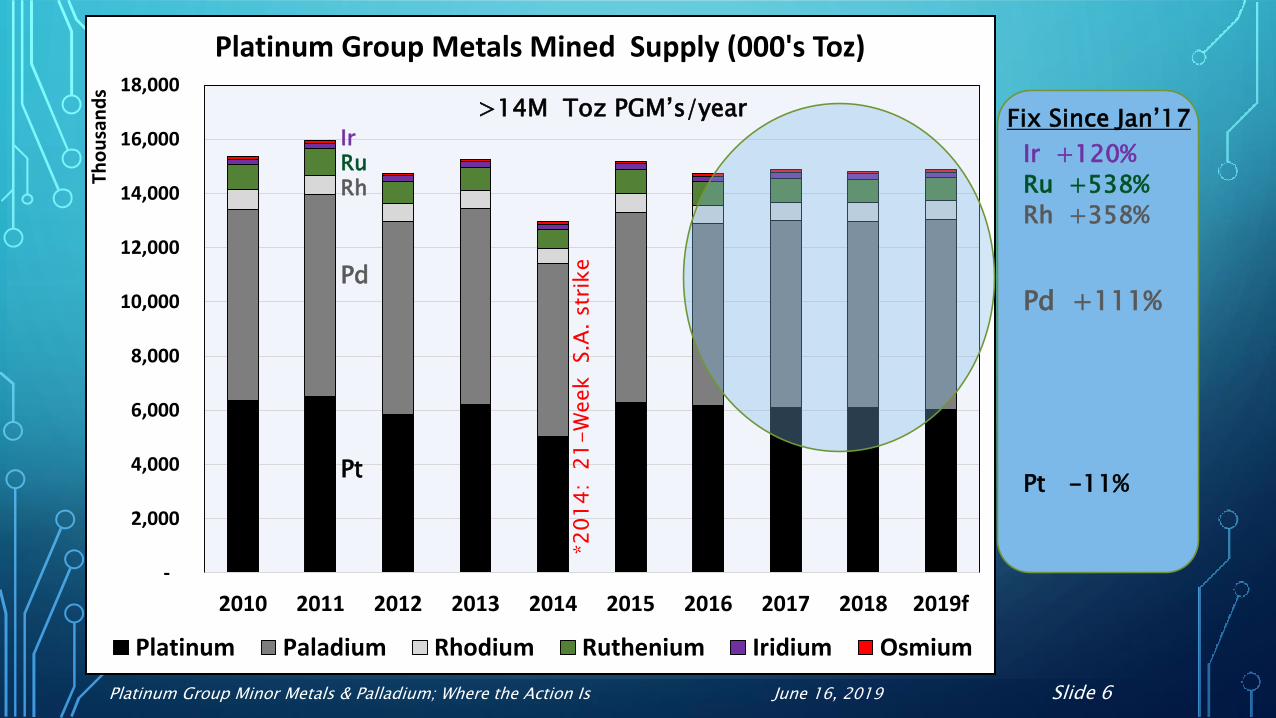
Platinum Group Metals Mined Supply (000's Toz)
Platinum Paladium Rhodium Ruthenium Iridium Osmium
>14M Toz PGM’s/year
*2014:
21
-W
eek
S.A
. str
ike
Pd
RhRuIr
Pt
Pd +111%
Rh +358%
Ru +538%
Ir +120%
Pt -11%
Fix Since Jan’17
Platinum Group Minor Metals & Palladium; Where the Action Is June 16, 2019 Slide 7
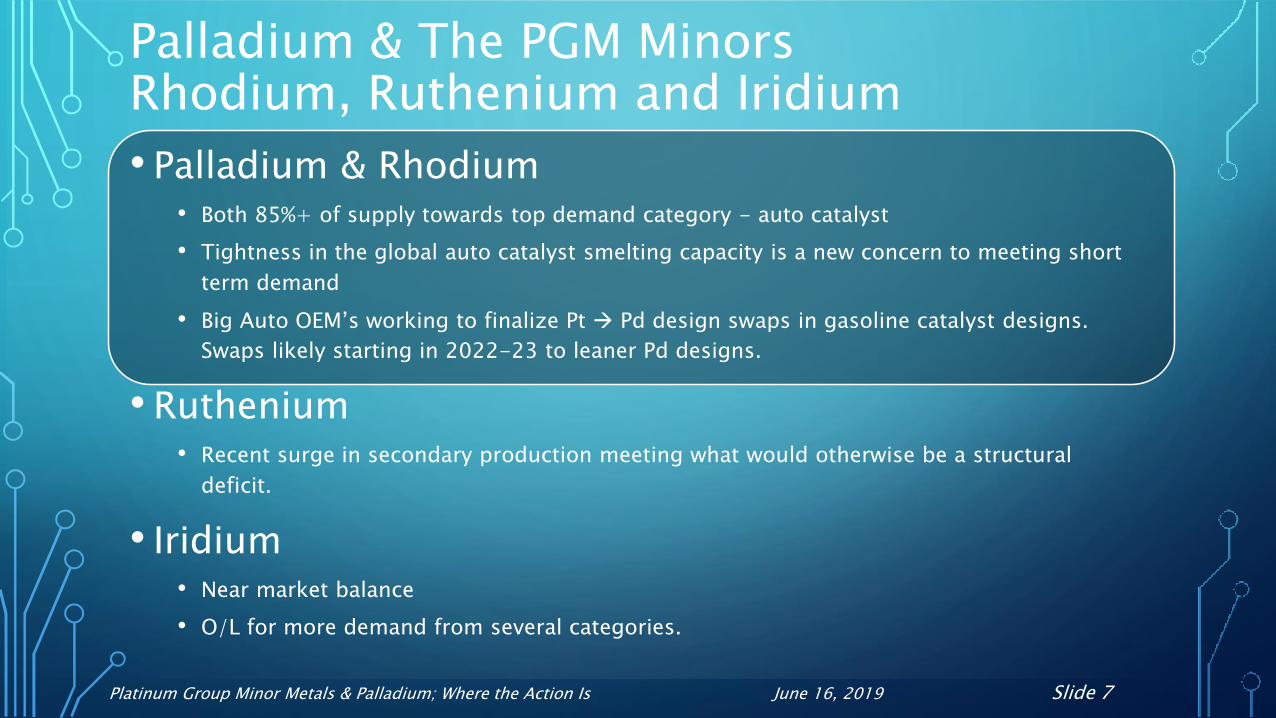
Palladium & The PGM MinorsRhodium, Ruthenium and Iridium
• Palladium & Rhodium• Both 85%+ of supply towards top demand category - auto catalyst
• Tightness in the global auto catalyst smelting capacity is a new concern to meeting short
term demand
• Big Auto OEM’s working to finalize Pt Pd design swaps in gasoline catalyst designs.
Swaps likely starting in 2022-23 to leaner Pd designs.
• Ruthenium • Recent surge in secondary production meeting what would otherwise be a structural
deficit.
• Iridium • Near market balance
• O/L for more demand from several categories.

Platinum Group Minor Metals & Palladium; Where the Action Is June 16, 2019 Slide 8
Previous IPMI Auto Catalyst Seminar Highlights
Increasing vehicle sales over next decade
Tightening vehicle emission standards - continuous
NOx standards are dramatically lower – impacts Rh
Much more stringent RDE (Real World) testing conditions – EU & China
Transition from LDV Diesel to Hybrids (Reduced Pt more Pd), but Hybrids
use 0%-15%+ or more PGM’s
Emerging BEV market (No PGM’s)
PGM Demand Impact
Platinum Group Minor Metals & Palladium; Where the Action Is June 16, 2019 Slide 9
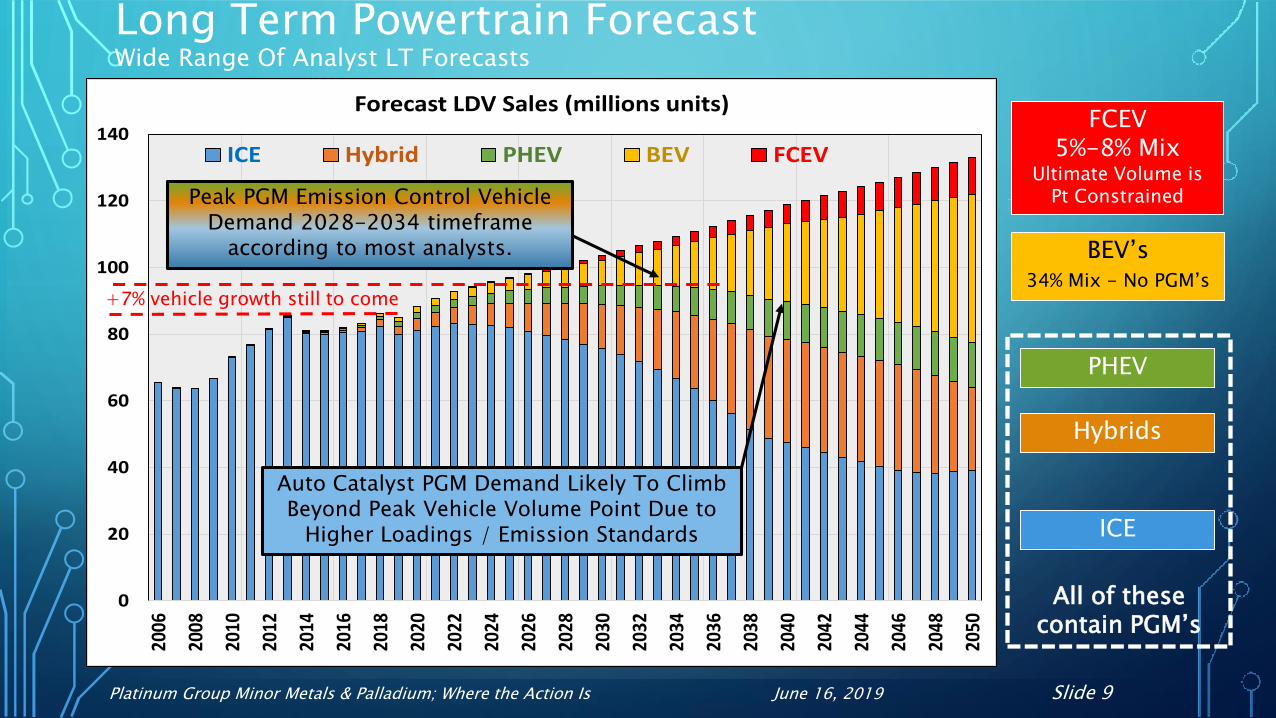
Long Term Powertrain ForecastWide Range Of Analyst LT Forecasts
0
20
40
60
80
100
120
140
2006
2008
2010
2012
2014
2016
2018
2020
2022
2024
2026
2028
2030
2032
2034
2036
2038
2040
2042
2044
2046
2048
2050
Forecast LDV Sales (millions units)
ICE Hybrid PHEV BEV FCEV
FCEV 5%-8% Mix
Ultimate Volume is Pt Constrained
BEV’s 34% Mix - No PGM’s
PHEV
Hybrids
ICE
Auto Catalyst PGM Demand Likely To Climb Beyond Peak Vehicle Volume Point Due to
Higher Loadings / Emission Standards
Peak PGM Emission Control Vehicle Demand 2028-2034 timeframe
according to most analysts.
+7% vehicle growth still to come
All of these contain PGM’s
Platinum Group Minor Metals & Palladium; Where the Action Is June 16, 2019 Slide 10
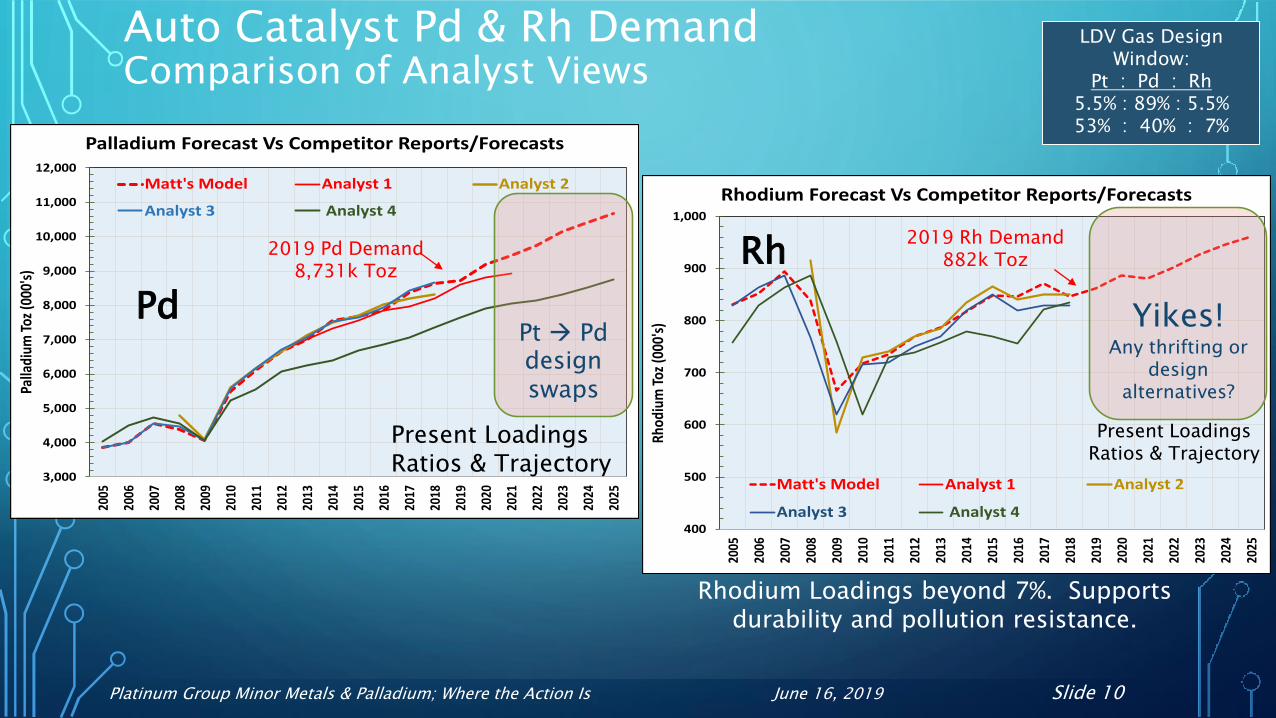
Auto Catalyst Pd & Rh Demand Comparison of Analyst Views
3,000
4,000
5,000
6,000
7,000
8,000
9,000
10,000
11,000
12,000
2005
2006
2007
2008
2009
2010
2011
2012
2013
2014
2015
2016
2017
2018
2019
2020
2021
2022
2023
2024
2025
Palla
dium
Toz
(000
's)
Palladium Forecast Vs Competitor Reports/Forecasts
Matt's Model Analyst 1 Analyst 2
Analyst 3 Analyst 4
LDV Gas Design Window:
Pt : Pd : Rh5.5% : 89% : 5.5%53% : 40% : 7%
Pt Pddesign swaps
Present Loadings Ratios & Trajectory
2019 Pd Demand 8,731k Toz
400
500
600
700
800
900
1,000
2005
2006
2007
2008
2009
2010
2011
2012
2013
2014
2015
2016
2017
2018
2019
2020
2021
2022
2023
2024
2025
Rhod
ium
Toz
(000
's)
Rhodium Forecast Vs Competitor Reports/Forecasts
Matt's Model Analyst 1 Analyst 2
Analyst 3 Analyst 4
Yikes!Any thrifting or
design alternatives?
Present Loadings Ratios & Trajectory
2019 Rh Demand 882k Toz
Pd
Rh
Rhodium Loadings beyond 7%. Supports durability and pollution resistance.
Platinum Group Minor Metals & Palladium; Where the Action Is June 16, 2019 Slide 11
0%
10%
20%
30%
40%
50%
60%
70%
80%
90%
100%
0
200
400
600
800
1,000
1,200
1,400
19
75
19
77
19
79
19
81
19
83
19
85
19
87
19
89
19
91
19
93
19
95
19
97
19
99
20
01
20
03
20
05
20
07
20
09
20
11
20
13
20
15
20
17
20
19
f
20
21
f
20
23
f
20
25
f
Rh
od
ium
De
man
d %
of Su
pp
lyRh
od
ium
Su
pp
ly (
00
0's
To
z)
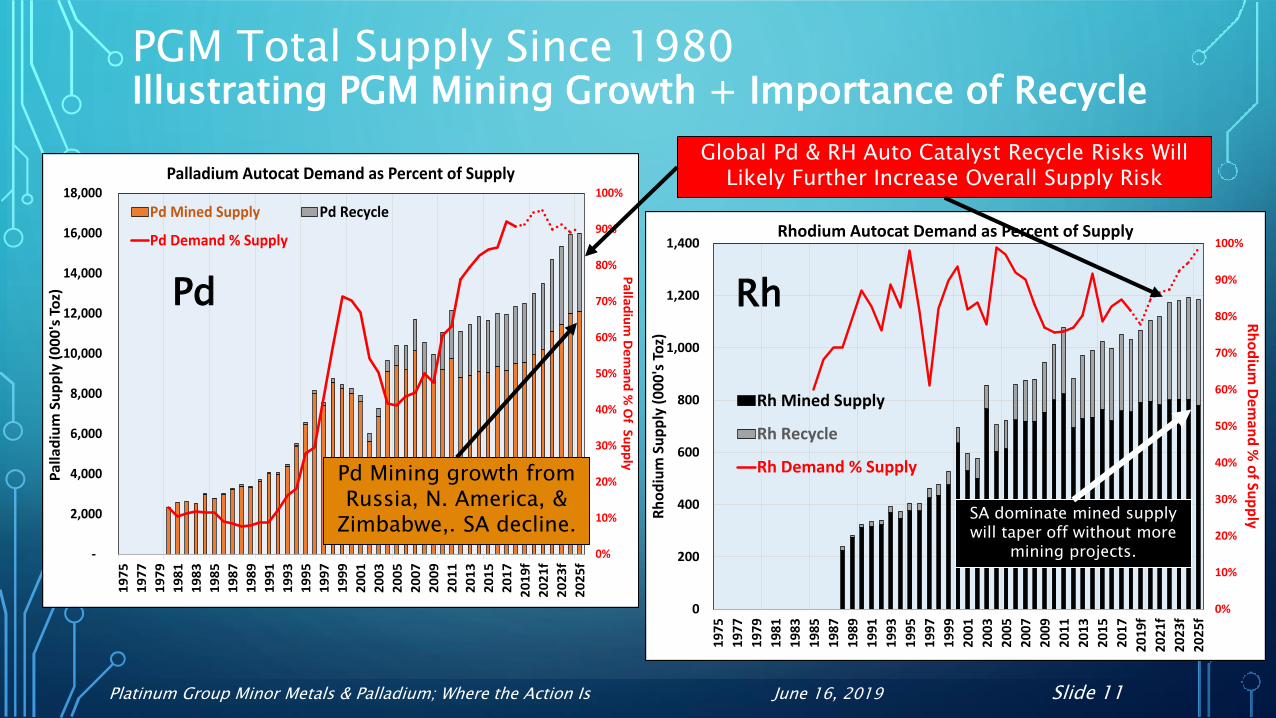
Rhodium Autocat Demand as Percent of Supply
Rh Mined Supply
Rh Recycle
Rh Demand % Supply
PGM Total Supply Since 1980 Illustrating PGM Mining Growth + Importance of Recycle
-
2,000
4,000
6,000
8,000
10,000
12,000
14,000
16,000
18,000
19
75
19
77
19
79
19
81
19
83
19
85
19
87
19
89
19
91
19
93
19
95
19
97
19
99
20
01
20
03
20
05
20
07
20
09
20
11
20
13
20
15
20
17
20
19
f
20
21
f
20
23
f
20
25
f
0%
10%
20%
30%
40%
50%
60%
70%
80%
90%
100%
Pa
lla
diu
m S
up
ply
(0
00
's T
oz)
Pa
llad
ium
De
ma
nd
% O
f Sup
ply
Palladium Autocat Demand as Percent of Supply
Pd Mined Supply Pd Recycle
Pd Demand % Supply
Pd Rh
Pd Mining growth from Russia, N. America, &
Zimbabwe,. SA decline.SA dominate mined supply will taper off without more
mining projects.
Global Pd & RH Auto Catalyst Recycle Risks Will Likely Further Increase Overall Supply Risk
Platinum Group Minor Metals & Palladium; Where the Action Is June 16, 2019 Slide 12
0%
5%
10%
15%
20%
25%
30%
35%
-
1,000
2,000
3,000
4,000
5,000
6,000
7,000
2013
2014
2015
2016
2017
2018
2019
2020
2021
2022
2023
2024
2025
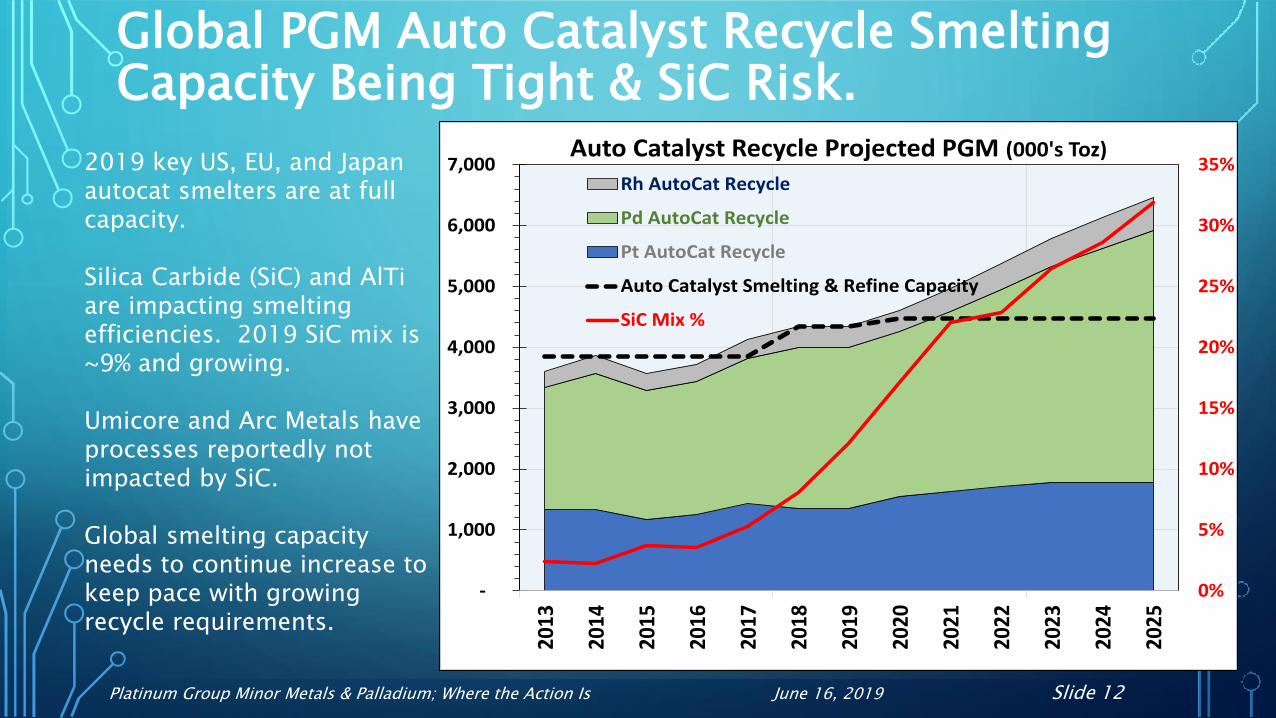
Auto Catalyst Recycle Projected PGM (000's Toz)
Rh AutoCat Recycle
Pd AutoCat Recycle
Pt AutoCat Recycle
Auto Catalyst Smelting & Refine Capacity
SiC Mix %
Global PGM Auto Catalyst Recycle Smelting Capacity Being Tight & SiC Risk.
2019 key US, EU, and Japan autocat smelters are at full capacity.
Silica Carbide (SiC) and AlTiare impacting smelting efficiencies. 2019 SiC mix is ~9% and growing.
Umicore and Arc Metals have processes reportedly not impacted by SiC.
Global smelting capacity needs to continue increase to keep pace with growing recycle requirements.
Platinum Group Minor Metals & Palladium; Where the Action Is June 16, 2019 Slide 13
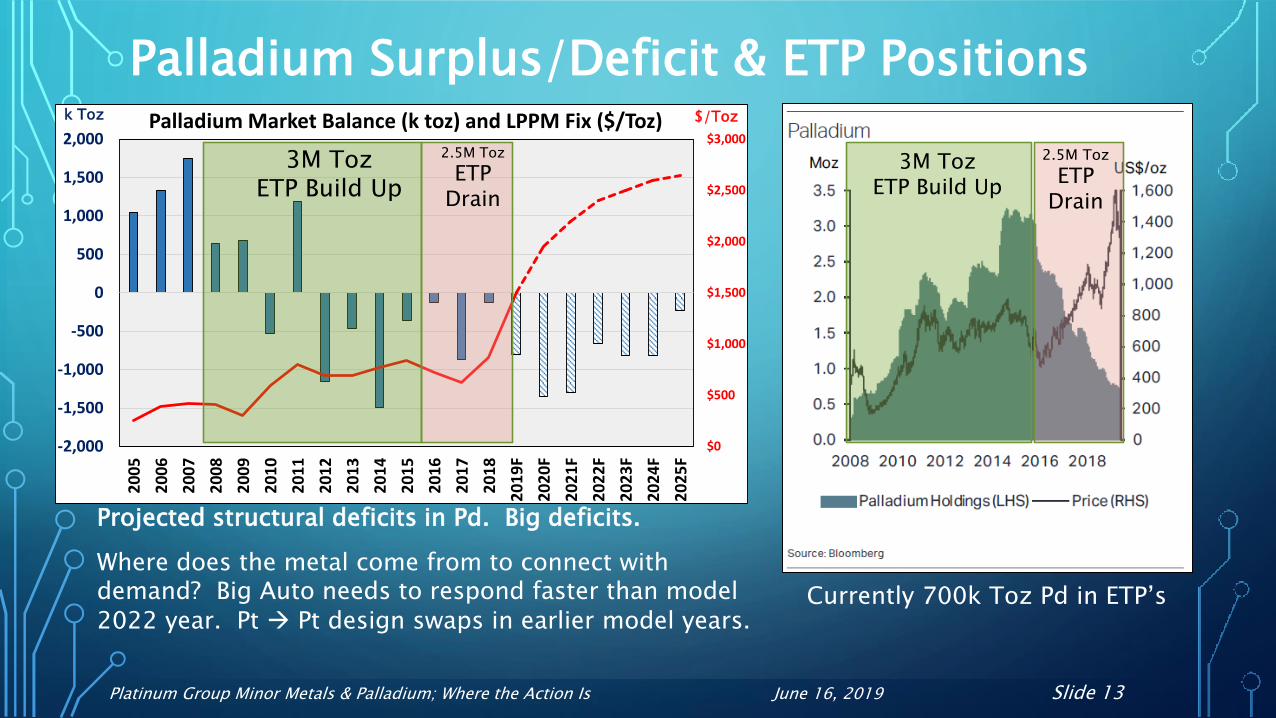
Palladium Surplus/Deficit & ETP Positions
Currently 700k Toz Pd in ETP’s
Projected structural deficits in Pd. Big deficits.
Where does the metal come from to connect with demand? Big Auto needs to respond faster than model 2022 year. Pt Pt design swaps in earlier model years.
$0
$500
$1,000
$1,500
$2,000
$2,500
$3,000
-2,000
-1,500
-1,000
-500
0
500
1,000
1,500
2,0002
00
5
20
06
20
07
20
08
20
09
20
10
20
11
20
12
20
13
20
14
20
15
20
16
20
17
20
18
20
19
F
20
20
F
20
21
F
20
22
F
20
23
F
20
24
F
20
25
F
Palladium Market Balance (k toz) and LPPM Fix ($/Toz)
3M TozETP Build Up
2.5M Toz
ETP Drain
2.5M Toz
ETP Drain
3M TozETP Build Up
$/Tozk Toz
Platinum Group Minor Metals & Palladium; Where the Action Is June 16, 2019 Slide 14
$0
$1,000
$2,000
$3,000
$4,000
$5,000
$6,000
$7,000
(350)
(300)
(250)
(200)
(150)
(100)
(50)
-
50
100
1502
00
1
20
02
20
03
20
04
20
05
20
06
20
07
20
08
20
09
20
10
20
11
20
12
20
13
20
14
20
15
20
16
20
17
20
18
20
19
F
20
20
F
20
21
F
20
22
F
20
23
F
20
24
F
20
25
F
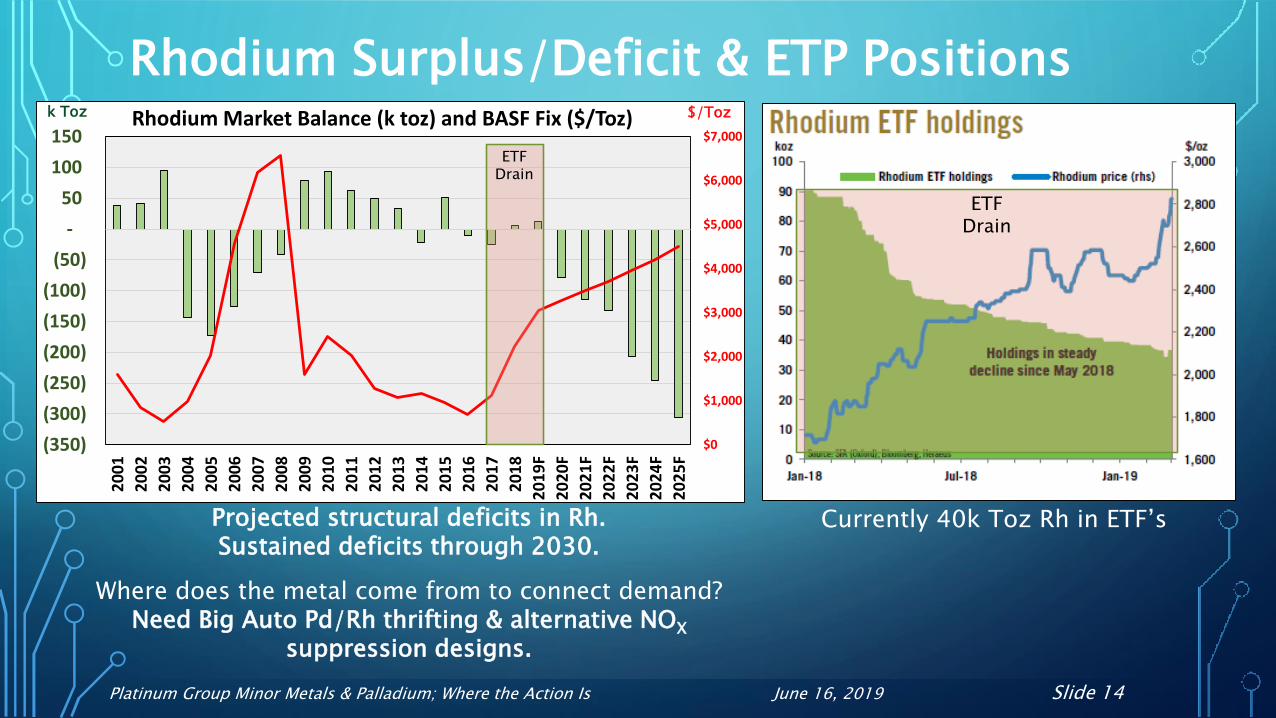
Rhodium Market Balance (k toz) and BASF Fix ($/Toz)
Rhodium Surplus/Deficit & ETP Positions
Currently 40k Toz Rh in ETF’sProjected structural deficits in Rh. Sustained deficits through 2030.
Where does the metal come from to connect demand? Need Big Auto Pd/Rh thrifting & alternative NOX
suppression designs.
$/Tozk Toz
ETFDrain
ETFDrain
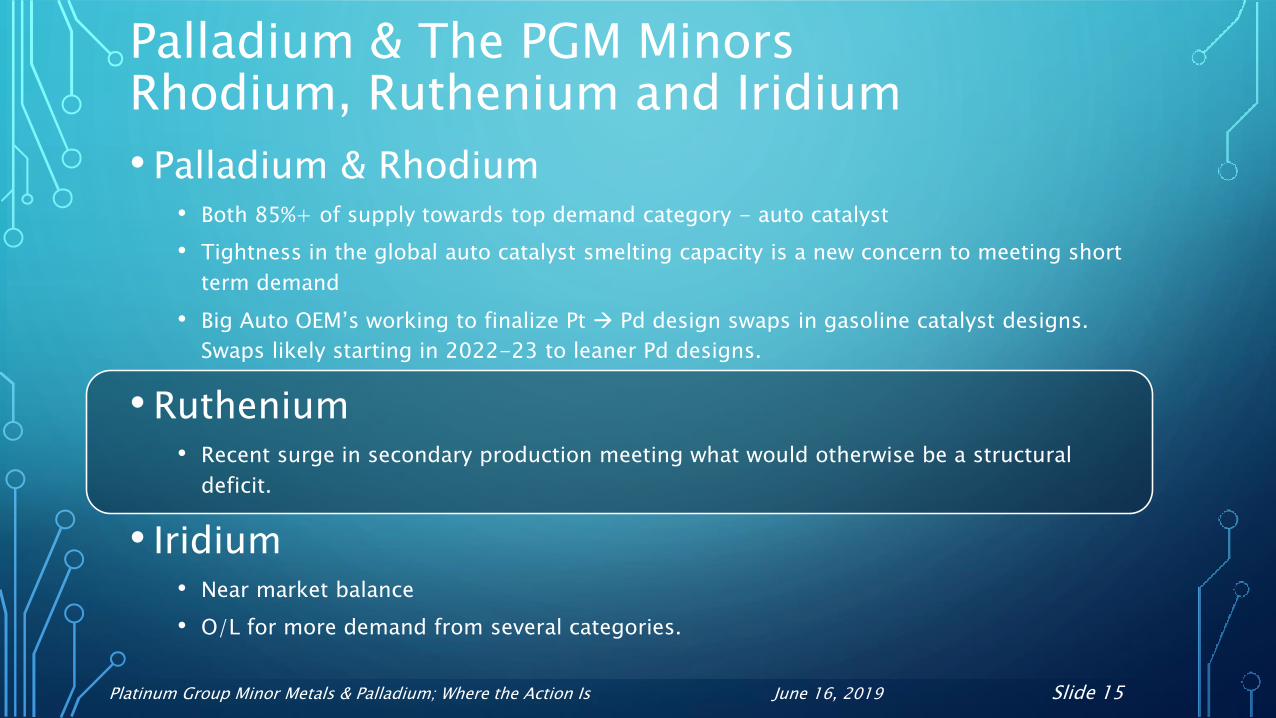
Platinum Group Minor Metals & Palladium; Where the Action Is June 16, 2019 Slide 15
Palladium & The PGM MinorsRhodium, Ruthenium and Iridium
• Palladium & Rhodium• Both 85%+ of supply towards top demand category - auto catalyst
• Tightness in the global auto catalyst smelting capacity is a new concern to meeting short
term demand
• Big Auto OEM’s working to finalize Pt Pd design swaps in gasoline catalyst designs.
Swaps likely starting in 2022-23 to leaner Pd designs.
• Ruthenium • Recent surge in secondary production meeting what would otherwise be a structural
deficit.
• Iridium • Near market balance
• O/L for more demand from several categories.

Platinum Group Minor Metals & Palladium; Where the Action Is June 16, 2019 Slide 16
S. African Bushveld Complex
Rustenberg
Kroondall
Mototolo
Marula
Lease Area
Planned slowdown 2020-2027 leading to EOL maintenance mode
Most near term EOL slowdowns and shutdowns on UG2 Reef
Prill Table Reef Summary
Prill Table Reef SummaryTwo new S. African mines by 2025
Zimbabwe low minor PGM content too.
1 : 4.2
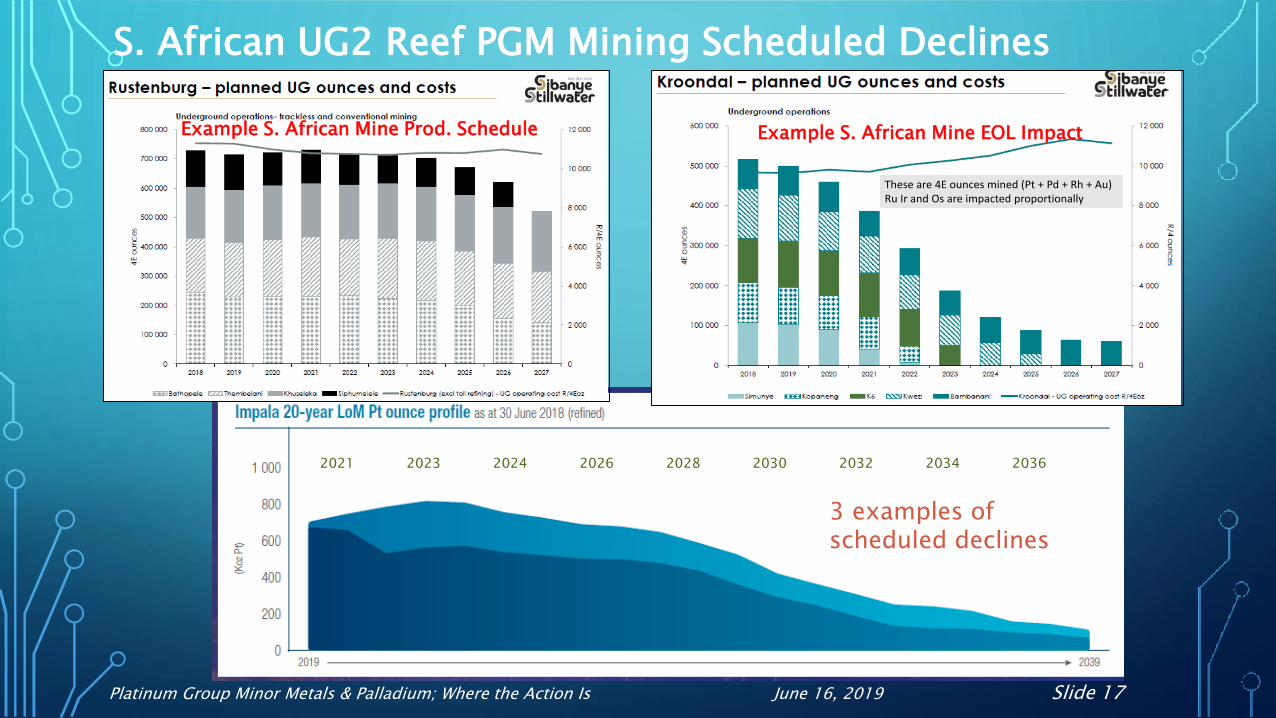
Platinum Group Minor Metals & Palladium; Where the Action Is June 16, 2019 Slide 17
These are 4E ounces mined (Pt + Pd + Rh + Au)Ru Ir and Os are impacted proportionally
S. African UG2 Reef PGM Mining Scheduled Declines
Example S. African Mine EOL ImpactExample S. African Mine Prod. Schedule
2021 2023 2024 2026 2028 2030 2032 2034 2036
3 examples of scheduled declines
Platinum Group Minor Metals & Palladium; Where the Action Is June 16, 2019 Slide 18
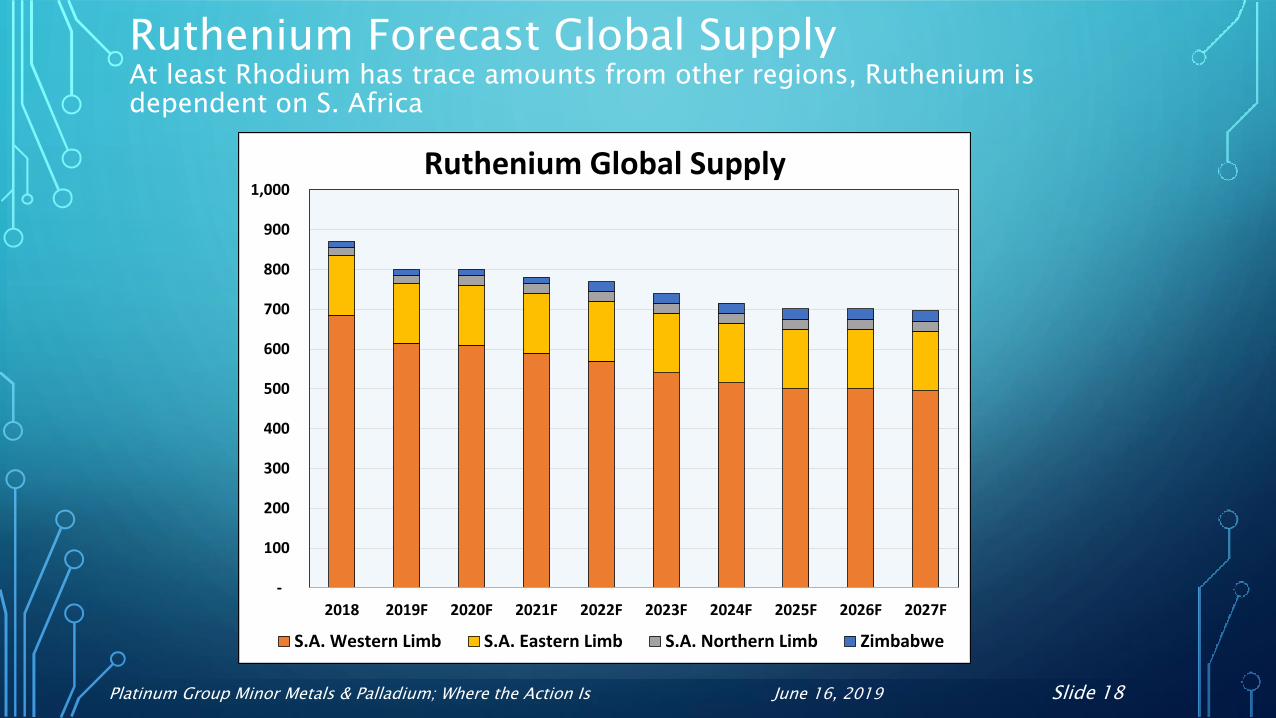
Ruthenium Forecast Global SupplyAt least Rhodium has trace amounts from other regions, Ruthenium is dependent on S. Africa
-
100
200
300
400
500
600
700
800
900
1,000
2018 2019F 2020F 2021F 2022F 2023F 2024F 2025F 2026F 2027F
Ruthenium Global Supply
S.A. Western Limb S.A. Eastern Limb S.A. Northern Limb Zimbabwe
Platinum Group Minor Metals & Palladium; Where the Action Is June 16, 2019 Slide 19
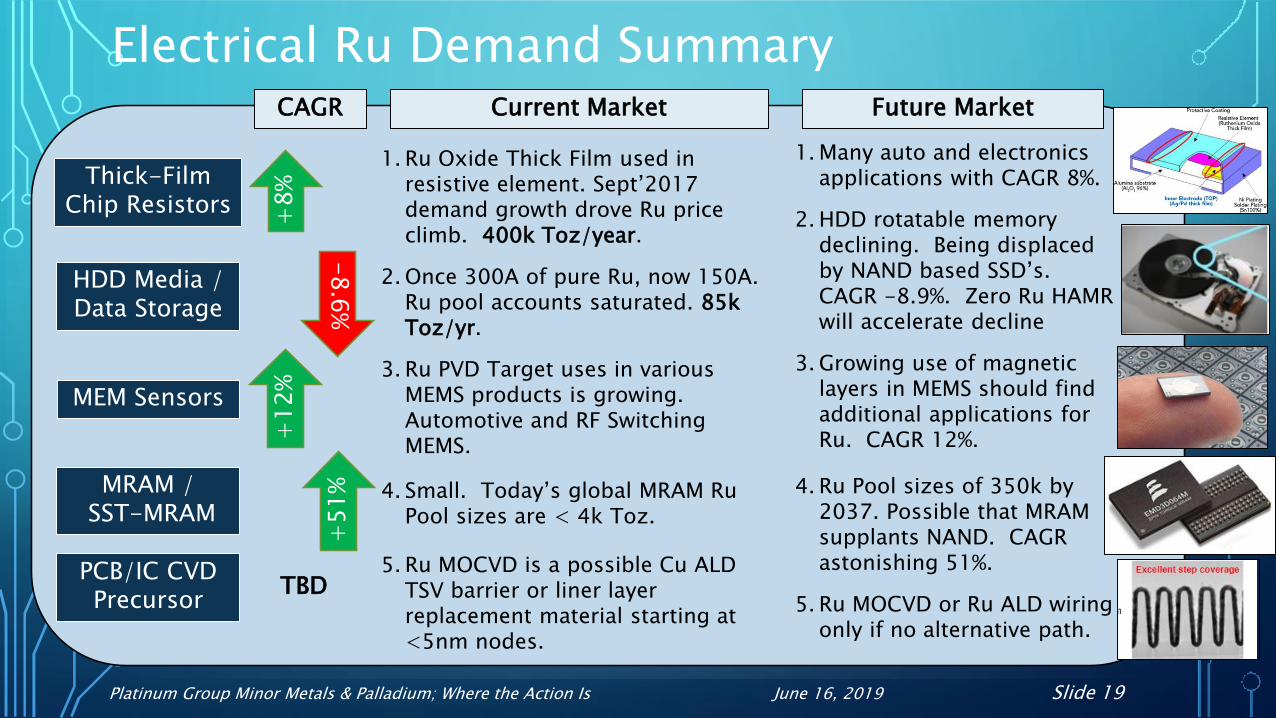
Electrical Ru Demand Summary
-8
.6%
+8
%+
12
%
Thick-Film Chip Resistors
MEM Sensors
HDD Media / Data Storage
MRAM /SST-MRAM
Current Market Future MarketCAGR
1. Ru Oxide Thick Film used in resistive element. Sept’2017 demand growth drove Ru price climb. 400k Toz/year.
2. Once 300A of pure Ru, now 150A. Ru pool accounts saturated. 85k Toz/yr.
3. Ru PVD Target uses in various MEMS products is growing. Automotive and RF Switching MEMS.
4. Small. Today’s global MRAM Ru Pool sizes are < 4k Toz.
5. Ru MOCVD is a possible Cu ALD TSV barrier or liner layer replacement material starting at <5nm nodes.
1. Many auto and electronics applications with CAGR 8%.
2. HDD rotatable memory declining. Being displaced by NAND based SSD’s. CAGR -8.9%. Zero Ru HAMR will accelerate decline
3. Growing use of magnetic layers in MEMS should find additional applications for Ru. CAGR 12%.
4. Ru Pool sizes of 350k by 2037. Possible that MRAM supplants NAND. CAGR astonishing 51%.
5. Ru MOCVD or Ru ALD wiring only if no alternative path.
+5
1%
PCB/IC CVD Precursor
TBD

Platinum Group Minor Metals & Palladium; Where the Action Is June 16, 2019 Slide 20
Ruthenium Price History – Why Did this Happen?
HDD PMR Transition
HDD Pure Ru Refill
Transition
Ru Thick Film Resistor Boom 2027
Platinum Group Minor Metals & Palladium; Where the Action Is June 16, 2019 Slide 21
-
200
400
600
800
1,000
1,200
1,400
2005
2006
2007
2008
2009
2010
2011
2012
2013
2014
2015
2016
2017
2018
2019
f
2020
f
2021
f
2022
f
2023
f
2024
f
2025
f
2026
f
2027
f
2028
f
Thou
sand
s
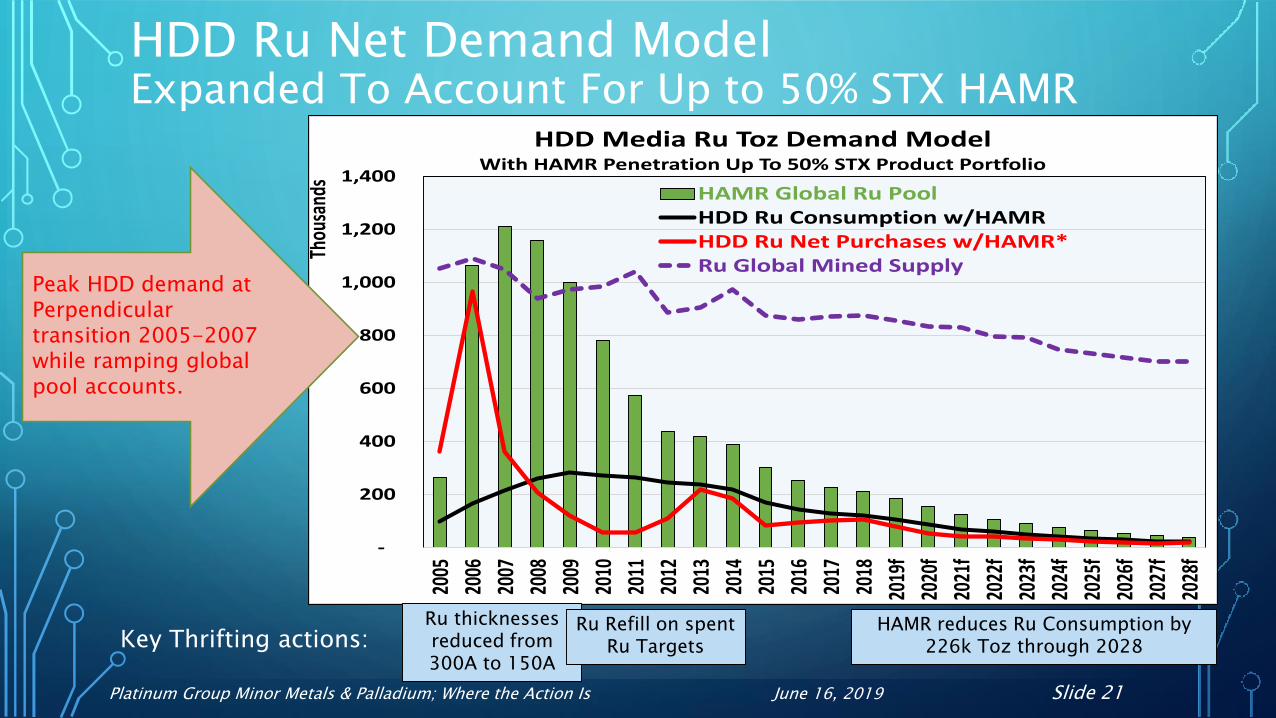
HDD Media Ru Toz Demand ModelWith HAMR Penetration Up To 50% STX Product Portfolio
HAMR Global Ru PoolHDD Ru Consumption w/HAMRHDD Ru Net Purchases w/HAMR*Ru Global Mined Supply
HDD Ru Net Demand Model Expanded To Account For Up to 50% STX HAMR
HAMR reduces Ru Consumption by 226k Toz through 2028
Peak HDD demand at Perpendicular transition 2005-2007 while ramping global pool accounts.
Ru thicknesses reduced from 300A to 150A
Ru Refill on spent Ru TargetsKey Thrifting actions:
Platinum Group Minor Metals & Palladium; Where the Action Is June 16, 2019 Slide 22
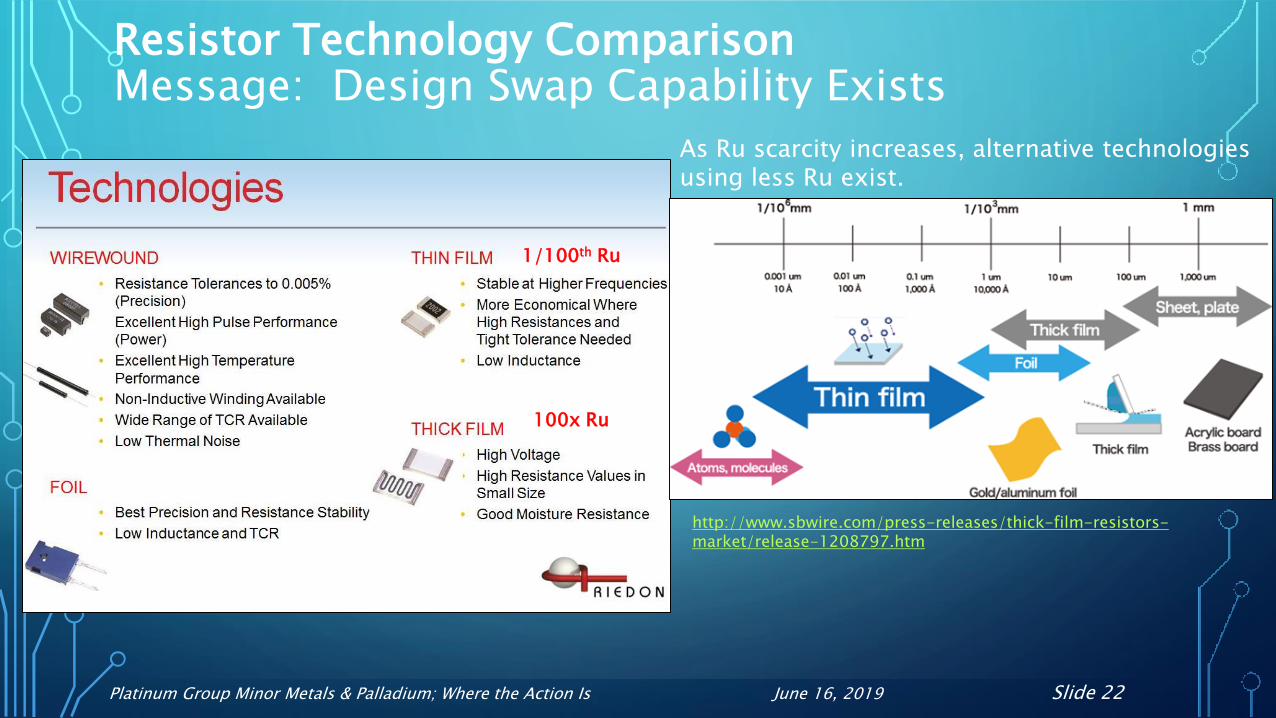
Resistor Technology ComparisonMessage: Design Swap Capability Exists
http://www.sbwire.com/press-releases/thick-film-resistors-market/release-1208797.htm
1/100th Ru
100x Ru
As Ru scarcity increases, alternative technologies using less Ru exist.

Platinum Group Minor Metals & Palladium; Where the Action Is June 16, 2019 Slide 23
Chemical Ru Demand Summary
+8
%+
9%
Caprolactam / Nylon
Acetic Acid
Current Market Future MarketCAGR
1. Demand for compound is ~5 million tons per year, and the vast majority is used to make Nylon 6 filament, fiber, and plastics.
2. Acetic acid demand is 17,808 kilo metric tones in 2019. Used in rubber, plastics, pharmaceutical, construction, paint & other app’s.
3. Ammonia synthesize using Ru NanoParticle Catalyst.
4. Catalyst used in electrolysis for hydrogen production.
1. $14.9 billion by 2019, CAGR 8.1% through 2022 with increasing auto, CE and electronic applications.
2. $11.6 billion by 2019 with CAGR of 8.7%. One risk of decline is the environmental efforts to reduce plastics.
3. Significant technology conversion for cost will grow this application 9% CAGR.
4. $200 billion by 2025 @ 6.1% CAGR. Upside growth possible.
Ammonia Catalyst +
9%
Ru Catalyst
H2 Electrolysis Catalyst
+6%
Platinum Group Minor Metals & Palladium; Where the Action Is June 16, 2019 Slide 24
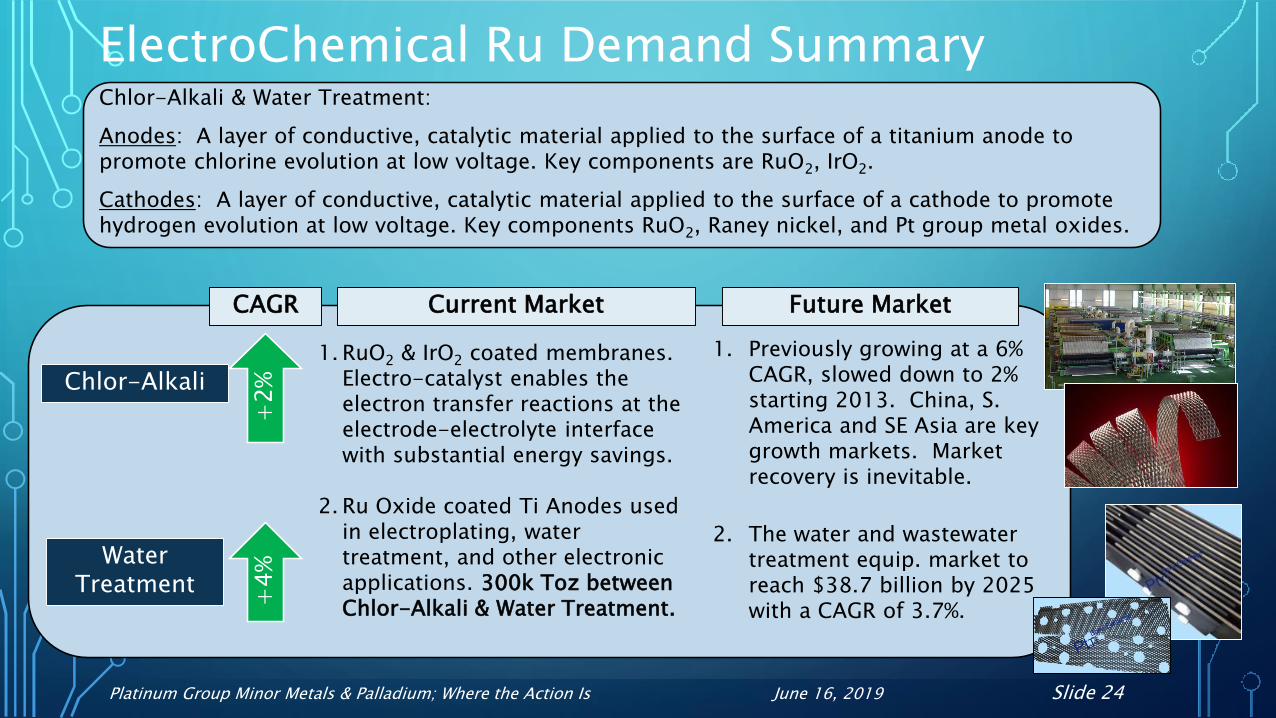
ElectroChemical Ru Demand Summary
+2
%+
4%
Chlor-Alkali
Chlor-Alkali & Water Treatment:
Anodes: A layer of conductive, catalytic material applied to the surface of a titanium anode to promote chlorine evolution at low voltage. Key components are RuO2, IrO2.
Cathodes: A layer of conductive, catalytic material applied to the surface of a cathode to promote hydrogen evolution at low voltage. Key components RuO2, Raney nickel, and Pt group metal oxides.
Water Treatment
Current Market Future MarketCAGR
1. RuO2 & IrO2 coated membranes. Electro-catalyst enables the electron transfer reactions at the electrode-electrolyte interface with substantial energy savings.
2. Ru Oxide coated Ti Anodes used in electroplating, water treatment, and other electronic applications. 300k Toz between Chlor-Alkali & Water Treatment.
1. Previously growing at a 6% CAGR, slowed down to 2% starting 2013. China, S. America and SE Asia are key growth markets. Market recovery is inevitable.
2. The water and wastewater treatment equip. market to reach $38.7 billion by 2025 with a CAGR of 3.7%.
Platinum Group Minor Metals & Palladium; Where the Action Is June 16, 2019 Slide 25
Ruthenium Supply/Demand Trend
-500
0
500
1,000
1,500
2,000
2001
2002
2003
2004
2005
2006
2007
2008
2009
2010
2011
2012
2013
2014
2015
2016
2017
2018
2019
F
2020
F
2021
F
2022
F
2023
F
2024
F
2025
F
2026
F
2027
F
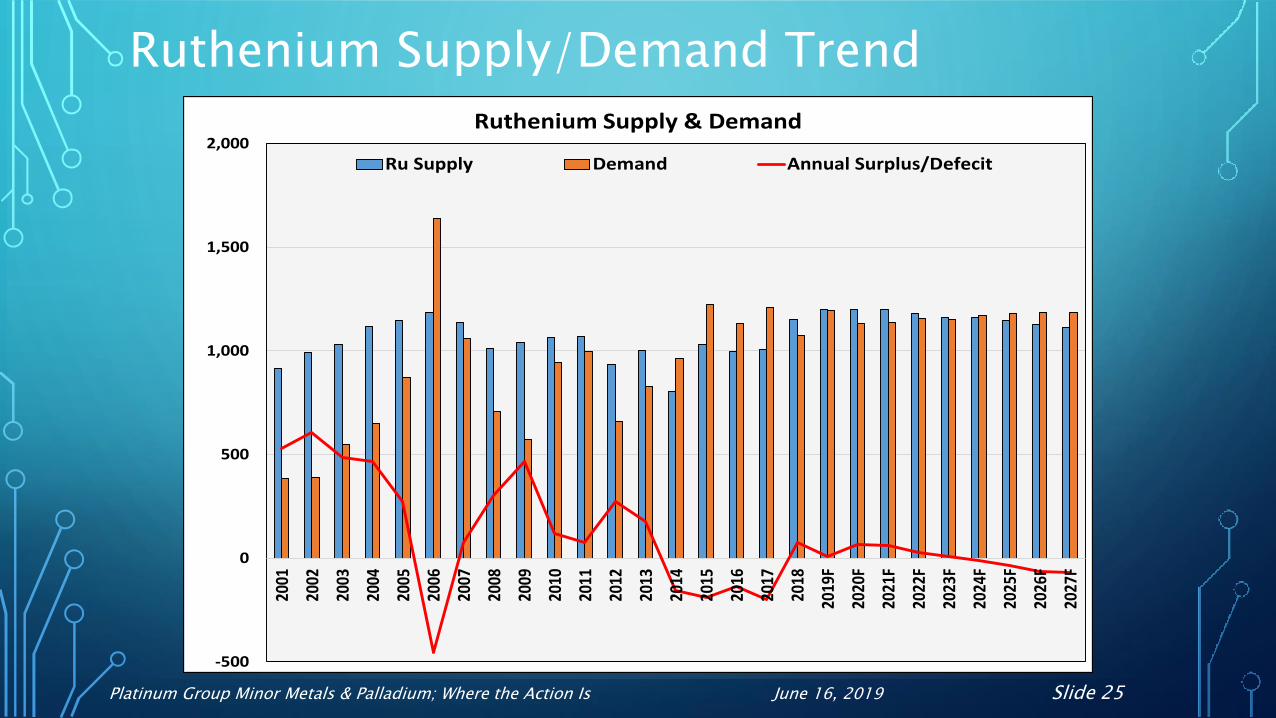
Ruthenium Supply & Demand
Ru Supply Demand Annual Surplus/Defecit

Platinum Group Minor Metals & Palladium; Where the Action Is June 16, 2019 Slide 26
Ruthenium – Why Such Liquid Physical Supply?
• Several large PGM trading firms with on-hand inventories of Ru.
1. Growing industrial demand
2. Oct’2017 Thick Film Resistors surge.
3. Dec’2017 surge in Japan industrial Ru buys.
4. Secondary Ru Refine Expansion and Movement of excess Ru positions.
5. Mined concentrate refining in Japan
12
3
45
Platinum Group Minor Metals & Palladium; Where the Action Is June 16, 2019 Slide 27
Ru Market Complication: 2017-18 HDD Ru Target Supply Chain Realignment
• Ruthenium PVD Target Market Disruption
• Exit Heraeus Tuas Singapore HDD Target Div. – sold Chinese firm Vital.
• Solar Applied Materials Technology - $100M financial loss, reset of the
business and management team. Is it worth it to do business with
Solar?
• Furuya Metals – sudden dominate sole source with capacity limits and
unwillingness to support some Ru Alloys.
• Need for Ru Refill on pure Ru for cost/thrifting.
• Tanaka Tsukuba factory entry into the Ru Alloy PVD market.
• Materion re-entry into limited HDD Ru target support.
• Materion suffered from a devastating Ru Refine Si Contamination
issue in 2007/8.
#1
HDD Ru PVD Secondary RefineMoving The Lawn Chairs
Platinum Group Minor Metals & Palladium; Where the Action Is June 16, 2019 Slide 28
0
500,000
1,000,000
1,500,000
2,000,000
2,500,000
3,000,000
3,500,000
4,000,000
2000
2001
2002
2003
2004
2005
2006
2007
2008
2009
2010
2011
2012
2013
2014
2015
2016
2017
2018
2019
F
2020
F
2021
F
2022
F
2023
F
2024
F
2025
F
2026
F
2027
F
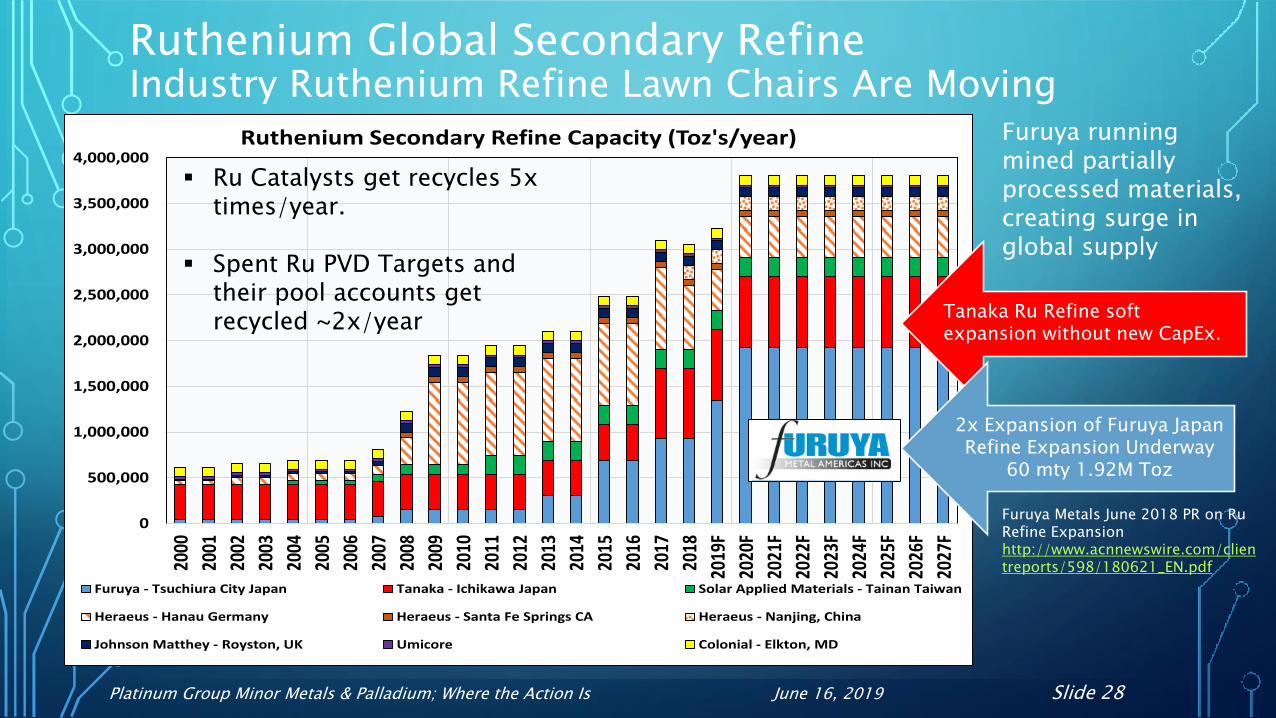
Ruthenium Secondary Refine Capacity (Toz's/year)
Furuya - Tsuchiura City Japan Tanaka - Ichikawa Japan Solar Applied Materials - Tainan Taiwan
Heraeus - Hanau Germany Heraeus - Santa Fe Springs CA Heraeus - Nanjing, China
Johnson Matthey - Royston, UK Umicore Colonial - Elkton, MD
Ruthenium Global Secondary RefineIndustry Ruthenium Refine Lawn Chairs Are Moving
Tanaka Ru Refine soft expansion without new CapEx.
2x Expansion of Furuya Japan Refine Expansion Underway
60 mty 1.92M Toz
Ru Catalysts get recycles 5x times/year.
Spent Ru PVD Targets and their pool accounts get recycled ~2x/year
Furuya Metals June 2018 PR on Ru Refine Expansionhttp://www.acnnewswire.com/clientreports/598/180621_EN.pdf
Furuya running mined partially processed materials, creating surge in global supply
Platinum Group Minor Metals & Palladium; Where the Action Is June 16, 2019 Slide 29
(500)
-
500
1,000
1,500
2,000
2,500
3,000
3,500
4,000
4,500
2001
2002
2003
2004
2005
2006
2007
2008
2009
2010
2011
2012
2013
2014
2015
2016
2017
2018
2019
F
2020
F
2021
F
2022
F
2023
F
2024
F
2025
F
2026
F
2027
F
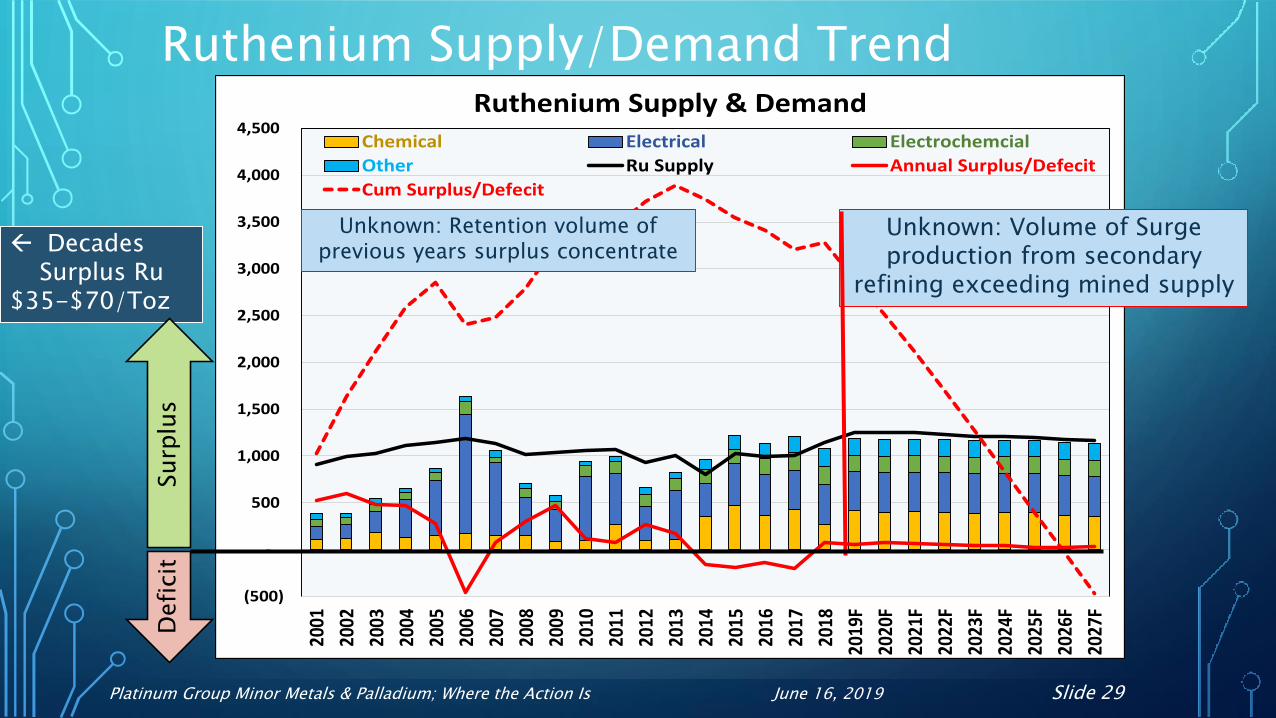
Ruthenium Supply & Demand
Chemical Electrical Electrochemcial
Other Ru Supply Annual Surplus/Defecit
Cum Surplus/Defecit
Ruthenium Supply/Demand Trend
Unknown: Volume of Surge production from secondary
refining exceeding mined supply
Unknown: Retention volume of previous years surplus concentrate Decades
Surplus Ru$35-$70/Toz
Defi
cit
Surp
lus
Platinum Group Minor Metals & Palladium; Where the Action Is June 16, 2019 Slide 30
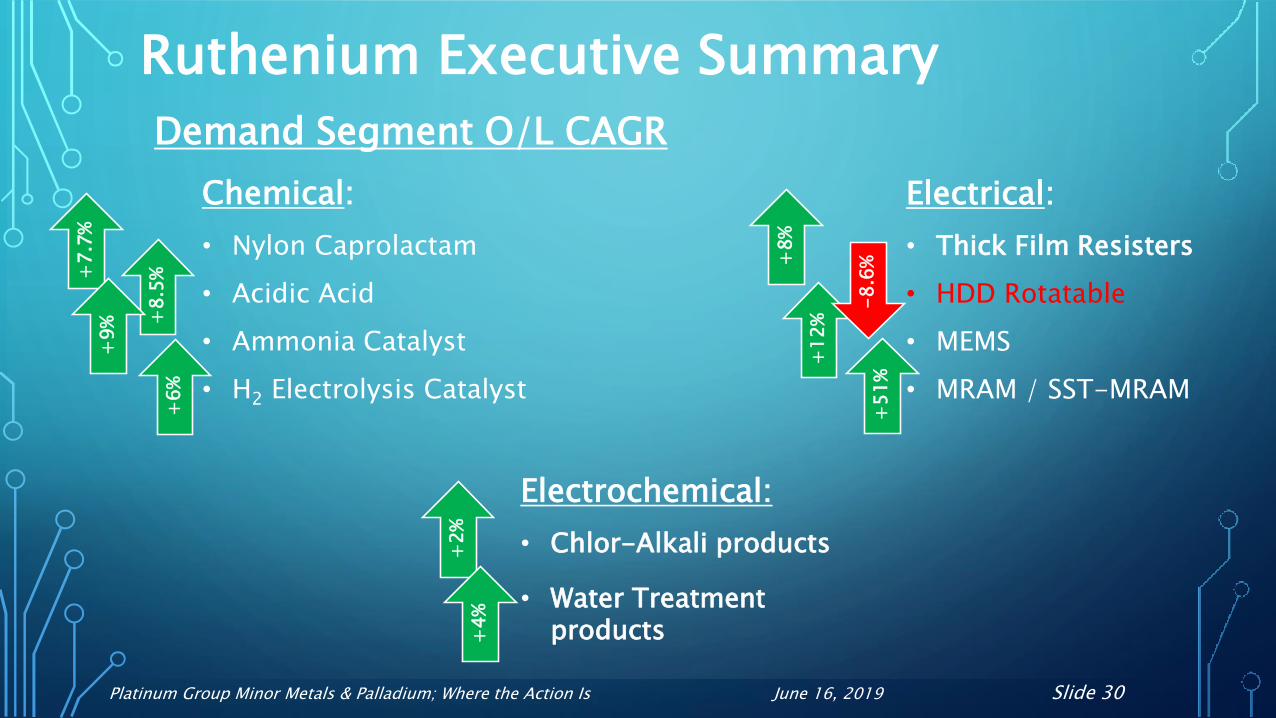
Ruthenium Executive Summary+
7.7
%
Electrical:
• Thick Film Resisters
• HDD Rotatable
• MEMS
• MRAM / SST-MRAM
+8
.5%
+8
%
+1
2%
-8
.6%
+5
1%
+9
%
Demand Segment O/L CAGR
Chemical:
• Nylon Caprolactam
• Acidic Acid
• Ammonia Catalyst
• H2 Electrolysis Catalyst
Electrochemical:
• Chlor-Alkali products
• Water Treatment products
+6
%
+2
%+
4%
Platinum Group Minor Metals & Palladium; Where the Action Is June 16, 2019 Slide 31
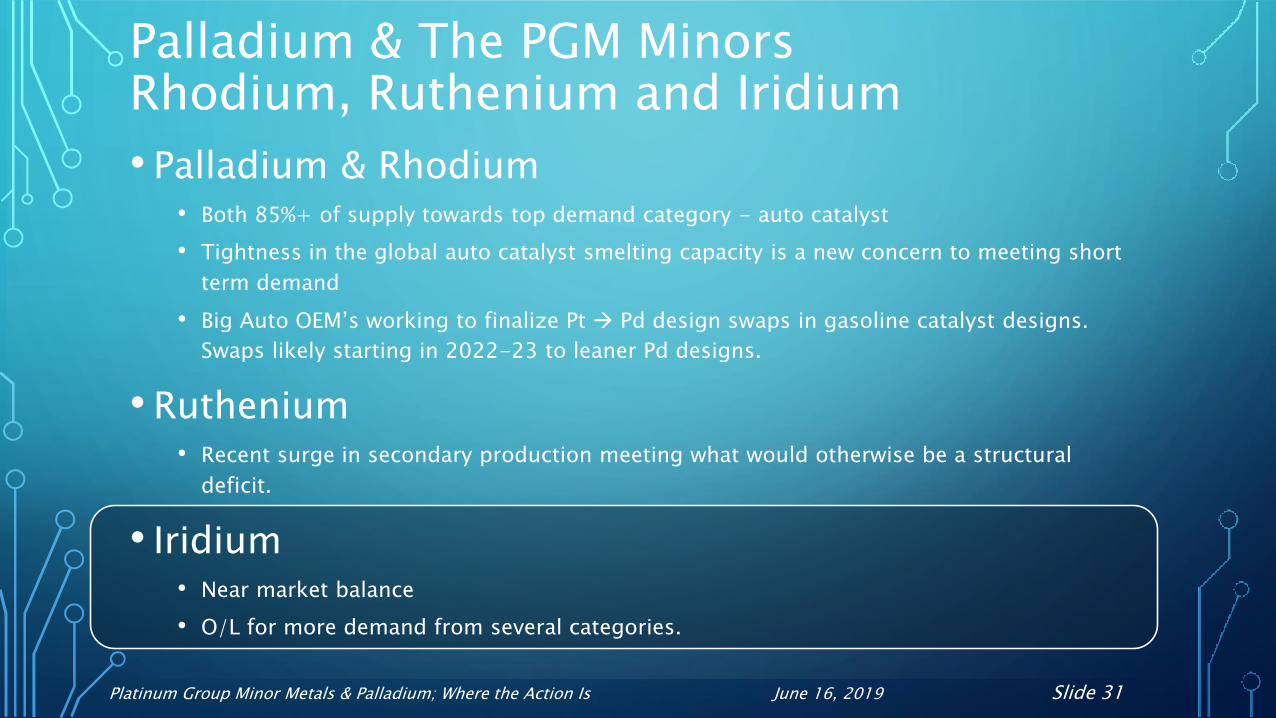
Palladium & The PGM MinorsRhodium, Ruthenium and Iridium
• Palladium & Rhodium• Both 85%+ of supply towards top demand category - auto catalyst
• Tightness in the global auto catalyst smelting capacity is a new concern to meeting short
term demand
• Big Auto OEM’s working to finalize Pt Pd design swaps in gasoline catalyst designs.
Swaps likely starting in 2022-23 to leaner Pd designs.
• Ruthenium • Recent surge in secondary production meeting what would otherwise be a structural
deficit.
• Iridium • Near market balance
• O/L for more demand from several categories.
Platinum Group Minor Metals & Palladium; Where the Action Is June 16, 2019 Slide 32
$0
$200
$400
$600
$800
$1,000
$1,200
$1,400
$1,600J-
00
J-01
J-02
J-03
J-04
J-05
J-06
J-07
J-08
J-09
J-10
J-11
J-12
J-13
J-14
J-15
J-16
J-17
J-18
J-19
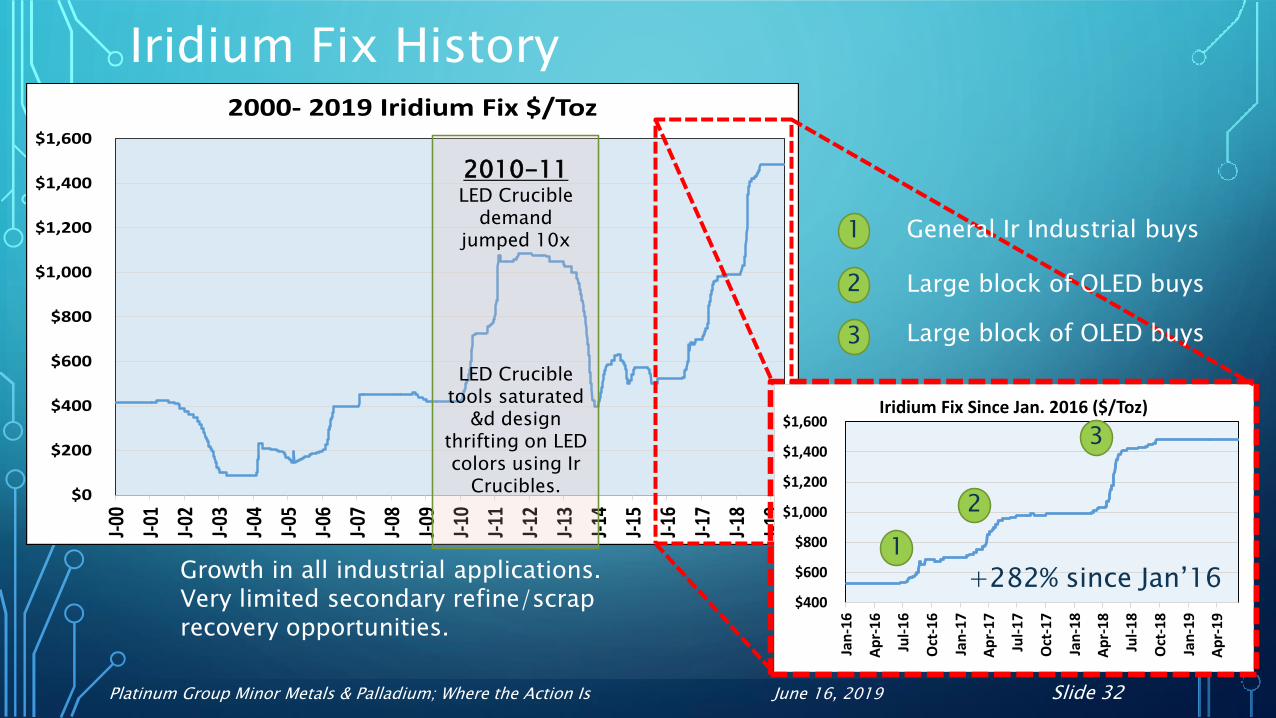
2000- 2019 Iridium Fix $/Toz
Iridium Fix History
Growth in all industrial applications.Very limited secondary refine/scrap recovery opportunities.
2010-11 LED Crucible
demand jumped 10x
LED Crucible tools saturated
&d design thrifting on LED colors using Ir
Crucibles.
$400
$600
$800
$1,000
$1,200
$1,400
$1,600
Jan
-16
Ap
r-1
6
Jul-
16
Oct
-16
Jan
-17
Ap
r-1
7
Jul-
17
Oct
-17
Jan
-18
Ap
r-1
8
Jul-
18
Oct
-18
Jan
-19
Ap
r-1
9
Iridium Fix Since Jan. 2016 ($/Toz)
+282% since Jan’16
3
2
1
3
2
1 General Ir Industrial buys
Large block of OLED buys
Large block of OLED buys
Platinum Group Minor Metals & Palladium; Where the Action Is June 16, 2019 Slide 33
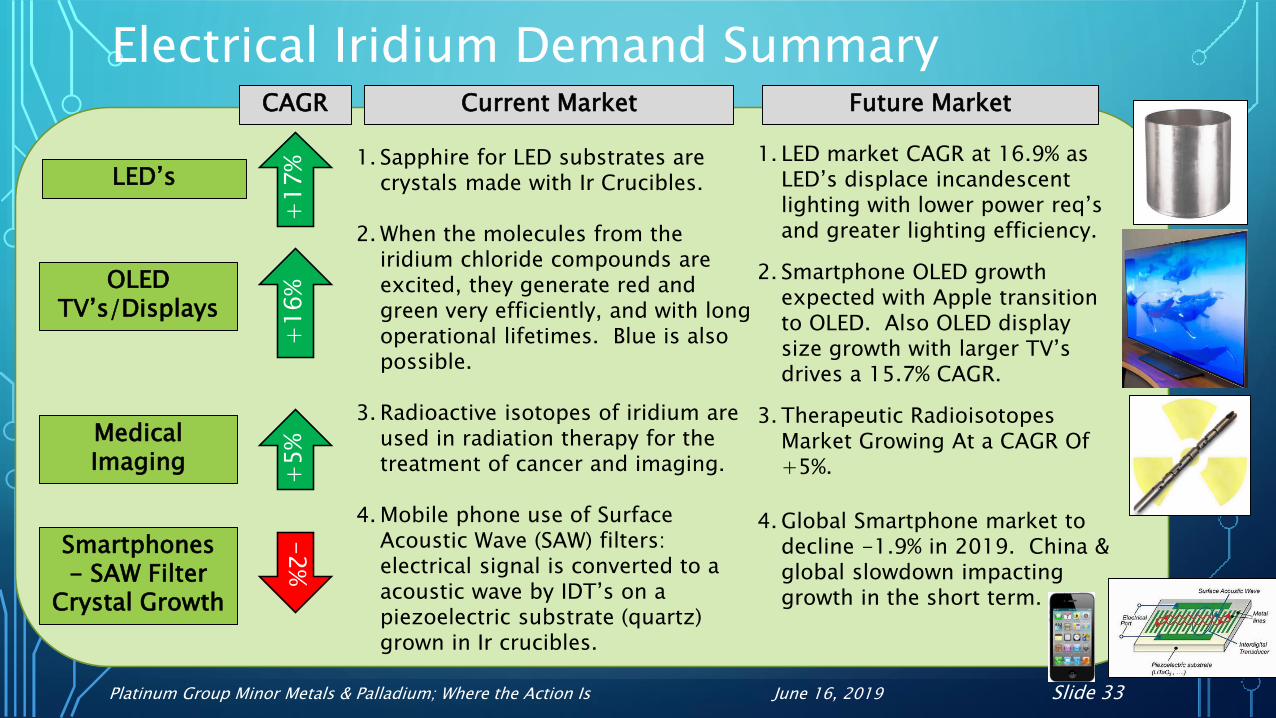
Electrical Iridium Demand Summary
+1
7%
+1
6%
LED’s
Medical Imaging
OLED TV’s/Displays
Smartphones- SAW Filter
Crystal Growth
Current Market Future MarketCAGR
1. Sapphire for LED substrates are crystals made with Ir Crucibles.
2. When the molecules from the iridium chloride compounds are excited, they generate red and green very efficiently, and with long operational lifetimes. Blue is also possible.
3. Radioactive isotopes of iridium are used in radiation therapy for the treatment of cancer and imaging.
4. Mobile phone use of Surface Acoustic Wave (SAW) filters: electrical signal is converted to a acoustic wave by IDT’s on a piezoelectric substrate (quartz) grown in Ir crucibles.
1. LED market CAGR at 16.9% as LED’s displace incandescent lighting with lower power req’sand greater lighting efficiency.
2. Smartphone OLED growth expected with Apple transition to OLED. Also OLED display size growth with larger TV’s drives a 15.7% CAGR.
3. Therapeutic Radioisotopes Market Growing At a CAGR Of +5%.
4. Global Smartphone market to decline -1.9% in 2019. China & global slowdown impacting growth in the short term.
+5
%
-2
%

Platinum Group Minor Metals & Palladium; Where the Action Is June 16, 2019 Slide 34
Chemical Iridium Demand Summary
+9
%
The most important iridium compounds in use are the salts and acids it forms with chlorineIridiumcatalyzed carbonylation process for the production of acetic acid.
Iridium chemical oxidation state influences the performance and durability of oxygen evolution catalysts in PEM electrolysis.
Acetic Acid
Current Market Future MarketCAGR
1. Acetic acid demand is 17,808 kilo metric tones in 2019. Used in rubber, plastics, pharmaceutical, construction, paint & other app’s.
2. Oxygen evolution catalysts in PEM electrolysis
1. $11.6 billion by 2019 with CAGR of 8.7%. One risk of decline is the environmental efforts to reduce plastics.
2. $200 billion by 2025 @ 6.1% CAGR. Upside growth possible.
H2 Electrolysis Catalyst +
6%
Platinum Group Minor Metals & Palladium; Where the Action Is June 16, 2019 Slide 35
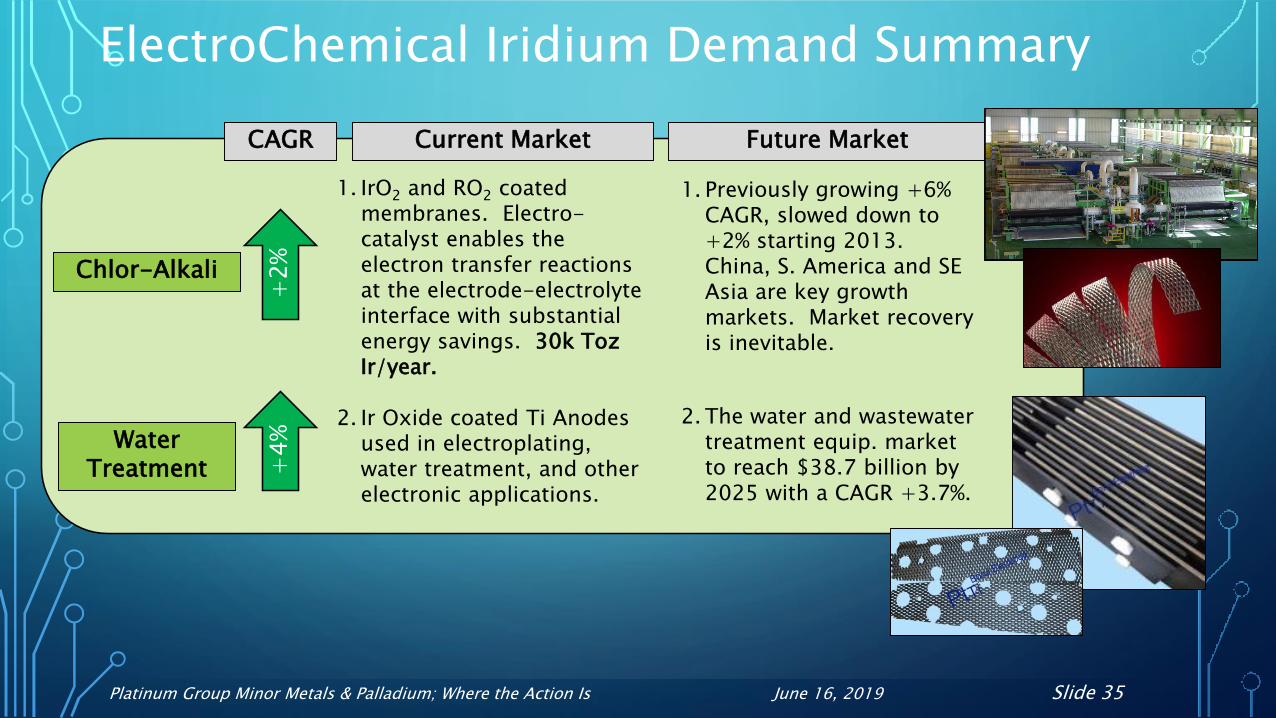
ElectroChemical Iridium Demand Summary
+2
%+
4%
Chlor-Alkali
Water Treatment
Current Market Future MarketCAGR
1. IrO2 and RO2 coated membranes. Electro-catalyst enables the electron transfer reactions at the electrode-electrolyte interface with substantial energy savings. 30k TozIr/year.
2. Ir Oxide coated Ti Anodes used in electroplating, water treatment, and other electronic applications.
1. Previously growing +6% CAGR, slowed down to +2% starting 2013. China, S. America and SE Asia are key growth markets. Market recovery is inevitable.
2. The water and wastewater treatment equip. market to reach $38.7 billion by 2025 with a CAGR +3.7%.

Platinum Group Minor Metals & Palladium; Where the Action Is June 16, 2019 Slide 36
Other Iridium Demands - Summary
+6
%Spark Plugs
Current Market Future MarketCAGR
1. Ir tipped spark plugs for automotive / ICE.
2. Ir alloy used in long-life parts for aircraft engines. Thermo-electric generators are produced using Ir. Plutonium-238 fuel encapsulated using Ir.
3. High melting point and low reactivity make it perfect for use as a primary crucible material.
4. Used in special alloys and forms an alloy with Os, used for pen tips and compass bearings.
1. Resurgence in Ir Spark Plug demand due to declining diesel and for ICE fuel efficiency & emission perf. Showing +5.9% CAGR.
2. Mil/Aero sector continued to growth. Satellites and airplanes +9% CAGR.
3. Alt. materials including Platinum are gaining share due to Ir price. CAGR on general lab Ir crucibles -3%.
4. Most other app’s flat CAGR.
Military / Aerospace
+9
%
Crucibles
Unique App’s
-3
%
+0%
Platinum Group Minor Metals & Palladium; Where the Action Is June 16, 2019 Slide 37
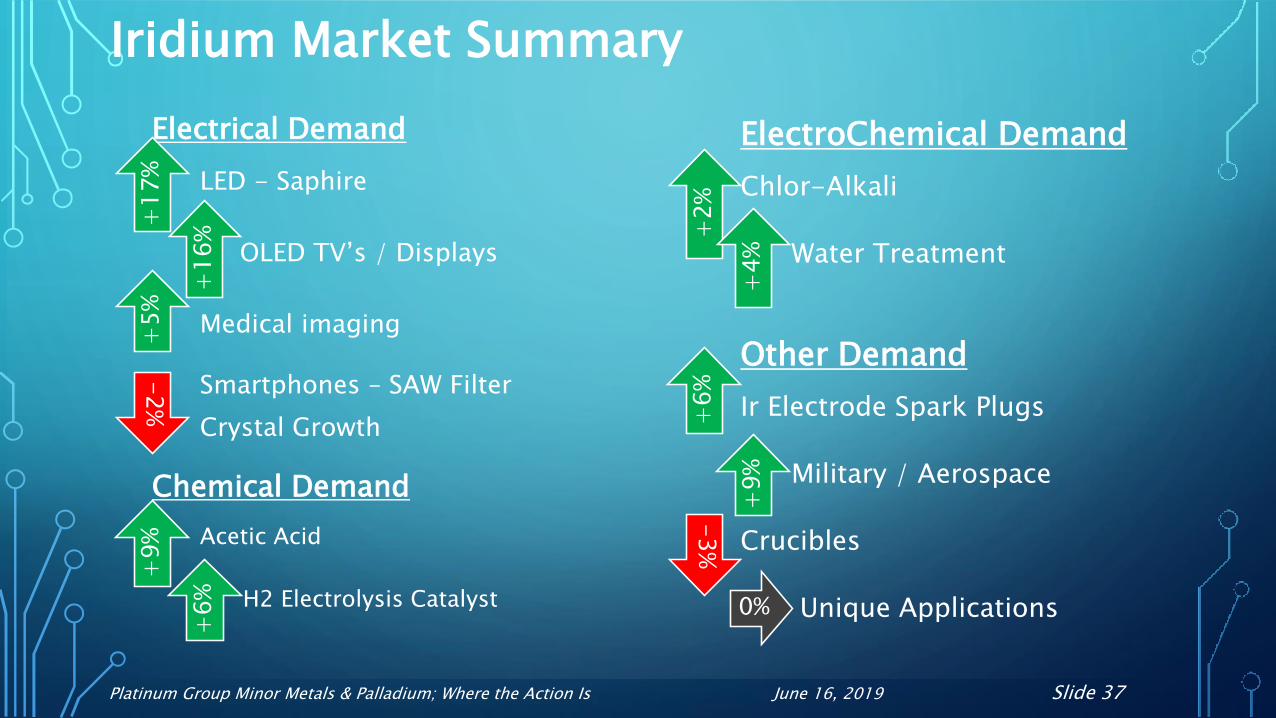
Iridium Market Summary
Electrical Demand
LED - Saphire
OLED TV’s / Displays
Medical imaging
Smartphones – SAW Filter
Crystal Growth
Chemical Demand
Acetic Acid
H2 Electrolysis Catalyst
+1
7%
+1
6%
+5
%
-2
%
ElectroChemical Demand
Chlor-Alkali
Water Treatment
Other Demand
Ir Electrode Spark Plugs
Military / Aerospace
Crucibles
Unique Applications
+2
%
+4
%
+9%
+6%
+6
%
+9
%
-3
%
0%
Platinum Group Minor Metals & Palladium; Where the Action Is June 16, 2019 Slide 38
$-
$500
$1,000
$1,500
$2,000
$2,500
$3,000
-250
-150
-50
50
150
250
350
450
20
08
20
09
20
10
20
11
20
12
20
13
20
14
20
15
20
16
20
17
20
18
20
19
F
20
20
F
20
21
F
20
22
F
20
23
F
20
24
F
20
25
F
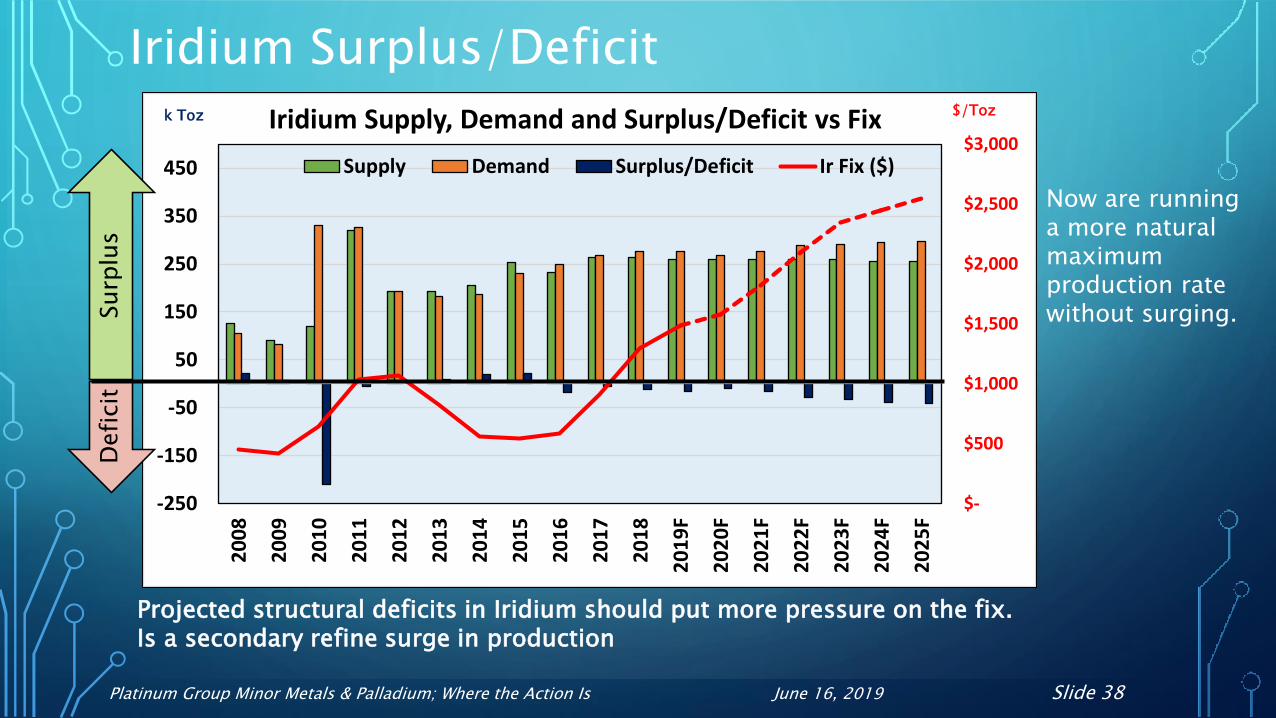
Iridium Supply, Demand and Surplus/Deficit vs Fix
Supply Demand Surplus/Deficit Ir Fix ($)
Iridium Surplus/Deficit
Projected structural deficits in Iridium should put more pressure on the fix.Is a secondary refine surge in production
$/Tozk TozD
efi
cit
Surp
lus
Now are running a more natural maximum production rate without surging.
Platinum Group Minor Metals & Palladium; Where the Action Is June 16, 2019 Slide 39
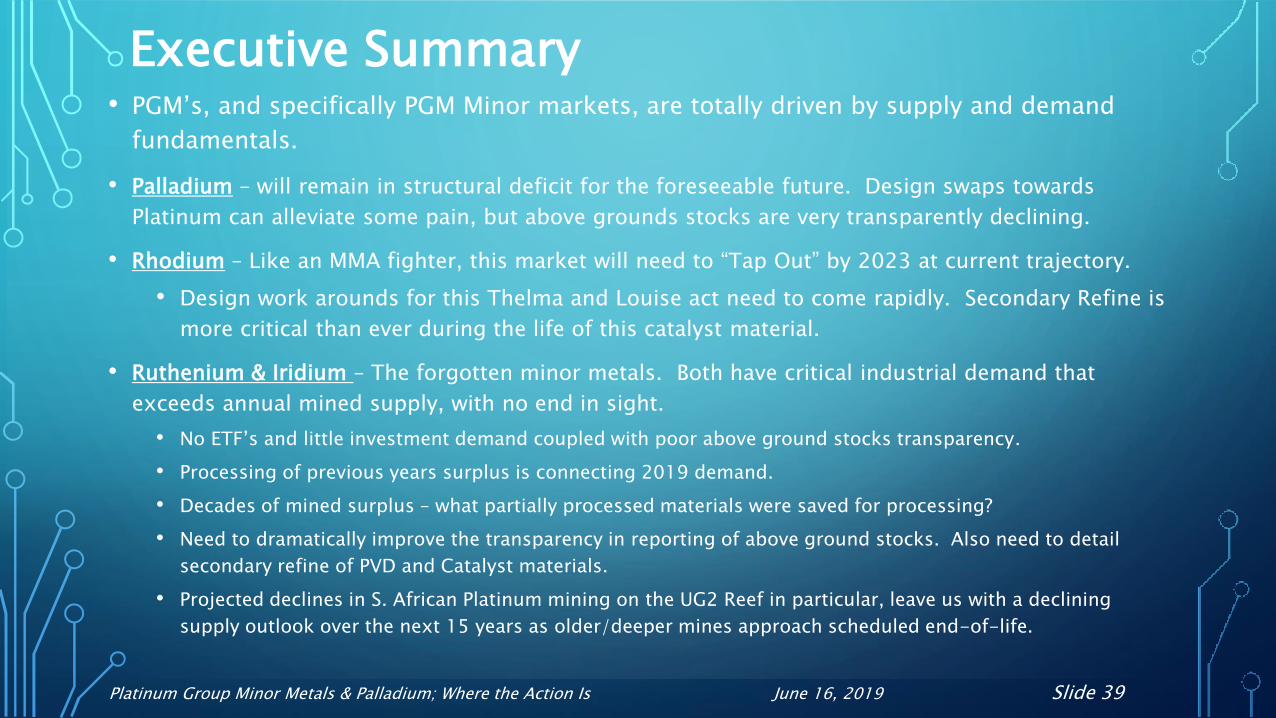
Executive Summary• PGM’s, and specifically PGM Minor markets, are totally driven by supply and demand
fundamentals.
• Palladium – will remain in structural deficit for the foreseeable future. Design swaps towards
Platinum can alleviate some pain, but above grounds stocks are very transparently declining.
• Rhodium – Like an MMA fighter, this market will need to “Tap Out” by 2023 at current trajectory.
• Design work arounds for this Thelma and Louise act need to come rapidly. Secondary Refine is
more critical than ever during the life of this catalyst material.
• Ruthenium & Iridium – The forgotten minor metals. Both have critical industrial demand that
exceeds annual mined supply, with no end in sight.
• No ETF’s and little investment demand coupled with poor above ground stocks transparency.
• Processing of previous years surplus is connecting 2019 demand.
• Decades of mined surplus – what partially processed materials were saved for processing?
• Need to dramatically improve the transparency in reporting of above ground stocks. Also need to detail
secondary refine of PVD and Catalyst materials.
• Projected declines in S. African Platinum mining on the UG2 Reef in particular, leave us with a declining
supply outlook over the next 15 years as older/deeper mines approach scheduled end-of-life.

Platinum Group Minor Metals & Palladium; Where the Action Is June 16, 2019 Slide 40
Disclaimer
• Precious Metals Commodity Management LLC works to ensure the accuracy of the information and materials contained in this report, but makes no warranty as to accuracy, completeness for any particular purpose. PMCM LLC accepts no liability whatsoever in respect of reliance placed by the user on information and materials contained in this report, which are utilized expressly at the user’s own risk.
• A decision to invest in any regulated precious metal related products or any other regulated products, securities or investments should not be made in reliance on any of the information or materials in this report. Before making any investment decision, prospective investors should seek advice from their financial, legal, tax and accounting advisers, take into account their individual financial needs and circumstances and carefully consider the risks associated with such investment decisions. This report does not, and should not be construed as acting to, sponsor, advocate, endorse or promote any regulated precious metal related products or any other regulated products, securities or investments.