the brazilian ethanol experience as fuel for...
TRANSCRIPT

TheThe Brazilian EthanolBrazilian Ethanol ExperienceExperience
Biomass Energy Workshop & Biomass Energy Workshop & ExhibitionExhibitionThe World BankThe World Bank -- FebruaryFebruary 26, 200326, 2003
as Fuel as Fuel forfor TransportationTransportation
Arnaldo Vieira de CarvalhoArnaldo Vieira de Carvalhoarnaldoarnaldo@@vieiravieira--dede--carvalhocarvalho..comcom

ContentsContents
•• BackgroundBackground ((ProAlcoholProAlcohol))
•• MainMain achievements and impactsachievements and impacts
•• Trends and future prospectsTrends and future prospects
Biomass Energy WorBiomass Energy Workshop & kshop & ExhibitionExhibitionThe WoThe World Bankrld Bank -- FebruaryFebruary 26, 200326, 2003

BackgroundBackground•• 19751975:: ProAlcohol created toProAlcohol created to reduce reduce crudecrude oil oil importsimports,,
increasing production of sugarcaneincreasing production of sugarcane--derived ethanolderived ethanoltoto displace displace gasolinegasoline ((onlyonly 1% 1% displaceddisplaced in 1975), in in 1975), in response response toto oil oil price increase afterprice increase after thethe 1973 embargo1973 embargo
•• 19791979: : another sudden another sudden oil oil price increaseprice increase; 14% ; 14% gasoline gasoline already being displacedalready being displaced; ; automotive industry begun automotive industry begun manufacturing neat ethanol cars employing straight manufacturing neat ethanol cars employing straight hydrous ethanolhydrous ethanol as fuel (92.6% as fuel (92.6% by volby vol) )
•• Program relied on Program relied on a a 4040--yearyear experience of blending experience of blending anhydrous ethanolanhydrous ethanol (99.3%(99.3% by volby vol)) with gasolinewith gasoline totohedge the sugar industry against international price hedge the sugar industry against international price variationsvariations (5(5--foldfold):): low sugar prices low sugar prices in 1966in 1966--67 67 led toled topeak peak addition to gasolineaddition to gasoline: 14% in S.Paulo, 6%: 14% in S.Paulo, 6% countrycountry

Background Background ((cont’dcont’d))
•• 19831983: : anhydrous ethanol contentanhydrous ethanol content in in gasoline reaches gasoline reaches 20%20% as national as national averageaverage; ; 1.3 1.3 million neat ethanol carsmillion neat ethanol carsinin operationoperation; ; 1/31/3 of gasoline demand displaced by of gasoline demand displaced by neatneat ((hydroushydrous)) and anhydrous ethanol combinedand anhydrous ethanol combined
•• 19861986--8888: : lowlow internationalinternational oil oil pricesprices;; domesticdomestic crudecrudeoil oil production increasesproduction increases; ; hydrous ethanolhydrous ethanol//gasoline gasoline price ratio increases fromprice ratio increases from 0.65 0.65 toto 0.69 (0.69 (JuneJune 1988)1988)
•• 19851985: 650,000: 650,000 neat ethanol carsneat ethanol cars sales/sales/year peaks atyear peaks at96%96% of of lightlight--vehicle sales; vehicle sales; 2.52.5 million neat ethanolmillion neat ethanolcarscars inin operationoperation;; halfhalf of gasoline displacedof gasoline displaced, , despitedespitehydrous ethanolhydrous ethanol//gasoline price ratio increased from gasoline price ratio increased from 0.59 0.59 to to 0.65 (0.65 (equilibrium ratioequilibrium ratio is approxis approx. 0.8). 0.8)

•• 19891989: 4: 4.5.5 million neat ethanol carsmillion neat ethanol cars inin operationoperation; ; 60%60%of gasoline displacedof gasoline displaced;; lack of supply of ethanol fuelslack of supply of ethanol fuels;;imports of ethanol imports of ethanol and methanoland methanol to meet the demandto meet the demand; ; gasoline surplusgasoline surplus exportsexports (100,000(100,000 bblbbl/d);/d); hydrous hydrous ethanolethanol//gasoline gasoline price ratio increasesprice ratio increases fromfrom 0.69 0.69 to to 0.75 0.75 ((JanJan. 1989): . 1989): only only 6% 6% savingssavings//mile over gasoline mile over gasoline down fromdown from 20% 20% savings before Junesavings before June 19881988
Background Background (final)(final)
•• 19901990: : neat ethanol carneat ethanol car sales sales dropped todropped to 5%; 5%; anhydrous anhydrous ethanol contentethanol content in in gasoline dropped to gasoline dropped to 12%; 12%; gasoline gasoline (5(5--7%) 7%) and methanol and methanol (0(0--33%)33%) added to hydrous ethanoladded to hydrous ethanol
•• 1991 1991 -- presentpresent:: neat ethanol carneat ethanol car salessales recovered untilrecovered until1992,1992, then decreased to practically none then decreased to practically none in 1996in 1996--2000;2000;crudecrude oiloil prices up sinceprices up since 1999;1999; anhydrous ethanolanhydrous ethanol salessalesfollowed gasolinefollowed gasoline sales;sales; hydrous ethanol recovering hydrous ethanol recovering

HYDRATED EtOH
ANHYDROUS EtOH
TOTAL EtOH
BRAZIL - ETHANOL PRODUCTION, 1975-2002
75/76
77/78
79/80
81/82
83/84
85/86
87/88
89/90
91/92
93/94
95/96
97/98
99/00
01/02
Harvest Season
0
2,000
4,000
6,000
8,000
10,000
12,000
14,000
16,000
18,000
1000
m3
EtO
H
Source: UNICA - União da Agroindústria Canavieira de São Paulo
TOTAL EtOH
ANHYDROUS EtOH
HYDRATED EtOH

ETHANOL PRODUCTION & OIL PRICES, 1975-2002
75/76
77/78
79/80
81/82
83/84
85/86
87/88
89/90
91/92
93/94
95/96
97/98
99/00
01/02
Harvest Season
0
2.000
4.000
6.000
8.000
10.000
12.000
14.000
16.000
18.000
1000
m3
EtO
H
Sources: UNICA, EIA, ANP, MME/BEN
TOTAL EtOH
ANHYDROUS EtOH
HYDRATED EtOH
5020.000
30
10
0
40
US$
/bbl
(nom
inal
)
20
Feb 18, 2003
2003 avg.CRUDE OIL PRICE

ETHANOL PRODUCTION & OIL IMPORTS DEPENDENCY, 1975-2002
75/76
77/78
79/80
81/82
83/84
85/86
87/88
89/90
91/92
93/94
95/96
97/98
99/00
01/02
Harvest Season
0
2.000
4.000
6.000
8.000
10.000
12.000
14.000
16.000
18.000
1000
m3
EtO
H
Sources: UNICA, EIA, ANP, MME/BEN
TOTAL EtOH
ANHYDROUS EtOH
HYDRATED EtOH
%20.000
60
20
0
80
40
Domestic oil production1.6 million bbl/d Feb 2003
OIL IMPORTS DEPENDENCY (%)OIL IMPORTS DEPENDENCY (%)
Domestic oil production100 thousand bbl/d

ETHANOL PRODUCTION & NEAT ETHANOL CAR SALES, 1975-2002
75/76
77/78
79/80
81/82
83/84
85/86
87/88
89/90
91/92
93/94
95/96
97/98
99/00
01/02
0
2,000
4,000
6,000
8,000
10,000
12,000
14,000
16,000
18,000
1000
m3
EtO
H
TOTAL EtOH
ANHYDROUS EtOH
HYDRATED EtOH
20,000
22,000
500
100
0
400
300
200
24,000 600
1000
veh
icle
s/ye
ar
26,000
28,000 700
Sources: UNICA, ANFAVEA, UN
NEAT ETHANOL NEAT ETHANOL CAR SALESCAR SALES

0.40
0.50
0.60
0.70
0.80
0.90
1.00
1997 1998 1999 2000 2001
BelemBelo HorizonteBrasíliaCuritibaFortalezaGoianiaPorto AlegreRecifeRio de JaneiroSalvadorSão Paulo
Hydrous EthanolHydrous Ethanol//Gasoline Price RatioGasoline Price Ratio19971997--20012001
Dec. 2002Dec. 2002
SE RegionSE Region
((avgavg. 0.59). 0.59)
Source: ANP

ETHANOL/SUGARCANE PRODUCTION, 1975-2002
75/76
77/78
79/80
81/82
83/84
85/86
87/88
89/90
91/92
93/94
95/96
97/98
99/00
01/02
Harvest Season
0
2,000
4,000
6,000
8,000
10,000
12,000
14,000
16,000
18,000
1000
m3
EtO
H
Source: UNICA
TOTAL EtOH
ANHYDROUS EtOH
HYDRATED EtOH
150
50
0
200
250
106
ton
suga
rcan
e
20,000 TOTAL SUGARCANE PRODUCTION
SUGARCANE FOR SUGAR100

Main achievements and impactsMain achievements and impacts
•• > 300 ethanol distileries> 300 ethanol distileries (200 tied to sugar factories);(200 tied to sugar factories);25,000 gas stations25,000 gas stations selling hydrous ethanol todayselling hydrous ethanol today
•• 2.52.5 million neat ethanol carsmillion neat ethanol cars inin operationoperation; ; 15.515.5 million million cars using 22% cars using 22% anhydrous ethanolanhydrous ethanol--gasoline blendgasoline blend; ; > 1/3 of gasoline displaced> 1/3 of gasoline displaced
•• $48 billion hard currency expenditures avoided in$48 billion hard currency expenditures avoided in19751975--2002, with an investment of $5 billion (2001 $)2002, with an investment of $5 billion (2001 $)in local currency in local currency
•• 320 million metric tons of sugarcane produced in 2002 320 million metric tons of sugarcane produced in 2002 (4 times more than in 1975); 20 million ton sugar (4 times more than in 1975); 20 million ton sugar (3X 1975); 12 million m(3X 1975); 12 million m33 ethanol (20X 1975); crude oil ethanol (20X 1975); crude oil displacement: 200,000 barrels/daydisplacement: 200,000 barrels/day

Main achievements and impactsMain achievements and impacts ((cont’dcont’d))
•• 700700 thousand jobs createdthousand jobs created inin the production chainthe production chain@ US$10@ US$10--2020 thousandthousand//jobjob (4X(4X lower than avglower than avg.) .)
•• Demonstration thatDemonstration that aa massivemassive biomassbiomass programprogramcan becan be establishedestablished in ain a short period ofshort period of time time
•• Ethanol prices deregulatedEthanol prices deregulated
•• Sugarcane/sugar/ethanol technology developmentSugarcane/sugar/ethanol technology developmentdemonstrated by productivity increases and cost demonstrated by productivity increases and cost reduction reduction
•• Positive environmental impactsPositive environmental impacts
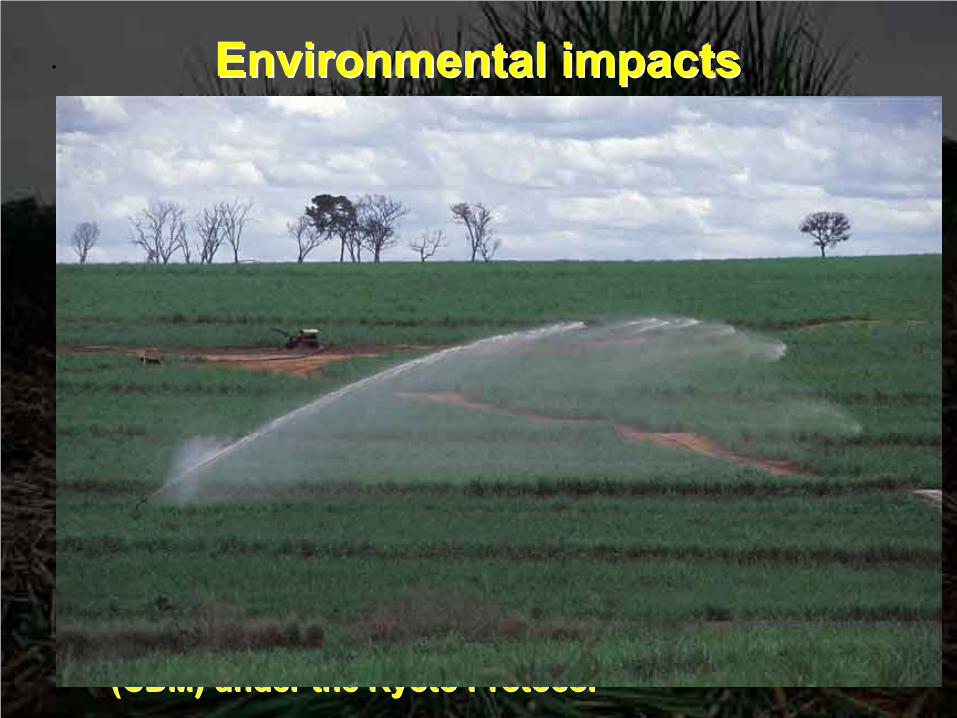
Environmental impactsEnvironmental impacts•• The first measurable impacts were The first measurable impacts were lead displacementlead displacement
due to the excelent octane enhancement properties due to the excelent octane enhancement properties of ethanolof ethanol:: lead concentrationslead concentrations inin the airthe air inin the citythe cityofof São PauloSão Paulo droppeddropped 93%93% fromfrom 19781978 toto 19911991
•• NONOxx, CO, CO and Sulfurand Sulfur emissions from ethanol fuelsemissions from ethanol fuels arearereduced whilereduced while HCHC ((hydrocarbonshydrocarbons)) and aldehyde and aldehyde emissionsemissions areare increasedincreased.. However ethanol HCs andHowever ethanol HCs andaldehydesaldehydes areare less toxic than gasoline’sless toxic than gasoline’s. .
•• COCO22 emissions from ethanol vehiclesemissions from ethanol vehicles areare absorbed absorbed back by sugarcane growingback by sugarcane growing in ain a closed cycleclosed cycle,, makingmakingethanolethanol fuelfuel eligible for Clean Developing Mechanismseligible for Clean Developing Mechanisms(CDM)(CDM) under the Kyoto Protocolunder the Kyoto Protocol
•• The environmental impacts from ethanol productionThe environmental impacts from ethanol production,,particulally the stillage disposalparticulally the stillage disposal,, have been resolvedhave been resolved
.

Air Pollutants Relative Concentration
City of São Paulo, 1999(Reference: 100 in 1985)
0
50
100
150
200
250
fleet CO HC NOx
246
84.2 84.8 78.6
1985
Sources: COPPE/UFRJ/MMA

AGRO-INDUSTRIAL PRODUCTIVITY- BRAZIL & S.PAULO
6.0
5.0
4.0
3.0
2.0
1.0
m3
etha
nol/h
a
Sources: IBGE, MIC-IAA, AIAA, UNICA, USP/IEE, MCT
5.0
6.0
7.0
8.0
9.0
10.0
t sug
ar/h
a
80 82 84 86 88 90 92 94 96 98Harvest Season
BRAZIL
1996/98 avg.7,57 t sugar/ha
1980/82 avg.5,43 t sugar/ha
1980/82 avg.7,11 t sugar/ha
1996/98 avg. 8,93 t sugar/haSÃO PAULO
1977: 2.6 m1977: 2.6 m33
EtOH/haEtOH/ha
1985: 3.8 m1985: 3.8 m3 3
EtOH/haEtOH/ha
1989: 4.7 m1989: 4.7 m3 3
EtOH/haEtOH/ha
1996: 5.1 m1996: 5.1 m3 3
EtOH/haEtOH/ha

Price paid to Ethanol Producers Price paid to Ethanol Producers
Dec. 2002Dec. 2002
in S.Pauloin S.Paulo
0.0
0.2
0.4
0.6
0.8
1.0
1978 1979 1980 1981 1982 1983 1984 1985 1986 1987 1988 1989 1990 1991 1992 1993 1994 1995
US$
cen
ts//l
iter o
f EtO
HU
S$ c
ents
//lite
r of E
tOH
Sources: ANP, MCT/IEE-USP

Trends and Future ProspectsTrends and Future Prospects
•• FlexibleFlexible--fuel vehicle: fuel vehicle: one one vehichevehiche/multiple fuels/multiple fuels
•• Greenhouse gases abatement Greenhouse gases abatement -- carbon credits/CDMcarbon credits/CDM
•• Cogeneration using sugarcaneCogeneration using sugarcane bagassebagasse (from the(from thepresent 20 kWh/ton to 100present 20 kWh/ton to 100--600 kWh/ton sugarcane)600 kWh/ton sugarcane)
•• Other uses for ethanol: Other uses for ethanol: ⇒⇒ Vegetable oil Vegetable oil transesterificationtransesterification (Bio(Bio--Diesel)Diesel)⇒⇒ Fuel cellFuel cell
•• International market development: International market development: explore the demand explore the demand for ethanol fuels in other countries (USA, India, China, Sfor ethanol fuels in other countries (USA, India, China, Sweden, Australia, weden, Australia, Thailand, Canada, Japan, etc) and transform it in an energThailand, Canada, Japan, etc) and transform it in an energy & y & environ’talenviron’talcommodity. Good opportunities open by the MTBE phase out in Calcommodity. Good opportunities open by the MTBE phase out in California ifornia for reformulated gasoline. The process of implementing a for reformulated gasoline. The process of implementing a sustainable sustainable internat’linternat’l fuel ethanol market implies the removal of the present tariff afuel ethanol market implies the removal of the present tariff andndnonnon--tariff barriers to imports.tariff barriers to imports.

km/l $R
14.5 13.3 11.5
Emissions Performance
Fuel Consumption Costs
Flex-fuel Vehicle Preliminary Results
Source: AEA/Magneti Marelli, Damasceno, C.F.
(@ 0.54 EtOH/gas price ratio)
12,810,7
8,7

Carbon Credits for Gasoline displacementCarbon Credits for Gasoline displacement
•• Brazilian Law # 10612 provides R$1,000 (US$280) for each Brazilian Law # 10612 provides R$1,000 (US$280) for each new owner of new owner of neat ethanol vehicles up to 3 years and up toneat ethanol vehicles up to 3 years and up to100,000 vehicles, employing international carbon credits100,000 vehicles, employing international carbon creditschanneled by the Brazilian Governmentchanneled by the Brazilian Government
•• The The avoided carbon avoided carbon emissions due to the emissions due to the use of ethanol fuels use of ethanol fuels have been estimated have been estimated @ @ apprappr. 50 million t CO. 50 million t CO22
•• Assuming a market Assuming a market value of $ 4/ton COvalue of $ 4/ton CO22: : $200 million/year$200 million/year
COCO22