the boulevard of broken dreams+buylocal€¦ · the boulevard of broken dreams: government and the...
TRANSCRIPT
THE BOULEVARD OF BROKEN DREAMS:GOVERNMENT AND THE PROMOTION OF ENTREPRENEURSHIP AND VENTURE CAPITAL
Josh LernerHarvard Business School

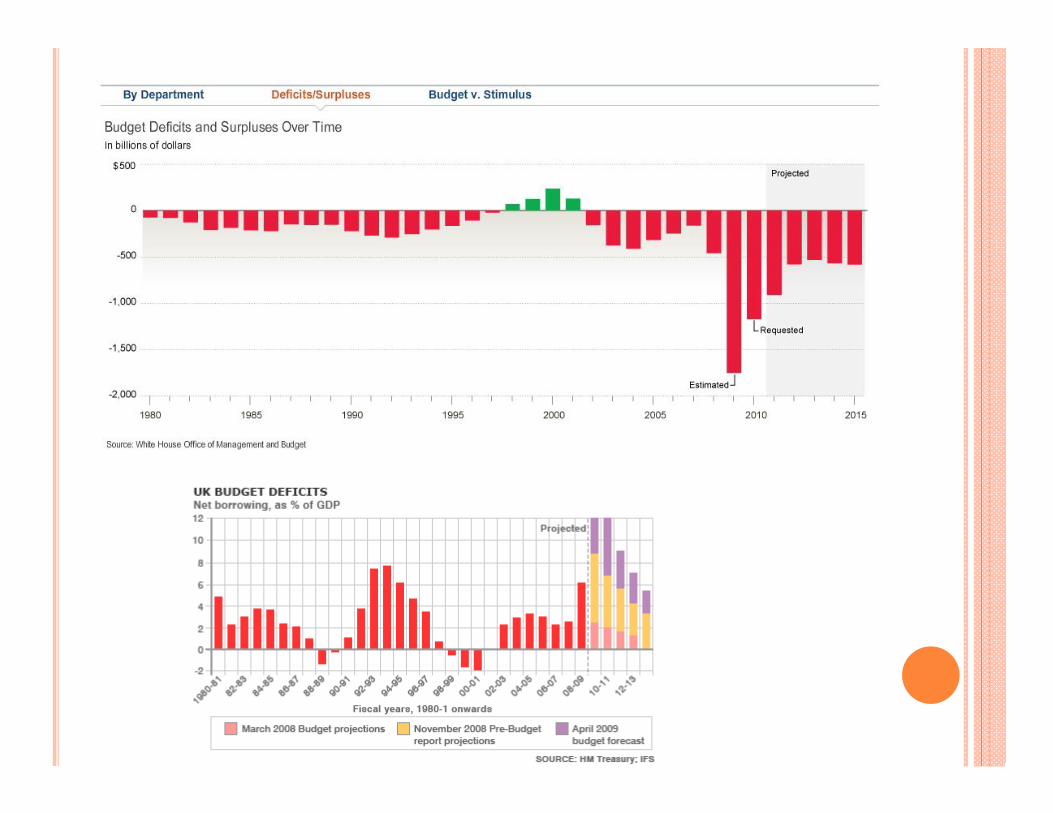
LEGACY OF THE CRISIS Massive public
intervention in failing firms.
Fiscal pressures from commitments.
Desperate need for economic growth. A global story.

DESPERATE NEED FOR “GREEN SHOOTS”
BUT ENTREPRENEURSHIP GROWTH ENGINES SPUTTERING Poor venture returns since 2000 boom. Even more pronounced drought elsewhere.
Linked to difficulties in exiting investments. Downturn in venture activity world-wide since
crisis. Concerns of wide-spread disillusionment of
investors.
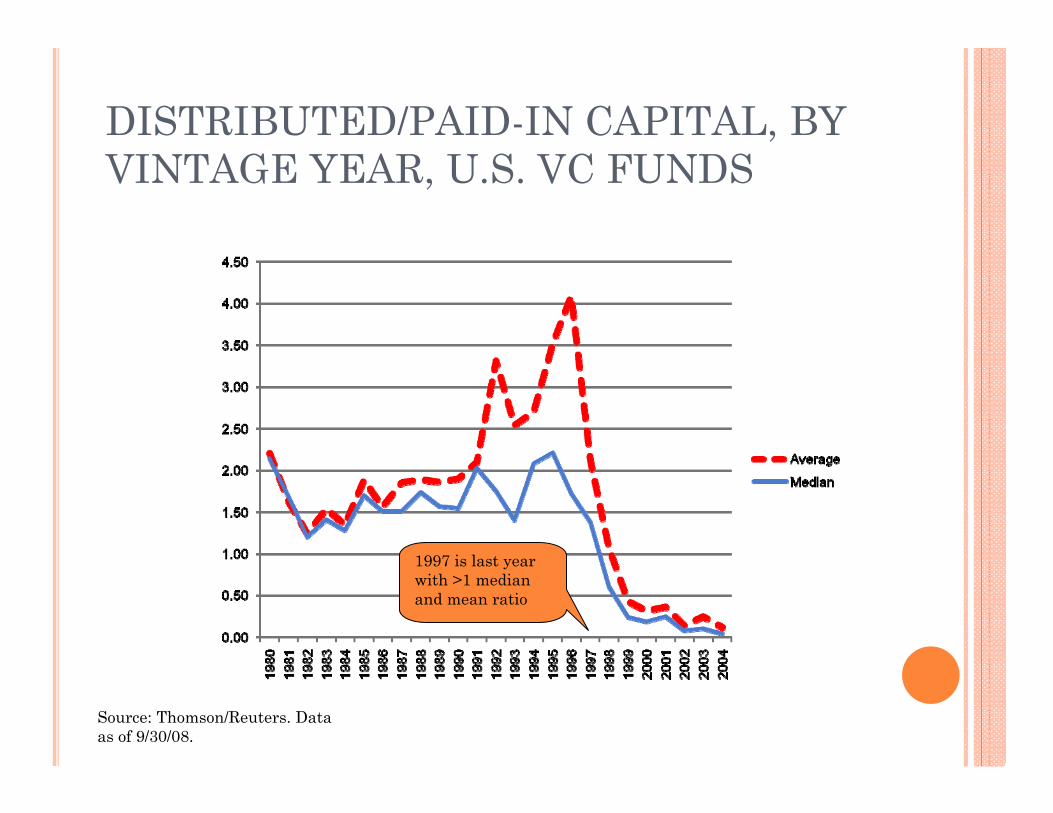
DISTRIBUTED/PAID-IN CAPITAL, BY VINTAGE YEAR, U.S. VC FUNDS
1997 is last year with >1 median and mean ratio
Source: Thomson/Reuters. Data as of 9/30/08.
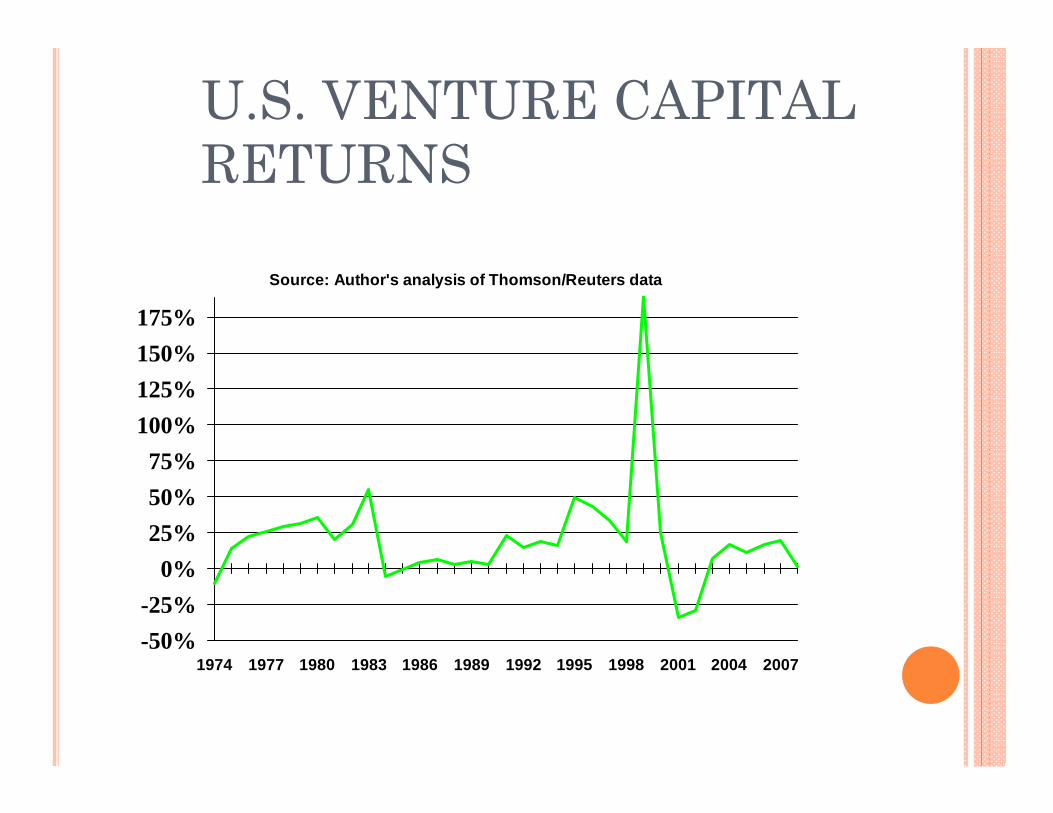
U.S. VENTURE CAPITAL RETURNS
-50%-25%
0%25%50%75%
100%125%150%175%
1974 1977 1980 1983 1986 1989 1992 1995 1998 2001 2004 2007
Source: Author's analysis of Thomson/Reuters data
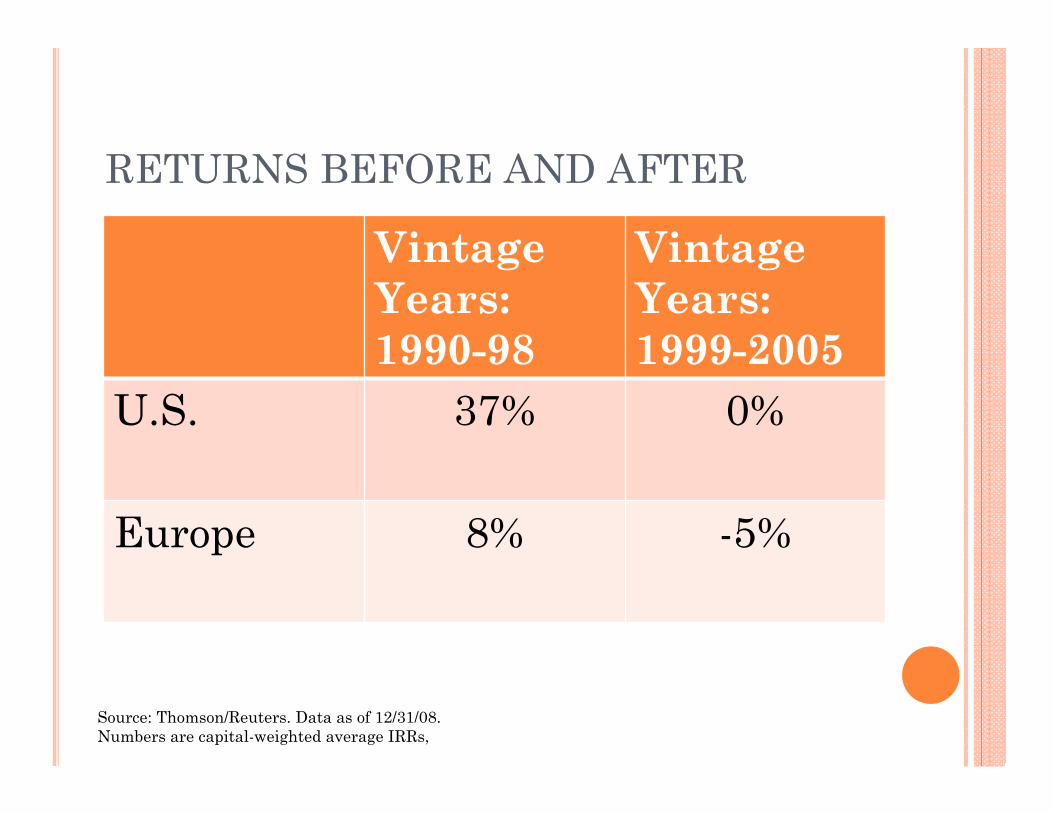
RETURNS BEFORE AND AFTER
Vintage Years: 1990-98
Vintage Years: 1999-2005
U.S. 37% 0%
Europe 8% -5%
Source: Thomson/Reuters. Data as of 12/31/08. Numbers are capital-weighted average IRRs,
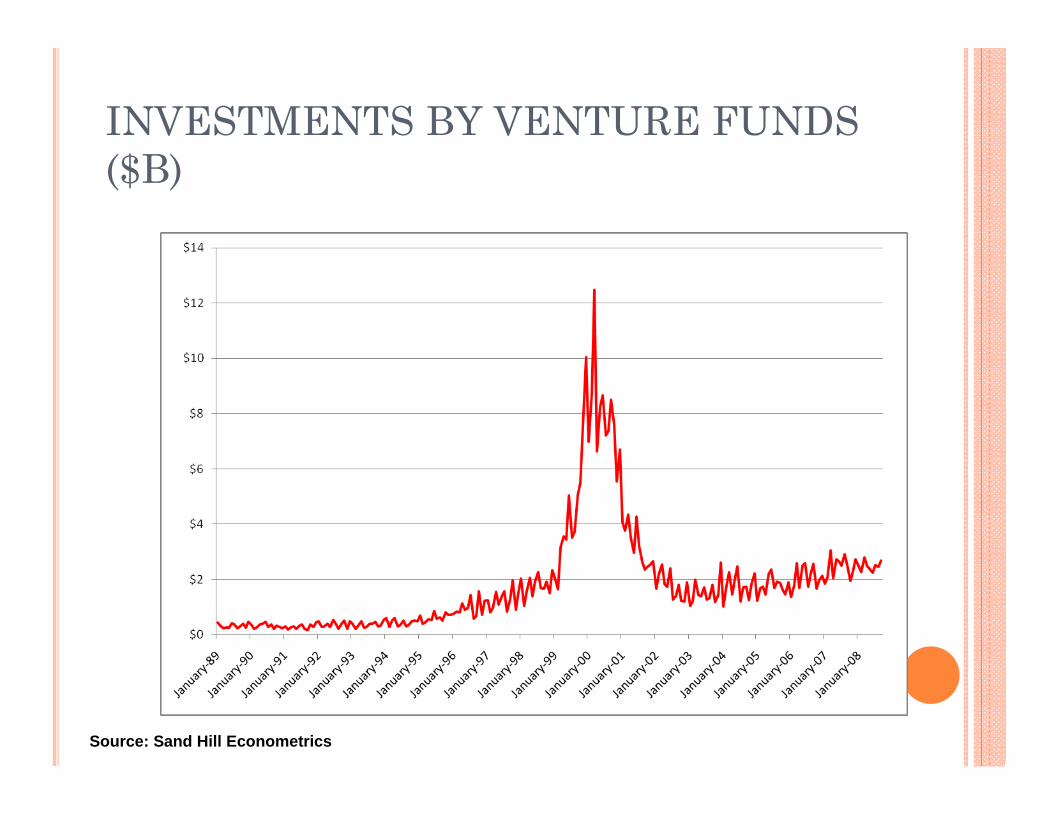
INVESTMENTS BY VENTURE FUNDS ($B)
Source: Sand Hill Econometrics
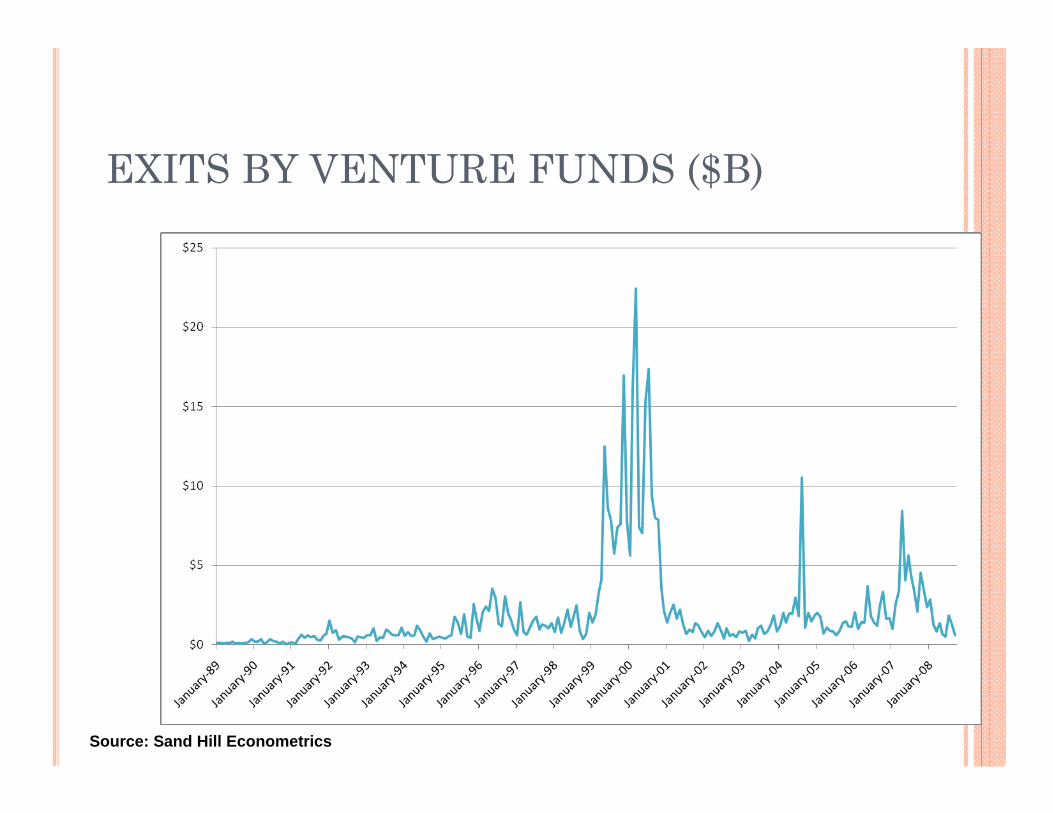
EXITS BY VENTURE FUNDS ($B)
Source: Sand Hill Econometrics
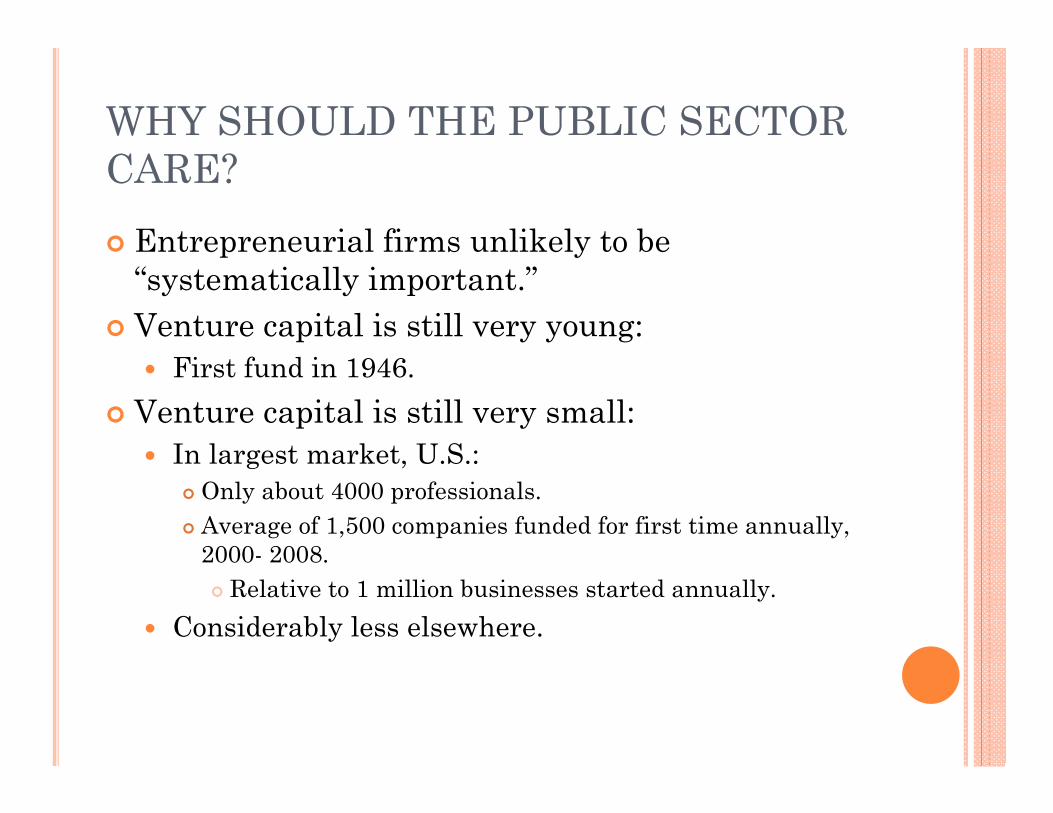
WHY SHOULD THE PUBLIC SECTOR CARE? Entrepreneurial firms unlikely to be
“systematically important.” Venture capital is still very young:
First fund in 1946. Venture capital is still very small:
In largest market, U.S.: Only about 4000 professionals. Average of 1,500 companies funded for first time annually,
2000- 2008. Relative to 1 million businesses started annually.
Considerably less elsewhere.
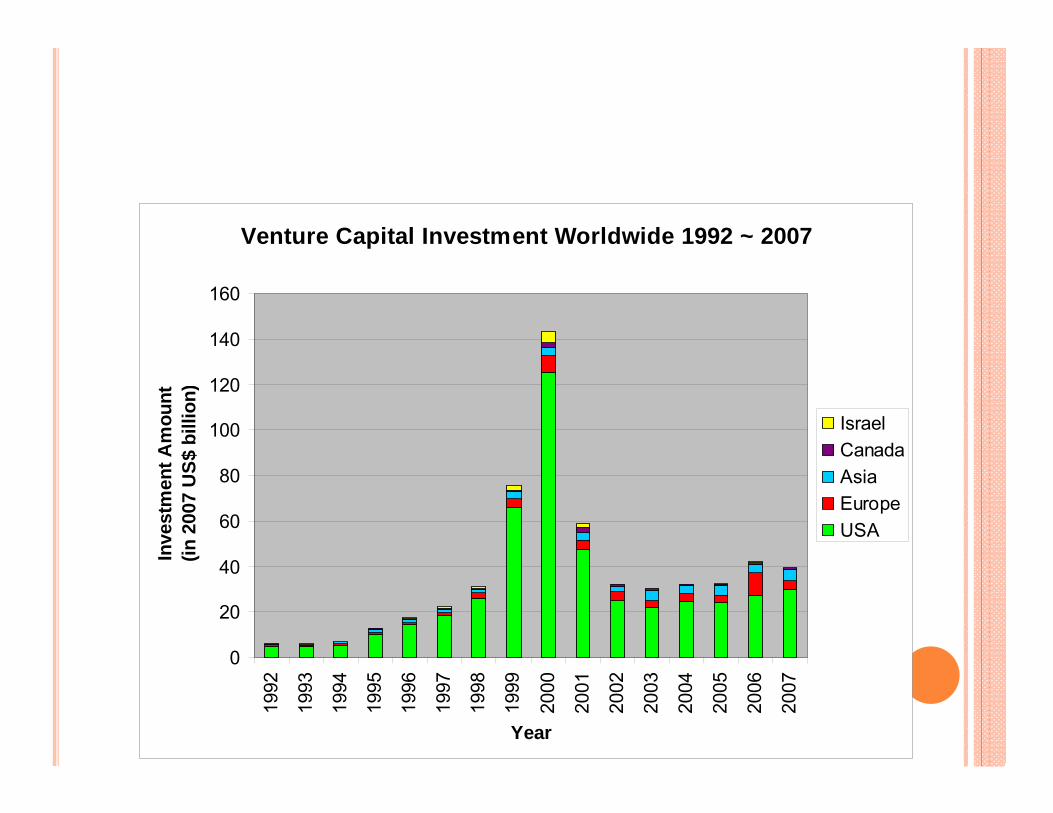
Venture Capital Investment Worldwide 1992 ~ 2007
0
20
40
60
80
100
120
140
16019
92
1993
1994
1995
1996
1997
1998
1999
2000
2001
2002
2003
2004
2005
2006
2007
Year
Inve
stm
ent A
mou
nt(in
200
7 U
S$ b
illio
n)
IsraelCanadaAsiaEuropeUSA
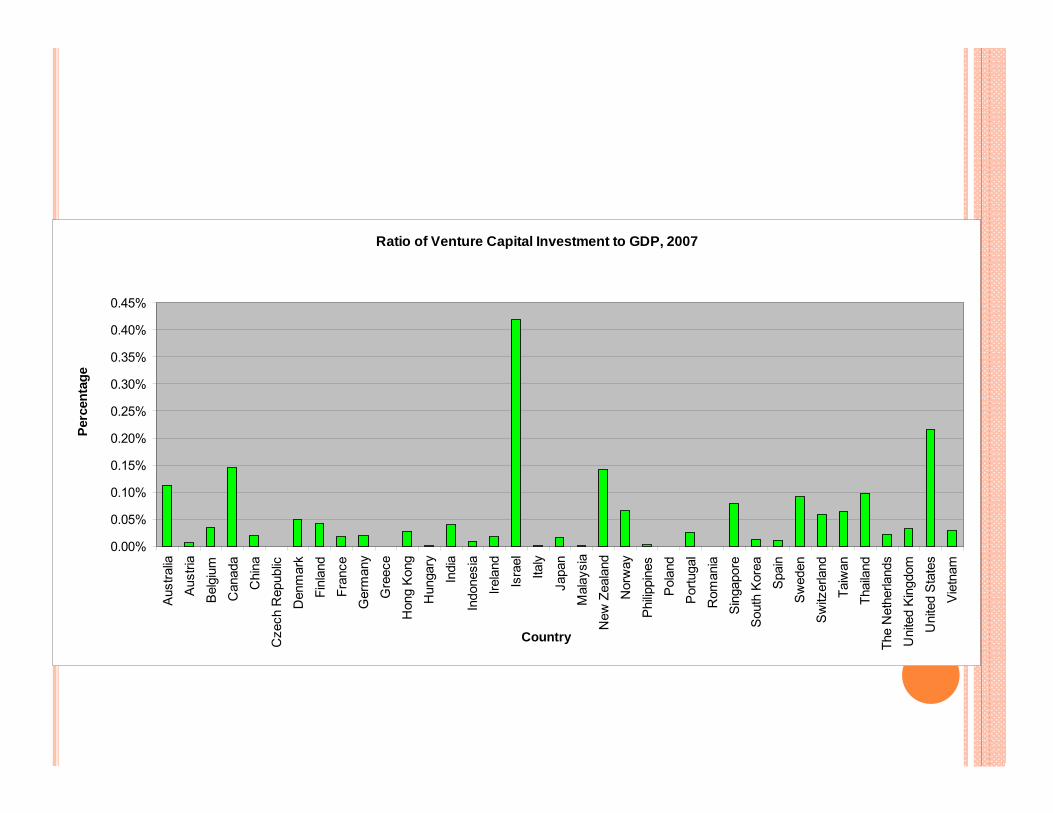
Ratio of Venture Capital Investment to GDP, 2007
0.00%
0.05%
0.10%
0.15%
0.20%
0.25%
0.30%
0.35%
0.40%
0.45%
Aus
tralia
Aus
tria
Bel
gium
Can
ada
Chi
naC
zech
Rep
ublic
Den
mar
k
Finl
and
Fran
ce
Ger
man
y
Gre
ece
Hon
g Ko
ngH
unga
ry
Indi
a
Indo
nesi
aIre
land
Isra
el
Italy
Japa
n
Mal
aysi
a
New
Zea
land
Nor
way
Phi
lippi
nes
Pola
ndP
ortu
gal
Rom
ania
Sing
apor
eS
outh
Kor
ea
Spa
in
Sw
eden
Sw
itzer
land
Taiw
an
Thai
land
The
Net
herla
nds
Uni
ted
Kin
gdom
Uni
ted
Stat
esV
ietn
am
Country
Perc
enta
ge
BUT IMPORTANCE FAR BEYOND ITS SIZE Young high-tech and restructuring firms pose
many challenges: Uncertainty. Information gaps. The nature of the firm’s assets. Market conditions.
Difficult for traditional financiers to fund these firms: Banks. Public markets.
“I realize, gentlemen, that thirty million dollars is a lot of money to spend. However, it’s not real money and, of course, it’s not our money either.”

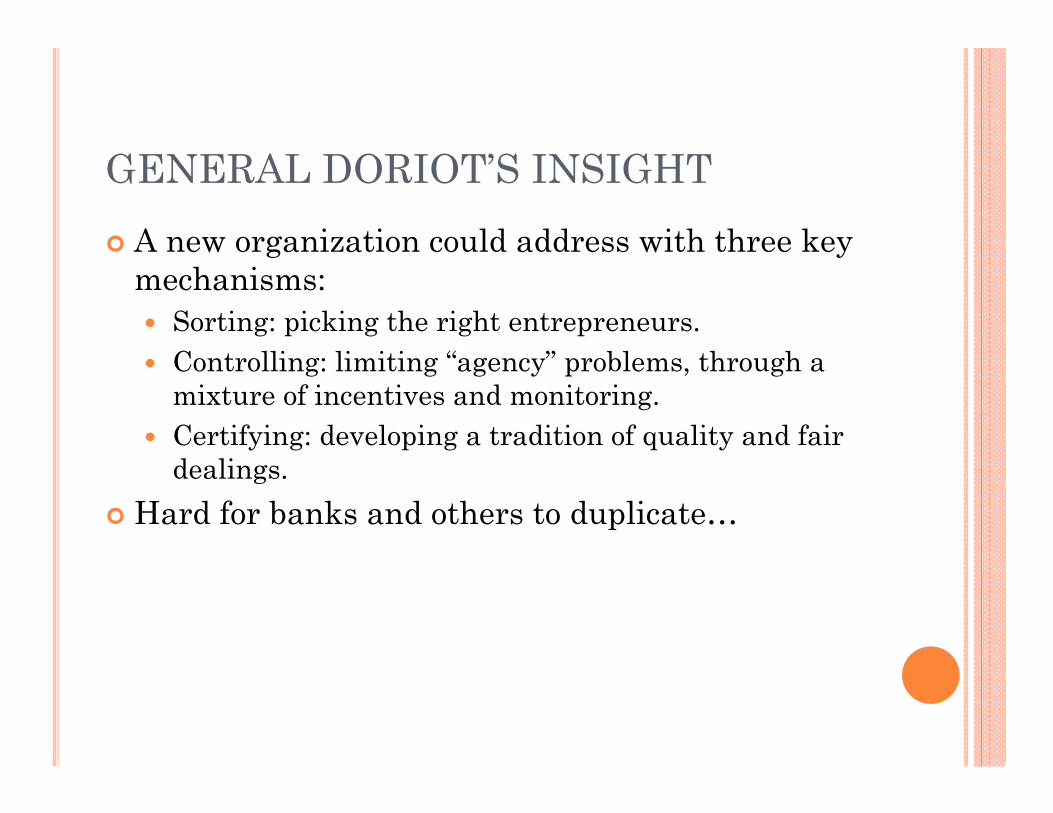
GENERAL DORIOT’S INSIGHT A new organization could address with three key
mechanisms: Sorting: picking the right entrepreneurs. Controlling: limiting “agency” problems, through a
mixture of incentives and monitoring. Certifying: developing a tradition of quality and fair
dealings. Hard for banks and others to duplicate…

18
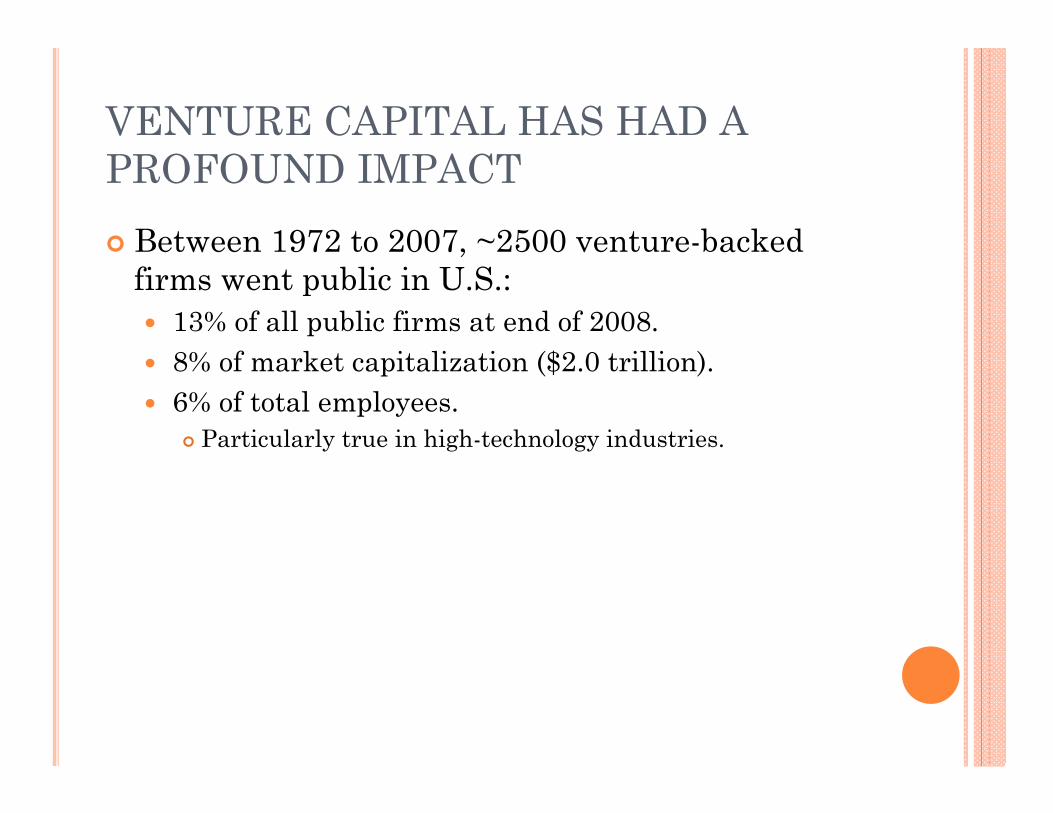
VENTURE CAPITAL HAS HAD A PROFOUND IMPACT Between 1972 to 2007, ~2500 venture-backed
firms went public in U.S.: 13% of all public firms at end of 2008. 8% of market capitalization ($2.0 trillion). 6% of total employees.
Particularly true in high-technology industries.

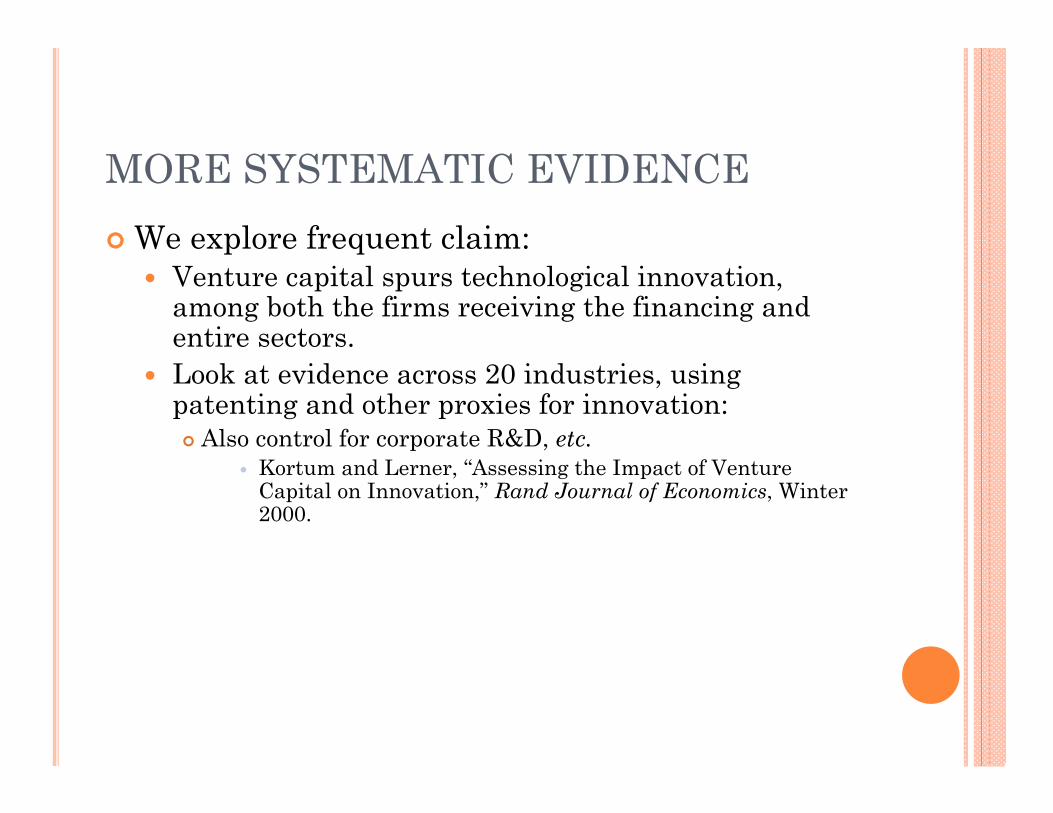
MORE SYSTEMATIC EVIDENCE We explore frequent claim:
Venture capital spurs technological innovation, among both the firms receiving the financing and entire sectors.
Look at evidence across 20 industries, using patenting and other proxies for innovation: Also control for corporate R&D, etc.
Kortum and Lerner, “Assessing the Impact of Venture Capital on Innovation,” Rand Journal of Economics, Winter 2000.
WHAT THE REGRESSIONS TELL USVenture capital appears ~3 to 4 times
more powerful than corporate R&D. Even after control for causality concerns.
From late 70s to mid-90s, VC was only 3% of corporate R&D, but responsible for ~10%-12% of privately funded innovations.
Potentially even greater influence in more recent years.
Similar evidence in parallel studies.

WHY A GOVERNMENT ROLE? Increasing returns to scale
Much easier to do 100th deal than the first: Knowledge and expectations of entrepreneurs. Familiarity of intermediaries. Sharing of information among peers. Comfort level of institutional investors.
Economists term these “externalities.” In these cases, government can frequently play a
catalytic role.
ILLUSTRATIONS FROM HISTORY In the U.S.:
Critical role of SBIC program. Established in 1958. Many early VC firms started as SBIC awardees, then
opted out. Building critical “infrastructure”: Lawyers, data
providers, etc. Similar insights from Israel, Singapore, etc.
Suggests that some of funding should be directed to growing industries!

MANY RECENT EXAMPLES
TWO FUNDAMENTAL PROBLEMS Incompetence:
Often, relatively little familiarity with worlds of entrepreneurship and venture capital.
Many well-intentioned efforts are poorly executed. “Capture”:
Public efforts can be directed to well-connected parties, who seek to benefit themselves.

THE BRITTANY MISADVENTURE Building a high-technology
cluster in Brittany: Response to decline in
shipbuilding activity in 1990s.
Sought to build local Silicon Valley in response… despite lack of high-tech tradition.
Focus of public spending was building broad-band network, training programs.
Spending benefited France Telecom, local universities, but little entrepreneurship,
THE IOWA MISADVENTURE Sought to encourage venture activity in early
1990s by earmarking part of state pension fund. Issued RFP for local fund and waited for
responses: Ended up selecting lightly-regarded group with no
experience in region. Despite hefty management fees, fund had hard
time finding deals. State sought to terminate fund:
VCs ended up suing state for fees and profits would have made, could they find deals!
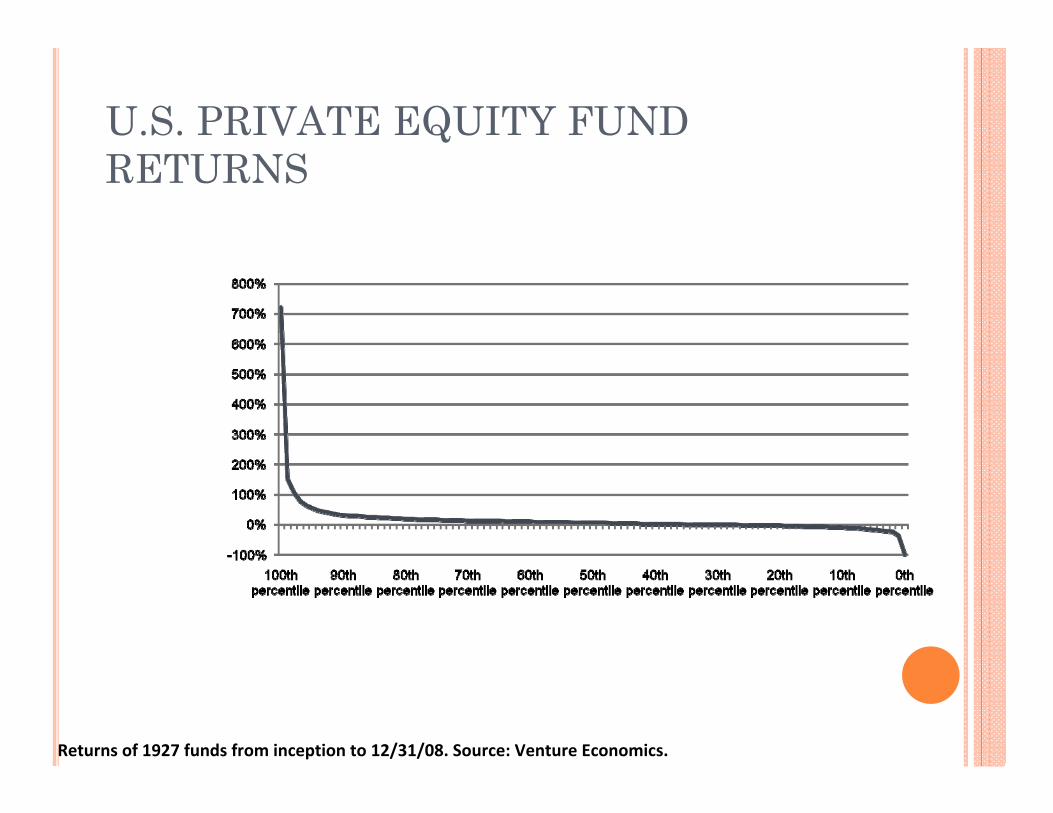
U.S. PRIVATE EQUITY FUND RETURNS
Returns of 1927 funds from inception to 12/31/08. Source: Venture Economics.
THE BITS MISADVENTURE Sought to promote incubators to help young
entrepreneurs: Largely funded from government’s stake in Telstra
privatization. But at typical incubator, >50% of funding went to
incubator managers, not entrepreneurs. In fact, managers even hindered firm progress:
Forcing them to use in-house service providers, even if less qualified.
Charging above market rates. For basic services Deficiencies eventually remedied.
BUT Undoubted growth in entrepreneurship in many
regions: China. Israel Singapore. Taiwan.
Aggressive government policy in all these markets… And undoubtedly had much to do with growth.

THREE KEY PRINCIPLES Making sure table is set. Ensuring effective design by listening to the
market. Avoiding self-defeating design errors.

“STAGE SETTING” Ensuring entrepreneurship is attractive:
Tax regime: Studies suggest critical role of capital gains vs. income
effective tax rate differential. Easing formal and informal sanctions on involvement
in failed ventures. Singapore’s Phoenix award.
Easing barriers to technology transfer. Entrepreneurship education for students and
professionals alike.
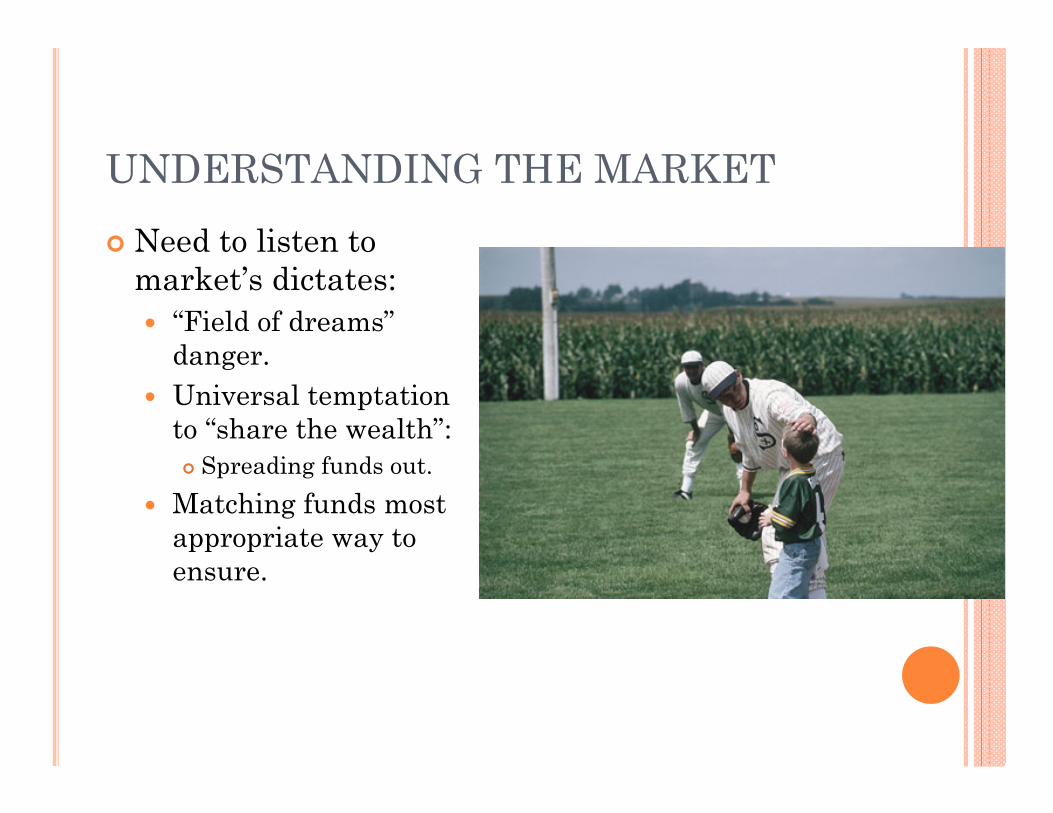
UNDERSTANDING THE MARKET Need to listen to
market’s dictates: “Field of dreams”
danger. Universal temptation
to “share the wealth”: Spreading funds out.
Matching funds most appropriate way to ensure.
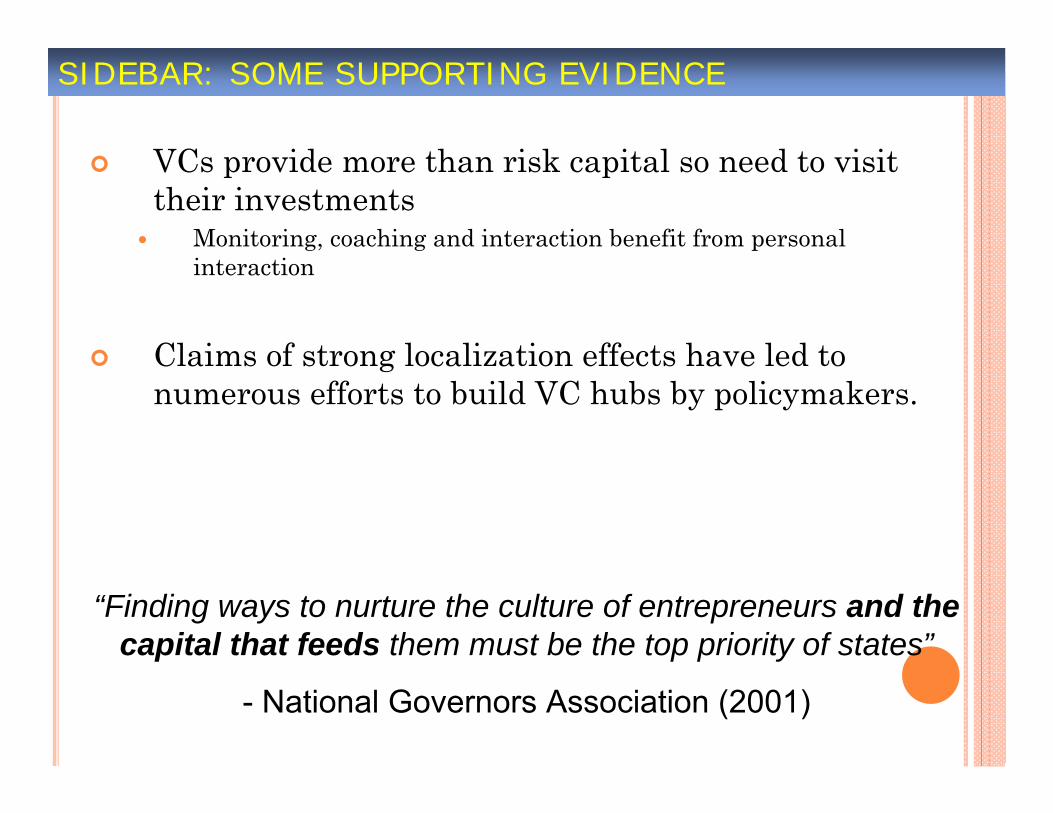
SIDEBAR: SOME SUPPORTING EVIDENCE
VCs provide more than risk capital so need to visit their investments
Monitoring, coaching and interaction benefit from personal interaction
Claims of strong localization effects have led to numerous efforts to build VC hubs by policymakers.
“Finding ways to nurture the culture of entrepreneurs and the capital that feeds them must be the top priority of states”
- National Governors Association (2001)
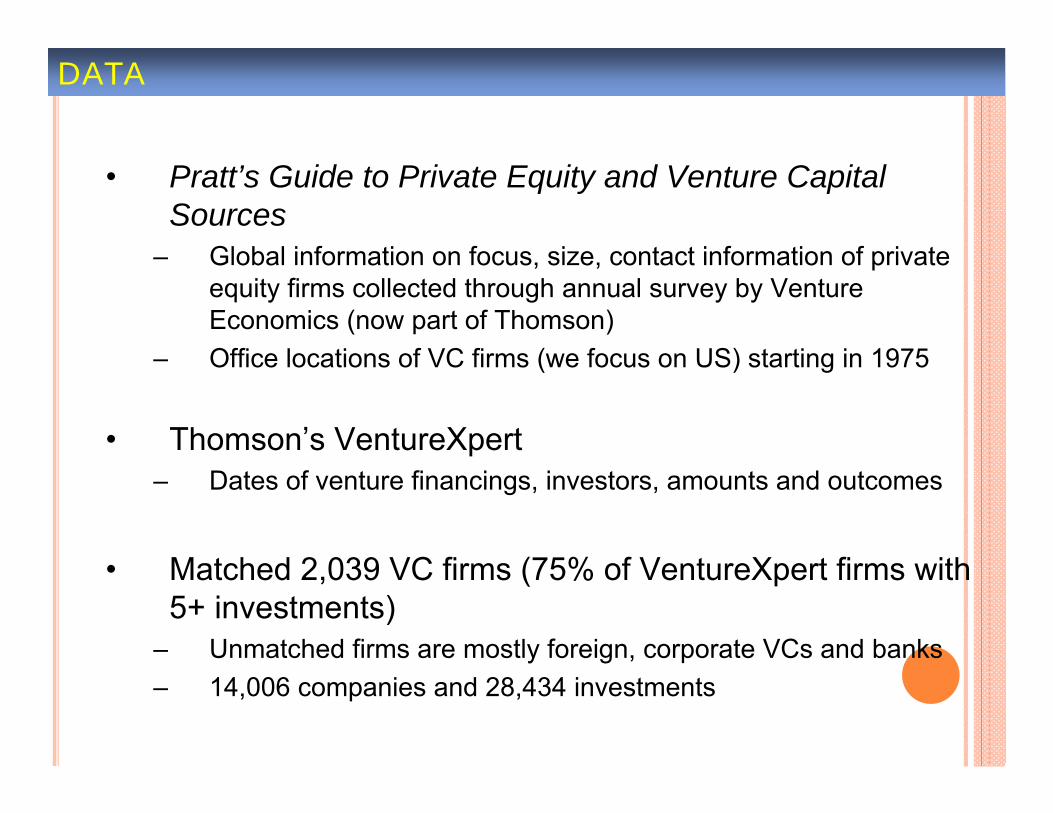
DATA
• Pratt’s Guide to Private Equity and Venture Capital Sources
– Global information on focus, size, contact information of private equity firms collected through annual survey by Venture Economics (now part of Thomson)
– Office locations of VC firms (we focus on US) starting in 1975
• Thomson’s VentureXpert– Dates of venture financings, investors, amounts and outcomes
• Matched 2,039 VC firms (75% of VentureXpert firms with 5+ investments)
– Unmatched firms are mostly foreign, corporate VCs and banks– 14,006 companies and 28,434 investments
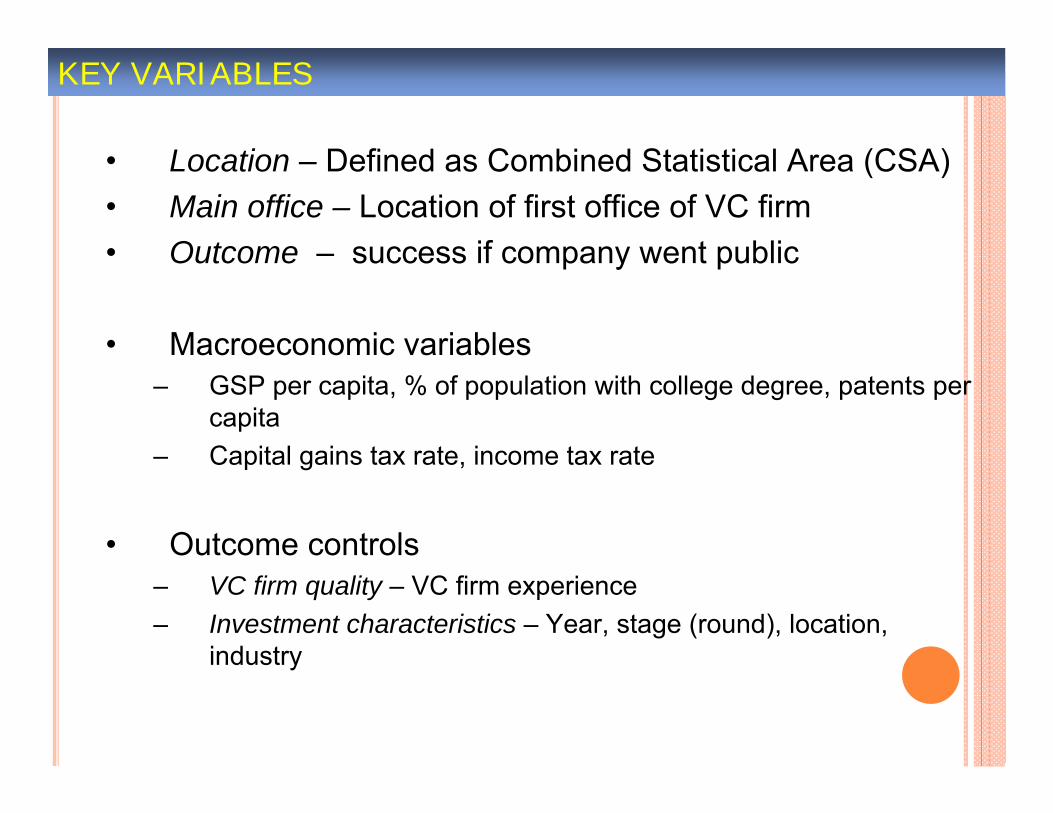
KEY VARIABLES
• Location – Defined as Combined Statistical Area (CSA)• Main office – Location of first office of VC firm• Outcome – success if company went public
• Macroeconomic variables– GSP per capita, % of population with college degree, patents per
capita– Capital gains tax rate, income tax rate
• Outcome controls– VC firm quality – VC firm experience– Investment characteristics – Year, stage (round), location,
industry
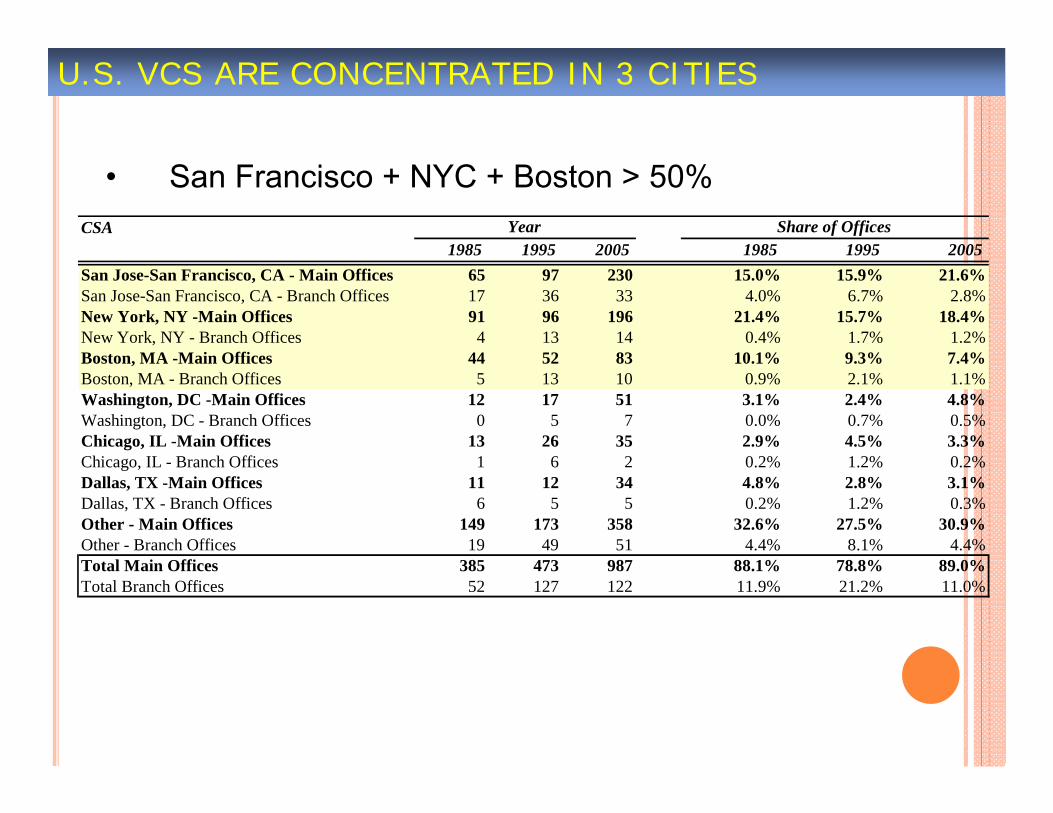
U.S. VCS ARE CONCENTRATED IN 3 CITIES
• San Francisco + NYC + Boston > 50%
1985 1995 2005 1985 1995 2005San Jose-San Francisco, CA - Main Offices 65 97 230 15.0% 15.9% 21.6%San Jose-San Francisco, CA - Branch Offices 17 36 33 4.0% 6.7% 2.8%New York, NY -Main Offices 91 96 196 21.4% 15.7% 18.4%New York, NY - Branch Offices 4 13 14 0.4% 1.7% 1.2%Boston, MA -Main Offices 44 52 83 10.1% 9.3% 7.4%Boston, MA - Branch Offices 5 13 10 0.9% 2.1% 1.1%Washington, DC -Main Offices 12 17 51 3.1% 2.4% 4.8%Washington, DC - Branch Offices 0 5 7 0.0% 0.7% 0.5%Chicago, IL -Main Offices 13 26 35 2.9% 4.5% 3.3%Chicago, IL - Branch Offices 1 6 2 0.2% 1.2% 0.2%Dallas, TX -Main Offices 11 12 34 4.8% 2.8% 3.1%Dallas, TX - Branch Offices 6 5 5 0.2% 1.2% 0.3%Other - Main Offices 149 173 358 32.6% 27.5% 30.9%Other - Branch Offices 19 49 51 4.4% 8.1% 4.4%Total Main Offices 385 473 987 88.1% 78.8% 89.0%Total Branch Offices 52 127 122 11.9% 21.2% 11.0%
CSA Year Share of Offices
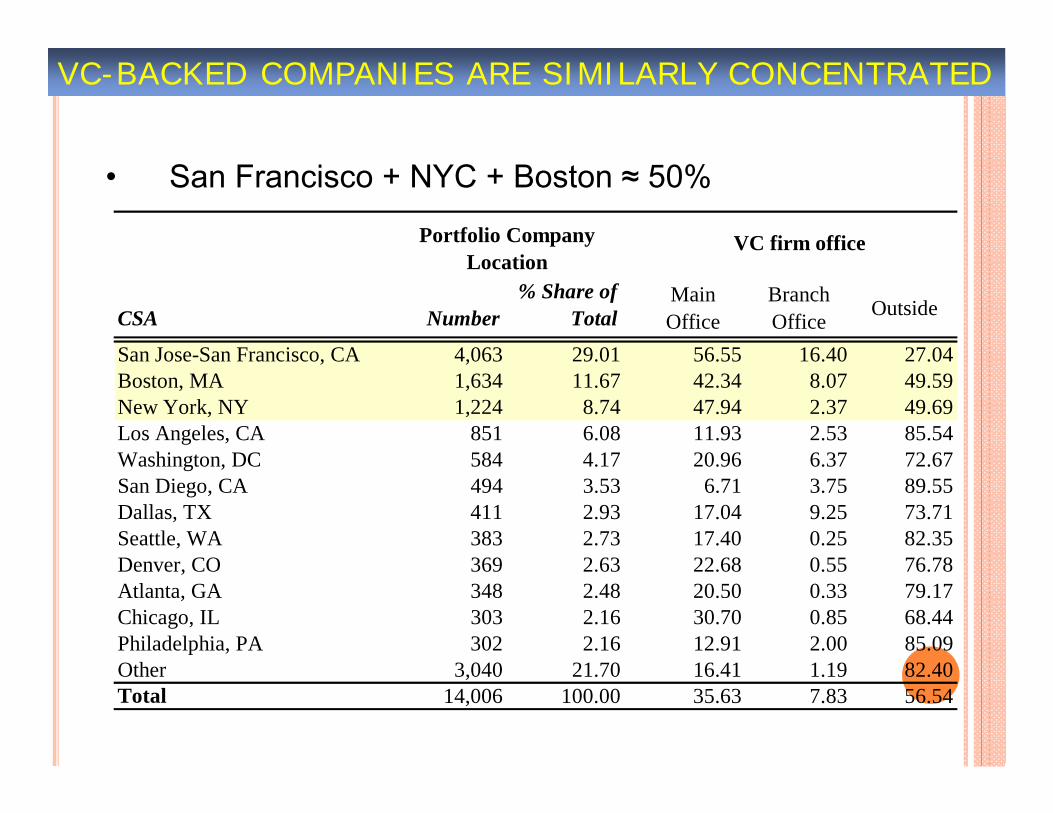
VC-BACKED COMPANIES ARE SIMILARLY CONCENTRATED
• San Francisco + NYC + Boston ≈ 50%
CSA Number% Share of
TotalMain Office
Branch Office Outside
San Jose-San Francisco, CA 4,063 29.01 56.55 16.40 27.04Boston, MA 1,634 11.67 42.34 8.07 49.59New York, NY 1,224 8.74 47.94 2.37 49.69Los Angeles, CA 851 6.08 11.93 2.53 85.54Washington, DC 584 4.17 20.96 6.37 72.67San Diego, CA 494 3.53 6.71 3.75 89.55Dallas, TX 411 2.93 17.04 9.25 73.71Seattle, WA 383 2.73 17.40 0.25 82.35Denver, CO 369 2.63 22.68 0.55 76.78Atlanta, GA 348 2.48 20.50 0.33 79.17Chicago, IL 303 2.16 30.70 0.85 68.44Philadelphia, PA 302 2.16 12.91 2.00 85.09Other 3,040 21.70 16.41 1.19 82.40Total 14,006 100.00 35.63 7.83 56.54
Portfolio Company Location
VC firm office
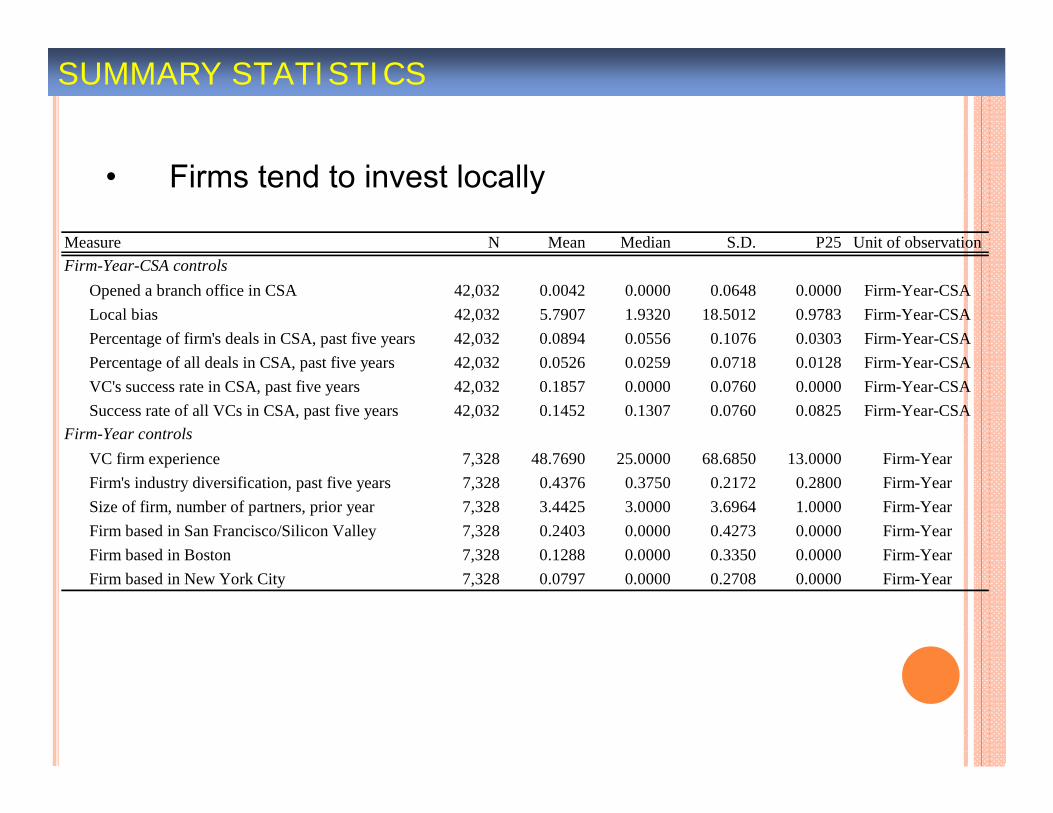
SUMMARY STATISTICS
• Firms tend to invest locally
Measure N Mean Median S.D. P25 Unit of observation
Opened a branch office in CSA 42,032 0.0042 0.0000 0.0648 0.0000 Firm-Year-CSALocal bias 42,032 5.7907 1.9320 18.5012 0.9783 Firm-Year-CSAPercentage of firm's deals in CSA, past five years 42,032 0.0894 0.0556 0.1076 0.0303 Firm-Year-CSAPercentage of all deals in CSA, past five years 42,032 0.0526 0.0259 0.0718 0.0128 Firm-Year-CSAVC's success rate in CSA, past five years 42,032 0.1857 0.0000 0.0760 0.0000 Firm-Year-CSASuccess rate of all VCs in CSA, past five years 42,032 0.1452 0.1307 0.0760 0.0825 Firm-Year-CSA
VC firm experience 7,328 48.7690 25.0000 68.6850 13.0000 Firm-YearFirm's industry diversification, past five years 7,328 0.4376 0.3750 0.2172 0.2800 Firm-YearSize of firm, number of partners, prior year 7,328 3.4425 3.0000 3.6964 1.0000 Firm-YearFirm based in San Francisco/Silicon Valley 7,328 0.2403 0.0000 0.4273 0.0000 Firm-YearFirm based in Boston 7,328 0.1288 0.0000 0.3350 0.0000 Firm-YearFirm based in New York City 7,328 0.0797 0.0000 0.2708 0.0000 Firm-Year
Firm-Year-CSA controls
Firm-Year controls
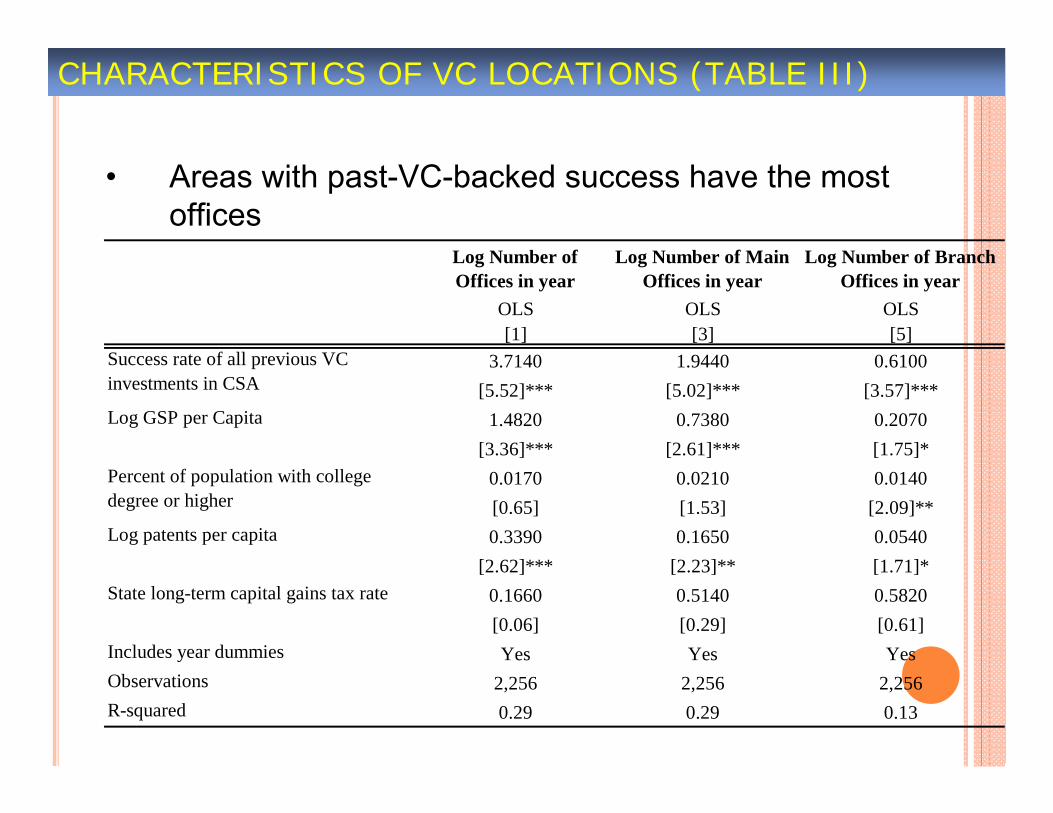
CHARACTERISTICS OF VC LOCATIONS (TABLE III)
• Areas with past-VC-backed success have the most offices
[1] [3] [5]3.7140 1.9440 0.6100
[5.52]*** [5.02]*** [3.57]***1.4820 0.7380 0.2070
[3.36]*** [2.61]*** [1.75]*0.0170 0.0210 0.0140[0.65] [1.53] [2.09]**0.3390 0.1650 0.0540
[2.62]*** [2.23]** [1.71]*0.1660 0.5140 0.5820[0.06] [0.29] [0.61]
Includes year dummies Yes Yes YesObservations 2,256 2,256 2,256R-squared 0.29 0.29 0.13
Log GSP per Capita
OLS OLS OLS
Percent of population with college degree or higher
Log patents per capita
State long-term capital gains tax rate
Log Number of Offices in year
Log Number of Main Offices in year
Log Number of Branch Offices in year
Success rate of all previous VC investments in CSA
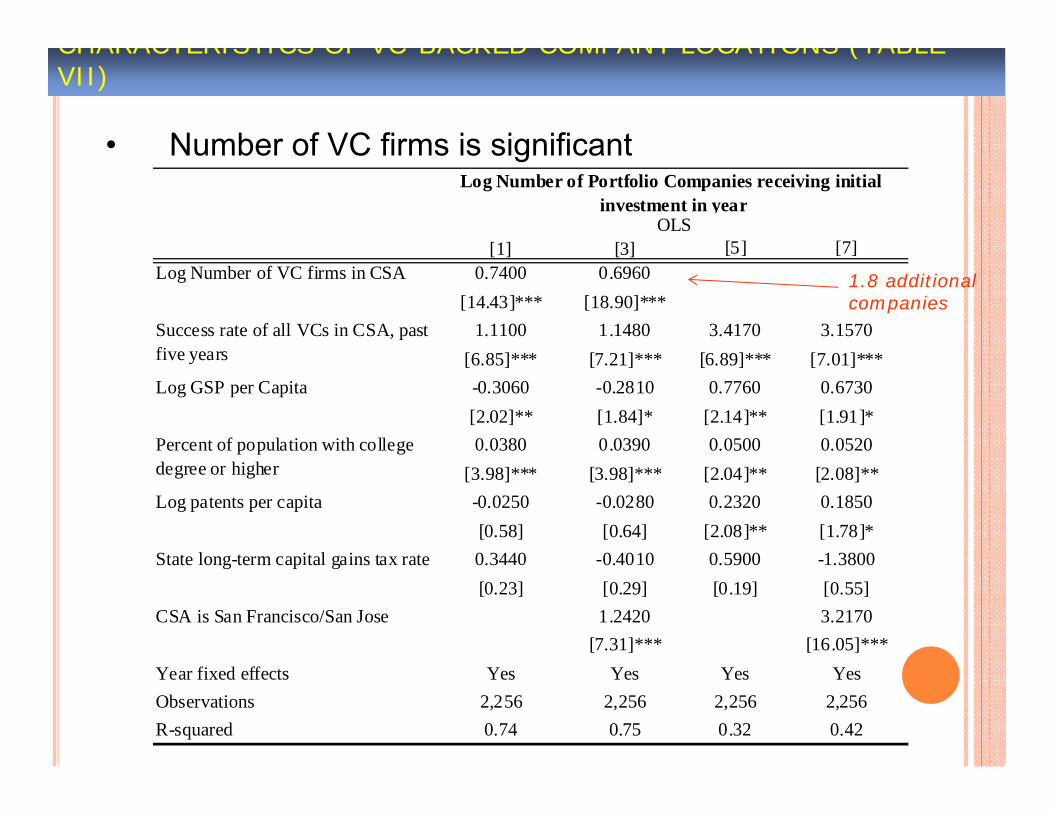
CHARACTERISTICS OF VC BACKED COMPANY LOCATIONS (TABLE VII)
• Number of VC firms is significant
1.8 additional companies
[1] [3] [5] [7]0.7400 0.6960
[14.43]*** [18.90]***1.1100 1.1480 3.4170 3.1570
[6.85]*** [7.21]*** [6.89]*** [7.01]***-0.3060 -0.2810 0.7760 0.6730[2.02]** [1.84]* [2.14]** [1.91]*0.0380 0.0390 0.0500 0.0520
[3.98]*** [3.98]*** [2.04]** [2.08]**-0.0250 -0.0280 0.2320 0.1850[0.58] [0.64] [2.08]** [1.78]*0.3440 -0.4010 0.5900 -1.3800[0.23] [0.29] [0.19] [0.55]
1.2420 3.2170[7.31]*** [16.05]***
Year fixed effects Yes Yes Yes YesObservations 2,256 2,256 2,256 2,256R-squared 0.74 0.75 0.32 0.42
Percent of population with college degree or higher
Log patents per capita
State long-term capital gains tax rate
CSA is San Francisco/San Jose
Log Number of Portfolio Companies receiving initial investment in year
OLS
Log Number of VC firms in CSA
Success rate of all VCs in CSA, past five years
Log GSP per Capita
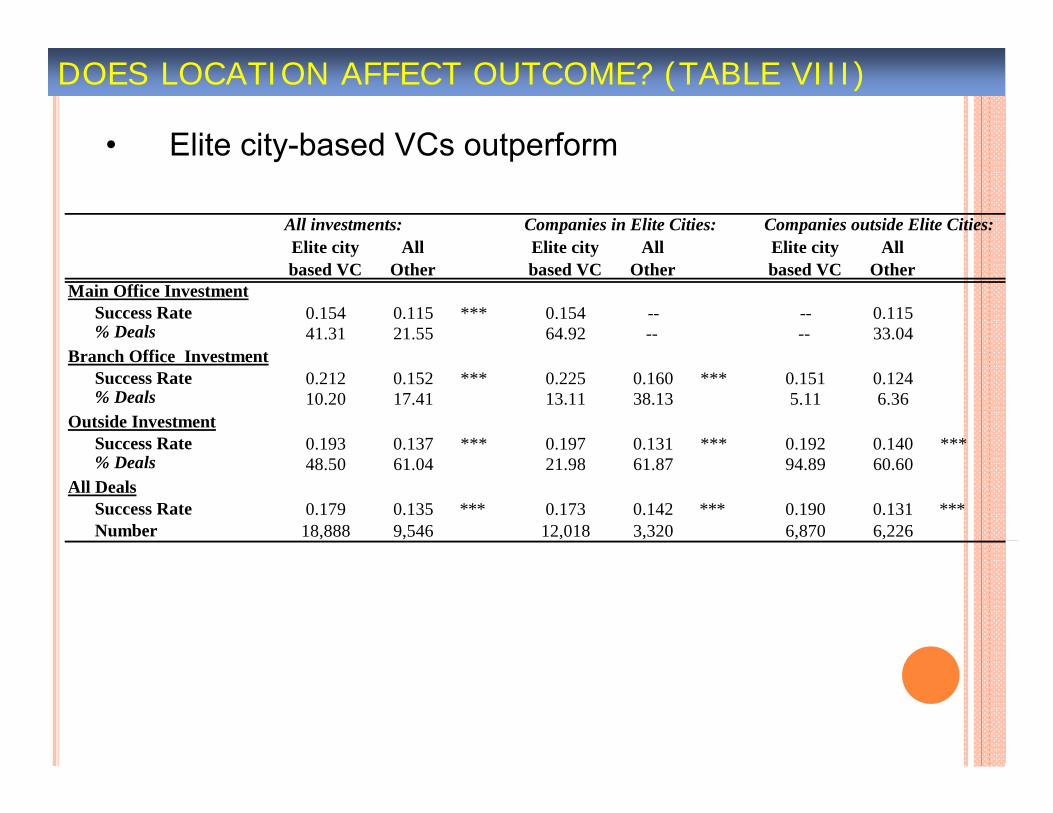
DOES LOCATION AFFECT OUTCOME? (TABLE VIII)
• Elite city-based VCs outperform
Companies outside Elite Cities:
Main Office InvestmentSuccess Rate 0.154 0.115 *** 0.154 -- -- 0.115% Deals 41.31 21.55 64.92 -- -- 33.04
Branch Office InvestmentSuccess Rate 0.212 0.152 *** 0.225 0.160 *** 0.151 0.124% Deals 10.20 17.41 13.11 38.13 5.11 6.36
Outside InvestmentSuccess Rate 0.193 0.137 *** 0.197 0.131 *** 0.192 0.140 ***% Deals 48.50 61.04 21.98 61.87 94.89 60.60
All DealsSuccess Rate 0.179 0.135 *** 0.173 0.142 *** 0.190 0.131 ***Number 18,888 9,546 12,018 3,320 6,870 6,226
All Other
Elite city based VC
Companies in Elite Cities:Elite city based VC
All Other
Elite city based VC
All Other
All investments:
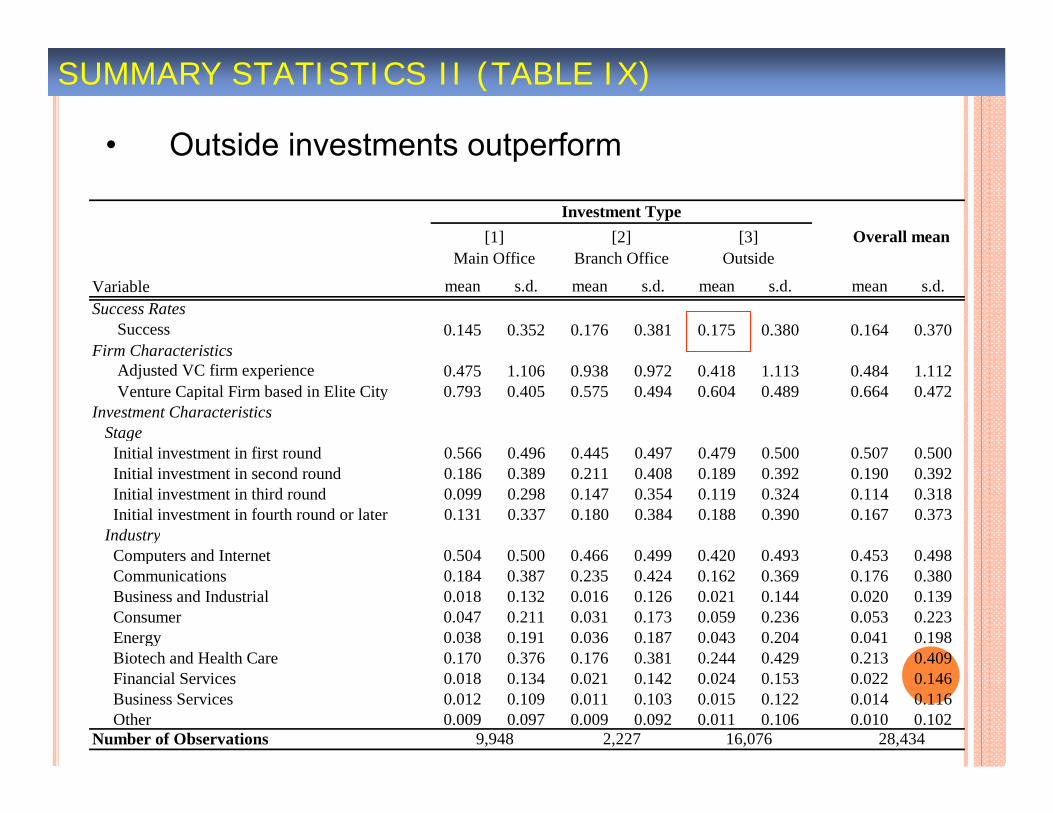
SUMMARY STATISTICS II (TABLE IX)
• Outside investments outperform
Variable mean s.d. mean s.d. mean s.d. mean s.d.Success Rates
Success 0.145 0.352 0.176 0.381 0.175 0.380 0.164 0.370Firm Characteristics
Adjusted VC firm experience 0.475 1.106 0.938 0.972 0.418 1.113 0.484 1.112Venture Capital Firm based in Elite City 0.793 0.405 0.575 0.494 0.604 0.489 0.664 0.472
Investment CharacteristicsStage
Initial investment in first round 0.566 0.496 0.445 0.497 0.479 0.500 0.507 0.500 Initial investment in second round 0.186 0.389 0.211 0.408 0.189 0.392 0.190 0.392 Initial investment in third round 0.099 0.298 0.147 0.354 0.119 0.324 0.114 0.318 Initial investment in fourth round or later 0.131 0.337 0.180 0.384 0.188 0.390 0.167 0.373
Industry Computers and Internet 0.504 0.500 0.466 0.499 0.420 0.493 0.453 0.498 Communications 0.184 0.387 0.235 0.424 0.162 0.369 0.176 0.380 Business and Industrial 0.018 0.132 0.016 0.126 0.021 0.144 0.020 0.139 Consumer 0.047 0.211 0.031 0.173 0.059 0.236 0.053 0.223 Energy 0.038 0.191 0.036 0.187 0.043 0.204 0.041 0.198 Biotech and Health Care 0.170 0.376 0.176 0.381 0.244 0.429 0.213 0.409 Financial Services 0.018 0.134 0.021 0.142 0.024 0.153 0.022 0.146 Business Services 0.012 0.109 0.011 0.103 0.015 0.122 0.014 0.116 Other 0.009 0.097 0.009 0.092 0.011 0.106 0.010 0.102Number of Observations 28,434
Investment TypeOverall mean[1]
Main Office[2]
Branch Office[3]
Outside
9,948 2,227 16,076
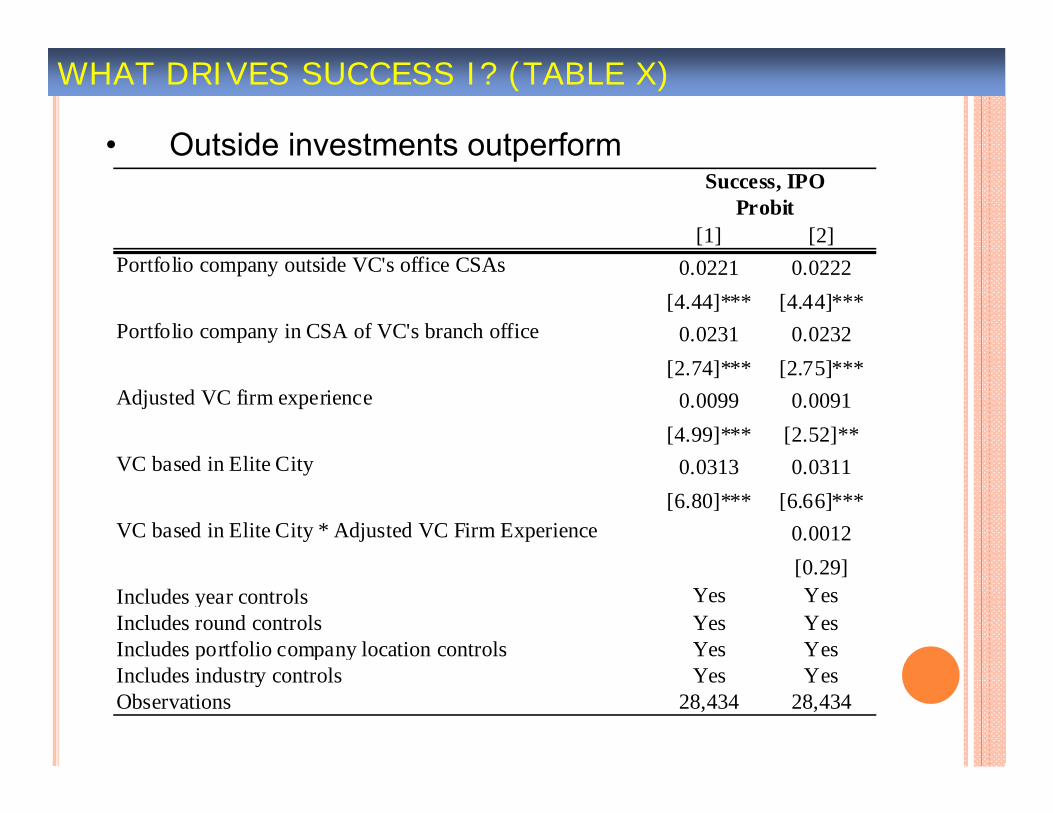
WHAT DRIVES SUCCESS I? (TABLE X)
• Outside investments outperform
[1] [2]0.0221 0.0222
[4.44]*** [4.44]***0.0231 0.0232
[2.74]*** [2.75]***0.0099 0.0091
[4.99]*** [2.52]**0.0313 0.0311
[6.80]*** [6.66]***0.0012[0.29]
Includes year controls Yes YesIncludes round controls Yes YesIncludes portfolio company location controls Yes YesIncludes industry controls Yes YesObservations 28,434 28,434
VC based in Elite City
VC based in Elite City * Adjusted VC Firm Experience
Success, IPOProbit
Portfolio company outside VC's office CSAs
Portfolio company in CSA of VC's branch office
Adjusted VC firm experience
CONCLUSIONS
• VC firms and VC-backed companies are highly concentrated
– Consistent with agglomeration economies in high-technology clusters
• Elite city VC firms achieve higher returns on non-local investments
– Wedge from personal costs of non-local travel?
• Suggests skepticism about the wisdom of trying to subsize too many hubs.
GETTING DETAILS RIGHT Appropriate sizing:
Too small may not make a difference. Too big may flood local investor.
Avoiding rules that go against what market needs.
Need to ensure incentives to ensure participants do well if meet goals.
Allowing to programs to evolve and adjust over time.
Evaluation of managers and program itself.

FINAL THOUGHTS The critical rationale…
And the many pitfalls. Three key points:
More than money is needed: entrepreneurship is not in a vacuum.
The virtues of market guidance. Getting details right important as well.
Need for patience!

Josh LernerRock Center for Entrepreneurship
Harvard Business SchoolBoston, MA 02163 USA
www.people.hbs.edu/jlerner