the bitter fruits of easy money - friedberg
TRANSCRIPT

Friedberg Commodity Management Inc.
- B E R G
Volume 11, No. 8 September 16,1990
The bitter fruits of easy moneyIn the early days of 1989, the Bank of Japan began to implement a gradual, albeit timid, increase in interest rates to combat the double-digit growth of money, a weakening yen, and a spiralling asset bubble.
Because the Great Credit Inflation of the ’80s did not have an appreciable impact on consumer prices, the market was temporarily lulled into believing that inflation was not a problem. As a result, long term bond yields remained relatively subdued allowing a 140-basis-point inverse yield curve to develop between three-month Euro-yen and 10-year government bonds.
Since the end of 1989, the inversion has flattened; the ascent of money market rates has been slowed by a Central Bank terrified at the collapse in stock prices and its impact on bank solvency, and long-term rates have, with increasing speed, begun to take note of the fact that they cannot, indefinitely, stay below the rate of money and credit growth.
As of this past week, yields on the heavily traded #119 exceed three-month Euro-yen by five basis points. The flattening of the yield curve indicates that the BOJ has, at least temporarily, lost control of monetary policy. Which seems to imply still higher rates down the pike...
While the impact on stock and bond futures is decidedly bearish, the impact on the currency is less clear. On the one hand, the relatively more accommodative BOJ posture permits a continuing high level of growth in nominal demand, causing a further narrowing of the surplus on current account. Since movements in current account are known to track yen fluctuations reasonably well, a weaker yen can be deduced. On the other hand, rising interest rates are producing a positive differential vis a vis European currencies and the US dollar, with favorable consequences for the yen.
Given the freedom of capital movements and the large pool of capital in search for high nominal yields — tempered only by clear signs of overvaluation, a vague and difficult-to- measure condition — we surmise that the capital flows effect will be the dominant one. Therefore, the yen is likely to continue to improve in the weeks and months ahead despite a shrinking current account surplus.
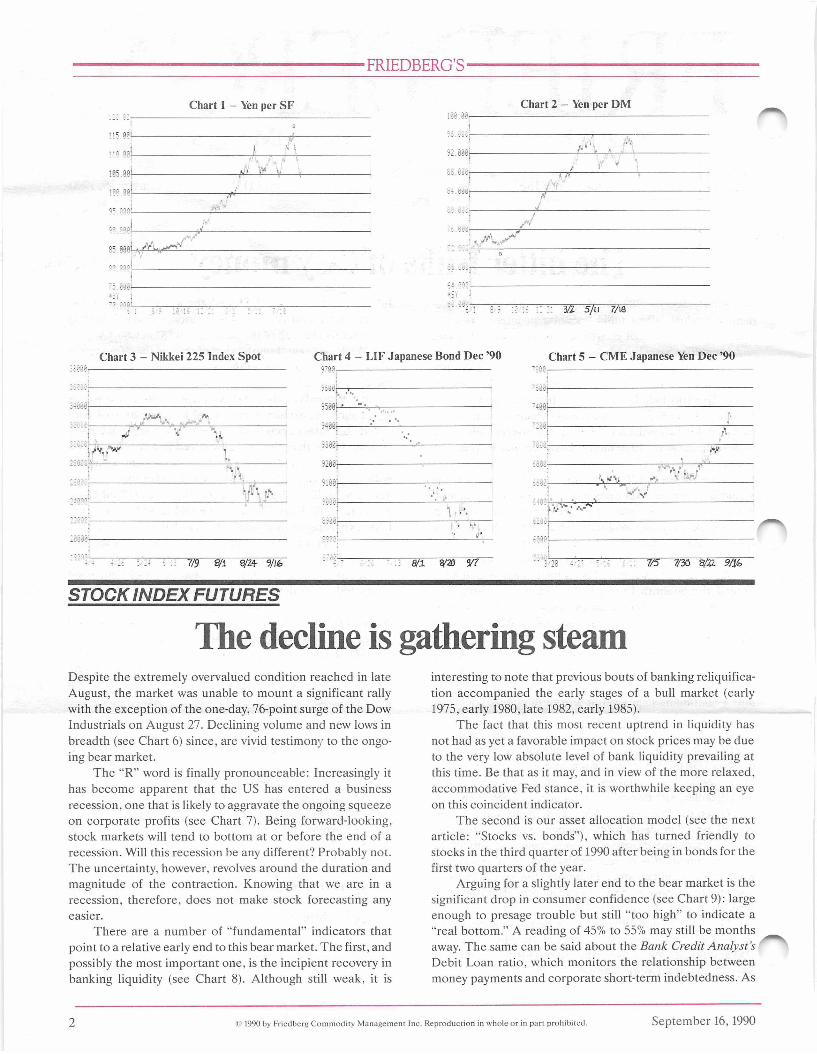
During 1989 and 1990 we benefitted handsomely from the view that the yen would weaken significantly vis a vis the DM and the SF. We initiated the cross-trade (long DM (and Swiss franc)/short yen) at around 74 yen/DM (see FC&CC
July 23, 1989 “On the US$ and the yen-DM cross”) and maintained it until August 24 (see Hotline Update), bailing out at nearly the high of the move (point “S” in Chart 1).
While our new “bullish” view of the yen therefore represents a dramatic reversal of the successfully-held notion that the yen was bound to depreciate, we are comforted by three additional shreds of favorable evidence: a) among industrialized countries, exchange rates tend to correlate well with differential rates of economic growth — and Japan is clearly growing faster than the US (now mired in a recession) and even Europe (slowed down significantly by tight monetary policies and indigestion problems with East Germany); b) the Yen “acts well” in the face of generally “bearish” oil news; and c) the bullish sentiment, on the DM and SF vis a vis the USS has become too one-sided, not so with the S/yen, auguring at the very least a relative improvement over the latter vis a vis the former.
In conclusion: much lower Japanese stock and bond prices and a considerably stronger yen.
STRATEGY: Maintain short positions in the yen bond traded on the LIFFE, now rolled over to December ’90.
Maintain short positions in the stock market via Nikkei futures as suggested in our June 24 issue (then trading at 32,000).
Buy December ’90 yen at market, placing initial stops at 6775, close only.
In this issue
2 Stock Index FuturesThe decline is gathering steam.
4 Market StrategyStocks vs. bonds.CurrenciesCanadian dollar.
6 Crude OilSell on the news?
7 Friedberg Capital MarketsConvertible bond update.
9 The ExoticsSwedish krona.
Contributions by Albert D. Friedberg, Dr. Steve H. Hanke, Daniel A. G ordon, and Michael D. Hart.
© 1990 by Friedberg Commodity M anagement Inc. Reproduction in whole or in part prohibited.
FRIEDBERG’S
Chart 1 - Yen per SFiffi.ee---------------------------------------
•r i ■
( hart 2 — Yen per DMsee.00,--------------------------------------
VI 5/11 7/18
Chart 3 - Nikkei 225 Index Spot Chart 4 - LIF Japanese Bond Dec ’90
8/i yaa W
Chart 5 - CME Japanese Yen Dec ’90
STOCK INDEX FUTURES
The decline is gathering steamDespite the extremely overvalued condition reached in late August, the market was unable to mount a significant rally with the exception of the one-day, 76-point surge of the Dow Industrials on August 27. Declining volume and new lows in breadth (see Chart 6) since, are vivid testimony to the ongoing bear market.
The “R” word is finally pronounceable: Increasingly it has become apparent that the US has entered a business recession, one that is likely to aggravate the ongoing squeeze on corporate profits (see Chart 7). Being forward-looking, stock markets will tend to bottom at or before the end of a recession. Will this recession be any different? Probably not. The uncertainty, however, revolves around the duration and magnitude of the contraction. Knowing that we are in a recession, therefore, does not make stock forecasting any easier.
There are a number of “fundamental” indicators that point to a relative early end to this bear market. The first, and possibly the most important one, is the incipient recovery in banking liquidity (see Chart 8). Although still weak, it is
interesting to note that previous bouts of banking reliquifica- tion accompanied the early stages of a bull market (early 1975, early 1980, late 1982, early 1985).
The fact that this most recent uptrend in liquidity has not had as yet a favorable impact on stock prices may be due to the very low absolute level of bank liquidity prevailing at this time. Be that as it may, and in view of the more relaxed, accommodative Fed stance, it is worthwhile keeping an eye on this coincident indicator.
The second is our asset allocation model (see the next article: “Stocks vs. bonds”), which has turned friendly to stocks in the third quarter of 1990 after being in bonds for the first two quarters of the year.
Arguing for a slightly later end to the bear market is the significant drop in consumer confidence (see Chart 9): large enough to presage trouble but still “too high” to indicate a “real bottom.” A reading of 45% to 55% may still be months away. The same can be said about the Bank Credit Analyst’s Debit Loan ratio, which monitors the relationship between money payments and corporate short-term indebtedness. As
2 © 1990 by Friedberg Comm odity M anagement Inc. Reproduction in whole or in part prohibited. September 16,1990

FRIEDBERG’S
Chart 10 shows, the Debit-Loan ratio has fallen significantly, forecasting an intensifying squeeze on corporate profits. Market expectations are nowhere near the dramatic deterioration about to take place. As an example, the surge in the dividend payout ratio (see Chart 11) reveals “latent” bullishness on the part of chief executives and corporate boardrooms.
The extraordinary build-up of debt of Corporate America (see Chart 12) almost guarantees near-fatal blood-letting. Stock prices, however, need not follow corporate earnings. In fact, it is quite certain that stock prices and earnings will
become divorced from each other near the absolute trough of the recession. It is for this reason that we believe that the indicators discussed above added to a good dosage of contrarian thinking (i.e., sentiment indicators) will become useful guideposts to the art of picking a market bottom.
STRATEGY: We liquidated September ’90 S&P 500 put options at a substantial profit. We remain short KC Value Line futures, now rolled over to December ’90. The decline is once again gathering steam.
Chart 6 Chart 7
Quarterly Profit Changes On a Year-to-Year Basis( 111 JMM'COnl 1
The Wall Street Journal
Chart 8INVESTMENTS/TOTAL LOANS AND INVESTMENTS33
I 9 7 3 ! 1975 | 1977 | 197 9 | 1991 1 1983 j 1965 | 1967 | I s W |1974 1976 1978 1980 1982 1984 1986 1986 1990
------- LATEST DATA PLOTTED : J u n e 1 9 9 0
Chart 9Consumer Confidence Index
1
I
/ AV
j s f )j— | Indicoles economy
73 G 7h) 76 7 7 /a /<) (£̂ 81< a > 3 R4 86 86 8/ 08 89 (w)Source : The Conference Board Chart Prepared By: C.J.Lawrence
Chart 10THE DEBIT/LOAN RATIO
Chart 11
1945 195(1 1955 I960 1965 1970 1975 I9K0 19H5 1990
Chart 12CORPORATE DEBT BURDEN’
S o u r c e : The Bank C re d it A n a ly s t .
September 16,1990 D 1990 by Friedberg Comm odity M anagement Inc. Reproduction in whole or in part prohibited. 3

FRIEDBERG’S
MARKET STRATEGY
Stocks vs. bondsOver the years, the analytical firepower that has been thrown at the so-called portfolio allocation problem has been impressive. Indeed, we have directed a bit of our firepower at that target. Our work has led us to the following conclusion: The most appropriate model (for us at least) is a rather simple one.
Our model is represented by the following equation:
(E/P - RF) - (CBY - IE) = SS
where:E = Earnings on the Standard and Poor’s 500 Stock Com
posite Index (S&P 500)P = Price on the S&P 500RF = Risk factor, which is computed to allow for the best
performance of our modelCBY = Corporate bond yields on the Salomon Brothers’
long-term, high-grade corporate bond index IE = inflation expectations, which are given for any year X
by the inflation rate (CPI-U) in the preceding year X-l SS = switch signal
The logic of the model is quite straightfoward. When stocks are cheap relative to bonds, risk-adjusted real yields on stocks (E/P-RF) exceed real yields on bonds (CBY-IE). Hence, the switch signal (SS) is positive. With this positive signal, investors should switch their portfolios to 100% stocks. Alternatively, when the switch signal is negative, bonds are cheap relative to stocks, and investors should switch their portfolios to 100% bonds. Hence, our model signals investors to be either 1007o in stocks or lOOTo in bonds.
So much for our model’s logic. Let’s consider a few of the model’s details. Stock returns — earnings yields (E/P) on stocks — are intrinsically more risky than high-quality corporate bonds. That fact can be verified by noting that the standard deviations (variability) of average returns for “All Stocks” exceed the standard deviations for “All Bonds” (see Chart 13). In consequence, to put earnings yields on a risk- adjusted basis so that they are comparable to bond yields, we subtract a risk factor (RF) from the earnings yield on stocks. We compute the risk factor to allow for the best switch model performance.
It is important to mention that the risk-adjusted yield on stocks is a real (inflation apart) yield because both earnings on stocks and stock prices fluctuate with changes in inflation. Hence, the ratio E/P represents a real earnings yield on stocks.
Corporate bond yields (CBY) are given in nominal terms. Hence, to make bonds comparable to stocks, we must transform nominal bond yields to real bond yields. This is done by subtracting inflation expectations (IE) from nominal bond yields (CBY).
To test the model, we employ quarterly data from 1929:4 through 1989:4. Chart 13 contains a summary of our results. The “All Bonds” column indicates average returns and standard deviations if investors are exclusively in bonds. The “All Stocks” column indicates those same data if investors are exclusively in stocks. The “Switch Model” column indicates average returns and standard deviations if investors would have invested in accordance with the quarterly signals given by our model. The last column (“All-Knowing Best Model”) indicates the returns and standard deviations if investors would have had perfect foresignt, would have been able to invest perfectly in either 100% stocks or 100% bonds, depending on which alternative actually yielded the highest returns in each quarter. Hence, “All Knowing” column represents performance of the hypothetical perfect investor.
Investors who would have employed our “Switch Model” would have outperformed those who followed a buy and hold strategy for either stocks or bonds. For example, if an investor would have invested $100 in 1930:1, it would have grown to $103,264, $26,502 and $2,077, depending on whether an investor had employed the “Switch Model”, stayed exclusively in stocks or stayed exclusively in bonds, respectively. In addition to enhancing returns, the switch strategy would have reduced the variability of portfolio returns. Hence, it would have reduced risks.
The “Switch Model” is not, of course, perfect. This can be seen by comparing the “Switch Model” and “All Knowing” columns in Chart 13. Chart 14 presents more detailed data on the performance of the “Switch Model.” The first two columns show the number of quarters in each decade that the “Switch Model” signaled to be in either bonds of stocks. The last three columns show the number and type of wrong signals in each decade. In the 1980s, for example, the “Switch Model” indicated that investors should be invested in bonds 17 quarters and stocks 23 quarters. In 20 of the 40 quarters in the 1980s, the signals were incorrect. In 11 quarters the “Switch Model” signaled stocks, when investors should have been invested in bonds, and in nine quarters, the model signaled bonds, when investors should have been invested in stocks.
IMPLICATIONS: The "Switch Model" indicates that for 1990:1 and 1990:2, investors should have been invested in bonds. Bonds were cheap relative to stocks. In 1990:3, the current quarter, investors should be invested in stocks because they are cheap relative to bonds.
- Dr. Steve H. Hanke
4 © 1990 by Friedberg Comm odity M anagement Inc. Reproduction in whole o r in part prohibited. September 16,1990

FRIEDBERG’S
Chart 13Alternative Portfolio Strategies
Chart 14“Switch Model’s” Performance
Period
1930s1940s1950s1960s1970s1980s1930-1989
AH-KnowingAll Bonds All Stocks Switch Model Best Model
Avg.Ret./S.D. Avg.Ret./S.D. Avg.Ret./S.D.Avg.Ret./S.D.
6.9%/2.6% 2.7%/1.0% l.l%/2.6% 1.8%/2.6% 6.4%/4.1%
13.6%/7.7% 5.4%/4.2%
9.9%/24.6% 10.1%/ 7.7% 18.7%/ 5.8% 8.5%/ 6.5% 7.5%/ 9.1% 17.9% 8.3% 12.1%/12.3%
13.6%/11.0% 10.1%/ 7.7% 18.6%/ 5.8% 10.0%/ 5.4% 7.1%/ 9.1%
18.4%/ 6.2% 13.0%/ 7.7%
40.9%/19.4% 18.3%/ 4.7% 23.2%/ 4.5% 15.9%/ 4.1% 18.0%/ 6.1% 28.4%/ 7.3% 24.2%/ 9.6%
Notes:1. "All Bonds" is a strategy that leaves the investor in bonds at all times.2. “All Stocks” is a strategy that leaves the investor in stocks at all times.3. “Switch Model” is a strategy that switches the investor from 100% stock to bonds
100% and vice-versa, according to the criteria described in text.4. "All-Knowing” assumes the investor knows beforehand which investment (100%
stocks or 100% bonds) would generate the highest yield in each quarter, and that the all-knowing investors placed funds in that option.
5. Average returns are arithmetic means for annualized returns.6. "S.D.” is the standard deviation of the average returns, and indicates the volatility
of average returns.7. All data from Ibbotson Associates, Stocks, Bonds, Bills and Inflation, Chicago: 1990.
Switch Signals (Quarters) Wrong Signals
Period Bonds Stocks Total Bonds1 Stocks2
1930s 19 21 13 8 5
1940s 0 40 16 16 -
1950s 1 39 10 9 1
1960s 2 38 12 11 1
1970s 1 39 21 20 1
1980s 17 23 20 11 9
NOTES: 1. Should have been invested in bonds. But signal indicated stocks. 2. Should have been invested in stocks. But signal indicated bonds.
CURRENCIES
Canadian dollarLast month we reasoned that the Bank of Canada was moving into a position of being able to lower interest rates as monetary aggregates, particularly M2, were moderating their rates of growth. We argued that “from past behavior, it would not be unreasonable to believe that a 100 basis point narrowing of the interest rates differential could initially produce a Canadian S drop of 2.5%-3.5%, perhaps the outer limit of the bank’s tolerance range. As such, the easing will have to be pianissimo.”
Because timing was so crucial (given the high cost of borrowing Canadian dollars), we deferred a sale recommendation until August 27 (see Hotline Update), when it became clear that a downtrend in interest rate differentials had emerged (see Chart 15). Our estimate of the impact on the exchange rate of a 100-basis-point narrowing proved remarkably conservative: The dollar has fallen 3.65% as the differential narrowed by 57 basis points.
Recent developments indicate that the Bank has precious little further room to ease. In the first place, by their own admission they “...would expect annual rates of increases (in M2 and M2+) that are consistently below 10%, and ultimately going down to well below 10%...” (speech given by John Crow, Governor of Bank of Canada, September 13).
Chart 16 shows that year-over-year percentage change in M2 stabilized at just under 10%. In recent weeks, M2 has shown a much faster rate of growth than evident over the first half of the year, an early warning that further easing may be imprudent. The Bank is particularly well aware of the link between inflationary expectations, a credible monetary policy, and interest rates. Secondly, the surprising victory of the socialist New Democratic Party in the provincial elections held last week in Ontario is certain to increase long-term
capital outflows from Canada, making it imperative for the Bank to maintain a high interest rate policy to avoid an eventual balance of payments crisis.
Finally, the Bank is well aware of the notorious inflationary impact of a weak dollar. As such it is unlikely to allow the dollar to depreciate much beyond 4% to 5% from the recent peak before committing first some of its large international reserves and then using again an interest rate policy (independent of a money supply target). In short, the Bank is likely to follow a “monetarist” policy between 84.50 and 88.50 and an “exchange rate” policy beyond these two levels.
STRATEGY: Retain short December ’90 Canadian dollar, initiated August 27 at approximately 86.35 (see Hotline Update). There is still another 100-point to 150-point profit potential before the going gets rough.
Swiss francsSwiss franc/Deutschemark. Our patience paid off: The DM fell to 82 Swiss centimes, allowing us to close out a highly profitable long Swiss franc/short DM spread.
DeutschemarkWe liquidated our outright long positions in DM and SF on Monday August 27 (see Hotline Update for August 24), accepting handsome profits.
On August 29 we initiated short positions in DM only, placing initial stops at 65.60, basis September ’90, close only (see Hotline Update for August 29). Roll positions forward to December ’90 and lower stops to 64.50, close only.
September 16,1990 © 1990 by Friedberg Comm odity M anagem ent Inc. Reproduction in whole or in part prohibited. 5

FRIEDBERG’S
B a s is P o in ts
Chart 15C AN AD A - U S
S o u rce : Bank o f Canada R eview
Chart 16C A N A D A - M 2
YEAR—OVER—YEAR % CHANGE
Chart 17 - CME Can. Dollars Dec ’90 Chart 18 - DM /SF Chart 19 - CME Deutsche Mark Dec ’90ica& . - • ■
-= ,/J , k\ ; : *» * 11 p
:;.000% hr N
V V , $ 1
' * * A * * * * S. ' i [2./ ' 1 If* f '
; :-000\ A •'* « ■■ ■
"'1'
70090
'28 4/2? 5/16 6/11 "-'5 7/28 3/22 M6 : 1 : M2 - 1 5/18 4/22 7/27 8 /3 0 :: 7/5- 7 /30 8 /22 9/17
CRUDE OIL
Selling on the news?Behind the extraordinary rise in crude prices is a story of inventory hoarding that bears little relation to the underlying supply/demand relationship. The numbers are telling: August Opec production was 19.7 million barrels per day (b/d), down from the excessive (remember the $15/barrel crude in July?) 23 million b/d output in July, allowing bulging inventories to be drawn down by roughly 60 million barrels. This compares with an overhang, which in May we estimated at more than 400 million barrels (see our May 20, June 24, and July 22 issues). September Opec production will come in as high as 21.9 million b/d and October could hit 22 million b/d, close to “equilibrium” levels before the invasion of Kuwait.
But here is the catch. At these rarefied levels, consumption is unlikely to hold up. Every 1% drop in world demand, represents a “savings” of 600,000 b/d. Can anyone be sure that demand won’t fall 1% to 5%? Furthermore, oil inventories are as high today as they were in the 1980-82 period (see Chart 20). Clearly, the day-to-day fundamentals do not justify a spot price of $30+/barrel.
What is, then, behind the run-up? A fear, founded or
unfounded, but a fear nonetheless, that any large-scale military action could place over 10 million b/d of production capacity under threat. For as long as the fear exists, speculative positions in crude and products will be built up by merchants and users. A quick, military resolution to the conflict, on the other hand, will cause massive liquidation of these positions, toppling prices, once again, to the mid-teens.
We are of the opinion that there is no solution to the Gulf conflict other than a lightning-fast and devastating high-tech attack on Iraq. Such an attack could come at any time, although “expert” military opinion points to an October 15 to November 15 timetable.
The ideal selling opportunity would take place at the commencement of military action, placing one’s faith in the ability of the Allied forces to strike rapidly and successfully. Lacking such faith, one should wait until the outcome of the conflict becomes clear.
STRATEGY: Short March ’91 crude oil as o f August 28. Cover short positions at market and wait to reinstate once military conflict commences.
6 © 1990 by Friedberg Commodity M anagement Inc. Reproduction in whole or in part prohibited. September 16,1990

FRIEDBERG’S
Crack spreadsOur June recommendation (see our June 24 issue, “High on crack”) to buy deferred products versus the sale of crude proved a bonanza. Put on at approximately $2.90 a barrel, we took par
tial profits at $4.25/barrel as recommended at that time and remain long the balance of the position, looking to liquidate in the $7-$9/barrel range (if you have not already done so).
C.J. Lawrence
Chart 21 - NYME Crude Light Mar ’91
r. ./ f
n • 5, : i v if: -
= ===- - -== - : J =====- .=
1432
3/28 4/23 5/16 6/11 7/5 7/30 8/22 9/17
FRIEDBERG CAPITAL MARKETS
Chart 22 - Crack Feb ’91
Convertible bond updatePacific ScientificFor the second quarter, Pacific Scientific has reported that earnings were the highest in five years, rising to $1.8 million, or $0.30 per share, with six-month earnings at $2.7 million, or $0.45 per share. These profits represent a substantial improvement over last year, when second quarter earnings before an extraordinary gain from the repurchase of debentures stood at $0.05 per share and six-month earnings before extraordinary gain were $0.11 per share.
The good news continues with second quarter revenue
growth of 12%, to $46.9 million. Six-month revenues were $91.7 million, versus the previous year’s $84.3 million.
The higher earnings were attributable to improved operational efficiencies, as well as the growth in sales and margins. The results for the second quarter include two unusual items: the sale of the Sigma Division’s relay product line, and a recall of a Sigma product to provide additional safety features. The recall diminished earnings by $0.06 per share, while the sale of the relay product line added $0.11 per share to the quarter’s earnings. Recent stock price: $ 11 % per share.
September 16,1990 © 1990 by Friedberg Commodity M anagement Inc. Reproduction in whole or in part prohibited. 7

FRIEDBERG’S
Sunrise MedicalSunrise Medical Inc., our star performer in the convertible department, continues to exhibit strength. Recently released fourth quarter results put earnings at $0.47 per share versus $0.36 for the same period last year. Net income rose 16.61% per annum, from a 1989 figure of $40.9 million to the present 1990 figure of $47.7 million. It’s worth noting that this is the sixth conscutive quarter of record sales and earnings versus the previous year. Recent stock price: $15% per share.
Recommended bond portfolio allocationSwiss franc and/or DM denominated bonds 35%US dollar high-yield convertible bonds 20%Argentina Bonex 5%British pound fixed-rate bonds 12.5%Danish krone fixed-rate bonds 17.5%Japanese yen bonds 10%
Friedberg Capital Markets is a division of Friedberg Mercantile Group, a securities dealer and futures commission merchant. Friedberg Mercantile Group and Friedberg Commodity Management Inc. are under common beneficial ownership, control and management.
Chart 23 - Foreign Currency BondsD a le : S ep tem ber 1 3 , 1990We o f f e r th e fo l lo w in g Bonds s u b j e c t to ch a n g e w i th o u t p r i o r n o t i c e : Minimum amount: U S$5,000 (C d n .$ 7 ,0 0 0 )
PAY I SSUKH/ffTY . HATH/COUPON CANADIAN IXMJJWt DENOMINATED BONDS GOVERNMENT OF CANADA (semi annual) 05/12/90 10 1/4%
NEW /EAIJ1ND DOIJJVR DENOMINATED RONDS CAN. IMP.RANK OF COMMERCF.
27/07/92 14% RRSP e l ig ib le AUSTRALIAN IX)I.r.AU DENOMINATED RONDSGeneral E lec tr ic
11/07/92 14 1/4% (semi) COMMONWEALTH BANK OF AUSTRALIA
01/07/94 14%WORLD BANK
15/03/93 12 3/4% RRSP e l ig ib le CAN.IMP.BANK OF COMMERCE
13/C3/91 13% RRSP e l ig ib le DANISH KRONE DENOMINATED BONDS STOCKHOLM
10/11/91 10 5/0%BRITISH POUND DENOMINATED BONDS KGDM o f SWEDEN
14/4/93 9 3/0%DEUTSCHE HARK DENOMINATED BONDS QUEBEC HYDRO 5 1/2%
1/5/96 RRSP e l ig ib le PROVINCE OF QUEBEC 6%
1/4/9? RRSP e l ig ib le EUROPEAN INV. BANK 5 1/2%9/0/93
RANK OF NOVA SCOTIA 5 5/0%07/05/96 RRSP e l ig ib le
WORLD BANK5 7/0% 4/2/97 .RRSP e l ig ib le
SWISS FRANC DENOMINATED BONDS GOVT.OF AUSTRALIA 30/10/90 5% JAPANESE YEN DKNOHTNATKD BONDS GOVT.OF CANADA
23/7/93 5 5/8% RRSP e l ig ib le 93 1 /2 -U.S.DOI.IJVR DENOMINATED FIXED CONVERTIBLE BONDSPACIFIC SCIENTIFIC 7 3/4% 15/06/03(sumi] CV @$38 p/sliSUNRISE MEDICAL INC.7.25% 26/0/96
’71 -
CV @$17 5/0 p/shALLIANT COMPUTER 7.25% 15/05/12(scmi)
92 -
CV @$39.75 p/shCOOPER CO'S. 10 5/8% 01/03/05(semi)
41 -
CV @$27.45 p/sh c a l l in 1995 @100 DICEON ELECTRONICS 5.5% 1/3/12 (semi)
70 1 /2 -
CV @$39.50 p/sh 32 1 /2 -U.S.DOI.IJVR DENCHIHATED FIXED RATE BONDSALBERTA 7 3/0%
98 3 /4 -9/12/91 •'RRSP e l ig ib le
B id(I.S-DOI.IJ\R DENOMINATED FIXATING RATE NOTESUNITED KINGDOM 24/9/96
9 9 .70-3 mo.LIBID-1/0 (q t ly )REPUBLIC OF ITALy/30/4/93 9 9 .30-3 mo Lim ean(qlly)
LAST PAY NEXT PAY DATE
0 5 /0 6 /9 0 -0 5 /1 2 /9 0
2 7 /0 7 /9 0 -2 7 /0 7 /9 (
1 1 /0 7 /9 0 -1 1 /0 1 /9 1
0 1 /0 7 /^ 0 -0 1 /0 7 /9 1
1 5 /0 3 /9 0 -1 5 /0 3 /9 1
1 3 /0 3 /9 0 -1 3 /0 3 /9 1
1 0 /1 1 /9 0 -1 0 /1 1 /9 1
1 4 /0 4 /9 0 -1 4 /0 4 /9 1
0 1 /0 5 /9 0 -0 1 /0 5 /9 1
0 1 /0 4 /9 0 -0 1 /0 4 /9 1
09 /00/90 -0 9 /0 0 /9 1
0 7 /0 5 /9 0 -0 7 /0 5 /9 1
0 4 /0 2 /9 0 -0 4 /0 2 /9 1
3 0 /1 0 /0 9 -3 0 /1 0 /9 0
2 3 /0 7 /9 0 -2 3 /0 7 /9 1
1 5 /0 6 /9 0 -1 5 /1 2 /9 0
2 6 /0 6 /9 0 -2 6 /0 6 /9 1
1 5 /0 5 /9 0 -1 5 /1 1 /9 0
0 1 /0 3 /9 0 -0 1 /0 3 /9 1
01 /0 9 /9 0 -0 1 /0 3 /9 1
0 9 /1 2 /0 9 -0 9 /1 2 /9 0
C u r r e n t Coupon
8 1 /4 % 2 0 /0 6 /9 0 -2 0 /0 9 /9 0
9 9 .7 0 8 1/16% 3 1 /0 7 /9 0 -3 1 /1 0 /9 0
9 9 .5 5 - 9 9 .8 5
101 - 101 3 /4
101 1 /2 - 102 1 /4
100 5 /8 -
100 5 /8 - 101 3 /8
CURRENT ANN. YIELD TO KIT
1 0 .6 7
12.81%
13.19%
11.99%
100 - 100 3 /4
91 7 /8 - 92 7 /8
9.84%
12.74%
85 - 85 3 /4
84 1 /2 - 85 1 /4
91 3 /4 - 92 1 /2
84 3 /4 - 8 5 .1 /2
84 1 /4 - 85
86 - 88
73 1 /2
94 1 /2
43
72 5 /8
33 1 /2
99 1 /2
O f f e r
100
8.81%
9.08%
8.53%
9.01%
9.07%
6.99%
7.95%
12.17%
8.48%
18.24%
15.99%
18.16%
7.78%
Although wo monitor these issues s p e c i f ic a l ly , wo a lso can f i l l any order in any foreign currency bond.
For further information and current p rices p lease c a l l :FRIEDBERG CAPITAL MARKETS (416) 364-2700 F/MICHCM
8 © 1990 by Friedberg Commodity M anagem ent Inc. Reproduction in whole o r in part prohibited. September 16,1990

FRIEDBERG’S
Chart 24Breakeven exchange rates for US$-based investor
This analysis shows a “snapshot” of the relationship between interest rate differentials and rates of exchange. The breakeven rate measures how far the foreign currency has to devalue (for NZS, AS, DKr) or revalue (for DM, SF, JY) before the interest rate advantage/disadvantage is overcome by currency depreciation/appreciation. Rates as of September 13,1990.
us. $ NEW ZEALAND $ AUSTRALIAN $ DEUTSCHEMARK SWISS FRANC JAPANESE YEN DANISH KRONE BRITISH POUND2 year 7.98% CIBC 14% 11/7/92,
yields 12.81%(.597 NZ/US)
G eneral Electric 141/4% 11/7/92 yields 13.19% (.782 A/US)
3 year 8.17% EIB 51/2 % 9/8/93 8.53%(1.60 US/DM)
Canada 5%% 23/7/93, yields 7.95%(137.06 US/JY)
Sweden 9%% 14/4/93, yields 12.74%(1.647 BP/US)
6 year 8.55%
7 year 8.69% Prov. Queb. 6% 1/4/97 yields 9.08% 1.626 US/DM
8 year 8.72% Australia 5% 30/10/98, yields 6.99% (1.164 US/SF)
SpotExchange
RateN/A .6241 .8198 1.586 1.3235 137.9 6.073 1.865
*For example, since a USS-based investor would receive 483 basis .6241 NZ/US over the next 2 years for the NZS investment to breakpoints (1281-798) by holding the CIBC NZS bond, the NZS can even with current USS rates of interest. Assumes that bonds are held todepreciate to .597 NZ/US from the present spot exchange rate of maturity, and coupons are reinvested.
THE EXOTICS
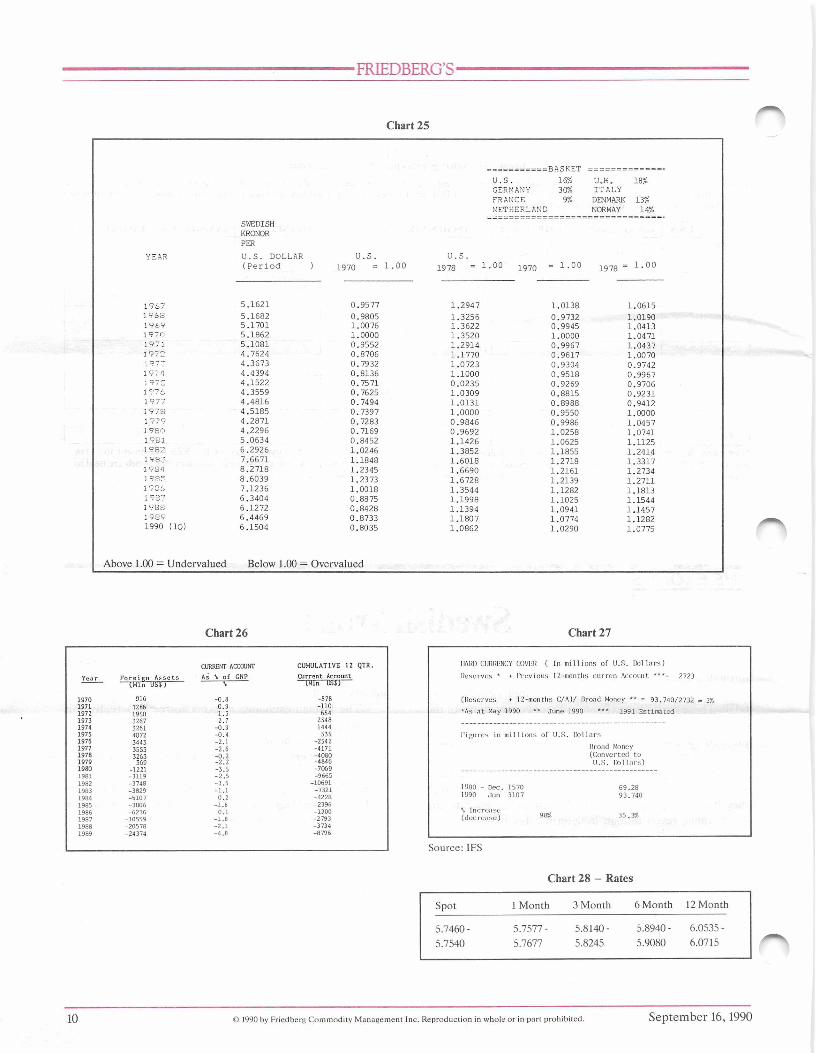
Swedish kronaSweden is beset by an inflation rate of 11.1% year on year through August 1990, one of the highest in Western Europe, and a current account deficit in 1990 approaching 5% of GDP. These economic evils are a direct consequence of the extremely permissive monetary policy put into practice by the Central Bank which allowed domestic credit to expand by 95% in the 1986 through 1989 period.
Even though interest rates were raised in February to almost 15% (basis three-month Treasury discount notes), they have more recently been allowed to fall back to the 12.5% range (even though long-term rates have remained
close to 14%), showing once again the Central Bank’s lack of firm determination to bring credit and money aggregates under control.
The foreign exchange markets correctly perceive this irresolution and justifiably fear a devaluation, the fifth one since 1977. Given the upcoming election, it is quite possible that the Swedish government will take the easy way out and devalue.
STRATEGY: Sell six-month forward Swedish kroner against DM or preferably against a high yield EMS currency such as the Italian lire. Remain neutral against the US dollar.
September 16,1990 © 1990 by Friedberg Commodity M anagement Inc. Reproduction in whole or in part prohibited. 9
FRIEDBERG’S
Chart 25
BASKETU .S . 16% U..K, 18%GERMANY 30% ITALYFRANCE 9% DENMARK 13%NETHER-LAND NORWAY 14%
SWEDISHKRONORPER
YEAR U .S . DOLLAR U .S . U .S .( P e r i o d ) 1970 = 1 . 0 0 1978 = 1 .0° 1970 = 1 .0 0 1978 1 .0 0
1967 5 .1 6 2 1 0 .9 5 7 7 1 .2 9 4 7 1 .0138 1 .0 6 1 51 c; /_q 5 .1 6 8 2 0 .9 8 0 5 1 .3 2 5 6 0 .9732 1 .01901969 5 .1 7 0 1 1 .0076 1 .3622 0 .9945 1 .04131970 5 .1 8 6 2 1.0000 1 .3 5 2 0 1.0000 1 .04711971 5 .1 0 8 1 0 .9552 1 .2 9 1 4 0 .9 9 6 7 1 .04373 972 4 .7 6 2 4 0 .8706 1 .1 7 7 0 0 .9 6 1 7 1 .00701973 4 .3 6 7 3 0 .7932 1 .0 7 2 3 0 .9304 0 .97423.97 A 4 .4 3 9 4 0 .8136 1 .1 0 0 0 0 .9518 0 .9 9 6 71975 4 .1 5 2 2 0 .7571 0 .0 2 3 5 0 .9269 0 .97063.976 4 .3 5 5 9 0 .7625 1 .0 3 0 9 0 .8 8 1 5 0 .92311977 4 .4 8 1 6 0 .7494 1 .0 1 3 1 0 .8988 0 .9412197S 4 .5 1 8 5 0 .7397 1.0000 0 .9550 1.00001979 4 .2 8 7 1 0 .7283 0 .9 8 4 6 0 .9986 1 .045719 SO 4 .2 2 9 6 0 .7169 0 .9 6 9 2 1 .0258 1 .07411981 5 .0 6 3 4 0 .8452 1 .1 4 2 6 1 .0625 1 .11253. 982 6 .2 9 2 6 1 .0246 1 .3 8 5 2 1 .1855 1 .24141 9 S3 7 .6 6 7 1 1 .1848 1 .6 0 1 8 1 .2718 1 .33171984 8 .2 7 1 8 1 .2345 1 .6 6 9 0 1 .2161 1 .273419B5 8 .6 0 3 9 1 .2373 1 .6 7 2 8 1 .2139 1 .271119S6 7 .1 2 3 6 1 .0018 1 .3 5 4 4 1 .1282 1 .18131987 6 .3 4 0 4 0 .8875 1 .1 9 9 8 1 .1025 1 .15441983 6 .1 2 7 2 0 .8428 1 .1 3 9 4 1 .0941 1 .14571989 6 .4 4 6 9 0 .8733 1 .1 8 0 7 1 .0774 1 .12821990 (IQ) 6 .1 5 0 4 0 .8035 1 .0 8 6 2 1 .0290 1 .0775
Above 1.00 = Undervalued Below 1.00 = Overvalued
Chart 26 Chart 27
F o r e ig n A s s e t s
CURRENT ACCOUNT As \ o f GNP
CUMULATIVE 12 QTR. C urren t Account
lM in USD % (Min OSS’)
1970 916 -0 .8 -5781971 1286 0.9 -1101972 1950 1.3 6541973 3267 2.7 23481974 3261 -0 .9 14441975 4072 -0 .4 5351976 3443 -2 .1 -25421977 3553 -2 .6 -41711978 3263 -0 .2 -40801979 369 -2 .2 -48461980 -1221 -3 .5 -70691981 -3119 -2 .5 -96651982 -3748 -3 .5 -106911983 -3829 -1 .1 -73211984 -5107 0.2 -42281985 -3806 -1 .6 -23961986 -6236 0.1 -13001987 -10559 -1 .8 -27931988 -20578 -2 .1 -37341989 -24374 -4 .8 -8796
HARD CURRRNCY COVHR ( In m i l l i o n s o f U .S . D o l l a r s )
R e se rv e s * + P re v io u s 1.2-m onths c u r r o n Account. ***= 2723
(R e s e rv e s + 1 2 -m o n th s C /A )/ B road Money * * = 9 3 .7 4 0 /2 7 3 2 = 3%
*As a t May 1990 ** J u n e 1990 *** 1991 E s tim a te d
F ig u r e s in m i l l i o n s o f U..S. D o l la r s
B road Money (C o n v e r te d to U .S . D o l la r s )
1980 - D ec. 1570 6 9 .2 81990 Ju n 3107 9 3 .7 4 0
% In c r e a s e ( d e c r e a s e ) 98% 35.3%
Source: IFS
Chart 28 - Rates
Spot 1 Month 3 Month 6 Month 12 Month
5.7460 - 5.7577 - 5.8140- 5.8940 - 6.0535 -5.7540 5.7677 5.8245 5.9080 6.0715
10 © 1990 by Friedberg Comm odity M anagement Inc. Reproduction in whole or in part prohibited. September 16,1990

FRIEDBERG’S
FOREX RATES & UPDATEComments
Comments vis a vis DMCurrency Spot 3-Month 12-Month vis a vis USS (Spot DM: 157.00)
*Australian dollar .8270-.8280 .8165-.8180 .7885-.7915 Neutral Neutral
**Belgian franc 32.22-32.27 32.25-32.38 32.52-32.77 Neutral Neutral
**Danish krone 5.9800-5.9880 6.0175-6.0305 6.1250-6.1430 Neutral Neutral
**Dutch guilder 1.7670-1.7680 1.7686-1.7699 1.7785-1.7805 Neutral Neutral
Greek drachma 151.50-152.50 154.60-159.50 164.50-179.50 Neutral Neutral
Hong Kong dollar 7.7640-7.7650 7.7660-7.7680 7.7925-7.7915 Neutral Neutral
** Irish punt 1.7170-1.7185 1.7050-1.7080 1.6640-1.6680 Neutral Neutral
** Italian lira 1170-1171 1176-1178 1208-1212 Neutral Neutral
Kuwaiti dinar Good luck — —
Malaysian ringgit 2.6950-2.6960 2.6960-2.6990 2.7000-2.7100 Neutral Neutral
New Zealand dollar .6265-.6275 .6160-.6180 .5890-.5920 Neutral Neutral
**Norwegian krone 6.0480-6.0580 6.0835-6.0965 6.2045-6.2245 Neutral Neutral
Portugese escudo 137.80-137.90 139.80-140.50 147.50-149.00 Neutral Neutral
Saudi Arabian riyal 3.7495-3.7505 3.7510-3.7545 3.7540-3.7600 Remain short Remain short
Singapore dollar 1.7715-1.7725 1.7690-1.7710 1.7625-1.7710 Neutral Neutral
Spanish peseta 98.40-98.50 99.96-100.14 104.60-104.90 Neutral Neutral
Explanatory Notesliq u id a ted as per Hotline Update of August 27.
**Liquidated as per Hotline Update of September 7.Currency expected to firm against both currencies. Buy BuyCurrency expected to strengthen against USS and weaken against DM. Buy SellCurrency expected to weaken against both major currencies. Sell SellCurrency expected to weaken against USS, but strengthen against DM. Sell BuyTerm used to liquidate short position but does not imply a new buy
recommendation. CoverTerm used to indicate sale advice of previous long position, but does not
imply a new short sale recommendation. Liquidate
September 16, 1990 © 1990 by Friedberg Commodity Management Inc. Reproduction in whole or in part prohibited. li

FRIEDBERG’S
HOTLINE UPDATETuesday, July 24:No changes or new recommendations.
Friday, July 27:No changes or new recommendations.
Tuesday, July 31:No change or new recommendations.
Friday, August 3:For new subscribers: As usual, there will be no market letter in August. This was inadvertently not mentioned in the last publication. Otherwise, no changes or new recommendations.
Tuesday, August 7:No changes or new recommendations.
Flash update, Thursday, August 9,11:45 a.m.:Based on the hunch that desperate men will do desperate things and that it is therefore increasingly likely that Iraq will strike out at Saudi installations or population centers in order to gain leverage, we recommend the following: Buy October crude oil and sell February or March crude oil as a spread at present levels. Keep in close contact.
Friday, August 10:Repeat as per Thursday’s flash update. No other changes.
Tuesday, August 14:No changes or new recommendations.
Flash update, Wednesday, August 15,10:30 a.m.:On Friday August 10, we advised you to put on spreads long October, short March crude oil on the assumption that a sudden desperate attack by the Iraqis on Saudi installations would spike nearby positions. Thus the spread would widen. Such an eventuality is now receding. Therefore liquidate this spread.
Friday, August 17:As per our flash update Wednesday August 15, we liquidated our crude oil spreads — long October and short March. No other changes or recommendations.
Tuesday, August 21:No changes or new recommendations.
Friday, August 24:Two new recommendations:1. Liquidate at market all outright long positions in SF and DM at
the opening on Monday.2. Liquidate at market all spreads long SF short JY at the opening
on Monday.
Flash update, Monday, August 27 ,1 :15 p.m.:Sell December C$ at market initiating new short positions. Place initial stops at 8875, close only.
Tuesday, August 28:As per our Hotline Update on Friday, we recommended liquidating long positions in SF and DM at the opening on Monday. As well, we recommended liquidating long SF short JY spreads.
As per our flash update of Monday the 27th, we sold December CS at around 8635 with stops at 8875, close only. New recommendations:1. Holders of S&P put options should liquidate now. However,
short positions in KC Value Line should be maintained.
2. Liquidate all long positions in EMS and other European currencies vis a vis the dollar.
3. Sell March crude oil and deferred months only, establishing new short positions. Place initial stops at 29.00, basis March, close only.
Flash update, Wednesday, August 29,9:25 a.m.:Followed by a recap of Tuesday's hotline update. Sell September DM at market, initiating a new' short position. Place initial stops at 6560, close only.
As per our Hotline Update on Friday, we recommended liquidating long positions in SF and DM at the opening on Monday. As well, we recommended liquidating long SF short JY spreads.
As per our flash update of Monday the 27th, we sold December CS at around 8635 with stops at 8875, close only. New recommendations:1. Holders of S&P put options should liquidate now. However,
short positions in KC Value Line should be maintained.2. Liquidate all long positions in EMS and other European curren
cies vis a vis the dollar.3. Sell March crude oil and deferred months only, establishing new
short positions. Place initial stops at 29.00, basis March, close only.
Friday, August 31:A recap of the week's activities. As per our Hotline Update of Friday, August 24, we recommended liquidating long SF and DM positions. We also recommended liquidating long SF and short JY spreads.
As per our flash update of Monday the 27th, we sold December C$ at around 8635 with stops at 8875, close only. Three new recommendations on our Tuesday update:1. We liquidated long S&P put options. However, short positions in
KC Value Line should be maintained.2. We recommended liquidating all long positions in EMS and
other European currencies vis a vis the US$.3. We sold March crude oil and deferred months only, establishing
new short positions initial stops at 2900, basis March, close only.
Friday, September 7:One new recommendation: Sell long Australian dollar position, accepting profits.
Tuesday, September 11:No changes or new recommendations.
Friday, September 14:A recap since our last market letter July 22. New positions:1. Short December CS at approximately 8635 with stops at 8875,
close only, as per our flash Monday, August 27.2. Short March crude oil and deferred months with stops at 2900,
close only, as per our recommendation Tuesday, August 28.3. Short DM at approximately 6434, basis September with stops at
6560, close only, as per our flash update Wednesday, August 29.
Positions still outstanding:• long T-bond put options• short Nikkei Dow futures® long crack spreads (having taken profits on half of position)• short yen bond futures• short KC Value Line futuresRolling forward to nearest month (December) when necessary.
Friedberg's Com modity & Currency Com ments (ISSN 0229-4559) is published m onthly by Friedberg Com modity M anagem ent Inc.. 347 Bay Street, Toronto, Ontario. M5H 2R7. Contents copyright © 1990 by Friedberg Com m odity M anagem ent Inc. All rights reserved. Reproduction in whole o r in part without perm ission is prohib ited . Brief ex trac ts m ay be m ade with due acknowledgement.
Subscription Enquiries Trading AccountsFriedberg's Commodity & Currency C om ments All enquiries concerning trading accounts should be directed to347 Bay Street Friedberg M ercantile Group2nd Floor 347 Bay StreetToronto. Ontario. Canada Toronto. Ontario M5H 2R7M 5H2R7 (416)364-2700(416)364-1171
All statements made herein, while not guaranteed, are based on information considered reliable and are believed by us to be accurate. Futures and options trading is speculative and involves risk of loss. Past trading results are not indicative of future profits.
12 September 16,1990