the best investment opportunities for the 2nd half of 2016
TRANSCRIPT


Do You Know What The
BIGGEST PROBLEM Facing The
World Today Is?

AMERICA is BANKRUPT and on borrowed time.

If the chart above looks INCREASINGLY EXPONENTIAL, that is not a coincidence.

A “Saturated World” Stock of debt across non-financial sectors vs GDP, in local currency, nominal
U.S. Japan China
U.K. Euro area Brasil

Is It Time To Sell The US
Dollar?

Source: www.GoldPredict.com

Source: www.GoldPredict.com
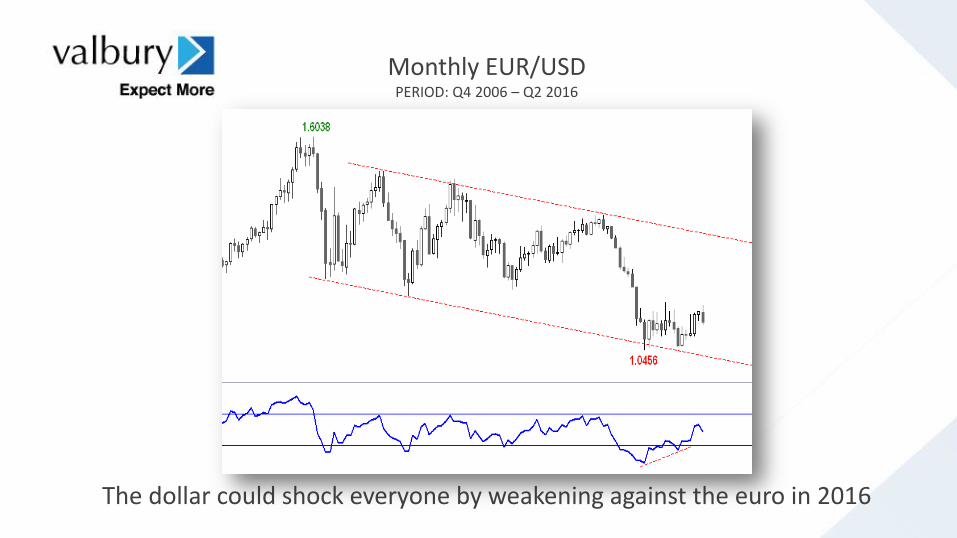
The dollar could shock everyone by weakening against the euro in 2016
Monthly EUR/USD PERIOD: Q4 2006 – Q2 2016

Weekly EUR/USD PERIOD: Q2 2012 – Q2 2016
Cautious Signs in the US Equity
Market

US QUARTERLY EPS GROWTH y/y, in% PERIOD: Q4 2012 – Q1 2016
1Q Results set to show biggest quarterly drop in U.S. Profits since 2009
Source: www.bloomberg.com

S&P 500 Monthly P/E Ratios Number of Months for Each P/E Ratio Range Since 1871

The current market environment is not unlike that seen just prior to the major market corrections in 2000 and 2008
SPX Prior Peak Earnings Index PERIOD: 1998 - 2016

Opportunities to
Consider
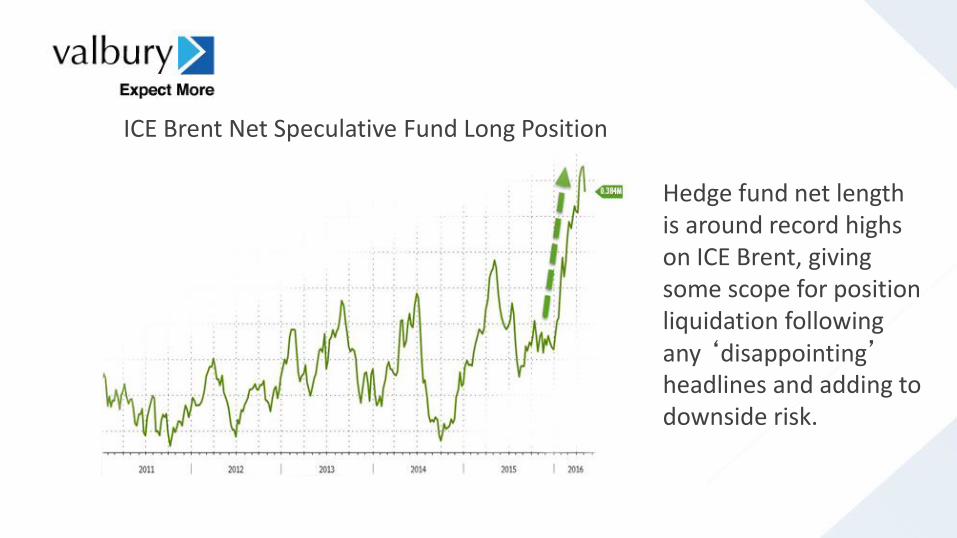
Hedge fund net length is around record highs on ICE Brent, giving some scope for position liquidation following any ‘disappointing’ headlines and adding to downside risk.
ICE Brent Net Speculative Fund Long Position
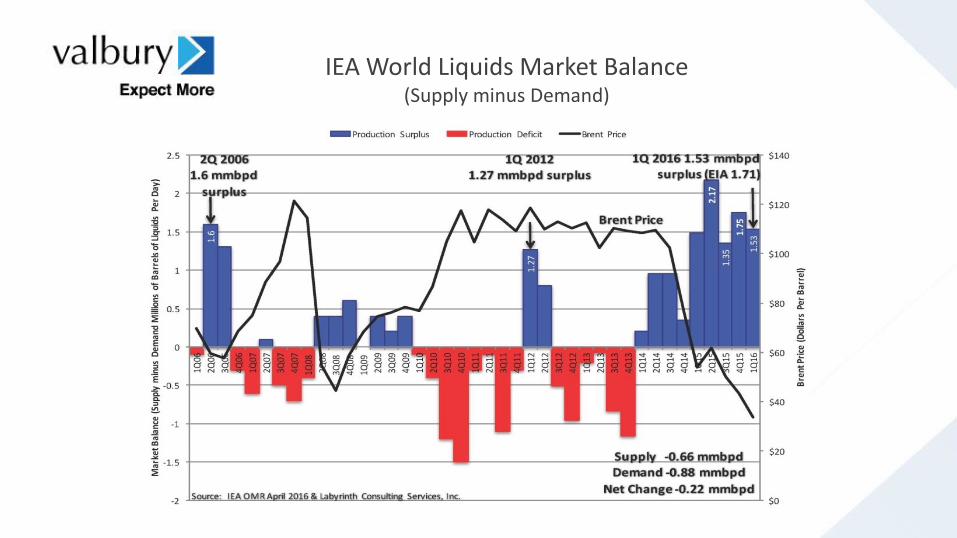
IEA World Liquids Market Balance (Supply minus Demand)

Shipping data shows that some 50 supertankers are currently anchored in or close to Singaporean waters.

Daily CLc1 Price (USD/Barrel) PERIOD: January ‘16 – May ‘16
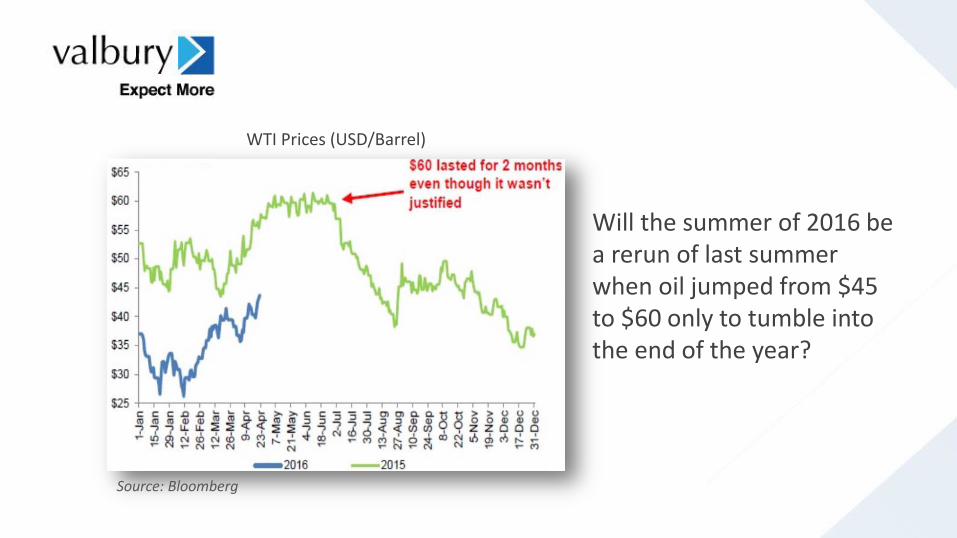
Will the summer of 2016 be a rerun of last summer when oil jumped from $45 to $60 only to tumble into the end of the year?
WTI Prices (USD/Barrel)
Source: Bloomberg

Has The New Bull Market
In Gold Started?
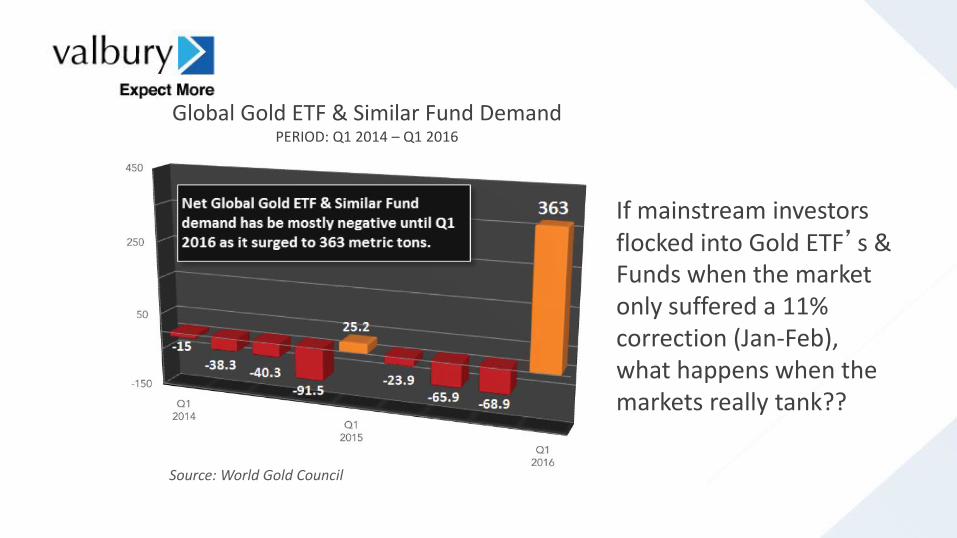
If mainstream investors flocked into Gold ETF’s & Funds when the market only suffered a 11% correction (Jan-Feb), what happens when the markets really tank??
Global Gold ETF & Similar Fund Demand PERIOD: Q1 2014 – Q1 2016
Source: World Gold Council
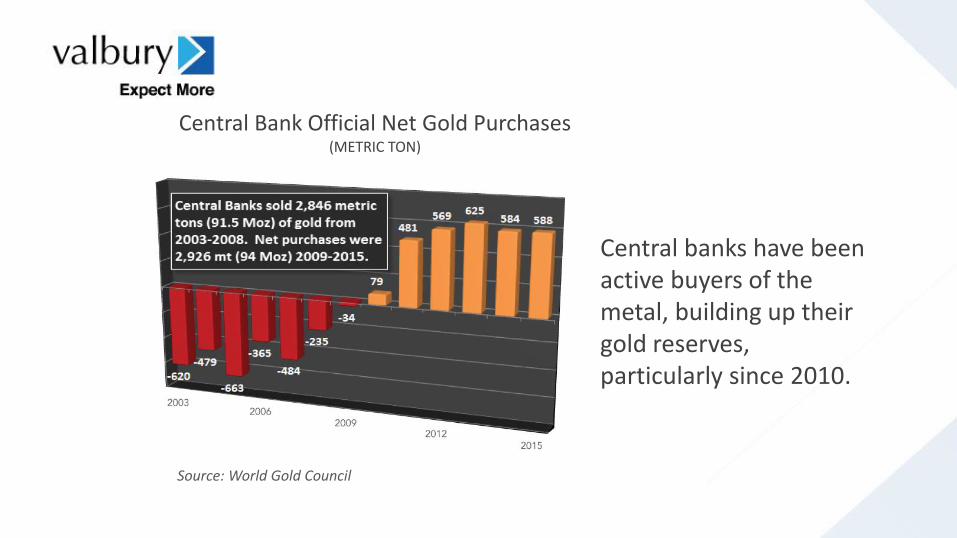
Central banks have been active buyers of the metal, building up their gold reserves, particularly since 2010.
Central Bank Official Net Gold Purchases (METRIC TON)
Source: World Gold Council
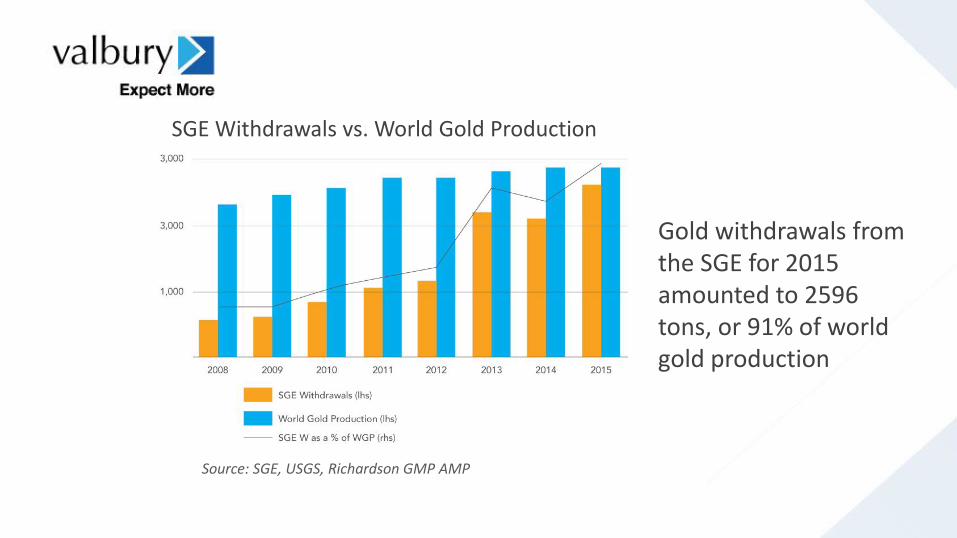
Gold withdrawals from the SGE for 2015 amounted to 2596 tons, or 91% of world gold production
SGE Withdrawals vs. World Gold Production
Source: SGE, USGS, Richardson GMP AMP
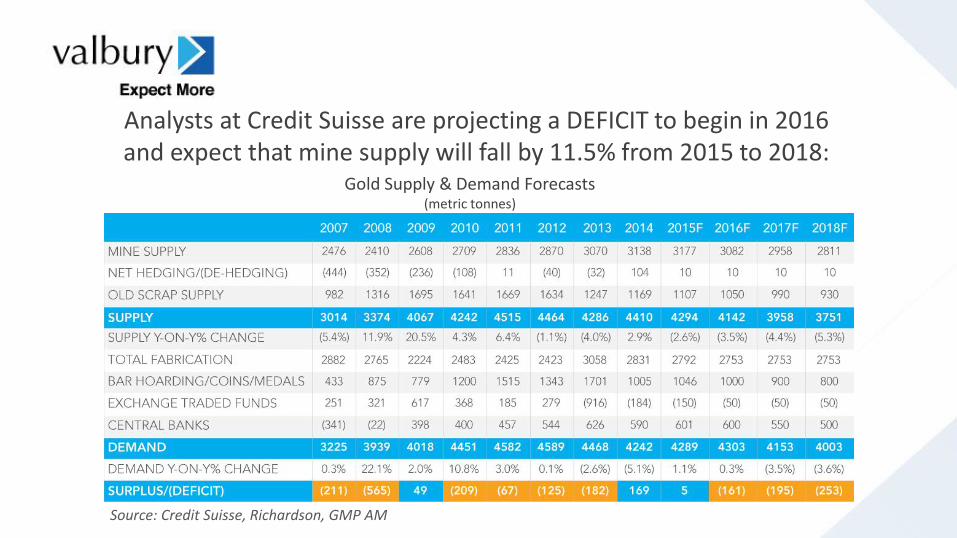
Analysts at Credit Suisse are projecting a DEFICIT to begin in 2016 and expect that mine supply will fall by 11.5% from 2015 to 2018:
Gold Supply & Demand Forecasts (metric tonnes)
Source: Credit Suisse, Richardson, GMP AM
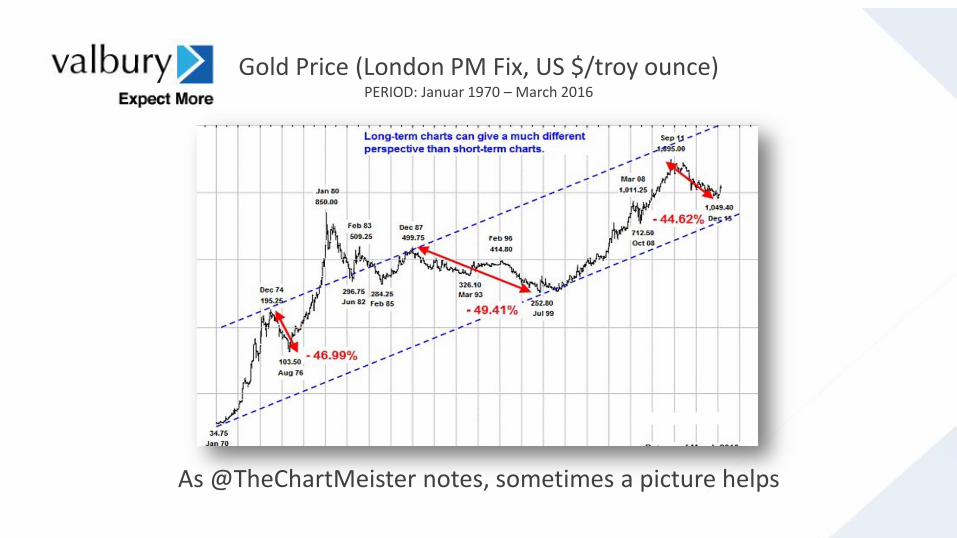
As @TheChartMeister notes, sometimes a picture helps
Gold Price (London PM Fix, US $/troy ounce) PERIOD: Januar 1970 – March 2016

Gold Spot Price PERIOD: December ‘15 – May ‘16

How About Indonesia?
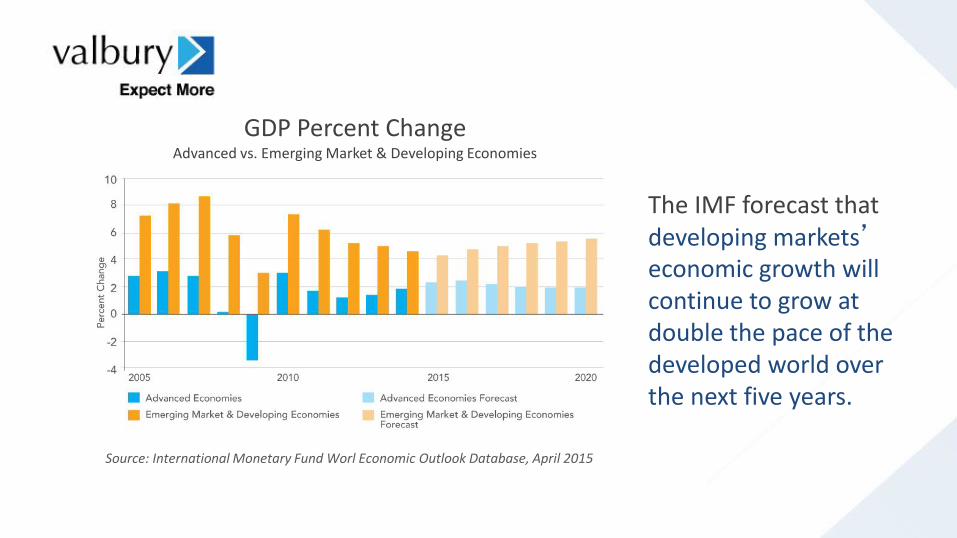
The IMF forecast that developing markets’ economic growth will continue to grow at double the pace of the developed world over the next five years.
GDP Percent Change Advanced vs. Emerging Market & Developing Economies
Source: International Monetary Fund Worl Economic Outlook Database, April 2015

Asia’s ascension will be led by 10 economies, which could account for 50 percent of global GDP by 2050.
Percentage of World GDP Current Prices PERIOD: 1980 - 2050
Source: CEIC, ANZ Research Projection, US Global Investors
Note: Asia 10 includes China, India, Indonesia, Japan, South Korea, Malaysia, Philippines, Singapore, Thailand and Vietnam
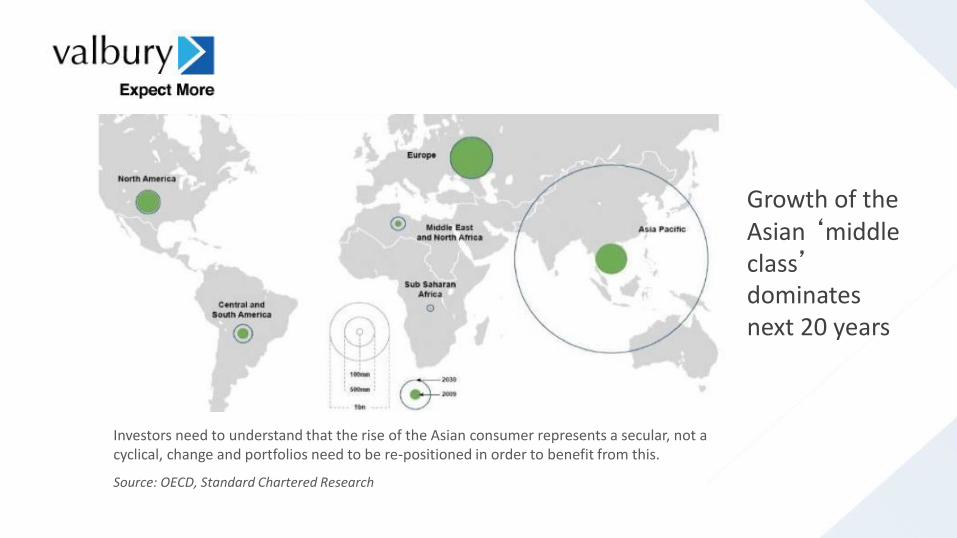
Growth of the Asian ‘middle class’ dominates next 20 years
Investors need to understand that the rise of the Asian consumer represents a secular, not a cyclical, change and portfolios need to be re-positioned in order to benefit from this.
Source: OECD, Standard Chartered Research
Indonesia’s economy
• Indonesia’s GDP only increased 4.92% YoY in 1Q16 compared to 5.04% YoY, below market expectation
• Consumption merely grew 4.94% YoY in 1Q16
• We are optimistic Indonesian economy to rebound in next quarters, supported by government spend along with economic stimulus package

Why Construction Sector?
In 2016, government has prepared Rp 1,325.6 trillion for state budget (APBN) where Rp 313.5 trillion (+8% YoY) has been allocated to boost infrastructure development in which Rp 104.1 trillion is set aside for Public Works and Housing Ministry.
Government has appointed construction SOEs as the executors of government projects.

Construction Sector
ADHI.IJ Price Target : Rp2,840
• New contracts grew 43.4% YoY in April 2016 to Rp4.7tn
• LRT Project
WSKT.IJ Price Target : Rp2,870
• Net income surged 1,026% YoY to Rp127,3bn in 1Q16
• Toll Road

Why Consumer Sector?
Growing Middle Income Class
Demographic Bonus
Source : Indonesia Central Bureau of Statistics and VAS Research

Consumer Sector
ICBP.IJ Price Target : Rp20,840
• Upbeat outlook on noodle division
• Growth potential from dairy and beverage sectors
INDF.IJ Price Target : Rp9,150
• Holding company with diversified portfolio, namely: bogasari, ICBP.IJ, LSIP.IJ and SIMP.IJ

Banking Sector
BBRI.IJ Price Target : Rp13,800
• Satellite launching
• King of Microloans
• Attractive Valuation
BBCA.IJ Price Target : Rp15,250
• Low NPL compared to its competitors
• Approaching single digit lending rate
• Strong financial position, presented by low LDR combined with a strong CAR
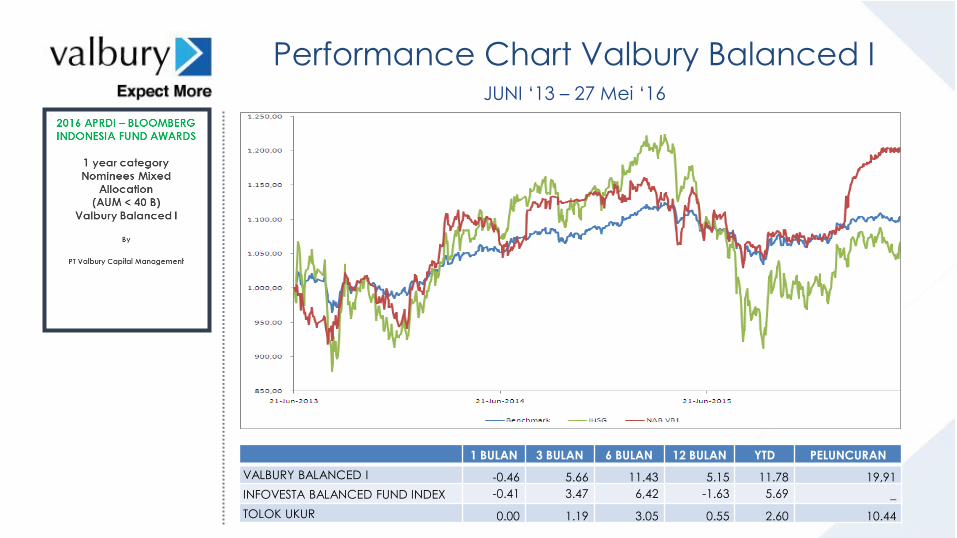
1 BULAN 3 BULAN 6 BULAN 12 BULAN YTD PELUNCURAN
VALBURY BALANCED I -0.46 5.66 11.43 5.15 11.78 19,91
INFOVESTA BALANCED FUND INDEX -0.41 3.47 6,42 -1.63 5.69 _
TOLOK UKUR 0.00 1.19 3.05 0.55 2.60 10.44
JUNI ‘13 – 27 Mei ‘16
Performance Chart Valbury Balanced I

SIMULASI HASIL INVESTASI
Performance Reksadana Valbury Capital Protected III
Periode Penawaran: 6 – 8 Juni 2016
Peluncuran : 9 Juni 2016
Lock Up periode : 1 Tahun
MANAJER INVESTASI BANK KUSTODIAN
70 % -100 % 0 % - 30 %
Efek Bersifat Utang
(Single A-)
Efek Bersifat Utang
dan/Kas dan/ Setara Kas
KOMPOSISI INVESTASI

@researchvaf and @researchvas
/valburyasia
THANK YOU!
/valburyresearch
www.valbury.co.id
CONNECT WITH US: