the bat study for potatoes, vegetables and fruit
TRANSCRIPT

Distribution: Restricted
The BAT study for potatoes, vegetables and fruit processing industry April 2016 translated version of parts of the Dutch version BBT voor de aardappel-, groenten- en fruitverwerkende nijverheid (AGF) Liesbet Van den Abeele, Stella Vanassche, Reinhilde Weltens and Diane Huybrechts 2016/SMAT/R/0592 April 2016
TRANSLATIO
N VERSIO
N APRIL
2016
All rights, amongst which the copyright, on the materials described in this document rest with the Flemish Institute for Technological Research NV (“VITO”), Boeretang 200, BE-2400 Mol, Register of Legal Entities VAT BE 0244.195.916. The information provided in this document is confidential information of VITO. This document may not be reproduced or brought into circulation without the prior written consent of VITO. Without prior permission in writing from VITO this document may not be used, in whole or in part, for the lodging of claims, for conducting proceedings, for publicity and/or for the benefit or acquisition in a more general sense. TRANSLA
TION V
ERSION A
PRIL 20
16

1
ABSTRACT
The Centre for Best Available Techniques (BAT) is founded by the Flemish Government, and is hosted by VITO. The BAT centre collects, evaluates and distributes information on environmentally friendly techniques. Moreover, it advises the Flemish authorities on how to translate this information into its environmental policy. Central in this translation is the concept “BAT” (Best Available Techniques). BAT corresponds to the techniques with the best environmental performance that can be introduced at a reasonable cost. To process potatoes, vegetables and fruit, large amounts of water and energy are used. By processing the potatoes, vegatables and fruit organic materials will migrate to the process water and cause waste water. The processes themselves and the storage of the processed fruit and vegetables use energy. These issues can cause a possible environmental impact. In the study, a distinction is made between companies that produce potatoes, vegetables or fruit. Vegetables and fruit should be processed as soon as possible after harvesting. The harvest periods of the different vegetables and fruits follow one another during the year. Each type of fruit or vegetable has its own (pre)processing steps with a different impact on water use and waste water contamination. The environmental impact therefore, varies during the year. Companies that process potatoes have a continuous process, as potatoes can be stored for a year. The environmental impact of these companies will therefore show less variation. Fruit processing into juices is limited in Flanders. Therefore, these activities are only described in chapters two, three and four. No specific BAT conclusions were developed for these companies. This study also distinguishes different preservation methods of potatoes, vegetables and fruit. Each preservation method has its own environmental impact. For canning, larger amounts of water and energy are needed than for the production of frozen or fresh products. The storage of canned vegetables or fruit is done at room temperature, allowing lower energy consumption in this phase than for frozen products ( -18 °C) or fresh products ( 4 to 6 ° C). The objective of this study was to determine the best available techniques to reduce water and energy consumption and emissions to wastewater and air (odor). An additional point of interest in this study is how the sector can efficiently handle its raw materials to maximize the use as food. In addition, we examined how the side streams can be become feed for livestock, soil improver or source for renewable energy. Based on the BAT conclusions, BAT associated emission levels for the fruit and vegetable sector were derived by the method of Polders et al. (2012). To come to this, emission data of VMM were used. Since the industrial waste water of various types potatoes, vegetables and fruit companies varies and not all proposed BAT are applicable in these companies, a proposal for differentiated BAT associated emission levels (BAT-AEL) was developed. This has been done for potato processing companies and vegetable processors and for larger companies (type frozen and canned products) and smaller companies (type processors of fresh potato and vegetables). The BAT selection in this study was based on plant visits, a literature survey, a technical and socio-economic study and discussions with industry experts and authorities,… The formal consultation was organised by means of an advisory committee.
TRANSLATIO
N VERSIO
N APRIL
2016

2
Table 1: Evaluation of available environmentally-friendly techniques and selection of BAT
Technique Technical feasibility Environmental benefit
Cost
feasib
ility
&
eff
ectiveness
BAT
Pro
ven
Safe
ty
Genera
lly
applicable
Quality
Overa
ll
Wate
r
consum
ption
Waste
wate
r
odour
Waste
ra
w
mate
rials
Energ
y
Chem
icals
Impact
on
the
chain
Overa
ll
Limiting raw materials
Limiting packaging + 01 - 0 +/- 0 0 0 + 0 0 0 + 0 cbc2
Intensive sorting of waste + 0 + 0 + 0 0 0 + 0 0 0 + 0 Yes
Accurate sorting machinery to limit raw
material losses + 0 + + + + + 0 + + 0 + + -
Yes
Automatic filling machinery for cans and glass
packaging + 0 + 0 + 0 + 0 + 0 + + + -
Yes
Good housekeeping in order to limit raw
material losses + 0 + 0 + 0 0 0 + 0 0 + + 0
Yes
Valorisation of secondary streams
Vegetable juice from vegetable residues + 0 - 0 +/- 0 0 0 + 0 0 + + -- No
Recovering starch from the potato processing
industry + 0 + 0 + 0 + 0 + 0 0 + 0 -/0
Yes
1 If the packaging is limited judiciously, this will not have any negative impact on safety or quality. 2 The adaptation or limitation of the packaging must be carefully considered and is not always possible due to quality requirements. TRANSLA
TION V
ERSION A
PRIL 20
16

3
Technique Technical feasibility Environmental benefit
Cost
feasib
ility
&
eff
ectiveness
BAT
Pro
ven
Safe
ty
Genera
lly
applicable
Quality
Overa
ll
Wate
r
consum
ption
Waste
wate
r
odour
Waste
ra
w
mate
rials
Energ
y
Chem
icals
Impact
on
the
chain
Overa
ll
Recovering oil in the production of fried potato
products + 0 + 0 + 0 + 0 + 0 0 0 + 0
Yes
Recovering vitamins and high-quality products
from waste substances of vegetables and fruit -3 0 - 0 - 0 0 0 + - 0 + + -/--
No4
Recovering fertilisers from waste water:
formation of struvite by a chemical process + 0 - 0 + 0 + 0 + 0 - + + --
No5
Recovering fertilisers from waste water:
formation of struvite by a biochemical process -6 0 - 0 - 0 ++ 0 + 0 0 + 0 -/--
No
Valorisation of coir in biofermentation + 0 - 0 +/- 0 + 0 + 0 0 + 0 -
cbc/
No7
Re-using slurry as soil + 0 + 0 + 0 0 0 + 0 0 + + 0 Yes
Valorisation of PVF residues as animal feed + 0 - 0 +/- 0 0 0 + 0 0 + 0 0 cbc8
Electrodialysis for recovering chlorides from
concentrate streams + 0 - 0 +/- + + 0 + - + 0 + -- No9
3 It usually concerns experiments or laboratory-scale installations. 4 This technique goes beyond the BAT. 5 This technique goes beyond the BAT and is eligible for the ecology premium. 6 Only proven on a laboratory scale. 7 Only at very low flow rates. The formation of deposits on the coir must be ensured. 8 If the nutritional value of the residues is sufficient for use as animal feed. 9 This technique goes beyond the BAT. TRANSLA
TION V
ERSION A
PRIL 20
16

4
Technique Technical feasibility Environmental benefit
Cost
feasib
ility
&
eff
ectiveness
BAT
Pro
ven
Safe
ty
Genera
lly
applicable
Quality
Overa
ll
Wate
r
consum
ption
Waste
wate
r
odour
Waste
ra
w
mate
rials
Energ
y
Chem
icals
Impact
on
the
chain
Overa
ll
Internal re-use of concentrate streams from
reverse osmosis plants lab 0 - 0 lab 0 + 0 0 0 + 0 + No10
Use of polymers of NON-petrogenic origin in
water treatment + 0 + 0 + 0 0 0 + 0 0 + + + Yes11
Limiting energy consumption: heat treatments
Pre-heating products when using a steam
peeler + 0 + - +/- 0 0 0 +/- + 0 0 + - No
Limiting microbial contamination during the
production process + + + + + - 0 0 + + - 0 + - Yes
Optimising heat treatment + 0 - + +/- 0 0 0 0 + 0 0 + - Yes12
Appropriate choice of type and size of blancher
and associated technologies + + + + + + 0 0 0 + 0 0 + 0 Yes
Heat treatment during sterilisation or
pasteurisation of cans or glass + + + 0 + 0 0 0 0 + 0 0 + 0 Yes
Limiting energy consumption: alternatives for heat treatments
Cold pasteurisation of drinks and juices using
UV-C -13 0 - + - 0 0 0 0 + 0 0 + -
No
10 This technique has not yet been tested at plant level but does have potential. 11 This is the BAT for plants that only process waste water from PVF plants in their water treatment facilities. 12 This measure must be viewed in the light of “continuous improvements” to the quality and the production process. 13 Has been tested in the lab and on pilot scale. TRANSLA
TION V
ERSION A
PRIL 20
16

5
Technique Technical feasibility Environmental benefit
Cost
feasib
ility
&
eff
ectiveness
BAT
Pro
ven
Safe
ty
Genera
lly
applicable
Quality
Overa
ll
Wate
r
consum
ption
Waste
wate
r
odour
Waste
ra
w
mate
rials
Energ
y
Chem
icals
Impact
on
the
chain
Overa
ll
Pulsed Electrical Field (PEF) -14 0 - + - 0 No
Limiting energy consumption: chilled chain
Differentiated chilling network + 0 - 0 + 0 0 0 0 + 0 0 + - - No15
Automated cold stores + 0 -16 0 +/- 0 0 0 0 + 0 0 + - (-) cbc16
Good housekeeping in chilling + 0 + 0 + 0 0 0 0 + 0 0 + - Yes
Limiting energy consumption: steam
Minimising spray
+ 0 - 0 +/- + 0 0 0 + + 0 + -(-) cbc17 by continuously measuring the conductivity of
the condensate
by using reverse osmosis for boiler feedwater
Differentiated steam network + 0 -18 0 +/- 0 0 0 0 + 0 0 + - cbc18
14 Has been tested in the lab and on pilot scale. 15 This system goes beyond the BAT. It is not feasible for small and micro businesses. For others, this must be taken into consideration
in the case of reinvestments, taking account of the investment costs and electricity consumption of the cooling installation. 16 Automated cold stores are only worthwhile in large cold rooms. The throughput volume and the number of modifications should also
be taken into account. 17 Not applicable to micro-businesses. 18 A thorough analysis of the pipeline network must be performed before introducing such a technology. TRANSLA
TION V
ERSION A
PRIL 20
16

6
Technique Technical feasibility Environmental benefit
Cost
feasib
ility
&
eff
ectiveness
BAT
Pro
ven
Safe
ty
Genera
lly
applicable
Quality
Overa
ll
Wate
r
consum
ption
Waste
wate
r
odour
Waste
ra
w
mate
rials
Energ
y
Chem
icals
Impact
on
the
chain
Overa
ll
Connecting the active boiler to the stand-by
boiler + 0 - 0 +/- 0 0 0 0 + 0 0 + - cbc19
Regular maintenance of the boiler, incinerator
and steam equipment + + - + + 0 0 0 0 + 0 0 + 0 Yes
Using the economiser on the steam boiler + 0 - 0 + 0 0 0 0 + 0 0 + - Yes
Limiting energy consumption: other energy consumption
No-load test + 0 + 0 + 0 0 0 0 + 0 0 + - Yes
Planning software in order to limit energy
consumption
+ 0 - + +/- + 0 0 0 + 0 0 + - cbc20
Insulation of pipelines and buffer tank for hot
water
+ 0 + 0 + 0 0 0 0 + 0 0 + - Yes
Recovery of heat for production of hot water + 0 + 0 0 0 0 0 0 + 0 0 + - Yes
Using a solar boiler + 0 - 0 +/- 0 0 0 0 + 0 0 + -(-) cbc
Using combined heat and power (CHP) and
trigeneration
+ 0 - 0 +/- 0 0 0 0 + 0 0 + -(-) cbc
Using a heat pump + 0 - 0 +/- 0 0 0 0 + 0 0 + -(-) cbc
19 Depending on the size of the installation and the existence of other energy measures applicable to and in relation to the steam
boiler. 20 The use of planning software presupposes that meters and a control system are present. This may well be the BAT for a new
installation. TRANSLATIO
N VERSIO
N APRIL
2016
7
Technique Technical feasibility Environmental benefit
Cost
feasib
ility
&
eff
ectiveness
BAT
Pro
ven
Safe
ty
Genera
lly
applicable
Quality
Overa
ll
Wate
r
consum
ption
Waste
wate
r
odour
Waste
ra
w
mate
rials
Energ
y
Chem
icals
Impact
on
the
chain
Overa
ll
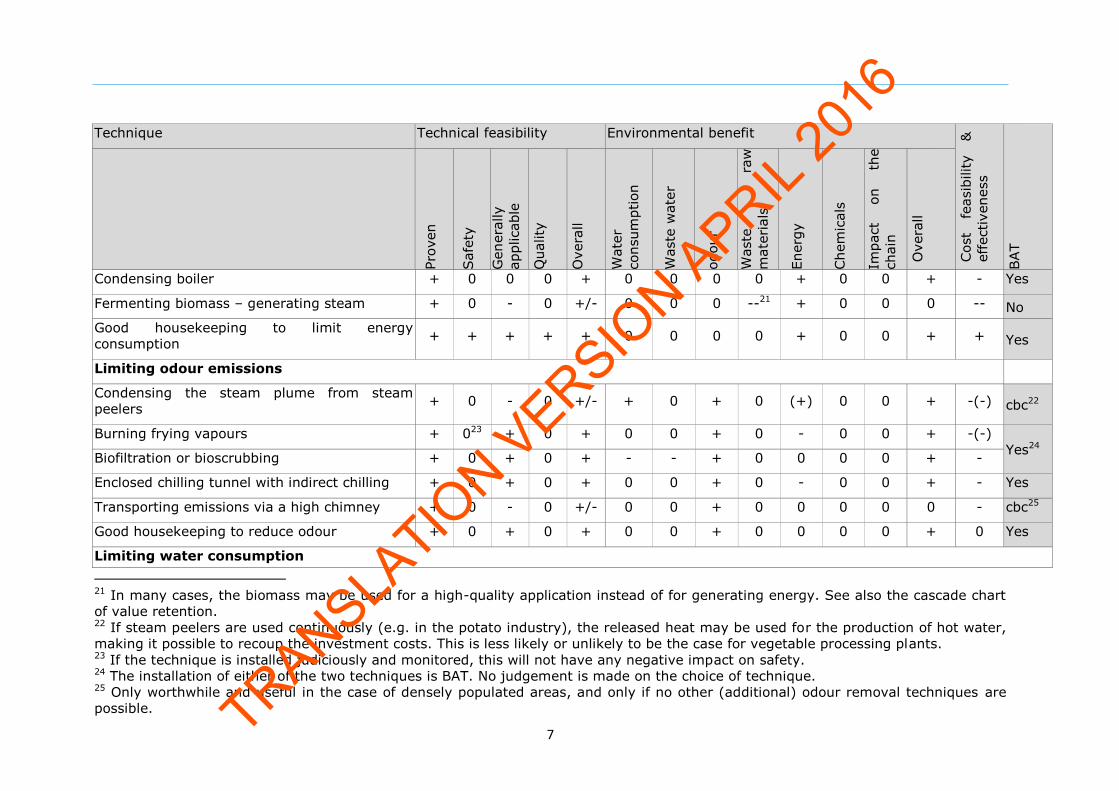
Condensing boiler + 0 0 0 + 0 0 0 0 + 0 0 + - Yes
Fermenting biomass – generating steam + 0 - 0 +/- 0 0 0 --21 + 0 0 0 -- No
Good housekeeping to limit energy
consumption + + + + + 0 0 0 0 + 0 0 + + Yes
Limiting odour emissions
Condensing the steam plume from steam
peelers + 0 - 0 +/- + 0 + 0 (+) 0 0 + -(-) cbc22
Burning frying vapours + 023 + 0 + 0 0 + 0 - 0 0 + -(-)
Yes24 Biofiltration or bioscrubbing + 0 + 0 + - - + 0 0 0 0 + -
Enclosed chilling tunnel with indirect chilling + 0 + 0 + 0 0 + 0 - 0 0 + - Yes
Transporting emissions via a high chimney + 0 - 0 +/- 0 0 + 0 0 0 0 0 - cbc25
Good housekeeping to reduce odour + 0 + 0 + 0 0 + 0 0 0 0 + 0 Yes
Limiting water consumption
21 In many cases, the biomass may be used for a high-quality application instead of for generating energy. See also the cascade chart
of value retention. 22 If steam peelers are used continuously (e.g. in the potato industry), the released heat may be used for the production of hot water,
making it possible to recoup the investment costs. This is less likely or unlikely to be the case for vegetable processing plants. 23 If the technique is installed judiciously and monitored, this will not have any negative impact on safety. 24 The installation of either of the two techniques is BAT. No judgement is made on the choice of technique. 25 Only worthwhile and useful in the case of densely populated areas, and only if no other (additional) odour removal techniques are
possible. TRANSLATIO
N VERSIO
N APRIL
2016

8
Technique Technical feasibility Environmental benefit
Cost
feasib
ility
&
eff
ectiveness
BAT
Pro
ven
Safe
ty
Genera
lly
applicable
Quality
Overa
ll
Wate
r
consum
ption
Waste
wate
r
odour
Waste
ra
w
mate
rials
Energ
y
Chem
icals
Impact
on
the
chain
Overa
ll
Transporting solid materials in dry form + 0 - 0/- +/- + + 0 - 0 0 + + - cbc26
Minimising the use of shallow or deep
groundwater and maximising the use of
rainwater
+ 0 + 0 0/- +27 0 0 0 0 0 0 + - Yes
Direct re-use of water + 0 -28 0 +/- + 0 0 0 0 - 0 + - Yes
Fitting start/stop systems on the water supply + 0 + 0 + + 0 0 0 0 0 0 + - Yes
Extending the service life of water baths at the
point of cutting blades by selectively removing
white starch – potato industry
+/- 0 - 0 +/- + 0 0 0 0 0 0 + -(-) No
Re-use of water after treatment – reverse
osmosis or sand filtration
+ 0 - 0 +/- +
0 0
- 0 + -(-) cbc29 Re-use after treatment – sand filtration 0 0
Re-use after treatment – reverse osmosis -30 -
Good housekeeping – general cleaning + 0 + 0 + + 0 0 0 0 0 0 + 0 Yes
Improving the quality of discharged waste water
26 This is possible for most PVF processing plants. In some cases, vegetable residues must be washed in order to be processed further,
in which case this is an essential production stage. 27 The environmental benefit is: limiting the use of shallow or deep groundwater. 28 This technique cannot be used on every water stream. The conditions described in Chapter 4 must always be taken into account. 29 The economic effect of implementation of the measure must be weighed up. 30 This has no effect on the total discharged load, but it does affect the concentration of chlorides. TRANSLA
TION V
ERSION A
PRIL 20
16

9
Technique Technical feasibility Environmental benefit
Cost
feasib
ility
&
eff
ectiveness
BAT
Pro
ven
Safe
ty
Genera
lly
applicable
Quality
Overa
ll
Wate
r
consum
ption
Waste
wate
r
odour
Waste
ra
w
mate
rials
Energ
y
Chem
icals
Impact
on
the
chain
Overa
ll
Steam peeling of salsify (instead of lye
peeling) + 0 - 0/- +/- 0 + 0 0 0 0 0 + 0 No
Limiting phosphate discharge by potato
processors – preventive measures + 0 + 0 + 0 + 0 0 0 + 0 + - Yes
Limiting phosphate discharge by vegetable
processors – preventively by adding milk of
lime
-
/+31 0 - 0 - 0 + 0 0 0 - 0 No32
Use of environmentally friendly cleaning agents
and disinfectants + 0 + 0 + 0 + 0 0 0 0 0 + - Yes
Limiting chloride discharge – preventively by
limiting softening + 0 + 0 + 0 + 0 0 0 + 0 + -- No
Limiting chloride discharge – by using softener
pellets + 0 - 0 +/- 0 + 0 0 0 + 0 + -- No
Limiting chloride discharge – by using
nanomembranes + 0 - 0 +/ 0 + 0 0 0 0 + + -- No
Limiting chloride discharge – by removing
brine stream + 0 + 0 + 0 + 0 0 0 0 0 + -- No
31 This has been proven for a number of vegetable types. It does not work for other types. 32 The process can only be controlled if only one type of vegetable is being processed at once. In practice, multiple types of vegetables
are processed at the same time. TRANSLATIO
N VERSIO
N APRIL
2016

10
Technique Technical feasibility Environmental benefit
Cost
feasib
ility
&
eff
ectiveness
BAT
Pro
ven
Safe
ty
Genera
lly
applicable
Quality
Overa
ll
Wate
r
consum
ption
Waste
wate
r
odour
Waste
ra
w
mate
rials
Energ
y
Chem
icals
Impact
on
the
chain
Overa
ll
Limiting chloride discharge – clay bath for the
potato processing industry + -33 + 0 - 0 + 0 0 0 0 0 + 0 No
Thickening slurry using a cyclone or in a pool + 0 - 0 +/- 0 0 0 + 0 0 0 + - cbc34
Correct assessment to send streams to
anaerobic treatment or fermenter + 0 + + + 0 + 0 0 0 0 0 + 0 Yes
Limiting the strain on the anaerobic treatment
or fermenter with material that is difficult to
biodegrade
+ 0 - + +/- 0 + 0 0 0 0 0 + 0 cbc35
Heating/chilling the influent of the anaerobic
water treatment + 0 - + +/- 0 + 0 0 0/- 0 0 + - cbc36
Biofermentation + 0 - 0 +/- 0 + 0 + 0 0 0 0 - cbc/N
o37
Limiting phosphate discharges – end-of-pipe
+ 0
0
0 + 0 0 0
0 +
Biological phosphate removal - -/+ 0- - cbc38
Physico-chemical phosphate removal - -/+ - -(-) cbc39
33 Due to potential contamination of the used clay with dioxins. 34 BAT for plants that process PVF straight from the soil. Not applicable to plants that accept washed PVF. 35 BAT for plants that have an anaerobic water treatment facility. 36 BAT for plants that have an anaerobic water treatment facility. 37 Only at very low flow rates. The formation of deposits on the coir must be ensured. 38 Not for sewer dischargers. 39 BAT for large plants or plants that discharge into surface water TRANSLA
TION V
ERSION A
PRIL 20
16

11
Technique Technical feasibility Environmental benefit
Cost
feasib
ility
&
eff
ectiveness
BAT
Pro
ven
Safe
ty
Genera
lly
applicable
Quality
Overa
ll
Wate
r
consum
ption
Waste
wate
r
odour
Waste
ra
w
mate
rials
Energ
y
Chem
icals
Impact
on
the
chain
Overa
ll
Removal of P and N using algae – tertiary
treatment technique - -/+ 0 --
No40
Limiting chloride and phosphate discharges by
means of precise dosing of the flocculant –
end-of-pipe
+ 0 - 0 -/+ 0 + 0 0 0 + 0 + +
cbc41
Good housekeeping for water treatment + 0 + 0 + 0 + 0 0 + + 0 + 0 Yes
General measures
Introduction of environmental management
system + + + + + + + + + + + 0 + 0 Yes
Replacing machinery in good time + + + + + + + + + + + 0 + 0 Yes
Limiting noise pollution + + + 0 + 0 0 0 0 0 0 0 +42 0 Yes
40 This technique goes beyond the BAT. 41 This technique is BAT for frozen-produce plants and large plants. 42 Positive: will limit noise pollution. Noise pollution has not been included as a separate criterion in this table. TRANSLA
TION V
ERSION A
PRIL 20
16

12
BAT-AEL Discharge data provided by the Flanders Environment Agency (VMM) for 2008 to 2014 in relation to vegetable and potato processing plants have been used to determine the BAT-AEL43. The data was divided up by plant type. Separate BAT-AEL were derived for different types of plants.
- A distinction has also been made between vegetable processors and potato
processors. Potato processors operate a continuous process, in which the
composition of the raw material remains relatively stable throughout the year.
The differences in the varieties of potato available will only give rise to limited
changes to the composition of the waste water produced. In the case of
vegetable processors that process other types of vegetables depending on the
time of year, there are greater fluctuations in the composition of the waste
water. Every transition from one type of vegetable to the next requires time for
the biological water treatment system to adjust, as a result of which effluent
concentrations of various parameters may temporarily increase. For that reason,
two BAT-AEL are determined for the vegetable processors: one for the
maximum concentration, and one for an annual average value. With the
exception of the parameter P (see below), BAT-AEL were only determined for
the maximum concentrations for potato processors.
- A distinction is made within the potato processors group between frozen-
produce plants and processors of fresh potato products. These plants differ in
their procedures, which results in a different composition of the waste water.
There is also a difference in terms of scale, which enables larger plants (frozen-
produce plant type) to implement end-of-pipe measures, which in turn makes
for a favourable composition of the discharged waste water.
- A distinction is made within the vegetable processors group between frozen and
preserved food plants and prepared fruit and vegetable plants. The same
reasoning applies here as for the potato processors: there is a difference in
process and a difference in scale, which accounts for differentiated BAT-AEL.
- As only limited data sets were available from wholesalers (both of vegetables
and potatoes), it was not possible to determine the BAT-AEL for these plants.
As the study featured only one preserved food plant and only one crisp-producing plant, these data were not included separately in the study. The data were examined against those of the frozen-produce plants and of the frozen potato plants, however. For the purposes of dividing up the data, we used information from the websites of Vegebe and Belgapom, combined with information from the plants’ websites and information from LNE and VMM. This analysis has shown that certain plants also carry out other activities (e.g. catering). The data from plants with a different activity (that affects the waste water issue) were excluded from the analysis. In addition, a distinction was made between discharge data from plants that discharge into surface water and plants that discharge into sewers. This classification was based on information from the VMM database. In order to determine BAT-AEL for discharging into surface water, the analysis used data from plants that discharge directly and indirectly into surface water. The analysis showed that the discharge data from certain plants labelled “indirect discharger” still did not fulfil expectations. More specifically, it was possible to deduce that these plants potentially did not possess a water treatment facility that could be expected of a plant that discharges into surface water44. The data from these plants were removed from the analysis for surface water dischargers.
43 An overview of all data has been compiled in Annex 4. 44 The status of indirect surface water discharger means that the plant’s situation with regard to discharging will change in the future. The plant will be disconnected in the future (and will have to discharge into surface water) or the plant will be connected to the public sewer network in the future.
TRANSLATIO
N VERSIO
N APRIL
2016

13
Apart from these data manipulations, outliers were also excluded from the analysis. It is not so much cleaning up the statistics, but more of an expert judgement by VITO in consultation with VMM and LNE, whereby it was decided that certain values did not reflect reality. From the perspective of BAT, the following data were removed in relation to surface water dischargers:
- data related to suspended solid concentrations greater than 60 mg/l;
- data related to BOD concentrations greater than 25 mg/l;
- data related to ammonium values greater than 5 mg/l (current standard for
potato processors). The EPAS study (Desmet et al., 2005) confirms that these
values are feasible for the vegetable processing sector.
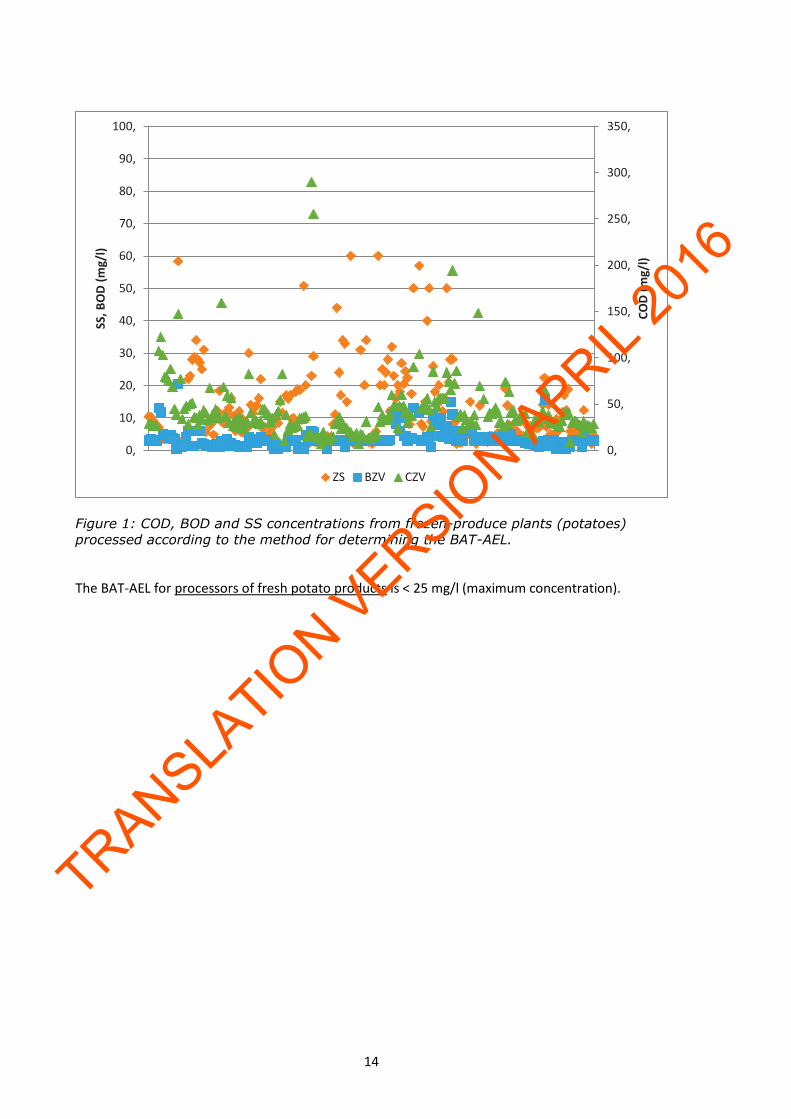
The first set indicates a poor separation of water and suspended particles, which will also affect the parameters COD, BOD and metals. This can be avoided by correctly applying the BAT. The second indicates a poorly functioning biological treatment facility, which is regarded as the BAT for all surface water dischargers. This will also have an effect on the parameters COD and N. The third set indicates a poorly functioning nitrification facility, which will also affect the parameter Ntot. Differentiated BAT-AEL were derived on the basis of this analysis and these are listed in the following tables. Annex 4 contains figures of the original and cleaned-up data sets. Potato processors The figures from the plant that produces crisps from potatoes were examined against those of frozen-produce plants, and the BAT-AEL could be set at the same level. There was too little background information to separate the data from processors of fresh potato products from those from wholesalers of potatoes, and consequently the figures contain data from both groups. The proposed BAT-AEL only relate to the processors, however. BOD The average BOD concentration of the frozen potato plants lies below the classification criterion (6 mg/l). The maximum measured value lies well below the value that is being proposed in the BREF. Based on the analysis on the Flemish frozen-produce plants, the BAT-AEL is < 25 mg/l (maximum concentration).
TRANSLATIO
N VERSIO
N APRIL
2016
14
Figure 1: COD, BOD and SS concentrations from frozen-produce plants (potatoes)
processed according to the method for determining the BAT-AEL.
The BAT-AEL for processors of fresh potato products is < 25 mg/l (maximum concentration).
0,
50,
100,
150,
200,
250,
300,
350,
0,
10,
20,
30,
40,
50,
60,
70,
80,
90,
100,
CO
D (
mg/
l)
SS, B
OD
(m
g/l)
ZS BZV CZV
TRANSLATIO
N VERSIO
N APRIL
2016

15
Figure 2: COD, BOD and SS concentrations from potato wholesalers and processors of
fresh potato products processed according to the method for determining the BAT-AEL.
COD The frozen potato plants have an average COD that lies just above the classification criterion (< 30 mg/l). Based on the analysis of the Flemish frozen-produce plants, the BAT-AEL is < 100 mg/l (maximum concentration). The BAT-AEL for COD for processors of fresh potato products is < 125 mg/l (maximum concentration). SS As stated earlier, it was assumed that with a properly functioning treatment facility, it is possible to limit suspended solid concentration to < 60 mg/l (= BAT-AEL for the maximum concentration). Ntotal
The frozen potato plants have an average Ntot that lies well above the classification criterion. The value of 10 mg/l proposed in the BREF is not being achieved in practice45. These high Ntot values may be attributed to poor nitrification (conversion of ammonium into nitrate) or denitrification (conversion of nitrate into nitrogen), which may indicate problems in the water treatment facility. However, it is not possible to filter out data linked to potentially poorly functioning treatment facilities entirely from the data set. For that reason, it has been assumed in determining the BAT-AEL that these values are unique to the sector. Based on the analysis of the Flemish frozen-produce plants, the BAT-AEL is < 20 mg/l (maximum concentration).
45 The BREF FDM only gives an indicative value. These have not been based on
measurements and the averaging period has not been specified.
0
50
100
150
200
250
300
350
400
0
10
20
30
40
50
60
CO
D (
mg/
l)
SS a
nd
BO
D (
mg/
l)
ZS BZV CZV
TRANSLATIO
N VERSIO
N APRIL
2016

16
Figure 3: COD, Ntot and Ptot concentrations from frozen-produce plants (potatoes) processed according to the method for determining the BAT-AEL.
The BAT-AEL for Ntotal for processors of fresh potato products is < 15 mg/l (maximum concentration).
0,
50,
100,
150,
200,
250,
300,
350,
0
5
10
15
20
25
30
35
40
45
50
CO
D (
mg/
l)
Nto
t, P
tot
(mg/
l)
N tot P tot CZV
0
20
40
60
80
100
120
140
160
180
200
0,
5,
10,
15,
20,
25,
30,
35,C
OD
(m
g/l)
SS a
nd
BO
D (
mg/
l)
Ntot Ptot CZV
TRANSLATIO
N VERSIO
N APRIL
2016

17
Figure 4: COD, Ntot and Ptot concentrations from potato wholesalers and processors of fresh potato products processed according to the method for determining the BAT-AEL. These concern direct dischargers.
Ptotal46
The frozen potato plants have an average Ptot that lies well above the classification criterion (0.14 mg/l). The value of 0.4 to 5 mg/l proposed in the BREF47 is not always being achieved in practice. The removal of phosphate is a physico-chemical process, in which the dosing of chemicals will determine the efficiency of treatment. The highest phosphate concentrations are linked to under-dosing of chemicals in the water treatment plant. Based on the current discharge data, the BAT-AEL is < 10 mg/l (maximum value) and < 2.5 mg/l (annual average value). It was not possible, however, to filter out the effect of the use of BAT of BAT 4.10.16 (Beperking van de chloride- en fosfaat lozing door precieze dosering van het vlokmiddel – end-of-pipe) from the data set. It is expected that the consistent use of this technique will make it possible to achieve lower maximum concentrations in this sector. It is therefore possible to opt for a lower standard for the maximum concentration when implementing the BAT-AEL into the VLAREM Regulation. This is a policy choice. The BAT-AEL for Ptot for processors of fresh potato products is < 10 mg/l (maximum concentration) and < 2.5 mg/l as the annual average value. The tables below summarise the measured emissions and the BAT-AEL for potato processing plants.
Table 2: measured emissions for the potato processing plants based on the VMM data,
processed according to the principle of BAT-AEL
Surface water dischargers
potato-processors – frozen wholesalers and processors of fresh potato products
mean median max. mean median max.
BOD mg/l 4 3 16 6 5 19
COD mg/l 40 33 290 80 54 350
N total mg/l 14 6 210 11 7 83
P total mg/l 5.9 1.6 70 5 2 48
Suspended solids
mg/l 12 6 60 15 15 55
46 Belgapom does not agree with this section. Their comments have been included in
Annex 5. 47 The BREF FDM only gives an indicative value. These have not been based on
measurements and the averaging period has not been specified.
TRANSLATIO
N VERSIO
N APRIL
2016

18
Table 3: BAT-AEL for potato processing plants48
curr
ent
sect
ora
l
dis
char
ge
con
dit
ion
s: s
urf
. w
ate
r/se
wer
B
REF
: BA
T-A
EL*
gen
eral
con
dit
ion
s o
r IC
GS
BAT-AEL for surface water dischargers
frozen-produce plants and crisp producers
processors of fresh potato products
BOD mg/l 25 < 25 6 (1) < 25 < 25
COD mg/l 200 < 125 30 (1) < 100 < 125
N total mg/l < 10 2.4 to 4 (2)
< 20 < 15
P total49 mg/l < 0.4-4 0.14 (2) < 10 (maximum concentration) < 2.5 (annual
average concentration)
< 10 (maximum concentration) < 2.5 (annual
average concentration)
Suspended solids
mg/l < 60 60 < 60 < 60
* The BREF FDM dates back to 2005. With regard to these values, the BREF notes that they concern indicative values, which can be achieved using the BAT described in the BREF. They do not necessarily reflect the emission levels currently (in 2005) being achieved, but are based on expert judgement by TWG. The BREF does not state which averaging period the BAT-AEL relate to. 1: as 90th percentile value 2: mid-summer average 3: dependent on the receiving water
Vegetable processors BOD The average BOD concentration of the frozen-produce plants lies below the classification criterion of < 6 mg/l. Despite this, higher values are being frequently measured that cannot be linked to specific circumstances. Based on the analysis of the Flemish frozen-produce plants, the BAT-AEL is < 6 mg/l (annual average) and < 25 mg/l (maximum concentration).
48 Belgapom does not agree with the value for Ptotal. Their comments have been
included in Annex 5. 49 It is possible to opt for a lower standard for the maximum concentration when implementing the BAT-AEL into the VLAREM Regulation. This is a policy choice.
TRANSLATIO
N VERSIO
N APRIL
2016

19
Figure 5: COD, BOD and SS concentrations from frozen-produce plants (vegetables) processed according to the method for determining the BAT-AEL.
Ninety-five percent of all measured results from the prepared fruit and vegetable plants and the preserved foods sector lie below the classification criterion for BOD (6 mg/l). Based on the analysis of the Flemish prepared fruit and vegetable plants and preserved foods sector, the BAT-AEL is < 25 mg/l (maximum concentration).
0
50
100
150
200
250
300
350
0
10
20
30
40
50
60
CO
D (
mg/
l)
SS, B
OD
(m
g/l)
ZS BZV CZV
TRANSLATIO
N VERSIO
N APRIL
2016

20
Figure 6: COD, BOD and SS concentrations from prepared fruit and vegetable plants processed according to the method for determining the BAT-AEL.
COD The COD values of the frozen-produce plants fluctuate significantly, depending on the conditions and the vegetables processed. Based on the analysis of the Flemish frozen-produce plants, the BAT-AEL is < 70 mg/l (annual average) and < 125 mg/l (maximum concentration). Apart from when salsify is being processed, the BAT-AEL during the period 1 January to 30 April is < 300 mg/l (maximum value). The increase in the BAT-AEL for the maximum concentration does not provide any reason to change the BAT-AEL for the annual average. The data set from the prepared fruit and vegetable plants and the preserved foods sector is too limited to enable the fluctuations in the COD to be linked to specific conditions. Based on the analysis, the BAT-AEL is < 125 mg/l (maximum concentration). SS As stated earlier, it was assumed that with a properly functioning treatment facility, it is possible to limit suspended solid concentration to < 60 mg/l (= BAT-AEL for the maximum concentration). Ntotal
The frozen-produce plants and preserved food sector have an average Ntot that lies well above the classification criterion (< 4 mg/l). The value of 10 mg/l proposed in the BREF is not always being achieved in practice. High Ntot values can be attributed to poor nitrification (conversion of ammonium into nitrate) or denitrification (conversion of nitrate into nitrogen), which may indicate problems in the water treatment facility. The pre-conditions for effective processing can be found in Section 4.10.17 and in the guide to water treatment techniques(Derden et al., 2010). Based on the analysis of the Flemish frozen-produce plants, the BAT-AEL is < 10 mg/l (annual average) and < 15 mg/l (maximum concentration). Under specific conditions, a higher BAT-AEL has been proposed
0
20
40
60
80
100
120
0
5
10
15
20
25
30
35
40
45
CO
D (
mg/
l)
BO
D a
nd
SS
(mg/
l)
ZS BZV CZV
TRANSLATIO
N VERSIO
N APRIL
2016

21
for the maximum concentration. These do not give any grounds for changing the value for the average annual concentration.
Specific conditions BAT-AEL
Processing of leafy vegetables (start-up period) – 1 April to 31 May < 30 mg/l
Processing of peas (start-up period) – is not possible in combination with a deviation for leafy vegetables – 1 June to 15 July
< 30 mg/l
Figure 7: COD, Ntot and Ptot concentrations from frozen-produce plants (vegetables) processed according to the method for determining the BAT-AEL
Wildly fluctuating total nitrogen values were measured in the prepared fruit and vegetable plants. Due the limited data set, it is not possible to link the high values to the type of nitrogen (Kjeldahl, ammonium, nitrite, nitrate). Based on the data set, the BAT-AEL has been set at < 30 mg/l (maximum concentration).
0
50
100
150
200
250
300
350
0,
10,
20,
30,
40,
50,
60,
70,
80,
Nto
t, P
tot
(mg/
l)
Ntot Ptot CZV
TRANSLATIO
N VERSIO
N APRIL
2016

22
Figure 8: COD, Ntot and Ptot concentrations from prepared fruit and vegetable plants processed according to the method for determining the BAT-AEL.
Ptotal
The frozen-produce plants and preserved food sector have an average Ptot that lies well above the classification criterion (0.14 mg/l). The value of 0.4 to 5 mg/l proposed in the BREF is not always being achieved in practice. The removal of phosphate is a physico-chemical process, in which the dosing of chemicals will determine the efficiency of treatment. The highest phosphate concentrations are linked to under-dosing of chemicals in the water treatment plant. Based on the current discharge data, the BAT-AEL is < 3 mg/l (annual average) and < 10 mg/l (maximum concentration). It was not possible, however, to filter out the effect of the use of BAT 4.10.16 (Beperking van de chloride- en fosfaat lozing door precieze dosering van het vlokmiddel – end-of-pipe) from the data set. It is expected that the consistent use of this technique will make it possible to achieve lower maximum concentrations in this sector. It is therefore possible to opt for a lower standard for the maximum concentration when implementing the BAT-AEL into the VLAREM Regulation. This is a policy choice. It is also the case in the prepared fruit and vegetable plants that phosphate discharges can be kept under control by means of physico-chemical treatment. Based on the analyses, the BAT-AEL is the same as for the frozen-produce plants. Overview The tables below summarise the measured emissions and the BAT-AEL for vegetable processing plants.
0
20
40
60
80
100
120
0
10
20
30
40
50
60
70
80
CO
D (
mg/
l)
Ntot Ptot CZV
TRANSLATIO
N VERSIO
N APRIL
2016
23
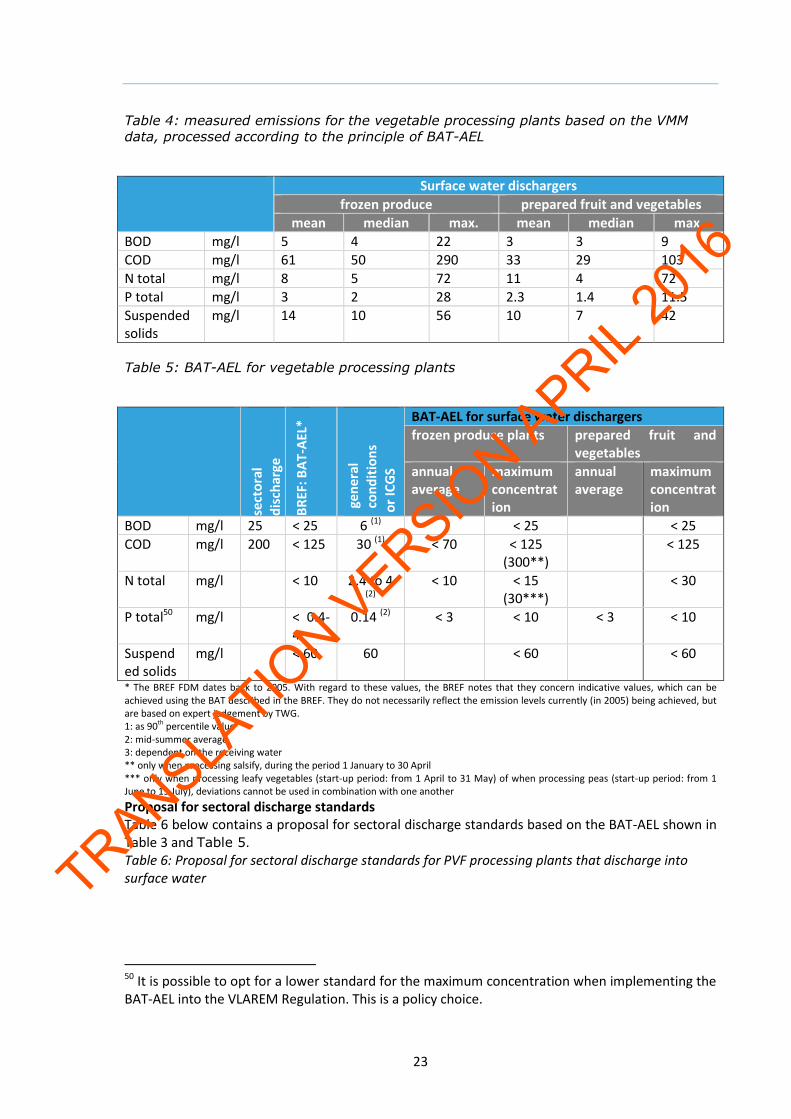
Table 4: measured emissions for the vegetable processing plants based on the VMM
data, processed according to the principle of BAT-AEL
Surface water dischargers
frozen produce prepared fruit and vegetables
mean median max. mean median max.
BOD mg/l 5 4 22 3 3 9
COD mg/l 61 50 290 33 29 103
N total mg/l 8 5 72 11 4 72
P total mg/l 3 2 28 2.3 1.4 11.5
Suspended solids
mg/l 14 10 56 10 7 42
Table 5: BAT-AEL for vegetable processing plants
sect
ora
l d
isch
arge
con
dit
ion
s:
surf
. w
ate
r/se
wer
B
REF
: BA
T-A
EL*
gen
era
l
con
dit
ion
s o
r IC
GS
BAT-AEL for surface water dischargers
frozen produce plants prepared fruit and vegetables
annual average
maximum concentration
annual average
maximum concentration
BOD mg/l 25 < 25 6 (1) < 25 < 25
COD mg/l 200 < 125 30 (1) < 70 < 125 (300**)
< 125
N total mg/l < 10 2.4 to 4 (2)
< 10 < 15 (30***)
< 30
P total50 mg/l < 0.4-4
0.14 (2) < 3 < 10 < 3 < 10
Suspended solids
mg/l < 60 60 < 60 < 60
* The BREF FDM dates back to 2005. With regard to these values, the BREF notes that they concern indicative values, which can be achieved using the BAT described in the BREF. They do not necessarily reflect the emission levels currently (in 2005) being achieved, but are based on expert judgement by TWG. 1: as 90th percentile value 2: mid-summer average 3: dependent on the receiving water ** only when processing salsify, during the period 1 January to 30 April *** only when processing leafy vegetables (start-up period: from 1 April to 31 May) of when processing peas (start-up period: from 1 June to 15 July), deviations cannot be used in combination with one another
Proposal for sectoral discharge standards Table 6 below contains a proposal for sectoral discharge standards based on the BAT-AEL shown in Table 3 and Table 5. Table 6: Proposal for sectoral discharge standards for PVF processing plants that discharge into surface water
50 It is possible to opt for a lower standard for the maximum concentration when implementing the BAT-AEL into the VLAREM Regulation. This is a policy choice.
TRANSLATIO
N VERSIO
N APRIL
2016

24
Potato processors51
Vegetable processors
frozen-produce plants and crisp producers
processors of fresh potato products
frozen produce plants
prepared fruit and vegetables
mg/l annual average value
maximum concentration
annual average value
maximum concentration
annual average value
maximum concentration
annual average value
maximum concentration
BOD 25 25 25 25
COD 100 125 70 125 (300)1
125
N total 20 15 10 15 (30)2 30
P total52
2.5 10 2.5 10 3 10 3 10
Suspended solids
60 60 60 60
Conditions for the values between brackets: 1: Whenever the plant processes salsify, the maximum value is increased to 300 mg/l for the period from 1 January to 30 April. The increase in the maximum value does not provide any reason to change the BAT-AEL for the annual average. 2: During the start-up of the leafy vegetable or pea season, the permitted maximum is increased to 30 mg/l. There are two possible options: (a) during the processing of leafy vegetables, from 1 April to 31 May OR (b) during the processing of peas, from 1 June to 15 July. Plants may only avail themselves of one of the proposed deviation periods, but not a combination of both. The increase in the maximum value does not provide any reason to change the BAT-AEL for the annual average.
A proposal for BAT-AEL for wholesalers was not developed due to the absence of discharge data. Recommendations for monitoring Whenever annual averages are included in the VLAREM regulation, a uniform measuring method must also be included. A range of measurement or calculation methods can be used to determine the annual average. The proposal below already forms part of the specific environmental permit conditions of various plants. The annual average is the progressive arithmetic average of the available analysis results from the previous twelve months. The analysis results are these results from the waste water levy scheme and the 24 samples from the mandatory self-testing programme. The self-testing programme consists of sampling in proportion to the flow rate and the analysis of the effluent in accordance with Article 4.2.5.2 of the VLAREM II regulation. The sampling and the analysis may be conducted by the operator or by an accredited laboratory. If the sampling is conducted by the operator, the first samples from the even months (February, April, June, ...) must be taken and analysed by an accredited laboratory. The samples are taken according to the frequency below and on the proposed dates, or the day after if the date in question falls on an official public holiday. month 1 1st Wednesday and 3rd Saturday of the month month 2 1st Monday and 3rd Thursday of the month month 3 1st Friday and 3rd Monday of the month
51 Belgapom does not agree with the value for Ptotal for the potato processing plants.
Their comments have been included in Annex 5. 52 The proposal for P is based on the current measurement data. It is expected that using BAT 4.10.16 (Beperking van de chloride- en fosfaat lozing door precieze dosering van het vlokmiddel – end-of-pipe) will make lower P values feasible. It is therefore possible to opt for a lower P standard. This is a policy choice.
TRANSLATIO
N VERSIO
N APRIL
2016

25
month 4 1st Wednesday and 3rd Thursday of the month month 5 1st Wednesday and 3rd Tuesday of the month month 6 1st Monday and 3rd Thursday of the month month 7 1st Friday and 3rd Monday of the month month 8 1st Wednesday and 3rd Tuesday of the month month 9 1st Wednesday and 3rd Sunday of the month month 10 1st Wednesday and 3rd Tuesday of the month month 11 1st Monday and 3rd Saturday of the month month 12 1st Friday and 3rd Monday of the month The results must be forwarded to the Flemish Environment Agency within 30 days of taking the samples and must be kept available by the Environment Inspectorate. It is only feasible to impose the aforementioned monitoring regime on plants with sufficiently large turnover. From the perspective of BAT, we consider this feasible for frozen-produce, preserved food and crisp plants. With regard to plants that carry out reverse osmosis on their waste water with the aim of reducing water consumption, the number of measurements must be sufficiently representative. Sampling during dry periods combined with high activity levels may affect the average. It is a matter of policy choice to regulate this specific issue on the basis of the VLAREM regulation or on the basis of the special environmental permit conditions. This issue has been described in this study in the section on indicative reference volumes (1.1.1).
1.1.1 Recommendations for special permit conditions
Not all BAT lend themselves to direct translation into environmental legislation. However, it may well be useful for the permitting authority to also take account of other measures in the permit, and to impose special permit conditions in this regard if required. The sections below describe in detail a proposal for
- chloride standards depending on specific conditions
- the effect of water-saving measures on discharge standards
- areas for attention in relation to raw materials, auxiliary substances and waste
substances
- areas for attention in relation to water quality (sensitive watercourses, additional
discharge parameters).
Issue of chlorides versus phosphates for frozen-produce plants, preserved
foods plants and crisp plants
Annex 3 examines the associated issue between chlorides and phosphates. Depending on the desired water quality of the receiving water course and the dilution factor (this being the ratio between the discharged flow rate and the flow rate of the water course), different standards are desirable with regard to phosphates and chlorides. Water consumption will decrease as a result of using the BAT “Re-use of water after treatment – reverse osmosis or sand filtration”. This may have an impact on the discharged P and chlorides concentrations.
TRANSLATIO
N VERSIO
N APRIL
2016

26
Table 7: BAT-AEL for chlorides depending on the technology used and required P
concentration.
P-concentration without reverse osmosis with reverse osmosis
max.: 10 mg/l 1000 mg/l 2000 mg/l
max.: 5 mg/l 2000 mg/l 5000 mg/l
average: 2 to 3 mg/l (1) 2000 mg/l 5000 mg/l (1) In the case of a maximum value and an average value, this must be followed by the average value
in relation to the chloride standard.
If lower phosphate or chloride standards are desired, then technologies other than BAT must be used.
TRANSLATIO
N VERSIO
N APRIL
2016

27
1.2 Material and energy streams in the chain
The PVF sector is inextricably linked to a number of other sectors in the product chain. Energy and material streams are exchanged within this chain and the output of one sector forms the input for another. The source of environmental issues that arise in one sector may be found in another sector (which also determines their solution). With a view to making the economy greener, it is extremely important not only to devote attention to the direct environmental impact of the sector, but to also take account of the interactions in the chain. An overview of the energy, water and material streams of which the production of vegetables, potatoes and fruit forms part, is shown in Figuur 43. This overview may be regarded as a general representation. Additional specific streams may also arise that have not been included in it. By charting these energy, water and material streams, we gain an insight into how the sector is connected with other sectors, where loops can be closed, and how certain environmental issues can be resolved in the interaction between sectors.
1.2.1 Degree of loop closure
At first glance, the materials loop appears to be closed. However, this is not the case if the aspects of location and time are taken into account.
- A variety of fertilisers are manufactured on the basis of ores and oil, and these
are not replenished.
- In addition, energy is used from fossil fuels, which are finite.
- An excess of (useful) nutrients (carbon, nitrogen, phosphorus) is removed or
broken down in the water treatment facility and these substances are not fed
back to the chain. Another part ends up in watercourses and results in pollution
of surface water.
1.2.2 Environmental issues in other sectors whose causes are found in the
PVF processing sector
- Drying up and salinisation of ground water as a result of high water
consumption.
1.2.3 Environmental issues in the PVF sector whose causes are found in
other sectors
- The use of pesticides results in contamination of the waste water used by the
PVF processing plants (see 3.14.2).
- The use of trace elements in feed for animals whose dung is used for the
cultivation of PVF results in contamination of waste water (see 1.3.1).
TRANSLATIO
N VERSIO
N APRIL
2016

28
1.3 Measures within the chain
The study in Chapter three, and more specifically section 1.2 show that some environmental issues are caused by activities that precede those of the food industry. These problems can be more effectively tackled within other sector studies or at a higher level.
1.3.1 Limiting copper and zinc in animal feed
description of measure
Pigs, cattle and calves need copper and zinc for growth and development. These elements are added to the compound feedstuffs for these animals. In order to be certain that the animals take in sufficient quantities of these elements, an excess amount is added to the feedstuffs. Measurements have shown that only 10% of the added copper and zinc are removed via the meat. The rest of the copper and zinc is excreted and some of it ends up in the manure (NN, 2008). Limiting the copper and zinc in feedstuffs will have a favourable effect on the composition of the manure that is later used as fertiliser on fields in which vegetables and potatoes are grown. If the manure contains lower levels of copper and zinc, the crops that are grown on these fields will also contain less copper and zinc. As a result, it is less likely that excessive concentrations of copper and zinc will be found in the waste water of PVF processing plants.
place within the chain
Agriculture: livestock production.
1.3.2 Supply of soft water by suppliers of mains water or grey water
description of measure
Section 3.10 shows that the hardness of the water used by PVF processors for their production process will determine the chloride concentration in the waste water. The chloride concentration will decrease if soft water is supplied to these plants (but also other plants). If drinking water or grey water is produced from hard water, it is better to soften it centrally at sites where increased salt concentrations have No harmful effects upon the receiving watercourse.
place within the chain
Drinking water producers.
1.3.3 Reuse of waste water in other sectors
description of measure
One line of thinking is the use of waste water from PVF plants in farming. Farms that produce PVF need to pump up ground or surface water during dry spells in order to meet their needs. The
TRANSLATIO
N VERSIO
N APRIL
2016

29
pumping up of (deep) groundwater is generally not desirable, because these water layers are already under pressure. Vegetable processing plants discharge effluent water throughout the year. These flow rates are greatest during the months of most intensive activity: spring and summer. These plants often discharge into small watercourses, in which case the discharged flow rate is often greater than that of the watercourse. The vegetable processing plants are usually located in the area surrounding farms that supply to the PVF sector. By linking the demand for water of one to the supply of another, we create a win-win situation throughout the chain.
place within the chain
Agriculture: crop production.
TRANSLATIO
N VERSIO
N APRIL
2016