the athena x-ray integral field unit (x-ifu) · 2016-08-30 · the athena x-ray integral field unit...
TRANSCRIPT
The Athena X-ray Integral Field Unit (X-IFU)
Didier Barreta, Thien Lam Trongb, Jan-Willem den Herderc, Luigi Pirod, Xavier Barconse,Juhani Huovelinf, Richard Kelleyg, J. Miguel Mas-Hesseh, Kazuhisa Mitsudai, Stephane
Paltanij, Gregor Rauwk, Agata Rozanskal, Joern Wilmsm, Marco Barberan, Enrico Bozzoj,Maria Teresa Ceballose, Ivan Charleso, Anne Decourchellep, Roland den Hartogc, Jean-MarcDuvalo, Fabrizio Fioreq, Flavio Gattir, Andrea Goldwurms, Brian Jacksonc, Peter Jonkerc,
Caroline Kilbourneg, Claudio Macculid, Mariano Mendezt, Silvano Molendiu, Piotr Orleanskiv,Francois Pajota, Etienne Pointecouteaua, Frederick Porterg, Gabriel W. Prattp, Damien
Prelew, Laurent Raveraa, Etienne Renottex, Joop Schayey, Keisuke Shinozakiz, LucaValenzianoA, Jacco VinkB, Natalie Webba, Noriko Yamasakii, Francoise Delcelier-Douchinb,Michel Le Dub, Jean-Michel Mesnagerb, Alice Pradinesb, Graziella Branduardi-RaymontC,Mauro DadinaA, Alexis Finoguenovf, Yasushi FukazawaD, Agnieszka JaniukE, Jon MillerF,
Yael Nazek, Fabrizio Nicastroq, Salvatore SciortinoG, Jose Miguel TorrejonH, Herve Geoffrayb,Isabelle Hernandezb, Laure Lunob, Philippe Peillea, Jerome Andreb, Christophe Danielb,
Christophe Etcheverryb, Emilie Gloaguenb, Jeremie Hassinb, Gilles Hervetb, Irwin Maussangb,Jerome Mouezab, Alexis Pailletb, Bruno Vellab, Gonzalo Campos Garridob, Jean-Charles
Dameryb, Chantal Panemb, Johan Panhb, Simon Bandlerg, Jean-Marc Biffib, Kevin Boyceg,Antoine Cleneta, Michael DiPirrog, Pierre Jamottonx, Simone Lottid, Denis Schwanderb,
Stephen Smithg, Bert-Joost van Leeuwenc, Henk van Weersc, Thorsten Brandm, Beatriz Coboe,Thomas Dauserm, Jelle de Plaac, and Edoardo Cucchettia
aIRAP CNRS, 9 Av. colonel Roche, BP 44346, F-31028 Toulouse cedex 4, France andUniversite de Toulouse III Paul Sabatier / OMP, Toulouse, France
bCentre National d’Etudes Spatiales, Centre spatial de Toulouse, 18 avenue Edouard Belin,31401 Toulouse Cedex 9, France
cSRON, Netherlands Institute for Space Research, Sorbonnelaan 2, 3584 CA Utrecht, TheNetherlands
dINAF/Istituto di Astrofisica e Planetologia Spaziali, Via Fosso del Cavaliere 100, 00133,Roma, Italy
eInstituto de Fısica de Cantabria (CSIC-UC), E-39005 Santander, Cantabria, SpainfDepartment of Physics, Division of Geophysics and Astronomy, P.O. Box 48, FI-00014,
University of Helsinki, FinlandgNASA/Goddard Space Flight Center, 8800 Greenbelt Rd, Greenbelt, MD 20771, United
StateshCentro de Astrobiologıa, CSIC / INTA, Ctra de Torrejon a Ajalvir, 4 km, 28850 Torrejon de
Ardoz, Madrid, SpainiInstitute of Space and Astronautical Science (ISAS) & Japan Aerospace Exploration Agency
(JAXA), 3-1-1 Yoshinodai, Chuo-ku, Sagamihara, 252-5210, JapanjDepartment of Astronomy, University of Geneva, Chemin d’Ecogia 16, CH-1290 Versoix,
SwitzerlandkUniversity of Liege, Institute for Astrophysics & Geophysics, Allee du 6 Aout 19c, B-4000
Liege, BelgiumlNicolaus Copernicus Astronomical Centre of the Polish Academy of Sciences, ul. Bartycka 18,
00-716 Warsaw, Poland
arX
iv:1
608.
0810
5v1
[as
tro-
ph.I
M]
29
Aug
201
6
mECAP, University of Erlangen-Nuremberg, Sternwartstr. 7, 96049 Bamberg, GermanynUniversita degli Studi di Palermo, Dipartimento di Fisica e Chimica, Via Archirafi 36, 90123
Palermo, Italy and INAF/Osservatorio Astronomico di Palermo G.S.Vaiana, Piazza delParlamento 1, 90134 Palermo, Italy
oUniv. Grenoble Alpes, CEA INAC-SBT, 38000 Grenoble, FrancepLaboratoire AIM, UMR 7158, CEA/CNRS/Universite Paris Diderot, CEA DRF/IRFU/SAp,
F-91191 Gif sur Yvette , FranceqINAF-Osservatorio Astronomico di Roma, Via Frascati, 33 - 00078, Monte Porzio Catone,
ItalyrUniversity of Genova, Dept. of Physics, Via Dodecaneso 33, 16146, Genova, Italy
sAPC - Astroparticule et Cosmologie, Universite Paris Diderot, 10 rue A. Domon et L.Duquet, 75205 Paris cedex 13, France and Service d’Astrophysique IRFU/DRF/CEA Saclay,
F-91191 Gif sur Yvette cedex, FrancetUniversity of Groningen, Landleven 12, 9747 AD Groningen, The Netherlands
uINAF - IASF Milano, Via E. Bassini 15, I-20133 Milano, ItalyvCentrum Badan Kosmicznych, Polish Academy of Science, Bartycka 18a, 00-716 Warszawa,
PolandwAPC - Astroparticule et Cosmologie, Universite Paris Diderot, 10 rue A. Domon et L.
Duquet, 75205 Paris cedex 13, FrancexCSL - Centre Spatial de Liege, Avenue du Pre-AiIly (B29), B-4031 Angleur (Liege), BelgiumyLeiden Observatory, Leiden University, PO Box 9513, NL-2300 RA Leiden, The Netherlands
zJapan Aerospace Exploration Agency, Research Unit II (U2), Research and DevelopmentDirectorate, 305-8505 2-11, Sengen, Tsukuba, Ibaraki, Japan
AINAF-IASF Istituto di Astrofisica Spaziale e Fisica Cosmica, Area della Ricerca - via PieroGobetti, 101 - 40129, Bologna, Italy
BAnton Pannekoek Institute/GRAPPA, University of Amsterdam, PO Box 94249, NL-1090GE Amsterdam, The Netherlands
CUniversity College London - Mullard Space Science Laboratory, Holmbury St. Mary Dorking,Surrey, RH5 6NT, United Kingdom
DHiroshima University, High Energy Astrophysics Group, Department of PhysicalSciences,1-3-1 Kagamiyama, Higashi-Hiroshima, Hiroshima 739-8526, Japan
ECenter for Theoretical Physics, Polish Academy of Sciences, Al. Lotnikow 32/46, 02-668Warsaw, Poland
FUniversity of Michigan Department of Astronomy, Ann Arbor, 1085 South UniversityAvenue, MI 48109-1107, United States
GINAF/Osservatorio Astronomico di Palermo G.S.Vaiana, Piazza del Parlamento 1, 90134Palermo, Italy
HIUFACyT, Universidad de Alicante, Campus de San Vicente del Raspeig, E03690, Alicante,Spain
Further author information: (Send correspondence to Didier Barret: [email protected])
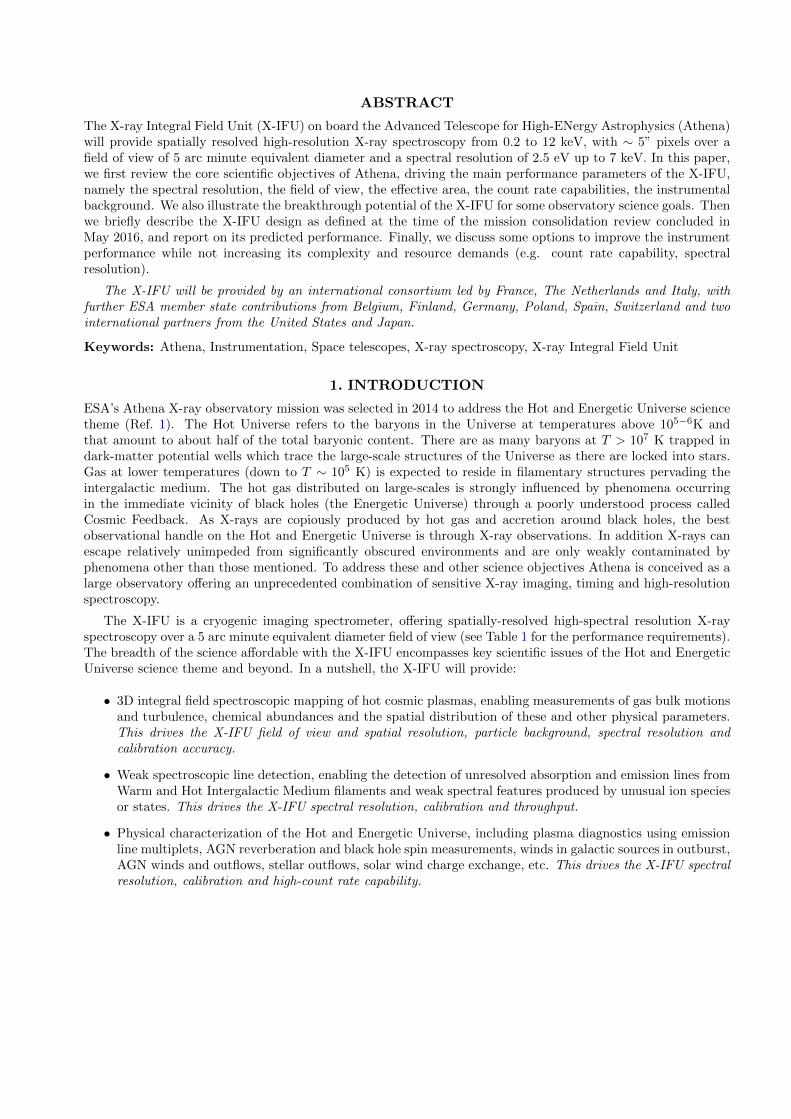
ABSTRACT
The X-ray Integral Field Unit (X-IFU) on board the Advanced Telescope for High-ENergy Astrophysics (Athena)will provide spatially resolved high-resolution X-ray spectroscopy from 0.2 to 12 keV, with ∼ 5” pixels over afield of view of 5 arc minute equivalent diameter and a spectral resolution of 2.5 eV up to 7 keV. In this paper,we first review the core scientific objectives of Athena, driving the main performance parameters of the X-IFU,namely the spectral resolution, the field of view, the effective area, the count rate capabilities, the instrumentalbackground. We also illustrate the breakthrough potential of the X-IFU for some observatory science goals. Thenwe briefly describe the X-IFU design as defined at the time of the mission consolidation review concluded inMay 2016, and report on its predicted performance. Finally, we discuss some options to improve the instrumentperformance while not increasing its complexity and resource demands (e.g. count rate capability, spectralresolution).
The X-IFU will be provided by an international consortium led by France, The Netherlands and Italy, withfurther ESA member state contributions from Belgium, Finland, Germany, Poland, Spain, Switzerland and twointernational partners from the United States and Japan.
Keywords: Athena, Instrumentation, Space telescopes, X-ray spectroscopy, X-ray Integral Field Unit
1. INTRODUCTION
ESA’s Athena X-ray observatory mission was selected in 2014 to address the Hot and Energetic Universe sciencetheme (Ref. 1). The Hot Universe refers to the baryons in the Universe at temperatures above 105−6K andthat amount to about half of the total baryonic content. There are as many baryons at T > 107 K trapped indark-matter potential wells which trace the large-scale structures of the Universe as there are locked into stars.Gas at lower temperatures (down to T ∼ 105 K) is expected to reside in filamentary structures pervading theintergalactic medium. The hot gas distributed on large-scales is strongly influenced by phenomena occurringin the immediate vicinity of black holes (the Energetic Universe) through a poorly understood process calledCosmic Feedback. As X-rays are copiously produced by hot gas and accretion around black holes, the bestobservational handle on the Hot and Energetic Universe is through X-ray observations. In addition X-rays canescape relatively unimpeded from significantly obscured environments and are only weakly contaminated byphenomena other than those mentioned. To address these and other science objectives Athena is conceived as alarge observatory offering an unprecedented combination of sensitive X-ray imaging, timing and high-resolutionspectroscopy.
The X-IFU is a cryogenic imaging spectrometer, offering spatially-resolved high-spectral resolution X-rayspectroscopy over a 5 arc minute equivalent diameter field of view (see Table 1 for the performance requirements).The breadth of the science affordable with the X-IFU encompasses key scientific issues of the Hot and EnergeticUniverse science theme and beyond. In a nutshell, the X-IFU will provide:
• 3D integral field spectroscopic mapping of hot cosmic plasmas, enabling measurements of gas bulk motionsand turbulence, chemical abundances and the spatial distribution of these and other physical parameters.This drives the X-IFU field of view and spatial resolution, particle background, spectral resolution andcalibration accuracy.
• Weak spectroscopic line detection, enabling the detection of unresolved absorption and emission lines fromWarm and Hot Intergalactic Medium filaments and weak spectral features produced by unusual ion speciesor states. This drives the X-IFU spectral resolution, calibration and throughput.
• Physical characterization of the Hot and Energetic Universe, including plasma diagnostics using emissionline multiplets, AGN reverberation and black hole spin measurements, winds in galactic sources in outburst,AGN winds and outflows, stellar outflows, solar wind charge exchange, etc. This drives the X-IFU spectralresolution, calibration and high-count rate capability.
X-IFU - Perseus core
Phot
ons
m-2
s-1
keV
-1
10
100
1000
Energy (keV)0.5 1 2 5
10
100
6.5 7.0
500
1000
1.0 1.2
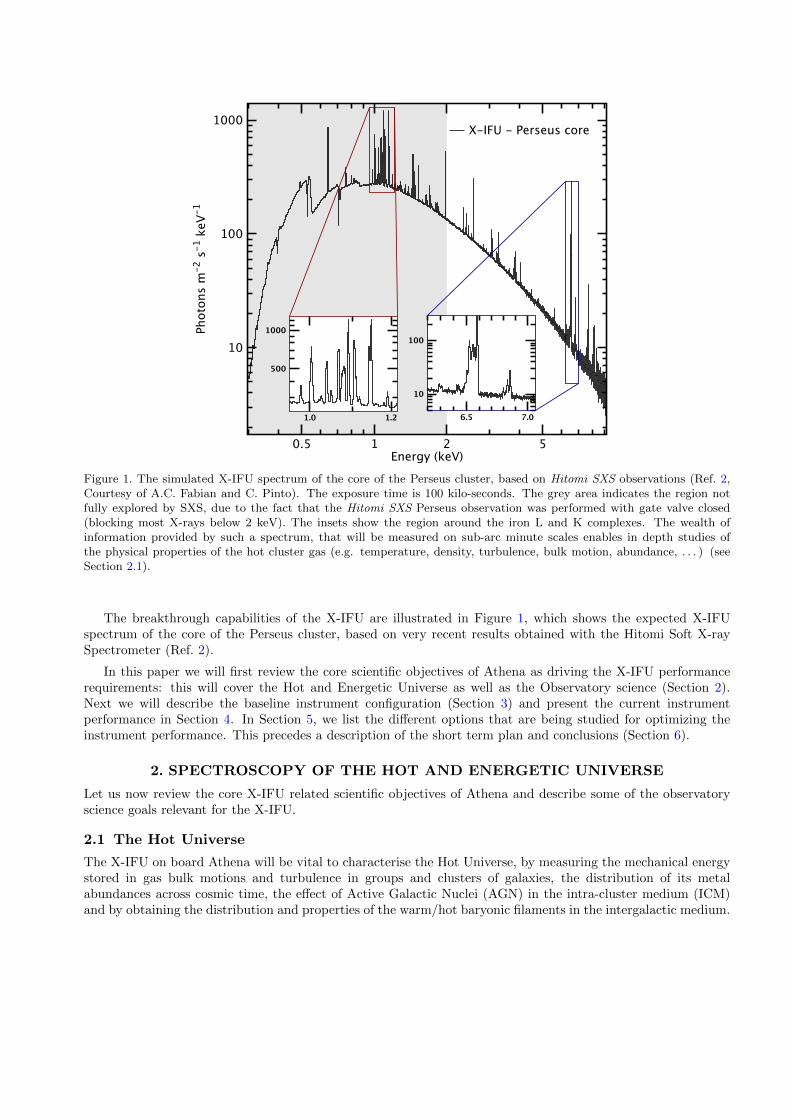
Figure 1. The simulated X-IFU spectrum of the core of the Perseus cluster, based on Hitomi SXS observations (Ref. 2,Courtesy of A.C. Fabian and C. Pinto). The exposure time is 100 kilo-seconds. The grey area indicates the region notfully explored by SXS, due to the fact that the Hitomi SXS Perseus observation was performed with gate valve closed(blocking most X-rays below 2 keV). The insets show the region around the iron L and K complexes. The wealth ofinformation provided by such a spectrum, that will be measured on sub-arc minute scales enables in depth studies ofthe physical properties of the hot cluster gas (e.g. temperature, density, turbulence, bulk motion, abundance, . . . ) (seeSection 2.1).
The breakthrough capabilities of the X-IFU are illustrated in Figure 1, which shows the expected X-IFUspectrum of the core of the Perseus cluster, based on very recent results obtained with the Hitomi Soft X-raySpectrometer (Ref. 2).
In this paper we will first review the core scientific objectives of Athena as driving the X-IFU performancerequirements: this will cover the Hot and Energetic Universe as well as the Observatory science (Section 2).Next we will describe the baseline instrument configuration (Section 3) and present the current instrumentperformance in Section 4. In Section 5, we list the different options that are being studied for optimizing theinstrument performance. This precedes a description of the short term plan and conclusions (Section 6).
2. SPECTROSCOPY OF THE HOT AND ENERGETIC UNIVERSE
Let us now review the core X-IFU related scientific objectives of Athena and describe some of the observatoryscience goals relevant for the X-IFU.
2.1 The Hot Universe
The X-IFU on board Athena will be vital to characterise the Hot Universe, by measuring the mechanical energystored in gas bulk motions and turbulence in groups and clusters of galaxies, the distribution of its metalabundances across cosmic time, the effect of Active Galactic Nuclei (AGN) in the intra-cluster medium (ICM)and by obtaining the distribution and properties of the warm/hot baryonic filaments in the intergalactic medium.

2.1.1 Cluster bulk motions and turbulence
The hierarchical growth of large-scale structures happens through continuous accretion of material and successivemerging events (Refs. 3–5). These processes heat the gas filling the massive halos by adiabatic compression andby countless shocks they generate at all scales (e.g., Ref. 6).
Part of the gravitational energy released at the formation of a halo is channeled through bulk motions andturbulent flows. It cascades down to smaller scales where it is dissipated, thereby contributing to the virialisationof their hot gaseous atmosphere (Refs. 7–9). Turbulence in the ICM is also related to the weak magnetic fieldbathing the cluster gas and further links to the viscosity, convection and conduction of the gas (Ref. 10). Theconnection between these micro-scale physical processes, as well as their impact on the larger scales is still to beunveiled in order to fully understand the overarching process of assembling large scale structures.
To date this has been investigated mostly by establishing a connection between the statistics of surfacebrightness fluctuations and of the turbulent velocity field (e.g., Refs. 11–13). Direct measurement of the turbulentvelocity and bulk motions can be obtained from the respective measurement of the broadening and shift theyinduce on the atomic emission lines from the ICM. X-ray grating spectroscopy has only provided upper limits(e.g., Refs. 14, 15). Thanks to the capabilities of the SXS calorimeter spectrometer (Ref. 16) Hitomi (Ref. 17)has provided an unprecedented view of the Perseus cluster (Ref. 2), showing for the first time what spatially-resolved high-resolution X-ray spectroscopy can deliver. These unique observations have shown that the levelof turbulence close to the core of Perseus is rather modest (< 164 ± 10 km s−1), despite the highly structuredspatial distribution of hot gas resulting from AGN feedback. This is only a small glimpse of what X-IFU will beable to do, but on 12 times smaller spatial scales and with a spectroscopic throughput which will be 25 timeslarger than that of Hitomi/SXS.
The direct measurement of the bulk motions and turbulence velocity field thus requires spatially-resolved,high resolution spectroscopy. The X-IFU on board the Athena observatory will be the first integral field unitoperating at X-ray wavelengths that will allow, thanks to its joint spatial (5′′) and spectral (2.5 eV) resolution,to map the velocity field of the hot gas in groups and clusters of galaxies down to a precision of 10 − 20 km s−1
for velocities ranging between 100 − 1000 km s−1 (see Fig. 2).
The joint high spatial and spectral resolution of the X-IFU shall also allow to resolve line complexes (e.g.,Iron around 6.7 keV) and measure line ratios to further constrain thermodynamics or ionisation state of the gasfar out into the clusters outskirts (see e.g. Ref. 18). All these diagnostics will provide us with a comprehensiveview of how the dark and baryonic matter assemble and evolve into large scale potential wells.
2.1.2 Chemical enrichment
With masses up to and exceeding 1015 M�, the deep potential wells of galaxy clusters retain all the informationregarding the chemical enrichment of their intracluster medium (ICM) across cosmic time (this is not the case forgalaxies, which lose their gaseous haloes and eject metals into the inter-galactic medium through stellar windsand stellar explosions). Just 40 years ago a feature corresponding to FeXXV and FeXXVI transitions wasdiscovered in the X-ray spectrum of the Perseus cluster (Ref. 19). Since then, it has been recognised that thehot gas of the ICM is continuously enriched with heavy elements generated in type Ia (SN1a) and core-collapsesupernova (SNcc) explosions in the cluster member galaxies. Elements from O to Si and S are mainly producedin massive stars and ejected in SNcc at the end of their lifetime. White dwarfs in binary systems give rise to SNIaexplosions that produce elements up to Si, Fe and Ni. X-ray observations of emission lines from highly-ionizedelements are the only way to access information on the abundances of the hot gas, its evolution to high redshift,and the processes by which heavy elements are redistributed into the surrounding ICM.
The combination of Athena’s large effective area and the 2.5 eV spectral resolution of the X-IFU will allowthe abundances of many common heavy elements to be measured to unprecedented precision. Abundance ratiosare a powerful method for constraining the contribution of SN1a, SNcc and AGB stars to the total heavy elementabundance, as each source produces different heavy element yields. Information on the Initial Mass Function(IMF), the stellar populations, and the star formation history of the galaxies in the cluster can also be gleanedfrom the evolution of abundance ratios across time.
21012RA [arcmin]
2
1
0
1
2
Decli
natio
n [ar
cmin]
600
450
300
150
0
150
300
450
Bulk motion [km/s]
Athena X-IFUXMM-Newton EPIC PNHitomi SXS
O
Fe LMg
Fe LFe L SiS
ArCa
Fe-K
Coun
ts/s
/keV
10−4
10−3
10−2
10−1
1
Energy (keV)0.2 0.5 1 2 5
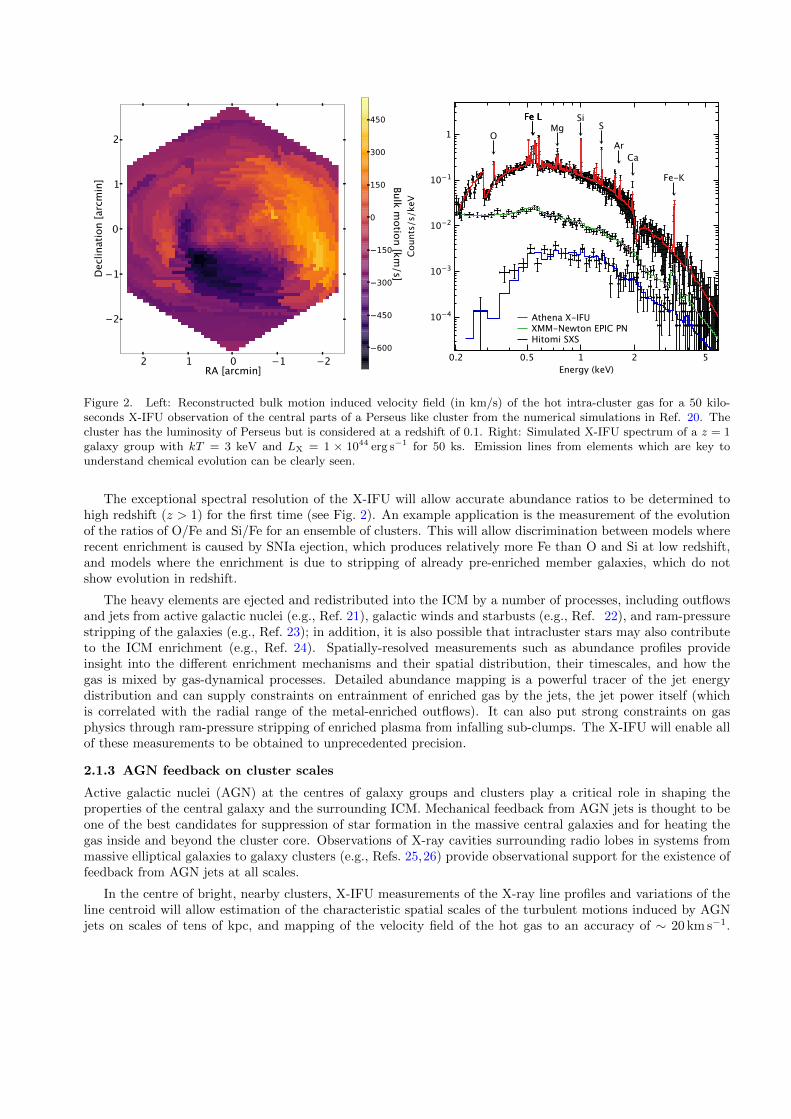
Figure 2. Left: Reconstructed bulk motion induced velocity field (in km/s) of the hot intra-cluster gas for a 50 kilo-seconds X-IFU observation of the central parts of a Perseus like cluster from the numerical simulations in Ref. 20. Thecluster has the luminosity of Perseus but is considered at a redshift of 0.1. Right: Simulated X-IFU spectrum of a z = 1galaxy group with kT = 3 keV and LX = 1 × 1044 erg s−1 for 50 ks. Emission lines from elements which are key tounderstand chemical evolution can be clearly seen.
The exceptional spectral resolution of the X-IFU will allow accurate abundance ratios to be determined tohigh redshift (z > 1) for the first time (see Fig. 2). An example application is the measurement of the evolutionof the ratios of O/Fe and Si/Fe for an ensemble of clusters. This will allow discrimination between models whererecent enrichment is caused by SNIa ejection, which produces relatively more Fe than O and Si at low redshift,and models where the enrichment is due to stripping of already pre-enriched member galaxies, which do notshow evolution in redshift.
The heavy elements are ejected and redistributed into the ICM by a number of processes, including outflowsand jets from active galactic nuclei (e.g., Ref. 21), galactic winds and starbusts (e.g., Ref. 22), and ram-pressurestripping of the galaxies (e.g., Ref. 23); in addition, it is also possible that intracluster stars may also contributeto the ICM enrichment (e.g., Ref. 24). Spatially-resolved measurements such as abundance profiles provideinsight into the different enrichment mechanisms and their spatial distribution, their timescales, and how thegas is mixed by gas-dynamical processes. Detailed abundance mapping is a powerful tracer of the jet energydistribution and can supply constraints on entrainment of enriched gas by the jets, the jet power itself (whichis correlated with the radial range of the metal-enriched outflows). It can also put strong constraints on gasphysics through ram-pressure stripping of enriched plasma from infalling sub-clumps. The X-IFU will enable allof these measurements to be obtained to unprecedented precision.
2.1.3 AGN feedback on cluster scales
Active galactic nuclei (AGN) at the centres of galaxy groups and clusters play a critical role in shaping theproperties of the central galaxy and the surrounding ICM. Mechanical feedback from AGN jets is thought to beone of the best candidates for suppression of star formation in the massive central galaxies and for heating thegas inside and beyond the cluster core. Observations of X-ray cavities surrounding radio lobes in systems frommassive elliptical galaxies to galaxy clusters (e.g., Refs. 25,26) provide observational support for the existence offeedback from AGN jets at all scales.
In the centre of bright, nearby clusters, X-IFU measurements of the X-ray line profiles and variations of theline centroid will allow estimation of the characteristic spatial scales of the turbulent motions induced by AGNjets on scales of tens of kpc, and mapping of the velocity field of the hot gas to an accuracy of ∼ 20 km s−1.

This will give unprecedented insights into how power from the initially highly collimated jets is distributedinto the surrounding ICM. The thermal and non-thermal energy content of the X-ray cavities will be measuredaccurately for the first time, helping to establish their composition. X-IFU will help to detect directly the shockedgas surrounding expanding radio lobes, with a spectral resolution sufficient to resolve shock expansion speedsfor the first time.
The dynamics of the hot gas in the vicinity of cool filaments will yield essential clues to the cooling andmixing process, and enable for the first time a measurement of the amount of material cooling out of the hotphase and relate this to the fuel available to power the AGN. The X-IFU will enable understanding of the entirecycle of heating and cooling in the cores of nearby clusters and groups. Robust jet power measurements for largesamples can be compared to accretion rates of hot and cold material, enabling insights into the accretion processand black hole growth to be obtained.
2.1.4 The missing baryons and the Warm-Hot Intergalactic Medium
The number of visible baryons in the local (z < 2) Universe (stars, cold atomic gas and molecular gas ingalaxies) adds up to only about 15% of the total number of baryons inferred through a number of independentmeasurements of cosmological parameters, and recent radio observations have shown the evidence that theseinvisible baryons mostly reside in the gaseous phase. However, not only the detailed state of the baryons remainsunclear, but at least half of these baryons are still elusive, and thought to lie in a tenuous web of warm-hotintergalactic medium (the WHIM). X-IFU studies of WHIM will provide unprecedented information on the hotphase of the baryons in large scale structures, complementing the COS/HST observations which are sensitive tothe luke-warm phase at 10(5−5.5) K.
X-IFU will pursue three independent approaches to the problem:
• Studies of WHIM in absorption against bright AGN at z < 0.5, probing low-z LSS and their interplay withthe surrounding intergalactic medium;
• Studies of WHIM in absorption (and simultaneously in emission at z < 0.1) against Gamma-Ray Burst(GRB) afterglows, probing the WHIM up to redshift of ∼ 2 or higher and strongly constraining the physics(i.e., density and temperature) and kinematics (turbulence and bulk motions) of the WHIM for thosefilaments detected both in emission and absorption;
• WHIM in emission in the outskirts of galaxy concentrations, probing the kinematics of the warm-hot gasnear large structures.
The main advances compared to previous instrumentation are the unique combination of large collecting areaand spectral resolution. Accurate simulations based on theoretical predictions, show that the X-IFU will be ableto fully understand the WHIM baryon budget with a set of Athena observations of bright nearby (z < 0.5) AGNand more distant (z < 2) GRB afterglows. Fig. 3 (left) displays a simulated spectrum of a GRB afterglow amongthe 10% brightest in the sky, going through a random WHIM line of sight extracted from the hydrodynamicalsimulations in Ref. 27 (spanning the redshift range z = 0−0.85). Four WHIM filaments are detected at redshifts0.108, 0.350, 0.444 and 0.753, one of them with 3 lines. Taking the Swift/BAT GRB monitor as a reference,there are ∼ 25 such GRB afterglows per year, and therefore with a moderate ToO efficiency several such targetscould be observed each year. Obtaining higher quality spectra of high-z objects will be rather infrequent interms of GRB afterglow availability. Alternatively (Fig. 3, right) a bright BL Lac like 3C 454.3, (z = 0.86)could provide a high-quality spectrum along the same simulated line of sight. The challenge in that approach tosample sufficiently long lines of sight is the scarcity of such bright objects at z > 0.5. An optimised combinationof both approaches as a function of the various performance parameters will be necessary.
2.2 The Energetic Universe
X-IFU observations will measure the energy released by accretion onto black holes by winds and outflows,all the way up from the local Universe to z ∼ 3, providing solid ground to understand AGN feedback. Innearby galaxies, the amount of gas, energy and metals blown into the circum-galactic medium by both AGN

OVII Kα
OVII Kα
OVII Kβ
NeIX Kα
OVII Kα
OVIII Kα
Resi
dual
s (σ
)
−12
−10
−8
−6
−4
−2
0
2
4
Energy (keV)0.4 0.5 0.6 0.7
OVII KαNeIX Kα
OVII Kα
OVII Kβ
NeIX Kα
OVII Kα
OVII Kα
OVIII KαOVIII Kα
Resi
dual
s (σ
)
−16
−14
−12
−10
−8
−6
−4
−2
0
2
4
Energy (keV)0.4 0.5 0.6 0.7
Figure 3. The two panels show a simulated X-IFU spectrum of a bright background source at z > 0.8 crossing the samerandom patch of the WHIM as predicted by the simulations in Ref. 27. Four WHIM filaments are clearly detected inboth spectra, in some cases through several absorption lines, enabling direct measurements of the gas temperature andeven turbulence. Left: The background source is a GRB afterglow at z > 0.8 with an effective intrinsic column densityof 1022 cm−2 yielding about 1.5 × 10⁶ counts in the 0.3-2 keV band. This corresponds to the brightest 10% of the GRBafterglows expected in the sky. Right: The background spectrum is that of the brightest known BL Lac at z > 0.8 3C454.3(z = 0.86), with a flux F (0.3− 2 keV ) = 2.7× 10⁻¹¹ erg cm−2 s−1 and integrated for 100 ks yielding about 7× 10⁶ counts.
and starbursts will be mapped. By targeting distant GRB afterglows, X-IFU observations will characterise theambient interstellar medium of high-z galaxies and constrain their prevailing stellar populations. Deep X-IFUobservations of obscured distant AGN will be able to unveil their redshift via the Fe K emission line.
2.2.1 High-z Gamma-ray Bursts: early metal enrichment of the Universe
X-IFU observations of gamma ray bursts can play a unique role in the study of metal enrichment as GRBs arethe brightest light sources at all redshifts and, for long duration events (LGRBs), occur in star-forming regions.As LGRB progenitors are short-lived massive stars, they provide an ideal probe of the effect of stellar evolutionon galaxy chemical enrichment across cosmic time. Beginning with metal free (Population III) stars, the cycleof metal enrichment started when their final explosive stages injected the first elements beyond Hydrogen andHelium into their pristine surroundings, quickly enriching the gas. These ejecta created the seeds for the nextgeneration of stars (population II). Finding and mapping the earliest star formation sites (population III/II stars)is one of the top priorities for future astrophysical observatories. Tracing the first generation of stars is crucialfor understanding cosmic re-ionization, the formation of the first seed Super-Massive Black Holes (SMBH), andthe dissemination of the first metals in the Universe. Photons from Pop III stars and radiation generated fromaccretion onto the first SMBH initiate the Cosmic Dawn.
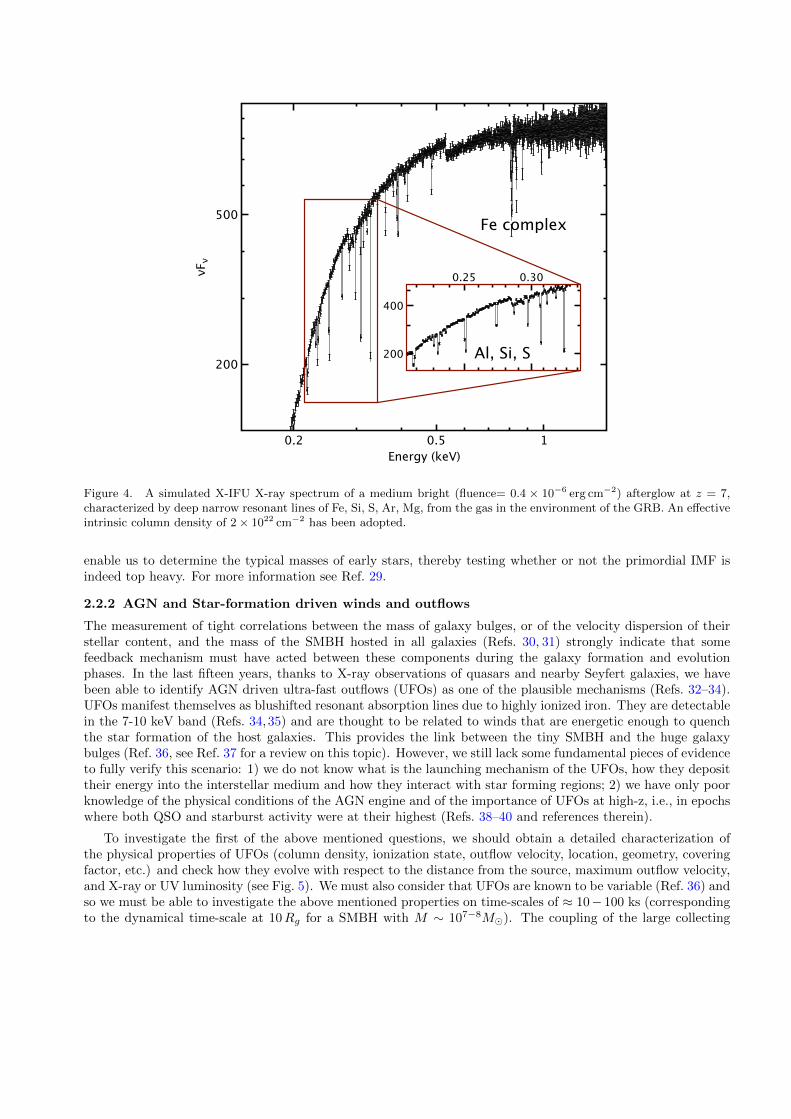
The chemical fingerprint of Pop III star explosions is distinct from that of later generations, opening thepossibility to probe the Initial Mass Function (IMF) of the Universe. Stellar evolution studies show that thenucleosynthetic yields of Pop III and Pop II explosions differ significantly. The convolution of these yields withan IMF directly translates to abundance patterns, which can differ up to an order of magnitude depending onthe characteristic mass scale of the IMF (Ref. 28). The X-IFU will be able to measure metal abundance patternsfor a variety of ions (e.g., S, Si, Fe) for at least 10 medium-bright X-ray afterglows per year with H equivalentcolumn densities as small as 1021cm−2 and gas metallicities as low as 1% of solar for the denser regions expectedin early star-forming zones; in even denser regions the accuracy will be further improved (Fig. 4). Measuringthese patterns using GRBs, combined with Athena studies of AGN sightlines, galaxies and supernovae, will
Fe complex
Al, Si, S
νF
ν
200
500
Energy (keV)
0.2 0.5 1
200
400
0.25 0.30
Figure 4. A simulated X-IFU X-ray spectrum of a medium bright (fluence= 0.4 × 10⁻⁶ erg cm−2) afterglow at z = 7,characterized by deep narrow resonant lines of Fe, Si, S, Ar, Mg, from the gas in the environment of the GRB. An effectiveintrinsic column density of 2 × 1022 cm−2 has been adopted.
enable us to determine the typical masses of early stars, thereby testing whether or not the primordial IMF isindeed top heavy. For more information see Ref. 29.
2.2.2 AGN and Star-formation driven winds and outflows
The measurement of tight correlations between the mass of galaxy bulges, or of the velocity dispersion of theirstellar content, and the mass of the SMBH hosted in all galaxies (Refs. 30, 31) strongly indicate that somefeedback mechanism must have acted between these components during the galaxy formation and evolutionphases. In the last fifteen years, thanks to X-ray observations of quasars and nearby Seyfert galaxies, we havebeen able to identify AGN driven ultra-fast outflows (UFOs) as one of the plausible mechanisms (Refs. 32–34).UFOs manifest themselves as blushifted resonant absorption lines due to highly ionized iron. They are detectablein the 7-10 keV band (Refs. 34, 35) and are thought to be related to winds that are energetic enough to quenchthe star formation of the host galaxies. This provides the link between the tiny SMBH and the huge galaxybulges (Ref. 36, see Ref. 37 for a review on this topic). However, we still lack some fundamental pieces of evidenceto fully verify this scenario: 1) we do not know what is the launching mechanism of the UFOs, how they deposittheir energy into the interstellar medium and how they interact with star forming regions; 2) we have only poorknowledge of the physical conditions of the AGN engine and of the importance of UFOs at high-z, i.e., in epochswhere both QSO and starburst activity were at their highest (Refs. 38–40 and references therein).
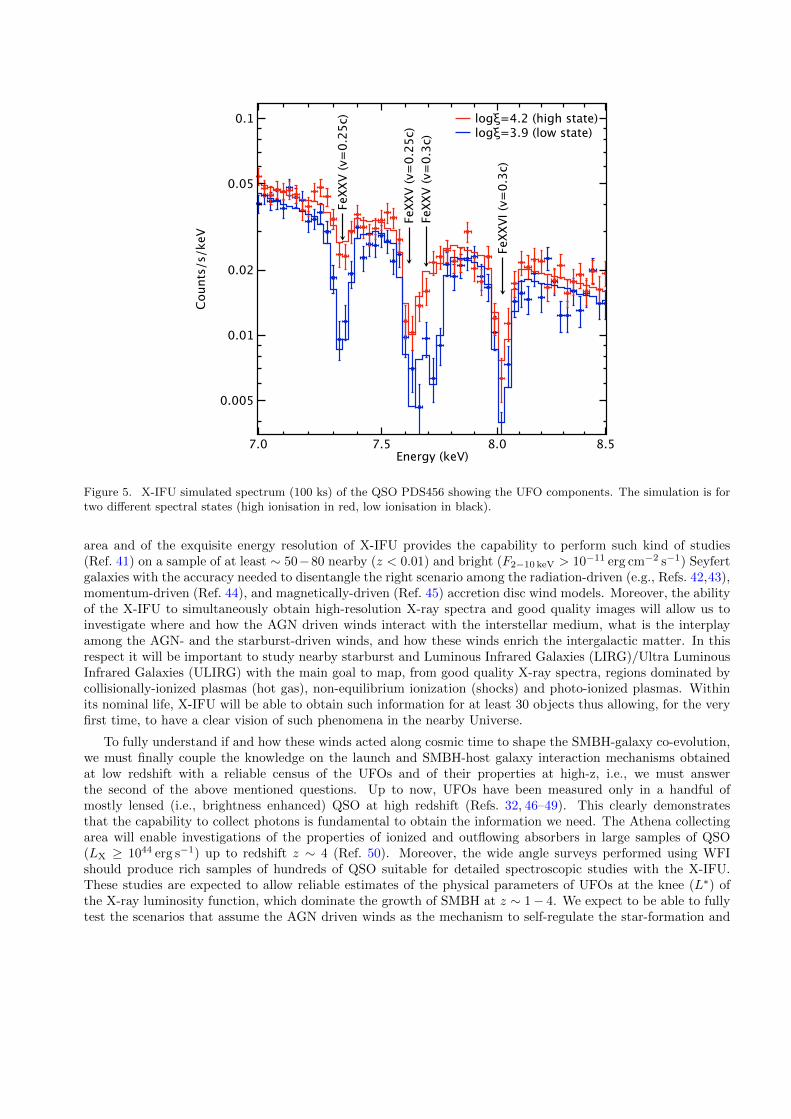
To investigate the first of the above mentioned questions, we should obtain a detailed characterization ofthe physical properties of UFOs (column density, ionization state, outflow velocity, location, geometry, coveringfactor, etc.) and check how they evolve with respect to the distance from the source, maximum outflow velocity,and X-ray or UV luminosity (see Fig. 5). We must also consider that UFOs are known to be variable (Ref. 36) andso we must be able to investigate the above mentioned properties on time-scales of ≈ 10− 100 ks (correspondingto the dynamical time-scale at 10Rg for a SMBH with M ∼ 107−8M�). The coupling of the large collecting
logξ=4.2 (high state)logξ=3.9 (low state)
FeXXV
I (v
=0
.3c)
FeXXV
(v=
0.3
c)
FeXXV
(v=
0.2
5c)
FeXXV
(v=
0.2
5c)
Counts
/s/keV
0.005
0.01
0.02
0.05
0.1
Energy (keV)7.0 7.5 8.0 8.5
Figure 5. X-IFU simulated spectrum (100 ks) of the QSO PDS456 showing the UFO components. The simulation is fortwo different spectral states (high ionisation in red, low ionisation in black).
area and of the exquisite energy resolution of X-IFU provides the capability to perform such kind of studies(Ref. 41) on a sample of at least ∼ 50−80 nearby (z < 0.01) and bright (F2−10 keV > 10−11 erg cm−2 s−1) Seyfertgalaxies with the accuracy needed to disentangle the right scenario among the radiation-driven (e.g., Refs. 42,43),momentum-driven (Ref. 44), and magnetically-driven (Ref. 45) accretion disc wind models. Moreover, the abilityof the X-IFU to simultaneously obtain high-resolution X-ray spectra and good quality images will allow us toinvestigate where and how the AGN driven winds interact with the interstellar medium, what is the interplayamong the AGN- and the starburst-driven winds, and how these winds enrich the intergalactic matter. In thisrespect it will be important to study nearby starburst and Luminous Infrared Galaxies (LIRG)/Ultra LuminousInfrared Galaxies (ULIRG) with the main goal to map, from good quality X-ray spectra, regions dominated bycollisionally-ionized plasmas (hot gas), non-equilibrium ionization (shocks) and photo-ionized plasmas. Withinits nominal life, X-IFU will be able to obtain such information for at least 30 objects thus allowing, for the veryfirst time, to have a clear vision of such phenomena in the nearby Universe.
To fully understand if and how these winds acted along cosmic time to shape the SMBH-galaxy co-evolution,we must finally couple the knowledge on the launch and SMBH-host galaxy interaction mechanisms obtainedat low redshift with a reliable census of the UFOs and of their properties at high-z, i.e., we must answerthe second of the above mentioned questions. Up to now, UFOs have been measured only in a handful ofmostly lensed (i.e., brightness enhanced) QSO at high redshift (Refs. 32, 46–49). This clearly demonstratesthat the capability to collect photons is fundamental to obtain the information we need. The Athena collectingarea will enable investigations of the properties of ionized and outflowing absorbers in large samples of QSO(LX ≥ 1044 erg s−1) up to redshift z ∼ 4 (Ref. 50). Moreover, the wide angle surveys performed using WFIshould produce rich samples of hundreds of QSO suitable for detailed spectroscopic studies with the X-IFU.These studies are expected to allow reliable estimates of the physical parameters of UFOs at the knee (L∗) ofthe X-ray luminosity function, which dominate the growth of SMBH at z ∼ 1− 4. We expect to be able to fullytest the scenarios that assume the AGN driven winds as the mechanism to self-regulate the star-formation and
SMBH growth along cosmic times.
2.2.3 SMBH spins
Thanks to its high energy resolution and sensitivity, the X-IFU will allow the measurement of SMBH spins withunprecedented accuracy in a large number of AGN even beyond the local Universe.
The angular momentum is, in addition to mass, the other fundamental parameter that characterizes astro-physical black holes and therefore a proper census of SMBH in the Universe requires the measurement of theirspins. This is also of fundamental importance in order to understand the black hole growth history (Ref. 51),particularly the relative roles of mergers and chaotic accretion, that tend to reduce the spin, versus prolongedaccretion, that generally increases it. Moreover a systematic study of SMBH spins would shed light on therelation between SMBH rotation and its outflow power in the form of relativistic jets. Since the influence ofthe spin is felt only up to a few gravitational radii, X-ray observations, probing the innermost regions of SMBHsystems, are the main tool for such measurements.
The simplest and most widely applicable way of measuring SMBH spins is via time-averaged spectral fittingof relativistically broadened Fe Kα lines (Ref. 52). The larger the spin, the closer to the horizon will be theinnermost stable circular orbit (ISCO) of a prograde accretion disk resulting in a larger broadening of the reflectedlines. Broad lines are present in at least ∼ 30 − 40% of bright nearby type 1 AGN (Refs. 53, 54) and reliableestimates of SMBH spins have already been made in about 20 AGN with this technique (e.g., Refs. 55–58). TheFe line is always accompanied by a reflection continuum in hard X-rays and, if the reflecting matter is at leastpartly ionized, also in the soft X-rays. With its large effective area over a broad energy range X-IFU will permitthe simultaneous use of the iron line and of the soft X-ray reflection continuum to measure black hole spins alsoat intermediate redshifts. As an example, the spin of a maximally rotating black hole spin in PB5062, a luminous(LX ∼ 3 × 1046 erg s−1) QSO at z = 1.77 can be recovered with a precision of 20% in a 100 ks observation.
One of the difficulties in these measurements is to disentangle the different AGN spectral components thatcome from regions at different distances from the SMBH. With its excellent energy resolution the X-IFU willeasily separate the broad lines from the narrow features, which are ubiquitous in AGN and originate from moredistant matter (Ref. 59) and this will again allow to increase drastically the sample of measured SMBH spins.
X-IFU will also be able to map the inner regions of the accretion disks in the time-energy plane. Anydeviation from axial symmetry in the disk emissivity (e.g., associated with hot spots) will lead to a characteristicvariability of the iron line (Ref. 60), with arcs being traced out on the time-energy plane (Ref. 61). Evidence ofhot spots were found in XMM-Newton data (Refs. 62,63) and they are of great diagnostic power for tracing theinner turbulent flow of the disk in the strong gravity environment. General Relativity makes specific predictionsfor the arc forms and from a fit of these features one can derive SMBH mass and spin as well as the disk viewinclination.
2.2.4 Accretion physics
Outbursts from Galactic stellar-mass black holes and neutron stars span orders of magnitude in mass accretionrate, and evolve over days, weeks, and months (Ref. 64–66). In contrast, the same dynamic range in AGN is notaccessible on human timescales. The high flux observed from Galactic sources ensures very high sensitivity inthe crucial Fe K band, wherein the most highly ionized gas –likely tied to the region closest to the black hole– isobserved. Discoveries made in the Fe K band in stellar-mass black holes help to direct and sharpen subsequentobservations of AGN. In short, Galactic compact objects represent rapidly evolving, high-flux proxies that arevital to understanding the much larger classes of Seyfert galaxies and quasars.
Theoretical studies demand that black holes must be fuelled by accretion disks wherein magnetic processesmediate the transfer of mass and angular momentum (Ref. 68–70). In addition, the angular momentum canbe transported throughout the accretion flow via the non-axisymmetric waves and shocks, related to the self-gravitating parts of disks in active galactic nuclei, or to the regions tidally excited by the companion star inblack hole binaries (Ref. 71).
For decades, one were only able to observe the effects of the fundamental disk physics (thermal spectra,jet ejection episodes), but unable to probe the underlying process that fuels black holes in Seyfert and quasar

Fe XXV Heα
Fe XXVI Hα
Fe XXV Heβ Fe XXVI Hβ
Norm
alized c
ounts
/s/keV
/cm
2
0.02
0.05
0.1
0.2
Energy (keV)6 7 8 9
Figure 6. X-IFU simulated observation lasting only 100 seconds of the Black Hole binary GRS1915+105. A disk wind, asreported in Ref. 67 has been simulated. Strong spectral features can be clearly seen in the spectrum, including FeXXVKα (6.65−6.75 keV), the resolved doublet FeXXVI Kα (6.95−7.00 keV), FeXXVI Kα shifted by 0.01c (7.00−7.05 keV),FeXXVI Kα shifted by 0.03c, FeXXV Kβ (7.65− 7.90 keV) and FeXXVI Kβ (8.20− 8.35 keV). This rich set of featureswill enable unprecedented studies of the structure of the disk winds.
accretion modes. Very new observations may now indicate that disk winds can be used to constrain the emergentmagnetic field of accretion disks (Ref. 67). This opens a long-awaited window on the fundamental physics ofdisk accretion and enables connections to numerical simulations. This is also a window on mechanical feedbackfrom black holes, since feedback modes may depend on the disk magnetic field strength and configuration (Ref.72,73).
Equipped with the X-IFU, Athena will have the power to reveal the fundamental physics that drives accretiononto black holes. The keys are spectral resolution, and sensitivity. Whereas current telescopes can only offerinitial constraints on disk physics in 100 kilo-seconds, the X-IFU will be able to constrain magnetic fields viawinds in just hundreds of seconds - the dynamical time scale of such winds. The evolution of the outflowproperties (mass outflow rate, kinetic power) and disk fields will finally be accessible on their natural time scale(see Fig. 6).
Jets may be the main agents of feedback from black holes into environments as large as galaxy clusters. Inboth stellar-mass black holes and AGN, momentary dips in the X-ray flux have been associated with relativisticjet ejection events (Ref. 74–76). These dips last 100s of seconds in stellar-mass black holes. Whereas priormissions have only been able to observe continuum variations that do not reveal velocities or accelerations, X-IFU will be able to obtain sensitive line spectra as mass is transferred from the disk into the jet, providing anew and unparalleled view of the jet launching process.
For black holes that accrete at rates more than a few per cent of the Eddington limit, the inner region of theflow will be dominated by radiation rather than gas pressure (Ref. 77). Observationally, two microquasars haveshown spectacular X-ray variability on timescales of order of 50-100 s, that confirm the limit-cycle nature of theunderlying process (Refs. 78, 79). Moreover, the observed interplay between the wind outflow launched in some
states of the sources and such ’heartbeat’ variations has shed some light on the plausible disk stabilizing force(Ref. 80). The magnetic fields, or, in general, the intrinsically stochastic nature of the turbulent dissipation mustbe an important agent here (Ref. 81). X-IFU observations of these and other targets will reveal to exquisitedetail the structure of these winds and allow a detailed study of disk wind launching mechanisms and open awindow into the study of fundamental disk physics.
A remarkable case that links the stellar BH to the SMBH of AGN is the massive BH at the center of ourown galaxy, Sgr A*. With its 4 × 10⁶ M� mass and consequently a time scale of ∼ 30 min at the ISCO, itsclean close environment due to the low accretion rate and the fact that it is relatively nearby, Sgr A* offers theopportunity to study the details of its steady accretion flow and the non-thermal flares that take place withina few Schwarzschild radii from the horizon. Even if challenging because of the confusion in the inner 5” ofthe galaxy, the X-IFU will allow to study the spectral lines of the Sgr A* accreting plasma (Ref. 82) providinginsights in the physical conditions and dynamics of the flow. X-IFU will also be able to explore in detail thevariable fluorescent spectral lines from the molecular clouds of the central zone which are reflecting radiationfrom ancient outbursts of the BH (Refs. 83,84). With its excellent spectral-imaging performances the X-IFU willobtain Molecular Cloud line diagnostics unreachable to present instruments and crucial for the reconstruction ofSgr A* light curve in the past 1000 yr, probing the link between dormant SMBH and their past active phases.
2.3 Observatory science
While focusing on the Hot and Energetic Universe, the breakthrough capabilities (e.g., excellent spectral reso-lution combined with high throughput and fast timing capabilities) of the X-IFU will enable a wealth of newscience investigations to be performed for a wide range of astrophysical sources of great interest to the broaderastronomical community. This so-called observatory science covers very different topics and we highlight hereonly a few of them. We also highlight the potential of X-IFU observations in unforeseen discoveries thanks to theAthena fast Target of Opportunity observation capability, in particular in science triggered by new GravitationalWave detectors.
2.3.1 Solar system and planetary science
Athena investigations of the solar system will answer questions still open following the pioneering work carriedout with Chandra and XMM–Newton, and will add enormously to our understanding of the interactions of thesolar wind with planetary bodies, and between space plasmas and magnetic fields. The X-IFU will determinethe species, and thus the origin (solar wind or Io’s volcanoes), of the ions responsible for Jupiter soft X-rayaurora, and will test theories of ion acceleration in the planet magnetosphere through line broadening velocitymeasurements (see Fig. 7). High sensitivity observations of X-ray fluorescence from the Galilean moons willallow surface composition measurements, and studies of the Io plasma torus will shed light on the yet unknownmechanisms energizing its X-ray emission. A search for X-ray aurorae on Saturn with the X-IFU will reach muchgreater depth than possible so far. The X-IFU will spectroscopically map Mars extended exosphere throughdiffering solar wind conditions and seasons, as well as the very extended comae of comets transiting in the Sunneighbourhood.
The X-IFU will drastically improve our knowledge of the consequences of X-ray incidence on exoplanets, acrucial element in order to understand the effects of atmospheric mass loss and, more generally, of the chemicaland physical evolution of planet atmospheres especially in the early evolutionary stages. In a few selectednearby known planetary systems hosting hot Jupiters, X-IFU will search for ingress/eclipse/egress effects duringplanetary orbits. In a wider sample of planetary systems X-IFU can confirm/improve the statistical evidence ofStar-Planet Interactions and search for those variability features that are imprints of such interactions. Athenamay also discover unexpected spectral signatures (and their orbital modulation) of planetary atmospheres dueto the host stars high energy radiation and particle emission.
2.3.2 Massive stars
The strong stellar winds of massive stars make them key players in feedback processes within galaxies, whatevertheir redshift. However, large discrepancies remain in the evaluation of the wind properties, impeding a properunderstanding of massive star evolution and feedback. X-rays form inside the stellar winds, so they are a

Jupiter X-IFU
SXI
SXII
CVI
Broad OVIII Ly α
Broad OVII
OVIII Ly α
OVIII Ly β
Fe XVIII
Fe XVII
Fe and Ne
Charge exchangeSolar scattered
Norm
alized
counts
/s/A
ng
0
0.1
0.2
0.3
0.4
0.5
0.6
Wavelength (Ang)10 20 30 40
Figure 7. Simulated Jupiter’s spectrum for a 20 kilo-seconds Athena X-IFU observation, showing clearly the emissionlines produced by charge exchange between solar wind particles and Jupiter’s atmosphere.
sensitive probe of their physical properties. Time resolved high-resolution spectroscopy, collected by X-IFU,will thus provide major breakthroughs in this field. In single stars, small-scale structures directly linked tothe degree of wind inhomogeneity will be probed by examining short-term variations as well as line profileshapes in a large sample of objects, which is not within reach of current X-ray spectrometers. In addition,detailed Doppler mapping will pinpoint the properties of larger-scale structures, notably linked to magneticconfinement, pulsational activity, or co-rotating features, whose presence could just be hinted at in the bestdatasets currently at hand. In massive binary systems, where the two stellar winds collide, precise line profilestudies, in particular of the Fe-K line complex at 6.7 keV, will for the first time be performed, yielding theimmediate post-shock conditions in the wind interaction zone while Doppler tomography will directly map it.X-IFU will thus dramatically increase our understanding of the plasma physics in the most important stellarfeedback drivers.
2.3.3 Cool stars
High-energy irradiation of circumstellar disks during star formation and early stellar evolution are crucial fordisk evolution and, eventually, resulting planetary system formation (Ref. 85). The radiation associated withmagnetospheric accretion onto CTTS (Classical T Tauri Stars) and young brown Dwarfs is believed to originatein localized structures (accretion streams and hot spots). Therefore, the observed emission changes throughoutthe stellar rotation cycle and the X-IFU will probe the X-ray line emission from the heated plasma in shocksforming upon impact of the accreting matter on the stellar surface, while accompanying simultaneous opticalstudies will monitor the line emissions produced in magnetic accretion channels. The viewing geometry cruciallydetermines what we see in X-rays (cf. TW Hya Ref., 86 and V2129 Oph, Ref. 87) and the detailed mapping ofthe accretion geometry, therefore, requires simultaneous optical and X-ray monitoring for at least one rotationcycle, i.e., typically a few days. Spectro-polarimetric optical monitoring (e.g., with E-ELT/HIRES) simultaneous(e.g for at least one night) with X-IFU observations provides both time-resolved emission line fluxes tracingaccretion columns and maps of the large-scale magnetic field structure. With X-IFU for the brightest (FX ∼

3 × 10⁻¹³ erg cm−2 s−1) CTTSs high resolution time-resolved spectroscopy down to 3 kilo-seconds will allow usi) to explore the variability of the accretion process (on predicted time scales of hours) and/or the modulationdue to accretion stream shadowing, ii) to constrain with Doppler line shifts down to 100 − 400 km s−1 the bulkvelocity of accreting material, iii) to investigate from simultaneous observations of many density sensitive tripletsthe controversial issue of density stratification of accreting material, and iv) to address the open issue of theexcitation mechanism of the Fe Kα 6.4 line emitted from the circumstellar disk (Ref. 88).
Strong flares (peak LX ∼ 1032 erg s−1, peak T ∼ 2 × 10⁸ K) on young active stars and the likely associatedhuge Coronal Mass Ejection are likely a major perturbation source either of circumstellar disk evolution and/orof the early planetary system formation (Ref. 89–91). The X-IFU will allow us to investigate the initial phase ofthe intense flares including mass motions as well as their influence on circumstellar disks and/or early planetaryevolution.
Structures on the surface of late-type stars such as dark star spots or bright plages can be expected to producecorresponding signatures in the outermost atmosphere, the corona, which is traced by X-ray emission. Yet, aclear rotational modulation of the X-ray luminosity has been observed only in few cases (eg., the M star AB Dor,Ref. 92). Joint X-IFU and optical spectro-polarimetric monitoring (e.g., with E-ELT/HIRES) will yield uniqueconstraints on the magnetic field structure in active stars, by probing different temperature regimes separatelyand, consequently, different structures on the stellar surface.
2.3.4 Supernova Remnants
The X-IFU will provide the spatially-resolved spectral capabilities that have long been wished for in the study ofsupernova remnants (SNRs) (See Ref. 93 and references therein). Like clusters of galaxies, SNRs are extendedsources, ranging in angular scale from less than 0.5 arc minutes (in external galaxies) to, in extreme cases, severaldegrees in our Galaxy. X-IFU will be able to spatially resolve the spectra of SNRs with unprecedented spectralresolution. This is of great importance to obtain information on the supernova event and explosion mechanismby providing detailed abundance ratios for all elements with Z=6-28 (carbon to nickel) and new insights intothe dynamics of the explosion by mapping Doppler shifts/broadening of the ejecta in young SNRs, as well asfor understanding the physics of the hot non-equilibrium plasmas in SNRs, its evolution and impact on theinterstellar medium.
To start with the abundance patterns in SNRs, it should be noted that SNRs originate from two differenttypes of explosions: core collapse supernovae (spectroscopy classes Type II, Ib/c) and thermonuclear supernovae(Type Ia). There are still major uncertainties regarding these explosions. Core collapse supernovae are causedby the implosion of the cores of massive stars, leading to the formation of a neutron star or black hole. How theenergy liberated leads to the ejection of the outer envelope is very uncertain, issues being the roles of neutrinos,instabilities, rotation and magnetic field. Thermonuclear supernovae are caused by CO white dwarf whichexplodes if its masses approaches the Chandrasekhar limit (1.4M�). Here a main issue is the supernova progenitorsystem, whether the evolution towards this limit is caused by accretion from a normal stellar companion, or due tomerging of two white dwarfs. For both types of supernovae much can be learned from the resulting nucleosynthesisproducts. With the current instruments the more abundant even elements have been reasonably well observedin young SNRs, but it is only with the X-IFU that their 3D distribution can be mapped through line dopplershift and broadening measurements, and their spectral properties along the line of sight determined. This iscrucial information for the models of Supernova explosions. Indeed the level of asymmetry of the ejecta is closelyrelated to the explosion mechanism itself, leading to relatively symmetrical explosion for Type Ia compared tocore collapse events, and leading to different nucleosynthesis yields.
Different explosion mechanisms leave also distinct patterns in the abundance of the odd elements, like F, Na,Al, P, Sc, Ti, Cr and Mn. These rare elements reveal in core collapse how much the exposure was to intenseneutrino radiation, and for thermonuclear supernovae it will inform us about the initial pre-main sequenceabundances of the progenitor, but also deviations from nuclear statistical equilibrium reactions, which can beused to distinguish among different types of explosions. X-IFU will be able to detect these weaker lines, amongthe wealth of lines from more abundant elements and to map their spatial distribution, expected to be in differentregions of the SNR, often grouped according to the layer of the supernova in which they were synthesized.

As for the physics of SNRs, the hot plasmas in SNRs are often out of both ionisation equilibrium and thermalequilibrium, as the plasmas often did not have time enough to relax to equilibrium. Ionisation non-equilibrium inyoung SNRs results in line emission from lower ionisation species than one would expect given the temperature.Low ionisation species can also be enhanced by dust sputtering, releasing new atoms into the hot plasma frombroken up dust particles. Interestingly, some older SNRs have plasmas for which the ionisation degree is higherthan expected given the electron temperatures. This could arise by rapid adiabatic cooling of the electrons,whereas the recombination rate is too low to keep up with the cooling. With X-IFU, this can be studied indetail, for individual ions, but also as a function of location and will lead to new insights on the progenitorproperties (stellar wind, shell) and interstellar environment.
Temperature non-equilibrium means that the electron temperature can be cooler than the ion temperature.This has important consequences as the electron temperature is easier to measure, but the internal energy isdominated by the ions. With X-IFU the ion temperatures can be measured through the thermal line broadeningat the edges of some SNRs, as in the center line broadening will be dominated by different velocities from differentparts of the shell. The ion temperatures are also interesting as efficient cosmic-ray acceleration by SNRs shocksmay lead to lower ion temperatures (as the internal energy will now be divided between hot plasma and cosmicrays). On the topic of cosmic-ray acceleration, some relatively young SNRs are dominated by X-ray synchrotronradiation. This radiation itself does not need X-IFU to characterise its spectrum, however, X-IFU is importantto find signatures of thermal emission, which can be more easily picked up by high resolution spectroscopy. Thethermal emission will be used to estimate the plasma densities, which is notably needed to model the gamma-rayemission from these young SNRs
2.3.5 Discovery science through fast ToOs
Athena will have a fast Target of Opportunity (ToO) observation capability enabling observations of transientphenomena within hours of the trigger. Transients will be very much at the focus of astrophysics by the late2020s, thanks to facilities like the LSST in the optical, SKA in radio or the all-sky Gamma-ray monitors likeSVOM or others. X-IFU observations of some of these triggers will reveal critical astrophysical informationon these sources (e.g., on high-z GRBs as explained in Sec. 2.2.1), extending into the high-energy domain theobservations at longer wavelengths.
Likewise, at the end of the next decade, one may expect that gravitational wave sources will be locatedto an accuracy that will enable follow-up observations with Athena. Coalescing compact objects in binaries(involving at least a neutron star, with a stellar mass black hole or another neutron star) are expected, duringtheir runaway orbital decay due to gravitational radiation, to produce electromagnetic radiation related to theenergetic outflows generated. A relativistic jet may form and produce a short gamma-ray burst, followed by anX-ray to radio afterglow lasting from hours to days. So far no such X-ray counterpart has been found, despiteextensive searches (Ref. 94 for a review of the follow-up observations of GW150914). Likewise for high redshiftGRBs, X-IFU observations of the X-ray counterparts of compact binary gravitational wave sources would shedlight on the nature and properties of their progenitors, their energy output in electromagnetic form, as well ason the properties of their host galaxies and circumstellar environments (see Ref. 95 for a review).
3. THE X-IFU INSTRUMENT
3.1 Top level X-IFU performance specifications
To meet the scientific objectives described above (Section 2), the derived X-IFU performance requirements arelisted in Table 1. Those performance requirements can be achieved with a large format array of actively cooledX-ray absorbers thermally coupled to Transition Edge Sensors (TES) (3840 TES with a 249 µm absorber pitch)operating at ∼ 90 mK, routinely calibrated, and shielded by an active cryogenic anti-coincidence system.
3.2 Functional block diagram
The X-IFU functional block diagram is shown in Figure 8. Here we will briefly describe each component of thediagram, starting from the top left.
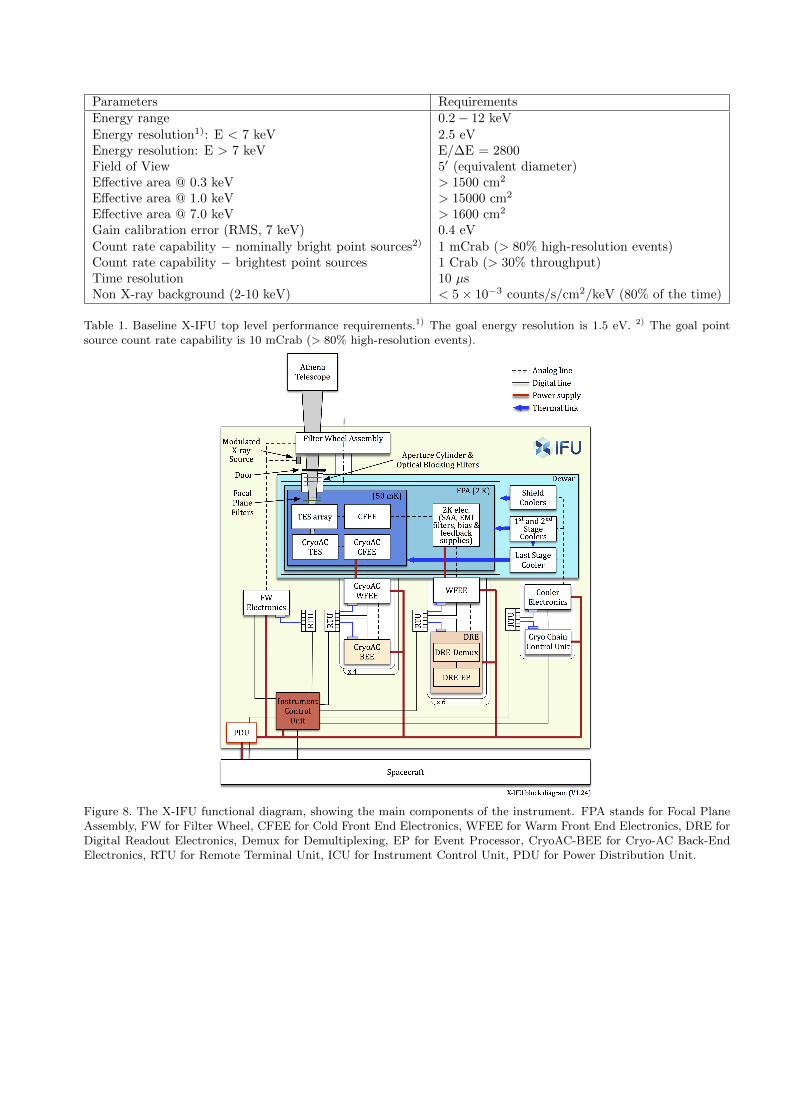
Parameters RequirementsEnergy range 0.2 − 12 keVEnergy resolution1): E < 7 keV 2.5 eVEnergy resolution: E > 7 keV E/∆E = 2800Field of View 5′ (equivalent diameter)Effective area @ 0.3 keV > 1500 cm2
Effective area @ 1.0 keV > 15000 cm2
Effective area @ 7.0 keV > 1600 cm2
Gain calibration error (RMS, 7 keV) 0.4 eVCount rate capability − nominally bright point sources2) 1 mCrab (> 80% high-resolution events)Count rate capability − brightest point sources 1 Crab (> 30% throughput)Time resolution 10 µsNon X-ray background (2-10 keV) < 5 × 10⁻³ counts/s/cm2/keV (80% of the time)
Table 1. Baseline X-IFU top level performance requirements.1) The goal energy resolution is 1.5 eV. 2) The goal pointsource count rate capability is 10 mCrab (> 80% high-resolution events).
Figure 8. The X-IFU functional diagram, showing the main components of the instrument. FPA stands for Focal PlaneAssembly, FW for Filter Wheel, CFEE for Cold Front End Electronics, WFEE for Warm Front End Electronics, DRE forDigital Readout Electronics, Demux for Demultiplexing, EP for Event Processor, CryoAC-BEE for Cryo-AC Back-EndElectronics, RTU for Remote Terminal Unit, ICU for Instrument Control Unit, PDU for Power Distribution Unit.

3.2.1 Filter wheel assembly
The filter wheel assembly and control electronics are described in Ref. 96. The filter wheel may include upto eight different filter positions, with the aim of providing: 1) Protection of the X-IFU focal plane detectorsagainst micro meteorites and contamination; 2) Reduction of the optical load from stars and solar system bodiesto limit the energy resolution degradation; 3) Possibility to optimize the throughput in case of bright X-raytargets; 4) Capability to separate the sky contributions from the intrinsic instrumental background by offeringon-off measurements with a closed position; 5) Provision of a radioactive calibration source as a backup to theModulated X-ray Sources (MXS).
3.2.2 Modulated X-ray Sources
Due to the high sensitivity of TES to their environment, changes in the energy scale throughout an observationare expected. These deviations shall be regularly corrected using on-board modulated X-ray sources (MXS)illuminating the TES array with X-rays emitted at known energies. Modulated X-ray sources similar to the onedeveloped for Hitomi SXS are baselined for X-IFU. The MXS can produce short pulses of X-rays (tens of µs)at multiple energies (e.g. 5.4 keV and 8.0 keV). Its intensity and duty factor will be tuned to give a sufficientnumber of high spectral resolution events over the typical duration of gain drifts in the electronics (10 minutes).By selection of the appropriate on and off times, the number of events per read-out channel can be tuned toreduce the effect of cross talk (see Ref. 97 for a description of the various cross-talks components expected). TheMXS will be driven by the same electronics as the filter wheel.
3.2.3 Dewar Door
The cryostat is expected to be launched in vacuum at ambient temperature and this requires a door to close itsentrance window at the interface with the aperture cylinder. Based on ASTRO-H/SXS heritage, which was ableto observe with the gate valve closed, the X-IFU Dewar door should be transparent to X-rays above a few keV.
3.2.4 Thermal filters and aperture cylinder
Thermal Filters (TF) for the X-IFU are described in Ref. 98 (see also Ref. 99 for a report on their on-going characterization). TF should maximize the soft X-ray transmission, while providing attenuation of thevisible/infrared/UV radiation from the warm surfaces seen from the TES array as to limit the radiation heatload on the cold stage and prevent the degradation of the energy resolution due to photon shot noise. Inaddition TF must also provide radio-frequency attenuation, as TES and associated readout are very sensitiveto electromagnetic perturbations. Finally TF should also protect the detector from molecular contamination,which would lead to a loss of effective area at soft energies (de-icing of the outer filter has to be considered inthe design).
The thermal filter baseline design presently implemented in the X-IFU response matrix (based on the Athenaoriginal proposal) consists of five filters for a total of 280 nm Polyimide, 210 nm Aluminum and a Polyimidemesh 10 µm thick 93% open area on the two larger filters. The metallic aluminum blocks the visible and infraredradiation mainly by reflection and the Polyimide blocks the UV radiation by absorption. Such filter design doesnot allow to fully achieve the effective area requirements at low energies (E < 1 keV) reported in Table 1 (seeSection 4.1). Section 5.3 discusses possible solutions under study to improve the low energy response.
The aperture cylinder holds the TF located at the interface of the thermal and structural shields of thecryostat.
3.2.5 The focal plane assembly (FPA)
The FPA is presented in detail in Ref. 100. The FPA includes all of the cryogenic components of the X-IFUdetector mounted on the (nominally) 2 K stage of the cryostat, including the main TES array (Ref. 101) and itscold front end electronics (CFEE) and the active cryogenic anti-coincidence TES (CryoAC TES) and its cold frontend electronics (CryoAC CFEE). The CryoAC enables to flag on the ground and remove events correspondingto background particles depositing energy in both TES arrays (see Ref. 102, 103). The TES and their SQUIDreadout electronics are sensitive to disturbances from their environment. As such, the FPA includes magneticand straylight shielding, EMC shielding and filtering to allow the TES to reach their required performance within

the expected environment of the cryostat, during both ground tests and in-flight operations. The inner two filtersof the aperture cylinder are related to the FPA. The FPA also contains a thermal suspension system to insulatethe TES, operating at a bath temperature of ∼ 50 mK, from the FPA 2 K mounting interface in the cryostat.
3.2.6 The TES array
The core of the focal plane assembly is a large-format Transition Edge Sensor (TES) microcalorimeter array. Inits baseline configuration (LPA 1 configuration in Figure 16), the TES array contains 3840 single size pixels (249µm pitch) combining a TES thermistor thermally coupled to a Au/Bi X-ray absorber, with the combination ofthermistor and absorber thermally isolated from the thermal bath of the silicon wafer frame by a thin (1 µm) SiNmembrane (see Ref. 101 for details). It has been designed to meet the instrument energy resolution, count-rate,and field-of-view requirements in a single pixel design. Operating at an assumed bath temperature of ∼ 50 mKwith a MoAu bilayer transition temperature of ∼ 90 mK, the raw pixel energy resolution for energies less than7 keV is ∼ 2.0 eV, leading to a total instrument energy resolution of 2.5 eV, once noise contributions from thereadout electronics, disturbances from the environment (FPA, cooling chain), a finite event record length, gaincalibration uncertainty are all taken into account in the spectral resolution budget of the X-IFU.
The Au/Bi absorbers form a filled-array to provide a high quantum efficiency, with the combined thicknessof the Au and Bi layers defined to produce the required stopping power for 7 keV X-rays, and the relativethicknesses of the Au and Bi layers adjusted to provide the required heat-capacity and thermal conductivity tothe TES thermistors.
3.2.7 Cold front end electronics and 2 K electronics
The main TES array is operated using frequency domain multiplexed SQUID readout electronics. SQUIDamplifiers are used to provide low-noise, low-dissipation readout of the low-impedance TES pixels. An individualSQUID amplifier chain is used to operate (nominally) 40 pixels in a frequency division multiplexed readoutscheme. In this scheme, a comb of 40 frequency carriers in the 1-5 MHz range is generated in warm electronicsand pass into the cryostat via a single twisted-pair. This comb is divided over 40 pixels by an array of 40resonant superconducting LC filters, such that each pixel is voltage biased by a single AC carrier. The bias(signal) currents of those 40 pixels are summed at the output of the LC filter chip, which is connected to theinput of a SQUID amplifier chain that combines a low-dissipation first-stage SQUID and a high output-powerSQUID amplifier array at 2 K. The 2 K electronics assembly will also combine bias dividers and filter networksfor all electric lines entering the FPA.
3.2.8 Cryo-AC and associated electronics
The CryoAC detector is a 4-pixel TES array whose physically large pixels are over-dimensioned relative to theactive area of the sensor array to intercept the majority of the primary cosmic rays passing through the sensorarray, including events at large angles of incidence (Ref. 102). The CryoAC pixels are micromachined out of asilicon wafer to produce physically large pixels with a substantial stopping power for minimum ionizing particles(MIPs), thermally isolated from their frame by thin Si support legs. The energy deposited in a CryoAC pixel isdetected by a parallel array of ∼ 100 TES thermistors patterned on one surface of the CryoAC detector. Theenergy deposition of a MIP event allows high signal-to-noise detections by means of an appropriate TES coveringof the large-area silicon absorber pixels (Ref. 102). The 4 CryoAC pixels will be read-out using 4 DC-biasedSQUID amplifiers operating at ∼ 50 mK.
3.2.9 The Dewar assembly
The Dewar assembly consists of a thermo-mechanical assembly providing support structure, thermal insulation,vacuum tight enclosure and entrance baffle to the FPA, between room temperature and FPA mounting interfacetemperature (2K). It includes external supports, outer vessel, door/valve, radiative shields, cryogenic supportsand structures, thermal hardware (thermal insulation, thermal straps) and the aperture cylinder. The Dewarassembly includes all active coolers and their control electronics as well as all cryogenic harnesses. The FPA andWFEE are also included in the Dewar assembly and must also provide EMC/EMI shielding and filtering.

2ST
2ST
300 K
2ST
2ST
15K
PT
15K
PT
4He
JT
4He
JT
3He
JT
3He
JT
2K
4K
Focal
Plane
Assembly
4K shield
Inner shield ~ 30 K
Outer shield ~ 100 K
ADR3He
Sorption
Detector cooling chain
Shield cooling chain
JAXA
coolers
Air Liquide
(ESA)
RAL
(ESA)
CEA
(CNES)
Figure 9. The reference cryogenic chain configuration for the X-IFU, split in two parts: the shield cooling chain and thedetector cooling chain. The Dewar assembly, including the full cyrogenic chain, is currently under optimization, with theobjective of consolidating its thermal and mass budgets.
3.2.10 The reference X-IFU cyrogenic chain
The X-IFU cyrogenic chain, and its potential evolution is presented in Ref. 104, based on an initial configurationderived from the Athena Concurrent Design Facility study of Athena. To satisfy the 5 year mission lifetimerequirement (10 years as a goal), the X-IFU cryogenic chain is based only on mechanical coolers. The mainassumptions used are 1) the use of a 4K stage to damp some of the parasitic losses (harnesses, straps) thatshould have reached directly the 2 K stage and to operate the subK cooler, 2) a fully redundant chain, acceptingonly the sub-K cooler as a single point of failure. As shown in Figure 9, the X-IFU cooling chain is divided intwo parts: a shield cooling chain and a detector cooling chain. Its components are 1) 2 two-stage Stirling coolersprovided by JAXA are foreseen to cool the inner and outer shields, 2) a 4 K Joule-Thomson, pre-cooled by 3two stage Stirling coolers, both provided by JAXA, 3) 2 K Joule-Thomson cooler developed by RAL, with a pre-cooling provided by a 15 K pulse Tube developed by Air Liquide, 4) and finally a hybrid Sorption He3-AdiabaticDemagnetisation Refrigerator (ADR) developed by CEA-SBT to reach the ∼ 50 mK bath temperature. Asdiscussed in Ref. 104, further optimization of the cooling chain is required (e.g. number of coolers), in particularin view of consolidating the thermal budgets, and reducing the mass budget of the whole Dewar assembly.Moving the first stage SQUIDs at ∼ 300 mK, to reduce the heat load at the ∼ 50 mK stage is an option thatwill be studied, assuming that it is demonstrated as not impacting the spectral resolution budget.
3.2.11 Warm Front End Electronics (WFEE)
The presentation of the WFEE for the X-IFU is addressed in Ref. 105. The WFEE is composed of 96 channels.Each channel biases and adjusts the offset of the 2 SQUID stages. The last SQUID stage is amplified by theLow Noise Amplifier just before the Analogue to Digital Converter (ADC) of the DRE.
3.2.12 The Digital Readout electronics (DRE)
In the CFEE the first stage SQUID needs to be linearized with a high gain feedback loop. For each readout chainthe DRE-DEMUX computes the AC signal to voltage-bias the 40 TES. It digitizes the signal amplified by theCFEE and the WFEE. Then it de-modulates the digital signal to reconstruct the data stream of each pixel andit computes the feedback signal for the first stage SQUID. The DRE implements a so-called base-band feedback(BBFB) technique to ensure that the feedback signal carriers are properly phased with the TES signal carriersat the SQUID input (accounting for delays). After de-multiplexing, the pixels data streams are transmitted tothe DRE Event Processor (DRE-EP), which includes two major functions: event triggering and pulse processing.The DRE-EP delivers the scientific data combing the arrival time and energy of each event.
The instrument requirements for a 2.5 eV energy resolution at 7 keV, operation up to 12 keV, and a pixel speedof 436 µs (given here as the electro-thermal decay constant corresponding to a critically damped time constantof 160 µs , see Ref. 101) to reach 1 mCrab point source count rates drive a large dynamic range requirementalong the full detection chain. In Frequency Domain Multiplexing, the DAC components used to generate theAC carriers and the feedback signals must produce high-amplitude signals (sum of 40 AC carriers) with very lownoise levels (minimizing the contribution to the energy resolution budget). A preliminary evaluation indicatesthat a DAC with a dynamic range of ∼ 161.5 dB per unit frequency is needed. Assuming a sampling frequencyof 20 MHz, this implies an effective number of bits of 15 (Ref. 106). A DAC with such requirements is understudy, but appears very challenging. As such, it is essential to optimize the DAC requirements by consideringtradeoffs in the detection chain. This includes: optimizing the intrinsic dynamic range of the sensor pixels byrelaxing the pixel speed requirement; considering optimized application-specific DAC configurations, includingthe use of multiple DACs per frequency comb to optimize the dynamic range and power dissipation; locatingthe AC carriers on a frequency grid to suppress intermodulation products; and considering alternative readoutschemes using Time Domain or Code Domain Multiplexing. The implications of all these tradeoffs at systemlevel must also be considered.
3.2.13 Instrument Control Unit (ICU)
The X-IFU Instrument Control Unit is presented in Ref. 107. The ICU functions include the telecommand &telemetry( TC/TM) management with the spacecraft, science data formatting and transmission to the spacecraftmass memory, housekeeping data handling, time distribution for synchronous operations and the managementof the X-IFU components (i.e. Coolers, Filter Wheel, Detector Readout Electronics Event Processor, PowerDistribution Unit).
3.2.14 Remote Terminal Unit (RTUs)
To better deal with the multiple instrument interfaces, to reduce harness lengths, mass and volume by reducingthe distance between the I/O boards and the units, to decrease connections and connectors, Remote TerminalUnits (RTUs) are proposed. A RTU is a flexible, miniaturized interface and control unit with support for variousprotocols and analogue/digital input and output control interface. TC/TM and thermal regulation functions areintegrated in the RTUs.
3.3 The X-IFU mechanical design
The X-IFU mechanical design as presented at the Mission Consolidation Review is shown in Figure 10. Thisdesign will evolve for two main reasons: First, since the overall mass of the X-IFU exceeds the mass allocationfrom the satellite, consolidation of the X-IFU mass budget is a priority. This will likely impact the design, mostparticularly the Dewar assembly (e.g. number of shields, cryostat compactness, number of coolers . . . ), and thedigital electronics as being the two largest contributors to the mass budget. Second, the X-IFU accommodationwill have to be optimized as being the driving component of the Athena focal plane module, hosting the twoinstruments. This will likely result in a less compact and integrated design of the instrument, with electronicsboxes more distributed around the two instruments. Nevertheless, Figure 10 provides a good view on the X-IFUsystem complexity and size. In terms of mass and power budgets, at the MCR, the X-IFU weighted 860 kg(margins included) and required up to ∼ 2.3 kW (in observation and regeneration mode).

Figure 10. The X-IFU mechanical design presented at the Mission Consolidation Review (May 2016, mid-Phase A). Thisaccommodation does not take into account any potential optimization of the placement of the different electronic boxeson the focal plane module.
4. X-IFU CURRENT PERFORMANCE
In this section, we will present the anticipated scientific performance of the X-IFU, based on current design andknowledge. In table 2, we list the various sub-system/components presented in Figure 8 that are involved in themain performance parameters of the X-IFU.
4.1 Effective area
In the current design, the effective area of the X-IFU is shown in Figure 11, and compared to that of Hitomi/SXS.The effective area of the mirror assumed an outer mirror module radius of 1469 mm and a 2.3 mm rib spacing (theso-called as proposed configuration), and on-axis case. A blanket factor of 0.9 for contingency and manufacturingerrors in the mirror is also assumed. For the TES response, a detector with 245 µm ×245 µm absorbers and agap distance of 4 µm (249 µm pitch) are assumed corresponding to a pixel filling factor of 0.97. The absorbercomposition is 1.7 µm of Au covered by 4.2 µm of Bi. The low-energy response is determined by the aperturecylinder and focal plane filters. The current baseline filter setup for the X-IFU consists of five filters with a totalthickness of 280 nm Polyimide and 210 nm Al. For each filter, an outer layer of 10 nm is assumed to consist ofAl2O3, leaving an effective absorber thickness of 160 nm Al and 50 nm of Al2O3. Furthermore, the two largestfilters have a support mesh of 10 µm thick Polyimide with an open area fraction of 93%. As can be seen, theanticipated effective areas at energies below 1 keV are close (and actually just below) to the requirements andtherefore consolidation of the scientific requirements and/or optimization of the mirror response and/or thermal

Parameters Component or subsystemEnergy range TES array, blocking filters, filter wheelEnergy resolution: E < 7 keV TES array, blocking filters, CFEE and 2K electronics,
WFEE, DRE, cryogenic chainEnergy resolution: E > 7 keV TES array, blocking filters, CFEE and 2K electronics,
WFEE, DRE, cryogenic chainField of View TES array, FPA, aperture cylinder, blocking filters,
dewar, MXS, filter wheelDetector quantum efficiency @ 0.3, 1 keV TES array, blocking filtersDetector quantum efficiency @ 7 keV TES array, blocking filtersGain error (RMS, 7 keV) TES array, cryogenic chain, MXSCount rate capability − nominal bright sources TES array, blocking filters, CFEE and 2K electronics,
WFEE, DRECount rate capability − brightest sources TES array, blocking filters, CFEE and 2K electronics,
WFEE, DRETime resolution TES array, DRE, ICUNon X-ray background Cryo-AC, FPA, dewar
Table 2. X-IFU performance parameters and subsystem dependencies. The subsystems are presented in Figure 8.
filter properties should be pursued (see section 5.3). A multi-layer coating specifically designed to increase theeffective area of the mirror (at energies between ∼ 4− 7 keV) is currently being studied by ESA and if adopted,may be used to relax the requirements on the absorber properties (if needed).
Athena X-IFU (Large mirror)Hitomi-SXS
Requirement
Al
C
O
N
Ir
X-IF
U E
ffecti
ve a
rea (
cm
2)
101
102
103
104
Energy (keV)
1 10
Figure 11. Effective area for the X-IFU compared to the effective area of Hitomi/SXS. The requirements to be met byX-IFU are indicated by a red cross in the case of the large mirror configuration to be studied. The elements causing themain edges in the instrument response (e.g. from the mirror) are indicated with vertical blue arrows.
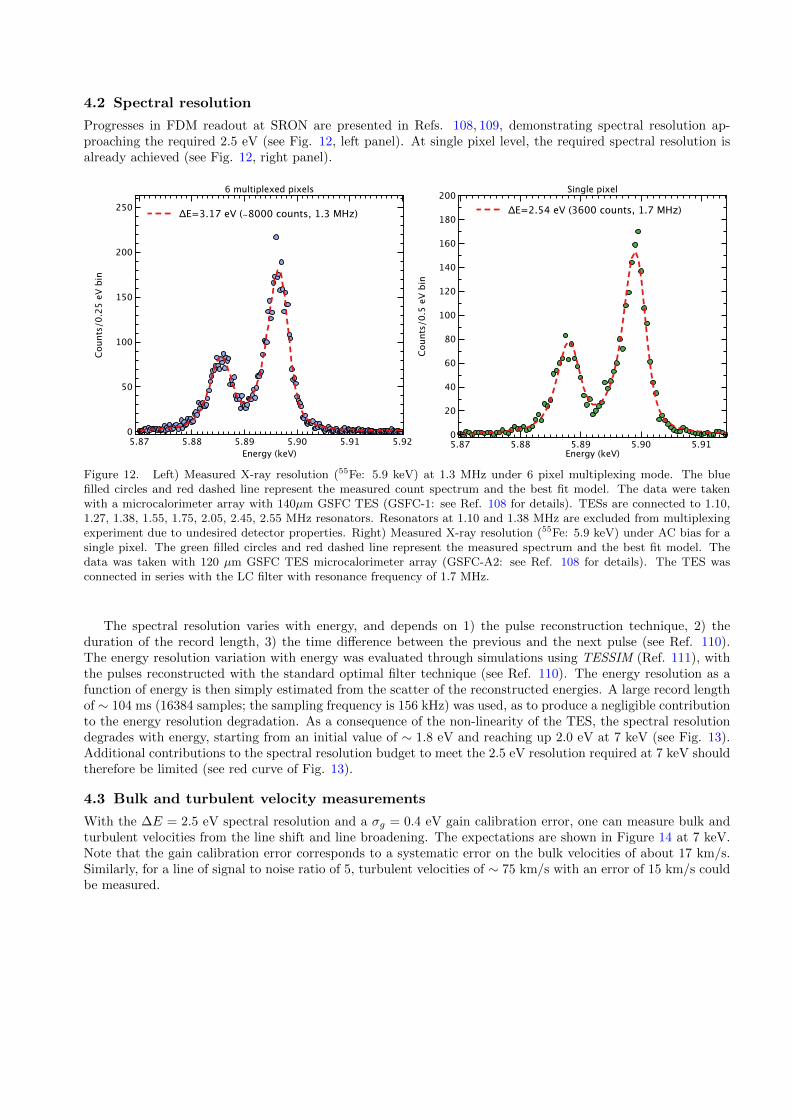
4.2 Spectral resolution
Progresses in FDM readout at SRON are presented in Refs. 108, 109, demonstrating spectral resolution ap-proaching the required 2.5 eV (see Fig. 12, left panel). At single pixel level, the required spectral resolution isalready achieved (see Fig. 12, right panel).
ΔE=3.17 eV (∼8000 counts, 1.3 MHz)
Coun
ts/0
.25
eV b
in
0
50
100
150
200
250
Energy (keV)5.87 5.88 5.89 5.90 5.91 5.92
6 multiplexed pixels
ΔE=2.54 eV (3600 counts, 1.7 MHz)
Coun
ts/0
.5 e
V bi
n0
20
40
60
80
100
120
140
160
180
200
Energy (keV)5.87 5.88 5.89 5.90 5.91
Single pixel
Figure 12. Left) Measured X-ray resolution (55Fe: 5.9 keV) at 1.3 MHz under 6 pixel multiplexing mode. The bluefilled circles and red dashed line represent the measured count spectrum and the best fit model. The data were takenwith a microcalorimeter array with 140µm GSFC TES (GSFC-1: see Ref. 108 for details). TESs are connected to 1.10,1.27, 1.38, 1.55, 1.75, 2.05, 2.45, 2.55 MHz resonators. Resonators at 1.10 and 1.38 MHz are excluded from multiplexingexperiment due to undesired detector properties. Right) Measured X-ray resolution (55Fe: 5.9 keV) under AC bias for asingle pixel. The green filled circles and red dashed line represent the measured spectrum and the best fit model. Thedata was taken with 120 µm GSFC TES microcalorimeter array (GSFC-A2: see Ref. 108 for details). The TES wasconnected in series with the LC filter with resonance frequency of 1.7 MHz.
The spectral resolution varies with energy, and depends on 1) the pulse reconstruction technique, 2) theduration of the record length, 3) the time difference between the previous and the next pulse (see Ref. 110).The energy resolution variation with energy was evaluated through simulations using TESSIM (Ref. 111), withthe pulses reconstructed with the standard optimal filter technique (see Ref. 110). The energy resolution as afunction of energy is then simply estimated from the scatter of the reconstructed energies. A large record lengthof ∼ 104 ms (16384 samples; the sampling frequency is 156 kHz) was used, as to produce a negligible contributionto the energy resolution degradation. As a consequence of the non-linearity of the TES, the spectral resolutiondegrades with energy, starting from an initial value of ∼ 1.8 eV and reaching up 2.0 eV at 7 keV (see Fig. 13).Additional contributions to the spectral resolution budget to meet the 2.5 eV resolution required at 7 keV shouldtherefore be limited (see red curve of Fig. 13).
4.3 Bulk and turbulent velocity measurements
With the ∆E = 2.5 eV spectral resolution and a σg = 0.4 eV gain calibration error, one can measure bulk andturbulent velocities from the line shift and line broadening. The expectations are shown in Figure 14 at 7 keV.Note that the gain calibration error corresponds to a systematic error on the bulk velocities of about 17 km/s.Similarly, for a line of signal to noise ratio of 5, turbulent velocities of ∼ 75 km/s with an error of 15 km/s couldbe measured.
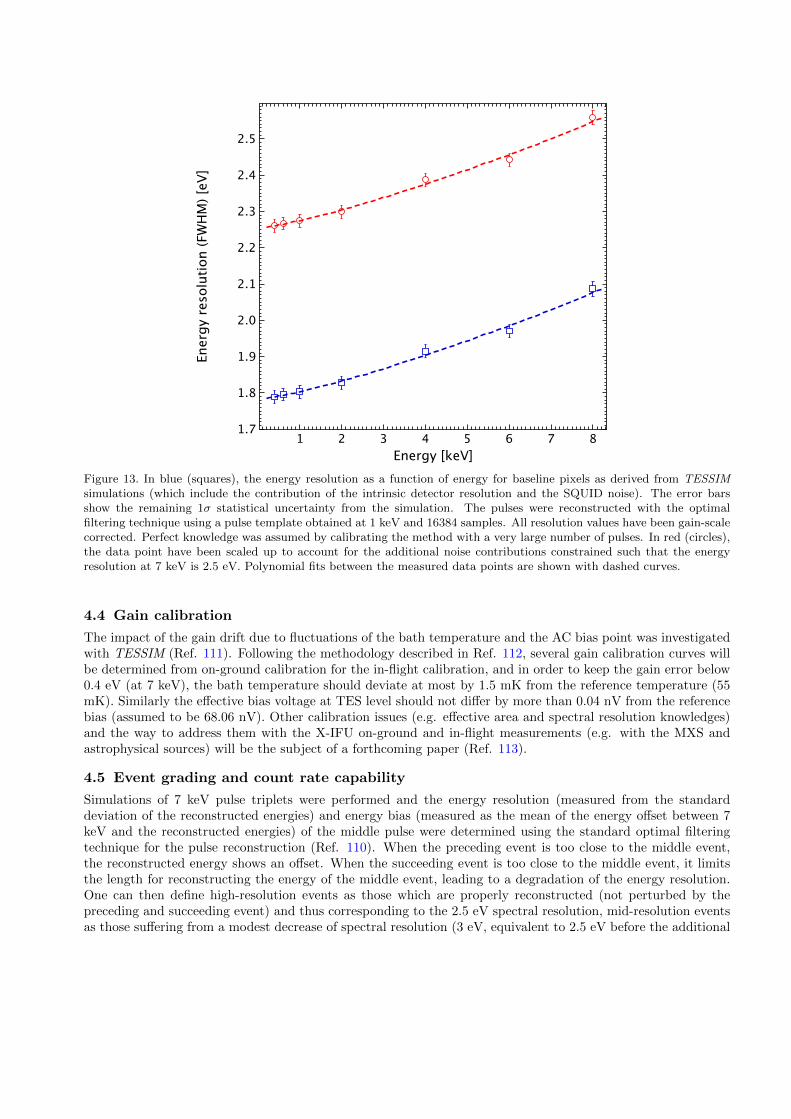
Ener
gy r
esol
utio
n (F
WH
M) [
eV]
1.7
1.8
1.9
2.0
2.1
2.2
2.3
2.4
2.5
Energy [keV]1 2 3 4 5 6 7 8
Figure 13. In blue (squares), the energy resolution as a function of energy for baseline pixels as derived from TESSIMsimulations (which include the contribution of the intrinsic detector resolution and the SQUID noise). The error barsshow the remaining 1σ statistical uncertainty from the simulation. The pulses were reconstructed with the optimalfiltering technique using a pulse template obtained at 1 keV and 16384 samples. All resolution values have been gain-scalecorrected. Perfect knowledge was assumed by calibrating the method with a very large number of pulses. In red (circles),the data point have been scaled up to account for the additional noise contributions constrained such that the energyresolution at 7 keV is 2.5 eV. Polynomial fits between the measured data points are shown with dashed curves.
4.4 Gain calibration
The impact of the gain drift due to fluctuations of the bath temperature and the AC bias point was investigatedwith TESSIM (Ref. 111). Following the methodology described in Ref. 112, several gain calibration curves willbe determined from on-ground calibration for the in-flight calibration, and in order to keep the gain error below0.4 eV (at 7 keV), the bath temperature should deviate at most by 1.5 mK from the reference temperature (55mK). Similarly the effective bias voltage at TES level should not differ by more than 0.04 nV from the referencebias (assumed to be 68.06 nV). Other calibration issues (e.g. effective area and spectral resolution knowledges)and the way to address them with the X-IFU on-ground and in-flight measurements (e.g. with the MXS andastrophysical sources) will be the subject of a forthcoming paper (Ref. 113).
4.5 Event grading and count rate capability
Simulations of 7 keV pulse triplets were performed and the energy resolution (measured from the standarddeviation of the reconstructed energies) and energy bias (measured as the mean of the energy offset between 7keV and the reconstructed energies) of the middle pulse were determined using the standard optimal filteringtechnique for the pulse reconstruction (Ref. 110). When the preceding event is too close to the middle event,the reconstructed energy shows an offset. When the succeeding event is too close to the middle event, it limitsthe length for reconstructing the energy of the middle event, leading to a degradation of the energy resolution.One can then define high-resolution events as those which are properly reconstructed (not perturbed by thepreceding and succeeding event) and thus corresponding to the 2.5 eV spectral resolution, mid-resolution eventsas those suffering from a modest decrease of spectral resolution (3 eV, equivalent to 2.5 eV before the additional
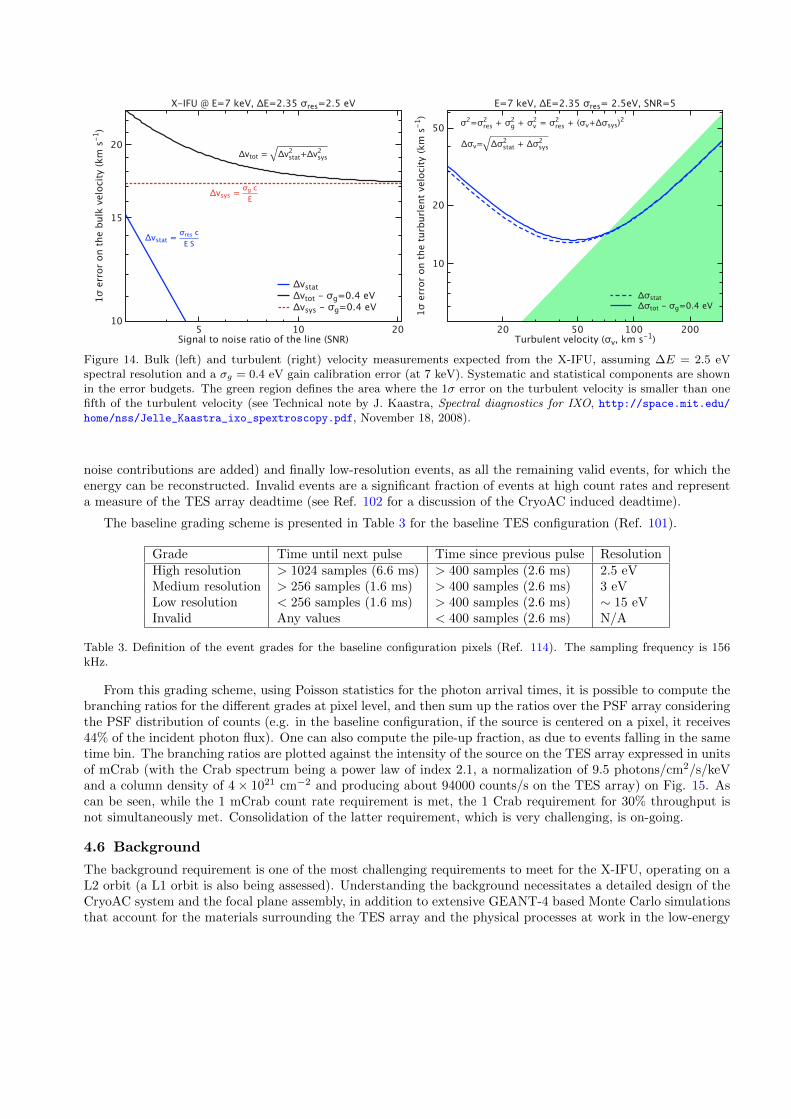
Δvstat
Δvtot - σg=0.4 eVΔvsys - σg=0.4 eV
Δvsys = σg c
E
Δvstat = σres c
E S
Δvtot = Δv2stat+Δv2
sys
1σ
err
or
on t
he b
ulk
velo
cit
y (
km
s-1)
10
15
20
Signal to noise ratio of the line (SNR)5 10 20
X-IFU @ E=7 keV, ΔE=2.35Oσres=2.5 eV
Δσstat
Δσtot - σg=0.4 eV
σ2=σ2res + σ2
g + σ2v = σ2
res + (σv+Δσsys)2
Δσv= Δσ2stat + Δσ2
sys
1σ
err
or
on t
he t
urb
url
ent
velo
cit
y (
km
s-1)
10
20
50
Turbulent velocity (σv, km s-1)20 50 100 200
E=7 keV, ΔE=2.35 σres= 2.5eV, SNR=5
Figure 14. Bulk (left) and turbulent (right) velocity measurements expected from the X-IFU, assuming ∆E = 2.5 eVspectral resolution and a σg = 0.4 eV gain calibration error (at 7 keV). Systematic and statistical components are shownin the error budgets. The green region defines the area where the 1σ error on the turbulent velocity is smaller than onefifth of the turbulent velocity (see Technical note by J. Kaastra, Spectral diagnostics for IXO, http://space.mit.edu/home/nss/Jelle_Kaastra_ixo_spextroscopy.pdf, November 18, 2008).
noise contributions are added) and finally low-resolution events, as all the remaining valid events, for which theenergy can be reconstructed. Invalid events are a significant fraction of events at high count rates and representa measure of the TES array deadtime (see Ref. 102 for a discussion of the CryoAC induced deadtime).
The baseline grading scheme is presented in Table 3 for the baseline TES configuration (Ref. 101).
Grade Time until next pulse Time since previous pulse ResolutionHigh resolution > 1024 samples (6.6 ms) > 400 samples (2.6 ms) 2.5 eVMedium resolution > 256 samples (1.6 ms) > 400 samples (2.6 ms) 3 eVLow resolution < 256 samples (1.6 ms) > 400 samples (2.6 ms) ∼ 15 eVInvalid Any values < 400 samples (2.6 ms) N/A
Table 3. Definition of the event grades for the baseline configuration pixels (Ref. 114). The sampling frequency is 156kHz.
From this grading scheme, using Poisson statistics for the photon arrival times, it is possible to compute thebranching ratios for the different grades at pixel level, and then sum up the ratios over the PSF array consideringthe PSF distribution of counts (e.g. in the baseline configuration, if the source is centered on a pixel, it receives44% of the incident photon flux). One can also compute the pile-up fraction, as due to events falling in the sametime bin. The branching ratios are plotted against the intensity of the source on the TES array expressed in unitsof mCrab (with the Crab spectrum being a power law of index 2.1, a normalization of 9.5 photons/cm2/s/keVand a column density of 4 × 1021 cm−2 and producing about 94000 counts/s on the TES array) on Fig. 15. Ascan be seen, while the 1 mCrab count rate requirement is met, the 1 Crab requirement for 30% throughput isnot simultaneously met. Consolidation of the latter requirement, which is very challenging, is on-going.
4.6 Background
The background requirement is one of the most challenging requirements to meet for the X-IFU, operating on aL2 orbit (a L1 orbit is also being assessed). Understanding the background necessitates a detailed design of theCryoAC system and the focal plane assembly, in addition to extensive GEANT-4 based Monte Carlo simulationsthat account for the materials surrounding the TES array and the physical processes at work in the low-energy

High resolutionMedium resolutionLow resolutionThroughputInvalid eventsPile-up
Requirement (1 mCrab)Bra
nchin
g r
ati
os
0.1
0.2
0.3
0.4
0.5
0.6
0.7
0.8
0.9
1.0
Intensity (mCrab)0.1 1 10 100 1000
Figure 15. The branching ratio of the different event grades for the X-IFU for the baseline configuration of the TES array.The throughput is given as the sum of all valid events. The invalid events are rejected. The pile-up fraction is also shownand starts increasing above 100 mCrab (the sampling frequency is 156 kHz). The pixel design was defined to match thecount rate requirement of 80% of high-resolution events at 1 mCrab (indicated by a red cross). The Crab spectrum isassumed to be a power law of index 2.1, a normalization of 9.5 photons/cm2/s/keV and a column density of 4 × 10²¹
cm−2. Such a spectrum produces about 94000 counts/s on the TES array.
domain of the X-IFU. It also puts requirements on the magnetic diverter screening out the protons focused by theAthena mirror and requires the focalization efficiency of the optics to be known. An update on the backgroundexpectations is provided in Ref. 103, while the overview of the CyroAC development is presented in Ref. 102 (seealso Ref. 115,116 for a discussion on the analysis of the CryoAC TES signal). As discussed in Ref. 103 the levelof uncertainty of the current estimates is about a factor of 2 to 3, thus calling for optimization and consolidationof the design of all the instrument components contributing to the background (e.g. FPA). It is anticipated thatthe fraction of the time the X-IFU observations will not be perturbed by soft protons is about 80% and this iswhen the background requirement shall be met (≤ 5×10⁻³ counts s−1 cm−2 keV−1, in the 2–10 keV range). Thenon focused charged particle background should be known at the 2% level, for the observations of low surfacebrightness sources (such as galaxy clusters). This may require ∼ 15% of blind (”out of the beam”) pixels to theX-ray sky or the use of the closed position of the filter wheel to block the focal beam for ∼ 15 % of the time.How the latter requirement can be best met clearly requires further simulations, a better understanding of theL2 environment, and considering the use of external informations provided by the WFI instrument, which willbe operated when the X-IFU is in focus. The requirement for a sensitive broad band particle monitor close tothe instrument should also be defined (e.g. energy range, Ion species,. . . ).
4.7 Observation of bright optical sources
Optical loading from bright UV and visible counterparts of X-IFU targets (massive stars, planets) would degradethe spectral resolution of the X-IFU by additional photon shot noise. Provision of two optical blocking filters(thin and thick OBF) on the filter wheel is therefore considered. The thin OBF would be made of 200 nmPolyimide + 40 nm Al and the thick one of 200 nm Polyimide + 80 nm Al. It would allow to observe hot stars

−1.0 −0.5 0.0 0.5 1.0Centimeters
−1.0
−0.5
0.0
0.5
1.0
Centimeters
LPA 1
−1.0 −0.5 0.0 0.5 1.0Centimeters
−1.0
−0.5
0.0
0.5
1.0
Centimeters
LPA 2 + SPA
Figure 16. Left) The baseline configuration of the X-IFU consisting of 3840 pixels of 249 µm pitch (Large Pixel Array,LPA 1). Right) A hybrid TES array configuration considered for the X-IFU, consisting of a Large Pixel Array (LPA 2)and a Small Pixel Array (SPA). The SPA consists of 324 pixels of 110 µm pitch (∼ 1.9′′) to cover a field of view of 34×34arc seconds. The pitch of the LPA 2 pixels has been increased to 260 µm to keep the same overall field of view. The redcircle indicates the 5’ equivalent circular field of view. Further optimization of the LPA 2 + SPA configuration is on-going(e.g. size of the SPA, gap between the SPA and LPA 2...). The LPA 2 pixels are slower than the LPA 1 pixels whoseparameters have been set to match both the spectral resolution, the count rate and field of view requirements.
fainter than mV ∼ 7.5 with no significant degradation of energy resolution, while the use of the thick OBF wouldallow to observe hot stars as bright as mV = 2. Note that the use of those two filters intercepting the focal beamwill necessarily lead to a reduction of the effective area of the X-IFU at low energies.
5. X-IFU PERFORMANCE OPTIMIZATION
Within the resource envelope allocated to the X-IFU, and without making the overall system more complex anddemanding, several areas where the performance of the instrument could be improved are being investigated,both from the scientific and technical point of views.
5.1 Count rate capability
Improving the count rate capability of the X-IFU can be achieved by the addition of a small pixel array and bydefocussing the mirror, which in both cases leads to spreading the PSF over a larger number of pixels. Improvingthe count rate capability of the X-IFU would be beneficial in several corners of the X-IFU science, includingenlarging the number GRB afterglows usable for WHIM detection and enlarging the fraction of observable X-raybinaries with a larger throughput of high resolution events.
5.1.1 Introducing a Small Pixel Array (SPA)
An alternative concept to the baseline configuration, in which two pixel geometries are combined to provide highcount-rate capability for a small central field of view (Small Pixel Array) and reduced count-rate capability overthe bulk of the array (Large Pixel Array) is thus being studied (see Figure 16). The TES pixel parameter designof the microcalorimeter array and the implementation and fabrication considerations of an optimal hybrid arrayare presented in Ref. 101. The pitch of the LPA 2 pixel has been increased to 260 µm to retain the 5 arc minutefield of view in the presence of the SPA (while keeping a similar number of readout channels). They have also

been made significantly slower (thermal conductance reduced by a factor of 2) as the count rate requirementapplying to point sources only is now set to the SPA pixels (the SPA pixels are about a factor of 2 faster thanthe LPA 1 pixels, while preserving the same spectral resolution). The event grading schemes for the SPA andLPA 2 pixel configuration are presented in Table 4. The critically damped time constant for the LPA 2 pixels is∼ 286 µs and ∼ 79 µs for the SPA pixels, compared to ∼ 160 µs for the LPA 1 pixels (see Ref. 101).
The increase in count rate capabilities moving from the baseline (LPA 1) configuration to the SPA is shownin Figure 17. As it can be seen, the SPA provides about an order of magnitude improvement in count ratecapability compared to the LPA 1 configuration. Beside relaxing the count rate requirement on the bulk of thearray (and thus making it easier to build somehow, e.g. by reducing the number of readout chains (hence theinstrument mass), and/or reducing the DAC dynamic range requirements and keeping the number of readoutchains unchanged, the addition of an SPA may also provide the opportunity to improve the spectral resolution,by considering pixel designs optimized for higher spectral resolution (lower heat capacity), while preservingadequate count rate capabilities (see 5.2).
Configuration Grade Time until next pulse Time since previous pulse ResolutionSPA High resolution > 512 samples (3.3 ms) > 190 samples (1.2 ms) 2.5 eV
Medium resolution > 128 samples (0.8 ms) > 190 samples (1.2 ms) 3 eVLow resolution < 128 samples (1.6 ms) > 190 samples (1.2 ms) ∼ 15 eVInvalid Any values < 190 samples (1.2 ms) N/A
LPA 2 High resolution > 16384 samples (105 ms) > 700 samples (4.5 ms) 2.5 eVMedium resolution > 512 samples (3.3 ms) > 700 samples (4.5 ms) 3 eVLow resolution < 512 samples (3.3 ms) > 700 samples (4.5 ms) ∼ 30 eVInvalid Any values < 700 samples (4.5 ms) N/A
Table 4. Definition of the event grades for the SPA and LPA 2 pixel configurations (Ref. 114). The sampling frequencyis 156 kHz.
5.1.2 Introducing defocussing
Another way of improving the count rate capability of the X-IFU is by using the defocussing option offered by theMovable Mirror Assembly (MMA), currently adopted as the baseline for the instrument switching mechanism.Improvement in the count rate capability of the X-IFU is shown in Figure 17. As can be seen, a defocussing of 35mm enables to improve the count rate capability by more than a factor of 10, even in the case of the slightly slowerpixels of the LPA 2 configuration compared to the LPA 1 one. Thus defocussing appears a very promising routeas it could enable the use of a single pixel design with relaxed and affordable count rate requirement. Adoptingdefocussing as the baseline now would however make the X-IFU performance dependent on a parameter externalto the instrument itself (i.e. the availability and performance of the defocussing option of the MMA). In addition,relatively large defocussing lengths are required to produce a meaningful improvement (≥ 30 mm): whether thiswill be achievable by the MMA remains to be demonstrated (maximum length is currently assumed to be 15 mm).On the other hand, the combination of a SPA and a short defocussing length (< 10 mm) would still produce avery significant improvement in count rate capability. Shorter defocussing lengths may be less constraining forthe MMA.
5.2 Spectral resolution
The spectral resolution requirement of 2.5 eV below 7 keV is achieved through a careful setting of the TESphysical parameters (Ref. 101), which defines the intrinsic spectral resolution of the TES (1.8-1.9 eV) beforeany degradations due to finite record length, readout electronics, perturbations induced by the cooling system,and so on. While optimizing the count rate performance of the X-IFU, by introducing an SPA, it may bepossible to take advantage of the small pixels to reduce their heat capacity (at equal stopping power a lower heatcapacity can be achieved by smaller pixels), and thus improve their spectral resolution (especially if the countrate capability requirements are achieved through defocussing). Approaching a 1.5 eV resolution would implythe intrinsic spectral resolution of the TES to be of the order of 1 eV (provided that all the other contributors

LPA 1 (in focus)LPA 2 (15 mm out of focus)LPA 2 (35 mm out of focus)SPA (in focus)
GoalReq.
Fra
cti
on o
f hig
h r
esolu
tion e
vents
0
0,1
0,2
0,3
0,4
0,5
0,6
0,7
0,8
0,9
1,0
Intensity (mCrab)10−2 10−1 1 101 102
LPA 1 (in focus)LPA 2 (15 mm out of focus)LPA 2 (35 mm out of focus)SPA (in focus)
Thro
ughput
(Hig
h+
Mediu
m r
esolu
tion e
vents
)
0
0.1
0.2
0.3
0.4
0.5
0.6
0.7
0.8
0.9
Intensity (mCrab)10 100 1000
Figure 17. Left) High resolution event fraction as a function of the point source intensity in mCrab units (1 mCrab is 95cps/s) for different options compared to the baseline configuration (LPA 1 in focus). LPA 2 is made of slightly slowerpixels but their count rate capabilities are recovered through defocussing. Two defocussing lengths are considered: 15mm and 35 mm. For comparison, the performance of the SPA is also shown. The requirement of having 80% of high-resolution events at 1 and 10 mCrab (goal) is also marked as a vertical orange line. The goal count rate capability canbe achieved with safe margins through defocussing of the LPA 2 pixels by 35 mm. Right) Throughput of high-resolutionand mid-resolution events in the four configurations for bright source observations. This figure shows that the throughputrequirement of 30% of events at 1 Crab is exceeded only with high resolution and mid resolution events, in the case ofa strongly defocussed LPA 2. Adding the low-resolution events would make the SPA and LPA 2 defocussed at 15 mmcompliant with the 30% throughput requirement. Note that the addition of thick filter on the filter wheel (reducing theoverall source flux by up to a factor of 5) could enable 1 Crab source to be observed with a throughput larger than 50%with the use of an SPA and a defocussed LPA2. In these two figures, the ratios are normalized to the total number ofphotons hitting the absorbers and thus encode the different filling factors of the various configurations (this explains thedifferences in the low intensity part of the plots).
remain unchanged). Achieving this may however require mixing two different TES parameter settings on the samesubstrate (e.g. different absorber properties: all gold versus gold and bismuth) which may lead to fabricationissues, two different heat sinks, and possibly two dedicated readout and event processing chains. The benefitof increasing the spectral resolution, which would improve the weak line sensitivity (e.g. doubling the numberof WHIM filaments detectable in a given exposure, resolving the velocity and ionisation state of the variouscomponents of the AGN winds), lowering down the systematics, should thus be weighted against the likelyadded risk and complexity of the overall system.
It is worth mentioning that having two different pixel sizes will also have an impact on the overall in-flightcalibration, as small and large pixels will not see the same photon rate produced during the MXS pulses. Althoughthe calibration requirements are difficult to anticipate before we have a consolidated design for the TES array,the characteristics of the MXS will have to be adjusted to minimize the on-board calibration time, while ensuringthat all photons produced by the MXS are processed as high-resolution events (e.g. they must be well separatedin time and they should not suffer from cross-talk issues).
5.3 Low-energy response
The low energy effective area of the X-IFU is the convolution of the mirror effective area and the absorption ofX-rays by any material placed between the mirror and the TES array. With the filter wheel in open position,absorption takes place predominantly in the thermal/optical blocking filters of the aperture cylinder and onepossibility to improve the low-energy response (and match the 0.3 keV requirement, see Figure 11) would be

to consider removing one filter or optimizing their thicknesses. Simulations indicate that removing one of thefive filters would be acceptable in terms of heat load on the sensor array but not in terms of photon shot noise,exceeding the allocation in the spectral resolution budget. Before considering the removal of one filter, consoli-dation of the interface specifications (shield temperatures, distance between shields and TES array, required RFattenuation) is thus required. Alternatively a configuration consisting of 5 filters with a total thickness of 225nm of Polyimide (instead of 280 nm in the baseline design) and 150 nm of Aluminum (instead of 210 nm in thebaseline design) with a few filters supported by metal meshes may also be considered. The properties of themetal meshes will be defined as to provide both mechanical strength and an attenuation of RF EMI from theuplink/downlink X-band telemetry and satellite operation signals. The drawback of using metal meshes is thatthey reduce the instrument effective area across the full energy range, in proportion to the masked area (a few% per mesh). RF attenuation modeling and structural analysis are being carried out to optimize filter and meshdesigns.
Note that as a way to reduce the background due to secondary electrons a thin filter just above the TES arraymay be needed (Ref. 103). Those electrons hit the surface of the detector and bounce back releasing a smallfraction of their energy. Half of these electrons have energies above 100 keV and are therefore difficult to block.Modeling of the backscattering process in GEANT-4 is rather uncertain, but in order to produce a significanteffect on the background level (20% level), filters such of 50 nm of Au would be required, reducing dramaticallythe low-energy effective area below 1 keV. Although the feasibility of implementing such a filter above the TESarray has to be demonstrated, the benefit of the lower background should be weighted against the reduction ofthe effective area at low energies.
5.4 Pulse reconstruction
Improving the spectral resolution and count rate capability of the X-IFU may be achieved through an optimizationof the pulse reconstruction scheme. The baseline today is a method based on optimal filtering (Ref. 117). Basedon TESSIM (Ref. 111), a thorough comparison of various pulse reconstruction techniques applicable to X-IFUis presented in Ref. 110 (see also Ref. 118 for a focus on a method based on principal component analysis).All techniques considered (optimal filtering, resistance space analysis, covariance based analysis) show relativelysimilar performance, with the covariance based analysis showing the larger improvement of the energy resolutioncompared to standard optimal filtering (improvement of 0.04 eV at 7 keV). This method however requiressignificantly more demanding calibration resources than the others and this may prevent its use for the X-IFU.Resistance space analysis should then be considered as it indeed provides some performance improvement overoptimal filtering (improvement of 0.02 eV at 7 keV) at a very limited computational cost and no impact onthe calibration needs. It is also the most robust technique at high count rates (see Ref. 110 for more details).Before modifying the baseline for the pulse reconstruction technique, more work is needed to account for theenvironmental perturbations of the TES response (e.g. low frequency variations of the bath temperature orthe voltage bias) and to study in greater details the sensitivity of the reconstruction techniques with the heatcapacity of the TES and its non linearity (see Ref. 110 for a comparison of the performance of the differentreconstruction techniques for low heat capacity TES that may be envisaged for the small pixel array describedabove).
5.5 Pushing bright X-ray source observations
In the current mission configuration, the telemetry allowance would enable to observe a 1 Crab source (the filterwheel in open position) for up to ∼ 3 kilo-seconds and download the on-board processed and recorded data tothe ground. Without requiring additional instrument complexity (e.g. on-board data compression, on-boardmemory for temporary data storage), we may consider pushing the bright source capability of the X-IFU. Asdiscussed above, there are two ways of improving the count rate capability of the X-IFU, by the addition ofan SPA and through defocussing of the optics. However, this may not be enough to observe sources at higherbrightness, reaching Crab-like intensities. For this purpose, we are considering the addition of thick filters on thefilter wheel as to suppress the more numerous low-energy photons, which for the bright source science are alsoscientifically less rewarding than the photons emitted above 5 keV (around the Iron line). Using a Be filter (100µm) would reduce the overall Crab count rate by a factor of ∼ 5, removing all photons below 1 keV (observationsas long as 15 kilo-seconds could thus be feasible). Bright X-ray source science may not require the 2.5 eV spectral

LPA 1 (in focus)LPA 2 (15 mm out of focus)LPA 2 (35 mm out of focus)SPA (in focus)
Fra
cti
on o
f in
valid e
vents
0
0.1
0.2
0.3
0.4
0.5
0.6
0.7
0.8
0.9
Intensity (mCrab)10 100 1000
LPA 1 (in focus)LPA 2 (15 mm out of focus)LPA 2 (35 mm out of focus)SPA (in focus)
Pile u
p f
racti
on
10−5
10−4
10−3
10−2
10−1
Intensity (mCrab)10 100 1000
Figure 18. Left) The fraction of invalid events in the four configurations: LPA 1 in focus, LPA 2 pixels (15 mm out offocus), LPA 2 pixels (35 mm out of focus) and the SPA in focus. The fraction of invalid events traces the main TESarray deadtime. As can be seen, large defocussing length reduces strongly the fraction of invalid events, even in the caseof the slower LPA 2 pixels. Right) The pile-up fractions for the same four configurations. A value of 2% of pile-up startsproducing significant distortions in the recovered energy spectrum (indicated by a black dashed line). Pile-up in thedefocussed LPA 2 configuration is negligible, but becomes significant for the baseline LPA 1 configuration around ∼ 100mCrab.
resolution but could make use of the mid-resolution events (∼ 3 eV resolution). The throughput expected bycombining high resolution and medium resolution events is shown in Figure 17. Reducing the 1-12 keV flux ofa 1 Crab source by a factor of ∼ 5 would correspond to a throughput of more than 50% for a defocussed LPA 2(without the SPA), thus providing 10000 cps/s with a spectral resolution of better than 3 eV.
Adding a gray filter, absorbing photons at all energies (it generally consists of tiny holes) may also beconsidered. The use of a gray filter would enable to reduce the overall flux by factors as high at 100-1000, andmay be useful for keeping the observation of bright sources in the limit affordable by the on-board processingand telemetry allocation. The number of positions in the filter wheel will be subject to further optimizationconsidering mechanical and mass constraints imposed to the instrument.
When observing bright sources, two instrumental processes have to be properly evaluated: pile-up and dead-time. Pile-up induces an artificial hardening of the input spectrum (as two photons arriving in the same time binare reconstructed as one event with an energy that is the sum of the two, if no saturation occurs). Simulationsindicate that deviations start to appear in the reconstruction of the input spectrum when the pile-up fractionexceeds a few percents. Rejected secondaries or invalid events trace the instrument deadtime. Deadtime levelshould be known accurately to properly recover the flux of the observed source. Deadtime complicates alsotime series analysis by causing significant departures of power spectra from those expected from simple Poissonstatistics. In the case of the X-IFU, the deadtime is paralyzable in the sense that if an event arrives in thedeadtime interval (during which no event can be reconstructed), the deadtime interval is extended (ultimatelythe sensor would not detect any events). Paralyzable deadtime in the X-IFU can be accurately modeled follow-ing the formalism in Ref. 119. The fraction of invalid events raises sharply with count rate, and only in thecase of the LPA1 configuration, pile-up becomes significant above ∼ 200 mCrab, and is negligible in all otherconfigurations up to ∼ 1 Crab intensities. This is shown in Figure 18, which demonstrates again the potentialof the defocussing option for the LPA2, in particular by its almost negligible pile-up fractions (together with itslower deadtime).
5.6 Field of view
When considering an hybrid TES array, while keeping the same multiplexing factor and the same number ofreadout channels, increasing the pixel pitch to 300 µm (equivalent to 5.1 arc seconds) would increase the field ofview of the X-IFU to ∼ 5.8 arc minutes (equivalent diameter). 300 µm was deemed to be the maximum pixelsize able to retain the 2.5 eV spectral resolution requirement. A 5.8 arc minute diameter field of view would be34% more efficient in imaging than the smaller field of view, which translates into a 34% saving in observingtime for any observations that needs mosaicing. Similarly, the larger field of view would be 80% more effectivefor WHIM autocorrelation studies: the reason being that the autocorrelation function signal scales as the powerof 2 of the solid angle and thus as the power of 4 of the field of view diameter. Another benefit of the largerfield of view could be that it would enable a 5 arc minute ”on-sky” field of view while allowing 15% of blindpixels to monitor the background, if the use of blind pixels is the solution retained for this purpose. Confusioneffects in the larger pixel would be comparable to the LPA 1 and LPA 2 pixels. From the technical point of view,increasing the field of view would necessarily increase by geometric scaling the size of the focal plane assemblyand its mass (e.g. larger shielding), with a snow ball effect on the overall instrument mass budget (which iscurrently above allocation). In addition, in the current Mock Observing Plan, going to a 5.8 arc minute field ofview would lead to a saving of ∼ 1 Ms of observing time. The benefits of the larger field of view do not currentlyappear substantial enough to drive further the resource demands of the X-IFU, but consolidation of the abovefindings is needed before a firm decision can be taken.
5.7 ToO efficiency
The X-IFU cool time is currently baselined as 32 hours. The regeneration time is 8 hours, meaning that thecooling chain achieves a duty cycle of 80%. The Athena ToO requirement states that the X-IFU should be ableto observe for at least 50 kilo-seconds, GRBs starting within 4 hours for at least 80% of instances (for a fieldof regard of 50% of the sky): the latter defines the so-called ToO efficiency (and includes all delays due to thescience ground segment operations). Assuming a larger field of regard of 60%, the ToO efficiency required dropsfrom 80 to 67%. For any reasonable assumptions about the Athena ground segment and the ToO implementationscheme (alert reception and validation, generating and uploading commands, instrument setting...), meeting thisrequirement depends strongly on the way the X-IFU is operated (it depends less critically on the cooling chainduty cycle if restricted to plausible values below 90%). The Mock Observing Plan indicates the X-IFU willobserve for about 60% of the time (i.e. the remaining 40% will be for WFI observations). Assuming that theX-IFU performs observations during its entire cool time (32 hours), before WFI turns on to observe for 21.3 hours(to preserve the 60-40 ratio) and that regeneration takes place during the last 8 hours of the WFI observation, theToO efficiency is only about 36%, hence very far from the 67% required. This low efficiency results from the factthat a successful ToO must happen within the first 18 hours of the 53.3 hour nominal operation cycle (to have50 kilo-seconds of remaining X-IFU observation time for the ToO). To improve significantly the ToO efficiency,a very effective solution is to split the X-IFU observations, as to always reserve 14 hours (50 kilo-seconds) ofcool time for ToO observations. The X-IFU observation would then stop after 18 hours and would be followedby a WFI observation lasting 12 hours, with the cooler regenerating in the last 8 hours of the WFI observation.This compressed operational mode would raise the ToO efficiency up to 66%, thus meeting the requirement. Thetechnical implications and feasibility of this operational mode for the X-IFU need however to be assessed.
Segmenting the observations into several shorter ones would imply a larger number of slews (driving theoverall spacecraft agility), more reaction wheel off-loadings, more instrument switching actuation cycles, thusimpacting on the overall spacecraft operational availability (set at 90%). Preliminary analysis indicates that alarge slew rate of at least 3 degrees/minute would be needed to meet the operational availability requirement inthe compressed operational mode described above. Such a large slew rate may not be achievable with reactionwheels alone, but would require the addition of thrusters. For a slew rate of 1 degree/minute (achievable withreaction wheels alone), in the 18-12 hour compressed X-IFU/WFI cycle, the loss of operational availability isalready 16%, thus breaking the compliance with the 90% availability requirement (this would correspond toan increase of ∼ 70% of instrument switches compared to the non-compressed operational cycle mode). Areduced operational availability could obviously be compensated by a longer mission duration, but one shouldfirst consolidate the ToO efficiency requirement which is driven in particular by the detection of the WHIM usingGRB afterglows. This is being addressed in Ref. 120 which presents the extensive WHIM detection simulations
being carried out, considering realistic instrument set-up (spectral resolution, throughput, and cross-talk, seeRef. 97), afterglow and WHIM properties. As discussed above, recent cosmological simulations predict thatthe evolution of the WHIM with redshift is flat up to z ∼ 0.8 (Ref. 121), so that each distant GRB afterglow(at z > 0.8) may probe multiple systems along the line of sight, with several of those predicted to be easilydetectable against a not extremely bright GRB afterglow (see Figure 3). This mere fact will be folded in whenconsolidating the ToO efficiency requirement, derived from the need to detect 50 WHIM filaments with GRBafterglows.
Athena (and the X-IFU) must offer a good ToO capability, as this is a top-level requirement for the mission,both for WHIM filament detection against GRB afterglows, high-z GRB studies and discovery science (e.g.follow-up of gravitational wave signals). This translates not simply into a requirement on ToO efficiency, butalso on requirements on other mission performances (e.g. effective area) onto which virtually all Athena scienceobjectives impose requirements. Consolidation of the requirements on each individual performance parameterhas to be achieved from a global point of view taking into account overall constraints, such as mass and cost.
6. SHORT TERM PLANS AND CONCLUSIONS
X-IFU has now been studied as an integrated instrument for about 1 year. The next priorities are 1) toconsolidate the mass budget in order to make it fit within the mass constraint derived from the spacecraftstudies while preserving its scientific performance and 2) to define an optimized accommodation for the X-IFUonto the focal plane module. This is achieved through a top-down approach, starting with a critical review of thethermal, mechanical and electrical budgets, and should lead to a consolidated design along the remaining partof the phase A study. Options to improve the X-IFU performance are being studied (e.g. count rate capability,spectral resolution, low-energy response,. . . ) within the constraint of not increasing its resource demands andcomplexity. Some of these options have however, system level impacts and therefore will require more extensiveand longer analysis (e.g. the hybrid array).
In parallel to the phase A study, technology developments are also being pursued in order to increase theTechnology Readiness Level of the X-IFU, as required for the adoption of the mission. This covers the TES array,the focal plane assembly, the cold front end electronics, warm readout electronics, thermal/optical blocking filters,aperture assembly, cryo-coolers,. . . Some of those activities will converge in the development of the DetectorCooling System, a Core Technology Program (CTP) contract issued by ESA to develop and characterize a 50mK cryogenic chain with which functional testing of a TES array will be performed.
The outstanding Hitomi SXS results have demonstrated the transformational character of high-resolution X-ray spectroscopy. The X-IFU consortium, which includes all key members of the SXS team, has gained additionalmotivation for delivering to the community the most ambitious X-IFU, while recognizing plainly the challengeto be faced for building it.
7. ACKNOWLEDGMENTS
We acknowledge support from the Athena Science Study Team, the Athena Working Group Chairs, the AthenaTopical Panel Chairs and the Topical Panel members in strengthening the X-IFU top level performance re-quirements. Particular thanks go to: E. Rasia, V. Biffi, S. Borgani and K. Dolag for providing cosmologicalhydrodynamic simulations of a cluster used to produce simulation of X-IFU observation presented in Fig. 2; P.T.O’Brien for assistance with Sect. 2.2.1, A.C. Fabian and C. Pinto for providing inputs for Figure 1. We also thankthe ESA project team, and in particular Mark Ayre and Ivo Ferreira, for their work on the assessment of theToO efficiency requirement. The Italian contribution to X-IFU is supported through the ASI contract n. 2015-046-R.0. XB, MTC and BC acknowledge financial support by MINECO through grant ESP2014-53672-C3-1-P.A.R., P.O, and A.J. were supported by Polish NSC grants: 2015/17/B/ST9/03422 and 2015/18/M/ST9/00541.GR, ER, YN, and PJ acknowledges support by FNRS and Prodex (Belspo). This work was supported by theFrench Space Agency (CNES).
REFERENCES
[1] Nandra, K., Barret, D., Barcons, X., Fabian, A., den Herder, J.-W., Piro, L., Watson, M., Adami, C., Aird,J., Afonso, J. M., and et al., “The Hot and Energetic Universe: A White Paper presenting the sciencetheme motivating the Athena+ mission,” ArXiv e-prints (June 2013).
[2] Hitomi Collaboration, Aharonian, F., Akamatsu, H., Akimoto, F., Allen, S. W., Anabuki, N., Angelini,L., Arnaud, K., Audard, M., Awaki, H., Axelsson, M., Bamba, A., Bautz, M., Blandford, R., Brenneman,L., Brown, G. V., Bulbul, E., Cackett, E., Chernyakova, M., Chiao, M., Coppi, P., Costantini, E., dePlaa, J., den Herder, J.-W., Done, C., Dotani, T., Ebisawa, K., Eckart, M., Enoto, T., Ezoe, Y., Fabian,A. C., Ferrigno, C., Foster, A., Fujimoto, R., Fukazawa, Y., Furuzawa, A., Galeazzi, M., Gallo, L., Gandhi,P., Giustini, M., Goldwurm, A., Gu, L., Guainazzi, M., Haba, Y., Hagino, K., Hamaguchi, K., Harrus,I., Hatsukade, I., Hayashi, K., Hayashi, T., Hayashida, K., Hiraga, J., Hornschemeier, A., Hoshino, A.,Hughes, J., Iizuka, R., Inoue, H., Inoue, Y., Ishibashi, K., Ishida, M., Ishikawa, K., Ishisaki, Y., Itoh,M., Iyomoto, N., Kaastra, J., Kallman, T., Kamae, T., Kara, E., Kataoka, J., Katsuda, S., Katsuta,J., Kawaharada, M., Kawai, N., Kelley, R., Khangulyan, D., Kilbourne, C., King, A., Kitaguchi, T.,Kitamoto, S., Kitayama, T., Kohmura, T., Kokubun, M., Koyama, S., Koyama, K., Kretschmar, P.,Krimm, H., Kubota, A., Kunieda, H., Laurent, P., Lebrun, F., Lee, S.-H., Leutenegger, M., Limousin, O.,Loewenstein, M., Long, K. S., Lumb, D., Madejski, G., Maeda, Y., Maier, D., Makishima, K., Markevitch,M., Matsumoto, H., Matsushita, K., McCammon, D., McNamara, B., Mehdipour, M., Miller, E., Miller,J., Mineshige, S., Mitsuda, K., Mitsuishi, I., Miyazawa, T., Mizuno, T., Mori, H., Mori, K., Moseley,H., Mukai, K., Murakami, H., Murakami, T., Mushotzky, R., Nagino, R., Nakagawa, T., Nakajima, H.,Nakamori, T., Nakano, T., Nakashima, S., Nakazawa, K., Nobukawa, M., Noda, H., Nomachi, M., O Dell,S., Odaka, H., Ohashi, T., Ohno, M., Okajima, T., Ota, N., Ozaki, M., Paerels, F., Paltani, S., Parmar,A., Petre, R., Pinto, C., Pohl, M., Porter, F. S., Pottschmidt, K., Ramsey, B., Reynolds, C., Russell, H.,Safi-Harb, S., Saito, S., Sakai, K., Sameshima, H., Sato, G., Sato, K., Sato, R., Sawada, M., Schartel, N.,Serlemitsos, P., Seta, H., Shidatsu, M., Simionescu, A., Smith, R., Soong, Y., Stawarz, L., Sugawara, Y.,Sugita, S., Szymkowiak, A., Tajima, H., Takahashi, H., Takahashi, T., Takeda, S., Takei, Y., Tamagawa,T., Tamura, K., Tamura, T., Tanaka, T., Tanaka, Y., Tanaka, Y., Tashiro, M., Tawara, Y., Terada, Y.,Terashima, Y., Tombesi, F., Tomida, H., Tsuboi, Y., Tsujimoto, M., Tsunemi, H., Tsuru, T., Uchida, H.,Uchiyama, H., Uchiyama, Y., Ueda, S., Ueda, Y., Ueno, S., Uno, S., Urry, M., Ursino, E., de Vries, C.,Watanabe, S., Werner, N., Wik, D., Wilkins, D., Williams, B., Yamada, S., Yamaguchi, H., Yamaoka, K.,Yamasaki, N. Y., Yamauchi, M., Yamauchi, S., Yaqoob, T., Yatsu, Y., Yonetoku, D., Yoshida, A., Yuasa,T., Zhuravleva, I., and Zoghbi, A., “The quiescent intracluster medium in the core of the Perseus cluster,”Nature 535, 117–121 (July 2016).
[3] Bertschinger, E., “Simulations of Structure Formation in the Universe,” ARAA 36, 599–654 (1998).
[4] Planelles, S., Schleicher, D. R. G., and Bykov, A. M., “Large-Scale Structure Formation: From the FirstNon-linear Objects to Massive Galaxy Clusters,” Space Science Reviews 188, 93–139 (May 2015).
[5] Vogelsberger, M., Genel, S., Springel, V., Torrey, P., Sijacki, D., Xu, D., Snyder, G., Nelson, D., andHernquist, L., “Introducing the Illustris Project: simulating the coevolution of dark and visible matter inthe Universe,” Monthly Notices of the Royal Astronomical Society 444, 1518–1547 (Oct. 2014).
[6] Markevitch, M. and Vikhlinin, A., “Shocks and cold fronts in galaxy clusters,” Phys Rep 443, 1–53 (May2007).
[7] McCarthy, I. G., Bower, R. G., Balogh, M. L., Voit, G. M., Pearce, F. R., Theuns, T., Babul, A., Lacey,C. G., and Frenk, C. S., “Modelling shock heating in cluster mergers - I. Moving beyond the sphericalaccretion model,” Monthly Notices of the Royal Astronomical Society 376, 497–522 (Apr. 2007).
[8] Nagai, D., Lau, E. T., Avestruz, C., Nelson, K., and Rudd, D. H., “Predicting Merger-induced Gas Motionsin ΛCDM Galaxy Clusters,” The Astrophysical Journal 777, 137 (Nov. 2013).
[9] Lau, E. T., Nagai, D., and Nelson, K., “Weighing Galaxy Clusters with Gas. I. On the Methods ofComputing Hydrostatic Mass Bias,” The Astrophysical Journal 777, 151 (Nov. 2013).
[10] Schekochihin, A. A. and Cowley, S. C., [Turbulence and Magnetic Fields in Astrophysical Plasmas ], 85,Springer (2007).

[11] Churazov, E., Vikhlinin, A., Zhuravleva, I., Schekochihin, A., Parrish, I., Sunyaev, R., Forman, W.,Bohringer, H., and Randall, S., “X-ray surface brightness and gas density fluctuations in the Coma cluster,”Monthly Notices of the Royal Astronomical Society 421, 1123–1135 (Apr. 2012).
[12] Zhuravleva, I., Churazov, E., Schekochihin, A. A., Allen, S. W., Arevalo, P., Fabian, A. C., Forman, W. R.,Sanders, J. S., Simionescu, A., Sunyaev, R., Vikhlinin, A., and Werner, N., “Turbulent heating in galaxyclusters brightest in X-rays,” Nature 515, 85–87 (Oct. 2014).
[13] Khatri, R. and Gaspari, M., “Thermal SZ fluctuations in the ICM: probing turbulence and thermodynamicsin Coma cluster with Planck ,” ArXiv e-prints (Apr. 2016).
[14] Sanders, J. S. and Fabian, A. C., “Velocity width measurements of the coolest X-ray emitting material inthe cores of clusters, groups and elliptical galaxies,” Monthly Notices of the Royal Astronomical Society 429,2727–2738 (Mar. 2013).
[15] Pinto, C., Sanders, J. S., Werner, N., de Plaa, J., Fabian, A. C., Zhang, Y.-Y., Kaastra, J. S., Finoguenov,A., and Ahoranta, J., “Chemical Enrichment RGS cluster Sample (CHEERS): Constraints on turbulence,”Astronomy and Astrophysics 575, A38 (Mar. 2015).
[16] Mitsuda, K., Kelley, R. L., Akamatsu, H., Bialas, T., Boyce, K. R., Brown, G. V., Canavan, E., Chiao,M., Costantini, E., den Herder, J.-W., de Vries, C., DiPirro, M. J., Eckart, M. E., Ezoe, Y., Fujimoto, R.,Haas, D., Hoshino, A., Ishikawa, K., Ishisaki, Y., Iyomoto, N., Kilbourne, C. A., Kimball, M., Kitamoto,S., Konami, S., Leutenegger, M. A., McCammon, D., Miko, J., Mitsuishi, I., Murakami, H., Murakami,M., Noda, H., Ogawa, M., Ohashi, T., Okamoto, A., Ota, N., Paltani, S., Porter, F. S., Sato, K., Sato,Y., Sawada, M., Seta, H., Shinozaki, K., Shirron, P. J., Sneiderman, G. A., Sugita, H., Szymkowiak, A.,Takei, Y., Tamagawa, T., Tashiro, M. S., Terada, Y., Tsujimoto, M., Yamada, S., and Yamasaki, N. Y.,“Soft x-ray spectrometer (SXS): the high-resolution cryogenic spectrometer onboard ASTRO-H,” in [SpaceTelescopes and Instrumentation 2014: Ultraviolet to Gamma Ray ], Proc. SPIE 9144, 91442A (July 2014).
[17] Takahashi, T., Mitsuda, K., Kelley, R., Aharonian, F., Akamatsu, H., Akimoto, F., Allen, S., Anabuki,N., Angelini, L., Arnaud, K., and et al., “The ASTRO-H X-ray astronomy satellite,” in [Space Telescopesand Instrumentation 2014: Ultraviolet to Gamma Ray ], Proc. SPIE 9144, 914425 (July 2014).
[18] Molendi, S., Eckert, D., De Grandi, S., Ettori, S., Gastaldello, F., Ghizzardi, S., Pratt, G. W., andRossetti, M., “A critical assessment of the metal content of the intracluster medium,” Astronomy andAstrophysics 586, A32 (Feb. 2016).
[19] Mitchell, R. J., Culhane, J. L., Davison, P. J. N., and Ives, J. C., “Ariel 5 observations of the X-rayspectrum of the Perseus Cluster,” Monthly Notices of the Royal Astronomical Society 175, 29P–34P (May1976).
[20] Rasia, E., Borgani, S., Murante, G., Planelles, S., Beck, A. M., Biffi, V., Ragone-Figueroa, C., Granato,G. L., Steinborn, L. K., and Dolag, K., “Cool Core Clusters from Cosmological Simulations,” ApJL 813,L17 (Nov. 2015).
[21] Kirkpatrick, C. C., McNamara, B. R., and Cavagnolo, K. W., “Anisotropic Metal-enriched Outflows Drivenby Active Galactic Nuclei in Clusters of Galaxies,” The Astrophysical Journal 731, L23 (Apr. 2011).
[22] Strickland, D. K. and Stevens, I. R., “Starburst-driven galactic winds - I. Energetics and intrinsic X-rayemission,” Monthly Notices of the Royal Astronomical Society 314, 511–545 (May 2000).
[23] Schindler, S. and Diaferio, A., “Metal Enrichment Processes,” Space Sci Rev 134, 363–377 (Feb. 2008).
[24] Gal-Yam, A., Maoz, D., Guhathakurta, P., and Filippenko, A. V., “A Population of Intergalactic Super-novae in Galaxy Clusters,” AJ 125, 1087–1094 (Mar. 2003).
[25] Boehringer, H., Voges, W., Fabian, A. C., Edge, A. C., and Neumann, D. M., “A ROSAT HRI study ofthe interaction of the X-ray-emitting gas and radio lobes of NGC 1275,” Monthly Notices of the RoyalAstronomical Society 264, L25–L28 (Oct. 1993).
[26] McNamara, B. R., Nulsen, P. E. J., Wise, M. W., Rafferty, D. A., Carilli, C., Sarazin, C. L., and Blanton,E. L., “The heating of gas in a galaxy cluster by X-ray cavities and large-scale shock fronts,” Nature 433,45–47 (Jan. 2005).
[27] Cen, R. and Ostriker, J. P., “Where Are the Baryons? II. Feedback Effects,” The Astrophysical Journal 650,560–572 (Oct. 2006).
[28] Heger, A. and Woosley, S. E., “Nucleosynthesis and Evolution of Massive Metal-free Stars,” The Astro-physical Journal 724, 341–373 (Nov. 2010).
[29] Jonker, P., O’Brien, P., Amati, L., Atteia, J.-L., Campana, S., Evans, P., Fender, R., Kouveliotou, C.,Lodato, G., Osborne, J., Piro, L., Rau, A., Tanvir, N., and Willingale, R., “The Hot and EnergeticUniverse: Luminous extragalactic transients,” ArXiv e-prints (June 2013).
[30] Kormendy, J. and Richstone, D., “Inward Bound—The Search For Supermassive Black Holes In GalacticNuclei,” ARAA 33, 581 (1995).
[31] Magorrian, J., Tremaine, S., Richstone, D., Bender, R., Bower, G., Dressler, A., Faber, S. M., Gebhardt,K., Green, R., Grillmair, C., Kormendy, J., and Lauer, T., “The Demography of Massive Dark Objects inGalaxy Centers,” AJ 115, 2285–2305 (June 1998).
[32] Chartas, G., Brandt, W. N., Gallagher, S. C., and Garmire, G. P., “CHANDRA Detects Relativistic BroadAbsorption Lines from APM 08279+5255,” The Astrophysical Journal 579, 169–175 (Nov. 2002).
[33] Pounds, K. A., Reeves, J. N., King, A. R., Page, K. L., O’Brien, P. T., and Turner, M. J. L., “A high-velocity ionized outflow and XUV photosphere in the narrow emission line quasar PG1211+143,” MonthlyNotices of the Royal Astronomical Society 345, 705–713 (Nov. 2003).
[34] Tombesi, F., Cappi, M., Reeves, J. N., Palumbo, G. G. C., Yaqoob, T., Braito, V., and Dadina, M.,“Evidence for ultra-fast outflows in radio-quiet AGNs. I. Detection and statistical incidence of Fe K-shellabsorption lines,” Astronomy and Astrophysics 521, A57 (Oct. 2010).
[35] Tombesi, F., Sambruna, R. M., Reeves, J. N., Braito, V., Ballo, L., Gofford, J., Cappi, M., and Mushotzky,R. F., “Discovery of Ultra-fast Outflows in a Sample of Broad-line Radio Galaxies Observed with Suzaku,”The Astrophysical Journal 719, 700–715 (Aug. 2010).
[36] Tombesi, F., Melendez, M., Veilleux, S., Reeves, J. N., Gonzalez-Alfonso, E., and Reynolds, C. S., “Windfrom the black-hole accretion disk driving a molecular outflow in an active galaxy,” Nature 519, 436–438(Mar. 2015).
[37] King, A. and Pounds, K., “Powerful Outflows and Feedback from Active Galactic Nuclei,” ARAA 53,115–154 (Aug. 2015).
[38] Boyle, B. J., Shanks, T., and Peterson, B. A., “The evolution of optically selected QSOs. II,” MonthlyNotices of the Royal Astronomical Society 235, 935–948 (Dec. 1988).
[39] Madau, P., Ferguson, H. C., Dickinson, M. E., Giavalisco, M., Steidel, C. C., and Fruchter, A., “High-redshift galaxies in the Hubble Deep Field: colour selection and star formation history to z˜4,” MonthlyNotices of the Royal Astronomical Society 283, 1388–1404 (Dec. 1996).
[40] Brandt, W. N. and Hasinger, G., “Deep Extragalactic X-Ray Surveys,” ARAA 43, 827–859 (Sept. 2005).
[41] Cappi, M., Done, C., Behar, E., Bianchi, S., Braito, V., Costantini, E., Dadina, M., Feruglio, C., Fiore,F., Gallagher, S., Gandhi, P., Grosso, N., Kaastra, J., King, A., Lobban, A., Maiolino, R., Piconcelli, E.,Ponti, G., Porquet, D., Pounds, K., Proga, D., Ranalli, P., Reeves, J., Risaliti, G., Rodriguez Hidalgo, P.,Rovilos, E., Sim, S., Stewart, G., Tombesi, F., Tsuru, T. G., Vaughan, S., Wang, D., and Worrall, D.,“The Hot and Energetic Universe: Astrophysics of feedback in local AGN,” ArXiv e-prints (June 2013).
[42] Proga, D. and Kallman, T. R., “Dynamics of Line-driven Disk Winds in Active Galactic Nuclei. II. Effectsof Disk Radiation,” The Astrophysical Journal 616, 688–695 (Dec. 2004).
[43] Sim, S. A., Miller, L., Long, K. S., Turner, T. J., and Reeves, J. N., “Multidimensional modelling of X-rayspectra for AGN accretion disc outflows - II,” Monthly Notices of the Royal Astronomical Society 404,1369–1384 (May 2010).
[44] King, A. R., “Black hole outflows,” Monthly Notices of the Royal Astronomical Society 402, 1516–1522(Mar. 2010).
[45] Fukumura, K., Kazanas, D., Contopoulos, I., and Behar, E., “Magnetohydrodynamic Accretion Disk Windsas X-ray Absorbers in Active Galactic Nuclei,” The Astrophysical Journal 715, 636–650 (May 2010).
[46] Chartas, G., Brandt, W. N., and Gallagher, S. C., “XMM-Newton Reveals the Quasar Outflow in PG1115+080,” The Astrophysical Journal 595, 85–93 (Sept. 2003).
[47] Chartas, G., Eracleous, M., Dai, X., Agol, E., and Gallagher, S., “Discovery of Probable Relativistic FeEmission and Absorption in the Cloverleaf Quasar H 1413+117,” The Astrophysical Journal 661, 678–692(June 2007).

[48] Lanzuisi, G., Giustini, M., Cappi, M., Dadina, M., Malaguti, G., Vignali, C., and Chartas, G., “HS1700+6416: the first high-redshift unlensed narrow absorption line-QSO showing variable high-velocityoutflows,” Astronomy and Astrophysics 544, A2 (Aug. 2012).
[49] Vignali, C., Iwasawa, K., Comastri, A., Gilli, R., Lanzuisi, G., Ranalli, P., Cappelluti, N., Mainieri, V.,Georgantopoulos, I., Carrera, F. J., Fritz, J., Brusa, M., Brandt, W. N., Bauer, F. E., Fiore, F., andTombesi, F., “The XMM deep survey in the CDF-S. IX. An X-ray outflow in a luminous obscured quasarat z ≈ 1.6,” Astronomy and Astrophysics 583, A141 (Nov. 2015).
[50] Georgakakis, A., Carrera, F., Lanzuisi, G., Brightman, M., Buchner, J., Aird, J., Page, M., Cappi, M.,Afonso, J., Alonso-Herrero, A., Ballo, L., Barcons, X., Ceballos, M. T., Comastri, A., Georgantopoulos,I., Mateos, S., Nandra, K., Rosario, D., Salvato, M., Schawinski, K., Severgnini, P., and Vignali, C., “TheHot and Energetic Universe: Understanding the build-up of supermassive black holes and galaxies at theheyday of the Universe,” ArXiv e-prints (June 2013).
[51] Berti, E. and Volonteri, M., “Cosmological Black Hole Spin Evolution by Mergers and Accretion,” TheAstrophysical Journal 684, 822–828 (Sept. 2008).
[52] Fabian, A. C., Iwasawa, K., Reynolds, C. S., and Young, A. J., “Broad Iron Lines in Active GalacticNuclei,” PASP 112, 1145–1161 (Sept. 2000).
[53] Nandra, K., O’Neill, P. M., George, I. M., and Reeves, J. N., “An XMM-Newton survey of broad iron linesin Seyfert galaxies,” Monthly Notices of the Royal Astronomical Society 382, 194–228 (Nov. 2007).
[54] de La Calle Perez, I., Longinotti, A. L., Guainazzi, M., Bianchi, S., Dovciak, M., Cappi, M., Matt, G.,Miniutti, G., Petrucci, P. O., Piconcelli, E., Ponti, G., Porquet, D., and Santos-Lleo, M., “FERO: Findingextreme relativistic objects. I. Statistics of relativistic Fe Kα lines in radio-quiet Type 1 AGN,” Astronomyand Astrophysics 524, A50 (Dec. 2010).
[55] Reynolds, C. S., “Measuring Black Hole Spin Using X-Ray Reflection Spectroscopy,” Space. Sci. Rev. 183,277–294 (Sept. 2014).
[56] Brenneman, L., “Measuring Supermassive Black Hole Spins in AGN,” Acta Polytechnica 53, 652 (2013).
[57] Risaliti, G., Harrison, F. A., Madsen, K. K., Walton, D. J., Boggs, S. E., Christensen, F. E., Craig,W. W., Grefenstette, B. W., Hailey, C. J., Nardini, E., Stern, D., and Zhang, W. W., “A rapidly spinningsupermassive black hole at the centre of NGC 1365,” Nature 494, 449–451 (Feb. 2013).
[58] Walton, D. J., Nardini, E., Fabian, A. C., Gallo, L. C., and Reis, R. C., “Suzaku observations of ‘bare’active galactic nuclei,” Monthly Notices of the Royal Astronomical Society 428, 2901–2920 (Feb. 2013).
[59] Yaqoob, T. and Padmanabhan, U., “The Cores of the Fe K Lines in Seyfert 1 Galaxies Observed by theChandra High Energy Grating,” The Astrophysical Journal 604, 63–73 (Mar. 2004).
[60] Dovciak, M., Bianchi, S., Guainazzi, M., Karas, V., and Matt, G., “Relativistic spectral features fromX-ray-illuminated spots and the measure of the black hole mass in active galactic nuclei,” Monthly Noticesof the Royal Astronomical Society 350, 745–755 (May 2004).
[61] Armitage, P. J. and Reynolds, C. S., “The variability of accretion on to Schwarzschild black holes fromturbulent magnetized discs,” Monthly Notices of the Royal Astronomical Society 341, 1041–1050 (May2003).
[62] Iwasawa, K., Miniutti, G., and Fabian, A. C., “Flux and energy modulation of redshifted iron emission inNGC 3516: implications for the black hole mass,” Monthly Notices of the Royal Astronomical Society 355,1073–1079 (Dec. 2004).
[63] de Marco, B., Iwasawa, K., Cappi, M., Dadina, M., Tombesi, F., Ponti, G., Celotti, A., and Miniutti,G., “Probing variability patterns of the Fe K line complex in bright nearby AGNs,” Astronomy andAstrophysics 507, 159–169 (Nov. 2009).
[64] Remillard, R. A. and McClintock, J. E., “X-Ray Properties of Black-Hole Binaries,” ARAA 44, 49–92(Sept. 2006).
[65] Dunn, R. J. H., Fender, R. P., Kording, E. G., Belloni, T., and Cabanac, C., “A global spectral study ofblack hole X-ray binaries,” Monthly Notices of the Royal Astronomical Society 403, 61–82 (Mar. 2010).
[66] Reynolds, M. T. and Miller, J. M., “A Swift Survey of Accretion onto Stellar-mass Black Holes,” TheAstrophysical Journal 769, 16 (May 2013).

[67] Miller, J. M., Raymond, J., Fabian, A. C., Gallo, E., Kaastra, J., Kallman, T., King, A. L., Proga, D.,Reynolds, C. S., and Zoghbi, A., “The Accretion Disk Wind in the Black Hole GRS 1915+105,” ApJL 821,L9 (Apr. 2016).
[68] Shakura, N. I. and Sunyaev, R. A., “Black holes in binary systems. Observational appearance.,” Astronomyand Astrophysics 24, 337–355 (1973).
[69] Blandford, R. D. and Payne, D. G., “Hydromagnetic flows from accretion discs and the production of radiojets,” Monthly Notices of the Royal Astronomical Society 199, 883–903 (June 1982).
[70] Balbus, S. A. and Hawley, J. F., “A powerful local shear instability in weakly magnetized disks. I - Linearanalysis. II - Nonlinear evolution,” The Astrophysical Journal 376, 214–233 (July 1991).
[71] Fragile, P. C. and Blaes, O. M., “Epicyclic Motions and Standing Shocks in Numerically Simulated TiltedBlack Hole Accretion Disks,” The Astrophysical Journal 687, 757–766 (Nov. 2008).
[72] Livio, M., Pringle, J. E., and King, A. R., “The Disk-Jet Connection in Microquasars and Active GalacticNuclei,” The Astrophysical Journal 593, 184–188 (Aug. 2003).
[73] Begelman, M. C., Armitage, P. J., and Reynolds, C. S., “Accretion Disk Dynamo as the Trigger for X-RayBinary State Transitions,” The Astrophysical Journal 809, 118 (Aug. 2015).
[74] Belloni, T., Mendez, M., King, A. R., van der Klis, M., and van Paradijs, J., “A Unified Model for theSpectral Variability in GRS 1915+105,” ApJL 488, L109–L112 (Oct. 1997).
[75] Chatterjee, R., Marscher, A. P., Jorstad, S. G., Olmstead, A. R., McHardy, I. M., Aller, M. F., Aller,H. D., Lahteenmaki, A., Tornikoski, M., Hovatta, T., Marshall, K., Miller, H. R., Ryle, W. T., Chicka, B.,Benker, A. J., Bottorff, M. C., Brokofsky, D., Campbell, J. S., Chonis, T. S., Gaskell, C. M., Gaynullina,E. R., Grankin, K. N., Hedrick, C. H., Ibrahimov, M. A., Klimek, E. S., Kruse, A. K., Masatoshi, S., Miller,T. R., Pan, H.-J., Petersen, E. A., Peterson, B. W., Shen, Z., Strel’nikov, D. V., Tao, J., Watkins, A. E.,and Wheeler, K., “Disk-Jet Connection in the Radio Galaxy 3C 120,” The Astrophysical Journal 704,1689–1703 (Oct. 2009).
[76] Chatterjee, R., Marscher, A. P., Jorstad, S. G., Markowitz, A., Rivers, E., Rothschild, R. E., McHardy,I. M., Aller, M. F., Aller, H. D., Lahteenmaki, A., Tornikoski, M., Harrison, B., Agudo, I., Gomez, J. L.,Taylor, B. W., and Gurwell, M., “Connection Between the Accretion Disk and Jet in the Radio Galaxy 3C111,” The Astrophysical Journal 734, 43 (June 2011).
[77] Lightman, A. P. and Eardley, D. M., “Black Holes in Binary Systems: Instability of Disk Accretion,”ApJL 187, L1 (Jan. 1974).
[78] Belloni, T., Klein-Wolt, M., Mendez, M., van der Klis, M., and van Paradijs, J., “A model-independentanalysis of the variability of GRS 1915+105,” Astronomy and Astrophysics 355, 271–290 (Mar. 2000).
[79] Altamirano, D., Belloni, T., Linares, M., van der Klis, M., Wijnands, R., Curran, P. A., Kalamkar, M.,Stiele, H., Motta, S., Munoz-Darias, T., Casella, P., and Krimm, H., “The Faint ”Heartbeats” of IGRJ17091-3624: An Exceptional Black Hole Candidate,” ApJL 742, L17 (Dec. 2011).
[80] Janiuk, A., Grzedzielski, M., Capitanio, F., and Bianchi, S., “Interplay between heartbeat oscillations andwind outflow in microquasar IGR J17091-3624,” Astronomy and Astrophysics 574, A92 (Feb. 2015).
[81] Janiuk, A. and Misra, R., “Stabilization of radiation pressure dominated accretion disks through viscousfluctuations,” Astronomy and Astrophysics 540, A114 (Apr. 2012).
[82] Wang, Q. D., Nowak, M. A., Markoff, S. B., Baganoff, F. K., Nayakshin, S., Yuan, F., Cuadra, J., Davis,J., Dexter, J., Fabian, A. C., Grosso, N., Haggard, D., Houck, J., Ji, L., Li, Z., Neilsen, J., Porquet, D.,Ripple, F., and Shcherbakov, R. V., “Dissecting X-ray-Emitting Gas Around the Center of Our Galaxy,”Science 341, 981–983 (Aug. 2013).
[83] Ponti, G., Morris, M. R., Terrier, R., and Goldwurm, A., “Traces of Past Activity in the Galactic Centre,”in [Cosmic Rays in Star-Forming Environments ], Torres, D. F. and Reimer, O., eds., Astrophysics andSpace Science Proceedings 34, 331 (2013).
[84] Clavel, M., Terrier, R., Goldwurm, A., Morris, M. R., Ponti, G., Soldi, S., and Trap, G., “Echoes ofmultiple outbursts of Sagittarius A∗ revealed by Chandra,” Astronomy and Astrophysics 558, A32 (Oct.2013).
[85] Glassgold, A. E., Feigelson, E. D., and Montmerle, T., “Effects of Energetic Radiation in Young StellarObjects,” Protostars and Planets IV , 429 (May 2000).

[86] Brickhouse, N. S., Cranmer, S. R., Dupree, A. K., Luna, G. J. M., and Wolk, S., “A Deep Chandra X-RaySpectrum of the Accreting Young Star TW Hydrae,” The Astrophysical Journal 710, 1835–1847 (Feb.2010).
[87] Argiroffi, C., Flaccomio, E., Bouvier, J., Donati, J.-F., Getman, K. V., Gregory, S. G., Hussain, G. A. J.,Jardine, M. M., Skelly, M. B., and Walter, F. M., “Variable X-ray emission from the accretion shock inthe classical T Tauri star V2129 Ophiuchi,” Astronomy and Astrophysics 530, A1 (June 2011).
[88] Giardino, G., Favata, F., Pillitteri, I., Flaccomio, E., Micela, G., and Sciortino, S., “Results from Droxo.I. The variability of fluorescent Fe 6.4 keV emission in the young star Elias 29. High-energy electrons inthe star’s accretion tubes?,” Astronomy and Astrophysics 475, 891–900 (Dec. 2007).
[89] Osten, R. A. and Wolk, S. J., “Connecting Flares and Transient Mass-loss Events in Magnetically ActiveStars,” The Astrophysical Journal 809, 79 (Aug. 2015).
[90] Sanz-Forcada, J., Micela, G., Ribas, I., Pollock, A. M. T., Eiroa, C., Velasco, A., Solano, E., and Garcıa-Alvarez, D., “Estimation of the XUV radiation onto close planets and their evaporation,” Astronomy andAstrophysics 532, A6 (Aug. 2011).
[91] Sanz-Forcada, J., Desidera, S., and Micela, G., “Effects of X-ray and extreme UV radiation on circumbinaryplanets,” Astronomy and Astrophysics 570, A50 (Oct. 2014).
[92] Hussain, G. A. J., Brickhouse, N. S., Dupree, A. K., Jardine, M. M., van Ballegooijen, A. A., Hoogerwerf,R., Collier Cameron, A., Donati, J.-F., and Favata, F., “Inferring Coronal Structure from X-Ray LightCurves and Doppler Shifts: A Chandra Study of AB Doradus,” The Astrophysical Journal 621, 999–1008(Mar. 2005).
[93] Decourchelle, A., Costantini, E., Badenes, C., Ballet, J., Bamba, A., Bocchino, F., Kaastra, J., Kosenko,D., Lallement, R., Lee, J., Lemoine-Goumard, M., Miceli, M., Paerels, F., Petre, R., Pinto, C., Plucinsky,P., Renaud, M., Sasaki, M., Smith, R., Tatischeff, V., Tiengo, A., Valencic, L., Vink, J., Wang, D., andWilms, J., “The Hot and Energetic Universe: The astrophysics of supernova remnants and the interstellarmedium,” ArXiv e-prints (June 2013).
[94] Abbott, B. P., Abbott, R., Abbott, T. D., Abernathy, M. R., Acernese, F., Ackley, K., Adams, C., Adams,T., Addesso, P., Adhikari, R. X., and et al., “Localization and broadband follow-up of the gravitational-wave transient GW150914,” ArXiv e-prints (Feb. 2016).
[95] Berger, E., “Short-Duration Gamma-Ray Bursts,” Annual Review of Astronomy and Astrophysics 52,43–105 (Aug. 2014).
[96] Bozzo, E. and et al., “The Filter Wheel and Filters development for the X-IFU instruments on-boardAthena,” SPIE 2016, 9905-189 (June 2016) (June 2016).
[97] den Hartog, R. and et al., “The impact of crosstalk in the X-IFU instrument on Athena science cases,”SPIE 2016, These proceedings (June 2016).
[98] Barbera, M., Argan, A., Bozzo, E., Branduardi-Raymont, G., Ciaravella, A., Collura, A., Cuttaia, F., Gatti,F., Jimenez Escobar, A., Lo Cicero, U., Lotti, S., Macculi, C., Mineo, T., Nuzzo, F., Paltani, S., Parodi, G.,Piro, L., Rauw, G., Sciortino, L., Sciortino, S., and Villa, F., “Thermal Filters for the ATHENA X-IFU:Ongoing Activities Toward the Conceptual Design,” Journal of Low Temperature Physics 184, 706–711(Aug. 2016).
[99] Sciortino, L. and et al., “Surface investigation and aluminum oxide estimation on test filters for theATHENA X-IFU and WFI detectors,” SPIE 2016, These proceedings (June 2016).
[100] Jackson, B. and et al., “The focal plane assembly for the Athena X-ray Integral Field Unit instrument ,”SPIE 2016, These proceedings (June 2016).
[101] Smith, S. and et al., “TES pixel parameter design of the microcalorimeter array for the x-ray integral fieldunit on Athena,” SPIE 2016, These proceedings (June 2016).
[102] Macculi, C. and et al., “The Cryogenic AntiCoincidence Detector for ATHENA X-IFU: a programoverview,” SPIE 2016, These proceedings (June 2016).
[103] Lotti, S. and et al., “Updates on the background estimates for the X-IFU instrument onboard of theATHENA mission,” SPIE 2016, These proceedings (June 2016).
[104] Charles, I. and et al., “Preliminary thermal architecture of the X-IFU instrument,” SPIE 2016, Theseproceedings (June 2016).

[105] Prele, D. and et al., “Gain stability with no-feedback-loop developed for the X-IFU/Athena readout chain,”SPIE 2016, These proceedings (June 2016).
[106] den Hartog, R., Barret, D., Gottardi, L., den Herder, J.-W., Jackson, B., de Korte, P., van der Kuur, J.,van Leeuwen, B.-J., van Loon, D., Nieuwenhuizen, A., and Ravera, L., “Requirements for the detectorsand read-out of ATHENA X-IFU,” in [Space Telescopes and Instrumentation 2014: Ultraviolet to GammaRay ], Proceedings of the International Society for Optical Engineering 9144, 91445Q (July 2014).
[107] Corcione, L. and et al., “Conceptual design of the X-IFU instrument control unit on board the ESA Athenamission,” SPIE 2016, These proceedings (June 2016).
[108] Akamatsu, H. and et al., “Development of frequency domain multiplexing for the X-ray Integral Field Unit(X-IFU) on the Athena,” SPIE 2016, These proceedings (June 2016).
[109] Van der Kuur, J. and et al., “Optimising the multiplex factor of the frequency domain multiplexed readoutof the TES-based microcalorimeter imaging array for the X-IFU instrument on the Athena x-ray observa-tory ,” SPIE 2016, These proceedings (June 2016).
[110] Peille, P. and et al., “Performance assessment of different pulse reconstruction algorithms for the AthenaX-ray Integral Field Unit,” SPIE 2016, These proceedings (June 2016).
[111] Wilms, J. and et al., “TESSIM: A simulator for the ATHENA X-IFU,” SPIE 2016, These proceedings(June 2016).
[112] Porter, F. S., Chiao, M. P., Eckart, M. E., Fujimoto, R., Ishisaki, Y., Kelley, R. L., Kilbourne, C. A.,Leutenegger, M. A., McCammon, D., Mitsuda, K., Sawada, M., Szymkowiak, A. E., Takei, Y., Tashiro,M., Tsujimoto, M., Watanabe, T., and Yamada, S., “Temporal Gain Correction for X-ray CalorimeterSpectrometers,” Journal of Low Temperature Physics 184, 498–504 (July 2016).
[113] Cucchetti, E. and et. al., “Calibration requirements for the Athena X-ray Integral Field Unit,” ExperimentalAstronomy .
[114] Peille, P., “Developpement d’un simulateur pour le X-ray Integral Field Unit: du signal astrophysique ala performance instrumentale,” PhD Thesis, 2016 .
[115] Biasotti, M. and et al., “The new cryogenic silicon monolithic micro-bridged AntiCoincidence detector forthe X-IFU of Athena,” SPIE, 9905-187 (June 2016) (June 2016).
[116] DAndrea, M. and et al., “The Cryogenic Anti-Coincidence detector for Athena X-IFU: pulse analysis ofthe AC-S7 single pixel prototype,” SPIE, 9905-185 (June 2016) (June 2016).
[117] Szymkowiak, A. E., Kelley, R. L., Moseley, S. H., and Stahle, C. K., “Signal processing for microcalorime-ters,” Journal of Low Temperature Physics 93, 281–285 (Nov. 1993).
[118] Vries, C. and et al., “Microcalorimeter pulse analysis by means of principle component decomposition,”SPIE 2016, These proceedings (June 2016).
[119] Zhang, W., Jahoda, K., Swank, J. H., Morgan, E. H., and Giles, A. B., “Dead-Time Modifications to FastFourier Transform Power Spectra,” The Astrophysical Journal Letters 449, 930 (Aug. 1995).
[120] Brand, T. and et al., “Observing the WHIM with ATHENA,” SPIE 2016, These proceedings (June 2016).
[121] Smith, B. D., Hallman, E. J., Shull, J. M., and O’Shea, B. W., “The Nature of the Warm/Hot IntergalacticMedium. I. Numerical Methods, Convergence, and O VI Absorption,” The Astrophysical Journal 731, 6(Apr. 2011).