the asian region
TRANSCRIPT

Offering DiversityLeveraging Potential
The Asian Region
Annual Report
An
nu
al R
ep
ort
201
3
2013

WACKER at a Glance € million 2013 2012 * Change
in %
Results / ReturnSales 4,478.9 4,634.9 – 3.4EBITDA 1 678.7 795.4 – 14.7EBITDA margin 2 (%) 15.2 17.2 n. a.EBIT 3 114.3 266.6 – 57.1EBIT margin 2 (%) 2.6 5.8 n. a.
Financial result – 83.3 – 62.7 32.9Income before taxes 31.0 203.9 – 84.8Net income for the year 6.3 114.7 – 94.5
Earnings per share (basic / diluted) (€) 0.05 2.43 – 97.9ROCE (%) 2.2 5.2 n. a.
Financial Position / Cash FlowsTotal assets 6,332.4 6,492.8 – 2.5Equity 2,197.1 2,121.3 3.6Equity ratio (%) 34.7 32.7 n. a.Financial liabilities 1,416.7 1,197.2 18.3Net financial debt 4 792.2 700.5 13.1Capital expenditures (including financial assets) 503.7 1,095.4 – 54.0Depreciation (including financial assets) 564.4 528.8 6.7Net cash flow 5 109.7 – 536.2 n. a.
Research and DevelopmentResearch and development expenses 173.8 173.7 0.1
EmployeesPersonnel expenses 1,133.0 1,196.8 – 5.3Employees (December 31, number) 16,009 16,292 – 1.7
1 EBITDA is EBIT before depreciation and amortization.2 Margins are calculated based on sales.3 EBIT is the result from continuing operations for the period before interest and other financial results, and income taxes.4 Sum of cash and cash equivalents, noncurrent and current securities, and noncurrent and current financial liabilities.5 Sum of cash flow from operating activities (excluding changes in advance payments) and cash flow from long-term investing activities (before securities), including additions due to finance leases.
* Adjusted for the effects of the adoption of IAS 19 (revised); see Changes in Accounting and Valuation Methods in the Notes section.

May 5Interim Report on the 1st Quarter
Investor RelationsJoerg HoffmannHead of Investor RelationsTel. +49 89 6279-1633joerg.hoffmann @ wacker.com
July 31Interim Report on the 2nd Quarter
Media RelationsChristof BachmairTel. +49 89 6279-1830christof.bachmair @ wacker.com
May 15 Annual Shareholders’ Meeting Munich
Publisher Wacker Chemie AG Corporate Communications Hanns-Seidel-Platz 4 81737 München, Germany Tel. + 49 89 6279 - 0 Fax + 49 89 6279 -1770 www.wacker.com
October 30Interim Report on the 3rd Quarter
Overall Responsibility Jörg Hettmann Project Coordination Heide Feja Concept and Design hw.design, Munich, Germany www.hwdesign.de
Financial Calendar 2014
Contacts Imprint

Key Events in 2013
FebruaryWACKER started up a new production facility for vinyl acetate-ethylene copolymer (VAE) dispersions at its Ulsan site in South Korea. With the second reactor line’s additional 40,000 metric tons, the capacity of VAE dispersions there has increased to a total of 90,000 metric tons per year.
MarchExtension of contracts: the Supervisory Board of Wacker Chemie AG re-appointed Dr. Rudolf Staudigl as president and CEO and Auguste Willems as Executive Board member for another five years.
MarchAt the European Coatings Show (ECS) in Nuremberg, WACKER introduced innovations for the construction, packaging and adhesives industries. Presentations ranged from silicone resins and polymeric binders for exterior and interior paint and plaster applications all the way to cyclodextrins as environmentally compatible processing auxiliaries.
JulyIn Singapore, Unilever conferred its “Partner to Win Award” on WACKER in recognition of its demand- driven supply of silicone raw materials. According to the jury, WACKER helped to significantly reduce the cost of silicone emulsions for hair-care products by expanding capacities at its site in India and by developing effective solutions.
OctoberWACKER presented innovations for the silicone and plastics processing industries at K 2013, the 19th International Trade Fair for Plastics and Rubber, in Düsseldorf. Its ELASTOSIL® Film – a thin film of silicone – is a world first. It can be used, for example, in pioneering sensor technologies.
AprilWACKER started up a further production plant for vinyl acetate-ethylene copolymer (VAE) dispersions. An additional 60,000 metric tons has doubled capacity to 120,000 tons a year; the plant complex is one of the largest of its kind in China.
SeptemberWacker Chemie AG published its Sustainability Report for 2011 and 2012. Partly in the interests of environmental protection, this was the first time that the company’s report had been published exclusively as an online version. It fully meets the G3 guidelines set by the Global Reporting Initiative (GRI). GRI evaluated the report and accorded it an A, its highest reporting category.
NovemberWacker Biotech in Jena, a subsidiary of Wacker Chemie AG, acquired a BioNet Ventures GmbH production site in Halle for the manufacture of therapeutic proteins. WACKER’s acquisition covers the assets and patent portfolio of Scil Proteins Production. This acquisition strengthens the activities of WACKER BIOSOLUTIONS in the field of pharmaceutical proteins (biologics).
Jan
Feb
Mar
Apr
May
Jun
Jul
Aug
Sep
Oct
Nov
Dec

Vision
WACKER, as an innovative chemical company, makes a vital contribution to improving the quality of life around the world.
In the future, we want to continue developing and supplying solutions that meet our rigorous demands – creating added value for our customers and shareholders, and growing sustainably.
Key Financial Indicators
EBITDA Margin (%)
Return on Capital Employed ( ROCE ) (%)
0.05 2013
2.432012
7.102011
Earnings per Share (€)
15.22013
17.22012
22.52011
2.22013
5.22012
13.92011
WACKER Share Performance (€)
Jan Feb Mar Apr May Jun Jul Aug Sep Oct Nov Dec
Divisional Shares in Group Sales (%)
€ 4,478.9million
2.5 OTHER 37.3
WACKER SILICONES
16.4 SILTRONIC
18.9 WACKER POLYSILICON
3.5 WACKER BIOSOLUTIONS
21.4 WACKER POLYMERS
80
100
60
40
20
0
82.01High for the year
50.66Low for the year

Offering Diversity Leveraging Potential
The Asian Region
Annual Report
2013 2 100 Years of WACKER
10 Offering Diversity Leveraging Potential The Asian Region
For Our Shareholders
1 35 Letter to Our Shareholders
40 Executive Board
41 Report of the Supervisory Board
46 WACKER Stock in 2013
Combined Management Report of the WACKER Group and of Wacker Chemie AG
Group Business Fundamentals
2 55 Group Business Fundamentals
64 Goals and Strategies
66 Management Processes
72 Statutory Information on Takeovers
Combined Management Report
Business Report
3 75 Business Report
84 Earnings
95 Net Assets
100 Financial Position
105 Supplementary Report
106 Non-Financial Performance Indicators and Other Information
134 Management Report of Wacker Chemie AG
141 Risk Management Report
Combined Management Report
Outlook
4 165 Outlook
Consolidated Financial Statements
5 181 Statement of Income of the WACKER Group
182 Statement of Comprehensive Income of the WACKER Group
183 Statement of Financial Position of the WACKER Group
185 Statement of Cash Flows of the WACKER Group
186 Statement of Changes in Equity of the WACKER Group
187 Reconciliation of Other Equity Items
188 Segment Information by Division
190 Segment Information by Region
191 Notes of the WACKER Group
265 Supervisory Board
267 Executive Board
268 Corporate Governance Report and Declaration on Corporate Management
278 Declaration by the Executive Board on Accounting Methods and Auditing
279 Auditors’ Report
Further Information 280 Multiyear Overview
282 Chemical Glossary
284 Financial Glossary
285 List of Tables and Figures
287 Index

Milestones100 Years of WACKER
2Wacker Chemie AGAnnual Report 2013
A century ago, WACKER was registered in Traunstein, Bavaria, under the company name “Dr. Alexander Wacker, Gesellschaft für elektrochemische Industrie, KG.” The next year, in October 1915, hundreds of workers started constructing a chemical plant in Burghausen. The first railcar, festively decorated, left with its cargo of ace tone on January 19, 1917, headed for Leverkusen, 648 kilometers away.
Focused initially on the German market, WACKER evolved over the following de ca-des into an increasingly global chemical company. Today, we generate 85 percent of our sales outside of Germany. Asia is now the key market for WACKER, accoun t-ing for over 40 percent of sales.
In this annual report, we explain how we provide our Asian customers with products, how WACKER helps them with solutions that enhance their success, what paths we are taking to reinforce our presence in Asia, and what we understand by the phrase
“Think globally, act locally.”

Milestones100 Years of WACKER
3Wacker Chemie AGAnnual Report 2013
Key Events in WACKER’s 100-Year
History
1917
Start of Acetone Production
Based on the 1st WACKER process, acetone is pro duced via acetaldehyde and acetic
acid to make synthetic rubber. The first railcar carrying
15 metric tons of acetone leaves for Leverkusen.
1916Construction of the Burghausen Plant
The first facility is a factory for producing oxygen. A rail line
connecting Pirach and the WACKER plant is built. The 20 employees of the Munich-based technical office move to Karlstrasse 10.
1914Establishment of “Dr. Alexander Wacker,
Gesellschaft für elektrochemische Industrie, KG,” in Traunstein, Bavaria. In Munich,
WACKER occupies premises in Karlstrasse.

Milestones100 Years of WACKER
4Wacker Chemie AGAnnual Report 2013
1921
New Shareholder An increase in
capital stock sees “Farbwerke Hoechst”
acquiring a 50-percent stake.
1918Building the Alz Canal. “Alzwerke GmbH” is founded
as work on constructing the Alz power station begins. The Consortium moves from Nuremberg to
Zielstattstrasse 20 in Munich.
1922
The “Alzwerke” Power Station Starts Operating
Completion of the 16-km Alz Canal, still used by the Alzwerke power station to
generate electricity.
1924Product for Synthetic Fibers
First-ever production of polyvinyl acetate and polyvinyl alcohol at the Consortium based on an invention by Dr. Willy O. Herrmann. The photograph shows the Burghausen operations for the small-
scale filling of acetic acid as an end product.

Milestones100 Years of WACKER
5Wacker Chemie AGAnnual Report 2013
1930Start of VINNAPAS ® Production
Following testing at the Consortium, the first
polyvinyl acetate production plant in Burghausen
starts operating.
1928
Social BenefitsEstablishment of the Munich-
based Pension Fund for Salaried Staff (“Pensionskasse von
Angestellten der Dr. Alexander Wacker Gesellschaft für elek-
trochemische Industrie GmbH”).
1935Patent application for a suspension polymerization
process to manufacture PVC. Dr. Herbert Berg, who later became managing director, developed the
process at the Burghausen plant’s Lab X.

Milestones100 Years of WACKER
6Wacker Chemie AGAnnual Report 2013
1953
InnovationsSemiconductor-grade hyperpure
silicon produced for the first time under the direction of Dr. Eduard
Enk at the Burghausen site. The production of silicone
rubber starts here, too. Dr. Max Ivanovits develops dispersible
polymer powder.
1947Dr. Siegfried Nitzsche begins research work on
silanes and silicones. The photograph shows the first silicone cartridges containing sealants.
1957Inventive Genius
Patent application for the 2nd WACKER process concerning the cost-effective production
of acetaldehyde by direct oxidation of ethylene. The
photograph shows the inventors – Consortium chemists.
1965Expansion
Entering the US market by establishing Wacker Chemicals
Corp., New York. The aerial photograph shows the early
plant in Adrian.

Milestones100 Years of WACKER
7Wacker Chemie AGAnnual Report 2013
1968A Major Subsidiary
Establishment of Chemitronic GmbH in Burghausen.
The fully owned WACKER subsidiary is the forerunner
of Siltronic AG.
1983
Asian Markets Founding of Wacker
Chemicals East Asia Ltd., Tokyo, Japan.
A counterpart in Singapore is established
a year later.
1990Start of biotech production at the Burghausen plant.
Compounds that were previously too complex or impossible to achieve are produced in the new biotech
research center’s reactors.
1998Establishing a Site in SaxonyThe Nünchritz plant in Saxony is purchased for WACKER SILICONES.
Wacker Metroark Chemicals is founded in India.
2001New Structures
Dr. Alexander Wacker Familien GmbH acquires
the majority of votes; Hoechst AG still has a stake.

Milestones100 Years of WACKER
8Wacker Chemie AGAnnual Report 2013
2012China Headquarters
Opening of the Shanghai Center as the company’s Chinese
headquarters. From page 26
2010At Zhangjiagang, WACKER and
Dow Corning open China’s largest integrated silicone site. The facilities cover
roughly one square kilometer.
2005
Helping Others Help ThemselvesEstablishment of WACKER HILFSFONDS, a charitable
relief fund for the victims of natural disasters.
2013Expansion in China
New facilities for vinyl acetate-ethylene copolymer (VAE) dispersions and polyvinyl
acetate (PVAc) solid resins go on stream in Nanjing, China.
From page 30
2011
Groundbreaking in Tennessee
Start of construction on a fully integrated polysilicon
production site in the USA.
2006IPO in Frankfurt
2005
WACKER Becomes a Stock Corporation
The stake held by Hoechst is sold to a holding company
controlled by the Wacker family.

Milestones100 Years of WACKER
9Wacker Chemie AGAnnual Report 2013
One hundred years of WACKER:
changing times that span two world wars,
the German economic miracle, globalization
and digitization.
Going Global from Bavaria – in 100 Years

10Wacker Chemie AGAnnual Report 2013
Offering Diversity, Leveraging PotentialThe Asian Region
We are seeing the dawn of a new age, as the world’s economic axis tilts from west to east. The 21st century is the century of Asia. And Europe, too, will benefit. German innovation leaders, in particular, are finding new partners and markets in the growth centers of the Far East.
With enough confidence and hard work, you can realize any dream – at the beginning of the 21st century, this core idea of the American Dream now also encapsulates the Chinese Dream. At the easternmost tip of China’s coastline, a city is springing up that embodies this optimism and faith in the future. Just a handful of sleepy fishing villages ten years ago, Lingang New City is being built to a grand plan by the Hamburg architect Meinhard von Gerkan. This model city for 800,000 residents from the creative class will soon come to life as a venue for education and research facilities, and trade and conference centers. “Our dream is to create China’s preeminent city of the future,” says Gu Xiaoming, one of the leading officials involved in the construction of this new, planned city. From Lingang on the outskirts of Pudong district, Shanghai’s commercial center, a 32kilometer sixlane bridge leads to the deepwater harbor of Yangshan, part of the port of Shanghai, the biggest container hub in the world.
Lingang’s roads are still almost empty, as only about 60,000 people live there. A rare snapshot in the new land of unlimited possibilities: “I remember when Pudong was still just fields, and we were shown a city planning model with numerous skyscrapers, parks and other facilities,” said Mark Mobius, a fund manager specializing in emerging countries.
“It seemed like an impossible dream at the time. But now the dream has become reality here in Pudong.”
Dreams can come true in Lingang, too. Almost all the apartments that have been built have already been sold. The owners are waiting for the city to be completed, which is expected by 2020. An important step was taken in December 2013, when Lingang was connected up to the Shanghai metro. A freetrade zone had already been created in Pudong in September 2013, reminiscent of Deng Xiaoping’s special economic zones, the nuclei of the Chinese economic miracle triggered by the 1978 reforms.
Lingang symbolizes China’s two key development focuses over the last three decades – urbanization and economic boom. Both are taking place on a scale and at a pace that take your breath away. The number of city dwellers rose from 172 million in 1981 to over 700 million in 2013. In the coming decade, a further 300 million Chinese, so it is predicted, will move into cities that didn’t exist until recently. China develops a floor area the size of the whole of Germany every two years.
Since 1978, the annual per capita income has in creased thirtyfold to US$ 6,000. China overtook Germany as the world’s biggest exporter in 2009 and Japan as the second biggest economy a year later. Now, three of the ten companies generating the most revenue in the world are from China, more than from Japan or the USA. The Fortune Global 500
Asia as Growth Area

11Wacker Chemie AGAnnual Report 2013
12Wacker Chemie AGAnnual Report 2013
Offering Diversity, Leveraging PotentialThe Asian Region
list of the world’s biggest companies included 34 Chinese companies five years ago, now there are 89. According to a study by management consultancy PricewaterhouseCoopers, China will overtake the USA as the world’s leading economic power in only three years.
“China as a whole has now become a single special economic zone,” wrote the former German Chancellor Helmut Schmidt in his new book “Ein letzter Besuch – Begegnungen mit der Weltmacht China” (A Last Visit – Encounters with the World Power of China; not yet available in English). The country is now continuing the process started by Japan in the 19th century, of overtaking western countries in science and economy and in standards of living within a few decades. China is passing through evolutionary stages at breakneck pace, or skipping them altogether.
In November 2013, the Communist Party made a decision to establish more freetrade zones in order to stimulate domestic demand and give the market a “decisive” role in the Chinese economy. Though cooling off somewhat, China’s growth is becoming more sustainable, less exportdependent, more innovationled and of higher quality. For example, its major cities are already connected by 10,000 kilometers of highspeed train lines, more than in the whole of Europe. Another 10,000 kilometers are planned. China now builds its highspeed trains itself. They cover the 2,300kilometer direct route between Beijing and Guangzhou in about eight hours, at an average speed of nearly 300 km /h.
The way Chinese companies are climbing the quality ladder can be demonstrated with two wrecked cars. It is now five years since a model by the Chinese manufacturer Brilliance was smashed to pieces in the crash test – zero stars out of five. When a model by the new Qoros brand from Shanghai was tested in fall 2013, it achieved the top grade, even surpassing the VW Golf. The “Made in China” label will go the same way as “Made in Japan” and “Made in Germany” before it – developing from a warning sign to a badge of quality.
China is more and more in the “midluxury” range in terms of both its manufacturers and consumers. Since 2012, China has been the most important market for BMW, Audi, Mercedes and Porsche. The four brands sold over 959,000 new cars here – more than nine times as many as in 2005. The Chinese already buy more luxury goods than the Europeans or Americans, sometimes even purchasing the
company that makes them. Volvo from Sweden, the Italian yacht manufacturer Ferretti and the Swiss watch brands Eterna and Corum are all owned by the Chinese.
Wages and living standards are rising – and therefore manufacturing costs, too. Unable to afford high er labor costs, increasing numbers of com panies are switching to automated production. The Apple contract manufacturer Foxconn, which employs over a million people in China, intends to bring se veral hundred thousand robots on stream in the coming years. The workshop of the world is moving on – to Vietnam and Indonesia, Cambodia and Bangladesh.
The boom emanating from China has sent ripples across Asia. It will tilt the 21st century’s economic axis from west to east. Seven of the ten biggest metropolitan regions are already in Asia – there were only four in 1980. And where are the ten biggest container ports in the world? Seven are in China; one is in Singapore and one in South Korea. Where are the most innovative countries? In 2011, half of all patent applications came from Japan, South Korea and China. “We are now witnessing a historic transformation, which, though still at an early stage, is destined to change the face of the world,” wrote the British journalist Martin Jacques in his bestseller “When China Rules the World.”
This change is particularly apparent among the ten member states of the Association of Southeast Asian Nations (ASEAN). Malaysia, Singapore, Indonesia, the Philippines, Thailand, Cambodia, Laos, Vietnam, Myanmar and Brunei currently make up the fastest growing economic region in the world.
In the past six years, ASEAN’s GDP has doubled to about US$ 2,500 billion. That could be repeated in the next six years, according to economic information provider IHS.
Increasing domestic demand and growing standards of living among the middle classes in China are stimulating demand for high-quality products.

13Wacker Chemie AGAnnual Report 2013
Growth RegionAsia
The planned freetrade zones could be the turbochargers for this growth rally. ASEAN should be an integrated economic area by as early as 2015. Negotiations for another freetrade agreement are already underway between the ASEAN states and their AsiaPacific neighbors Australia, China, India, Japan, New Zealand and South Korea – an economic area of over three billion people. This development is being driven by two markets akin to giant rising suns: China and India. But they are accompanied by a constellation of stars that, though smaller, are also growing strongly.
The direction Asia is taking can already be charted: after its independence in 1965, Singapore evolved into a tiger state. Within a few decades, this developing country had shrugged off its mass unem ployment and developed into one of the wealthiest, most modern societies in the world, thanks to an economically innovative, albeit politically authoritarian brand of state capitalism and a tough crackdown on corruption. One young lady who embodies this rise is 31yearold Daphne Tang.
“My grandfather emigrated to Singapore from the southern Chinese province of Guangdong. He had nothing at all, and, in his new homeland, offered himself for hire as a construction worker.” Daphne Tang’s father became a cook in a roadside restaurant. She herself studied information science and gained a job as a senior application consultant at NCS, Singapore’s biggest IT service provider.
When independence was gained in 1965, Singapore’s gross national product was just US$ 1 billion; in 2012, it was US$ 277 billion. Singapore now has one of the highest per capita incomes in the world. No other state has such a high concentration of millionaires. There are only two casinos, but in 2012 they turned over about US$ 6 billion, more than all the casinos of Las Vegas together. The infrastructure and level of education are exemplary. In the current Times ranking of the best universities, the National University of Singapore comes 26th. The best German university, LMU Mu nich, comes 55th. Prime Minister Lee Hsien Loong announced that the port, the second biggest in the world with some 30 million metric tons of container trade per year, will be shut down in the near future. A new port over twice the size will be constructed at a different location. There are also plans to build a highspeed rail connection – 330 kilometers, 90 minutes – to the Malaysian capital of Kuala Lumpur.
The emerging Asian cities model themselves on Singapore and are trying to implement the economic
23.7Shanghai, China
21.1 Beijing, China
12.5Mumbai, India
13.1Tokyo, Japan
Millions
Mega-Cities in Asia
In the USA, only New York City has over eight million residents. Germany’s biggest city, Berlin, has only 3.5 million residents. In Asia, the most highly populated continent, there are over 23 cities with over four million residents, two of which are among the top 3 in the world (first place goes to Mexico City with 19.9 million residents).
Worldwide Investment in the Chemical Industry
According to Cefic, the European Chemical Industry Council, a good two thirds of the worldwide chemical investment, totaling US$ 374 billion, went to China and other countries in Asia, giving them a leading position. Ten years ago, only a good 40 percent of global spending on new chemical plants and capacity expansions was invested in Asia.
Rest of the world
US$ 374 billion
The Asian region

14Wacker Chemie AGAnnual Report 2013
Offering Diversity, Leveraging PotentialThe Asian Region
development measures that were so successful there. Singapore is even contributing to the deve lopment of some Chinese cities, such as the In dustrial Park in Suzhou or Knowledge City in Guangzhou, an urban planning vision for South China’s transition from workshop to knowledge society in the medium term. Malaysia, too, from which Singapore once gained its independence, is facing a leap in development toward a knowledgebased and innovationdriven economy. In the global ranking of competitiveness published by the World Economic Forum each year, it is already ahead of Ireland, Spain and Italy.
Another beacon of the new Asia is South Korea. Like Singapore, the country only made the leap to an industrial and eventually IT and innovationled economy thanks to farsighted state capitalism and iron discipline. Here, too, knowledge was seen as the most valuable raw material, and therefore education was considered the principal task of the state. Important past and present South Korean players are the chaebols – large, often familycontrolled business conglomerates with strong ties to the state, such as Samsung, LG Electronics and Hyundai, who export all around the world.
US President Barack Obama frequently cited the country as a role model for developing countries:
“When my father came to study in the United States, Kenya had a higher standard of living than South Korea.” That was in 1959. The per capita income of South Korea is now 18 times that of Kenya. South Korea is the first country to rise from a recipient of OECD development aid to become one of its donors. The country is a world market leader in cellphones and memory chips. In shipbuilding, too, and the production of LCD displays, South Korea bestrides global markets with shares of 51 percent in each case. Samsung Electronics, founded in 1969, has become the biggest electronics corporation in the world.
However, the country still isn’t resting on its laurels. A structural change can currently be observed in South Korea – if China is reinventing itself, then its neighbor must follow suit. In the automotive, electron ics and telecommunications industries, for example, Chinese manufacturers will be playing an ever more important role in the foreseeable future, backed up by a huge domestic market. South Korea’s new growth industries include biotechnology, medical engineering, nanotechnology and batteries for electric cars.
Percentage Sales of WACKER’s Key Sectors in Asia
From a developing country to a high-tech nation: South Korea is the world market leader in cellphones, memory chips and liquid crystal displays.
33Semicon
ductor industry
24Other industries (e.g. automotive, chemicals, electronics and consumer goods)
11Construction industry
€ 1,826.1 million
32Photovoltaic
industry
%
15Wacker Chemie AGAnnual Report 2013
Growth RegionAsia
India has still not seen developments like those in South Korea, Singapore and China, despite some impressive growth rates of over 9 percent in recent years. The main bottlenecks are proliferating bureaucracy and an inadequate infrastructure, cau sing India to have paused for breath in the past two years, while its economy has only grown by about 5 percent annually.
It is remarkable how well the country has developed, despite the modest infrastructure. In an analysis, the HSBC bank astonishingly found that India had
“managed to achieve growth without the infra structure focus of other Asian countries.” But the government’s current fiveyear plan now provides for an injection of some US$ 1,000 billion into the country’s infrastructure by 2017. Probably the most ambitious single project is the 1,500 kilometerlong DelhiMumbai Industrial Corridor linking the politi cal capital city of Delhi to Mumbai ( India’s economic center) with a highspeed rail line. Some 24 new cities are to be built in the corridor – modern, en viron mentally friendly and carefully planned with excellent trans port links and broadband internet connections.
Raghuran Rajan, the head of India’s central bank, believes that his country will soon pick up speed and surpass China’s rates of growth. “India only has to exercise the same discipline that the Chinese have shown in expanding their infrastructure.” There are grounds for optimism in their very low per capita income compared to China, a relatively young population with growing consumer power and a high level of education among the aspiring middle class numbering some 300 million people.
India’s economic output is currently half that of Europe, and, according to the OECD, will close the gap with Europe by 2030, and be twice the size by 2060. This year, India will surpass the USA as the biggest user of the internet after China. By 2020, it will probably be the third biggest car market in the world, behind China and the USA.
Thus the Asian century is well underway. For Europeans, too, the “Far” East has drawn much closer. Large parts of German industry would no longer be viable without the markets in East, Southeast and South Asia. Volkswagen already talks of China as its “second domestic market.” The German economy breaks record after record – in October 2013, alone, goods valuing € 99.1 billion were exported, more than in any previous month. A good part of that is due to the growing interest of Asian client industries, customers and partners.
German companies face new competitors as ever more Asian companies move up the valuecreation chain. However, Germany’s most important export goods – machinery, cars and chemical products – are in strong demand in Asia. Between 1990 and 2012, the Asian share of Germany’s exports grew from 7.1 percent to 13 percent. This development is likely to continue provided that German companies maintain their role as innovation leaders and guardians of quality, since they are the most important equippers of the Asian boom. France is still Germany’s most important bilateral trading partner. But, according to a recent study by the Oxford Economics research institute, China will take on this role by 2030 at the latest.

16Wacker Chemie AGAnnual Report 2013
1

17Wacker Chemie AGAnnual Report 2013
A TV in Your PocketSeoul, South Korea
Seoul, South Korea: in the new “Center of Electronics Excellence,” a team of WACKER experts is working on silicones for the high-tech applications of the future. For example, the chemists are developing silicones for flexible displays that will allow screens to be folded up, or even rolled up.
A TV in Your Pocket
electronics companies are among the world’s technology leaders, continually looking for innovations.
“They make excellent end products, but need outstanding raw materials from other companies,” explains Chung. That is where WACKER’s Center of Electronics Excellence (COEE ) comes in, which Chung heads.
In 2012, COEE started work on hightech silicones for the electronics industry. The new lab is located in Pangyo, South Korea’s silicone valley. This area, in the south of Seoul, has become a magnet for hightech startups, research institutes and software com panies. Engineers are testing their robots on the campus under the midday sun. Behind the shimmer ing green of the South Korean headquarters’ glass facade, WACKER, too, is busy working on many innovations for LEDs, displays, automotive elec tron ics and semiconductors.
Speed Is of the EssenceCOEE provides new products and tailored solutions to customers from the region, since demand for hightech materials is growing in both South Korea and its neighbors, such as China and Japan. “Speed is of the essence,” explains Kyuha Chung, who has excellent contacts within the industry.
“Not Really Very Practical, Is It?”Dr. Kyuha Chung reaches into his pocket and pulls out his cellphone, a thick smartphone with a screen the size of a postcard. Every second passenger in the Seoul metro is whiling away their time with a similar device. “Not really very practical, is it?” says the slender Korean with a smile. Then he places his ballpoint pen next to the phone. “What if we could roll up the display to the size of this pen?”
Innovations for Technology LeadersKyuha Chung, vice president of Wacker Chemicals Korea Inc., was personally involved in the rise of the South Korean electronics industry. The chemist wor ked for Samsung Electronics for many years, helping to develop the first 40inch OLED displays.
“Back in the nineties, Korean products were considered run of the mill,” he says. Now, Korean
1 SangHoon Kim, Kyuha Chung and DooJin Kang ( from left ) are driving forward research into hightech silicones.
2 Tradition meets the modern world in Seoul: the historic Namdaemun city gate, originally from the 14th century, surrounded by multilane highways and office blocks.
2

18Wacker Chemie AGAnnual Report 2013
Offering Diversity, Leveraging PotentialThe Asian Region
3
4
The First WACKER Site in Asia
Wacker Chemicals East Asia Ltd. in Tokyo, Japan, was found ed on January 8, 1983, as a sales office for WackerChemitronic GmbH’s products in Japan, Hong Kong, Taiwan, South Korea and the People’s Republic of China.
1983 Starting date

19Wacker Chemie AGAnnual Report 2013
A TV in Your PocketSeoul, South Korea
“Either you are there on the spot, or you are out of the picture.”Dr. Kyuha Chung, vice president of Wacker Chemicals Korea Inc.
“We can be in daily contact with customers here. The customers we see are very demanding, and aren’t prepared to wait weeks for a sample. “Either you are there on the spot, or you are out of the picture.” Even when his staff is groaning from long nights in the lab, the short grayhaired man still presses them on: “The electronics market runs at its own pace.”
3 Silicones are the preferred materials for encapsulating LED chips.
4Phosphorus in the silicone transforms blue LED light into white.
5In the lab, employees test UVactivated silicone gels for optical lamination.
5

20Wacker Chemie AGAnnual Report 2013
Offering Diversity, Leveraging PotentialThe Asian Region
The LED Market Takes Top PriorityFortunately, says Chung, his team can rely on WACKER’s extensive knowhow. “If we had to do everything on our own, I would never have taken on the job in the first place,” he says, laughing. “We get the building blocks from our colleagues in Germany and use them to build new products.” HanHyung Cho, head of the Wacker Chemicals Korea
“We are only just starting out, but we want to be number one in certain segments.”HanHyung Cho, president of Wacker Chemicals Korea Inc.
6

21Wacker Chemie AGAnnual Report 2013
A TV in Your PocketSeoul, South Korea
7
subsidiary, has a clear idea of what WACKER can achieve with silicones for the electronics sector when the small R & D team puts its mind to it. “We are only just starting out, but we want to be number one in certain segments,” he says. “We can’t afford to fritter away our energy.”
Sales of silicones for the electronics sector are fore cast to rise tenfold between 2010 and 2020. The LED market has first priority. COEE mainly concentrates on materials for lenses and for encapsulating chips. Because of the long lifetime of the LEDs, silicones are the material of choice here, since they also maintain their special properties in the long term: they are thermally stable and provide protection against UV radiation, moisture and vibrations.
Kyuha Chung knows there is fierce competition on the LED market. “We will have to achieve success very soon,” he says. The first innovations from COEE are already being manufactured in the Jincheon plant, 100 kilometers southeast of Seoul. To meet the electronic industry’s strict demands, WACKER has set up a cleanroom there, to produce hightech silicones under dustfree and ultraclean conditions.
Dr. Chung and his team are optimistic that other new developments will follow soon. One customer is currently testing an innovative silicone gel for airtight bonding of cellphone displays and PC monitors to the protective screen. “It will cut out reflections altogether,” explains Dr. Chung, showing the difference between two displays in the lab.
“Optical lamination” as it is called is a new, strongly growing market.
Another new market is that for flexible displays. Here, WACKER is working in a research cluster financed by the South Korean government. That is potentially a billiondollar market for silicones, says Chung, though at this stage it isn’t clear which technology will prevail. “That’s why we’re not putting all our eggs in one basket,” he adds. But Dr. Chung is sure about one thing: “Flexible displays are on their way.”
Kyuha Chung shows one of the samples that could one day become a display, a composite film of glass fiber and silicone. A South Korean electronics manu facturer will launch the first foldable displays in late 2015, which will double their size. The next step would be displays you can roll up. And one day, who knows? You might actually be able to carry a 20inch TV in your pocket.
“We are seeing a global turnaround, a revolution toward LEDs,” says Dr. Christian Hartel, head of the WACKER SILICONES division: the fate of the incandescent bulb is already sealed in much of the world. According to a study by management consultants McKinsey, the LED will command a 65percent share of the global market in 2020. The transformation is taking place particularly fast in Asia, which is also the biggest market. In 2020, Asia is expected to have a share of 45 percent of the global lighting market.
6 Ten developers work in the COEE’s new hightech lab in Seoul.
7 In the cleanroom of the production facility in Jincheon, highpurity specialty silicone rubbers are produced for the electronics industry.

22Wacker Chemie AGAnnual Report 2013
Offering Diversity, Leveraging PotentialThe Asian Region
Dr. Christian Hartel is president of WACKER SILICONES. One year ago, the division started a concentrated expansion of its activities in Asia. In this interview, Dr. Hartel discusses the first successes – and the steps that are to follow.
Local Presence Is the Key to Mar ket Access in Asia
Dr. Hartel, how will the silicone business continue to grow?Over recent years, we have invested a great deal in our upstream production capacities, chiefly for siloxane, which is our key intermediate. Now, the priority is to utilize these capacities efficiently by bringing local facilities for manufacturing downstream products on stream, that is to say to continue the growth with our end products. The core of our strategy is to expand our business with specialties in a targeted way not only in Asia, but in other markets as well. We want to improve our value creation per silicon atom. To achieve this, we are simult aneously optimizing our global production network.
What is WACKER SILICONES’ current standing in Asia?WACKER has established itself as the world’s number two in silicones in recent years. We haven’t achieved this position in Asia yet, so we can see a good deal of scope for our business to grow here. In some Southeast Asian countries such as Thai land and Vietnam, but in highly populated India as well, silicone products are much less widely used in everyday life than in Europe or the USA. We have therefore quite deliberately built up a business team specifically for Asia – like the one we have had in China for five years.
What will this change?We have a stronger presence in the region and can respond faster. To successfully capture these markets, we simply need to act more rapidly than we could ever do operating exclusively from Europe. It is important to have experts on the spot and to understand how the markets tick. That allows us to develop the right products and build up local chan nels to our customers. Our chief priority, market access, in particular, is only possible from a local base.
1 Dr. Christian Hartel is a chemist. He has headed the WACKER SILICONES division since 2012.
2 Expertise for the Asian market: working on new silicones in the technical center in Seoul, South Korea.
1

23Wacker Chemie AGAnnual Report 2013
Market Access Has SucceededAsia
2
Why?Because the technical requirements are often different. In the past, it was tough for us with our European viewpoint. For example, our colleagues from India know much better than us what characteristics products need to sell well in India and South east Asia. It is not always a matter of just find ing the best technical solution. What is impor tant is to quickly satisfy customers’ demands by working closely with them, and ultimately to earn money.
What implications does that have for organizational structures?In Asia, we have now been operating with five new business teams since early 2013. The team for textile applications and consumer care is based in Mumbai, because our greatest expertise in these sectors is located there. We support business with silicone cartridges from South Korea, where we also have our own cartridge production. Elastomers are lo ca ted in Singapore. The business teams there take care of marketing, customer service and the deve lop ment of new products in Asia. Our colleagues are eager to take on more responsibility for business than has been the case so far.
And China?China is a special case, as it is our biggest and most important market in Asia. We are reckoning on the Chinese silicone market outperforming our domestic market in Europe by 2020. We have therefore already strongly expanded our production, sales and local development there.
How is knowledge transferred to Asia? We have two new teams that help us – global product development and global business development. Their task is to build up our knowhow and expertise in Asia and advance global exchange, in other words communication. In an ideal case, our applications engineer in Asia will contact his colleague in the USA, who is an expert in a particular application. In reality, it is sometimes the case that colleagues don’t know whom to call. With these two teams, we want to change that in future in order to develop more into a global network of experts.
How is the regional structure changing global business? This can be very clearly illustrated with the example of India. Here, we have long had a market presence, with a joint venture and a strong local team. We have succeeded in developing silicones for appli cations in Indian personalcare products (shampoos and conditioners) of a multinational consumer goods manufacturer. Previously, we had no business relation ships at all with this company. Now we manufacture globally for it in China, India, Germany and Brazil. This local partnership has flourished into a global business.
“We have to understand how the markets tick.”Dr. Christian Hartel, president of WACKER SILICONES.

24Wacker Chemie AGAnnual Report 2013
Offering Diversity, Leveraging PotentialThe Asian Region
Only Seven Days to a SolutionManoj Shetty still clearly recollects the difficult beginnings. “I was supposed to do something about prospecting for customers in the personalcare sector,” says the Indian. “But there were hardly any customers.” So Shetty visited the biggest producer in South Asia, a multinational manufac turer of consumer goods. The first visits were so bering, considering that WACKER didn’t have any business relationships with this customer anywhere in the world. But Shetty didn’t give up. “It was clear that if I didn’t manage to sell them anything, I would have lost.”
His tenacity was rewarded. The company’s haircare team in India changed to WACKER, and looked for ideas for a silicone emulsion. Shetty dispatched his colleagues Amit Kumar Paul and his development team from Calcutta. After only seven days, they came up with a solution. Now, WACKER supplies the emulsion to this company worldwide. Other major manufacturers followed.
A Genuine Innovation PartnerThe purchasers quickly realized that WACKER is a flexible and committed partner. “With our specialty chemicals, we can respond to customer needs precisely,” says Shetty. “We have become a real inno vation partner, not only for shampoos,” adds Amit Kumar Paul.
The local business has grown into a longterm global partnership with annual growth rates of about 30 percent. To meet the increasing demand, WACKER has expanded its production in China, India, Brazil and Germany, and in 2013 was honored as one of the company’s key suppliers. The award is now displayed in the Munich HQ. But the first person to be allowed to take it back to his office was Manoj Shetty.
WACKER already has a long and successful track record in India with silicones for the textile industry. The booming market for personal-care products, on the other hand, was still uncharted territory. With persistence and innovation, the India team gained a foothold in this market, developing it into a global business.
The Indian Recipe for Success:Start Local, then Go Global
2
1

3
25Wacker Chemie AGAnnual Report 2013
The Indian Recipe for SuccessMumbai, India
The Indian Recipe for Success:Start Local, then Go Global
€ million
WACKER Sales Growth in India
1Booming market: India’s 1.2 billion inhabitants are showing an increasing liking for shampoos and personalcare products.
2Silicones in shampoos or conditioners make hair soft and glossy.
3Amit Kumar Paul ( left) and Manoj Shetty together ensure that WACKER is well placed in the personalcare sector.
14.7 2004
91.7 2013

26Wacker Chemie AGAnnual Report 2013
Offering Diversity, Leveraging PotentialThe Asian Region
The Journey into the FutureShanghai, China: we have been active in the Chinese market for 20 years. In moving into its new Shanghai HQ, which also consolidates the local R & D activities, WACKER now has a home in China at last. The future priority is to penetrate the market even deeper – for example in the construction industry.
1

27Wacker Chemie AGAnnual Report 2013
The Journey into the FutureShanghai, China
The Pioneering Years Are OverWhen Lars Nordblom returned to Shanghai on behalf of WACKER in 2012, the first thing he noticed was that the construction cranes had gone. The Swede had already worked in Shanghai from 2002 to 2005. At that time, the city was just one huge building site, he remembers. But is the construction boom over now? No. It has just moved on to other megacities in this huge country.
On Lars Nordblom’s second stay in China, something else had changed, too – the competition. In the dispersible polymer powders business, which he heads, WACKER is still the clear market leader, but instead of five competitors, there are now over 90. A number of domestic manufacturers have grabbed market share from the multinationals.
“Competition is as tough as it gets,” says Nordblom. The pioneering years, when the company just grew and grew, are a thing of the past. WACKER now makes a fifth of its corporate sales in mainland China and Taiwan. In 2013, that totaled € 1.07 billion. After starting business in China 20 years ago by ope ning two offices, WACKER invested € 500 million in modern production facilities, sales, administration and later in R & D.
Outgrowing the CompetitionNow it is a matter of carefully considering which market segments hold the most potential for WACKER to achieve more and which applications have the brightest future. The magic word is differentiation. With products tailored to the Chinese market, such as the less expensive price segment in construction, and with new customers and new sales channels, WACKER Greater China intends to outgrow the competition in the coming years, too.
For an insight into the Chinese construction industry, it’s worth paying a visit to Raymond Zhou’s small, glasswalled office. The marketing expert sur veyed 1,400 Chinese mortar producers about their busi ness and practices. The study only confirmed what Zhou and his colleagues had already guessed: “We can’t ignore inexpensive alternative products.” WACKER is the market leader in highquality disper sible polymer powders, with a market share of over 40 percent says Zhou. Impressive though that may be, he’s sure WACKER can do better in the lower price segment, where the Group’s share is only just over 10 percent. The market in this area will grow much more strongly in the next few years, says Zhou.
1The new Chinese HQ in Shanghai: hundreds of thousands of motorists on the Middle Ring Road see the WACKER company sign every day.
2Paul Lindblad, an American, has been president of Wacker Chemicals Greater China since 2013.
2

28Wacker Chemie AGAnnual Report 2013
Offering Diversity, Leveraging PotentialThe Asian Region
3At the Nanjing polymer site, WACKER intends to double its production capacity for dispersible polymer powders.
4The main customer for polymer products is the Chinese construction industry.
5Lars Nordblom ( left), Lucy Lu (center) and Raymond Zhou (right) are responsible for sales of polymers in China.
4
3WACKER’s Production Sites in China
Zhangjiagang Siloxane and HDK ® pyrogenic silica ( joint venture with Dow Corning ) Silicone fluids and emulsions Elastomers
ShundeSilicone fluids and emulsions ( joint venture with Dymatic Chemicals)
NanjingDispersions Dispersible polymer powders
Wuxi PVAc solid resins
WACKER SILICONESSiloxanes Silicone intermediates Silicone sealants Solid silicone rubbers RTV and HTV liquid silicone rubbers Silicone emulsions Silicone fluids Pyrogenic silica
WACKER POLYMERSDispersions Dispersible polymer powders
WACKER BIOSOLUTIONSPVAc solid resins
SILTRONIC200 mm hyperpure silicon wafers 300 mm hyperpure silicon wafers
WACKER Products Manufactured in Asia

29Wacker Chemie AGAnnual Report 2013
5

30Wacker Chemie AGAnnual Report 2013
Offering Diversity, Leveraging PotentialThe Asian Region
6The plant complex in Nanjing is one of the largest of its kind in China.
7The polymer team in Shanghai has a clear plan for the future.
Construction Has Moved to the ProvincesZhou’s study also explains why his colleague Lars Nordblom didn’t see construction cranes any longer when he returned to Shanghai. The govern ment is putting a brake on growth in megacities such as Shanghai, Beijing and Guangzhou. Instead, construc tion work is moving to the provinces. Year after year, 15 million people are moving from the countryside into cities, for example to Changshu or Shantou – megacities that are unknown outside China. Here, an attractive price is more important than outstanding quality. “We are building for the next 20 to 30 years, not for eternity,” says Raymond Zhou.
70Percent GrowthZhou’s colleagues in product development respond ed quickly to his market study. The first dispersible polymer powder specifically for this price segment was launched in 2012. “That is excellent quality for the price,” says Nordblom. In 2013, as a result, WACKER sold 70 percent more dispersible polymer powder in this market sector than in the previous year. The success was so great that further in expensive products are under development.
Since price and availability in remote areas are crucial in this segment, products are sold via distributors. In addition, Zhou wants to sell the products in homeimprovement stores and over the powerful online portal Taobao. “We want to get closer to local customers,” he says. By 2018, WACKER’s market share is expected to have risen to over 30 percent.
“Nobody Will Wait for Us”In the long term, however, the lower price segment will disappear, Lars Nordblom believes. “Now, when we go to restaurants where we used to meet other nonChinese colleagues, there are almost only Chinese there,” he says. Not only the super rich, but also the middle classes are doing well. “People are be coming aware of quality of life and appreciate fine things,” he says. “China will continue to develop in the way we have already seen in many other coun tries.” His colleague Raymond Zhou adds:
“Nobody will wait for us. That is why we need a clear strategy.”
PentUp DemandFirst and foremost, there is a product that is unimpressive to look at, namely tile adhesive. However, when Raymond Zhou reports that nine billion square meters of tiles are produced in China each year, mainly for Chinese floors and walls, the issue of tile adhesives looks much more attractive. Until recently, tile layers used sand, cement and some
6

25Japan
183India
148South Korea
830China
573Singapore
24Other
WACKER Employees in Asia
31Wacker Chemie AGAnnual Report 2013
The Journey into the FutureShanghai, China
Construction quality is increasing and not only for tiles. Lucy Lu, business director for VAE dispersions, sees standards becoming higher in other areas, too. For example in the waterproofing of basements and wet areas. “There used to be a lot of water damage, damp walls and mold in apartments,” she explains. Waterproofing membranes are therefore being increasingly installed. WACKER has been able to triple sales of VAE dispersions in the last four years. VINNAPAS® dispersions are gaining in popularity, particularly among local manufacturers of sealing slurries.
Expanding Production in NanjingIn 2013, WACKER doubled its production capacity for polymer dispersions from 60,000 to 120,000 metric tons in Nanjing. And in 2014, capacity for dispersible polymer powders is also planned to double from 30,000 to 60,000 metric tons. This will make the plant complex in Nanjing the largest of its kind in China.
WACKER is already the clear market leader in China for binders for exterior insulation and finish systems (ETICS /EIFS). This is by no means a niche market. Thermal insulation is indispensable in the north of the country. Energy saving is also becoming an important issue in other regions, too. The Shanghai lab has designed products tailored to the market. In addition, in recent years, WACKER employees have initiated pilot projects, trained craftsmen to use ETICS /EIFS systems, and become actively involved in standards and laws for lowenergy construction techniques. “The People’s Congress has just raised China’s energysaving goals,” adds Lars Nordblom.
cheap glue to bond their tiles to the wall. Imported tile adhesive was far too expensive for them, says Zhou. Thus, only one in twenty binders was polymermodified. So there is a fair amount of ground to gain. With ever larger tiles, narrow joints and the preferred porcelain stoneware with a very smooth backside, polymer binders are indispensable. In addition, increasing labor costs mean that working hours also play a role. “It’s no longer economical to hold the tile pressed onto the wall for a quarter of an hour until it sticks,” says Lars Nordblom. He therefore reckons on annual growth of 15 percent over the next years for VINNAPAS® in tile applications.
7

32Wacker Chemie AGAnnual Report 2013
Offering Diversity, Leveraging PotentialThe Asian Region
He is counting on energy efficiency and environmentally friendly construction materials playing an ever greater role in China. People are concerned about smog and environmental scandals, says Nordblom. In a city like Shanghai, energy costs are also exorbitant, as poorly insulated apartments of 24 million residents are heated by airconditioning systems or electric radiators in the cold winters.
Well EstablishedWACKER’s new Chinese headquarters shows the way to the future. The office building with its shiny facade is a lowenergy structure. With over 10,000 square meters on six stories, WACKER has consolidated not only marketing, sales and administration offices, but also numerous research and test labs under one roof. Paul Lindblad, president of WACKER Greater China, stands proudly in his office and says:
“The new HQ not only saves energy. It also creates a good team atmosphere, brings us together and makes it easier for all of us to work together.”
Paul Lindblad sees the HQ as a symbol that WACKER is now really established in China. That is clear even from the location of the new HQ. “The old office was just a stone’s throw from Pudong International Airport. Now we are close to the domestic airport and the railway station, where the highspeed trains start out,” he says. “As a result, we can easily reach production sites and customers throughout China.” Lindblad wants to make the company even more locally based. Of the 870 employees, 844 are already Chinese. The American would consider it only logical if his eventual successor also came from China.
With products tailored to the Chinese market – such as the less expen-sive price segment in construction – and with new customers and new sales channels, WACKER Greater China intends to outgrow the competition in the coming years, too.
WACKER Sales Growth in China
€ million
1,066.82013
14.12000
230.32004
732.72009

Fo
r O
ur
Sh
are
ho
lde
rs
For Our Shareholders
1
Key Construction Sector Player
Our VINNAPAS ® brand dispersible polymer powders are mainly used in construction applications. These powders are used wherever a combination of strong adhesive bonds and sufficient elasticity is needed: whether in renders, ETICS /EIFS systems, tile adhesives or selfleveling flooring compounds. Due to the high quality and tailored properties of our polymer powders, we are clearly the world leader in this market.

35 Letter to Our Shareholders
40 Executive Board
41 Report of the Supervisory Board
46 WACKER Stock in 2013
For Our Shareholders
Fo
r O
ur
Sh
are
ho
lde
rs

WACKER looks back on an eventful and difficult year. Although we set new records for polysilicon volumes in 2013, sales and EBITDA (earnings before interest, taxes, depreciation and amortization) came in below the previous year’s level. Low polysilicon prices and persistent price pressure in the semiconductor segment were mainly responsible for this decrease. Overall, price effects reduced Group sales by around € 360 million. Our chemical business was stable, but the economy did not provide the tailwind to enable continued growth. At € 4.48 billion, Group sales were down on the previous year by more than 3 percent. EBITDA was € 679 million, declining by around 15 percent.
In 2013, we placed particular emphasis on resource management and lowered our costs across every corporate sector. This enabled us to limit the negative influence of price effects on Group sales and EBITDA. Cost savings of around € 225 million made a substantial contribution. Higher production output also had a positive effect.
Net cash flow and net financial debt developed better than we had expected at the beginning of the year, due to lower investment spending and rigorous inventory management. At just under € 800 million, net financial debt remained well below the one-billion-euro mark.
Given the exceptionally challenging circumstances, WACKER delivered a respectable performance. At the Annual Shareholders’ Meeting in May, the Supervisory and Executive Boards will propose a dividend of € 0.50 per share.
Our employees deserve considerable credit for WACKER’s performance last year. I would like to express my gratitude, and that of my colleagues on the Executive Board, to all of our employees for their outstanding efforts.

In the photovoltaic market, conditions were very varied. The process of consolidation continued, with excess capacity persisting along the entire supply chain. Despite these problems, positive trends prevailed and the market has continued to grow. The installation of new solar systems increased to 39 gigawatts. In ever more countries, solar energy is gaining acceptance as an environmentally friendly and absolutely competitive source of energy. We profited from this volume growth and, in addition, expanded our market share.
A key, positive signal for the market’s future development was the agree-ment reached in the solar dispute between the European Union and China regarding imports of Chinese solar modules and cells to Europe. On the other hand, we find it unsatisfactory that there has still been no agreement in the dispute about punitive tariffs for European polysilicon deliveries to China. We are working proactively at all political decision- making levels to enable a permanent and viable solution.
In the silicon-wafer market, trends were disappointing. The volume increase expected for the second half-year did not materialize and price pressures continued unabated amid the exchange-rate advantages of Japanese competitors. Our acquisition in early 2014 of a majority stake in our joint venture with Samsung will strengthen business in 300 mm silicon wafers in the Asian region – in line with our strategy.
On the whole, the chemical business was stable. Higher volumes en-abled us to compensate for pressure on prices. Demand was high, especially for silicone products, where we expanded our market share and are now Number 2 globally. The dispersions business, though, developed somewhat more slowly. Overall, sales remained at the prior- year level, while EBITDA climbed noticeably.
The year 2013 was a turning point in WACKER’s investment policy. In the period between 2005 and 2012, we invested substantial capital in expand-ing our global production capacity. Large facilities for manufac turing upstream products were constructed to ensure continued growth and strengthen our global presence in important markets. These invest-ments are virtually completed, with the exception of the new polysilicon site in Charleston (Tennessee, USA).

By 2017, our capital expenditures will decrease and remain below the level of depreciation. Our investment emphasis will also shift. In the next few years, we will not only complete the Tennessee production site, but also concentrate on constructing facilities for fi nished products with substantially lower capital intensity. At the same time, we will expand our market share with high-end products in the areas of automotive technology, energy, electronics, medicine, and health and personal care.
The focal point of our growth strategy is to achieve greater profi tability in our operating activities and to post consistently positive net cash flow. This strategy will be supported by a stringent cost-monitoring program at each corporate sector.
Our strategic focus, which we initially presented at the Capital Markets Day in July 2013 in London, was received positively by analysts, investors and other capital-market participants alike. This strengthens us in our resolve to continue down the path we have taken.
After two challenging years, we look to the current year with more optimism. Our forecast is for increasing sales and volumes at all of our business divisions. We also expect EBITDA to grow again this year. We will work hard to achieve these goals.
Even if our net financial debt continues to increase, the basic tenets of our financial policy still apply. We will focus on a strong financial profile with a sound capital structure and healthy maturities for our debt.
WACKER will be 100 years old this year. Our company stands for inno-vation, high quality, good service and financial stability – as well as for three generations of individuals who have identified strongly with the company, promoting its success over the past century with their unswerving commitment.
Amid this steadfast continuity, there is one virtue that has always characterized WACKER: the courage to change, to explore new frontiers – just as we are doing at our new production site in Tennessee.

I, for my part, am optimistic that this combination of continuity and modernity will secure WACKER a positive future in the coming decades. We will do our utmost to take advantage of the opportunities that arise. We are convinced that our businesses are very well positioned and that we will profit from this over the long term. We have excellent products that make people’s daily lives easier, more comfortable and simpler all over the globe.
I would like to thank all of our customers and suppliers for their trust and successful collaboration, and our shareholders for communicating so openly. Together, we want to stride ahead, continuing to shape WACKER’s future.
Munich, Germany, March 2014
Dr. Rudolf StaudiglPresident & CEO of Wacker Chemie AG

For Our Shareholders Executive Board
39Wacker Chemie AGAnnual Report 2013
I, for my part, am optimistic that this combination of continuity and modernity will secure WACKER a positive future in the coming decades. We will do our utmost to take advantage of the opportunities that arise. We are convinced that our businesses are very well positioned and that we will profit from this over the long term. We have excellent products that make people’s daily lives easier, more comfortable and simpler all over the globe.
I would like to thank all of our customers and suppliers for their trust and successful collaboration, and our shareholders for communicating so openly. Together, we want to stride ahead, continuing to shape WACKER’s future.
Munich, Germany, March 2014
Dr. Rudolf StaudiglPresident & CEO of Wacker Chemie AG
Executive Board: Dr. Tobias Ohler, Dr. Rudolf Staudigl, Dr. Joachim Rauhut and Auguste Willems
40Wacker Chemie AGAnnual Report 2013
For Our Shareholders
Executive Board
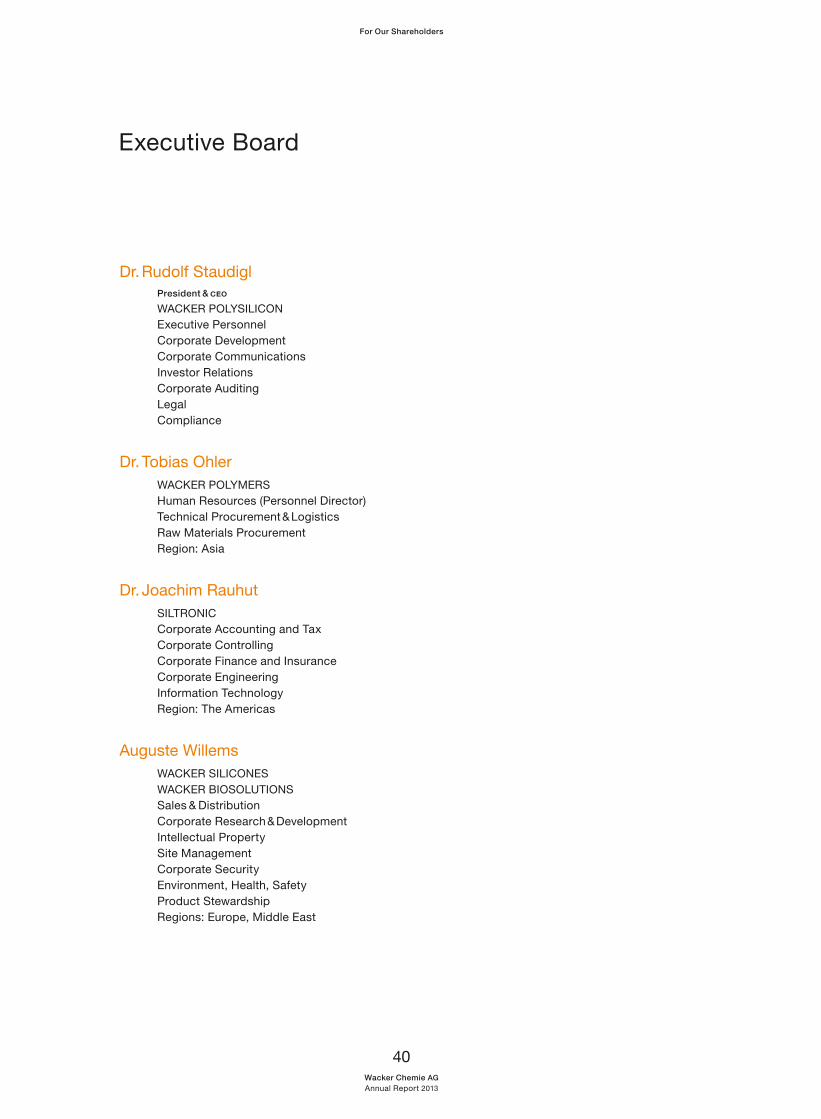
Dr. Rudolf StaudiglPresident & CEO
WACKER POLYSILICONExecutive PersonnelCorporate DevelopmentCorporate CommunicationsInvestor RelationsCorporate AuditingLegalCompliance
Dr. Tobias OhlerWACKER POLYMERSHuman Resources (Personnel Director)Technical Procurement & LogisticsRaw Materials ProcurementRegion: Asia
Dr. Joachim RauhutSILTRONICCorporate Accounting and TaxCorporate ControllingCorporate Finance and InsuranceCorporate EngineeringInformation TechnologyRegion: The Americas
Auguste WillemsWACKER SILICONESWACKER BIOSOLUTIONSSales & DistributionCorporate Research & DevelopmentIntellectual PropertySite ManagementCorporate SecurityEnvironment, Health, SafetyProduct StewardshipRegions: Europe, Middle East

41Wacker Chemie AGAnnual Report 2013
For Our Shareholders
Report of the Supervisory Board
2013 was not an easy year for WACKER. The global economy’s flat trajectory, persistently low polysilicon prices and the weakness of the semiconductor market all impeded our business. Additionally, solar companies were unsettled by the anti-dumping proceedings of the European Union against Chinese solar companies and those of the Chinese Ministry of Commerce against European polysilicon manufacturers. To navigate these headwinds, we worked intensively on improving our cost positions. By focusing our resources and imple-menting numerous measures at our business divisions and corporate departments, we lowered our costs by some € 225 million last year. Higher production output also had a positive effect.
Dr. Peter-Alexander Wacker Chairman of the Supervisory Board of Wacker Chemie AG

42Wacker Chemie AGAnnual Report 2013
For Our ShareholdersReport of the Supervisory Board
That success is due in large part to WACKER’s employees. Their strong commitment, their drive to perform well and their outstanding expertise are essential for keeping the company on course, especially in troubled economic waters. The Supervisory Board of Wacker Chemie AG sincerely thanks them for their accomplishments in 2013.
Looking beyond last year’s challenges, we are confident about WACKER’s future, for a number of reasons. Although we invested about € 500 million in 2013, our net financial debt did not rise significantly. Our acquisition of a majority stake in our joint venture with Samsung in Singapore in early 2014 will increase our net financial debt by around € 150 million. This move, though, strengthens our 300 mm wafer business in Asia. WACKER’s equity base remains healthy. The company’s long-term financing is secure. Our solid balance sheet continues to provide a firm foundation for WACKER’s lasting success.
Despite the difficult market conditions, we reinforced our positions in key business segments last year. WACKER POLYSILICON increased its market share as a leading producer of hyper-pure polycrystalline silicon for electronic and solar applications, and is now the global market leader. WACKER SILICONES also gained ground and, for the first time, occupies the No. 2 position among the world’s largest silicone producers. And WACKER POLYMERS remains the global market leader for vinyl-acetate-based dispersions and dispersible polymer powders. Siltronic, for its part, has retained its strong No. 3 position as a producer of silicon wafers for the semiconductor industry.
These developments underpin an important fact – WACKER’s products are recognized for their high quality by customers across practically every major industry in the world’s main economic regions. Our technological expertise and our innovative strength enable us to develop new applications for our products and to find solutions for the megatrends of the coming decades.
With our high capital expenditures outside of Germany, we have not only markedly strength-ened our global presence, but also improved our cost positions.
An agreement has yet to be found in the trade dispute that is still simmering about punitive tariffs for polysilicon deliveries from Europe to China. If this dispute can be resolved, the resulting situation will, on the whole, be good for WACKER’s continued growth.
Our task, then, will be to leverage our strengths into business success. During WACKER’s 100-year existence, we have often proven that we can effectively seize the opportunities that arise.
Continuous Dialogue with the Executive BoardAt WACKER, sound corporate governance and control are built on a relationship of trust between the Executive Board and Supervisory Board as they work closely together in the company’s interest. In 2013, the Supervisory Board performed – with great diligence – the duties incumbent upon it under the law, the Articles of Association, and the internal rules of procedure. The Supervisory Board was involved in every decision of fundamental significance for the company at an early stage.

43Wacker Chemie AGAnnual Report 2013
For Our ShareholdersReport of the Supervisory Board
In both written and verbal reports, the Executive Board regularly provided us with timely and comprehensive information on corporate planning, strategic development, business operations, and the current state of Wacker Chemie AG and the Group, including the risk situation. Outside of the scheduled Supervisory Board meetings, the Chairman of the Super-visory Board also remained in regular contact with the Executive Board, especially with the CEO, and was kept informed about the business situation, current trends and key business transactions. Any deviations from business plans and targets were explained to us in detail.
Wherever required by statutory provisions and the Articles of Association, the Supervisory Board voted on the reports and proposals of the Executive Board after detailed examination and discussion.
In the reporting year, we paid particularly close attention to investment projects, the current earnings situation, including the risk position and risk management, and the company’s liquidity and financial position.
The Supervisory Board held five meetings in 2013, three in the first half of the year – including the newly elected Supervisory Board’s inaugural meeting – and two in the second. Between meetings, the Executive Board immediately informed us in detail by means of written reports about all projects and plans of particular importance to the Group. At its full meetings and in its committees, the Supervisory Board discussed in detail business trans-actions important to the company on the basis of the reports submitted by the Executive Board. The full meetings were prepared by shareholder and employee representatives in their own separate sessions. In the period under review, every Supervisory Board member attended at least half of the meetings held during their period in office.
The Supervisory Board’s Main Areas of DeliberationThe development of sales, earnings and employment at the Group and its individual segments were the subject of regular deliberations in the full meetings. At each meeting, the Supervisory Board evaluated the Executive Board’s performance – on the basis of Executive Board reports – and discussed strategic development opportunities and other key topics with the Executive Board. There was no need for additional monitoring measures, such as inspection of corporate documents or appointing expert counsels from outside.
Major areas of deliberation dealt with by the Supervisory Board were:
The anti-dumping proceedings against the solar industry in the USA, EU and China; their impact on WACKER; and courses of action open to us
The market-price level of polysilicon, demand fluctuations in this segment, and the consequences for WACKER
The acquisition of the SCIL company in Halle Progress with constructing the polysilicon production site at Charleston, Tennessee (USA) The future and financing of our Singapore-based joint venture with Samsung Investments in the semiconductor sector Performance of the share price Group financing measures

44Wacker Chemie AGAnnual Report 2013
For Our ShareholdersReport of the Supervisory Board
The Supervisory Board discussed the WACKER Group’s plans for 2014 at its meeting of December 10, 2013. On this occasion, the Supervisory Board also dealt with medium-term corporate plans for 2014 to 2018. It also discussed and approved the capital-expenditure budget for 2014.
Work in the CommitteesThe Supervisory Board is assisted in its work by the committees which it has constituted. WACKER’s Supervisory Board has created three committees – an Audit Committee, an Executive Committee, and a Mediation Committee (as per the German Co-Determination Act (MitbestG), Section 27, Subsection 3). With the exception of the Audit Committee, which is chaired by Dr. Bernd W. Voss, the Chairman of the Supervisory Board chairs the committees.
The Audit Committee met four times last year. Key aspects of its work included the audit of the annual financial statements of Wacker Chemie AG and the Group for 2012 and of the consolidated interim financial statements for the first half-year. It also discussed the consolidated quarterly reports and issues relating to risk management, compliance and auditing. Additionally, the Audit Committee awarded the audit assignment ( including the focus of auditing) to the chosen auditors and submitted a proposal for the choice of auditors for 2013 to the Supervisory Board’s full meeting.
The Executive Committee met once in 2013. At that meeting, it dealt with personnel issues relating to the Executive Board (such as compensation, Executive Board membership and employment contracts).
The Mediation Committee did not need to be convened last year.
The Supervisory Board was regularly informed about the committees’ work.
Corporate GovernanceLast year, the Supervisory Board again looked closely at corporate-governance standards. At its meeting of December 10, 2013, the Supervisory Board discussed the application of the German Corporate Governance Code and adopted the annual Declaration of Conformity that must be submitted jointly by the Executive and Supervisory Boards in accordance with Section 161 of the German Stock Corporation Act (AktG). Shareholders can access the Declaration on the company’s website.
In its Corporate Governance Report, the Executive Board reports on corporate governance at WACKER also in the name of the Supervisory Board in accordance with Item 3.10 of the German Corporate Governance Code. For further details, refer to page 268 onward.
At its meeting in December 2013, the Supervisory Board also discussed the efficiency of its activities and found that it works efficiently – one reason being the regular preliminary discussions regarding the Supervisory Board meetings.
Audit of the Annual Financial Statements of Wacker Chemie AG and the WACKER GroupKPMG AG Wirtschaftsprüfungsgesellschaft, Munich, audited the annual financial statements of Wacker Chemie AG prepared by the Executive Board for 2013, the consolidated financial statements and the combined management report (reporting date: December 31, 2013), including the accounting.

45Wacker Chemie AGAnnual Report 2013
For Our ShareholdersReport of the Supervisory Board
The audit assignment had been awarded by the Supervisory Board’s Audit Committee in line with the resolution of the Annual Shareholders’ Meeting of May 8, 2013. The auditors issued an unqualified audit report.
The auditors also examined the risk management system in accordance with Section 91 of the German Stock Corporation Act (AktG). The audit verified that the risk management system meets the legal requirements. No risks endangering the continued existence of the company were identified. The financial-statement documents ( including the auditors’ reports, the combined management report and the Executive Board’s proposal for the distribution of profits) were submitted to all the Supervisory Board members in good time.
At its meeting of March 4, 2014, the Audit Committee closely examined the aforementioned financial statements and reports, as well as the reports submitted by the auditors of the separate and consolidated financial statements, and discussed and examined them in detail with the auditors before reporting to the full Supervisory Board. At its meeting on March 13, 2014, the full Supervisory Board discussed and examined the relevant financial-statement documents intensively, taking account of the reports submitted by the Audit Committee and the auditors. At both meetings, the auditors took part in the deliberations. They reported on the main results of the audit and were available to the Audit Committee and the full Supervisory Board to answer questions and provide supplementary information.
After concluding our own examination, we found no grounds for disputing the annual financial statements of Wacker Chemie AG, the consolidated financial statements or the combined management report, or the auditors’ reports.
Accordingly, we approve the annual financial statements of Wacker Chemie AG prepared by the Executive Board and the consolidated financial statements as of December 31, 2013. The annual financial statements of Wacker Chemie AG are hereby adopted. We concur with the Executive Board’s proposal for the distribution of retained profits.
Changes in the Composition of the Supervisory and Executive BoardsAt the Annual Shareholders’ Meeting on May 8, 2013, new elections were held for shareholder representatives to the Supervisory Board. Wacker Chemie AG employees had elected their employee representatives on March 21, 2013. The Annual Shareholders’ Meeting was followed by the inaugural meeting of the new Supervisory Board, at which Dr. Peter-Alexander Wacker was re-elected as the Supervisory Board chairman.
At its meeting on March 7, 2013, the Supervisory Board had re-appointed Dr. Rudolf Staudigl as president and CEO and Auguste Willems as Executive Board member for another five years, respectively, extending their contracts for five years.
Munich, March 13, 2014The Supervisory Board
Dr. PeterAlexander WackerChairman of the Supervisory Board of Wacker Chemie AG

46Wacker Chemie AGAnnual Report 2013
For Our Shareholders
WACKER Stock in 2013
A wide range of factors influenced the performance of WACKER stock in 2013. The chief factor was the progress of the EU’s trade dispute with China over punitive tariffs for Chinese solar modules. The agreement between the EU Commission and the Chinese Ministry of Commerce in late July had a very positive impact on WACKER’s share price. Capital markets also responded positively to WACKER’s first publication of medium-term goals through to 2017. The Executive Board presented the goals and the strategy for achieving them at a dedicated conference for analysts and investors in London on July 1, 2013.
Trade Dispute Between the EU and China Affects WACKER’s Share PriceIn Q1 2013, German and international capital markets were essentially dominated by fiscal-policy developments in Europe and the USA. Although there was a growing consensus that the acute symptoms of the crisis were subsiding in the European Monetary Union, both the struggle to avert impending sovereign default in Cyprus and Italy’s ongoing political in stability rekindled market participants’ fears. In the USA, Congress and the Administration were unable to find a consensus on ways to reduce the US budget deficit. As a result, a so-called sequester took effect in early March, resulting in a drastic reduction in federal spending.
During the first quarter, WACKER stock, at times, clearly outperformed the DAX and MDAX. It started at € 49.65 (year-end closing price on Dec. 28, 2012). The share price received impetus from positive market reports on the growth outlook for photovoltaics in non-European econo-mies and from the ending of short-time work at WACKER POLYSILICON in February 2013. As a result, the stock climbed to € 70.38 (Feb. 25, 2013), though it declined again afterward and ended the first quarter at € 55.83 (closing price on March 28, 2013).
The release of WACKER’s preliminary 2012 figures on February 7, 2013, and the publication of the annual report on March 14, 2013, did not affect the price of WACKER stock.
During the second quarter of 2013, there were increasing signs that the global economy would stabilize and that the European Central Bank would continue its policy of low interest rates. Both these factors calmed stock markets for a time, but did not remove the skepticism of market participants in the long term. Additionally, economic trends diverged strongly across the individual regions. While the US economy continued on its path to recovery, growth in China slowed. The eurozone remained in recession. And the crisis-hit countries of southern Europe saw the financial and economic crisis continue unabated.
WACKER’s stock started the second quarter at € 55.85 (closing price on April 2, 2013) and shortly afterward fell to its year-low of € 50.66 (April 18, 2013). From mid-April, it moved within a corridor of € 50 to € 60. The uncertainties of the solar dispute between the European Union and China were seen in the share price. In early June, the European Union imposed provisional import tariffs on Chinese solar products. At the end of the quarter, WACKER stock was quoted at € 57.82 (June 28, 2013).

47Wacker Chemie AGAnnual Report 2013
For Our ShareholdersWACKER Stock in 2013
The publication of WACKER’s first-quarter report on April 30, 2013 and the Annual Shareholders’ Meeting of May 8, 2013 had no immediately noticeable impact on the share price.
From July through September 2013, global financial markets saw bright spells and cloudy periods. Europe’s financial and sovereign-debt crisis became somewhat less acute in the eyes of many market participants. Moreover, the US Federal Reserve and European Central Bank decided to adhere to their low-interest-rate policies for the time being. Both these aspects helped provide some relief for stock markets. On the other hand, conflicts in Arab countries such as Syria and Egypt intensified the risks to the world economy. The long-running dispute over the US budget also affected capital markets.
At the start of the third quarter, WACKER’s share price was € 58.95. In the following weeks, positive news about the resolved solar dispute between Europe and China significantly buoyed the share price, which rose to € 78.92 (Aug. 23, 2013) – a level last reached in early 2012. For the rest of the quarter, it tended to move sideways at over € 70. WACKER stock closed September at € 72.95.
In the fourth quarter, too, financial markets were subject to fluctuating influences. The European Central Bank’s surprise decision to cut the base rate to its lowest-ever level since the ECB’s creation lifted European stock markets in early November. The ECB had set the base rate at 0.25 percent. Conversely, speculation about the US Federal Reserve scaling back its bond-buying program in response to an improving economy adversely affected capital markets. The European financial and sovereign-debt crisis did not play a major role in that quarter. The weakness of global economic growth and the usual seasonal effects at our chemical divisions amid slower construction-product demand during the winter months impacted WACKER’s business again last year. On December 6, representatives of the EU member states agreed in Brussels to extend the EU’s punitive tariffs on Chinese solar products by two years. Conversely, a negative impact resulted from the controversy about whether to exempt energy-intensive companies from the EEG levy and from power-grid charges. The agreement reached in the US budget dispute and the welcome news that the US Federal Reserve intended to somewhat tighten its ultra-easy monetary policy stimulated stock-market activity. WACKER’s share price benefited from positive signals about photo-voltaic-sector growth.
WACKER stock entered the final quarter at € 75.00 (closing price on Oct. 1, 2013), but then lost a little ground. This was due to the publication of the Q3 figures on October 31, 2013. Capital markets had expected earnings in particular to be higher. The share price fell back briefly to € 65.00 (Nov. 4, 2013). A renewed upturn was prompted by positive signals from the solar market due to high demand and by the trade-dispute settlement. WACKER stock climbed to € 80.10 on December 2, 2013, crossing the € 80 threshold for the first time since 2011. It reached its high of € 82.01 on December 27, 2013. Performing notably better than either the DAX or MDAX, the stock closed at € 80.38 on December 30, 2013.

48Wacker Chemie AGAnnual Report 2013
For Our ShareholdersWACKER Stock in 2013
Performance of WACKER Stock Compared with DAX and MDAXGermany’s DAX and MDAX equity indices gained 2 percent and 12 percent, respectively, in the first three months of 2013. WACKER stock increased by 12 percent during the same period. It started the year at € 50.86 (closing price on Jan. 2, 2013) and closed the first quarter at € 55.83. In the second quarter, the DAX grew by 2 percent and the MDAX by 3 percent. Over the same period, WACKER stock went up by 4 percent, climbing from € 55.83 (closing price on March 30, 2013) to € 57.82 (closing price on June 28, 2013). Germany’s DAX and MDAX developed very positively until the end of the third quarter. The DAX climbed about 8 percent from July through September to stand at over 8,500 points at the end of September 2013. During the same period, the MDAX gained 10 percent, moving from 13,800 points at the quarter’s start to 15,000 points at its close. WACKER’s share price clearly outperformed these indices, climbing by 26 percent. In early July, the stock entered Q3 at a price of € 57.82 (closing price on June 28, 2013) and ended the quarter at € 72.95 (closing price on Sept. 30, 2013). During the fourth quarter, the DAX and MDAX continued to perform positively. On October 29, the DAX crossed the 9,000-point threshold for the first time. The DAX and MDAX closed Q4 2013 with gains of 11 percent and 10 percent, respectively. For full-year 2013, the DAX rose 25 percent and the MDAX 39 percent. WACKER stock closed at € 80.38 on December 30, its value up 10 percent in the fourth quarter. Overall, the stock gained 62 percent last year.
WACKER Share Performance ( indexed to 100)1
180
160
140
120
100
80
Jan Feb Mar Apr May Jun Jul Aug Sep Oct Nov Dec
WACKER 1 DAX 30 MDAX 1 100 = € 49.65 (closing price on Dec. 28, 2012)
Facts & Figures on Wacker Chemie AG’s Stock
Year-high (on Dec. 27, 2013) 82.01
Year-low (on April 18, 2013) 50.66
Year-end closing price (on Dec. 28, 2012) 49.65
Year-end closing price (on Dec. 30, 2013) 80.38
Performance for the year (without dividend) (%) 61.9
Year-end market capitalization (shares outstanding; prior year: 2.5) (billion) 4.0
Average daily trading volume 1 (prior year: 15.9) (million) 12.2
Earnings per share (prior year: 2.27) 0.05
Dividend per share (proposal ) 0.50
Dividend yield 2 (%) 0.8
1 Trading platforms (Xetra, Chi-X and Turquoise)2 Dividend proposal based on an average share-price weighting of € 64.47 in 2013
G 1.1
T 1.2€

49Wacker Chemie AGAnnual Report 2013
For Our ShareholdersWACKER Stock in 2013
Earnings per Share of € 0.05Earnings per share (EPS) is calculated by dividing net income allocable to Wacker Chemie AG shareholders by the weighted average of all shares in circulation during the year. In 2013, the number of shares in circulation was 49,677,983. On this basis, the EPS is € 0.05.
Useful Information on WACKER Stock
ISIN DE000WCH8881
Ticker, security identification number (WKN) WCH888
Frankfurt Stock Exchange WCH
Bloomberg CHM / WCK.GR
Reuters CHE / WCHG.DE
Capital stock € 260,763,000
Number of shares (December 31, 2013) 52,152,600
Dividend Payment of € 0.60 per ShareThe Annual Shareholders’ Meeting of May 8, 2013, passed a resolution to pay out a dividend from the retained profit of € 654.3 million that was posted in 2012 (2011: € 978.7 million), setting the total dividend sum at € 29.8 million (2011: € 109.3 million). No allocations to retained earnings were made for 2012; instead, € 624.6 million was carried forward. The dividend per dividend-bearing share for 2012 was therefore € 0.60 (2011: € 2.20). The dividend was distributed to share-holders on May 9, 2013. At a volume-weighted average share price of € 60.28 in 2012 (2011: € 109.67), this produced a dividend yield of 1.0 percent.
Dividend Trends
€ 2012 2011 2010
Dividend 0.6 2.2 3.2
Plus special bonus per share _ _ _
Dividend yield (%) 1.0 2.0 2.8
Net result for the year (allocable to WACKER’s shareholders) (million) 112.8 352.6 490.7
Dividend payout (million) 29.8 109.3 159.0
Distribution ratio (%) 26.0 31.0 32.4
Structural Changes in Broker ReportingThe growing success of alternative trading platforms during 2013 saw a slight shift in trading volumes, particularly in favor of the Chi-X and Turquoise platforms. In total, Xetra accounted for a good three-quarters of trading in WACKER stock. In 2013, the average daily trading volume for WACKER stock was some 190,000 shares – more than 28 percent below the prior-year figure of around 263,000 shares. The number of financial analysts regularly covering and valuing the company decreased to 23 (2012: 24). Financial markets’ increasingly negative attitude toward solar-industry stocks prompted some banks to dissolve their teams of analysts covering companies in that area. During the year, analysts’ consensus price target for WACKER stock rose. In Q1, the average price target for WACKER stock was € 55.63 (16 esti-mates) 1. At year-end 2013, the analysts’ fair-value price target was higher, averaging € 65.40 (13 estimates) 1.
1 Consensus figures from VARA Research (Q1 = April 23, 2013 / Q3 = Nov. 26, 2013)
T 1.3
T 1.4

50Wacker Chemie AGAnnual Report 2013
For Our ShareholdersWACKER Stock in 2013
The Following Banks and Investment Firms Monitor and Assess WACKER
Bankhaus Lampe KG J. P. Morgan Cazenove Ltd.
Bank of America Merrill Lynch (UK ) Landesbank Baden-Württemberg
Citi Investment Research Macquarie Capital (Europe) Ltd.
Commerzbank Corporates & Markets MainFirst Bank AG
Credit Suisse Securities (Europe) Ltd. Metzler Equity Research
Deutsche Bank AG Morgan Stanley & Co. International Ltd.
DZ Bank AG Natureo Finance Investment Research
equinet Bank AG Nomura International Plc.
fairesearch GmbH & Co. KG Norddeutsche Landesbank Girozentrale
Hauck & Aufhäuser Institutional Research AG UBS Ltd.
HSBC Trinkaus & Burkhardt AG Wolfgang Steubing AG
Independent Research GmbH
As of the end of December 2013
On our website, we regularly report on the consensus of analysts’ expectations for the current year. Moreover, our website offers extensive information on WACKER stock. In addition to financial reports, a Fact Book, presentations and publications (viewable online or down-loadable), our website lists all our key financial-calendar dates, with contact information if you have any questions. Videos of our annual press conference and other events are also available for online viewing, or as an audio stream. Interested investors can additionally subscribe to an email newsletter to always stay informed about new developments in the Group. As we did last year, we are also offering an online version of our Annual Report for 2013. The easy-to-navigate online version facilitates access to the information. Moreover, its interactive options, such as key-indicator comparisons and a toolbox, enable readers to work directly with the figures.
Market Capitalization and GEX Weighting Higher (Weighting as per December 30, 2013)
WACKER’s year-end market capitalization increased from € 2.5 billion to € 4.0 billion (total stock without treasury shares) due to the Group’s share-price performance. In the MDAX, WACKER’s market capitalization based on the free float was € 1.2 billion (€ 744.6 million in 2012). Thus, WACKER received an MDAX weighting of 1 percent and currently ranks 18th (by 12-month trading volume) and 37th (by market capitalization) among the 50 companies listed there.
WACKER’s GEX weighting was 10.15 percent. Deutsche Börse AG’s GEX mid-cap index ( introduced in January 2005) comprises owner-dominated companies that are listed on the Frankfurt Stock Exchange (Prime Standard) and went public no longer than ten years ago. At year-end 2013, WACKER ranked 1st in the GEX weighting.
WACKER Communicates Closely with Capital MarketsOrganic growth and investment in promising markets are key elements of our corporate strategy. These priorities are reinforced through continuous and open communication with institutional and private investors and with analysts. In 2013, we presented our new equity story “WACKER – The Next Five Years.” It covers our business strategy, key financial indi cators and
T 1.5

51Wacker Chemie AGAnnual Report 2013
For Our ShareholdersWACKER Stock in 2013
medium-term goals through to 2017, and explains recent market developments. On many occasions, Executive Board members attended events in person to answer questions from capital-market participants. There were 18 roadshows with a total of 30 road show days in Germany, Europe, the USA and Asia. We also held about 300 meetings both in person and via telephone, as well as some 35 group discussions, and we participated in various international conferences. WACKER gave presentations, for example, at the following events:
Commerzbank: German Investment Seminar in New York Nomura Global Chemical Industry Leaders Conference in Venice Deutsche Bank: German, Swiss and Austrian Conference in Frankfurt Intersolar: Solar Trade Fair in Munich Commerzbank Sector Conference, Chemicals & Life Sciences in Frankfurt UBS: Best of Germany Conference in New York UniCredit /KeplerCheuvreux: 11th German Investment Conference 2013 in Munich Macquarie’s 6th Alternative Energy Conference in London Bank of America Merrill Lynch: European Chemicals Conference in London HSBC Luxembourg Conference in Luxembourg
On July 1, 2013, WACKER held its Capital Markets Day in London, at which the Exe cutive Board presented its medium-term goals for the company to analysts and investors. WACKER aims to increase its sales by some 6 percent annually – to between € 6.0 billion and € 6.5 billion – by 2017. The 2017 target for earnings before interest, taxes, depreciation and amortization (EBITDA) is around € 1.2 billion, with return on capital employed (ROCE) more than doubling to above 11 percent. Over 30 investors and analysts took part in the event.
Wacker Chemie AG maintained its dialogue with private investors during the past year, presenting the Group and its markets at various events. For example, we attended the shareholder forum organized by the DSW (German association of small investors) in Munich.
Shareholder StructureWacker Chemie AG’s largest shareholder is still Dr. Alexander Wacker Familiengesellschaft mbH, Munich. It holds over 50 percent of the voting shares in Wacker Chemie AG (2012: over 50 percent).
Blue Elephant Holding GmbH (Pöcking, Germany) once again had no voting-share changes to report in 2013. That means it still holds over 10 percent (2012: over 10 percent) of Wacker Chemie AG.
Free Float: UK Share Ownership IncreasesBased on our shareholder analysis 1 (Dec. 31, 2013), the number of shareholders in the USA increased further during the past year. In December 2012, the level of US-held shares was 20 percent. Now, a year later, it is 24 percent. The strongest growth recorded by WACKER was accounted for by UK shareholders. Their share of the free float more than doubled to 23 percent last year (2012: 11 percent). Conversely, share ownership in Germany declined to 15 percent (2012: 24 percent). The number of Swiss shareholders was practically steady at 7 percent (2012: 6 percent). The overall share of Canadian investors edged down to 11 percent (2012: 12 percent). Share ownership in Europe – excluding Germany, Switzerland and the UK – decreased by 6 percent to 19 percent.
1 Shareholder structure analysis, based on the free float of 28.75 % (= 100 %)

52Wacker Chemie AGAnnual Report 2013
For Our ShareholdersWACKER Stock in 2013
Short Positions in WACKER StockAt the end of 2013, short sales of Wacker Chemie AG’s stock amounting to 4.29 percent of the shares outstanding were reported as per Section 30h of the German Securities Trading Act (“WpHG”). The largest position amounted to 2.11 percent. Short positions exceeding 0.5 percent of the shares outstanding are published in Germany’s Federal Gazette.www.bundesanzeiger.de

Ma
na
ge
me
nt
Re
po
rtG
rou
p B
usi
ne
ss F
un
da
me
nta
ls
A Versatile Material
Silicone is a material with almost unlimited applications. Resistant to high or low temperatures, liquid or solid, electrically conductive or insulating – the properties of silicones can be customized to suit nearly every requirement.
Combined Management Report of the WACKER Group and of Wacker Chemie AGGroup Business Fundamentals
2

Ma
na
ge
me
nt
Re
po
rtG
rou
p B
usi
ne
ss F
un
da
me
nta
ls
55 Group Business Fundamentals
64 Goals and Strategies
66 Management Processes
72 Statutory Information on Takeovers
Combined Management Report of the WACKER Group and of Wacker Chemie AGGroup Business Fundamentals

55Wacker Chemie AGAnnual Report 2013
Combined Management Report
Group Business Fundamentals
Business Model of the Group
WACKER is a globally active company with state-of-the-art specialty chemical products. Our portfolio includes over 3,200 products supplied to more than 3,500 customers in over 100 countries. WACKER products are found in countless everyday items, ranging from cosmetic powders to solar cells.
Silicon Is Our Main Starting MaterialMost of our products are based on inorganic starting materials. Silicon-based products account for 80 percent of WACKER sales, and products that are primarily ethylene-related for 20 percent. Our customers come from virtually every major sector, ranging from consumer goods, food, pharmaceuticals, textiles and the solar, electrical /electronics and base-chemical industries, to medical technology, biotech and mechanical engineering. As a manufacturer of silicones and polymers, WACKER is particularly well represented in the automotive and construction sectors. We are also a key supplier of silicon wafers to the semiconductor industry. In recent years, we have greatly expanded our polycrystalline-silicon business for the solar industry, where WACKER is one of the world’s largest manufacturers.
Technical Competence Centers Support Sales and Marketing ActivitiesWACKER operates all over the world. Our sales strategy is centered around expanding our presence in growth markets. Our sales organization is supplemented not only by a network of technical competence centers, where customers learn about WACKER’s product portfolio, but also by the WACKER ACADEMY, where we offer technical training sessions on our products and their application fields. In 2013, we opened a new technical competence center for carpet applications in Mexico and Dalton (Georgia, USA). At the same time, we set up new WACKER ACADEMY branches there. We expanded our existing technical competence centers in São Paulo (Brazil ) and in Singapore. In total, WACKER has 52 sales offices in 28 countries.
New Dispersion Plants Come on Stream in China and South KoreaWACKER’s integrated global production system consists of 24 production sites (2012: 24). Of these, eight are in Europe, seven in the Americas and nine in Asia. The Group’s key production site is Burghausen (Germany), with some 9,700 employees ( incl. temporary workers and trainees). In 2013, Burghausen’s manufacturing output reached around 680,000 metric tons, accounting for over 50 percent of groupwide production output. Alongside Burghausen, Nünchritz is WACKER’s second multidivisional site. In 2013, we started up additional production capacities for vinyl acetate-ethylene copolymer (VAE) dispersions at Nanjing (China) and Ulsan (South Korea).

56Wacker Chemie AGAnnual Report 2013
Combined Management ReportGroup Business Fundamentals
WACKER’s Production and Sales Sites and Technical Competence Centers 1
Production site Sales site Technical competence center 1 Only majority-owned subsidiaries2 Consolidated as of 2014
G 2.1
Europe
20
21
22
23
24
25
26
27
28
29
30
31
32
North and South America 1 Adrian, Michigan, USA 2 Allentown, Pennsylvania, USA 3 Calvert City, Kentucky, USA 4 Chino, California, USA 5 Dalton, Georgia USA 6 Eddyville, Iowa, USA 7 North Canton, Ohio, USA 8 Portland, Oregon, USA 9 Mexico City, Mexico 10 Jandira, São Paulo, Brazil
Europe 11 Burghausen, Germany 12 Freiberg, Saxony, Germany 13 Jena, Germany 14 Cologne, Germany 15 Munich, Germany 16 Nünchritz, Germany 17 Stetten, Germany 18 Stuttgart, Germany 19 Halle 2 (Saale), Germany 20 Lyon, France
21 Chertsey, Great Britain 22 Milan, Italy 23 Krommenie, Netherlands 24 Kyrksæterøra, Holla, Norway 25 Warsaw, Poland 26 Moscow, Russia 27 Solna, Sweden 28 Barcelona, Spain 29 Plzeň, Czech Republic 30 Istanbul, Turkey 31 Kiev, Ukraine 32 Budapest, Hungary
Asia 33 Dhaka, Bangladesh 34 Beijing, China 35 Chengdu, China 36 Guangzhou, China 37 Hong Kong, China 38 Nanjing, China 39 Shanghai, China 40 Shunde, China 41 Wuxi, China
42 Zhangjiagang, China 43 Bangalore, India 44 Chennai, India 45 Kolkata, India 46 Mumbai, India 47 New Delhi, India 48 Jakarta, Indonesia 49 Tsukuba (Akeno), Japan 50 Osaka, Japan 51 Tokyo, Japan 52 Singapore, Singapore 53 Jincheon, South Korea 54 Seoul, South Korea 55 Ulsan, South Korea 56 Hsinchu, Taiwan 57 Taipei, Taiwan 58 Bangkok, Thailand 59 Dubai, United Arab Emirates 60 Ho Chi Minh City, Vietnam
Australia 61 Melbourne, Victoria, Australia
Germany
11
121613
1914
15
17
18
123
33
34
3536 3740
4142
3839
4346
47
48
60
61
4950
51
535455
5657
5859
52
44
45
4
6
7
8
9
10
5

57Wacker Chemie AGAnnual Report 2013
Combined Management ReportGroup Business Fundamentals
Key Factors for Multidivisional Sites
Legal Structure
Our legal structure has not changed compared with the previous year. In November 2005, WACKER became a stock corporation (AG) under German law. Headquartered in Munich, Wacker Chemie AG holds a direct or indirect stake in 55 companies belonging to the WACKER Group. Our financial statements include 50 companies that have been fully consolidated and four accounted for using the equity method. One small company that is not part of our core operations has not been consolidated.
Five Operating DivisionsWACKER is based on a matrix organization with clearly defined functions. The Group has five business divisions, which have global responsibility for their own products, manufacturing facilities, markets, customers and results. Regional organizations are responsible for all business in their countries. WACKER’s corporate departments primarily provide services for the whole Group, although some also have production-related functions.
WACKER’s Structure
Group Structure in Terms of Managerial Responsibility
G 2.2
Areas on site available
for expansion
Long-term supplier relations
Qualified employees from
local area
Integrated production
system
Burghausen Nünchritz
WACKER Group
Captive energy supply
G 2.3
Business divisions
WACKER BIOSOLUTIONS
WACKER POLYMERS
WACKER SILICONES
WACKER POLYSILICON
SILTRONIC
Corporate departments
WACKER Group
G 2.4
Executive Board
Managerial ResponsibilityStructure based on decision-making responsibility and reporting lines
Corporate departmentsBusiness divisions Regions Group coordinators

58Wacker Chemie AGAnnual Report 2013
Combined Management ReportGroup Business Fundamentals
Management and Supervision
In compliance with the German Stock Corporation Act (AktG), Wacker Chemie AG has a two-tier management system, comprising the Executive Board and Supervisory Board. Wacker Chemie AG’s Executive Board consists of four members. Wacker Chemie AG is the parent company and thus determines the Group’s strategy, overall management, resource allocation, funding, and communications with key target groups (especially with the capital market and shareholders).
Executive Board Responsibilities
(until Dec. 31, 2012) (since January 1, 2013)
Dr. Rudolf Staudigl
President & CEO
SILTRONICExecutive Personnel, Corporate Development, Corporate Communications, Investor Relations, Corporate Auditing, Legal & Insurance, Compliance
President & CEO
WACKER POLYSILICONExecutive Personnel, Corporate Development, Corporate Communications, Investor Relations, Corporate Auditing, Legal, Compliance
Dr. Tobias Ohler
WACKER POLYMERSHuman Resources, Technical Procurement & Logistics, Raw Materials Procurement Region: Asia
Dr. Joachim Rauhut
WACKER POLYSILICONCorporate Accounting, Corporate Controlling, Corporate Finance, Information Technology, Raw Materials Procurement, Technical Procurement & Logistics, Tax Region: The Americas
SILTRONICCorporate Accounting and Tax, Corporate Controlling, Corporate Finance and Insurance, Corporate Engineering, Information Technology Region: The Americas
Dr. Wilhelm Sittenthaler*
WACKER SILICONESHuman Resources (Personnel Director), Corporate Research & Development, Intellectual Property Region: Asia
Auguste Willems
WACKER POLYMERS WACKER BIOSOLUTIONSCorporate Engineering, Sales & Distribution, Corporate Security, Site Management; Environment, Health, Safety; Product Stewardship Regions: Europe, Middle East
WACKER SILICONES WACKER BIOSOLUTIONSSales & Distribution, Corporate Research & Development, Intellectual Property, Site Management, Corporate Security; Environment, Health, Safety; Product Stewardship Regions: Europe, Middle East
* Dr. Wilhelm Sittenthaler left the Executive Board on December 31, 2012.
Changes in the Executive Board and Supervisory Board in 2013The Executive Board welcomed a new member in 2013. Dr. Tobias Ohler was appointed as a member of the Executive Board, effective January 1, 2013. He succeeded Dr. Wilhelm Sittenthaler, who resigned on December 31, 2012. The change in the Executive Board also led to a reorganization of responsibilities. At the Annual Shareholders’ Meeting in Munich on May 8, 2013, new elections were held of shareholder representatives to the Wacker Chemie AG Supervisory Board. The Shareholders’ Meeting elected Dr. Gregor Biebl as the new shareholder representative to replace Dr. Werner Biebl. All other Supervisory Board shareholder representatives were re-elected. The Supervisory Board re-appointed Dr. Peter-Alexander Wacker as its chairman at its constituent session, held directly after the
T 2.5

59Wacker Chemie AGAnnual Report 2013
Combined Management ReportGroup Business Fundamentals
Annual Shareholders’ Meeting. The employee representatives had already been determined prior to the Shareholders’ Meeting by the employees and management staff of Wacker Chemie AG. Dagmar Burghart was elected as employee representative for the Supervisory Board, replacing Marko Fartelj.
Declaration on Corporate ManagementSubmitted as per Section 289a of the German Commercial Code (HGB), the declaration on corporate management is included in the corporate governance report. This declaration is also part of the combined management report and is available online. It contains the Executive and Supervisory Boards’ work procedures, the declaration of conformity pursuant to Section 161 of the German Stock Corporation Act (AktG), and information on key corporate management practices. www.wacker.com /corporategovernance
Executive and Supervisory Board CompensationExecutive Board compensation contains both fixed and variable components. The main features of the compensation system for the Executive Board and Supervisory Board are described in the compensation report contained in the corporate governance report. The compensation report is also part of the combined management report.
Key Products, Services and Business Processes
Our divisions’ overall range of products and services remained unchanged in 2013. In several application areas, we expanded our product portfolio. Our WACKER SILICONES division provides customers with our broadest offering of over 2,800 products – ranging from silicone fluids and emulsions, resins, elastomers and sealants, to silanes and pyrogenic silica grades. The division manufactures both specialty products tailored to customers’ specific needs, and standard products primarily used as starting materials in the production of silicones.
WACKER POLYMERS manufactures state-of-the-art binders and polymeric additives (such as dispersible polymer powders and dispersions). These are used in diverse industrial applications or as base chemicals. Customers include the paints, coatings, paper and adhesives industries. The main customer for polymeric binders is the construction industry, which uses them as additives in tile adhesives, dry-mix mortars, self-leveling flooring compounds, and EIFS (exterior insulation and finish systems) /ETICS (external thermal insulation composite systems).
WACKER BIOSOLUTIONS, our smallest division, supplies customized biotech and catalog products for the fine-chemical sector. Products include pharmaceutical proteins, cyclodextrins, cysteine, polyvinyl acetate solid resins (for gumbase), organic intermediates and acetylacetone. The division focuses on customer-specific solutions for growth areas, such as food additives, pharmaceutical actives and agrochemicals.
WACKER POLYSILICON produces hyperpure polysilicon for the semiconductor, electronics and – above all – solar sectors. Most of this polysilicon is sent to external customers. Internally, we supply both Siltronic and its Siltronic Samsung Wafer joint venture.
Siltronic supplies leading semiconductor manufacturers with silicon wafers. These wafers are the essential raw materials for virtually all semiconductor products – whether for discrete semiconductor components (e.g. transistors and rectifiers) or microchips (e.g. micro processors and memory chips).

60Wacker Chemie AGAnnual Report 2013
Combined Management ReportGroup Business Fundamentals
Integrated Production System – WACKER’s Main StrengthThe WACKER Group’s key competitive advantages include the highly integrated material loops at its major sites in Burghausen, Nünchritz and Zhangjiagang. The basic principle of integrated production is the use of the byproducts from one stage as starting materials for making other products. Auxiliaries required for this process, such as silanes, are recycled in a closed loop and waste heat from one process is utilized in other chemical processes. The result is lower specific production costs compared to open production processes. At the same time, integrated production cuts energy and resource consumption, improves the use of raw materials in the long term, and integrates environmental protection into our processes. WACKER’s integrated production sites also provide other benefits, including outstanding infrastructure, well-trained personnel, and reliable raw-material and energy supplies.
Major Markets and Competitive Positions
In its four strongest sales-generating divisions, WACKER ranks among the world’s top three suppliers. In 2013, WACKER was the world’s leading producer of hyperpure polycrystalline silicon for electronics and solar applications. We are also the global market leader for several other products, such as VINNAPAS® dispersible polymer powders for the construction industry. Asia is the key sales region for our products, followed by Europe ( including Germany) and the Americas.
Market Positions of WACKER’s DivisionsWACKER SILICONES ranks a strong number 2 in the silicones market, with a leading market position in Europe. We are the global market leader for building-protection silicones. Due to their wide-ranging product properties, silicones are used in every major industry. The largest growth potential lies in Asia, where ever-higher living standards are boosting demand for silicone products.
WACKER POLYMERS is the world’s largest producer of dispersions and dispersible polymer powders based on vinyl acetate-ethylene. Importantly, we are the only company in the market to have a complete supply chain for dispersions and powders in Europe, the Americas and Asia. In this market, too, we see the largest potential for growth in Asia. WACKER POLYMERS supplies not only the construction industry, but also the textile, adhesive, paint, surface-coating and carpet sectors.
WACKER’s Competitive Positions
Number 1 Number 2 Number 3
WACKER SILICONES Dow Corning WACKER /Momentive Shin-Etsu
WACKER POLYMERS
WACKER (dispersible polymer powders /VAE dispersions)
Akzo Nobel (Elotex) (dispersible polymer powders) /Celanese (dispersions)
Dairen (dispersible polymer powders /dispersions)
WACKER POLYSILICON WACKER /GCL-Poly OCI Hemlock
SILTRONIC Shin-Etsu Sumco SILTRONIC
T 2.6

61Wacker Chemie AGAnnual Report 2013
Combined Management ReportGroup Business Fundamentals
WACKER BIOSOLUTIONS is the global market leader in cyclodextrins and cysteine, and in polyvinyl acetate solid resins for gumbase. In the field of bacterial pharmaceutical protein production, we hold small, but promising market positions, which we continue to expand.
WACKER POLYSILICON operates in an intensely competitive and high volume-growth environment, chiefly shaped by solar-industry demand for polysilicon and market trends in the global solar sector. Our production capacity was 52,000 metric tons in 2013.
Siltronic is the world’s third-largest manufacturer of silicon wafers and other products for the semiconductor industry. Its customers include all the major global semiconductor companies, which account for over 80 percent of our sales in this segment.
Economic and Legal Factors
WACKER sells its products and services to virtually every industry. Although economic fluctuations cannot be avoided in individual business divisions, their impact and onset may vary greatly. We are, however, able to mitigate the impact of these fluctuations thanks to our product portfolio and broad customer base.
OrdersThe terms for orders placed with WACKER vary from division to division. Most orders received by WACKER SILICONES are short-term, with a small number of long-term orders. Delivery is usually effected within three months of receipt of order. At WACKER POLYMERS, business is based on contracts and master agreements with terms of up to one year. Around 30 percent of incoming orders are short term. WACKER POLYSILICON’s contracts are short, medium or long term. In certain instances, they include flexible volume-specific escalator clauses. The spot market business plays only a limited role. Siltronic usually negotiates orders with the customer from one quarter to the next. As a rule, we aim for fixed contracts with negotiated prices and quantities. Due to varying order-placement procedures at the Group and its divisions, order-level reporting is not very meaningful and hence does not serve as an indicator in our monthly reports.
Operational Metrics as Leading Indicators of Future DevelopmentsBy referring to specific leading indicators based on operational metrics, we try to include potential developments in our business plans and to allocate capacities accordingly. Since our operations are based on diverse businesses and markets, we consult a number of leading indicators to gain insights into potential developments at each of our business divisions. As many of WACKER’s products are destined for the construction industry, we deploy various analytical tools in order to assess potential future growth in this segment. These tools include WACKER market research, regular customer talks, forecasts by Global Insight and Euroconstruct, and studies of our key national markets.

62Wacker Chemie AGAnnual Report 2013
Combined Management ReportGroup Business Fundamentals
Leading Operational Indicators
Business Division Leading Operational Indicator Indicator of:
WACKER SILICONES WACKER POLYMERS WACKER BIOSOLUTIONS
Raw-material and energy price trends
Our cost trends
WACKER SILICONES Orders received per month Our capacity utilization
WACKER POLYSILICON
Medium- and long-term contracts
Market research, customer talks
Our capacity utilization, other market trends
Increase in solar capacity by country, our capacity utilization
SILTRONIC Data on chipmakers’ capacity utilization
Our capacity utilization
Every business division
Customer talks Market research
Our sales trend, our product quality, market trends
Market trends, product innovations
Economic Factors Impacting Our BusinessThe main economic factors influencing WACKER’s business remain unchanged in many sectors. Energy and raw-material costs, at around 40 percent of production costs, had the largest impact in 2013.
Energy and rawmaterial costsAs a chemical company, we belong to an energy-intensive industry and require diverse raw materials to manufacture our products. Consequently, higher energy and raw-material costs impact our cost structure. WACKER is taking steps to become more independent of this factor. By generating our own power at Burghausen and Nünchritz, we are reducing our energy-procurement needs and thereby the cost risk. Regulatory requirements or additional expenses, such as electricity tax or levies relating to the German Renewable Energy Act (EEG), can affect WACKER’s energy costs both directly and indirectly – for example, through higher grid fees, which lead to increased operating costs for grid operators. Conversely, cost reductions in connection with the EEG levy can positively influence energy costs. Our ongoing efforts to improve our energy efficiency include the POWER PLUS program, which aims to reduce specific energy consumption by 11 percent by 2022. When procuring raw materials, we increase price flexibility by concluding new contracts with shorter terms, with more scope regarding volumes or with regular price adjustments that reflect wholesale market prices.
Exchangerate fluctuationsThe weak Japanese yen against the euro has had a negative impact on Siltronic’s business. As a rule, WACKER hedges against exchange-rate fluctuations. We use currency hedging (derivatives) to secure at least half of our dollar exposures for each subsequent year. The hedging ratio for 2013 was around 50 percent. In determining sensitivity, we simulate a 10-percent devaluation of the US dollar against the euro. Without hedging, an increase in the euro against the US dollar would have negatively impacted EBITDA by € –59 million.
Stateregulated incentive and feedin tariff programs for renewable energy sourcesAs one of the world’s leading suppliers of hyperpure polycrystalline silicon, we are affected by regulatory changes to incentive and feed-in tariff programs for renewable energy sources. Due to the price decline for solar modules and cells, solar energy has greatly increased its competitive advantage over fossil fuels and other forms of energy generation. As a result, the solar market’s continued growth has become more independent of state-
T 2.7

63Wacker Chemie AGAnnual Report 2013
Combined Management ReportGroup Business Fundamentals
regulated incentive and tariff programs. At the same time, WACKER has kept its focus on improving productivity in order to maintain its competitive position. Our cost leadership, product quality, international orientation, customer structure and our medium- to long-term supplier contracts all offer us competitive advantages over other producers.
Legal Factors Impacting Our BusinessIn 2013, the most negative impact facing WACKER’s future operations resulted from anti-dumping proceedings instigated both by the European Union against Chinese solar companies and by the Chinese Ministry of Commerce against polysilicon manufacturers in the USA, South Korea and Europe. In late July 2013, China and the EU reached an agreement, setting a minimum price of 56 cents per watt for Chinese solar cells imported into the EU and limiting Chinese solar-panel imports into the EU to 7 gigawatts (GW) per year. The European Commission confirmed this agreement, as final, on December 6, 2013. Chinese solar cell exporters not complying with the agreed minimum prices will face punitive tariffs averaging 47.7 percent.
In January 2014 the Chinese Ministry of Commerce imposed temporary punitive tariffs on European polysilicone producers, which however have been suspended. A final decision on whether punitive tariffs will be imposed at all is still pending. WACKER rejects all forms of restraints on trade.
155 Registration Dossiers Submitted as Part of REACHAccording to the EU chemicals regulation REACH (Registration, Evaluation and Authorization of Chemicals in the European Union), we are obligated to register and classify by property all substances exceeding an annual amount of one metric ton. By late 2013, WACKER had submitted 155 registration dossiers to the European Chemicals Agency (ECHA). This includes 67 registration dossiers for substances between 100 and 1,000 metric tons a year, the registration deadline of which expired on May 31, 2013. As part of the normal REACH pro-cedure, the ECHA still requires companies to provide additional information on dossiers submitted during the first phase (2010), which we complied with in 2013. By the end of 2013, together with the EU members’ regulatory bodies, the ECHA had identified 151 substances of very high concern for people and the environment as candidates for authorization. WACKER has been only marginally affected to date, with only a few purchased substances, and none of its own. As part of the EU Commission’s GHS (Globally Harmonized System of Classification and Labeling of Chemicals), all mixtures will have been reclassified pursuant to EU-GHS (7,000 mixtures) by 2015. A central register for hazardous substances has been set up at the ECHA. We had already registered all relevant substances in 2011.
The ICCA (International Council of Chemical Associations) has developed the Global Product Strategy (GPS), which governs how to assess the properties of chemicals and how to provide information on their safe use. In Europe, most GPS requirements are satisfied by REACH and by CLP (Classification, Labeling and Packaging of Substances and Mixtures). Manufacturers are required to publish descriptions written in layman’s terms on the safe and environmentally sound use of chemicals (Safety Summaries). By the end of 2013, we had published 59 Safety Summaries on the ICC chemicals website for the substances we have registered with the European Chemicals Agency (ECHA).

64Wacker Chemie AGAnnual Report 2013
Combined Management Report
Goals and Strategies
Strategy of the WACKER GroupOur vision, which was refined in 2011, and our five strategic goals remain in place. Taken as a whole, they form our strategy’s foundation and express our performance aspirations. Our strategy is focused on profitable growth and securing a leading competitive position in most of our business fields, and our actions are oriented to sustainable development. The five strategic goals are described at www.wacker.com
Between 2005 and 2012, WACKER invested considerable capital in expanding its global production capacities – especially at large plants for upstream products – in order to secure further growth and enhance its global presence. These investments are nearly complete. In 2013, we introduced the next strategic phase. Our strategic focus for the next five years is on improving profitability and posting positive net cash flow. This strategy is supported by a stringent cost-monitoring program at every business division. In 2013 alone, WACKER achieved cost savings of € 225 million, attributable to the positive impact from increased production volumes. As in 2013, capital expenditures for the coming four years will remain at or below the amount of depreciation. The investment focus is shifting toward facilities for manufacturing downstream products. On the product side, we have intensified our efforts to expand our market share for high-end products in the areas of health, personal care, medicine, electronics, automotive engineering and energy. We presented our strategic goals for the next four years at the Capital Markets Day in London on July 1, 2013.
Our strategic goals are oriented toward the highly promising fields of energy, urbanization and construction, digitization, and rising affluence in emerging countries. WACKER offers products that satisfy these global trends.
WACKER’s MediumTerm Targets through 2017
Targets for 2017
Sales € 6 billion to € 6.5 billion
EBITDA € 1.2 billion
EBITDA margin Approx. 20 percent
ROCE Over 11 percent
Investments At the level of or below depreciation
T 2.8

65Wacker Chemie AGAnnual Report 2013
Combined Management ReportGoals and Strategies
Strategy at Each Business DivisionWACKER SILICONES
In 2013, we refined our strategy at WACKER SILICONES. To spur silicone business in Asia, WACKER is expanding its operations and marketing presence there. Five new teams have been active in the region since March 2013. They are geared to providing customer support locally from WACKER sites in Singapore, Mumbai ( India), Jincheon (South Korea) and Shanghai (China). The regional teams are supported by business- and product-development experts, who are active globally. These experts coordinate cross-regional marketing strategies and product portfolios. Additionally, they are responsible for reinforcing local knowledge transfer and expertise growth. New products are expected to account for an increasing share of sales in the coming years. So, we have set our research priorities accordingly and realigned our innovation portfolio. We intend to add even more value while maintaining current raw-material consumption levels. Strong utilization of our production capacity is an important factor in keeping our specific production costs as low as possible. We have established differentiated marketing strategies for selling standard and specialty products.
WACKER POLYMERSWACKER POLYMERS continues to firmly pursue its strategy of profitable growth in dispersions and dispersible polymer powders. The key is to develop regional production capacities for dispersions and polymer powders so that local and regional customer demand can be met both promptly and cost-effectively. To this end, it is important to develop product solutions that are specifically tailored to local application requirements. WACKER systematically continued this approach in 2013. In Asia, we started up additional production capacities in Nanjing (China) and Ulsan (South Korea). An important aspect of our strategy is to develop new applications for our products, including improving their properties to replace other products.
WACKER BIOSOLUTIONSWACKER BIOSOLUTIONS continues to concentrate on the pharmaceutical, agrochemical and food industries. We increasingly draw on chemical-biotech synergies to provide our customers with complete solutions for their specific market needs. The success of our products in the industries we serve is based on a strong customer focus. Consequently, the division’s organizational structure is firmly oriented to customers and markets. WACKER BIOSOLUTIONS will focus even more on innovation to achieve future growth in sales. The acquisition of Scil Proteins Production in 2014 is a step toward strengthening WACKER BIOSOLUTIONS’ business in pharmaceutical proteins.
WACKER POLYSILICONWACKER POLYSILICON’s strategic aims are to maintain its quality and cost leadership as a hyperpure-polysilicon manufacturer, and to expand its production capacities in line with market growth. In a competitive environment, the division’s cost position is a key success factor. For this reason, our focus remains on reducing costs through productivity improvements and on optimizing our supplier base.
SILTRONICAt Siltronic, there are four coordinated strategic priorities. By concentrating on lead sites, we are enhancing capacity utilization and cost structures. With regard to individual wafer diameters, our focus is on 300 mm silicon wafers in Asia, where growth is strongest. One ongoing strategic task is to implement productivity, cost-saving and flexibility initiatives to improve production processes and workflows. Investments in product developments are aimed at fulfilling the latest design-rule specifications and implementing quality-enhancing measures. Investments are lower than the amount of depreciation. Siltronic is no longer working on 450 mm technology.

66Wacker Chemie AGAnnual Report 2013
Combined Management Report
Management Processes
Value-Based Management Is an Integral Part of Our Corporate Policies
Value-based management is an integral part of our corporate policies for sustainably increasing our company’s value in the long term. In our management processes, we distinguish between performance and budget parameters. Performance parameters serve the financial management of the company. Performance parameters include the EBITDA margin and ROCE. The EBITDA margin indicates how successful the company is compared with the competition, while ROCE shows how successfully the company employs its capital. Further, EBITDA and net cash flow are budget parameters used for control purposes. In addition to these indicators, BVC (business value contribution) is included as a pure budget parameter in calculating the variable compensation for Executive Board members and senior managers at our divisions and corporate departments.
In this context, value management and strategic planning complement each other. Consequently, we align the strategic positioning of a business entity with its contribution to increasing the company’s value. As part of annual planning, we make fundamental decisions on capital expenditure and innovation plans, on harnessing new markets and on a variety of other projects.
The management decision-making process makes active use of key financial performance indicators. For example, lower-than-expected net cash flow could result in adjusting our investments during the year. Being highly flexible, WACKER can react to both positive and negative changes, as seen in the extension of the Tennessee project’s timeline. This decision supported our 2013 cash flow by several hundred million euros.
The EBITDA trend is perceived as the most important financial indicator for communication with capital markets.
Key Financial Performance Indicators for the WACKER GroupIn 2013, we continued to use the same key financial performance indicators for value management as in previous years. Value management is based on the following key performance indicators:
EBITDA margin (EBITDA in relation to sales). We compare historical performance with planned performance and the competition, and use the result to calculate a target EBITDA margin. For the Group, we take the weighted divisional average as our target margin.
ROCE or return on capital employed is a measure of the efficient use of capital. ROCE is defined as earnings before interest and taxes (EBIT ) divided by capital employed. Capital employed comprises noncurrent assets and net current assets. ROCE makes clear how profitably the capital required for business operations is being employed. ROCE is influ-enced not only by profitability, but also by capital intensity with regard to noncurrent and net current assets. ROCE is reviewed annually as part of our planning process and is a key criterion for managing our capital expenditure budget.

67Wacker Chemie AGAnnual Report 2013
Combined Management ReportManagement Processes
EBITDA (earnings before interest, taxes, depreciation and amortization). Our goal is to achieve a high level of profitability, and the benchmark for this is EBITDA. This demonstrates the operative performance capability of the company before cost of capital. We set absolute EBITDA targets for the business divisions. By using BVC to determine the internal budget target, we take the cost of capital into account. EBITDA is the starting point for calculating BVC. We calculate BVC by deducting the cost of capital, non-operational factors, and depre-ciation and amortization from EBITDA. We call earnings after cost of capital business value contribution (BVC). The development of BVC is mainly related to changes in EBITDA. Changes in the cost of capital and in depreciation and amortization have only a marginal effect on BVC.
Net cash flow (defined as the sum of cash flow from operating activities and long-term investing activities, before securities, including additions from finance leases less the change in advance payments received). Net cash flow shows whether we can finance ongoing operations and the necessary investments from our own operating activities. WACKER’s aim is to generate sustainably positive net cash flow. Apart from profitability, the main factors affecting net cash flow are the effective management of net current assets and the level of capital expenditures.
Supplementary Financial Performance IndicatorsOur key financial performance indicators are supplemented by additional performance indicators that provide us with information on the Group’s sales and liquidity situation and debt levels.
These supplementary financial performance indicators include:
Sales. Profitable growth is an important factor in increasing the company’s value over the long term and one of the main drivers of a positive cash flow trend.
Investments. As our business is capital intensive, managing capital expenditures is of crucial importance. In the course of our medium-term planning, we determine the focus of our capital expenditures and the corresponding budget. Investments of overriding importance for the company are decided on by the Executive Board on the basis of the Group’s strategy. The individual business divisions are responsible for additional capital expenditures. The focus here is generally on expansion and extension projects with a low specific level of investment and projects targeting the expansion of capacity for downstream products that add value. To this end, the individual business divisions regularly analyze their capacity utilization and anticipated capacity requirements. Both these factors are essential in determining capital-expenditure requirements. The respective business divisions and WACKER’s Corporate Engineering are responsible for the operational management of the individual investment projects ( i.e. for handling, deadlines, budgets, quality, safety). Both current and planned capital expenditures are managed flexibly and aligned with developments in the respective markets. This ensures that, if required, we can make ad hoc adjustments to our investment budget throughout the year. To this end, all capital-expenditure projects are regularly consolidated and analyzed at Group level.

68Wacker Chemie AGAnnual Report 2013
Combined Management ReportManagement Processes
Net financial debt. Net financial debt is a supplementary performance indicator that we use to monitor WACKER’s financial situation. We define it as the sum of cash and cash equivalents, noncurrent and current securities, and noncurrent and current financial liabilities. Net financial debt is also an important factor in our financing activities. The financing instruments used by WACKER contain standard market credit terms and a net debt-to-EBITDA ratio as the only financial covenant. By monitoring and managing our net financial debt, we ensure that it remains within the limits set by the net debit-to-EBITDA financial covenant ratio agreed with our creditors.
NonFinancial Performance IndicatorsNone of the non-financial performance indicators, which we describe in detail in the Annual Report, is used by us across the board for corporate decision-making, although certain indicators, such as the accident rate, are important in some parts of the company. The following table shows which non-financial performance indicators are used in individual parts of the company.
NonFinancial Performance Indicators Used for DecisionMaking in Parts of the Company
Non-Financial Performance Indicators Indicator for
Number of employees Corporate departments /production
Order intake Business divisions
New -product rate Business divisions
Electricity /energy consumption Business divisions /sites
Production utilization Business divisions /sites
Key environmental indicators Business divisions /sites
Accident rate Business divisions /sites
Development of Key Financial Performance Indicators in 2013EBITDA margin: In 2013, the target margin was 20 percent. The Group actually posted an EBITDA margin of 15.2 percent for 2013. Continuing pressure on prices and negative exchange- rate effects were the principal reasons for not achieving our target. Our programs for reducing production costs had a positive impact on the EBITDA margin.
ROCE: WACKER achieved ROCE of 2.2 percent in 2013. The decline in ROCE was mainly due to weaker profitability.
EBITDA: We were expecting EBITDA for 2013 to be below the 2012 figure. At € 678.7 million, it was € 116.7 million below the previous year. The primary reasons were lower prices for polysilicon in the first nine months of 2013 compared with the previous year, and the persistent pressure on silicon-wafer prices, which had a negative impact on EBITDA. In 2013, the cost of capital was 11 percent, and we did not meet our BVC target at Group level. At € –478.6 million, the actual BVC was clearly negative.
T 2.9

69Wacker Chemie AGAnnual Report 2013
Combined Management ReportManagement Processes
Planned and Actual Figures
€ million 2012 Forecast 2013
Actual 2013
EBITDA margin (%) 17.2 14.3 15.2
ROCE (%) 5.2 2.7 2.2
EBITDA 795.4 below
prior year 678.7
Net cash flow –536.2 –55.0 109.7
Net cash flow: Our 2013 forecast for net cash flow was in negative territory because our investment level was still high. We clearly surpassed this target. By lowering our capital expenditures and imposing strict inventory management, we posted a positive net cash flow of € 109.7 million.
ROCE and BVC
€ million 2013 2012*
EBIT 114.3 258.0
Capital employed 1 5,238 4,979
ROCE 2 (%) 2.2 5.2
Pre-tax cost of capital (%) 10.8 12.1
BVC 3 –478.6 –366.0
1 Capital employed is made up of average noncurrent fixed assets ( less noncurrent securities) plus inventories, and trade receivables less trade payables. It is a variable used in calculating the cost of capital.
2 Return on capital employed is the profitability ratio relating to the capital employed.3 BVC is calculated by correcting EBIT for non-operational factors.
* Not adjusted for IAS 19 (revised)
TwoStage Strategic PlanningStrategic planning determines how we can meet value-related and corporate goals. It is conducted in two stages. First, our divisions identify their market and competitive positions, and their value-related strength. We then use these results to formulate recommendations regarding strategic positioning and planned steps. This input is consolidated at Group level and specific goals are set. All of this is supplemented by innovation and investment projects, and approved by the Strategy Conference.
Subsequently, strategic-planning decisions are included in operational planning, which takes place in the second half of the year. The Executive and Supervisory Boards jointly approve the annual plan. On that basis, fundamental forecasts are then fixed in early February for the current year. We monitor whether we are meeting our forecasts via monthly comparisons of planned and actual figures. The overarching framework is based on a medium-term plan spanning five years.
T 2.10
T 2.11

70Wacker Chemie AGAnnual Report 2013
Combined Management ReportManagement Processes
Strategic and Operational Planning
Financing StrategyThe goal of WACKER’s financing strategy is to ensure sustainable growth and stability for the Group. This strategy comprises both financing through our own resources and the use of debt instruments.
We satisfy our capital requirements with operating cash flow, and short-term and long-term financing.
We ensure the Group’s permanent solvency via rolling cash-flow management, and adequate credit lines guaranteed in writing. Financing requirements are calculated for the entire Group, with funding usually being granted at Group level. Project-specific or regional funding is available in special cases.
Financing Measures in 2013The Group took several financing measures in 2013. Due to them, the Group has covered its financing requirements for the coming years, gained new lenders and optimized the maturity schedule and term structure of its borrowings. In April 2013, Wacker Chemical Corporation (Adrian, Michigan, USA) sold securities in a private placement in the USA for a total amount of US$ 400 million, guaranteed by Wacker Chemie AG. Repayment is divided into installments of five years (US$ 70 million), seven years (US$ 130 million) and 10 years (US$ 200 million), each at a fixed interest rate. The liquidity inflow occurred on April 23, 2013. This was WACKER’s first private placement in the USA. In June 2013, Wacker Chemie AG took out a fixed-rate loan for € 50 million (five-year maturity) with LfA Förderbank Bayern, a development bank for Bavarian companies. This loan replaced one for the same amount that fell due in June 2013.
G 2.12
Planning Conference
Approval of operational planning (by Supervisory Board)
Approval of strategy
Implementation of strategy in operational planning
Use of operational planning as a basis for strategic planning ( incl. the latest actual and RF figures)
Defining forecasts for current year
Strategy Conference
Bu
sin
ess
plan
ning
Strategic planning
Jan Feb Mar A
pr M
ay Jun Jul A
ug
Sep
Oct
Nov Dec

71Wacker Chemie AGAnnual Report 2013
Combined Management ReportManagement Processes
Financing Measures in 2013
Volume Term until
US private placement in three installments US$ 400 million 2018 –2023
LfA Förderbank Bayern € 50 million 2018
European Investment Bank € 80 million 2020
Not all of the loans have been utilized.
Wacker Chemie AG also took out a loan for € 80 million with the European Investment Bank in July 2013 to finance research and development costs at Siltronic. This loan can be drawn in four installments and matures in six years. The maturity period commences when the first installment is drawn.
For all the loans that we negotiate, we structure the agreements carefully to ensure that the financial partners are treated equally (pari passu) and that the agreements can subsequently be monitored groupwide. WACKER pledged its investment in a joint venture to cover that company's financial liabilities. Some of the liabilities to banks are fixed-interest while others have variable interest rates. As of December 31, 2013, WACKER had unused credit lines of around € 700 million with terms of over one year. The measures concluded contain standard market credit terms and a net debt-to-EBITDA ratio as the only financial covenant.
WACKER collaborates with a number of banks (core-bank principle), who must have an investment-grade credit rating and a long-term business model. To minimize counterparty and concentration risks, no one bank’s share in credit lines committed to WACKER must exceed 20 percent. The only exception is the European Investment Bank.
Operational Control InstrumentsWe control operational processes via our integrated management system ( IMS). It stipulates uniform standards throughout the Group for issues relating to quality, environmental protection, health and safety. We have our Group management system analyzed by an international certification organization in accordance with uniform standards based on ISO 9001 (quality) and ISO 14001 (environment). In 2013, we expanded our Group certification to include our South Korean site in Jincheon (certified to ISO 9001 and ISO 14001) and other sales regions (certified to ISO 9001). At Siltronic, every site is certified to ISO /TS 16949, to ISO 14001 and to OHSAS 18001 (occupational safety), due to this subsidiary’s specific processes and customer requirements.
T 2.13

72Wacker Chemie AGAnnual Report 2013
Combined Management Report
Statutory Information on Takeovers
Statutory Information on Takeovers
The following table contains information required by Section 315, Subsection 4 of the German Commercial Code (HGB):
§ 315 (4) 1
Composition of subscribed capitalWacker Chemie AG’s subscribed capital totals 52,152,600 non-par value voting shares. There are no differences in share category. The total number of shares currently includes 49,677,983 held by external shareholders and 2,474,617 held by Wacker Chemie AG itself. WACKER’s treasury shares were acquired by repurchasing Wacker-Chemie GmbH shares in August 2005 when it was still a private limited company. The Executive Board can use or sell these treasury shares only on the following conditions: 782,300 shares require Supervisory Board approval and an appropriate resolution by the Annual Shareholders’ Meeting. The remaining 1,692,317 shares are subject to Supervisory Board approval.
§ 315 (4) 2
Restrictions on voting rights or on the transfer of sharesThere are no restrictions on voting rights or the transfer of shares.
§ 315 (4) 3
Direct or indirect capital stakesEach of the following holds a stake of over 10 percent of the subscribed capital: Dr. Alexander Wacker Familiengesellschaft mbH, based in Munich, Blue Elephant Holding GmbH, based in Pöcking, and Dr. Peter-Alexander Wacker, resident in Starnberg and to whom the voting shares of Blue Elephant Holding GmbH are attributable.
§ 315 (4) 4 § 315 (4) 5
Owners of shares entailing special rights Method of votingright control in the case of employee participationShareholders have not been given any special rights that bestow control powers. Insofar as employees hold shares in Wacker Chemie AG’s capital, they exercise their resultant control rights directly.
§ 315 (4) 6
Statutory provisions and articles of association regarding the appointment and dismissal of executive board members and amendments to said articlesThe provisions to appoint and dismiss Wacker Chemie AG’s Executive Board members are based on Section 84 et seq. of the German Stock Corporation Act (AktG). Wacker Chemie AG’s Articles of Association do not contain any further provisions in this respect. Pursuant to Article 4 of the Articles of Association, the number of Executive Board members is fixed by the Supervisory Board, which also appoints an Executive Board member as President & CEO. Amendments to the Articles of Association are covered by Sections 133 and 179 of the German Stock Corporation Act. In accordance with Section 179 (1) sent. 2 of the German Stock Corporation Act, the Supervisory Board has been empowered to amend the Articles of Association if only the wording thereof is affected.
§ 315 (4) 7
Authority of the executive board to issue or buy back sharesIn accordance with a resolution passed at the May 21, 2010 Annual Shareholders’ Meeting, Wacker Chemie AG’s Executive Board was authorized – in compliance with the legal provisions set out in Section 71 (1) no. 8 of the German Stock Corporation Act – to acquire treasury shares totaling a maximum of 10 percent of capital stock. No capital has been authorized for the issue of new shares.
§ 315 (4) 8
Major agreements associated with control changes due to a takeover bidVarious agreements with joint-venture partners include change-of-control clauses, which deal with what might happen if one of the joint-venture partners were taken over. These arrangements comply with the usual standards for such joint-venture agreements. In addition, several loan agreements contain change-of-control clauses. Here, too, the clauses are typical of this type of agreement.
§ 315 (4) 9
Severance agreements with the executive board or employees in the event of a takeover bidThere are no severance agreements or similar with employees or with Executive Board members in the event of a takeover bid (please refer to the compensation report).
T 2.14

Ma
na
ge
me
nt
Re
po
rtB
usi
ne
ss R
ep
ort
Innovations for Technology Leaders
Electronics is a growth market with huge potential. Processors, memories and control systems are increasingly becoming an integral part of applications for all areas of life. Plus, LEDs are enjoying global success as a replacement for conventional light bulbs. In Pangyo, South Korea’s answer to Silicon Valley, WACKER’s Center of Electronics Excellence works on hightech silicones for the electronics industry.
Combined Management ReportBusiness Report
3

Ma
na
ge
me
nt
Re
po
rtB
usi
ne
ss R
ep
ort
75 Business Report
84 Earnings
95 Net Assets
100 Financial Position
105 Supplementary Report
106 Non-Financial Performance Indicators and Other Information
134 Management Report of Wacker Chemie AG
141 Risk Management Report
Combined Management ReportBusiness Report
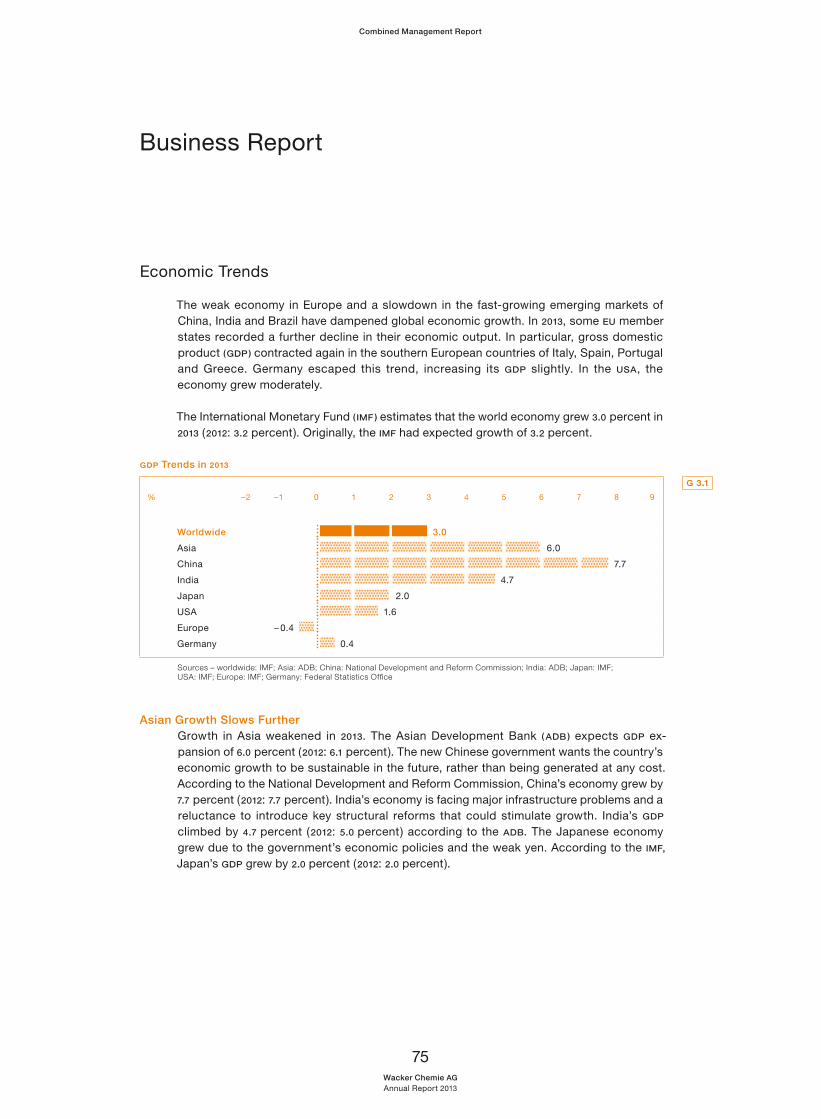
75Wacker Chemie AGAnnual Report 2013
Combined Management Report
Business Report
Economic Trends
The weak economy in Europe and a slowdown in the fast-growing emerging markets of China, India and Brazil have dampened global economic growth. In 2013, some EU member states recorded a further decline in their economic output. In particular, gross domestic product (GDP) contracted again in the southern European countries of Italy, Spain, Portugal and Greece. Germany escaped this trend, increasing its GDP slightly. In the USA, the economy grew moderately.
The International Monetary Fund ( IMF) estimates that the world economy grew 3.0 percent in 2013 (2012: 3.2 percent). Originally, the IMF had expected growth of 3.2 percent.
GDP Trends in 2013
Worldwide
Asia
China
India
Japan
USA
Europe
Germany
– 2 – 1 0 1 2 3 4 5 6 7 8 9
Sources – worldwide: IMF; Asia: ADB; China: National Development and Reform Commission; India: ADB; Japan: IMF; USA: IMF; Europe: IMF; Germany: Federal Statistics Office
Asian Growth Slows FurtherGrowth in Asia weakened in 2013. The Asian Development Bank (ADB) expects GDP ex-pansion of 6.0 percent (2012: 6.1 percent). The new Chinese government wants the country’s economic growth to be sustainable in the future, rather than being generated at any cost. According to the National Development and Reform Commission, China’s economy grew by 7.7 percent (2012: 7.7 percent). India’s economy is facing major infrastructure problems and a reluctance to introduce key structural reforms that could stimulate growth. India’s GDP climbed by 4.7 percent (2012: 5.0 percent) according to the ADB. The Japanese economy grew due to the government’s economic policies and the weak yen. According to the IMF, Japan’s GDP grew by 2.0 percent (2012: 2.0 percent).
G 3.1%
3.0
6.0
7.7
4.7
2.0
1.6
– 0.4
0.4

76Wacker Chemie AGAnnual Report 2013
Combined Management ReportBusiness Report
US Economy Expands ModeratelyDespite political controversy about the budget, the US economy grew moderately in 2013, due to steady domestic demand and slightly lower unemployment. According to the IMF, GDP rose by 1.6 percent (2012: 2.8 percent).
Eurozone Still Dominated by Debt CrisisEurope’s sovereign-debt crisis continued to dampen economic output in 2013, with many crisis-hit economies still in recession. Austerity programs, loss of income and high unemployment subdued consumer spending and corporate investments. However, there are initial signs that growth may resume in 2014. According to IMF calculations, GDP in eurozone countries dropped by –0.4 percent (2012: –0.6 percent).
German Economy Remains Resilient to Euro CrisisGermany’s economy again proved robust amid the euro crisis, in contrast to most other European countries. As a result, Germany reinforced its role as Europe’s leading economy, benefiting from both export strength and solid domestic demand. With unemployment remaining low and employment at a high level, tax-revenue increased, further easing debt growth. Data issued by the German Federal Statistics Office show that GDP increased by 0.4 percent (2012: 0.7 percent).
General Sector-Specific Conditions
We supply products to a wide range of industries. Our main customers are in the semi con-ductor, photovoltaic, chemical, construction, electrical-engineering and electronics sectors.
Semiconductor Market Grows, But Silicon Wafers DeclineThe semiconductor industry continued to grow in 2013. Demand for mobile end-user equipment, such as tablets and smartphones, compensated for the slow PC market. Market researchers at Gartner expect sales for 2013 to be up some 5 percent at US$ 315 billion. Weak PC business dampened demand for silicon wafers. Volumes slowed by –13.2 percent year on year to US$ 8.01 billion (2012: US$ 9.23 billion). Silicon-wafer demand, in terms of surface area sold, is estimated at about 58 billion cm2. Overall, the market was flat for all diameters. Siltronic’s market share remained at about 15 percent.
Overcapacity, Price Pressure and Continued Growth Shape Photovoltaic MarketThe photovoltaic market continued to expand in 2013. Various market studies and our own estimates anticipate that over 36.1 gigawatts (GW) of capacity were installed worldwide (2012: 31.1 GW), up 16 percent on the prior-year period. In Germany, feed-in tariffs depend on newly installed capacity and are reduced each month. As a result, the German market has declined, leveling out at 300 MW per month. According to Germany’s Federal Network Agency, the installed output reached 3.3 GW (2012: 7.6 GW). Other countries have supplanted Germany as the key market. China and Japan in particular recorded a marked increase in new installations.
Market conditions remained tight in 2013. Global production capacities still outstrip demand. Given the strong price pressure throughout supply chains, further companies became insolvent or exited the market. WACKER retained advance payments from long-term contracts and received damages from companies that withdrew from the business.
Additionally, markets were unsettled by anti-dumping proceedings by the European Union against Chinese solar companies and by the Chinese Ministry of Commerce against polysilicon manufacturers in the USA, South Korea and Europe. The European Union and China agreed in late July 2013 to set minimum prices for Chinese solar cells and to limit imports. The uncertainties in the anti-dumping dispute curbed production, especially at the

77Wacker Chemie AGAnnual Report 2013
Combined Management ReportBusiness Report
beginning of the first quarter and in the third quarter of 2013. In the fourth quarter, we sold substantial volumes. Overall, WACKER sold greater quantities of polysilicon in 2013 than ever before, though at prices on a par with those at the end of the fourth quarter of 2012. Prices stabilized at this level in 2013. In total, we supplied 49,000 metric tons of polysilicon, including deliveries to our electronics-industry customers, a rise of 27.9 percent on the previous year.
Installation of New PV Capacity in 2012 and 2013
Installation of New PV Capacity (MW)
Growth in 2013
2013 2012 %
Germany 3,300 7,600 –57
Italy 1,800 3,600 –50
Rest of Europe 6,000 6,000 –
USA 4,200 3,300 27
Japan 7,700 2,500 208
China 11,000 4,900 124
Other regions 5,000 4,000 25
Total 39,000 31,900 22
Sources: European Photovoltaic Industry Association (EPIA), Global Market Outlook for Photovoltaics until 2016; WACKER’s own market research; Germany’s Federal Network Agency, GTM Research and Solar Industries Association (SEIA), U.S. Solar Market Insight
Chemical Industry Without Economic Tailwinds – WACKER’s Chemical Divisions Record Stable Growth
In 2013, the chemical industry still did not show the momentum of previous years. Prices for chemical products decreased. Global output ( including pharmaceuticals) in 2012 totaled € 4.1 trillion, with Asia contributing nearly 50 percent, Europe 25 percent, and the Americas 20 percent. The German Chemical Industry Association (VCI) expects chemical production in Germany to expand by 1.5 percent. Capacity utilization at German chemical plants was 84 percent. Sales edged up by 0.5 percent to € 187.7 billion (2012: € 186.8 billion). Growth was primarily driven by Asia. China remains the most interesting growth market. In 2012, chemical exports to China increased to € 5.4 billion. As a result, China now ranks among the top-ten export destinations for Germany’s chemical industry. Performance at WACKER’s chemical divisions remained strong, at the high level of 2012. Lower prices for standard products, unfavorable exchange rates compared with the previous year and the sluggish economy impeded growth. WACKER SILICONES recorded strong demand for silicone products for cosmetics, consumer goods, medical technology and industrial applications. WACKER POLYMERS again increased its sales of dispersible polymer powders. Business in dispersions, though, was weaker. At WACKER BIOSOLUTIONS, sales of polyvinyl acetate solid resin for manufacturing gumbase were at the prior-year level.
T 3.2

78Wacker Chemie AGAnnual Report 2013
Combined Management ReportBusiness Report
SpotPrice Trends for WACKER’s Key Raw Materials
Silicon Metal Ethylene
2011 € 2,360
2012 € 2,025
2013 € 1,960
2011 € 1,015
2012 € 1,140
2013 € 1,045
3,500
3,000
2,500
2,000
1,500
1,000
500
0
1,750
1,500
1,250
1,000
750
500
250
0
Methanol Vinyl Acetate Monomer
2011 € 260
2012 € 300
2013 € 360
2011 € 980
2012 € 850
2013 € 815
490
420
350
280
210
140
70
0
1,750
1,500
1,250
1,000
750
500
250
0
Annual average in each case
Price trends for our key raw materials were not uniform in 2013. Silicon metal and VAM were only slightly cheaper, while ethylene prices in Europe fell by nearly 10 percent. The average price of methanol rose significantly by almost 20 percent throughout the year.
Construction Industry Grows in 2013According to the market research institute Global Insight, the construction industry grew in 2013 by 2.7 percent globally to US$ 8.3 trillion (2012: US$ 8.1 trillion). In January 2013, the market researchers had still been expecting growth to come in at 4.1 percent. The effects of the euro crisis hurt the construction industry, especially in Europe, and led to a drop in construction contracts. Southern Asia again delivered the strongest performance, growing 5.5 percent. China – at US$ 1.8 trillion – remains the largest market worldwide. In the US, the property market continued to stabilize in 2013, spurring the construction industry, where volumes rose by 4.6 percent. In Western Europe, business declined by 1.6 percent. Sales in the German construction industry were US$ 323.8 billion in real terms (2012: US$ 323.8 billion).
G 3.3€ / t
€ 1,900 Three-year low
€ 2,620 Three-year high
€ 875 Three-year low
€ 1,270 Three-year high
€ 250 Three-year low
€ 390 Three-year high
€ 790 Three-year low
€ 1,200 Three-year high

79Wacker Chemie AGAnnual Report 2013
Combined Management ReportBusiness Report
Global Construction Industry by Region in 2013
Worldwide
Asia
North America
Middle East and Africa
South America
Western Europe
Eastern Europe
– 6 – 4 –2 0 2 4 6
Source: Global Insight
With construction applications, WACKER POLYMERS increased its sales further. Growth in dispersible polymer powders is driven by the market for dry-mix mortar in countries such as China and India. In these areas, we achieved double-digit sales growth. The move away from conventional building materials and construction methods to higher quality systems will continue. Europe’s prolonged winter dampened construction activity in the first half of 2013. In the second half, we did not fully make up for this decline, which meant that we posted a sales drop here. In dispersions, WACKER POLYMERS generated very strong growth in China, with dispersion sales for water-repellent flooring layers more than doubling. By substituting acrylates with VAE dispersions, we achieved over 40-percent growth in the sealant market in the USA. The European coatings market developed more slowly. Overall, we sold nearly 20,000 additional metric tons to the construction industry.
At WACKER SILICONES, construction-application sales were up by 3 percent. Raw materials for construction and silicones for building protection posted sales at the previous year’s level. Hybrid silicone products, on the other hand, saw business expand. In the case of hybrid polymers, which are used for example in wood-flooring adhesives, we increased sales by around 40 percent. Sales in cartridges under our own brand name also grew in certain countries, by around 7 percent. On the regional front, year-on-year sales were below the prior year in Germany (– 7 percent) and in Western and Southern Europe (– 2 percent). Sales in China grew by 4 percent. We grew in India (9 percent), the Middle East (23 percent) and the USA (10 percent). In Eastern Europe, business expanded by 9 percent.
Electrical and Electronics Industry Grows in Emerging MarketsWith global sales of around € 3.6 trillion, the electrical and electronics industry continued its uptrend in 2013. The German Electrical and Electronic Manufacturers’ Association (ZVEI ) estimates worldwide growth at 6 percent for 2013. The emerging markets were the main driving force here, expanding by around 9 percent. In Germany, the fifth largest market worldwide, sales edged up to around € 173 billion , according to ZVEI’s estimates (2012: € 170.2 billion). WACKER has three business divisions that supply customers in the electrical and electronics industries. At Siltronic, sales to semiconductor customers declined compared with the year-earlier period, mainly due to lower prices. During 2013, WACKER POLYSILICON sold around 15 percent of its polysilicon capacities to customers in the electronics industry.
G 3.4%
2.7
5.5
4.6
2.9
2.8
– 1.6
– 4.6

80Wacker Chemie AGAnnual Report 2013
Combined Management ReportBusiness Report
WACKER SILICONES posted a sales increase of over 3 percent for this market. We generated higher sales in media-resistant potting compounds, in highly specialized silicone rubber grades for automotive electronics and optoelectronics, and in electronic components for circuit boards. The LED business remained at the prior-year level. In regional terms, sales rose in the USA (10 percent) and in Asia (8 percent). European sales came in at the year-earlier level.
Overall Statement by the Executive Board on Underlying Conditions
The global economic trend in 2013 was affected by the continued recession in many European countries and by weaker growth in the emerging economies. In 2013, Germany once again proved to be more resilient than other countries and achieved some growth. In China, annual growth is between 7 and 8 percent. At an economic summit in Beijing in November 2013, the government decided to initiate further reforms. Private banks will be allowed, initial public offerings made easier, and privatization of state enterprises accelerated. The maxim is: more market and less government.
The economy’s flat trajectory in 2013 has heightened competition and put pressure on standard-product prices. This has also affected WACKER. Siltronic’s sales declined once again. At WACKER POLYSILICON, market conditions were varied. Prices for polysilicon remain at a low level, but have not dropped any further. Continued growth in this market has benefited our business. In 2013, WACKER sold more polysilicon than ever before. The agreement reached between the EU and China in their solar dispute revived the market in the second half of 2013. Due to the lack of economic tailwind, performance at WACKER’s three chemical divisions remained unchanged at the prior-year’s high level. As a result, Group sales came in slightly lower year on year. Pressure from WACKER’s main raw materials has eased further. Overall, raw-material prices have stopped rising and are, in some cases, slightly lower than a year earlier. WACKER SILICONES’ broad product range – extending into numerous customer sectors – delivered some growth. Compared to our competitors, this division slightly increased its overall market share. WACKER BIOSOLUTIONS and WACKER POLYMERS remained at the prior-year level. At WACKER POLYMERS, business in dispersible polymer powders grew, while the trend for dispersions weakened.
The effects of the EU’s sovereign-debt crisis led to a slight sales decline in Europe again in 2013. One reason for this was weak construction-sector demand. As a percentage of sales, the decline in the Americas was more pronounced. This was primarily due to negative exchange- rate effects and weaker packaging-industry substitution business at WACKER POLYMERS. Sales were down slightly in Asia, although we posted a sales increase in China. We were able to grow sales there via stronger chemical business and higher polysilicon volumes. At 40.8 percent, Asia continues to have the largest share in Group sales.
In the first few weeks of 2014, various institutions, such as the International Monetary Fund and the World Bank, issued positive statements about this year’s global economic trend. They expect stronger growth than last year. In January, WACKER started 2014 with somewhat higher sales than a year earlier. Our silicone and polysilicon segments, in particular, generated sales growth.

81Wacker Chemie AGAnnual Report 2013
Combined Management ReportBusiness Report
Key Events Affecting Business Performance
DivestituresWACKER did not divest any business fields or product business in 2013.
InvestmentsInvestments were more than halved compared with 2012. In 2013, they totaled € 503.7 million (2012: € 1.1 billion), a sign that WACKER has largely completed, or extended the timeline for, its capital-intensive large-scale investments in new upstream product facilities.
WACKER’s investing activities remained centered on the construction of the new polysilicon site at Charleston, Tennessee (USA). At some € 250 million, this project accounted for approxi-mately half of all investments in 2013. Construction there continued as planned throughout 2013 and is set for completion in the second half of 2015.
Investing activity in 2013 additionally focused on production-capacity expansion in Asia and the USA. At Ulsan (South Korea), WACKER officially opened a new production facility for vinyl acetate-ethylene copolymer dispersions with an annual capacity of 40,000 metric tons. The existing dispersions facilities at the polymer site in Nanjing (China) were enlarged by a new reactor with an annual output of 60,000 metric tons. Nanjing also saw the completion of a new plant for polyvinyl acetate solid resins. It has an annual capacity of 20,000 metric tons. In the USA, the polymers site at Calvert City also expanded, adding 30,000 metric tons of dispersions capacity per year. In 2013, these three projects involved a total of € 25.1 million in additions to property, plant and equipment.
Comparing Actual with Forecast Performance
WACKER did not quite achieve the target it had set in early 2013, namely to reach its prior-year sales level. EBITDA, as predicted in March 2013 and forecast in our Annual Report, remained below the 2012 level. This was mainly due to a decline in prices for polysilicon and semiconductor wafers compared with the previous year. In addition, both a sluggish economy and exchange-rate effects stemming from the weaker US dollar and yen held back sales and earnings. Cost savings, also supported by higher production output, of approximately € 225 million were unable to compensate for these effects.
At WACKER POLYSILICON, prices for solar silicon remained largely unchanged since the beginning of the year. However, they are still at a very low level. Due to the price declines in 2012, they were some 30 percent lower on average in 2013. Siltronic’s business did not experience the revival in demand for silicon wafers in the second half of the year that many market experts had expected. At the same time, semiconductor-wafer prices fell noticeably during 2013. Overall, prices were more than 10 percent lower on average than in 2012. Amid adverse economic conditions, business at our three chemical divisions – WACKER SILICONES, WACKER POLYMERS and WACKER BIOSOLUTIONS – developed satisfactorily. Significantly higher volumes as well as savings due to efficiency projects and personnel cost savings offset increasing price pressure, especially on standard products, and negative exchange-rate effects. Taken together, these three business divisions maintained the prior-year sales level and managed to increase EBITDA. This, however, could not make up for the lower sales figures at WACKER POLYSILICON and the earnings decline in the semiconductor and solar business. Raw-material and energy costs stayed within expectations. On the other hand, the exchange rates of the US dollar and the yen against the euro developed somewhat weaker than we had assumed in our projections at the beginning of 2013.

82Wacker Chemie AGAnnual Report 2013
Combined Management ReportBusiness Report
Sales Projections Specified after Second QuarterWith the publication of the Q2 Interim Report in July 2013, WACKER specified and adjusted slightly downward its forecast that sales would be maintained at the prior-year level. This revision was mainly prompted by indications that the semiconductor-wafer business would be weaker in the second half of 2013 and by the increasing price pressure in the chemical business. As of that point, sales were anticipated to total € 4.5 billion for the full year, while the EBITDA projection remained unchanged at below the prior-year level. WACKER still expected its net income to be in slightly positive territory. In addition, WACKER announced in the Q2 report its intention to save approximately € 200 million, including volume effects, at all business divisions and corporate departments in 2013 by means of a wide-ranging initiative, with about half of the savings to be generated at WACKER POLYSILICON. When we published our third-quarter figures, we confirmed this revised sales and earnings forecast. Group sales in 2013 amounted to € 4.48 billion, meeting the forecast target of approximately € 4.5 billion. The WACKER Group’s 2013 EBITDA amounted to € 678.7 million, down from the prior-year figure, as expected. We retained € 77.6 million in advance payments and received damages relating to terminated supply contracts for polysilicon. This income is included in 2013 EBITDA.
Investments – excluding acquisitions – were initially projected at just under € 600 million for 2013. We revised this projection for investment spending to € 550 million in our Q2 2013 report. In the Q3 2013 Interim Report’s “Outlook” section, we lowered this projection to € 500 million. At € 503.7 million, investments were within our target corridor. The largest share of the funding went toward ongoing expansion of our polysilicon production facilities.
Comparing Actual with Forecast Performance
€ million Results in 2012
Forecast March 2013
Forecast July 2013
Forecast Oct. 2013
Results in 2013
Sales 4,634.9 at prior-year level approx. 4,500 approx. 4,500 4,478.9
EBITDA 795.4 below prior year below prior year below prior year 678.7
Net income for the year 114.7 slightly positive slightly positive slightly positive 6.3
Investments ( incl. financial assets) 1,095.4 approx. 600 550 500 503.7
Net financial debt 700.5 over 1,000 under 1,000 under 900 792.2
Net cash flow –536.2 slightly negative slightly negative positive 109.7
Net financial debt and net cash flow developed more favorably than expected at the beginning of the year. Lower investments and reduced working capital substantially improved net financial debt and net cash flow. In March 2013, we had forecast that net financial debt would surpass € 1 billion by the end of 2013. At that point, we had expected negative net cash flow. The gap would, however, turn out to be much smaller than in 2012. In the Q2 report, our target was to stay below the one-billion-euro mark for net financial debt by the end of the year. In our Q3 report, we forecast that net financial debt would be under € 900 million by year’s end, and that net cash flow would be positive. As of December 31, 2013, net financial debt of € 792.2 million and net cash flow of € 109.7 million were both in line with our expectations.
R & D expenditures for the development of future products and solutions amounted to € 173.8 million for full-year 2013, thus corresponding to the expenditures for R & D of approxi-mately € 175 million forecast at the beginning of the year.
T 3.5

83Wacker Chemie AGAnnual Report 2013
Combined Management ReportBusiness Report
The slight increase in the workforce anticipated at the start of the year did not materialize. As per the reporting date, WACKER had 16,009 employees, 283 fewer than the year before. This shows that WACKER adopted a conservative hiring policy in 2013.
The Executive and Supervisory Boards are proposing a dividend of € 0.50 per share for 2013 (dividend for 2012: € 0.60) at this year’s annual shareholders’ meeting.
Deviations from Projected ExpensesPersonnel expenses, as a percentage of sales, edged down compared with the previous year. They declined 5 percent in absolute terms. We did not quite reach our target for 2013. Reasons for our lower personnel expenses included our conservative hiring policy and wide-ranging cost-saving measures, such as programs to increase productivity at our operating divisions and corporate departments. Employee numbers decreased in 2013. Medium term, we expect personnel expenses (excluding non-recurring effects) to be about 25 percent of sales.
Raw-material costs were down slightly year on year, both as a percentage of sales and in absolute terms. This reflected the impact of lower sales and more favorable prices for some raw materials. We were one percentage point below our target for 2013. Medium term, we expect raw-material costs to be flat.
Energy costs came in below our target, the result of more favorable procurement conditions and a lower regulatory cost burden.
Depreciation in absolute figures was slightly above our target. This was due to an impairment at Siltronic at year-end. In total, depreciation amounted to € 564.4 million, with some 40 percent of this sum being accounted for by our polysilicon facilities. Depreciation will rise further in the medium term owing to our investments in polysilicon-capacity expansion.
Expenses by Cost Types
% of sales 2012 Forecast 2013
Reported 2013
Personnel expenses 25.8 25.2 25.3
Raw-material costs 23.1 23.9 22.9
Energy costs 10.9 10.5 10.2
Depreciation 11.4 11.4 12.6
T 3.6

84Wacker Chemie AGAnnual Report 2013
Combined Management Report
Earnings
Fiscal 2013 was marked by stable sales at WACKER’s three chemical divisions, persistent price pressure on silicon wafers and lower prices in the polysilicon segment. WACKER’s sales were lower and, as anticipated, its EBITDA was substantially reduced. The sluggish economy intensified competition in 2013, pushing down prices for standard products. Higher volumes and personnel cost savings only partially offset the pressure on prices in the three chemical divisions. Although prices remained at low levels at WACKER POLYSILICON, they did not decline any further. The agreement reached between the EU and China in their solar dispute revived the market in the second half of 2013, helping WACKER sell record volumes of polysilicon. Sales of silicon wafers for the semiconductor industry continued to decline, with lower prices and negative exchange-rate effects dampening sales growth. The Group’s net income for the year amounted to € 6.3 million, once again substantially lower than in the previous year (2012: € 114.7 million).
Sales Decrease 3 Percent to € 4.48 BillionWACKER generated a total of € 4.48 billion in sales in 2013 (2012: € 4.63 billion), down 3.4 percent from a year earlier. Considerably lower prices for polysilicon and silicon wafers were the main reasons that Group sales were lower than a year ago. Performance differed across the Group’s business divisions in 2013 for a number of reasons.
Although WACKER’s chemical divisions succeeded in increasing their volumes compared with the previous year, price pressure and negative exchange-rate effects impeded sales growth. WACKER SILICONES and WACKER BIOSOLUTIONS managed to increase their sales slightly, while WACKER POLYMERS’ sales declined. Weaker dispersions business was the main reason for this decrease. WACKER POLYMERS generated sales of € 978.7 million (2012: € 1.00 billion), 2 percent down on the previous year. WACKER SILICONES, on the other hand, grew its sales by 1 percent year on year, to € 1.67 billion (2012: € 1.65 billion). WACKER BIOSOLUTIONS, too, posted a slight increase, with sales rising by 1 percent to € 158.4 million (2012: € 157.6 million).
WACKER POLYSILICON succeeded in selling record volumes of polysilicon, but sales were lower than in the previous year. Sales came in at € 924.2 million (2012: € 1.14 billion), a drop of just under 19 percent. This drop was caused by low polysilicon prices, which reached low levels toward the end of Q4 2012 and remained there for almost the whole of 2013. The agreement reached in late July between the European Union and China in connection with punitive tariffs for Chinese solar companies increased the volumes of polysilicon sold.
In 2013, Siltronic generated sales of € 743.0 million (2012: € 867.9 million), down 14 percent from a year earlier. Although volumes remained unchanged overall, the division had to come to terms with a substantial drop in silicon-wafer prices. Another factor dampening the price trend was the devaluation of the Japanese yen.

85Wacker Chemie AGAnnual Report 2013
Combined Management ReportEarnings
YearonYear Sales Comparison
5,000
4,000
3,000
2,000
1,000
0
Group Sales Full-year 2012
Sales-Volume and Product-Mix Effects
Price Effects Exchange-Rate Effects
Group Sales FullYear 2013
Higher volumes positively influenced sales, adding € 301 million, while exchange-rate effects had a negative impact of € 91 million. The dollar-euro and yen-euro exchange rates were the main factors in this trend. The average rate in 2013 was 1.36 dollars to the euro (2012: 1.29), while the average rate of the yen to the euro in the same period was 136.61 (2012: 102.50). Declining prices in particular lowered Group sales by € 366 million.
WACKER generated the majority of its sales outside Germany. In 2013, international sales reached € 3.83 billion (2012: € 3.95 billion), or 86 percent of total sales. Asia is clearly WACKER’s biggest market. WACKER delivers a large proportion of its polysilicon to Asia, and there is also strong demand from Asian customers for the Group’s silicone and polymer products.
Domestic and International Sales (by Customer Location)
€ million 2013 2012 2011 2010 2009 2008 2007
External sales 4,478.9 4,634.9 4,909.7 4,748.4 3,719.3 4,298.1 3,781.3
of which Germany 647.0 686.0 899.4 887.3 774.6 948.6 723.5
of which international 3,831.9 3,948.9 4,010.3 3,861.1 2,944.7 3,349.5 3,057.8
EBITDA down 15 Percent Year on YearIn 2013, WACKER’s earnings before interest, taxes, depreciation and amortization (EBITDA) amounted to € 678.7 million (2012: € 795.4 million), down 14.7 percent from a year earlier. The EBITDA margin was 15.2 percent (2012: 17.2 percent). As in 2012, the low EBITDA figure was predominantly due to lower prices – in particular for silicon wafers and polysilicon – across all business divisions. At WACKER POLYSILICON, the EBITDA margin dropped from the prior-year’s 37.6 percent to 25.3 percent. The division had income of € 77.6 million (2012: € 113.1 million) from the retention of advance payments and from damages relating to the termination of contracts. In Q4 2013, WACKER SILICONES used provisions for purchase obligations, which had negatively impacted our silicone business. This enhanced EBITDA by € 13.7 million.
G 3.7€ million
4,635301
– 366 – 91
4,479
T 3.8

86Wacker Chemie AGAnnual Report 2013
Combined Management ReportEarnings
EBIT for the year amounted to € 114.3 million (2012: € 266.6 million) – a 57.1-percent decrease. Depreciation and impairments have an impact not only on EBITDA, but also on EBIT. Depreciation totaled € 527.4 million in 2013 (2012: € 526.3 million). WACKER also recognized overall impairments of € 37.0 million. Of this sum, € 34.8 million related to Siltronic. This mainly concerned noncurrent assets no longer in use. The EBIT margin for 2013 was 2.6 percent (2012: 5.8 percent). The non-recurring effects that influenced both EBIT and EBITDA in 2013 are shown in the following table:
Non Recurring Effects in 2013
€ million 2013
Use of provisions for losses from future purchase obligations in China 13.7
Advance payments retained and damages received 77.6
Total non recurring effects on EBITDA 91.3
Retirement and impairment of noncurrent assets at Siltronic –34.8
Total non recurring effects on EBIT 56.5
Non Recurring Effects in 2012
€ million 2012
Advance payments retained and damages received 113.1
Obligations relating to the closure of the 150 mm line in Portland –14.8
Total non recurring effects on EBITDA 98.3
Total non recurring effects on EBIT 98.3
Cost of Goods Sold Remains at Same LevelCompared with the previous year, gross profit from sales fell by € 156.0 million to € 663.5 million (2012: € 819.5 million). That is a decline of 19 percent. The gross margin for 2013 was just under 15 percent. A year earlier, the figure had been 18 percent. This decline, too, was mainly due to markedly reduced sales margins for both silicon wafers and polysilicon.
At € 3.82 billion, the cost of goods sold remained unchanged in 2013 (2012: € 3.82 billion). Well-utilized production facilities provided for good coverage of fixed costs, while positive effects also came from a slight overall reduction in raw-material costs. In addition, a number of measures taken by WACKER helped to reduce the company’s material and personnel expenses. A reduction in inventories, though, had a contrary effect on the cost of sales in the second half of the year. The cost-of-sales ratio for the year stood at 85 percent (2012: 82 percent).
Functional CostsOther functional costs (selling, R & D and general administrative expenses) were slightly lower than in the previous year, amounting to € 557.5 million (2012: € 571.7 million), a decrease of just under 3 percent.
Other Operating Income and ExpensesIn 2013, the balance of other operating income and expenses was € 44.3 million (2012: € 101.3 million). This positive figure included income of € 77.6 million (2012: € 113.1 million) from the retention of advance payments and from damages relating to the termination of
T 3.9
T 3.10

87Wacker Chemie AGAnnual Report 2013
Combined Management ReportEarnings
polysilicon contracts. Foreign currency gains and losses were almost balanced at € – 2.8 million (2012: € – 7.9 million). Impairments of noncurrent assets, particularly at Siltronic, in the amount of € 37.0 million were recognized as other operating expenses.
Operating ResultDue to the effects outlined above, the operating result fell from € 349.1 million to € 150.3 million, 57 percent down on one year earlier.
Result from Investments in Joint Ventures and AssociatesThe investment result – the total income from investments in joint ventures and associates and other income from participations – amounted to € – 36.0 million (2012: € – 82.5 million). This aggregate loss is attributable to investment losses from the 300 mm-wafer joint venture with Samsung, which were caused by high depreciation and lower prices. As expected, profits from the joint venture with Dow Corning for the production of siloxane in China declined significantly during 2013, a reduction that was due to the lower transfer prices for siloxane that WACKER had agreed with Dow Corning. The previous year’s investment result contained depreciation of € 77.0 million of the Group’s share in its joint venture Dow Corning (ZJG) Holding Co. Private Ltd., Singapore.
Financial and Net Interest ResultThe Group’s financial result was € – 83.3 million (2012: € – 62.7 million), 33 percent down on one year earlier. The main reason for this decline was the company’s higher debt level and the associated interest expenses for financial liabilities. Interest expenses amounted to € 41.8 million (2012: € 26.2 million). The effect of construction-related borrowing costs reduced interest expenses only minimally, by € 2.0 million (2012: € 14.2 million). In 2013, the balance of interest income and interest expenses was € – 26.8 million (2012: € – 10.2 million). At € 15.0 million, interest income was almost unchanged over the previous year (2012: € 16.0 million).
The other financial result was € – 56.5 million (2012: € – 52.5 million) and primarily comprised interest-bearing components of pension and other noncurrent provisions. It also included income and expenses from the exchange-rate effects of financial investments.
Income TaxesThe Group reported tax expenses of € 24.7 million (2012: € 89.2 million). That is 72 percent less than a year earlier. The Group’s tax rate was 79.7 percent in 2013 (2012: 43.7 percent). The relatively high tax expenses primarily stemmed from the non-tax-deductible investment result and from expenses and losses of international subsidiaries, with low Group income before taxes overall.
Group Net IncomeAs a result of the above effects, consolidated net income decreased to € 6.3 million (2012: € 114.7 million).
ROCEThe return on capital employed (ROCE) sets earnings before interest and taxes (EBIT ) in relation to the capital employed for business activities.
In 2013, the return on capital employed (ROCE) was 2.2 percent (2012: 5.2 percent), a year-on-year decrease mainly attributable to a decline in earnings and the increased commitment of funds to the construction of new production facilities. Capital employed rose from € 4,979.0 million to € 5,238.2 million in the year under review.

88Wacker Chemie AGAnnual Report 2013
Combined Management ReportEarnings
Combined Statement of Income
€ million 2013 2012 * Change in %
Sales 4,478.9 4,634.9 –3.4
Gross profit from sales 663.5 819.5 –19.0
Selling, R & D and general administrative expenses –557.5 –571.7 –2.5
Other operating income and expenses 44.3 101.3 –56.3
Operating result 150.3 349.1 –56.9
Result from investments in joint ventures and associates –36.0 –82.5 –56.4
EBIT 114.3 266.6 –57.1
Financial result –83.3 –62.7 32.9
Income before taxes 31.0 203.9 –84.8
Income taxes –24.7 –89.2 –72.3
Net income for the year 6.3 114.7 –94.5
Of whichAttributable to Wacker Chemie AG shareholders 2.6 120.7 –97.8
Attributable to non-controlling interests 3.7 –6.0 n. a.
Earnings per common share (€ ) (basic /diluted) 0.05 2.43 –97.9
Average number of shares outstanding (weighted) 49,677,983 49,677,983 –
Reconciliation to EBITDAEBIT 114.3 266.6 –57.1
Depreciation /appreciation of noncurrent assets 564.4 528.8 6.7
EBITDA 678.7 795.4 –14.7
ROCE (%) 2.2 5.2 n. a.
* Adjusted for the effects of the adoption of IAS 19 (revised); see Changes in Accounting and Valuation Methods in the Notes section.
Segments
WACKER SILICONES
Sales Grow 1.5 PercentIn 2013, WACKER SILICONES increased its sales by 1.5 percent to € 1.67 billion (2012: € 1.65 billion). The increase was mainly the result of higher volumes. Factors dampening sales momentum were lower prices for standard products and unfavorable exchange-rate effects due to the stronger euro. However, every sector of our silicones business generated higher sales. Silicone volumes were especially strong for personal-care products, industrial applications and medical technology. At the regional level, WACKER SILICONES increased its sales in Asia by 4.9 percent. In Europe, the rise was 3.6 percent despite its weak economy. The “Other regions” delivered double-digit growth. Sales in the Americas stayed at the prior-year level. In Germany, sales declined by 2.7 percent.
Compared with the previous year, EBITDA outpaced sales growth. It came in at € 230.2 million, up 21.6 percent (2012: € 189.3 million). The use of provisions that were set up in the past for contingent losses from future purchase obligations from the joint venture with Dow Corning in China had a positive impact of € 13.7 million on EBITDA. Raw-material and energy costs were somewhat higher overall than a year earlier. The average price for silicon metal was 8 percent down year on year, while the price for methanol climbed 3 percent. Higher utilization of capacity resulted in better fixed-cost coverage in production. On the other hand, price pressure, especially on standard products, and exchange-rate effects dampened the division’s earnings performance. The EBITDA margin rose to 13.8 percent (2012: 11.5 percent).
T 3.11

89Wacker Chemie AGAnnual Report 2013
Combined Management ReportEarnings
Investments Lower than Prior YearInvestments were considerably lower year on year. They came in at € 85.4 million (2012: € 158.8 million). That is 46.2 percent less than a year earlier. The prior year’s figure contained a loan of € 87.9 million to the joint venture with Dow Corning. Capital expenditures in the year under review focused primarily on expanding capacities for downstream silicone products.
Continued Expansion of Sales Structures in AsiaTo better meet the needs of Asian customers and to intensify market activities, five new business teams have been active in the region since March 2013. They are geared to providing customer support locally from WACKER sites in Singapore, Mumbai ( India), Jincheon (South Korea) and Shanghai (China). Each of these teams utilizes not only local sales structures, but also region-specific technical competence centers. Here, products are adapted to local raw materials and customer specifications. WACKER SILICONES had 4,109 employees on December 31, 2013 (Dec. 31, 2012: 3,960).
Key Data: WACKER SILICONES
€ million 2013 2012 2011 2010 2009 2008 2007
Total sales 1,672.2 1,648.0 1,593.8 1,580.5 1,238.8 1,408.6 1,361.0
EBITDA 230.2 189.3 182.9 229.9 157.9 167.9 226.9
EBITDA margin (%) 13.8 11.5 11.5 14.5 12.7 11.9 16.7
EBIT 151.1 106.4 103.3 150.0 33.5 86.3 144.6
Investments 85.4 158.8 106.3 92.9 102.2 107.0 102.2
Acquisitions – – – 81.2 – – –
Employees (December 31, number) 4,109 3,960 3,956 3,892 3,873 3,927 3,871
WACKER POLYMERS
Sales at WACKER POLYMERS decreased slightly in 2013, declining 2.4 percent to € 978.7 million (2012: € 1.0 billion). The drop was due to slower dispersions business. In dispersible polymer powders, sales growth from higher volumes was held back by lower average selling prices and negative exchange-rate effects. Raw-material costs were slightly lower than in the previous year. The substitution business with VAE dispersions, especially in the packaging industry, did not develop as positively as it had in 2012.
Sales trends varied across the individual regions. WACKER POLYMERS posted sales declines in Germany, the rest of Europe and the Americas. In Asia, though, sales rose by over 10 percent. India was where we achieved the biggest increase of almost 30 percent.
EBITDA was stable at € 147.8 million (2012: € 147.4 million). The EBITDA margin rose to 15.1 percent (2012: 14.7 percent).
StartUp of New Production FacilitiesInvestments decreased to € 36.8 million from € 58.8 million in 2012. Most of the expenditures were for expansion projects in Calvert City (USA) and Nanjing (China). At Nanjing, a new plant for VAE dispersions with an annual output of 60,000 metric tons started up in April. WACKER POLYMERS now has a total production capacity in China of 120,000 metric tons per year. Additionally, we increased capacity at Calvert City (USA) by 30,000 metric tons.
T 3.12

90Wacker Chemie AGAnnual Report 2013
Combined Management ReportEarnings
The number of employees at the division rose slightly to 1,377 as of December 31, 2013 (Dec. 31, 2012: 1,365).
Key Data: WACKER POLYMERS
€ million 2013 2012 2011 2010 2009 2008 2007
Total sales 978.7 1,003.1 928.1 810.0 743.8 867.9 632.8
EBITDA 147.8 147.4 111.8 122.6 117.2 108.9 107.0
EBITDA margin (%) 15.1 14.7 12.0 15.1 15.8 12.5 16.9
EBIT 112.9 110.7 76.2 82.2 77.8 64.9 80.5
Investments 36.8 58.8 30.4 13.1 40.0 74.4 41.0
Employees (December 31, number) 1,377 1,365 1,412 1,377 1,362 1,579 1,128
WACKER BIOSOLUTIONS
WACKER BIOSOLUTIONS posted slightly higher sales in 2013. Sales rose 0.5 percent to € 158.4 million (2012: € 157.6 million), with the increase stemming from higher volumes. Sales growth was impeded by negative exchange-rate effects and lower prices. While business in both Asia and Europe as a whole expanded, sales in Germany and the Americas declined. Europe is the division’s largest sales region, with a share of more than 40 percent.
EBITDA for 2013 amounted to € 23.6 million, down slightly from the previous year (2012: € 24.5 million). EBITDA performance was dampened in particular by negative exchange-rate effects. The division’s EBITDA margin edged down to 14.9 percent (2012: 15.5 percent).
Investments Down from PriorYear LevelInvestments declined compared with the previous year, amounting to € 10.2 million (2012: € 19.3 million). Most of this sum went on constructing a new plant for polyvinyl acetate solid resins, which are used in the production of gumbase. With an annual capacity of 20,000 metric tons, the plant is being built at our Nanjing site in China. It will replace our existing production site at Wuxi. The new facility is scheduled to come on stream in 2014.
PharmaceuticalProtein Business Reinforced by AcquisitionIn November 2013, Wacker Biotech GmbH, a subsidiary of Wacker Chemie AG, signed a contract with BioNet Ventures GmbH to purchase a production site for the manufacture of therapeutic proteins. WACKER’s acquisition covers the assets of Scil Proteins Production at its site in Halle (Germany), including its patent portfolio. Scil Proteins has fermenters with a capacity of up to 1,500 liters. Acquiring this capacity is an important step in continuing to support customers after their drugs have passed the regulatory-approval stage and enter the commercial-supply phase. The acquisition was completed as per January 2, 2014 and the company will be included in WACKER's consolidated financial statements as of the first quarter of 2014.
T 3.13

91Wacker Chemie AGAnnual Report 2013
Combined Management ReportEarnings
As of December 31, 2013, the workforce at WACKER BIOSOLUTIONS rose to 371 (Dec. 31, 2012: 357).
Key Data: WACKER BIOSOLUTIONS
€ million 2013 2012 2011 2010 2009 2008 2007
Total sales 158.4 157.6 144.5 142.4 104.9 97.7 112.4
EBITDA 23.6 24.5 20.4 25.0 9.9 9.2 9.5
EBITDA margin (%) 14.9 15.5 14.1 17.6 9.4 9.4 8.5
EBIT 17.2 17.8 13.3 16.6 4.7 6.0 –7.5
Investments 10.2 19.3 8.6 6.5 12.7 16.5 7.5
Employees (December 31, number) 371 357 354 363 344 259 245
WACKER POLYSILICON
Photovoltaic Market Shaped by Volume Growth Amid Low PricesAs expected, WACKER POLYSILICON’s sales fell in 2013, declining 18.6 percent to € 924.2 million (2012: € 1.14 billion). Although WACKER POLYSILICON sold more polysilicon than ever before, with 49,000 metric tons shipped, its 2013 sales were down year on year due to the marked drop in average prices for hyperpure polysilicon. Fiscal 2013 was shaped by continued photovoltaic-market growth, by persistent overcapacity throughout the supply chain and by price pressure. The uncertainties in the anti-dumping dispute between the EU and China curbed production, especially in the third quarter. Following an agreement in the anti-dumping dispute, polysilicon volumes picked up in the fourth quarter of 2013. In the division’s sales regions, Asia has been playing an ever-greater role. Conversely, sales continue to decline in Europe and the Americas.
EBITDA fell 45.3 percent to € 233.9 million (2012: € 427.5 million), dampened primarily by prices that were, on average, markedly lower than in the previous year. Terminations of supply contracts with customers who exited the solar business and payment of damages added a total of € 77.6 million to EBITDA. The EBITDA margin reached 25.3 percent (2012: 37.6 percent).
Investments Below PriorYear LevelIn 2013, WACKER POLYSILICON’s capital expenditures were lower than a year earlier. This was primarily due to our extended timeline for completing the new polysilicon site in Tennessee (USA ), with production now scheduled to begin in the second half of 2015. Investments decreased 58.5 percent to € 290.0 million (2012: € 698.1 million). Most capital expenditures were for constructing the new production site in Tennessee. We estimate that construction of the new production site will cost a total of some US$ 2.2 billion.
The number of employees fell. It decreased to 2,102 (Dec. 31, 2012: 2,349).
T 3.14

92Wacker Chemie AGAnnual Report 2013
Combined Management ReportEarnings
Key Data: WACKER POLYSILICON
€ million 2013 2012 2011 2010 2009 2008 2007
Total sales 924.2 1,135.8 1,447.7 1,368.7 1,121.2 828.1 456.9
EBITDA 233.9 427.5 747.3 733.4 520.8 422.0 182.2
EBITDA margin (%) 25.3 37.6 51.6 53.6 46.5 51.0 39.9
EBIT 0.1 200.8 545.6 586.7 414.1 349.8 135.0
Investments 290.0 698.1 566.5 309.9 400.1 410.3 259.5
Employees (December 31, number) 2,102 2,349 2,251 1,763 1,600 1,289 1,003
SILTRONIC
Sales Down from Previous YearLagging silicon-wafer demand and lower prices resulted in a sales decline at Siltronic. Its sales decreased 14.4 percent to € 743.0 million (2012: € 867.9 million). While 300 mm wafer business grew slightly during full-year 2013, 200 mm-wafer volumes remained at the prior-year level and the small-diameter wafer segment saw a further slowdown. On the regional front, sales declined year on year in each region. Asia remains the strongest market, although even there sales decreased by more than 10 percent.
EBITDA improved compared with the previous year, climbing to € 26.5 million (2012: € 0.7 million). EBIT did not improve because we recognized an impairment of € 34.8 million for shuttered production facilities in Q4 2013. The rise reflects the effectiveness of Siltronic’s measures to reduce production costs and increase plant utilization. Negative price effects weighed on EBITDA performance. The EBITDA margin was 3.6 percent (2012: 0.1 percent).
Lower Investment LevelInvestments at Siltronic decreased in 2013. They came in at € 30.9 million (2012: € 103.2 million), 70 percent down on one year earlier. The funds chiefly flowed into enhanced technologies.
Siltronic’s workforce shrank substantially due to structural measures. As of December 31, 2013, the division had 3,746 employees (Dec. 31, 2012: 3,978).
Key Data: SILTRONIC
€ million 2013 2012 2011 2010 2009 2008 2007
Total sales 743.0 867.9 992.1 1,024.8 637.5 1,360.8 1,451.6
EBITDA 26.5 0.7 49.2 87.7 –162.4 357.3 478.1
EBITDA margin (%) 3.6 0.1 5.0 8.6 –25.5 26.3 32.9
EBIT –95.9 –92.2 –56.7 –3.5 –414.7 193.8 337.2
Investments 30.9 103.2 128.1 75.5 73.0 199.6 200.0
Employees (December 31, number) 3,746 3,978 4,974 5,025 5,096 5,469 5,634
T 3.15
T 3.16

93Wacker Chemie AGAnnual Report 2013
Combined Management ReportEarnings
Other
In 2013, sales reported under “Other” totaled € 192.7 million (2012: € 162.9 million), up 18.3 percent on the prior-year period.
“Other” EBITDA came to € 14.7 million in the year under review (2012: € 6.1 million).
As of December 31, 2013, the “Other” segment had 4,304 employees (Dec. 31, 2012: 4,283). WACKER reports, for example, site management and infrastructure-unit employees at Burghausen and Nünchritz under this segment.
Divisional Shares in External Sales
Regions
WACKER’s operations are highly international. In 2013, 85.5 percent of the Group’s € 4.48 billion in sales were generated by international business (2012: € 4.63 billion). Germany accounted for 14.5 percent.
Asia Slightly Down from Prior YearRegionally, Asia offers us the greatest opportunities for business and growth. The main impetus is the rising standard of living in Asia’s emerging economies. Accounting for 40.8 percent of Group sales (2012: 40.2 percent), Asia remains our principal market. Sales there reached € 1.83 billion (2012: € 1.86 billion). That is a slight decrease of 1.9 percent. In Greater China ( including Taiwan), though, sales rose. In this region, the Group posted sales of € 1.07 billion, up 8.5 percent (2012: € 986 million). WACKER also made strong advances in India, where our sales climbed 11.1 percent. In Asia, we grew sales at WACKER SILICONES, WACKER POLYMERS and WACKER BIOSOLUTIONS, our three chemical divisions. Sales at WACKER POLYSILICON remained at the prior-year level, but declined at Siltronic.
G 3.17
3.5 % WACKER BIOSOLUTIONS
WACKER SILICONES 37.3 %
18.9 % WACKER POLYSILICON
2.5 % OTHER
16.4 % SILTRONIC
WACKER POLYMERS 21.4 %
€ 4,478.9 million

94Wacker Chemie AGAnnual Report 2013
Combined Management ReportEarnings
External Sales by Customer Location
€ million 2013 2012 2011 2010 2009 2008 2007
Germany 647.0 686.0 899.4 887.3 774.6 948.6 723.5
Rest of Europe 1,073.8 1,090.7 1,186.7 1,175.4 944.1 1,008.2 1,034.7
The Americas 761.0 834.2 846.4 818.2 636.3 852.9 642.6
Asia 1,826.1 1,862.0 1,822.0 1,717.4 1,252.9 1,362.8 1,267.1
Other regions 171.0 162.0 155.2 150.1 111.4 125.6 113.4
Group 4,478.9 4,634.9 4,909.7 4,748.4 3,719.3 4,298.1 3,781.3
Europe Still Marked by Debt CrisisIn Europe excluding Germany, where WACKER has always had a very strong market position, sales came in lower because of the sovereign-debt crisis and the weakness of many EU economies. European sales were down 1.5 percent to € 1.07 billion (2012: € 1.09 billion). Europe accounted for a 24.0 percent share in Group sales (2012: 23.5 percent). In Germany, sales fell more steeply, decreasing 5.7 percent to € 647.0 million (2012: € 686.0 million).
Business in the Americas Below Prior YearIn the Americas, business was below the year-earlier level. Its sales decreased 8.8 percent to € 761.0 million (2012: € 834.2 million). All of WACKER’s divisions were affected by the sales decline. The Americas accounted for 17.0 percent of Group sales (2012: 18.0 percent).
Other Regions Continue to GrowSales in the “Other” regions continued to grow, rising by 5.6 percent to € 171.0 million (2012: € 162.0 million). WACKER generates more than 35 percent of these sales in Middle Eastern countries.
External Sales by Group Company Location
€ million 2013 2012 2011 2010 2009 2008 2007
Germany 3,782.3 3,972.9 4,250.8 4,150.9 3,272.0 3,746.8 3,341.0
Rest of Europe 144.7 156.8 138.3 74.3 23.5 29.4 26.6
The Americas 742.1 817.6 783.0 779.4 599.2 736.4 659.1
Asia 761.6 729.7 750.4 684.1 491.4 546.3 480.2
Other regions 7.0 6.8 7.4 6.3 3.5 2.2 1.8
Consolidation –958.8 –1,048.9 –1,020.2 –946.6 –670.3 –763.0 –727.4
Group 4,478.9 4,634.9 4,909.7 4,748.4 3,719.3 4,298.1 3,781.3
T 3.18
T 3.19

95Wacker Chemie AGAnnual Report 2013
Combined Management Report
Net Assets
Between year-end 2012 and year-end 2013, total assets decreased by 2.5 percent or € 160.4 million to € 6.33 billion (Dec. 31, 2012: € 6.49 billion), mainly because of lower noncurrent assets and a reduction in working capital compared with the prior year. The provisions for pensions recognized by WACKER at the balance sheet date were lower due to remeasurement effects, falling by € 156.2 million. In contrast, the senior unsecured notes placed in the USA in Q1 2013 increased total assets by US$ 400 million, raising both liquidity and financial liabilities. Liquidity was reduced by cash outflows for capital expenditures, the dividend payout and the redemption of bank loans falling due. Foreign currency translation effects reduced total assets by € 104.2 million.
The prior-year figures for equity and liabilities given here differ markedly from those published by WACKER in the 2012 quarterly reports and annual report. This is because of the adoption of the new IAS 19 (revised) accounting standard “Employee Benefits,” which led to a substantial rise in pension provisions. At the same time, equity was reduced. The changes are
presented in detail in the Notes section under “Changes in Accounting and Valuation Methods” on page 212.
Asset and Capital Structure
Assets Equity and Liabilities
2013 Total Assets € 6,332.4 million
2012 Total Assets € 6,429.8 million
G 3.20
Fixed assets 64.2 %
Receivables 16.2 %
Inventories 9.7 %
Cash / securities 9.9 %
34.7 % Equity
22.2 % Provisions
22.3 % Financial liabilities
20.8 % Liabilities /advance payments received
Fixed assets 65.6 %
Receivables 15.7 %
Inventories 11.0 %
Cash / securities 7.7 %
32.7 % Equity
24.3 % Provisions
18.4 % Financial liabilities
24.6 % Liabilities /advance payments received

96Wacker Chemie AGAnnual Report 2013
Combined Management ReportNet Assets
Financial-Position Trends: Assets
Current and Noncurrent AssetsNoncurrent assets fell by € 148.5 million to € 4.39 billion (Dec. 31, 2012: € 4.54 billion), a decrease of 3 percent. They accounted for 69 percent of total assets (Dec. 31, 2012: 70 percent). At € 1.95 billion, current assets were almost unchanged (Dec. 31, 2012: € 1.96 billion) and accounted for 31 percent of total assets (Dec. 31, 2012: 30 percent). In 2013, the assets side of the balance sheet was marked by reduced noncurrent assets owing to lower capital expenditures, by depreciation and impairments, and by high noncurrent and current liquidity.
Intangible Assets, Property, Plant and Equipment, and Investment PropertyIntangible assets, property, plant and equipment, and investment property totaled € 3.81 billion on the balance sheet date (Dec. 31, 2012: € 3.95 billion). Property, plant and equipment decreased by € 138.8 million between January and December 2013. The main reason for this reduction was lower capital expenditures after WACKER extended the timeline for construction of its production site in Charleston (Tennessee, USA), where WACKER POLYSILICON is investing in a new polysilicon production facility. In 2013, the Group posted capital expenditures of € 501.6 million for property, plant and equipment (Dec. 31, 2012: € 975.0 million), down 49 percent from a year earlier. Of that total, around € 250 million was spent on the new plant in Tennessee. Additional investments funded the expansion of business at WACKER SILICONES, WACKER POLYMERS and Siltronic. The lion’s share of WACKER’s capital expenditures was for operations outside Germany. Depreciation amounted to € 527.4 million in 2013 and exceeded capital expenditure. WACKER also recognized impairments of € 37.0 million, particularly for noncurrent assets at Siltronic no longer in use. Exchange-rate movements decreased the value of noncurrent assets by € 70.3 million.
Investments in Joint Ventures and Associates Accounted for Using the Equity MethodInvestments in joint ventures and associates accounted for using the equity method decreased from € 41.0 million to € 18.9 million. This 54-percent decline was mostly due to investment losses from the 300 mm wafer joint venture with Samsung.
Noncurrent Financial Assets and SecuritiesOther noncurrent assets rose 3 percent to € 562.2 million (Dec. 31, 2012: € 544.7 million) and included loans to joint ventures and associates totaling € 231.4 million (Dec. 31, 2012: € 256.2 million). Exchange-rate differences had a negative overall impact of € 15.8 million on noncurrent financial assets. New investments with maturities of more than one year increased noncurrent securities by € 59.7 million to € 120.8 million. Other noncurrent assets also included noncurrent derivative financial instruments, noncurrent tax receivables, and deferred tax assets. Deferred tax assets totaled € 165.7 million as of December 31, 2013 (Dec. 31, 2012: € 182.0 million), primarily as a result of temporary differences from provisions for pensions.
Current AssetsAt € 1.95 billion, current assets were almost unchanged compared with the prior-year figure of € 1.96 billion. Inventories were substantially reduced compared with year-end 2013 levels. They totaled € 616.9 million as of December 31, 2013 (Dec. 31, 2012: € 712.1 million), down 13 percent from a year earlier. Trade receivables remained unchanged, amounting to € 614.1 million as of December 31, 2013 (Dec. 31, 2012: € 600.2 million). The share of total assets accounted for by inventories and trade receivables together was almost unchanged compared with the previous year. It amounted to 19 percent (Dec. 31, 2012: 20 percent).
Other current assets rose by 11 percent to € 714.3 million (Dec. 31, 2012: € 644.9 million) and mainly comprised securities, and cash and cash equivalents. New investments in noncurrent securities reduced the proportion of current securities in the portfolio. At the balance sheet

97Wacker Chemie AGAnnual Report 2013
Combined Management ReportNet Assets
date, current securities were recognized in the amount of € 71.9 million (Dec. 31, 2012: € 243.0 million). Liquid funds rose from € 192.6 million to € 431.8 million at year-end 2013, primarily because of the cash inflow generated by the US$ 400 million loan taken out by the company. At the same time, there was an outflow of liquid funds for capital expenditures, the dividend payout and loan redemptions. Other current assets also include income tax receivables and VAT receivables totaling € 71.6 million, derivative financial instruments in the amount of € 19.6 million and other current receivables amounting to € 119.4 million.
Financial-Position Trends: Equity and Liabilities
Group Equity up SlightlyGroup equity increased slightly relative to December 31, 2012, rising by € 75.8 million to € 2.20 billion (Dec. 31, 2012: € 2.12 billion). As a result, the equity ratio was 34.7 percent (Dec. 31, 2012: 32.7 percent). Group equity was influenced by a number of different factors. Net income for the year increased retained earnings by € 2.6 million. At the same time, the dividend distributed diminished retained earnings by € 29.8 million. Other equity items led to an increase in equity. These were mainly impacted by a pension-provision adjustment that was not recognized in the income statement. At the start of 2013, WACKER switched to the new IAS 19 (revised) accounting and valuation methods for pension provisions. The remeasurement of defined benefit plans carried out at the end of the year led to lower actuarial losses. Changes from the remeasurement of defined benefit plans led to an increase in equity of € 152.8 million in 2013. Increases in the fair value of derivative financial instruments also raised equity by a further € 8.0 million, while negative foreign currency translation effects lowered equity by € 54.7 million.
LiabilitiesWACKER’s liabilities declined by € 236.2 million year on year, totaling € 4.14 billion at the end of 2013 (Dec. 31, 2012: € 4.37 billion). They accounted for 65 percent of total equity and liabilities (Dec. 31, 2012: 67 percent).
Noncurrent LiabilitiesNoncurrent liabilities totaled € 3.08 billion as of December 31, 2013, a year-on-year decline of 4 percent (Dec. 31, 2012: € 3.21 billion). They continued to account for 49 percent of total equity and liabilities (Dec. 31, 2012: 49 percent). The provisions for pensions declined by € 156.2 million, mainly because a higher discount rate (3.8 percent instead of 3.5 percent) was applied for remeasurement than at the end of fiscal 2012. Provisions for pensions amounted to € 1.08 billion as of December 31, 2013 (Dec. 31, 2012: € 1.24 billion), equivalent to 17 percent of total equity and liabilities. Other noncurrent provisions fell slightly as provisions for phased early retire-ment were reduced.
Noncurrent financial liabilities grew by € 288.9 million to € 1.25 billion (Dec. 31, 2012: € 958.5 billion), an increase of 30 percent. Noncurrent financial liabilities now account for 20 percent of total equity and liabilities (Dec. 31, 2012: 15 percent). On April 23, 2013, WACKER issued US$ 400 million in senior unsecured notes in a private placement in the USA. The notes were offered with three maturities, namely five, seven and ten years. The transaction was based on standard market credit terms.
Other noncurrent liabilities fell by € 252.1 million to € 567.3 million (Dec. 31, 2012: € 819.4 million) and mainly comprise advance payments received for polysilicon deliveries in the amount of € 564.4 million. Reclassifications to current liabilities and the retention of advance payments from terminated contracts are the reasons for the € 239.0 million drop in noncurrent advance payments received.

98Wacker Chemie AGAnnual Report 2013
Combined Management ReportNet Assets
Current LiabilitiesCurrent liabilities decreased year on year, totaling € 1.06 billion at the end of 2013 (Dec. 31, 2012: € 1.16 billion), down 9 percent from a year earlier. They accounted for 17 percent of total equity and liabilities (Dec. 31, 2012: 18 percent). Trade payables dropped 19 percent, amounting to € 309.4 million as of the balance sheet date (Dec. 31, 2012: € 379.8 million). This decrease was mainly due to a drop in trade payables in connection with investments. Other current provisions and liabilities rose by 7 percent to € 579.9 million (Dec. 31, 2012: € 542.8 million). The main factor behind this is reclassification of advance payments received as current assets.
WACKER Posts Higher Net Financial DebtCompared with 2012, current financial liabilities fell from € 238.7 million to € 169.3 million. This decrease was due to redeemed loans and to credit lines no longer required for financing working capital. Overall, financial liabilities increased to around € 1.42 billion (Dec. 31, 2012: € 1.20 billion), accounting for 22 percent of total equity and liabilities (Dec. 31, 2012: 18 percent). Current liquidity (current securities, cash and cash equivalents) also rose compared with the prior year. It amounted to € 503.7 million (Dec. 31, 2012: € 435.6 million) – an increase of 16 percent. Noncurrent securities rose from € 61.1 million to € 120.8 million. As of December 31, 2013, WACKER had net financial debt (the balance of gross financial debt and noncurrent and current liquidity) totaling € 792.2 million (Dec. 31, 2012: € 700.5 million), a rise of 13 percent year on year.
Unrecognized Assets and OffBalanceSheet Financial InstrumentsAn important asset that does not appear in our statement of financial position is the value of the WACKER brand and other Group trademarks. We consider the high profile and reputation of our trademarks to be a key factor influencing customer acceptance of our products and solutions. Moreover, there are other intangible assets that are vital for success and have a positive impact on our business – for example, long-standing customer relationships and customer trust in our product- and solution-related expertise. Just as important are our employees’ in-depth skills and experience, and our many years of expertise not only in R & D and project management, but also in designing products and production- and business-process structures. In particular, our integrated production system gives us an edge over our rivals. Another key success factor is WACKER’s sales network, which has evolved over many years and enables the Group to market and sell its range of products and services locally to customers. Various German legal forms of rented and leased goods reported on in Note 17 are also not included in the statement of financial position, nor are other self-constructed assets. WACKER does not use any off-balance-sheet financing instruments.

99Wacker Chemie AGAnnual Report 2013
Combined Management ReportNet Assets
Combined Statement of Financial Position
€ million 2013 2012* Change in %
AssetsIntangible assets, property, plant and equipment, and investment property 3,806.0 3,949.9 –3.6
Investments in joint ventures and associates accounted for using the equity method 18.9 41.0 –53.9
Other noncurrent assets 562.2 544.7 3.2
Noncurrent assets 4,387.1 4,535.6 –3.3
Inventories 616.9 712.1 –13.4
Trade receivables 614.1 600.2 2.3
Other current assets 714.3 644.9 10.8
Current assets 1,945.3 1,957.2 –0.6
Total assets 6,332.4 6,492.8 –2.5
Equity and liabilitiesEquity 2,197.1 2,121.3 3.6
Noncurrent provisions 1,262.0 1,432.3 –11.9
Financial liabilities 1,247.4 958.5 30.1
Other noncurrent liabilities 567.3 819.4 –30.8
of which advance payments received 564.4 803.4 –29.7
Noncurrent liabilities 3,076.7 3,210.2 –4.2
Financial liabilities 169.3 238.7 –29.1
Trade payables 309.4 379.8 –18.5
Other current provisions and liabilities 579.9 542.8 6.8
Current liabilities 1,058.6 1,161.3 –8.8
Liabilities 4,135.3 4,371.5 –5.4
Total equity and liabilities 6,332.4 6,492.8 –2.5
Capital employed 5,238.2 4,979.0 5.2
* Adjusted for the effects of the adoption of IAS 19 (revised); see Changes in Accounting and Valuation Methods in the Notes section.
T 3.21

100Wacker Chemie AGAnnual Report 2013
Combined Management Report
Financial Position
FinancialManagement Principles and GoalsOur key financial-management goal is to maintain WACKER’s financial strength. The central task is to sufficiently cover the financial needs of our operations and investment projects. Financial management at WACKER comprises capital structure management, cash and liquidity management, and the management of market-price risk (currencies, interest rates). Financial management at the Group is centrally organized. A groupwide financial regulation sets out the corresponding tasks and responsibilities.
Capital-structure management involves shaping the capital structure of the Group and its subsidiaries. The latter are capitalized and financed in accordance with the principles of cost and risk optimization, which entails taking account of restrictions on the movement of capital as well as other capital and foreign-currency transfer constraints.
As part of liquidity management, we continuously monitor payment flows from operations and financial business. WACKER covers its resultant liquidity needs via suitable instruments, such as intra-Group financing through borrowings, or through external loans from local banks. We receive the necessary outside funding via contractually agreed credit lines in various currencies and with differing terms. We invest liquidity surpluses on the money and capital markets at an optimum risk /return rate. Cash management centralizes procedures designed to calculate cash requirements and surpluses.
WACKER pursues a careful financing policy that targets a balanced financing portfolio, a diversified maturity portfolio and a comfortable liquidity buffer. In addition to the financing instruments already mentioned, WACKER expects to be able to tap the bond markets and other instruments, if necessary. Our aim is to maintain our corporate financial structures so that the Group’s credit rating remains – at a minimum – in the investment-grade range.
WACKER’s key source of liquidity is its operations and their resultant incoming payments. As part of our cash-management systems, liquidity surpluses at individual Group companies are used to cover the financing needs of other Group companies. This centralized system of internal transfers reduces external borrowing requirements and interest costs.
The purpose of managing market-price risks is to limit the effects of fluctuations in exchange rates and interest rates on the Group’s bottom line. That involves first determining the Group’s overall exposure to currency risks; on the basis of the information obtained, we can then make decisions as regards hedging – namely the volume to be hedged, the respective term of the hedge and the choice of hedging instrument.
Financial AnalysisThe Group’s cash flow is a key instrument of liquidity management. Net cash flow serves as the internal indicator for liquidity measurement. Together with advance payments retained, the net financial debt indicator shows the Group’s level of debt. To enhance the financial scope for ongoing investment projects, WACKER decided to add long-term loans to its financing strategy.

101Wacker Chemie AGAnnual Report 2013
Combined Management ReportFinancial Position
Net Cash FlowIn 2013, WACKER complied with its long-term policy of essentially financing its investments from its own cash flow. Net cash flow totaled € 109.7 million in 2013 (2012: € – 536.2 million), demonstrating that long-term investments are predominantly covered by the cash flow from operating activities.
Net Cash Flow
€ million 2013 2012
Cash flow from operating activities (gross cash flow) 464.0 363.2
Changes in advance payments received 200.9 154.4
Cash flow from long-term investing activities before securities –555.2 –1,053.8
Net cash flow 109.7 –536.2
Net cash flow is the sum of cash flow from operating activities (excluding changes in advance payments) and cash flow from long-term investing activities (before securities), including additions due to finance leases.
Net Cash Flow
2013
2012
2011
2010
2009
2008
2007
– 750 – 500 – 250 0 250 500 750
Financial liabilities amounted to € 1.42 billion as of December 31, 2013 (Dec. 31, 2012: € 1.20 billion), up € 219.5 million year on year. On April 23, 2013, WACKER issued US$ 400 million in senior unsecured notes in a private placement in the USA. The notes were offered with three maturities, namely five, seven and ten years. The transaction was based on standard market credit terms. It enabled WACKER to finance the expansion of its business operations in the USA by means of local-currency loans and to substantially reduce its exposure to currency risks.
WACKER defines net financial debt – which is one of its financial indicators – as the balance of gross financial debt (current and noncurrent financial liabilities) and existing noncurrent and current liquidity, consisting of securities, cash and cash equivalents. In the period under review, net financial debt grew at a substantially slower rate than in 2012. The moderate rise of € 91.7 million to € 792.2 million (Dec. 31, 2012: € 700.5 million) was attributable to substantially reduced capital expenditures compared with the prior year. In 2013, WACKER invested € 503.7 million, which corresponds to an investment ratio of 11 percent (2012: 24 percent).
Aside from the financial liabilities disclosed in the report on net assets, WACKER has at its disposal adequate unused syndicated loans with terms of over one year totaling some € 700 million as of the reporting date. In 2013, WACKER entered into an agreement for an additional special loan of € 80 million from the European Investment Bank to finance research
T 3.22
G 3.23€ million
109.7
– 536.2
– 157.4
289.8
2.9
– 248.7
230.4

102Wacker Chemie AGAnnual Report 2013
Combined Management ReportFinancial Position
and development expenditures at Siltronic. Thus far, this loan has not been drawn down. In addition, new agreements were signed with Chinese banks to refinance existing loans. Our existing credit lines provide us with enough financial scope to secure the Group’s continued growth. The Group does not use any off-balance-sheet financing components.
Net Financial Debt
0
Net financial debt as per
Dec. 31, 2012
Cash flow from operating activities (gross
cash flow)
Cash flow from long-term
investing activities before securities
Dividend paid, Wacker Chemie AG
Exchange-rate effects and other
Net financial debt as per
Dec. 31, 2013
Trend in Cash and Cash EquivalentsCash flow (with its components) shows the change in cash and cash equivalents in the period under review.
Gross Cash FlowIn 2013, cash inflows from operational activities (gross cash flow) amounted to € 464.0 million (2012: € 363.2 million), up 28 percent. Net income for the year dropped substantially year on year, amounting to € 6.3 million compared with € 114.7 million in 2012. This item, however, contained a large number of expenses that did not affect cash flow. Depreciation of € 564.4 million and changes in provisions amounting to € 47.3 million added to gross cash flow. The reduction in working capital ( trade receivables less trade payables from operational activities plus inventories) was another positive impact, adding € 81.7 million to gross cash flow. As expected, advance payments received – relating mainly to future polysilicon deliveries – changed in 2013 by € – 200.9 million (2012: € – 154.4 million) in line with the deliveries made and the advance payments retained in connection with terminated contracts.
Cash Flow from Operating Activities (Gross Cash Flow)
2013
2012
2011
2010
2009
2008
2007
0 250 500 750 1,000 1,250 1,500
G 3.24€ million
– 792.2– 29.8
29.3
– 555.2
464.0
– 700.5
G 3.25€ million
464.0
363.2
867.0
1,103.1
767.5
1,005.4
1,322.5

103Wacker Chemie AGAnnual Report 2013
Combined Management ReportFinancial Position
Cash Flow from Investing ActivitiesThe Group’s investment projects influence cash flow from long-term investing activities. Extension of the timeline for constructing the production site in Charleston, Tennessee (USA) reduced the cash flow from long-term investing activities from € 1.05 billion in 2012 to € 555.2 million in 2013. Capital expenditures mainly concerned property, plant and equipment. In 2013, too, some 50 percent of capital expenditures related to the construction of the new US production site.
Cash Flow from LongTerm Investing Activities before Securities
2013
2012
2011
2010
2009
2008
2007
– 1,250 – 1,000 – 750 –500 –250 0
In 2013, inflows and outflows of cash from securities with maturities exceeding three months were classified as cash flow from investing activities. Cash flow from investing activities totaled € 449.5 million (2012: € 970.4 million). Overall, maturing securities led to incoming payments during the reporting period.
Cash Flow from Financing ActivitiesIn 2013, cash inflow from financing activities was € 227.6 million (2012: € 326.6 million) and mainly comprised the cash inflow from the private placement of US$ 400 million. In addition, bank debt in the amount of € 124.7 million was repaid. The dividend payment by Wacker Chemie AG in the second quarter of 2013 led to a cash outflow of € 29.8 million. Cash and cash equivalents grew by € 239.2 million year on year, amounting to € 431.8 million (2012: € 192.6 million).
Changes in Cash and Cash Equivalents
0
Cash and cash equivalents as
per Dec. 31, 2012
Cash flow from operating activities (gross
cash flow)
Cash flow from investing
activities (before
securities)
Cash receipts and payments for securities
Cash flow from financing
activities
Changes in exchange rates
Cash and cash equivalents as
per Dec. 31, 2013
G 3.26€ million
– 555.2
– 1,053.8
– 831.5
– 681.5
– 800.4
– 983.7
– 678.8
G 3.27€ million
464.0
– 555.2
227.6
105.7192.6
431.8
– 2.9

104Wacker Chemie AGAnnual Report 2013
Combined Management ReportFinancial Position
Proposal on Appropriation of ProfitsIn accordance with German Commercial Code accounting rules, Wacker Chemie AG posted a retained profit of € 636.1 million in 2013. The Executive and Supervisory Boards will propose a dividend of € 0.50 per share at the Annual Shareholders’ Meeting. Based on the number of shares entitled to dividends as of December 31, 2013, the cash dividend corresponds to a payout of € 24.8 million. Calculated in relation to WACKER’s average share price in 2013, the dividend yield is 0.8 percent. At the Annual Shareholders’ Meeting, the Executive and Supervisory Boards will propose treating the remaining amount as profit carried forward.
RatingWACKER has sufficient credit lines with banks and does not issue rated financial instruments such as bonds and commercial paper. Consequently, WACKER has not published a credit rating so far.
Executive Board Statement on Business Development and on the Group’s Economic Position
In 2013, WACKER’s performance was marked by stable sales at its three chemical divisions, persistent price pressure on its silicon wafers and low prices at its polysilicon business. Sales and earnings trends were dampened mainly by weak silicon-wafer prices and by lower year-on-year prices for polysilicon. All in all, price effects reduced Group sales by € 366 million.
Although polysilicon prices hovered at the weak level of late Q4 2012 for most of the year, they did not decline further. The volume trend was positive, with WACKER POLYSILICON achieving strong growth. The solar-dispute agreement between the EU and China revived the market in the second half, so that our production plants were fully utilized. At Siltronic, business was impeded by the weak semiconductor market, declining prices and by negative exchange-rate effects. The devaluation of the yen benefited our Japanese competitors. Despite this situation, we succeeded in improving Siltronic’s EBITDA through cost-saving and productivity measures. At our chemical divisions, we posted volume gains, but sales performance was dampened by price pressure on standard products and by negative exchange-rate effects. WACKER SILICONES expanded its market share and is now the second-largest silicone producer in the world.
Our sales expectations of some € 4.6 billion were revised down to € 4.5 billion with the publication of the Q2 interim report. Our EBITDA forecast remained unchanged.
Personnel expenses, in relation to sales, were lower due to cost-saving measures. Energy costs came in below our target value. Raw-material costs showed a flat price trend and were also below our target value. Depreciation increased compared with the previous year and with our target.
As announced, investments were down by more than half, and amounted to € 503.7 million. Lower investments and tight inventory management meant that the debt level did not rise as much as projected at the start of 2013. Net financial debt for 2013 totaled € 792.2 million, well below € 1 billion. Net cash flow developed better than expected. Here, too, lower investments and our inventory management had a positive impact. Equity was almost unchanged, with an equity ratio at a high level of 34.7 percent.

105Wacker Chemie AGAnnual Report 2013
Combined Management Report
Supplementary Report
In January 2014, Siltronic Holding International B.V. (NL), a 100-percent subsidiary of Siltronic AG, reached an agreement with Samsung Electronics Co. Ltd. to take over a majority stake in the Siltronic Samsung Wafer Pte. Ltd. joint venture. Prior to acquisition of the majority stake, Siltronic and Samsung Electronics each held 50 percent in the joint venture. Siltronic subscribed for new shares as part of a capital increase and now owns 78 percent of the company. Samsung’s stake will decrease to 22 percent as a result. At the same time, all of the joint venture’s outstanding project loans of some € 210 million were repaid. Siltronic is spending about € 150 million in total on this, which will increase the WACKER Group’s net financial debt in 2014.
The joint venture will subsequently be renamed Siltronic Silicon Wafer Pte. Ltd. Upon assumption of control in January 2014, Siltronic Silicon Wafer Pte. Ltd. will be fully con soli-dated in the WACKER Group. Full consolidation will improve Siltronic’s EBITDA in 2014.
Also in January 2014, Wacker Chemie AG restructured its contractual and delivery relationship with one of its solar-silicon customers. WACKER will continue supplying this customer with hyperpure polysilicon for solar cells, albeit under better conditions than before. Delivery volumes and prices were adjusted. Due to the new agreement, WACKER will recognize special income from advance payments retained and from damages received in its financial statements for the first quarter of 2014. WACKER’s first-quarter EBIT (earnings before interest and taxes) will increase by about € 115 million as a result.
There were no fundamental changes in our overall economic and business environment following the closing date of December 31, 2013.
The Group’s organizational and legal structures remained unchanged in the first few weeks of 2014.
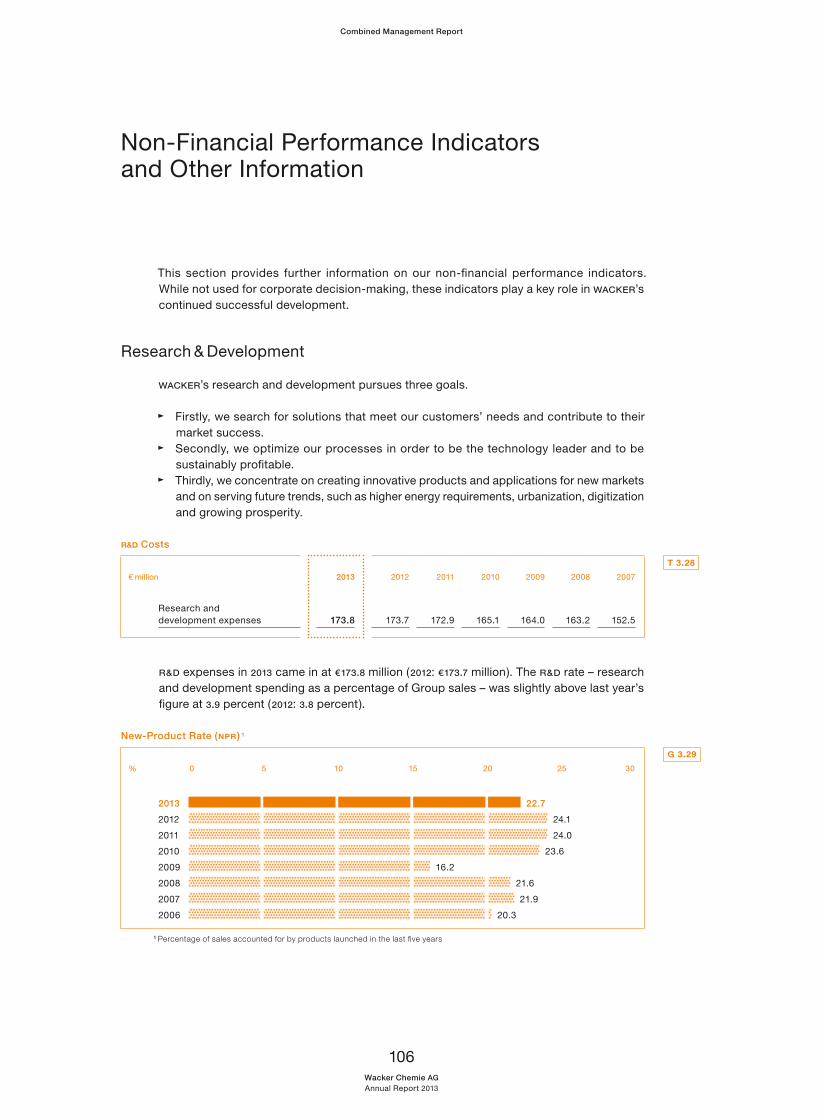
106Wacker Chemie AGAnnual Report 2013
Combined Management Report
Non-Financial Performance Indicators and Other Information
This section provides further information on our non-financial performance indicators. While not used for corporate decision-making, these indicators play a key role in WACKER’s continued successful development.
Research & Development
WACKER’s research and development pursues three goals.
Firstly, we search for solutions that meet our customers’ needs and contribute to their market success.
Secondly, we optimize our processes in order to be the technology leader and to be sustainably profitable.
Thirdly, we concentrate on creating innovative products and applications for new markets and on serving future trends, such as higher energy requirements, urbanization, digitization and growing prosperity.
R & D Costs
€ million 2013 2012 2011 2010 2009 2008 2007
Research and development expenses 173.8 173.7 172.9 165.1 164.0 163.2 152.5
R & D expenses in 2013 came in at € 173.8 million (2012: € 173.7 million). The R & D rate – research and development spending as a percentage of Group sales – was slightly above last year’s figure at 3.9 percent (2012: 3.8 percent).
NewProduct Rate (NPR) 1
2013
2012
2011
2010
2009
2008
2007
2006
0 5 10 15 20 25 30
1 Percentage of sales accounted for by products launched in the last five years
T 3.28
G 3.29%
22.7
24.1
24.0
23.6
16.2
21.6
21.9
20.3

107Wacker Chemie AGAnnual Report 2013
Combined Management ReportNon-Financial Performance Indicators and Other Information
We received about € 7.3 million from licensing agreements in 2013 (2012: € 7.1 million). WACKER’s innovative strength is reflected in the number of patents held and patent applications submitted. In 2013, we filed 123 patent applications (2012: 119). Our portfolio contains about 5,500 active patents worldwide, as well as 2,400 patent applications currently pending.
Licensing Income
2013
2012
2011
2010
2009
2008
2007
2006
0 2 4 6 8 10
In 2013, WACKER invested € 5.9 million in R & D facilities (2012: € 8.9 million). This represents a reduction from the previous year, and reflects the end of major capital expenditures from 2012 (totaling € 30 million) on new laboratory buildings, which are now in operation. Investments in 2013 included new pilot plants that we use to scale up project results from the laboratory scale to full industrial-scale production, or to confirm results from simulations. Examples include polysilicon deposition and conversion, as well as electrically active silicone films. We have automated the analytical processes in the Biologics research department, enabling faster analysis of experimental results. New analytical methods have been introduced in our polymer research and we have established laboratory facilities for silicone research to investigate basic processes in the synthesis of methylchlorosilane (MCS). Corporate Research & Development has built laboratory facilities for the production of nanostructured silicon for lithium-ion batteries.
Investment in R & D Facilities
2013
2012
2011
2010
2009
2008
2007
2006
0 5 10 15 20
8.2
G 3.30€ million
7.3
7.1
6.7
7.5
3.4
2.7
2.6
1.8
G 3.31€ million
5.9
8.9
17.3
13.4
10.2
15.3
8.0

108Wacker Chemie AGAnnual Report 2013
Combined Management ReportNon-Financial Performance Indicators and Other Information
Breakdown of R & D Expenditures
Most of the € 173.8 million (2012: € 173.7 million) in R & D costs was spent on the development of new products and production processes. WACKER scientists are currently working on around 260 projects based on more than 40 technology platforms. More than a quarter of these topics are key strategic projects, which account for 50 percent of all project costs (totaling € 69 million) incurred in 2013. WACKER operates in highly promising fields, ranging from energy, electronics, construction and automotive engineering to household and personal-care products, food and biotechnology. In 2013, we launched the initiative New Solutions. The goal is to develop technically and commercially advanced solutions for new applications. Expertise from various areas in the company is consolidated groupwide and applied to projects as needed. The first projects were initiated in Q4 2013.
We acquired only a small amount of R & D expertise from third parties in 2013, spending some € 170,000 (2012: € 250,000). This amount went to a total of four licensors, with three-fourths used to acquire one particular know-how license, for which we paid € 130,000.
Some of our ongoing research projects in 2013 were subsidized by government grants. Here are a few examples:
In the MAIspeed project, the German Federal Ministry of Education and Research (BMBF) is funding a subproject in which WACKER is involved. Working with partners from industry and academia, we are doing research on new materials for use in fiber-reinforced lightweight construction in areas such as the automotive industry.
In the SiHTF project, the German Federal Ministry for the Environment, Nature Con ser-vation, Building and Nuclear Safety (BMUB) is supporting the development of environ-mentally compatible high-temperature heat-transfer fluids for solar thermal facilities. WACKER coordinates the work being done by the project partners from industry and research.
In the OPERA project, WACKER SILICONES is working on phosphorescent polymers for LED applications. This project is being supported at a European level by the European Nano-electronics Initiative Advisory Council (ENIAC), and by the BMBF in Germany.
In the MAINPAGE joint research undertaking, where WACKER is involved in two projects, the BMBF is funding the development of innovative new materials for industrial photovoltaic applications with enhanced energy efficiency. WACKER POLYSILICON has responsibility for the project aimed at producing granular polysilicon of the highest product quality. Siltronic is leading the research on a continuous, crucible-free pulling process for 200 mm monocrystals with granular silicon.
G 3.32
Process and product optimization 38 %
29 % Product development
10 % Basic research
Technology development 23 %

109Wacker Chemie AGAnnual Report 2013
Combined Management ReportNon-Financial Performance Indicators and Other Information
Our business divisions and Central R & D have submitted applications for six more projects to government sponsors during 2013 with approvals pending. Our externally-funded research projects are coordinated through our Grant Management office, which evaluates candidate programs, submits our project proposals and manages contacts with funders.
Research and Development at Two Levels WACKER conducts R & D at two levels: centrally at our Corporate Research & Development department and locally at our business divisions. Corporate R & D coordinates activities on a company-wide basis and involves other departments, such as Corporate Engineering (during process development). We also use a portfolio-management process to keep our R & D project portfolio transparent throughout the Group. In 2013, we further optimized the Project System Innovation (PSI ) program we use to manage our innovation portfolio and conduct project management. We assess, for example, how we might use the WACKER ® Eco Assessment Tool – developed within our sustainability management unit – for innovation projects. When we do research on new products, we use this tool to systematically examine the use of materials, energy and water, and to assess ecotoxicity over the entire product lifecycle. In the 2013 edition of its multi-project management benchmarking study, the Technical University of Berlin has once again ranked our project and portfolio management as one of the top performers.
Strategic Collaboration with Customers and Research Institutes Our business divisions conduct application-driven R & D. They focus on product and process innovations relating to semiconductor technology, silicone and polymer chemistry, and biotechnology, as well as on new processes for producing polycrystalline silicon. To achieve successful research results more quickly and efficiently, we collaborate with customers, scientific institutions and universities. In 2013, WACKER worked together with more than 40 international research institutes from three continents on 50 research projects.
Our collaborative efforts cover topics such as electricity storage, biotechnology, process simulation and materials research for renewable energy production. Projects include a Central R & D collaboration with the Technical University of Munich and the Fraunhofer organization regarding purification and subsequent methanization of CO2.
WACKER has also created a worldwide network of 22 technical competence centers that liaise between sales offices and local production sites. Specialists in these centers customize products to regional requirements, taking account of climatic conditions, national standards and local raw materials, for example. They develop formulations for customers’ new products, as well as optimize existing recipes.
Research Work at WACKER As the center of WACKER’s R & D activities, Corporate R & D has the task of researching scientific correlations to develop new products and processes efficiently. Another task is to harness and develop new business fields that complement the Group’s core competencies.

110Wacker Chemie AGAnnual Report 2013
Combined Management ReportNon-Financial Performance Indicators and Other Information
R & D Organization
WACKER had 987 research and development staff in 2013, which represents 6.2 percent of the Group’s employees. Our scientists and engineers conduct basic research, develop new products and processes, and improve existing processes. The lab and technical staff at our R & D, applications-technology and production-support facilities work in our laboratories and in our production and pilot plants, or on-site at our customers’ plants. Our other R & D personnel construct research equipment in our workshops, or perform administrative functions in such fields as market research and trend analysis.
Employees in R & D as of December 31, 2013
Number 2013 2012 2011 2010 2009 2008 2007
Group R & D employees 987 1,008 1,100 1,057 1,072 1,078 1,038
R & D ratio1 in Group (%) 6.2 6.2 6.4 6.5 6.9 6.8 6.9
R & D employees, Germany 817 849 868 855 860 836 835
R & D employees, international 170 159 232 202 212 242 203
R & D employees, Germany, by qualification 817 849 868 855 860 836 835
Scientists and engineers 318 339 346 337 332 311 302
Lab staff and technicians 329 332 350 344 349 345 344
Other personnel 170 178 172 174 179 180 189
R & D employees, international, by qualification2 102 92 93 95 90 113 66
Scientists and engineers 38 32 35 31 30 34 29
Lab staff and technicians 34 32 30 32 29 34 36
Other personnel 30 28 28 32 31 45 1
R & D employees, international, Siltronic AG only (without differentiation by qualification) 68 67 139 101 122 127 136
1 Ratio of R & D employees to total number of Group employees2 Excluding R & D employees at Siltronic AG
G 3.33
R & D processes:Portfolio management
Grant management Higher education
management
New businesses
Technology management
Divisional R & D:WACKER SILICONES WACKER POLYMERS
WACKER BIOSOLUTIONS WACKER POLYSILICON
SILTRONIC
Intellectual Property: licenses, patents
Executive Board
Head of R & D
Central R & DConsortium für
elektrochemischeIndustrie
Corporate Engineering:
process development
T 3.34

111Wacker Chemie AGAnnual Report 2013
Combined Management ReportNon-Financial Performance Indicators and Other Information
Alexander Wacker Innovation Award Wacker Chemie AG presented the Alexander Wacker Innovation Award to a project team at Siltronic AG. The team developed a process for manufacturing silicon wafers for high-performance devices. This granular float zone process opens up technological prospects for the custom high-performance wafer market. The € 10,000 Alexander Wacker Innovation Award (named after the company’s founder) has been presented every year since 2005 for pioneering work – alternating between the categories of product innovation, process innovation and basic research.
Siltronic Inventor AwardSiltronic AG confers its Inventor Award on employees who have delivered technological innovations. In 2013, the two categories “Most Important Invention” and “Best Inventor” each awarded € 10,000 in prize money. With their CMP (chemical-mechanical polishing process) and wet-bench cleaning projects, the two winners have optimized processes in the final wafer treatment stages.
Selected Corporate R & D Research Topics On the topic of energy, we continued our activities in electricity storage and conversion. We are working on materials used in lithium-ion batteries to enhance this type of battery for automotive and consumer-product applications. We are also focusing on lightweight construction, as lighter materials can be used to conserve raw materials and energy, for instance in the automotive and aerospace industries. In these fields, we are developing building blocks for composites.
We have created nanoscale silicon structures and incorporated these in formulations for anodes of lithium-ion batteries using new binders. In tests conducted on batteries with these anodes, we have achieved good stability in charge-discharge cycles: compared with commercially available anodes, these have a much higher specific capacitance. We are also developing new additives in the SafeBatt project, also funded by the BMBF, to improve the safety of lithium-ion batteries.
Selected Divisional Research Projects WACKER SILICONES launched new silicone rubber foams for use in medical technology and for cushioning. We enhanced our highly transparent liquid silicones for lighting and improved our additives for cosmetic products. We also conducted research on defoaming agents as processing auxiliaries for industrial applications.
WACKER POLYMERS focused its research during 2013 on polymers that enable the formulation of low-emission end products that will meet the requirements of the most stringent ecolabels. We additionally improved our products in the fields of fire-protection and for ensuring safety in road surfacing. In our VAE (vinyl acetate-ethylene copolymer) technology, we worked on new products to meet customer requirements that differ by region. These include high-performance binders that will allow our customers to lower their production costs in Asian markets. We improved our production methods for dispersions and dispersible polymer powders, and developed new technologies for polymer-modified cementitious dry-mix mortars.
In the VINNEX® product family, WACKER enhanced a binder system for bioplastics. With this system, polymers based on renewable resources can now be processed just like standard thermoplastics. The system improves the physical properties of the bioplastics and makes them compatible with each other. These polymer blends have higher impact strength, higher melt strength or better flexibility than conventional biopolymers. Blends formulated with VINNEX® can be processed into items such as food packaging materials, disposable flatware, parts for electronic appliances and self-degradable gardening and agricultural containers.

112Wacker Chemie AGAnnual Report 2013
Combined Management ReportNon-Financial Performance Indicators and Other Information
Wacker Biotech and XL-protein GmbH showed that antibody fragments with substantially extended activity can be produced efficiently using WACKER’s ESETEC ® secretion technology and XL-protein’s PASylation ®. We custom-developed an efficient bacterial cell line and obtained high yields of the PASylated antibody fragment, which is currently being tested for effectiveness against autoimmune diseases. Working with Metheresis Translational Research, Wacker Biotech developed a cell line based on ESETEC ® for producing an antibody fragment for a cancer drug.
At the start of 2014, Wacker Biotech GmbH acquired a BioNet Ventures GmbH production site for therapeutic proteins and its associated business, as well as the Scil Proteins Production company assets located at its Halle site, including its patent portfolio. Scil Proteins Production has expertise in protein refolding that significantly complements WACKER’s know-how as a full-service provider for the microbial manufacture of biologics. For proteins that cannot be produced in an active form in bacterial cells, refolding is a key technology in order to achieve the desired active properties. The acquisition represents a crucial step toward extending our ability to serve our customers once their drugs fully enter the commercial market following successful regulatory approval.
To improve the energy balance of solar cells and lower our costs, we strive to continuously reduce energy consumption in polysilicon production. WACKER POLYSILICON further optimized the processes in its closed production loop. We have thus once again reduced energy consumption during deposition and conversion.
The performance of semiconductor devices doubles about every two years. Among the key performance-boosting parameters are the design rules achieved on a silicon wafer. They determine how many transistors fit on a device per square centimeter. Today, the semi-conductor industry’s standard design rules are 22 and 16 nanometers (nm). In the coming years, they will decrease to 11 and eventually 8 nm. We are currently developing processes to produce 300 mm wafers that are used for 11 and 8 nanometer design rules. Siltronic’s first 11 nm products are in customer approval processes. We have evaluated the technology for 8 nm wafers and produced the first experimental products.
Transferring Knowledge Locally Our WACKER ACADEMY locations serve as a collection of forums for industry-specific knowl-edge transfer between customers, distributors and WACKER experts. The focus is on industry-specific courses, which now cover silicone applications in addition to polymer chemistry, such as for cosmetics and paints. The training centers’ proximity to our deve lopment and test laboratories promotes the sharing of ideas and enables participants to conduct practical on-site tests. We work with company research facilities, universities and institutes to ensure our seminars remain state of the art.
WACKER attaches considerable importance to fostering young scientific talent and main-taining close contacts with universities. In 2013, we sponsored 120 final-degree theses and internships with students at over 50 universities internationally. We additionally sponsored 16 students at the Institute of Silicon Chemistry, which was founded at the Technical University of Munich in 2006 (making for a grand total of 50 students since the founding of the Institute). Seven of these students completed their doctoral theses in 2013 (the Institute has produced a total of 29 doctoral theses since its founding). Two new graduates joined WACKER in 2013 to pursue careers in R & D.

113Wacker Chemie AGAnnual Report 2013
Combined Management ReportNon-Financial Performance Indicators and Other Information
Key Product Launches in 2013
Product Description Application Sector
BELSIL® ADM 8301 E
Aqueous macroemulsion
Hair conditioners, treatments and masks
Hair-care industry
BELSIL® REG 1100
Silicone resin elastomer Skin care and color cosmetic preparations
Cosmetics industry
CAVAMAX ® W6
Alpha-cyclodextrin
Substitution of sodium caseinate in coconut milk powder, solid-fat-free vegetarian stabilizer for cake icings or egg-free fillings for confectionery products
Food industry
ELASTOSIL® Film
Silicone film
Packaging; dielectric precision films for sensors, actuators and generators
Electronics and packaging industry
ELASTOSIL® R 416 / 70
High-temperature-curing solid silicone rubber
Cost-effective extrusion of fabric-reinforced silicone hoses
Automotive industry
ELASTOSIL® R 781/ 80
Magnetizable solid silicone rubber
Molded parts, profiles, hoses; products that can be detected by metal detectors
Appliance industry, detection systems
ETONIS ® 260
Dispersible polymer powder
Concrete modification for road surfacing
Road, tunnel and underground construction projects
LUMISIL® LR 7600
Highly transparent liquid silicone rubber
Flexible optical lens Automotive, lighting and solar industries
SEMICOSIL® 915 HT
Highly heat-resistant silicone gel
Encapsulation of power semiconductor modules
Electronics industry
SILPURAN ® 2112
Skin-compatible silicone adhesive
Wound dressings, wound treatment
Health industry
SILPURAN ® 2438 ADH
Silicone adhesive Bonding textiles and composites
Prosthetics
VINNAPAS ® 5111 L
Dispersible polymer powder
Self-leveling floorings and smoothing compounds, reduced VOC (volatile organic compounds)
Construction sector
VINNAPAS ® CA 55
Dispersion Adhesives for carpet backings
Carpet industry
VINNAPAS ® LL 3019
Dispersion
Low-emission paint and plaster applications for interior and exterior use
Construction and coatings industry
VINNAPAS ® LL 3112
Dispersion Fire-protection coating Construction and coatings industry
VINNAPAS ® 5518 H
Dispersible polymer powder
Strongly hydrophobic binder for joint sealant and plasters
Construction sector
T 3.35

114Wacker Chemie AGAnnual Report 2013
Combined Management ReportNon-Financial Performance Indicators and Other Information
Employees
Employee Numbers Down SlightlyWACKER’s workforce decreased slightly in 2013. We had 16,009 employees worldwide as of December 31, 2013 (Dec. 31, 2012: 16,292), 1.7 percent down on one year earlier. This decline was mainly due to a restrictive hiring policy when filling open positions.
At the Burghausen site, Siltronic continued its job reductions in 150 millimeter wafer production begun in 2012, eliminating a further 50 positions through December 31, 2013. The cuts were achieved without involuntary layoffs, primarily through job offers at the Group’s other units, phased-early-retirement plans and natural staff turnover. With this restructuring measure, Siltronic adapted production to lower demand levels. We reorganized 300 millimeter wafer production in 2013 by combining the existing structures at the Burghausen and Freiberg sites into one single structure for all of Germany. This resulted in the elimination of 50 jobs through the end of 2013 through internal transfers, phased early retirement and voluntary severance packages.
In February 2013, WACKER canceled the short-time work schedule that had been introduced at Burghausen’s polysilicon facilities back in early October 2012. The Group made this decision amid growing demand from its solar-sector customers.
Number of Employees on December 31, 2013
2013 2012 2011 2010 2009 2008 2007
Germany 12,322 12,635 12,813 12,235 11,925 12,110 11,624
International 3,687 3,657 4,355 4,079 3,693 3,812 3,420
Group 16,009 16,292 17,168 16,314 15,618 15,922 15,044
12,322 WACKER employees (77.0 percent) work in Germany and 3,687 employees (23.0 percent) at non-German sites. We also employed 344 temporary workers in the year under review.
Number of Temporary Workers on December 31, 2013
2013 2012 2011 2010 2009 2008 2007
Germany 286 14 48 374 247 80 333
International 58 77 65 114 53 58 213
Group 344 91 113 488 300 138 546
As a manufacturing company, WACKER has a large contingent of industrial employees (54.2 percent), about an eighth of whom are women (13.2 percent).
Personnel expenses fell to € 1.13 billion (2012: € 1.20 billion), down 6.0 percent from the previous year. These expenses included outlays for social benefits and the company pension plan amounting to € 231.7 million (2012: € 217.3 million).
T 3.36
T 3.37

115Wacker Chemie AGAnnual Report 2013
Combined Management ReportNon-Financial Performance Indicators and Other Information
Personnel Expenses
€ million 2013 2012 2011 2010 2009 2008 2007
Personnel expenses 1,133.0 1,196.8 1,282.5 1,135.7 1,090.3 1,086.1 1,014.9
In addition to their fixed base salary (which includes vacation and Christmas bonuses), WACKER employees usually also receive some variable compensation – a voluntary payment to employees both on the standard and above-standard pay scales. It consists of a profit-sharing amount and a personal-performance component. Employees in Germany received no payment of a profit share in 2013 for the 2012 fiscal year in light of that year’s earnings trend. The portion of variable compensation coupled to personal performance for 2012 will be paid out in the spring of 2014. The Group’s business performance precludes any payment of a profit share or performance bonus for 2013.
We also implemented a series of cost-saving measures in 2013. The Executive Board and Executive Personnel contributed by foregoing 10 percent of their fixed salaries from March through November 2013. Half of this solidarity contribution will be remitted to Executive Personnel during the course of 2014. The salary increases usually awarded to employees on above-standard pay scales for value retention purposes was suspended in 2013.
A WACKER company pension is an important compensation component and is available at most of our German and non-German sites – except for regions where the statutory pension appears sufficient or legal provisions are inadequate. Wacker Chemie AG’s pension fund – Pensionskasse der Wacker Chemie VVaG – provides a company pension to WACKER employees in Germany. The fund has around 17,000 members and provides pension payments to some 7,500 retirees. The average pension paid was around € 630 per month. WACKER pays in up to 3.5 times its employees’ annual pension contributions, with the exact amount being deter-mined by the type of agreement. As of 2014, this amount will be raised to four times the employees’ contribution. Employees can supplement their company pensions by making their own additional contributions. WACKER matches supplementary contributions as provided for by the collective wage agreements. For the base amount, employees receive a 28-percent match called “Chemieförderung I”; additional contributions receive the 13-percent
“Chemieförderung II” match. For salary over and above the pension insurance contribution assessment ceiling, employees in Germany receive an additional supplementary pension.
AwardWinning TraineesVocational training is one of the first steps of personnel development at WACKER. In 2013, 185 young people began their training at WACKER or at the Burghausen Vocational Training Center (BBiW). In total, the company employed 675 trainees, slightly more than a year earlier (2012: 665). At 5.2 percent, the percentage of trainees (ratio of trainees to Group employees in Germany) is also slightly above the previous year’s level (2012: 5.0 percent). 564 trainees are in scientific and technical disciplines and 111 in business-related fields. We offered permanent jobs at WACKER to most of our suitable trainees –124 graduates – in 2013. We additionally offered numerous fixed-term contracts. The Burghausen Vocational Training Center (BBiW) also provides training for some 24 partner companies. The public foundation set up by WACKER thus satisfies an intercompany training mandate – in 2013, partner companies sent 53 trainees to start courses at the BBiW.
T 3.38

116Wacker Chemie AGAnnual Report 2013
Combined Management ReportNon-Financial Performance Indicators and Other Information
The BBiW’s high quality of training is evidenced by all the awards won by its trainees. The Chamber of Industry and Commerce (German: IHK) for Munich and Upper Bavaria named a chemical technician and a logistics clerk the best of the class of 2013. In the Young Welders competition, WACKER trainees took home two gold and two silver medals at the state level. At the German Skills competition held in Leipzig, an electrical installer and an electronics and instrumentation systems technician qualified for World Skills 2013 and were presented with the “Excellence” medal for their achievements.
WACKER also trains young management talent, offering a General Management Trainee Program. Four university graduates completed the 18-month program in 2013.
WACKER will remain innovative and competitive as long as it has highly skilled employees. That is why we offer all our employees opportunities for additional training. At least once a year, employees and supervisors discuss development measures during performance reviews. This approach applies to all levels of corporate hierarchy. In 2013, our workforce completed about 88,000 e-learning sessions (2012: about 95,000), and more than 17,500 participants (2012: more than 15,500) attended seminars, advanced training programs and conventions, or received tutoring.
2013 marked the launch of a new talent-management process at WACKER. Our aim here is to identify and encourage talent at an early stage across the Group and to have candidates available that are sufficiently qualified to assume challenging tasks in the medium and long term. The talent-management process is directed at above-standard payscale employees and Executive Personnel. Employees are discussed at conferences held during the annual talent-management cycle. These conferences initially take place within a corporate sector (business division, corporate department or subsidiary), and are subsequently conducted across corporate sectors. This groupwide approach allows us to present opportunities to employees in small areas and at subsidiaries, too.
Overall, WACKER invested € 7.0 million in personnel-development measures and advanced training (2012: € 7.0 million).
HR Marketing Enhances Graduate ContactsWACKER seeks to remain competitive in the face of demographic trends. Accordingly, we are intensifying our contact to graduates in critical disciplines. In 2013, the HR Marketing depart-ment expanded its talent relationship management in order to form closer ties with external candidates. We intensified our contacts with students whom we got to know during their training or internships with us and whom we considered to be prospects for subsequent employment. We invited graduates of the last five WACKER summer courses for process and chemical engineering students to a first-ever week of seminars designed to help them get ready for their first job. The central topic was social skills.
Idea Management on the Right TrackIn order to do things better and stay competitive, WACKER relies on the ideas submitted by its employees. In 2013, improvement suggestions from our employees were at a record high for the fourth year in succession. In total, we received 9,159 suggestions (2012: 8,982) – roughly two percent more than in the previous year. The participation rate (number of submitters per 100 employees) fell slightly to 32 percent (2012: 34 percent). Our goal is still for every second employee to contribute ideas. The calculable benefit rose to € 7.7 million (2012: € 4.9 million). The WACKER Employee Suggestion Program celebrated its 85th anniversary in 2013.

117Wacker Chemie AGAnnual Report 2013
Combined Management ReportNon-Financial Performance Indicators and Other Information
Idea Management
2013 2012 2011 2010 2009 2008 2007
Number of improvement suggestions 9,159 8,982 8,220 7,702 5,724 5,808 4,440
Participation rate (%) 32 34 34 33 28 28 24
Calculable benefit (€ million) 7.7 4.9 7.8 10.5 11.2 13.5 7.6
WACKER has been addressing the demographic trend for many years. The average age of the Group’s workforce at the reporting date was 42.4. Employees at non-German sites are younger (average age: 40.3) than in Germany (43.0). The age structure abroad varies greatly from region to region. Staff at Asian sites are comparatively young (average age: 34.7), while staff at US locations have an average age of 47.7. Regional variations in age structure are not exclusive to WACKER; they reflect the age structures of the populations in each continent and country.
Demographic Analysis of German and International Sites in 2013
5 %
4 %
3 %
2 %
1 %
0 %
15 35 55 70
Group Germany International
Five HealthManagement Focus AreasTo maintain our long-term innovative and competitive strength at WACKER, we have set ten strategic goals. Long-term measures for the workforce range from basic and advanced training opportunities to health programs. Our health management focuses on five areas: we seek to avoid spinal disorders and cardiovascular diseases in our workforce, increase mental resilience, enable age-appropriate work and find suitable jobs for staff with health restrictions.
In 2013, WACKER launched a preventive-care project in partnership with the South German branch of the country’s statutory retirement plan (Deutsche Rentenversicherung Süd). The aim here is to promote the health of shift workers. In a health program tailored specifically to this group of workers, participants are taught habits that can help them deal better with the pressures of shift work in the long term. The program consists of four modules: a one-week stay at a rehabilitation clinic, a three-month program of training at the workplace, a six-month period during which workers continue the training on their own and a final refresher weekend.
T 3.39
G 3.40Age
Germany ( 43.0 years)International ( 40.3 years)
Group ( 42.4 years)

118Wacker Chemie AGAnnual Report 2013
Combined Management ReportNon-Financial Performance Indicators and Other Information
Our Health Services surveyed the Group’s management employees and Executive Personnel in Germany on mental and social stress. Applying a standardized, internationally recognized surveying method, we wanted to identify potential sources of stress and their consequences, as well as recommended courses of remedial action. The survey showed that, compared with a representative reference group, managerial employees at WACKER see themselves as being subjected to higher quantitative and emotional demands. These types of stress are, however, offset by a substantial range of flexibility in their own work areas.
Work on a new Health Services building at the main Burghausen site commenced in October 2013. The result will be a modern, efficient infrastructure providing occupational and acute medical care to more than 10,000 employees. This facility is scheduled to open in the fourth quarter of 2014.
Good social benefits, competitive compensation and motivating tasks make WACKER an attractive employer. This is demonstrated by the long-term commitment of our employees to our company: The average length of service in Germany (permanent staff ) was 17.3 years (2012: 16.8 years). The 2013 employee turnover rate fell to 3.4 percent groupwide (2012: 7.9 per-cent) and in Germany it was only 0.9 percent (2012: 0.9 percent). At non-German sites, it was 11.9 percent (2012: 30.8 percent).
Employee Turnover Rate
% 2013 2012 2011 2010 2 2009 2008 2007
Germany 0.9 0.9 0.9 0.6 0.7 0.9 0.9
International 11.9 30.8 1 8.9 8.7 8.6 9.3 9.1
Group 3.4 7.9 2.9 2.5 2.5 2.9 2.8
1 Higher employee turnover rate due to closure of Siltronic’s production site at Hikari (Japan) and job cuts at the Portland (USA) site.2 Figures changed to reflect current data from the Sustainability Report for 2009 / 2010.
Managerial Employees Give WACKER a Good AssessmentAs viewed by its own managerial employees, WACKER remained one of the most popular chemical-sector employers in Germany in 2013. In the annual satisfaction survey conducted by Germany’s Association of Chemical-Industry Executives (VAA), the members gave WACKER a 2.80 score – on a par with the 2012 figure (2.78). On average, the 22 chemical, pharmaceutical and medical-technology companies participating in the survey scored 3.1 on a scale of 1 to 6, where 1 is the highest grade. Since some companies improved their year-on-year score, WACKER’s overall ranking fell from fourth place (2012) to sixth place. Experience shows that these results correlate with the company’s financial success.
In a survey of some 36,000 students at 130 universities and other institutions of higher education who were nearing their final exams, the consulting firm “trendence” identified WACKER as a highly popular employer among engineering graduates. The survey once again ranked WACKER among Germany’s top 100 companies to work for in 2013. A student survey conducted by the “Universum” consultancy showed that, in Germany, WACKER was a favored employer for natural sciences majors.
T 3.41

119Wacker Chemie AGAnnual Report 2013
Combined Management ReportNon-Financial Performance Indicators and Other Information
Sustainability
Managing SustainabilityCompanies can only be profitable in the long term if they take their responsibility toward the environment and society seriously. That is why sustainability has been firmly rooted in our business processes for many years. The importance of sustainability to us is demonstrated by the fact that we have made it one of our five strategic goals and have compiled our own Code of Sustainability. Sustainable development means balancing economic, ecological and social factors in everything we do.
Two voluntary global initiatives form the basis for sustainable corporate management at WACKER: Responsible Care ® (the chemical-industry initiative) and the UN’s Global Compact. Through this voluntary commitment, WACKER undertakes to protect the environment, em-ployees and society above and beyond legal requirements. We also expect our suppliers to respect the principles of the UN’s Global Compact and the Responsible Care ® initiative. This is part of our general terms of procurement.
WACKER Greater China won the Responsible Care ® Chairman’s Award in 2013. With this award, the Association of International Chemical Manufacturers in China acknowledged WACKER’s endeavors in environmental and health protection, as well as in plant and workplace safety.
Substantial progress was made on strategic sustainability-management projects in 2013:
Group CertificateOur Group certification ensures that customer-driven specifications and our corporate standards are implemented at all WACKER sites. In 2013, we expanded our Group certification to include our Jincheon site in South Korea (certified to ISO 9001 and ISO 14001) and other sales regions (certified to ISO 9001). Jincheon additionally has local OHSAS 18001 certification. The German sites have introduced an OHSAS 18001 management system. We have merged Wacker Chemie AG’s ISO 14001 certification with that of Siltronic AG.
Almost all WACKER production sites are now included in the Group certificate. Not yet included are the sites in Brazil and India, which have corresponding individual certificates, though. The Jandira site in Brazil also passed an external OHSAS 18001 audit in 2013.
Energy ManagementOur energy goals ensure we meet a requirement for ISO 50001 certification of WACKER Germany. We already had the energy management systems at Wacker Chemie AG and Siltronic certified to this standard in 2012. This was followed in 2013 by the certification of Alzwerke GmbH, whose primary purpose is to generate hydroelectric power.
Greenhouse Gas EmissionsAfter having determined our indirect greenhouse gas emissions from bought-in energy (as per Greenhouse Gas Protocol Scope 2) for the first time in 2011, we started measuring our Scope 3 emissions in 2013. These include all emissions generated along the supply chain, e.g. by suppliers or through waste disposal and the transportation of products. The Group’s carbon footprint is an important tool for improving climate protection.
Lifecycle AssessmentsWe have developed an analytical tool that enables us to estimate, already in the R & D phase, the environmental impact of new products. Launched in 2012, the environmental analysis performed with the Eco Assessment Tool is gradually being established within the Group. It helps us to assess and improve the sustainability of our products.

120Wacker Chemie AGAnnual Report 2013
Combined Management ReportNon-Financial Performance Indicators and Other Information
Sustainability PlatformIn the year under review, we implemented groupwide our new IT system for sustainability reporting (SPIRIT ), replacing the various individual systems. We use the new software to collect and manage environmental and energy data, environment- and safety-related incidents and Integrated Management System ( IMS) audits.
Sustainability ReportIn 2013, WACKER published its new Sustainability Report for 2011 / 2012. The report adheres completely to the G3 guidelines set by the Global Reporting Initiative (GRI). GRI evaluated the report and accorded it an A, their highest report grade. Partly in the interests of environ-mental protection, this was the first time that the company’s report had been published exclusively as an online version. With its new Sustainability Report, WACKER provides a full and transparent account of its sustainability efforts to customers, business partners, employees, shareholders, analysts, non-governmental organizations, regulatory bodies and the neigh bors of its various sites.
Compliance Officers Advising Employees WorldwideWACKER’s ethical principles of corporate management exceed legal requirements. Employees can direct their questions to 22 compliance officers worldwide. They are based in Germany, the USA, China, Taiwan, Japan, India, South Korea, Brazil, Mexico, Singapore and the United Arab Emirates. Compliance issues in countries other than those listed are handled in Germany by the corporate Compliance Officer.
Employees are instructed to inform their supervisors, the compliance officers, the employee council or their designated HR contacts of any violations they notice. In 2013, Compliance Management continued to focus on devising and implementing globally applicable measures in consultation with international sites to ensure compliance with local requirements.
Environmental ProtectionAll WACKER’s processes focus on the need to protect the environment and to manufacture products safely. We attach particular importance to integrated environmental protection. This commences with product development and plant planning. In accordance with the core ideas of the Responsible Care ® initiative, our environmental protection measures often go beyond what is legally required. In 2013, WACKER invested € 5.4 million in environmental protection (2012: € 8.6 million). In the same period environmental operating costs amounted to € 89.4 million (2012: € 79.3 million). WACKER continuously works on improving its production processes to conserve resources. One of our main tasks is to close material loops and recycle byproducts from other areas back into production, enabling us to reduce or prevent emissions and waste. We only have access to partial benchmark figures on how the chemical industry recycles, or disposes of, hazardous chemical waste because of the industry’s product-mix variations and unique site infrastructures.
In 2013, we achieved a slight reduction in direct emissions of carbon dioxide and nitrogen oxides thanks to improvements made to the Burghausen power plant. Lower exterior temperatures during the year under review resulted in reduced water use at Burghausen. We have closed the Burghausen acetaldehyde plant, and this has lowered chemical oxygen demand and emissions of halogenated organic compounds into our wastewater. The total waste volume rose slightly, owing to more filter and sewage sludge resulting from additional capacity utilization at the Nünchritz site, which also saw the disposal of construction waste from the expansion measures. In Burghausen, more chlorosilane was eliminated by incin-eration of residues. The resulting silicic acid was provided to the cement industry for their further use.

121Wacker Chemie AGAnnual Report 2013
Combined Management ReportNon-Financial Performance Indicators and Other Information
Since fiscal 2011, our environmental indicators include our silicon-metal plant in Holla (Norway), acquired in 2010. The environmental impact of metallurgical production there differs greatly from that of WACKER’s typical chemical operations. The environmental indicators, particularly regarding airborne emissions, have risen as a result of the acquisition. Groupwide, WACKER emitted a total of 1,236,000 metric tons of carbon dioxide in 2013 (2012: 1,294,000 metric tons CO2). Lower emissions in 2013 are the result of improved power plant operations and the planned decommissioning of a gas turbine at the Burghausen site. Carbon dioxide makes up 98.5 percent of WACKER’s direct greenhouse gas emissions. The remaining 1.5 percent is made up of nitrous oxide, methane, fluorocarbons and other green-house gases.
Emissions into the Air: Business Divisions / Metallurgy
2013 Groupwide
2012 Groupwide
2013 Business
divisions 1
2012 Business
divisions 1
2013 Metallurgical
production 2
2012 Metallurgical production 2
AirCO2 emissions (kt) 1,236 1,294 925 983 311 310
NOX nitrogen oxides (t) 2,130 2,225 950 1,072 1,180 1,153
Non-methane volatile organic compounds (NMVOCs) (t) 410 418 403 411 7 7
1 WACKER business divisions, without silicon-metal production in Holla, Norway2 Holla site, Norway
Our indirect greenhouse gas emissions from procured energy (as per Greenhouse Gas Protocol Scope 2) rose by 9.5 percent in 2013. The increase in Scope 2 emissions is caused not only by increased production capacity for polysilicon at the Nünchritz site, but also by a shift from Scope 1 to Scope 2 emissions due to the planned shutdown of a gas turbine at the Burghausen site. In addition, one-fourth of the increase is caused by the annual update of regional emission factors used in calculating greenhouse gas emissions.
The Group’s carbon footprint is an important tool for improving climate protection. After determining our indirect greenhouse gas emissions from bought-in energy (as per Green-house Gas Protocol Scope 2) for the first time in 2011, we have also been measuring our Scope 3 emissions since 2012. These include all emissions generated along the supply chain, e.g. by suppliers or through waste disposal and the transportation of products. In the 2013 fiscal year, we once again forwarded these emissions data to the Carbon Disclosure Project (CDP), which WACKER joined in 2007. Founded in London in 2000, CDP is a not-for-profit organization working to achieve greater transparency in greenhouse gas emissions.
Since the fall of 2013, we have been participants in the myccf project of co2ncept plus – a German association of businesses with interests in emissions trading and climate protection issues. In this project, which is supported by the German Federal Environmental Foundation (DBU), we determine our corporate carbon footprint (CCF). We use the resulting data to further optimize our energy management and to improve climate-related environmental protection measures.
T 3.42

122Wacker Chemie AGAnnual Report 2013
Combined Management ReportNon-Financial Performance Indicators and Other Information
Environmental Indicators from 2007 to 2013 1
2013 2012 2011 2010 2009 2008 2007
AirCO2 emissions 2 (kt) 1,236 1,294 1,341 986 969 976 912
NOX nitrogen oxides (t) 2,130 2,225 2,221 926 963 997 838
Non-methane volatile organic compounds
(NMVOCs) (t) 410 418 396 415 383 501 687
Greenhouse gases direct 3 (kt CO2 ) 1,236 1,294 1,341 – – – –
indirect 4 (kt CO2 ) 1,247 1,138 1,075 – – – –
Water Water consumption5 ( thousand m3 ) 220,908 242,072 268,657 252,151 264,532 241,286 244,173
Chemical oxygen demand (COD) (t) 1,320 1,460 1,680 1,820 2,730 4,782 2,162
Halogenated organic hydrocarbons (AOX) (t) 2 3 5 6 6 7 6
WasteDisposed of (t) 31,560 39,920 47,410 48,520 80,860 87,293 43,100
Recycled (t) 110,500 96,880 80,290 77,030 63,430 74,327 74,676
Hazardous (t) 73,380 73,620 68,230 69,320 100,860 108,458 70,027
Non-hazardous (t) 68,680 63,180 59,470 56,230 43,430 53,161 47,538
EnergyElectricity consumption (GWh) 4,526 4,559 4,372 3,759 2,702 2,405 2,107
Primary energy consumption
natural gas (GWh) 5,051 5,927 5,771 5,463 5,378 5,372 –
Solid fuels 6 (coal, charcoal, wood) (GWh) 872 862 886 432 – – –
Heat supplied by third parties (steam and district heating) (GWh) 236 223 218 228 209 195 –
Heating oil (GWh) 17 18 16 13 8 9 –
1 In 2011, the environmental indicators reflected for the first time the silicon-metal production site in Holla (Norway), acquired in 2010.2 Reduction in 2012 due to optimized operation of the Burghausen power station. The figure for 2011 contains final measured emissions for the Burghausen power station in accordance with the monitoring guidelines of the European emissions trading system (EU ETS).
3 As per the Greenhouse Gas Protocol “A Corporate Accounting and Reporting Standard” (published by the World Resources Institute and World Business Council for Sustainable Development), Scope 1: direct emissions without emissions from consumption of purchased energy, no CO2 equivalents
4 As per the Greenhouse Gas Protocol “A Corporate Accounting and Reporting Standard” (published by the World Resources Institute and World Business Council for Sustainable Development), Scope 2: indirect emissions from consumption of purchased energy (electricity, heat), CO2 only; surveyed for the first time in 2011; recalculation of 2011 and 2012 values based on the improved accuracy of selected emission factors (Source: “CO2 emissions from fuel combustion, 2013 edition”, published by the International Energy Agency ( IEA))
5 Decrease at the Burghausen site due to lower capacity utilization of a cooling-water-intensive production line.6 Used in silicon-metal production at Holla, Norway
In the case of wastewater, chemical oxygen demand and halogenated organic compounds were both down because we closed the Burghausen acetaldehyde plant in 2012. Disposable waste has been reduced, since the filter cake from wastewater treatment at Burghausen is now being recycled instead of being disposed of as before.
Water Consumption Tested Using the Global Water Tool ©
In many parts of the world, clean water is particularly scarce, and thus obtaining and purifying water is very expensive there. As a globally-active company, we take such conditions into account in our production processes and during transport. We used the
T 3.43

123Wacker Chemie AGAnnual Report 2013
Combined Management ReportNon-Financial Performance Indicators and Other Information
Global Water Tool © (GWT) developed by the World Business Council for Sustainable Devel-opment (WBCSD) to analyze the annual relative water stress index of the countries in which our main global production sites are located.
This analysis was conducted for the first time in 2012, based on analyses using the water stress index developed by the Water Systems Analysis Group of the University of New Hampshire, USA. This index provides information on the relationship between water con-sumption and the availability of renewable fresh water. The outcome of the analysis is that our most important production sites are located in regions with a low relative water stress index. These regions account for more than 97 percent of our annual water consumption and over 90 percent of our production volume. Production sites in countries for which no GWT-based water stress index information is available account for less than 0.5 percent of our water consumption.
“Save Wastewater and Make a Profit” was the title of a special Employee Suggestion Program initiative launched in July 2013 at the Burghausen site. The goal was to encourage employees to scrutinize any and all parameters relevant for water consumption and recycling in production. When the campaign ended on December 31, 2013, employees had submitted 72 improvement suggestions, with 5 of them implemented by year’s end. Another 30 suggestions were set aside as potential future wastewater treatment projects; examples include sewer-system modifications and retention systems for rainwater.
Product StewardshipWACKER takes criteria for environmental and health protection as well as for safety into account at every stage of the product lifecycle. In research and development projects, we examine the sustainability aspects of our new products and processes, starting with the raw materials used. We try to minimize raw-material consumption while selecting materials that offer maximum ecological benefit.
Our products are generally supplied to business customers for further processing – not directly to end customers. Our lifecycle assessments (LCA S) look at the environmental impact caused by a specific product family throughout its lifecycle – a “cradle-to-gate” assessment extending from manufacturing to the factory gate. They allow us to gauge the sustainability of our products and production processes, and to improve them accordingly.
Product Lifecycles
We have introduced a tool to systematically evaluate the risks and opportunities of our product line from an environmental perspective – starting at the development phase and continuing with feedback from our customers. This WACKER ® Eco Assessment Tool factors in the material, water and energy consumption of a product, as well as its ecotoxicity, over
G 3.44
Use phase by end consumer
Factory gate / shipment
Production at the customer
End-product manufacturing
Recycling / disposal
Raw materials and resources
Production at WACKER
Cradle-to-gate

124Wacker Chemie AGAnnual Report 2013
Combined Management ReportNon-Financial Performance Indicators and Other Information
the entire life cycle. We have already used it to assess initial product families and we will be widening its scope to include other products.
Energy Management The chemical industry is an extremely energy-intensive sector. In Germany alone, it uses around 20 percent of all the power consumed by industry. WACKER is therefore also con-tinually improving the energy efficiency of its processes. This enables us to remain globally competitive and to support climate protection. Many chemical reactions generate heat that can be put to use in other production processes. We have been using integrated heat-recovery systems in Burghausen and Nünchritz for years and are continually improving them. In this way, we can reduce the amount of primary energy (as a rule, natural gas) that our power plants consume.
To further improve energy efficiency and reduce specific energy consumption (amount of energy per unit of net production output), the Executive Board has defined energy targets for WACKER Germany. We already cut specific energy consumption by 22 percent between 2007 and 2013. This should drop a further 11 percent between 2014 and 2022. Overall, by 2022, we will have brought our specific energy consumption down by one-third.
One new tool used by our energy managers is the “energy cascade”, in which computer simu lations are used to compare the current energy consumption of production plants with the theoretical optimum, and to identify the sources of energy losses. In 2013, we used it to determine potential electricity and heat savings for our methylchlorosilane (MCS) synthesis facility at the Nünchritz site.
Generating Energy EfficientlyBurghausen uses hydroelectric power to generate electricity. Our Norwegian site, Holla, also generates its electricity mainly from water power. Our primary source of energy, though, is climate-friendly natural gas. At WACKER’s large Burghausen and Nünchritz sites, we produce steam and electricity in cogeneration systems. These combined heat and power (CHP) plants have more than 80-percent fuel efficiency, which is significantly higher than that of conventional plants, where electricity and heat are generated separately.
Electricity Supply
1 Burghausen / Nünchritz2 Burghausen3 Coal, lignite, oil, gas4 Hydro, wind, solar power5 Outside Germany, we purchase electricity from third parties based on the local standard energy mix
G 3.45
Consumption in Germany 78 %
Consumption abroad 5 22 %
Electricity consumption, Germany: 3,501 GWh
34 % co-generation 1
7 % hydropower 2
59 % procured electricity
51 % fossil fuels 3
18 % nuclear energy31 % renewable energy 4
Procured electricity, Germany 2,068 GWh
Group electricity consumption: 4,526 GWh

125Wacker Chemie AGAnnual Report 2013
Combined Management ReportNon-Financial Performance Indicators and Other Information
In 2013, electricity consumption fell slightly to 4.5 million MWh (2012: 4.6 million MWh). This was caused by the lower utilization of our polysilicon production capacity at the beginning of the year. The Group’s power plants – the hydroelectric and CHP (gas and steam turbine) generating stations in Burghausen and the CHP in Nünchritz – produced around 1.5 million MWh in 2013 (2012: 1.6 million MWh). This means that WACKER covered about a third of its total electricity needs with its own production. Groupwide, carbon dioxide emissions – of which around 90 percent in 2013 (2012: 60 percent) result from captive power plants subject to emissions trading rules and from silicon-metal production in Holla, Norway – totaled about 1.2 million metric tons in the period under review (2012: 1.3 million metric tons). Procurement of emission allowances have been included in energy procurement planning since 2013. Having achieved a surplus in the second trading period (2008 through 2012), we did not have to purchase additional emission allowances for 2013.
WACKER’s German production sites accounted for 78 percent (2012: 76 percent) of its electricity needs. In Germany, we purchased enough electricity from utilities to cover 59 percent of our electricity requirements there (2012: 55 percent). In line with the utilities’ primary energy sources, 51 percent of this electricity was generated from fossil fuels (2012: 60 percent). 18 percent came from nuclear energy (2012: 24 percent) and 31 percent from renewable energy sources (2012: 16 percent). Heat consumption, which includes the use of solid carbon-based and biogenic fuels (coal, charcoal, wood) in silicon-metal production at Holla (Norway), fell slightly across the Group to 3,724 GWh (2012: 3,755 GWh). Consumption of natural gas decreased due to the planned shutdown of a gas turbine at the Burghausen site and to lower hydrogen production compared to the prior-year figure.
Energy Consumption
GWh 2013 2012 2011 2010 2009 2008 2007
Energy consumption 4,526 4,559 4,372 3,759 2,702 2,405 2,107
Heat consumption 1 3,724 3,755 3,862 3,374 2,794 2,782 2,516
Primary energyNatural gas 5,051 5,927 5,771 5,463 5,378 5,372 –
Solid fuels 2 (coal, charcoal, wood) 872 862 886 432 – – –
Heat supplied by third parties (steam and district heating) 236 223 218 228 209 195 –
Fuel oil 17 18 16 13 8 9 –
1 Since 2010, heat consumption figures have reflected the use of solid fossil and biogenic fuels (coal, charcoal and wood) at the silicon-metal plant in Holla, Norway.
2 Used as a reducing agent at the silicon-metal plant in Holla, Norway
Workplace and PlantSafety ProjectsManaging plants and processes in a way that poses no risk to people or the environment is an important objective at WACKER. We therefore operate a groupwide safety management system that covers both workplace safety and plant safety. Our processes and workplace safety standards will be aligned with the international standard OHSAS 18001 by 2015.
Systematic workplace safety includes the regular evaluation of hazards and work-area monitoring. The first step in ensuring plant safety is to identify the risks systematically and then assess them. This includes analyzing how well we control the energy (e.g. pressure, heat) present in a process and determining what influence an individual error might have on a chain of events that could lead to the escape of a substance or an accident. On completion of this comprehensive analysis, we specify safety measures that will prevent undesirable incidents.
T 3.46

126Wacker Chemie AGAnnual Report 2013
Combined Management ReportNon-Financial Performance Indicators and Other Information
We continued the ANSIKO project for machine safety in the year under review. At the German sites and at the SILMIX ® plant in Plzěn (Czech Republic), we identified machinery that poses a risk of injury, subjected their safety plans to critical review and made them even safer to protect employees.
WACKER attaches particular importance to providing ongoing training to its safety experts. We hold regular training sessions, for example, on plant safety and explosion damage protection. Group experts organize safety training at WACKER sites, including those outside Germany. In 2013, we conducted safety reviews internationally at Holla (Norway) and in Brazil, and at the Nünchritz, Freiberg, Cologne and Jena sites in Germany.
Groupwide, there were 3.8 workplace accidents with missed workdays per 1 million hours worked in 2013 (2012: 4.7 accidents), a reduction of 19 percent from the previous year. In terms of reportable accidents (accidents with more than three days of absence), WACKER’s numbers are far better than the German chemical industry average. The reportable accident rate in 2013 was 1.4 per 1 million hours worked (2012: 2.1), whereas in 2012, Germany’s BG RCI (the statutory employer liability insurance carrier of the basic materials and chemical industries) registered 9.5 reportable accidents per 1 million hours worked in chemical companies.
Very few of the accidents at our sites are chemical in nature. The most common causes are tripping, slipping, falling, and inattentiveness during manual activities. Not satisfied with our accident rate, we are increasing our occupational-safety efforts. We are systematically implementing our new WACKER Safety Plus (WSP) program, which incorporates successful safety elements from sites with particularly low accident rates. Such elements include safety patrols, discussions with the workforce and emergency drills. WACKER Safety Plus has the goal of recognizing and avoiding unsafe behavior – on the way to and from work, in the office, at the plant, when operating machinery, or when handling chemicals. Our US subsidiary Wacker Chemical Corporation began introducing some of the key elements of the new safety program at US sites in 2013.
At German sites, WACKER published a safety manual for partner companies. It covers requirements and processes for working with partner companies and aims to ensure that planning, investment and repair projects are carried out safely and accident-free.
Workplace Accidents Involving Permanent Staff and Temporary Workers
Number 2013 2012 2011 2010 2009 2008 2007
Accident rate for Group employees: accidents 1 per 1 million hours worked 3.8 4.7 3.9 4.3 4.0 3.7 3.8
Accident rate for Group employees: reportable accidents 2 per 1 million hours worked 1.4 2.1 1.4 1.2 1.2 1.0 1.4
1 Accidents leading to at least one day off work2 Accidents leading to over three days off work
Few Deficiencies in Hazardous Goods TransportationWACKER ensures that its products are safely stored and transported. Before loading vehicles, we carry out stringent checks on them, especially if they are carrying hazardous goods. We inspected nearly 8,500 trucks in 2013. If a vehicle fails inspection, we continue sending it back until it passes. Failure rates have been low for years now. In 2013, the failure rate for shipments of hazardous goods in Germany dropped to 1.2 percent (2012: 2.2 percent). WACKER normally audits hazardous-goods shippers every two years.
T 3.47

127Wacker Chemie AGAnnual Report 2013
Combined Management ReportNon-Financial Performance Indicators and Other Information
We rely on well-trained personnel for transport safety as well. In 2013, we instructed over 1,300 employees throughout the Group in classroom seminars on the transport of hazardous goods. Another 1,750 completed an online training course.
We regularly review aspects of transport safety with our logistics providers, e.g. during the annual Logistics Day. If deficiencies are found, we agree on improvements and then follow up on their implementation. WACKER uses in-house criteria and internationally recognized systems, such as the Safety and Quality Assessment System (SQAS) operated by the Euro-pean Chemical Industry Council (Cefic), to select logistics service providers and evaluate their performance. Our evaluation criteria include drivers’ qualifications and training, vehicle equipment and accident response. Through the use of standards and specifications, WACKER ensures that even the subcontractors working for our logistics providers meet our stringent safety requirements.
In 2013, we recorded eight transport incidents (2012: ten). This number includes not only accidents involving the distribution of our intermediates and products where we commissioned the transport, but also incidents not involving hazardous goods, whether or not they adversely impact people or the environment. These incidents, too, form part of our shipper assessments.
Transport Accidents
2013 2012 2011 2010 2009 2008 1 2007 1
Road 4 8 6 4 5 11 –
Rail 1 2 1 1 – 4 –
Sea 2 – 1 – – 2 –
Inland waterways 1 – – – – – –
Air – – – – – – –
1 In 2008, the criteria for recording and evaluating transport accidents were redefined. Consequently, no comparable data exist for 2007.
WACKER Promotes Science Education and Social ProjectsCompanies can be commercially successful only if they have society’s trust. which is why we take our social responsibilities seriously, especially in communities near our sites. We place particular importance on the scientific and technical education of young people, as we will need committed chemists, engineers and laboratory assistants in the future if we are to remain competitive.
WACKER officially presented its new 2013 edition of the CHEM2DO experiment kit to the Bavarian State Ministry for Education and Culture. CHEM2DO gives students an opportunity to explore modern silicones and cyclodextrins. The experiments can be adapted to the varied curricula of the German secondary school system. Interested teachers can receive training on the materials throughout Germany. The course is offered at the teacher-training centers of the Society of German Chemists (GDCh) and at select universities. By late 2013, some 850 teachers nationwide, and more than 100 teachers in Austria, had completed the course. In the year under review, WACKER once again sponsored the Dresden / East Saxony regional heat of “Young Scientists.”
T 3.48Number of Accidents

128Wacker Chemie AGAnnual Report 2013
Combined Management ReportNon-Financial Performance Indicators and Other Information
Employees Helping ColleaguesWe attach particular importance to projects that help children and young people. Since 2007, WACKER has supported “Die Arche” (The Ark), a German Christian charity that aids children and adolescents from socially disadvantaged families in several German cities. In the re-porting year, WACKER presented its seventh annual donation of € 100,000 to the charity’s Munich branch.
In June 2013, Germany experienced devastating floods that caused economic damage totaling several billion euros. Several WACKER employees, as well as social institutions in the German states of Saxony and Bavaria, as well as in Austria, were affected by the flooding. WACKER HILFSFONDS, our disaster-relief foundation, appealed for employee donations to help colleagues in distress. Employees responded in numbers and, by the end of 2013, had do-nated approximately € 52,000. Combined with an employer contribution, a total of € 152,000 in donations was collected and will shortly be distributed to those affected.
Procurement and Logistics
WACKER’s procurement volume declined in 2013. This is primarily due to lower investment spending. Volumes are broken down into raw materials and energy, and into services, materials and equipment, with a high proportion for investments. WACKER spent € 3.08 billion (2012: € 3.49 billion) on raw materials, other materials and services. The 2013 figure includes investment-project-related procurements of € 497 million (2012: € 907 million). Our procurement rate – the volumes purchased for raw materials, services and other materials in relation to sales revenue – was 68.8 percent (2012: 75.4 percent). In 2012, we procured some 1,300 different raw materials, and numerous technical goods and services for plant-engineering and main-tenance-related purposes. Our suppliers number 10,300 (9,200 in the Technical Procurement & Logistics department and 1,100 in Raw Materials Procurement).
Energy and RawMaterial Procurement Volumes Slightly Below PriorYear LevelAt € 1.64 billion, the Group’s energy and raw-material procurement volumes remained at the prior-year level (2012: € 1.64 billion). Minimal growth in volume was compensated by lower prices. The prices of the most important raw materials that we require have – with the exception of methanol – remained slightly below or at the prior-year level. Due to scarcity and to trade restrictions imposed on Iran and Libya, methanol prices have risen considerably. In the area of energy procurement, we profited from the fact that some of our production facilities were exempted from the German EEG levy (a renewables surcharge). At the same time, electricity prices were lower than in the previous year. The prices we paid for natural gas were also lower year on year. Of the approximately € 225 million in cost savings achieved in 2013, around € 100 million was attributable to energy and raw-material price effects.
Procurement Volumes ( including Procurement for Capital Expenditures)
€ million 2013 2012 2011 2010 2009 2008 2007
Procurement volumes 3,076 3,493 3,418 2,799 2,342 2,660 2,291
Because the markets for the raw materials we need are so liquid, new procurement contracts are often short-term in order to achieve greater price flexibility.
In 2013, we signed one- to three-year contracts for our strategic raw materials silicon, methanol and vinyl acetate monomer (VAM), thereby securing a medium-term supply in most regions. In North America, we negotiated a long-term supply contract for ethylene that, effective
T 3.49

129Wacker Chemie AGAnnual Report 2013
Combined Management ReportNon-Financial Performance Indicators and Other Information
January 1, 2015, will replace the previous short-term supply contract for more costly cryogenic ethylene ( i.e. frozen ethylene transported in tank cars). As of that date, the majority of the ethylene we require will be supplied via a pipeline.
Technical Procurement & LogisticsThe order volume at the Technical Procurement & Logistics department remained below the prior-year level. There were no further price increases for technical materials and services. Delivery times were at the prior-year level. WACKER – including Siltronic – placed a total of some 350,000 orders worldwide. At Technical Procurement & Logistics, 10 percent of our suppliers cover 90 percent of our procurement volume.
In 2013, we signed major master agreements for installations as well as for logistics services. To lower the risk of dependency on individual suppliers, we launched an initiative that aims to reduce the number of these procurement orders. Our Project Procurement unit handled 20 projects at various stages of planning in 2013. The four largest were the polysilicon expan-sion projects in Nünchritz (Germany) and Tennessee (USA ), as well as the polysilicon purification facility and the new lab building at Burghausen (Germany).
During investment projects in the USA, Asia and Europe, we worked with a large number of qualified local suppliers. We will continue this collaboration, so that WACKER benefits from the advantages of a global procurement market and from enhanced competition among our long-standing suppliers. Our goal is to thereby optimize our procurement costs, delivery times and quality, as well as to quickly tap additional supply sources.
Systematic review of supplier risks is an important tool at WACKER for correctly evaluating our supplier relationships. Reviews are conducted using analyses from rating agencies, our own supplier assessments and, increasingly, direct contact with our partners. With the assistance of Technical Procurement, we reviewed 358 suppliers in 2013.
Percentage of Electronic Procurement Transactions Continues RisingElectronic procurement continues to gain in importance for WACKER. This includes the entire procurement process – starting with the initial inquiry received by the supplier and ending with payment of the invoice. Once again, the percentage of electronic procurement trans-actions has risen. The number of electronic inquiries placed by WACKER is twice as high as the chemical industry average as determined by the German Association of Materials Man-age ment, Purchasing and Logistics (BME). One of the reasons is the increase in electronic tenders through the internet for all services with a services catalog stored in SAP. Additional e-catalogs were introduced for the automated order processes, mainly in the USA and China. Out of a total of around 600,000 orders, some 480,000 were processed electronically, compared with 500,000 in 2012. Broken down, these figures account for some 80 percent of all purchasing transactions in Germany, over 45 percent in the USA, and 15 percent in China. Procurement via e-catalogs remained constant, with the number of suppliers using them rising slightly to 200. There are nearly 2 million e-catalog articles, and at about 200,000 orders, the amount placed using this system was nearly the same as in 2012 (205,000).
Electronic Procurement Orders
2013
2012
2011
0 30,000 600,00
G 3.50€ million
480,000
500,000
450,000

130Wacker Chemie AGAnnual Report 2013
Combined Management ReportNon-Financial Performance Indicators and Other Information
Direct Contact with Our SuppliersAt WACKER, we have always valued direct contact with our suppliers. About 270 companies participated in our 18th Supplier Day in Burghausen. Karl Ley GmbH & Co. KG received the product award for the high quality and purity of its heat exchangers. The best supplier in the repairs and maintenance category was WISAG Produktionsservice GmbH. VEGA Grieshaber KG was recognized for its strong customer focus and continual process optimization. 170 freight forwarders converged on Burghausen for WACKER’s Logistics Day. At this event, DB Schenker Logistics received an award for superior achievement in hazardous goods trans-portation. Lengerich-based Bischof & Klein GmbH & Co. KG was honored as the best packaging supplier. The best logistics partner was UTi in Kelsterbach. WACKER values its long-term collaboration with suppliers and, at the same time, focuses on reducing its dependency on individual ones. In Germany, which remains our largest procurement market, we cooperate with some 6,900 suppliers. The average length of business relationships between Technical Procurement & Logistics and its suppliers is ten years.
Shipping Volume Up Shipping volume rose year on year. Our Burghausen logistics hub shipped some 750,000 metric tons (2012: 740,000 metric tons) of finished products to customers. There was a slight rise in the number of both truck loads and overseas containers. That volume involved about 39,800 truck loads and 12,100 overseas containers.
Transport Volumes for the Burghausen Logistics Hub
Ethylene Pipeline South Started OperationWe are responsible for all of the project logistics entailed in the construction of the new polysilicon facility at Charleston (Tennessee, USA). The infrastructure that was put in place will be used during plant start-up, and for subsequent supply and waste-disposal ope rations. A road connecting the Burghausen plant and the new public freight terminal (combined road / rail terminal ) is being built at the same time as construction work on the terminal, which commenced in December 2012. To this end, we started to build a new freight gate in the northern area of the plant. We will use this gate to expedite container traffic between the plant and the combined road / rail terminal completed in late 2013 and scheduled to officially start operation in mid-2014. The Ethylene Pipeline South (EPS) was started up in 2013. It enables the safe and economical transport of ethylene between major southern German chemical sites and on up to Rotterdam (Netherlands). The ethylene can be transported without emissions and at very low energy costs.
G 3.51
Shipment of approx. 750,000 metric tons of finished products
12,100 overseas containers
> 39,800 truck loads

131Wacker Chemie AGAnnual Report 2013
Combined Management ReportNon-Financial Performance Indicators and Other Information
Production
YearonYear Increase in Production OutputIn 2013, production output increased compared with the previous year. WACKER POLYSILICON sold higher volumes than ever before. Our chemical divisions, too, saw their volumes increase and capacity utilization reach a high level. Capacity utilization at the chemical divisions was in excess of 80 percent. There were no major facility shutdowns. Production costs were up 5 percent. Maintenance costs were at prior-year levels and totaled € 355 million.
PlantCapacity Utilization in 2013
% Plant Utilization
WACKER SILICONES 90
WACKER POLYMERS 82
WACKER POLYSILICON 90
SILTRONIC 77
Investments in new production facilities amounted to € 503.7 million in 2013, with most funds flowing into the expansion of our polysilicon facilities in the US state of Tennessee, where a new polysilicon production site has been under construction since April 2011.
We have built two new plants for WACKER POLYMERS and WACKER BIOSOLUTIONS at our Nanjing site in China. The WACKER POLYMERS plant, for the production of VAE dispersions, has already been started up. It has an annual capacity of 60,000 metric tons. The new VAE dispersion facility at our site in Ulsan, South Korea, is now also operational. Capacity there was increased by 40,000 metric tons. We have stepped up production capacity for VAE dispersions at our site in Calvert City (USA ) by 30,000 metric tons. The new WACKER BIOSOLUTIONS plant for polyvinyl acetate solid resins is scheduled to start production in 2014.
Key StartUps
Location Projects Start-Up
Nanjing VAE dispersions 2013
Ulsan VAE dispersions 2013
Calvert City VAE dispersions 2013
Corporate Engineering is responsible for implementing all investment projects at WACKER.
Productivity Program Targets Lower RawMaterial Consumption and Higher Energy Efficiency
High productivity throughout the supply chain is a key to WACKER’s success. WACKER boosts productivity along the entire supply chain via its Wacker Operating System (WOS) program. Our goal is to continue to reduce specific operating costs every year. 2013 saw the im-plementation of more than 900 projects at our operating divisions and corporate depart ments. Almost 650 of these concerned our operating divisions, with the corporate depart ments accounting for 250. Last year, the focus of WOS was on improving specific energy consumption, raw-material yields and plant utilization levels.
T 3.52
T 3.53

132Wacker Chemie AGAnnual Report 2013
Combined Management ReportNon-Financial Performance Indicators and Other Information
Productivity Projects According to Focus
Total projects
Relating to operations
Relating to corporate departments
0 250 500 750 1,000
During the year under review, our WOS ACADEMY (founded in 2009) held nine training courses at which some 100 employees were trained in the application of new productivity methods, such as Six Sigma.
Sales and Marketing
Sales of WACKER Products Decline SlightlyOur products’ overall sales were slightly lower in 2013. Revenues at WACKER POLYSILICON and Siltronic remained below the previous year, mainly due to pricing policies. Sales at the three chemicals divisions – WACKER POLYMERS, WACKER SILICONES and WACKER BIOSOLUTIONS – matched the prior-year level.
Our business is characterized by high repeat-purchase rates. 99 percent of Siltronic’s 2013 product sales were transacted with customers we had supplied in 2012. At WACKER POLYMERS, the repeat-purchase rate was 95 percent (by revenue), and the rate at WACKER SILICONES was over 92 percent. The repeat-purchase rate at WACKER POLYSILICON is not meaningful, since there are customers who have completely withdrawn from the solar business.
Having introduced “SMART” (a new customer management system) for our three chemical divisions in 2011, we extended its coverage to WACKER POLYSILICON in 2012. This highly inte-grated system allows customer data to be recorded and documented, as well as combined with customer-related data from all SAP modules.
WACKER customers break down into three groups: global key accounts, customers, and distributors. Key accounts are customers of special strategic significance for WACKER and with high sales levels. WACKER currently has 37 key accounts with whom we generated around 25 percent of our 2013 revenue in the chemical divisions (WACKER SILICONES, WACKER POLYMERS, WACKER BIOSOLUTIONS). Over 55 percent of our chemical-related revenue was from our approximately 8,000 other active customer relationships and around 20 percent from distributors.
The share of sales transacted through electronic sales platforms increased further in 2013. Such platforms are in place in 63 countries. E-business is used most frequently in Asia, where it accounts for around 45 percent of sales at the chemical divisions.
G 3.54Number
900
650
250

133Wacker Chemie AGAnnual Report 2013
Combined Management ReportNon-Financial Performance Indicators and Other Information
Sales and Distribution Network OptimizedWe are working with new distribution partners in Poland, the UK and Ireland. China and India are now served by new distributors. We have increased our business with the major international partners Brenntag, DKSH and IMCD. Despite these developments, distributor numbers have not changed from a year earlier. We collaborate with 280 distributors (2012: 280) and five distributor groups. The number of countries in which WACKER sells its products has risen to 95 (2012: 87). Around 80 percent of business with distributors is transacted with just over 50 partners.
Marketing communication is a key element for strengthening WACKER’s branding and for supporting product sales effectively. In 2013, we spent € 14.8 million (2012: € 13.8 million) on marketing communication.
Percentage of Marketing Costs
Attendance at 88 Tradeshows WorldwideWACKER increased its tradeshow presence in 2013, having a booth at a total of 88 trade-shows (2012: 80). For the first time ever, we presented our polymer and silicone products for construction applications at a show in Africa. WACKER demonstrated water-repellent dis-persion powders and silicone sealants at the BUILDEXPO in Nairobi. The calendar for 2013 featured two major events, the plastics show K in Düsseldorf and the coatings show ESC in Nuremberg. We presented 11 new products at the K, and 10 at the ESC. We analyze the success of our tradeshow communications qualitatively and quantitatively, with 24 shows reviewed in 2013 (2012: 23).
Tradeshows in 2013
Total
Europe 1
Asia 2
USA and Canada
South America 3
Russia
Middle East 4
Africa 5
0 25 50 75 100
1 Austria, Belgium, Czech Republic, Denmark, France, Germany, Switzerland, Turkey, UK2 China, India, Japan, Thailand3 Argentina, Brazil, Chile4 Dubai5 Kenya
G 3.55
39% PR work
Advertising 4%
Other 12%
Product communications 15%
Tradeshows 30%
€ 14.8 million
G 3.56Number
88
28
22
18
10
7
2
1

134Wacker Chemie AGAnnual Report 2013
Combined Management Report
Management Report of Wacker Chemie AG(Summary as per the German Commercial Code)
The management report of Wacker Chemie AG and the Group management report for fiscal 2013 are combined in accordance with German Commercial Code (HGB) Section 315, Sub-section 3 in conjunction with Section 298, Subsection 3. The annual financial statements of Wacker Chemie AG, prepared in accordance with the German Commercial Code (HGB), and the summarized management report are published simultaneously in the “Elektronischer Bundesanzeiger” (the electronic version of Germany’s Federal Gazette).
Further to our report on the WACKER Group, we explain developments at Wacker Chemie AG. As required by German law, the combined management report includes all mandatory reporting elements pertaining to Wacker Chemie AG.
Wacker Chemie AG is the parent company of the WACKER Group and is headquartered in Munich, Germany. The parent company operates through four business divisions – WACKER SILICONES, WACKER POLYMERS, WACKER POLYSILICON and WACKER BIOSOLUTIONS – which generate a substantial part of the Group’s sales. Siltronic AG is affiliated with Wacker Chemie AG on the basis of a profit and loss transfer agreement. Wacker Chemie AG’s business is also strongly characterized by its directly- and indirectly-held subsidiaries and investments located in Germany and abroad. Wacker Chemie AG has 55 subsidiaries, joint ventures and associated companies in total. The company also handles the Group’s corporate functions. Wacker Chemie AG’s Executive Board exercises key leadership functions for the whole Group. This Board determines the Group’s strategy, allocates resources (such as funds for investment) and is responsible for the management of ex-ecutive personnel and of corporate finances. It also oversees communication with important target groups, especially capital markets and shareholders.
Key performance indicators used in the management decision-making process are applied groupwide in all business divisions. Corporate goals for the divisions are defined and reported on a groupwide basis. Wacker Chemie AG is an independent entity and as such is not separately managed. For more information, please refer to the respective details provided on the WACKER Group as a whole.
The general business and financial conditions of Wacker Chemie AG principally correspond to those of the Group and are stated in section 3.
Wacker Chemie AG had 9,351 employees as per December 31, 2013.
The financial statements of Wacker Chemie AG were prepared in accordance with the German Commercial Code (HGB) and the German Stock Corporation Act (AktG). Major deviations from the IFRS values exist in relation to fixed assets, depreciation and amortization, provisions for pensions, and deferred taxes. On the EBITDA front, there are only slight differences between IFRS and HGB figures.

135Wacker Chemie AGAnnual Report 2013
Combined Management ReportManagement Report of Wacker Chemie AG
Earnings Performance of Wacker Chemie AG as per the German Commercial Code
Statement of Income
€ million 2013 2012
Sales 3,143.3 3,298.1
Changes in inventories –49.1 –0.1
Other capitalized self-constructed assets 27.4 31.7
Operating performance 3,121.6 3,329.7
Other operating income 188.6 279.4
Cost of materials –1,492.9 –1,536.2
Personnel expenses –720.5 –726.1
Depreciation and amortization –331.7 –341.3
Other operating expenses –608.1 –616.4
Operating result 157.0 389.1
Result from investments in joint ventures and associates –46.2 –245.7
Net interest income –41.8 –40.0
Other financial result –4.8 –4.9
Financial result –92.8 –290.6
Pretax income 64.2 98.5
Income taxes –52.6 –83.6
Net income 11.6 14.9
Profit carried forward from the previous year 654.3 978.7
Dividends paid –29.8 –109.3
Allocations to retained earnings – –230.0
Retained profit 636.1 654.3
EBITDA 488.7 730.4
* EBITDA is the operating result before depreciation and amortization.
Earnings at Wacker Chemie AG in 2013 were marked by a further reduction in the operating result. Net income of € 11.6 million remained roughly at the prior-year level (2012: € 14.9 million). A decline in sales, in particular at WACKER POLYSILICON, resulted in a lower operating result. Counteracting this were advanced payments retained and damages received related to terminated long-term supply contracts for polysilicon amounting to a total of € 77.6 million, although this was less than the prior-year figure of € 113.1 million. The previous year’s financial result was also impacted by impairment losses on investments in the amount of € 175.0 million. In fiscal 2013, € 8.0 million in impairments on investments was recognized. Pre-tax income came in at € 64.2 million (2012: € 98.5 million). Tax expenses were impacted by non-recurring effects, due in particular to non-tax-deductible expenses, resulting in net income of € 11.6 million. In the previous year, net income of € 14.9 million was reported.
T 3.57

136Wacker Chemie AGAnnual Report 2013
Combined Management ReportManagement Report of Wacker Chemie AG
Sales declined from € 3.30 billion to € 3.14 billion. This is a year-on-year drop of 5 percent. Whereas WACKER SILICONES and WACKER BIOSOLUTIONS succeeded in boosting their sales, WACKER POLYMERS and WACKER POLYSILICON recorded declining sales. WACKER SILICONES increased its sales by 3 percent to € 1.30 billion (2012: € 1.27 billion). WACKER BIOSOLUTIONS’ sales grew to € 118.6 million (2012: € 114.4 million). Sales at WACKER POLYMERS were somewhat lower, declining by 3 percent to € 625.0 million (2012: € 642.0 million). Prices for polysilicon were lower year on year, reducing sales at WACKER POLYSILICON by 18.5 percent to € 896.1 mil-lion (2012: € 1.10 billion). The agreement in the solar dispute revived the market in the second half of 2013, so that WACKER was able to sell large volumes of polysilicon. Operating performance fell by € 208.1 million to € 3.12 billion. This included inventory reductions of € 49.1 million.
In 2013, the cost of materials declined slightly to € 1.49 billion (2012: € 1.54 billion). This drop reflected lower energy expenses. Prices for strategic raw materials were somewhat lower on average than in 2012.
Personnel expenses remained at the previous year’s level, coming in at € 720.5 million (2012: € 726.1 million). The fact that personnel costs did not drop even further is due to the collective bargaining agreements reached for 2013, which increased personnel expenses. Wacker Chemie AG had 9,370 employees as per December 31, 2013 (Dec. 31, 2012: 9,467).
Research and development costs at Wacker Chemie AG remained at the previous year’s level, coming in at € 102.4 million (2012: € 105.0 million).
Depreciation and amortization decreased slightly to € 331.7 million (2012: € 341.3 million).
The other operating result, consisting of other operating income less other operating ex-penses, decreased by 24 percent (on balance) to € –419.5 million (2012: € –337.0 million). This decrease is largely due to a reduction in advance payments retained and damages received relating to terminated polysilicon contracts. In 2013, these payments amounted to € 77.6 million (2012: € 113.1 million). Conversely, the improvement in foreign currency gains and losses from operations reduced the net loss to € 2.0 million (2012: € 10.0 million). Reversals of provisions led to an increase in the other operating result, on balance, of € 14.2 million (2012: € 24.4 million). Major effects on other operating expenses beside the foreign currency loss were: outgoing-freight expenses, customs duties, other selling expenses, as well as other contractor work.
The operating result came in at € 157.0 million, around 60 percent below the 2012 level (€ 389.1 million). In particular, lower revenue was the main cause of this drop. Due to decreased operating performance, the material-to-sales ratio rose to 47.8 percent (2012: 46.1 percent). The labor-to-sales ratio also went up, reaching 23.1 percent (2012: 21.8 percent).
The result from investments in joint ventures and associates contains expenses for losses assumed under profit-and-loss transfer agreements. Also included is an € 8 million impair-ment of the stake in WACKER’s Brazilian subsidiary. The prior-year result from invest ments in joint ventures and associates was impacted chiefly by impairments of investments in Chinese companies totaling € 175 million. In 2012, the intracompany transfer prices between the Chinese WACKER companies and the associated company Dow Corning (ZJG) Co. Ltd., which produces siloxane at the Zhangjiagang site in China, were adjusted to reflect altered market conditions. This led to a reduction in transfer prices for siloxane and an impairment of the carrying amount of the investment in Singapore-based Dow Corning (ZJG) Holding Co. Private Ltd.

137Wacker Chemie AGAnnual Report 2013
Combined Management ReportManagement Report of Wacker Chemie AG
The losses assumed, resulting principally from Siltronic AG and amounting to € –105.3 million (2012: € –112.0 million), were compensated by combined earnings from dividends and profit-and-loss transfers relating to the chemical holdings and Siltronic in the amount of € 67.1 million (2012: € 41.3 million).
The net interest result remained at the previous year’s level, coming in at € –41.8 million (2012: € –40.0 million). This is chiefly due to slightly higher expenses for interest accruing to provisions for pensions. Income from investments in securities and fixed deposits as well as interest expenses for financial liabilities remained nearly constant compared to the prior-year level.
Income tax expenses amounted to € 52.6 million (2012: € 83.6 million). Tax expenses were higher year on year, due in particular to non-tax-deductible expenses.
Net income was € 11.6 million. In the previous year, net income of € 14.9 million was generated. Retained profit for 2013 – calculated as the profit carried forward from 2012 less € 29.8 million in dividends paid – amounted to € 636.1 million (2012: € 654.3 million).
Net Assets and Financial Position of Wacker Chemie AG as per the German Commercial Code
Statement of Financial Position
€ million 2013 2012
AssetsIntangible assets 5.1 5.9
Property, plant and equipment 1,639.4 1,823.0
Financial assets 1,700.0 1,453.6
Fixed assets 3,344.5 3,282.5
Inventories 388.6 447.5
Trade receivables 347.3 330.1
Other receivables and other assets 593.2 805.7
Receivables and other assets 940.5 1,135.8
Securities 58.1 175.4
Cash on hand, demand deposits 337.8 125.2
Current assets 1,725.0 1,883.9
Accruals and deferrals 2.5 3.4
Total assets 5,072.0 5,169.8
Equity and LiabilitiesSubscribed capital 260.8 260.8
Less nominal value of treasury shares –12.4 –12.4
Issued capital 248.4 248.4
Capital reserves 157.4 157.4
Other retained earnings 1,000.0 1,000.0
Retained profit 636.1 654.3
Equity 2,041.9 2,060.1
Provisions for pensions and similar obligations 571.1 535.7
Other provisions 328.4 297.6
Provisions 899.5 833.3
Financial liabilities 1,113.7 1,056.2
Trade payables 155.9 154.4
Other liabilities 861.0 1,065.8
Liabilities 2,130.6 2,276.4
Total equity and liabilities 5,072.0 5,169.8
T 3.58

138Wacker Chemie AGAnnual Report 2013
Combined Management ReportManagement Report of Wacker Chemie AG
The amount of total assets held by Wacker Chemie AG dropped slightly to € 5.07 billion (2012: € 5.17 billion). This represented a decrease of 2 percent compared to year-end 2012, whereby individual balance-sheet items had counteracting effects.
Fixed assets grew to € 3.34 billion in 2013 (2012: € 3.28 billion). Property, plant and equipment increased to € 153.2 million, primarily due to investments in plant and machinery. Depreciation reduced property, plant and equipment by € 328.1 million (2012: € 337.6 million), while financial assets grew from € 1.45 billion to € 1.70 billion. On the one hand, € 191.1 million was added to the equity base of Wacker Polysilicon North America, LLC, an intermediate holding company for production purposes. This measure ensured financing for construction of the Tennessee production site. On the other hand, impairments totaling € 8.0 million were recognized on the investment in WACKER’s Brazilian subsidiary.
Additionally, the closed investment fund recognized as a financial asset was increased from € 140.0 million to € 200.0 million. Liquidity not required in the short term is invested in this fund and held for future financing of investment projects. Fixed assets account for 66 percent of total assets held by Wacker Chemie AG. A year earlier, the ratio had been 63 percent.
The level of inventories sank substantially year on year, to € 388.6 million (Dec. 31, 2012: € 447.5 million), down 13 percent from a year earlier. In particular, high capacity utilization at WACKER POLYSILICON lead to low inventory levels at the balance-sheet date. Trade receiv-ables increased from € 330.1 million to € 347.3 million. Other receivables and other assets declined to € 593.2 million as of the balance-sheet date, 26 percent down on one year earlier. Receivables from affiliated companies decreased significantly, amounting to € 475.6 million (Dec. 31, 2012: € 676.7 million). This decrease was due to repayment of the ongoing financing provided by the production company Wacker Polysilicon North America, LLC for construction work taking place at the new production site in Charleston, Tennessee. This company now receives its funding from its US parent company Wacker Chemicals Corporation, which issued $ 400 million in senior unsecured notes in a private placement in the USA for this purpose. Other assets decreased by 10 percent to € 107.4 million (Dec. 31, 2012: € 118.8 million). Other assets mainly comprise tax receivables and other receivables.
As per December 31, 2013, Wacker Chemie AG held € 51.2 million in commercial paper with a term of less than three months. Wacker Chemie AG’s cash on hand and demand deposits amounted to € 337.8 million as of December 31, 2013 (2012: € 125.2 million).
Equity amounted to € 2.04 billion as of the reporting date (2012: € 2.06 billion). This corresponds to an equity ratio of 40.3 percent (2012: 39.8 percent). At the annual Wacker Chemie AG shareholders’ meeting, a resolution was passed to distribute € 29.8 million in retained profit from 2012 as dividends. The remaining retained profit of € 624.5 was carried forward. Retained profit as of December 31, 2013 primarily comprised the current net income in 2013 of € 11.6 million and profit carried forward from 2012 of € 624.5 million that was not distributed as dividends.
As expected, provisions for pensions and similar obligations continued to rise in comparison to the previous year – up by € 35.4 million to € 571.1 million (2012: € 535.7 million), Other provi-sions, too, increased in 2013, by € 30.8 million to € 328.4 million, a rise of 10 percent. This balance-sheet item is comprised primarily of provisions for taxes, personnel and environ-mental protection, as well as other provisions. The reason for the increase was in particular additions to provisions for taxes and for personnel. All in all, provisions constituted 18 percent of total equity and liabilities.
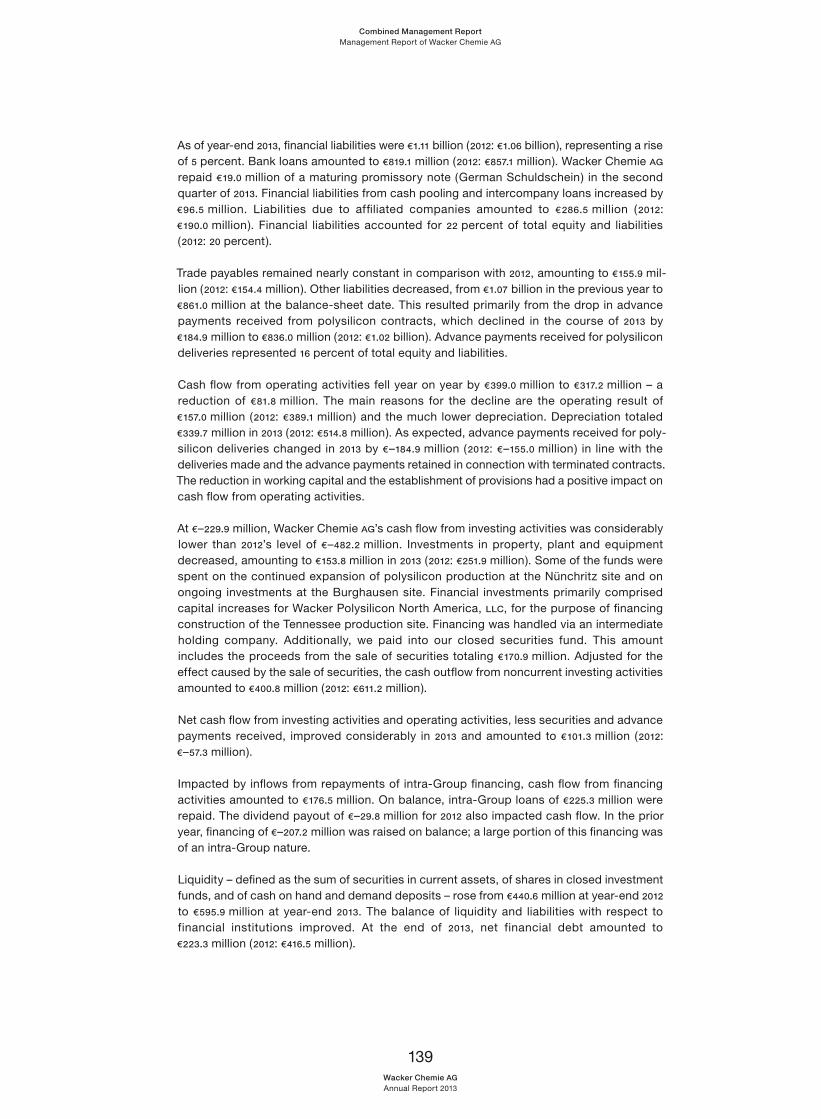
139Wacker Chemie AGAnnual Report 2013
Combined Management ReportManagement Report of Wacker Chemie AG
As of year-end 2013, financial liabilities were € 1.11 billion (2012: € 1.06 billion), representing a rise of 5 percent. Bank loans amounted to € 819.1 million (2012: € 857.1 million). Wacker Chemie AG repaid € 19.0 million of a maturing promissory note (German Schuldschein) in the second quarter of 2013. Financial liabilities from cash pooling and intercompany loans increased by € 96.5 million. Liabilities due to affiliated companies amounted to € 286.5 million (2012: € 190.0 million). Financial liabilities accounted for 22 percent of total equity and liabilities (2012: 20 percent).
Trade payables remained nearly constant in comparison with 2012, amounting to € 155.9 mil-lion (2012: € 154.4 million). Other liabilities decreased, from € 1.07 billion in the previous year to € 861.0 million at the balance-sheet date. This resulted primarily from the drop in advance payments received from polysilicon contracts, which declined in the course of 2013 by € 184.9 million to € 836.0 million (2012: € 1.02 billion). Advance payments received for polysilicon deliveries represented 16 percent of total equity and liabilities.
Cash flow from operating activities fell year on year by € 399.0 million to € 317.2 million – a reduction of € 81.8 million. The main reasons for the decline are the operating result of € 157.0 million (2012: € 389.1 million) and the much lower depreciation. Depreciation totaled € 339.7 million in 2013 (2012: € 514.8 million). As expected, advance payments received for poly-silicon deliveries changed in 2013 by € –184.9 million (2012: € –155.0 million) in line with the deliveries made and the advance payments retained in connection with terminated contracts. The reduction in working capital and the establishment of provisions had a positive impact on cash flow from operating activities.
At € –229.9 million, Wacker Chemie AG’s cash flow from investing activities was considerably lower than 2012’s level of € –482.2 million. Investments in property, plant and equipment decreased, amounting to € 153.8 million in 2013 (2012: € 251.9 million). Some of the funds were spent on the continued expansion of polysilicon production at the Nünchritz site and on ongoing investments at the Burghausen site. Financial investments primarily comprised capital increases for Wacker Polysilicon North America, LLC, for the purpose of financing construction of the Tennessee production site. Financing was handled via an intermediate holding company. Additionally, we paid into our closed securities fund. This amount includes the proceeds from the sale of securities totaling € 170.9 million. Adjusted for the effect caused by the sale of securities, the cash outflow from noncurrent investing activities amounted to € 400.8 million (2012: € 611.2 million).
Net cash flow from investing activities and operating activities, less securities and advance payments received, improved considerably in 2013 and amounted to € 101.3 million (2012: € –57.3 million).
Impacted by inflows from repayments of intra-Group financing, cash flow from financing activities amounted to € 176.5 million. On balance, intra-Group loans of € 225.3 million were repaid. The dividend payout of € –29.8 million for 2012 also impacted cash flow. In the prior year, financing of € –207.2 million was raised on balance; a large portion of this financing was of an intra-Group nature.
Liquidity – defined as the sum of securities in current assets, of shares in closed investment funds, and of cash on hand and demand deposits – rose from € 440.6 million at year-end 2012 to € 595.9 million at year-end 2013. The balance of liquidity and liabilities with respect to financial institutions im proved. At the end of 2013, net financial debt amounted to € 223.3 million (2012: € 416.5 million).

140Wacker Chemie AGAnnual Report 2013
Combined Management ReportManagement Report of Wacker Chemie AG
Risks and OpportunitiesWacker Chemie AG’s business performance is subject to the same risks and opportunities as those facing the WACKER Group. In principle, Wacker Chemie AG’s exposure to risks at subsidiaries and investments depends on the size of its stakes in the respective entities. Through our subsidiaries and holdings, we could face impairments arising from legal or contractual contingencies (especially financing). These contingencies are explained in the Notes of Wacker Chemie AG.
As the parent company of the WACKER Group, Wacker Chemie AG is integrated in the group-wide risk management system.
For further details, see pages 252 to 254 of this Annual Report. The description of the internal control system for Wacker
Chemie AG, as mandated by Section 289, Subsection 5 of the German Commercial Code (HGB), can be found in the section
on Internal Control System (ICS) and Internal Control System for Accounting starting on page 143.
OutlookWACKER’s main assumptions in its planning relate to raw-material and energy costs, personnel expenses and exchange rates. For 2014, we are planning on an exchange rate of US$ 1.35 and ¥ 135 to € 1.
Essentially, Wacker Chemie AG’s prospects for 2014 mirror the business trend at WACKER, which is fully explained in the Group’s Outlook section. Please refer to pages 165 to 178 of this Annual Report.
We expect year-on-year sales to rise by a mid-single-digit percentage and anticipate that EBITDA will increase by at least 10 percent against the prior year.
Projections indicate that Wacker Chemie AG’s net income will be in slightly positive territory.
PublicationThe annual financial statements of Wacker Chemie AG have been submitted to the publisher of the online German Federal Bulletin and can be viewed on the website of the German register of companies. KPMG AG Wirtschaftsprüfungsgesellschaft, Munich, audited the annual financial statements and provided them with an unqualified audit certificate. The statement of financial position and the statement of income are the main documents published here. Wacker Chemie AG’s annual financial statements are published together with those of the WACKER Group. The annual financial statements can be requested from Wacker Chemie AG, Hanns-Seidel-Platz 4, 81737 München, Germany. They can also be accessed on the internet at: www.wacker.com

141Wacker Chemie AGAnnual Report 2013
Combined Management Report
Risk Management ReportDescription and Statement Relating to WACKER’s Internal Control and Risk Management System
Risk Management Is an Integral Part of Corporate Management
Risk management is an integral part of corporate management at WACKER. As a globally active company, WACKER is exposed to numerous risks directly attributable to our opera-tional activities. Starting from an acceptable level of overall risk, the Executive Board decides which risks we should take to utilize opportunities available to the company. The goal of risk management at WACKER is to identify risks as early as possible, to evaluate them appropriately, and to limit them through suitable measures. We define risks as internal and external events that have a negative effect on the attainment of our targets and forecasts. Compared with the previous year, we made no fundamental changes to the existing risk management system in 2013. The scope of consolidation for risk reporting purposes comprises all WACKER majority shareholdings, as well as companies consolidated using the equity method.
As a specialty-chemical and semiconductor company, we have a particular responsibility to ensure plant safety and to protect health and the environment. All our production sites have coordinators who manage plant and workplace safety, alongside health and environmental protection. Our risk management complies with legal requirements and is a component in all our decisions and business processes. The Executive and Supervisory Boards are regu-larly informed about the current risk status in the Group and at each business division.
Risk ManagementWACKER focuses on identifying, evaluating, managing and monitoring risks as part of a transparent risk management and control system for all company processes. The system is based on a defined risk strategy and an efficient reporting procedure. It involves the Executive Board regularly reviewing and enhancing our risk strategy, particularly with regard to our groupwide processes for strategic planning and reporting. The Supervisory Board’s Audit Committee receives regular briefings on existing risks from the Executive Board. Opportunities, however, are neither systematically identified as part of risk manage-ment, nor are they communicated in the context of internal Group management reporting.
All corporate areas are integrated into the risk management system. It consists of three intermeshed aspects:
Division-specific risk management, including corresponding early-warning systems Groupwide risk coverage Groupwide risk mapping

142Wacker Chemie AGAnnual Report 2013
Combined Management ReportRisk Management Report
Risk Management Structures and ToolsWACKER’s risk management system spans a variety of aspects. This groupwide system draws on existing organizational and reporting structures, supplemented by additional elements:
The risk management manual: this contains the system’s principles and processes. It explains reportable levels of risks and how risks are to be covered and mapped.
The risk management regulation: it stipulates groupwide reporting requirements, including when a specific committee must be informed.
The risk management coordinator: this coordinator is responsible for the risk management system and is supported by local risk coordinators.
The risk list: this records each specific risk facing our divisions and other corporate sectors. Reporting is mandatory for individual risks where the effect on earnings would exceed € 5 million.
Risk IdentificationWACKER identifies risks at two levels: for the individual divisions, and at a Group level. We employ various instruments to ascertain and identify risks. These include order intake development, market and competition analyses, customer talks and ongoing observation and analysis of the economic environment.
Risk Management System
Assessment, Quantification and Management of RisksWe analyze each identified risk’s probability of occurrence and potential effects on earnings. Corporate Controlling compiles a monthly report to inform the Executive Board of current and expected future business developments and their associated risks. We evaluate and balance risks and opportunities at regular meetings with our divisions.
Corporate Controlling ensures that our risk management standards are implemented and that our risk management process is refined. It not only records every substantial risk groupwide, but also evaluates them systematically according to uniform criteria. Major risks and those endangering the continued existence of the company are immediately com-municated via ad-hoc reporting. As the divisions are responsible for their own results, this process is closely interwoven with operational controlling. Individual divisional risks are identified and evaluated on a monthly basis. Operational risk management is thus firmly rooted in the divisions. At the same time, Corporate Finance and Insurance, Corporate Accounting and Tax, Raw Materials Procurement, Technical Procurement & Logistics, and Legal are involved in risk controlling at the Group level.
Financial risks are managed at Corporate Finance, which is responsible for all measures relating to exchange-rate and interest-rate hedging transactions, and for all measures needed to ensure adequate Group liquidity. WACKER’s scope of action is set out in detailed
G 3.59
Supervisory and Executive Boards
Risk management basis
Risk list Risk management
manual
Risk management
regulation
Risk identification: all business divisions and corporate departments
Risk monitoring: internal control
system, Corporate Controlling
Risk coverage: legal and insurance functions
Control of the risk management
process: Corporate Auditing
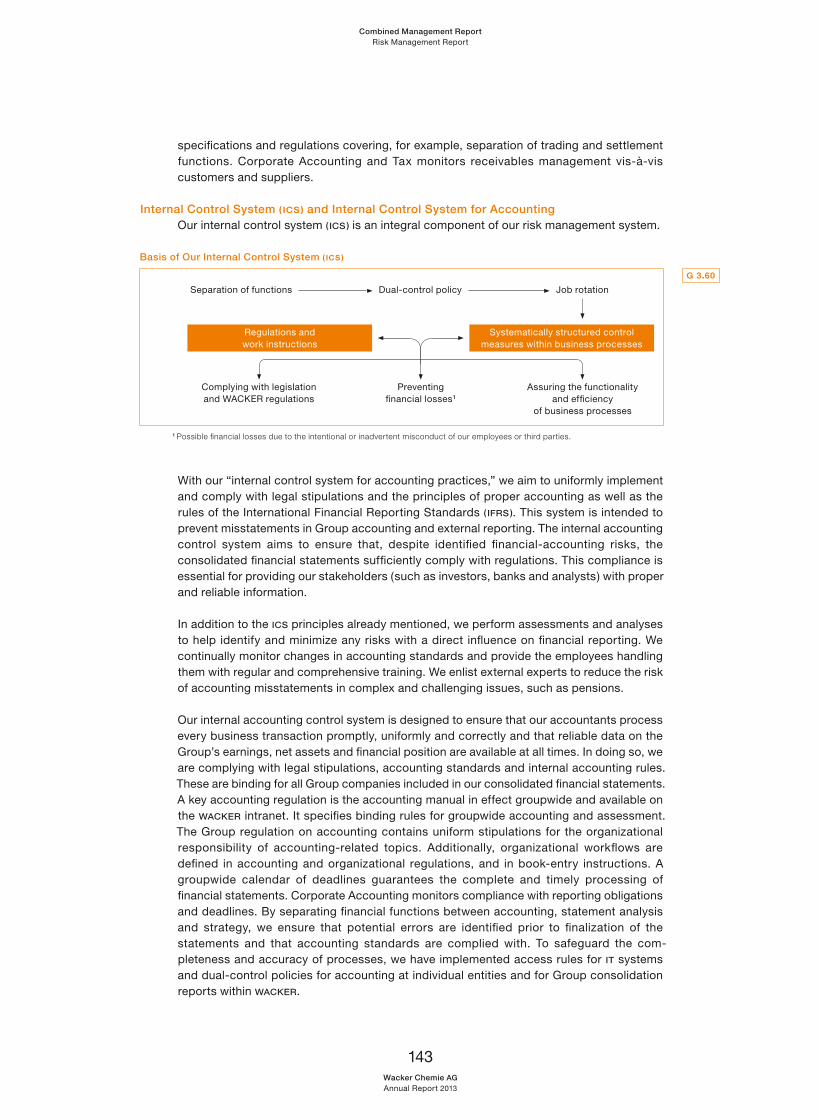
143Wacker Chemie AGAnnual Report 2013
Combined Management ReportRisk Management Report
specifications and regulations covering, for example, separation of trading and settlement functions. Corporate Accounting and Tax monitors receivables management vis-à-vis customers and suppliers.
Internal Control System (ICS) and Internal Control System for AccountingOur internal control system ( ICS) is an integral component of our risk management system.
Basis of Our Internal Control System ( ICS)
1 Possible financial losses due to the intentional or inadvertent misconduct of our employees or third parties.
With our “internal control system for accounting practices,” we aim to uniformly implement and comply with legal stipulations and the principles of proper accounting as well as the rules of the International Financial Reporting Standards ( IFRS). This system is intended to prevent misstatements in Group accounting and external reporting. The internal accounting control system aims to ensure that, despite iden tified financial-accounting risks, the consolidated financial statements sufficiently comply with regulations. This compliance is essential for providing our stakeholders (such as inves tors, banks and analysts) with proper and reliable information.
In addition to the ICS principles already mentioned, we perform assessments and analyses to help identify and minimize any risks with a direct influence on financial reporting. We continually monitor changes in accounting standards and provide the employees handling them with regular and comprehensive training. We enlist external experts to reduce the risk of accounting misstatements in complex and challenging issues, such as pensions.
Our internal accounting control system is designed to ensure that our accountants process every business transaction promptly, uniformly and correctly and that reliable data on the Group’s earnings, net assets and financial position are available at all times. In doing so, we are complying with legal stipulations, accounting standards and internal accounting rules. These are binding for all Group companies included in our consolidated financial statements. A key accounting regulation is the accounting manual in effect groupwide and available on the WACKER intranet. It specifies binding rules for groupwide accounting and assessment. The Group regulation on accounting contains uniform stipulations for the organizational responsibility of accounting-related topics. Additionally, organizational workflows are defined in accounting and organizational regulations, and in book-entry instructions. A groupwide calendar of deadlines guarantees the complete and timely processing of financial statements. Corporate Accounting monitors compliance with reporting obligations and deadlines. By separating financial functions between accounting, statement analysis and strategy, we ensure that potential errors are identified prior to finalization of the statements and that accounting standards are complied with. To safeguard the com-pleteness and accuracy of processes, we have implemented access rules for IT systems and dual-control policies for accounting at individual entities and for Group consolidation reports within WACKER.
G 3.60
Complying with legislation and WACKER regulations
Preventing financial losses 1
Assuring the functionality and efficiency
of business processes
Regulations and work instructions
Systematically structured control measures within business processes
Separation of functions Dual-control policy Job rotation
144Wacker Chemie AGAnnual Report 2013
Combined Management ReportRisk Management Report
Our subsidiaries ensure that existing stipulations are implemented in their local regions. In doing so, they are supported and monitored by Corporate Accounting. Additionally, country-specific accounting standards exist that must be complied with. After local management has released the subsidiary’s separate financial statements, they are fed into a centralized consolidating system. The reported data are verified both by automatic system validation, and by reports and analyses. This ensures data integrity and compliance with reporting logic. Comparisons with respective prior-year figures serve to explain the data entered into the system. After ensuring the plausibility of data, we commence the consolidation process. Here, too, we carry out both system-based and manual monitoring of the individual consolidation steps. Any errors or differences are systematically reviewed and corrected by hand. Finally, we analyze the statement of income and the Group statement of financial position with a view to trends and variances.
We guarantee the effectiveness of controls not only through feedback talks with the em-ployees responsible, but also by continually monitoring key financial indicators in our monthly management reports and in system-supported test runs. Moreover, regular external audits are carried out, as well as external reviews at year-end and for each quarter.
Managers at our divisions, corporate departments and subsidiaries confirm quarterly, via area-specific notification, that all key issues for quarterly and annual financial statements have been reported.
The Supervisory Board is also integrated into the internal control system through the Audit Committee. In particular, the Audit Committee monitors the accounting process and the effectiveness of the internal control, risk management and auditing systems. Moreover, it reviews the documents for Wacker Chemie AG’s separate financial statements and the WACKER Group’s annual and quarterly financial statements and the combined management report for these statements, and discusses them with the Executive Board and the auditors.
We protect all financial systems from misuse with user authorization systems, data release policies and access restrictions. The Information Technology corporate department carries out regular system backups and maintenance measures to minimize both the risk of data loss and of a breakdown of accounting-related IT systems. However, even with adequate and functioning systems in place, we cannot guarantee that the internal control system will be 100 percent effective.

145Wacker Chemie AGAnnual Report 2013
Combined Management ReportRisk Management Report
Internal ControlsCorporate Auditing rounds out our risk management system. On behalf of the Executive Board and with the assistance of the auditing manual, this department regularly reviews all corporate entities. The Executive Board – in consultation with the Audit Committee – adopts a risk-driven approach when choosing audit topics, which, if necessary, are flexibly adjusted during the year to take account of changes in underlying conditions. The auditing emphasis in 2013 was on the settlement of investment projects and external maintenance work. In addi-tion, cross-functional audits were used to review the business processes of four subsidiaries. In total, Corporate Auditing conducted 32 audits in 2013 (2012: 32 audits). The proposed audit plan was largely implemented, with seven topics or items for review to be completed in the course of 2014. No major complaints came to light. Audit recommendations to optimize processes are being implemented and systematically followed up on.
External ControlsWhen auditing our annual financial statements, the external auditor examines our early-warning system for detecting risks. The auditor then reports to the Executive and Super-visory Boards.
Central Risk Areas
Defining the Probability and Impact of Risk OccurrenceWe have defined categories for describing the probability that risks we identify will occur. They provide a framework for understanding our evaluations of individual areas of risk. The categories define the range of probability as follows:
Unlikely: under 25 percent Possible: 25 – 75 percent Likely: over 75 percent
We also use categories to describe how the occurrence of the risks listed might impact the Group’s earnings, net assets and financial position. We assess the possible effect on earnings using the net method, i.e. after taking appropriate countermeasures, such as estab lishing provisions or hedging. The following categories define the ranges:
Low: up to € 25 million Medium: up to € 100 million High: over € 100 million
The following table shows our estimation of the risks’ probability and of how risk occurrence might impact the Group’s earnings, net assets and financial position. The statements refer to the forecast period, thus to fiscal 2014.

146Wacker Chemie AGAnnual Report 2013
Combined Management ReportRisk Management Report
Probability and Possible Impact of Our Risks in 2014
Category Probability Possible Impact
Overall economic risksChemical business Unlikely Medium
Siltronic Unlikely Medium
Polysilicon Unlikely Medium
Sales-market risksChemical-segment overcapacity Unlikely Medium
Cyclical fluctuations and intense competition on the semiconductor market Possible Medium
Polysilicon overcapacities and price risks Possible Medium
Procurement-market risks Unlikely Low
Market-trend risks Unlikely Low
Investment risks Possible Medium
Production risks Unlikely Medium
Financial risksCredit risks Unlikely Low
Market-price risks and risks of fluctuating payment flows Unlikely Low
Liquidity risk Unlikely Low
Pensions Unlikely Low
Legal risks Unlikely Medium
Regulatory risks Energy transition Likely Medium
Anti-dumping proceedings to do with polysilicon Possible High
New regulations for upstream, intermediate and downstream products and for production processes Unlikely Low
IT risks Unlikely Medium
Personnel-related risks Unlikely Low
External risks Unlikely Low
Overall Economic RisksScenario: Continuing economic slowdown.
Impact on WACKER: Production-capacity utilization drops, specific manufacturing costs rise, and the Group’s sales and earnings decline.
Measures: We counter this risk by continuously monitoring economic trends in our key sales markets. If we detect economic weakness, we take early precautions to flexibly adjust production capacities, resources and inventories in line with customer demand. In such cases, we focus on, for example, production locations with the best cost position and temporarily shut down some production facilities. To counter an economic slowdown, we also use the instrument of short-time work and do not extend temporary employment contracts.
Evaluation: Market observers expect global economic growth to accelerate in 2014. Eco-nomic activity is forecast to gain momentum both in advanced economies and in the emerging markets of Asia, South America and Eastern Europe. At the same time, political and struc tural challenges remain high. The European financial and sovereign-debt crisis and the public-sector deficit in the USA still pose risks to the stability of the global economy.
T 3.61

147Wacker Chemie AGAnnual Report 2013
Combined Management ReportRisk Management Report
Risk Assessment: We presently see no specific signs that economic trends will diverge substantially from the experts’ forecasts. Given the risks mentioned, however, we cannot completely rule out that the global economy in 2014 could perform below current projections.
Our chemical business supplies a large number of customers from a wide range of industrial sectors worldwide. As per our previous experience, we can use this to partially compensate for temporary weakness in some sectors and sales regions. If global economic growth should turn out to be weaker than currently forecast, the impact on our chemical-business earnings trend will probably be low. However, if a recession should unexpectedly occur and significantly dampen demand for our products in a number of key sales markets and sectors, this would reduce chemical-business earnings at least to a medium degree.
In Siltronic’s semiconductor-wafer business, volume and price trends depend essentially on two factors. First: on how consumer and industrial demand develops for electronic equip-ment, such as computers, smartphones and tablet PCs. Second: on the balance between global production capacities and semiconductor-manufacturer demand. Both factors are closely interlinked. If the consumer climate should cool off noticeably, contrary to expec ta-tions, this would probably have a medium impact on Siltronic’s earnings trend.
The continued development of our polysilicon business will primarily be determined by the regulatory framework for solar-power use and for international trade in photovoltaic systems and solar silicon. Economic influences are of subordinate importance by comparison. If the global economy turns out to be weaker than currently forecast, there would be a medium impact on earnings as regards WACKER’s polysilicon business.
SalesMarket RisksScenario 1: Chemical-segment overcapacity.
Impact on WACKER: Price and volume pressures on our products.
Measures: WACKER minimizes this risk in various ways. For example, we align production with demand and perform quantity controls to ensure appropriate plant-utilization rates. Our approach also includes structured price management, process optimization and intense development of growth markets. Importantly, a key ongoing goal is to increase the share of cyclically resilient product groups in our portfolio and to rank among the global leaders in all our business fields. By cooperating closely with customers, we aim to quickly open the way to novel applications, thus fostering long-term customer loyalty.
Evaluation: We expect overcapacity-related risks for our products to remain the same in 2014. At WACKER POLYMERS, we anticipate overcapacity for dispersions and dispersible polymer powders in Asia. Nevertheless, we expect plant utilization to be strong despite this overcapacity. WACKER SILICONES faces overcapacity for siloxane production in China and for certain segments (such as liquid silicone rubber) – which could reduce plant utilization. Price pressure on some of our chemical divisions’ products will persist in 2014.
Risk Assessment: It is unlikely that individual areas of our chemical business will experience overcapacity and, consequently, price pressure. We have already taken account of this development in our planning and forecasts. Any additional impacts on the Group’s earnings are considered to be in the medium range.

148Wacker Chemie AGAnnual Report 2013
Combined Management ReportRisk Management Report
Scenario 2: Cyclical fluctuations and intense competition on the semiconductor market.
Impact on WACKER: Volumes and prices decline.
Measures: Siltronic tries to reduce these risks through systematic cost management and through flexible structures and production operations. We have aligned our capacity for < 300 mm diameters with market trends by closing the Hikari (Japan) site in 2012 and dis-continuing 150 mm silicon-wafer production at Portland. In the 300 mm wafer segment, Siltronic is continuing to improve its production- and business-process efficiency and, thus, its cost basis.
Evaluation: 2014 will be another challenging year for the semiconductor industry. Market researchers expect volumes to increase by more than 5 percent, with the pressure on prices remaining high. Siltronic’s Japanese competitors are using the devaluation of the yen against the euro to lower their semiconductor-wafer prices. That could impact the asset value of Siltronic’s 300 mm wafer production facilities. We expect stronger demand, in particular for 300 mm silicon wafers. Volumes for wafer diameters below 300 mm might decline in 2014.
Risk Assessment: In our semiconductor business, we anticipate that volumes in 2014 will edge up year on year amid persistently strong price pressure. This scenario forms the basis for our planning and forecasts. We consider it possible that volumes and prices will diverge substantially from our expectations. If volumes came in considerably below our current estimates, this would have a medium impact on Siltronic’s earnings.
Scenario 3: Polysilicon overcapacities and price risks, difficult market conditions due to a roll-back of government incentive programs, and the tight financial situation of many customers.
Impact on WACKER: There will be volume risks if the photovoltaic market is dampened by government solar incentives being curtailed too far and too quickly. Overcapacity could lead to intense price competition, which would exert pressure on margins. Both factors could result in declining sales and earnings and impact the asset value of our polysilicon production facilities.
Measures: We counter this risk by continually improving our productivity, cost positions and quality. If demand falls, we adjust our production capacities flexibly in line with the market trend. In February 2013, due to accelerating demand, we discontinued the short-time work schedule we had introduced in October 2012 in individual areas of the Burghausen plant. To align our capacity expansion with anticipated customer demand, we decided, as early as fall 2012, to extend the timeline for the new site in Charleston (Tennessee, USA) by about 18 months and to start production in the second half of 2015. This timeline is still in place.
Evaluation: The photovoltaic industry continues to face production overcapacity. The per-sistent price pressure at all stages of the supply chain has, however, recently let up. From early 2013, polysilicon prices remained more or less stable, however at a very low level. The industry’s consolidation process is not yet over and will probably continue in 2014. Overall, as the cost and quality leader, we expect to emerge from this consolidation process with renewed strength. However, as long as global production capacity exceeds market demand, there is little chance that prices will increase noticeably at every stage of the supply chain. In certain European countries, we also expect to see a tendency for further cuts in state incentives for photovoltaics. Conversely, incentive programs outside Europe – for example in China, Japan and the USA – will probably be expanded. At the same time, falling prices for photovoltaic components are making solar energy more competitive. Among the sources of renewable energy, pholtovoltaics is becoming one of the most cost-effective technologies for generating power. This trend will help promote access to new markets and spur further growth in the global market for photovoltaic applications.

149Wacker Chemie AGAnnual Report 2013
Combined Management ReportRisk Management Report
Risk Assessment: In all probability, the consolidation process in the solar industry will carry on in 2014. As long as this trend continues and global production capacities exceed market demand, it is possible that polysilicon prices will not change substantially compared with the current level. Our planning and forecasts anticipate such a situation. Should solar-silicon demand clearly exceed supply, we believe that there would be a medium positive influence on WACKER POLYSILICON’s earnings. Conversely, a slump in solar-silicon demand would probably have a medium impact on WACKER POLYSILICON’s earnings in this business.
ProcurementMarket RisksScenario: Higher raw-material and energy prices, and bottlenecks in the supply of certain raw materials.
Impact on WACKER: Earnings dampened by higher raw-material and energy prices. If there are supply bottlenecks, delivery times to customers grow longer and there could be volume losses.
Measures: On an annual basis – and if necessary, ad hoc – we prepare systematic pro-curement plans for strategic raw materials and energy, along with an evaluation of the procurement risk. Whenever possible, we counter any procurement risks deemed significant with corresponding measures. Examples of such measures include long-term supply contracts with partners, structured procurement from multiple suppliers under contracts with various maturities, expansion of our supplier base, and higher safety stocks. With our silicon-metal production site in Holla (Norway), we have achieved backward integration for one of our key raw materials, considerably reducing our dependency on external suppliers. We are now in a position to produce – in-house and to a high quality standard – just under one-third of the quantities we need.
Evaluation: WACKER has positioned itself well in energy and raw-material procurement to better manage the risks inherent in both economic upturns and downturns. If the global economy should weaken markedly, our contracts for key raw materials allow us to adjust purchase volumes flexibly and to benefit – wherever possible – from price decreases through escalator clauses. If the global economy grows, we have volume guarantees such that we do not see any major risks affecting the supply of raw materials. Prices could, of course, markedly increase in such a situation. There is, however, the possibility of at least partially compensating for these additional costs with higher selling prices for our own products. Overall, we see the risks WACKER faces in the area of raw-material procurement and prices as currently being low.
At present, energy-intensive companies or parts of such companies can for the most part be exempted from the EEG levy. Some entities at WACKER also profit from this exemption. Any restriction on the rules for exemption would considerably reduce the competitiveness of individual corporate entities. The scope of these exemption rules is currently the topic of political discussions and legal disputes in Germany and Europe. We are not able to predict the outcome of these proceedings.
Risk Assessment: We currently consider it unlikely that raw-material supply and price risks affecting WACKER's business could materialize. Correspondingly, we view the possible impact on Group earnings as low. Conversely, the risks and potential impact on our earnings emanating from the continued regulatory affect on energy prices in Europe, and in Germany in particular, are high (also see Regulatory Risks, Energy Transition in Germany, on pages 155 to 157).

150Wacker Chemie AGAnnual Report 2013
Combined Management ReportRisk Management Report
MarketTrend RisksScenario: An incorrect projection of market trends, and lack of customer acceptance for newly developed products.
Impact on WACKER: If we misjudge future market trends, this could impact our market strength and earnings position. New product developments that fail to meet market needs could negatively impact our sales and earnings.
Measures: WACKER works closely with its customers and, therefore, has reliable information for developing new products and applications. At the same time, we monitor the market and our competitors very closely (all the way down to a business-field level ), hold customer and supplier interviews and regularly attend tradeshows that are important to WACKER. In indi-vidual cases, we commission market research. We minimize risks relating to product devel-op ments by collaborating on specific projects with customers. WACKER also coop erates with universities and scientific institutions on R & D projects to stay abreast of state-of-the-art technological and product-development trends.
Evaluation: WACKER has many years of market experience and can update its detailed planning as soon as market developments change.
Risk Assessment: We consider the risk of misjudging market trends, or not reacting to them appropriately, to be low. If this should, nevertheless, occur in individual application fields, the impact on our earnings trend would probably be low.
Investment RisksScenario: Bad investments, higher-than-expected investment costs, postponed plant start-ups, deterioration of original market projections, and acceptance of risks from investments in joint ventures and associates.
Impact on WACKER: Bad investments lead to idle-capacity expenses and /or impairments of assets and investments. Higher investment costs will lead to higher depreciation expenses in our operating result. Postponed start-ups pose the risk of being unable to fulfill supply agreements and, thus, of posting lower sales and earnings.
Measures: WACKER has numerous measures in place for countering investment risks. We check the completeness and plausibility of plans for all new projects with an investment volume exceeding € 1.5 million. Economic feasibility is assessed using comparative studies that look at other plant projects, including those of competitors. Investments are approved in stages only. Intensive project-budget management helps prevent or minimize delays.
By establishing partnerships with companies such as Samsung or Dow Corning, we have reduced our own investment risk. In this regard, however, there are long-term purchasing and financing commitments with the respective associated companies or joint ventures. At the same time, the result from investments in joint ventures and associates can influence our profitability.
Evaluation: Over the past few years, WACKER has demonstrated that it can complete complex technical investment projects on schedule, or even earlier than planned. To ensure that polysilicon production at our new site in Charleston (Tennessee, USA) can be ramped up on schedule in the second half of 2015, calls for tenders are currently in progress for the remaining subcontracting work. As the chemical industry will be initiating a series of large-

151Wacker Chemie AGAnnual Report 2013
Combined Management ReportRisk Management Report
scale projects over the next few years to take advantage of the shale-gas boom in the USA, the resulting competitive situation may cause the capital expenditure on materials and assembly to be higher than originally expected. It will not be possible to gauge the extent of these additional costs – or whether third-party projects might have an impact on the scheduled production start in Charleston – until after these calls for tenders have been completed.
Risk Assessment: We consider it possible that commissioning of our new polysilicon production facility in Charleston could encounter delays and higher capital expenditure. It is currently difficult to estimate to what degree commissioning at a later date would impact the Group’s earnings trend. If commissioning took place several months later than as scheduled today, this could have a medium impact on earnings.
Production RisksScenario: Risks relating to the production, storage, filling and transport of raw materials, products and waste.
Impact on WACKER: Potential personal injury, property damage and environmental impairment; production downtimes and operational interruptions; and the obligation to pay damages.
Measures: WACKER coordinates its operational processes through its integrated management system ( IMS). The system regulates workflows and responsibilities, attaching equal impor-tance to productivity, quality, the environment, and health and safety. Our IMS is based on legal regulations, and on national and international standards, such as Responsible Care ® and the Global Compact, which go far beyond legally prescribed standards. We monitor maintenance extensively and regularly perform inspections to ensure the highest possible level of operational safety at our production sites. We conduct thorough safety and risk analyses, from the design stage through to commissioning, to ensure our plants’ safety. We regularly hold seminars on plant / workplace safety and explosion protection. Every WACKER site has its emergency response plan to regulate cooperation between internal and external emergency response teams, and with the authorities. When we work with logistics providers, we ensure that hazardous-goods transport vehicles are always checked prior to loading and that faults are systematically recorded and tracked.
Evaluation: Risks stemming from the production, storage, filling and transport of raw materials, products and waste can never be completely ruled out.
Risk Assessment: Even though it is generally possible for risks relating to the production, storage, filling and transport of raw materials, products and waste to materialize, we currently consider a serious loss event to be unlikely. Nevertheless, if such an event should occur, it could have a medium impact on WACKER’s earnings.
Financial Risks: WACKER is exposed to financial risks from ongoing operations and financing. Such risks include credit, market-price, financing and liquidity risks. They are managed by the individual WACKER departments responsible for them. We employ primary and derivative financial instruments to cover and control the financial needs and risks necessitated by our operations. Such financial instruments are not permitted, however, if they are not based on actual or planned operational activities. The Notes to the consolidated financial statements provide extensive information about risk hedging using derivative financial instruments. See further details on pages 252 to 256 of the Notes section

152Wacker Chemie AGAnnual Report 2013
Combined Management ReportRisk Management Report
Controlling Financial Risks
Risk Corporate Department Responsible
Credit risks Corporate Finance and Insurance
Market-price risks Corporate Finance and Insurance
Liquidity risks Corporate Finance and Insurance
Currency-exchange and interest-rate risks Corporate Finance and Insurance
Raw-material price risks Raw Materials Procurement
Credit RisksScenario: Customers or business partners fail to meet their payment obligations.
Impact on WACKER: Losses on trade receivables, and failure of banks to fulfill their obliga-tions to WACKER ( loan disbursements, repayment of deposits and compensatory payments arising from derivatives transactions).
Measures: We use a variety of instruments to reduce the risk of any loss on receivables. Depending on the nature of the product / service provided, we may demand collateral, including retention of title. Other preventive measures range from references and credit checks, to the evaluation of historical data from our business relationship to date (parti c-ularly payment behavior). We take out credit insurance to minimize the risk of default. We prevent counterparty risk vis-à-vis banks and contractual partners by carefully selecting these partners. We strictly limit cash investments and derivative dealings to banks with a minimum rating of A- from Standard & Poor’s or a comparable rating agency. Investment activities are additionally subject to maximum investment and term limits. In exceptional cases, investments or derivative dealings may be conducted with banks of lower credit-worthiness within tight limits and terms. The same criteria apply to buying government and corporate bonds.
Evaluation: The credit risks stemming from customer business are manageable. Credit risks arising from contractual obligations to financial institutions are related to financial assets and derivative financial instruments. Our Corporate Finance and Insurance depart-ment centrally handles global dealings with currency-exchange and interest derivatives, as well as liquidity management.
Risk Assessment: We consider it unlikely that credit risks stemming from customer business will occur. The same applies to our risk concentration in relation to bank failures, thanks to our approach to counterparty risk. If, however, credit risks stemming from cus-tomer business should unexpectedly occur or should banks fail, the probable impact on WACKER’s earnings would be low.
T 3.62
153Wacker Chemie AGAnnual Report 2013
Combined Management ReportRisk Management Report
MarketPrice Risks and Risks of Fluctuating Payment FlowsScenario: Fluctuations in currency-exchange rates, interest rates and raw-material prices.
Impact on WACKER: Effect on earnings, liquidity and financial investments.
Measures: Currency risks primarily arise from exchange-rate fluctuations for receivables, liabilities, and cash and cash equivalents not held in euros. The currency risk stemming from financial instruments is of particular importance with respect to the US dollar, Japanese yen, Singapore dollar and Chinese renminbi. WACKER hedges the resultant net exposure – as of a certain level – via derivative financial instruments. The use of such instruments is governed by WACKER’s regulation on currencies. We employ currency-option and forward-exchange contracts, and foreign-exchange swaps. Foreign currencies are hedged predominantly for the US dollar, Japanese yen and Singapore dollar. Plus, we counter exchange-rate risks through our non-eurozone production sites.
Interest-rate risks arise due to changes in market rates that impact future interest payments for variable-rate loans and investments. Thus, the changes have a direct influence on the Group’s liquidity and financial assets. When exposure for euro amounts is identified, interest-rate hedging is performed. The use of derivative financial instruments is governed by internal regulations that separate trading and settlement functions, and is subject to strict controls within the entire processing procedure. We continually monitor the effect ive ness of any measures taken. In certain cases, commodity prices are hedged by traded futures.
Evaluation: We hedge part of our US dollar, yen and Singapore dollar business. The possible impact of a stronger euro will be partially cushioned by hedging measures. Consequently, we do not expect any major effects from exchange-rate shifts in 2014.
Risk Assessment: From today’s perspective, we consider it unlikely that exchange-rate and interest-rate changes in 2014 will substantially differ from our planning assumptions. Nevertheless, if this were to occur unexpectedly, we believe that it would have a low impact on Group earnings.
Liquidity RiskScenario: Lack of funds for payments, and tougher access to credit markets.
Impact on WACKER: Higher financing costs, and modifications to further expansion plans.
Measures: Liquidity risk is managed centrally at WACKER. Our Corporate Finance depart-ment employs efficient systems for both cash management and rolling liquidity planning. In order to counter financing risks, WACKER holds adequate long-term, contractually-agreed credit lines, and has set aside sufficient liquidity. By means of cash pooling, liquid funds are passed on internally within the Group as required.
Evaluation: WACKER’s liquidity increased in 2013 compared with the previous year as a result of new loans coupled with significantly lower investment spending. Liquidity totaled € 624.5 million at the reporting date. At that time, financial liabilities exceeded liquidity (con-sisting of current and noncurrent securities, and cash and cash equivalents) by € 792.2 million. The loans contain a net debt-to-EBITDA ratio as the key financial covenant. Concurrently, there were unused credit lines with terms of over one year totaling some € 700 million. We invest liquid funds only in issuers or banks that have a credit rating in the sound investment-grade range. The investment of liquid funds is, moreover, subject to limits that we have defined.

154Wacker Chemie AGAnnual Report 2013
Combined Management ReportRisk Management Report
Risk Assessment: We consider the occurrence of financing and liquidity risks to be unlikely. At the moment, we see no risks relating to financial-covenant infringements. Nevertheless, if financial or liquidity bottlenecks were to occur, their impact on Group earnings would be low.
PensionsScenario: The greater life expectancy of pension-fund beneficiaries, additional obligations due to pay and pension adjustments, and falling discount factors increase the volume of pension obligations. Significant changes in the composition of the invested fund assets and capital-market interest rates produce a rise or fall in fund assets. Altered criteria used in the measurement of pension plans influence the net pension cost for the period.
As of 2013, IAS 19 requires enterprises to report actuarial gains and losses, as well as other changes in value immediately and in full in other comprehensive income. This leads to greater volatility in equity. Other future changes to the principles applied in accounting for pensions may adversely affect the Group’s earnings, net assets and financial position.
Impact on WACKER: A large portion of WACKER’s pension guarantees are covered by the Wacker Chemie VVaG pension fund, by pension-related funds and special-purpose assets, and by insurance plans. The largest contribution comes from the pension fund. A rise in the pension provisions as well as reduced plan assets and a possible injection of financial resources into the pension fund or into the plan assets will affect the financial position and earnings of the Group. Over and above the basic pension plan, there are defined-benefit pension plans in the form of direct commitments. Additionally, employees have the option of converting part of their remuneration into direct benefit commitments. What is more, the greater life expectancy of pension-fund beneficiaries, pay and pension increases, and the discount factor (calculation of the present value proceeding from the final capital amount) also impact WACKER’s equity and earnings to a substantial extent.
Measures: A large portion of WACKER’s pension guarantees are covered by the Wacker Chemie VVaG pension fund, by pension-related funds and special-purpose assets, and by insurance plans. The pension fund manages the pension insurance of our German-based employees in accordance with its Articles of Association and General Terms and Conditions of Insurance. To ensure a sufficient rate of return and to limit investment risks, the fund diversifies its investment portfolio among various asset classes and regions. In managing its assets and liabilities, the pension fund controls and optimizes all asset items to attain the required return within specified risk limits. As one of the fund’s sponsoring entities, WACKER makes payments to it (when necessary), thereby ensuring sufficient coverage for pension obligations. We periodically adjust the calculation parameters of the other defined-benefit pension commitments (e.g. the minimum interest rate).
Evaluation: Pension-fund beneficiaries are living longer, and capital-market interest rates have steadily declined in recent years. The rate of return will probably be insufficient to fulfill long-term pension obligations. The contribution for Wacker Chemie AG’s defined-benefit pension commitments thus rose from 350 percent of the employee contribution in 2013 to 400 percent in 2014 to protect the pension fund.
Risk Assessment: We consider it unlikely that WACKER will have to make further payments to the pension fund in 2014, along with increased pension payments to cover its other commitments. Since we have already sufficiently accounted for this, we estimate the impact on WACKER’s earnings trend as being low. Nonetheless, the likelihood that we will have to make further payments to the pension fund in the future is greater. See further details starting on
page 231 of the Notes section
155Wacker Chemie AGAnnual Report 2013
Combined Management ReportRisk Management Report
Legal RisksScenario: Diverse tax, brand, patent, competition, antitrust, environment, labor- and contract-related legal risks could arise from our international business.
Impact on WACKER: Drawn-out legal disputes that could impact our company’s operations, image and reputation, and that could be costly.
Measures: We limit legal risks with centralized contract management and legal review by our legal department. If necessary, we also seek highly-qualified and specialized external legal advice.
Our Intellectual Property department protects and monitors patents, brands and licenses. By reviewing patent regulations, we determine – before initiating R & D projects – whether existing third-party patents and intellectual property rights impair the competitive marketing of any newly developed products, technologies or processes.
We limit risks arising from possible legal infringements by means of compliance programs. WACKER’s Code of Conduct defines and stipulates binding rules of behavior for all employees. Through training programs, WACKER enhances awareness of these issues and attempts to prevent reputation-related risks.
Evaluation: We currently do not foresee any legal disputes, patent infringements or other legal risks that could significantly influence our business.
Risk Assessment: Due to the varied nature of our business activities in all major regions of the globe, the occurrence of legal risks, for example in the form of legal disputes, is always conceivable in principle. We do not, however, see any specific indication of any such events that would have a significant impact on our business and currently consider their occurrence to be unlikely. Should they occur, there would be a medium impact on Group earnings.
Regulatory RisksEnergy Transition in Germany
Scenario: The transformation of Germany’s energy supply system to 80 percent renewable energy in the electricity sector by 2050 (known as the “Energiewende” or energy transition) creates a regulatory environment that will probably be marked by continual legislative amendments in Berlin and Brussels (German Renewable Energy Act (EEG) reform, special compensation rules for energy-intensive companies, the grid charge, self-generated electricity, EU investigation into EEG state aid procedures, state aid rules, the 2030 EU Green Paper, and capacity mechanisms).
Impact on WACKER: Additional costs due to rising government levies on the cost of electricity procurement.
Measures: We continually monitor regulatory activity in Germany and in the EU. Whenever we anticipate changes in the current legal situation, we try to bring our position into the appropriate legislative procedures through discussion with policymakers and by participating in trade associations. In addition, we search for and take advantage of market opportunities arising, for example, from renewable energy (e.g. industrial load management).
Evaluation: We expect the regulatory environment for the energy transition to remain in transition during the next few years. WACKER supports implementation of the energy tran-sition at the state, federal and EU level.

156Wacker Chemie AGAnnual Report 2013
Combined Management ReportRisk Management Report
Risk Assessment: It is likely that there will be changes in the EEG Act and in the special compensation rules for energy-intensive companies. At the moment, we cannot reliably forecast whether this will cause any additional burden on WACKER, nor how substantial it might be. In our opinion, the most probable scenario entails limited changes that will have, at most, a medium impact on Group earnings. Should it be decided, however, to completely abolish rules relieving energy-intensive companies with regard to EEG feed-in tariffs, the privilege for self-generated electricity, and the grid charge, then there would be a high impact on WACKER’s earnings.
AntiDumping ProceedingsScenario: Anti-dumping proceedings by the Chinese Ministry of Commerce against Euro-pean polysilicon manufacturers.
Impact on WACKER: Negative impact on the company’s earnings, net assets and financial position; influence on the plans for the further expansion of polysilicon, impact on long-term customer relations.
Measures: Anti-dumping and anti-subsidy proceedings filed by the Chinese Ministry of Commerce against European polysilicon manufacturers are currently ongoing. By actively participating in these proceedings, WACKER is striving to prevent the imposition of punitive tariffs in China on European polysilicon producers. WACKER rejects all forms of restraints on trade. We try to avoid imposition of punitive tariffs on European polysilicon by conducting numerous discussions with policymakers in Germany, at the EU level and in China. To this end, we are cooperating with the Chinese Ministry of Commerce. Both WACKER and its Chinese customers are making every effort to highlight the adverse impact of punitive tariffs on their business performance and the market as a whole.
A final decision is expected from the Chinese Ministry of Commerce in April 2014. A pre-liminary decision has already been made which determined the tariffs to be imposed, but also suspends them.
Evaluation: It is unclear what verdict the Chinese Ministry of Commerce will reach in this issue.
Risk Assessment: WACKER assumes that the EU decision – meanwhile finally confirmed – to permanently accept the compromise reached in July 2013 and to generally waive punitive tariffs on Chinese solar products will have a positive effect on the outcome of the pro-ceedings in China. In our estimation, however, it is possible that the Chinese Ministry of Commerce could impose significant punitive tariffs on European solar silicon. Should this occur, the impact on our earnings would be high since WACKER POLYSILICON’s business would be noticeably restrained and the asset value of our production facilities could be impacted.
New Regulations for Upstream, Intermediate and Downstream Products That WACKER Produces Itself or Uses and Their Effects on Our Production Processes
Scenario: The production and use of chemical substances will be more strictly regulated due to new legal regulations. New legal provisions necessitate changes in WACKER’s production processes.
Impact on WACKER: Additional investments in production facilities and revenue losses in individual application fields.
Measures: WACKER continually monitors how the regulatory environment impacts its products and production processes to enable it to quickly react to impending changes. This is why we have begun to additionally equip some silicone production plants in prepa-ration for possible regulatory changes.

157Wacker Chemie AGAnnual Report 2013
Combined Management ReportRisk Management Report
Evaluation: In principle, it is always possible that new legal regulations will make it necessary to modify our product portfolio or production processes.
Risk Assessment: We consider it unlikely that new legal provisions will require additional investment in our production facilities or changes to our product portfolio. We currently have no knowledge of specific decisions made that would influence our business in a significant way. Should such changes occur, there would, at most, be a low impact on WACKER’s earnings.
IT RisksScenario: Attacks on, interference with, and unauthorized access to, IT systems and net-works, threatening data security.
Impact on WACKER: Negative impact on the company’s earnings, net assets and financial position, on production processes and on workflows; loss of know-how.
Measures: We continually monitor our use of information technology and do everything we can to ensure that IT-supported business processes function reliably. Our IT security and risk management specialists are responsible for handling hazards in a cost-efficient way. Their work is based on ISO 27001. Using risk analyses, we define the requirements for WACKER’s central systems – in terms of availability and data integrity / confidentiality. We anchor these requirements in SLAs (service level agreements) at our business divisions and corporate departments, and continually monitor compliance with those agreements. For our central ERP systems (Enterprise Resource Planning), we set – and exceeded – an availability goal of 99.5 percent for 2013. We achieved this primarily by designing our systems for maximum availability and by installing an associated backup and recovery procedure. We have taken appropriate precautions to cover emergency situations (business continuity management).
We minimize project-related IT risks with the help of a uniform project and quality-manage-ment method. It ensures that changes are integrated into our system landscape in a controlled manner. Before new IT solutions are rolled out, we ensure that development and security requirements have been observed. Systematic enterprise architecture management reduces complexity and risks.
As part of the risk management process, we log and evaluate any operations-related risks that arise and initiate countermeasures. We also optimize IT service management processes on an ongoing basis. We use state-of-the-art hardware and software solutions to counter network downtime, data loss or manipulation, and unauthorized access to our network. We use efficient software security programs to protect ourselves against malware. We have set up an international security team to address problems with the confidentiality, integrity and availability of data and systems by means of organizational and technical measures, and awareness programs. In addition, we regularly conduct comprehensive penetration tests and audits at domestic and international sites to prevent the risk of hacker attacks.
Evaluation: We can never completely rule out interference with, and attacks on, our IT systems and networks. The long-term failure of IT systems or a major loss of data can considerably impair WACKER’s operations.
Risk Assessment: Thanks to our precautionary measures, we consider the occurrence of such events – and the risks associated with them – to be unlikely. However, if one of our IT systems experiences a service disruption, downtime or hacker attack affecting a significant number of users or lasting a longer period of time, there would be a medium impact on Group earnings.

158Wacker Chemie AGAnnual Report 2013
Combined Management ReportRisk Management Report
PersonnelRelated RisksScenario: Demographic change, lack of qualified technical and managerial employees, and problems in filling executive positions.
Impact on WACKER: The lack of technical and managerial employees could dampen our continued growth and lead to the loss of our technological edge.
Measures: We counter these risks through personnel-policy measures. Our new Talent Management Process is an integral part of this policy. In addition, we offer a wide variety of training programs, good social benefits and performance-oriented compensation. We also offer our employees various working-time arrangements and models, as well as oppor-tunities to achieve a positive work-life balance.
WACKER has a detailed groupwide successor-planning process in place for key positions in the company, as well as for all executive personnel. For every upper management position, we observe up to three candidates to assess their potential and performance. In successor planning, WACKER distinguishes between short-term needs (up to two years) and medium-term needs (two to four years). Regardless of the above distinction, WACKER has appointed deputies for executive personnel in the event of a lengthy absence or illness.
Evaluation: Demographic change will increase the risk of not being able to find enough appro priate personnel for qualified technical and managerial positions in the medium to long term.
Risk Assessment: For 2014, we consider the risks to our personnel needs as being low. Should these occur, we believe that the impact on Group earnings would be low.
External RisksScenario: Pandemic, natural disaster, war or civil war.
Impact on WACKER: Impairment of our entrepreneurial capacity to act, production down-times, loss of trade receivables, impact on sales and earnings.
Measures: WACKER is a globally operating Group with production facilities and technical centers in Europe, the Americas and Asia, and about 50 sales offices worldwide. Pandemics, natural disasters and acts of war in individual countries or regions where we are active represent a potential risk to our business and production operations, product sales and fixed assets and, therefore, to our earnings, net assets and financial position. Our manage-rial entities and our sites have worked out and publicized plans and measures to minimize the effects of a pandemic on the health of our employees and on our business processes. A standardized and coordinated approach is ensured by a “pandemic preparedness plan.” The financial impact of damage to our production plants due to natural disaster is partly covered by insurance. Since WACKER has production sites on different continents, our manufacturing and delivery capability will remain viable to a certain extent even if particular plants should fail.

159Wacker Chemie AGAnnual Report 2013
Combined Management ReportRisk Management Report
Evaluation: Risks from pandemics, natural disasters, acts of war or civil war can never be ruled out entirely.
Risk Assessment: In our view, it is unlikely that WACKER might be affected by risks from pandemics, natural disasters, acts of war or civil war. Our preparedness plan and our internationally distributed production sites and local offices help to limit the impact of local or regional damage on our business processes. This is why we expect that even if such an event should occur, the impact on WACKER’s earnings would be low.
Development of Risks in 2014
Risks Status
Overall economic risks
Sales-market risks
Procurement-market risks
Market-trend risks
Investment risks
Production risks
Financial risks
Credit risks
Market-price risks and risks of fluctuating payment flows
Liquidity risk
Pensions
Legal risks
Regulatory risks
IT risks
Personnel-related risks
External risks
Unchanged Decreased Increased
G 3.63

160Wacker Chemie AGAnnual Report 2013
Combined Management ReportRisk Management Report
Opportunities Report
Opportunity Management SystemWACKER’s opportunity management system remained unchanged from the previous year. It is a divisional and Group-level instrument. We identify operational opportunities and exploit them in our business divisions, which possess the detailed product and market expertise needed. We continuously use market observation and analysis tools to obtain a well-structured analysis of market, industry and competitor data, for instance. Plus, we hold customer interviews to evaluate future opportunities. The monitoring process – how WACKER seizes opportunities – is based on key indicators (such as rolling forecasts and current-status reporting).
Opportunity Management System
Strategic opportunities of overarching importance – such as strategy adjustments, potential acquisitions, collaborations and partnerships – are handled at the Executive Board level. Such opportunities are incorporated into WACKER’s annual strategy-development and planning process, with current issues being discussed at regularly scheduled Executive Board meetings. For these issues, we normally use various scenarios to develop risk-opportunity profiles before making decisions.
WACKER has identified a whole range of opportunities for advancing the Group’s success over the next few years.
Overall EconomicGrowth OpportunitiesAlthough the economic environment is becoming tougher, WACKER sees good opportunities for growth in new markets and sales regions. Our focus here is on Brazil, China, India and the Middle East. As previously, we expect the highest growth rates to be in China and Southeast Asia. To seize such opportunities, we are steadily expanding our presence in these markets. Our technical competence centers and the WACKER ACADEMY are pivotal in achieving WACKER’s high standard of service and customer proximity.
SectorSpecific OpportunitiesSector-specific opportunities arise mainly due to our extensive product portfolio, which enables us to satisfy global megatrends with great success. These trends remain as impor-tant as ever to our business.
Rising affluence in Asia and in the emerging economies of other regions is driving demand for high-quality products that incorporate silicones. WACKER wants to benefit from this development and further increase its proportion of high-end silicone products compared with standard products. Our main points of focus are automotive applications, cosmetics, personal care, health, medicine and electronics. We intend to support growth here by launching innovations in the personal-care, film-technology, 3D-printing and electronics sectors. We see good growth prospects for WACKER SILICONES in the electrical and electronics markets, especially in the field of LEDs. Several products are in the research pipeline at our new technical competence center for electronics in Seoul. WACKER is concentrating its efforts on materials for chip encapsulation and lenses. According to a
G 3.64
Opportunity Management System
Seizing operational opportunities through our divisions
Seizing strategic opportunities at a Group level

161Wacker Chemie AGAnnual Report 2013
Combined Management ReportRisk Management Report
study by McKinsey, LED lighting technology will dominate the world market for lighting, gaining an estimated share of 70 percent by 2020. By then, Asia will be the biggest market, accounting for 45 percent of the total volume.
WACKER POLYMERS, too, has potential for growth due to the rising affluence in emerging economies. A key aspect here is the use of dispersible polymer powders for modifying cement. By admixing these polymer powders, cement becomes easier to process, can be applied more thinly and can be imparted with decisively enhanced properties. Its spread-ability, flexibility or water repellency increases. While industrialized countries modify 85 percent of their cement already, the rate in emerging economies has only reached about 15 percent so far. Of the 30 million metric tons of cement used worldwide, only 20 percent is modified with dispersible polymer powders. WACKER POLYMERS continues to see growth potential in its material-substitution business, especially in the carpet industry. We intend to target the European market with a new VAE dispersion.
At WACKER BIOSOLUTIONS, we see good opportunities for expanding our biologics business following the takeover of Scil Proteins Production. We now have a fermenter with a capacity of up to 1,500 liters. It can be used not only to manufacture pharmaceutical actives for clinical testing, but also to supply the market.
Energy remains a key megatrend, with the photovoltaic industry playing a major part here. The competitiveness of the solar industry compared to other energy sources continues to spur demand for solar installations. All around the globe, the use of renewable energy is increasing. Other countries and regions have supplanted Germany as the key market. The main examples here are the USA, China and Japan. As a polysilicon producer and cost and quality leader, WACKER POLYSILICON will benefit from this megatrend.
Sales Volumes: Opportunities and Risks
Risks Opportunities
Imposition of punitive tariffs on polysilicon deliveries to China
Rising polysilicon prices
Weaker economic growth in emerging markets Sales growth driven by products for cosmetics and personal care, electronics and construction
Higher energy costs due to a reform of Germany’s EEG legislation
Strategic OpportunitiesThanks to the production-capacity expansion of recent years, WACKER has opportunities for further growth at its business divisions. The investment focus is now shifting, though, toward facilities for the manufacture of downstream products. The commissioning of the new polysilicon site in the US state of Tennessee in mid-2015 will bring fresh production capacities on stream and enable us to tap into further growth on the photovoltaic market.
A new organizational structure for WACKER SILICONES is designed to boost our penetration of the Asia region yet further and significantly increase our market share there. The business teams in Asia are being supported by two teams working on global product development and global business development. We now have five new business teams based in different countries throughout the region to handle business in a variety of application areas. Together with our customers, we aim to develop products tailored to local requirements.
T 3.65

162Wacker Chemie AGAnnual Report 2013
Combined Management ReportRisk Management Report
Overview of Business Opportunities
Overall economic opportunities Growth in Asia and other emerging markets
Sector-specific opportunities Good product portfolio for megatrends, such as energy, greater prosperity, urbanization and digitization
Strategic opportunities
Production-capacity expansion New high-quality products via innovations
Performance-related opportunities
Higher plant productivity Extension of our sales organization and establishment of technical competence centers Region-specific product development via a complete supply chain for dispersions and dispersible polymer powders
PerformanceRelated OpportunitiesWACKER has a number of options for improving its cost structures, processes and produc-tivity. We have identified scope for cutting costs at WACKER POLYSILICON and Siltronic and are already acting to realize these savings. The various levers for cost reductions include the specific costs for auxiliaries, productivity advances on the manufacturing side, and a broader choice of suppliers for securing more attractive terms.
At WACKER SILICONES, we are working on optimizing our integrated production network, while increasing the proportion of higher-quality products per metric ton of siloxane. For a number of years now, the “Wacker Operating System” (WOS) program has been helping us to realize further potential savings by optimizing our processes and increasing productivity. Specific energy consumption alone – i.e. amount of energy per unit of net production out-put – is to be reduced by 11 percent in Germany by 2022.
Executive Board Evaluation of Overall Risk
The Executive Board bases its estimate of the overall risk situation on the risk management system in place. The system assesses every risk indicated by our divisions, corporate de-partments and regional entities. It is regularly reviewed by the Executive Board. In December 2013, the European Union finally approved the compromise in the dispute over Chinese solar product imports to Europe, thereby mitigating a substantial risk to further development of the photovoltaic market. On the other hand, the Chinese Ministry of Commerce has yet to reach a final decision on punitive tariffs on European solar silicon. These proceedings still entail a substantial risk to our polysilicon business. In numerous talks at a political level, we are actively striving to avoid punitive tariffs against European polysilicon producers in China.
The overall risk has remained basically unchanged compared with a year ago. As per this report’s publication date, the Executive Board does not see any individual or aggregate risk that could endanger WACKER’s future in any material way. Market risks in the photovoltaic industry, which is marked by overcapacity and low prices along the entire supply chain, as well as intra-sector consolidation, continue to impede our polysilicon business. Despite these risks, we continue to see good opportunities for WACKER to be successful in this market in the medium to long term. We remain confident that WACKER is strategically and financially so well placed that we can take advantage of any opportunities that arise.
T 3.66

Ma
na
ge
me
nt
Re
po
rtO
utl
oo
k
Ensuring a WellGroomed Appearance
Whether used in shampoo or as an additive in creams – silicones from WACKER leave their mark on the booming personalcare market.
Combined Management ReportOutlook
4

Ma
na
ge
me
nt
Re
po
rtO
utl
oo
k
165 Outlook
Combined Management ReportOutlook

165Wacker Chemie AGAnnual Report 2013
Combined Management Report
Outlook
Key market data, such as purchasing managers’ indices, suggest stronger growth for the global economy over the next two years. For the first time since 2011, market researchers anticipate a slight rise in Europe’s economic output. The USA should see its economic output rise relative to the past year. China and other emerging countries will maintain their economic expansion in 2014, broadly matching the growth rates of 2013. In our scenario, we assume that the global economy will expand slightly in 2014. Stronger growth should then follow in 2015.
Underlying Economic Conditions
According to the International Monetary Fund ( IMF ), the global economy will experience slightly higher growth in 2014 than in the previous year. The IMF forecasts that world GDP will rise by 3.7 percent (2013: 3.0 percent). For 2015, the IMF predicts 3.9 percent. Upward momentum in 2014 will mainly come from emerging markets, with an increase of 5.1 percent. Advanced economies will deliver GDP growth of 2.2 percent. The eurozone economy is expected to grow for the first time since 2011.
Stronger Expansion for US EconomyUnemployment and high indebtedness are the major problems facing the US economy. On the other hand, it is benefiting from a strong reindustrialization process. The Organisation for Economic Co-Operation and Development (OECD) expects growth of 2.9 percent there. For 2015, the OECD estimate is 3.4 percent.
GDP Trends in 2014
Worldwide
Asia
China
India
Japan
USA
Europe
Germany
0 1 2 3 4 5 6 7 8 9
Sources – worldwide: IMF; Asia: ADB; China: ADB; India: ADB; Japan: OECD; USA: OECD; Europe: IMF; Germany: IMF
G 4.1%
3.7
6.2
7.4
5.7
1.5
2.9
1.0
1.6

166Wacker Chemie AGAnnual Report 2013
Combined Management ReportOutlook
Asia to Rely More on Sustained Economic Expansion In China, the days of double-digit growth are over. The country’s economy is still growing at a high single-digit rate, though. The Chinese government has altered its growth strategy. It is focusing more on robust domestic demand and less on infrastructure projects worth billions or overly strong export growth. The Asian Development Bank ( ADB) expects the Chinese economy to expand by 7.4 percent. For 2015, the OECD anticipates a gain of 7.5 percent. In India, growth has been impeded by insufficient investment, an under-developed infrastructure and the failure to push through economic reforms. The ADB expects GDP to rise by 5.7 percent in 2014 compared with the previous year. In Japan, the economy will continue expanding in 2014. The OECD forecasts growth of 1.5 percent year on year, and 1.0 percent for 2015. Overall, Asia will deliver much higher growth rates than the other regions over the next two years. According to the ADB, Asian economies will expand 6.2 percent compared with 2013.
Europe to Return to Growth for First Time Since 2011The IMF expects Europe to pull out of recession in 2014 and generate marginal growth. After the economic contraction of the past two years, the IMF estimates that GDP for 2014 will edge up by 1.0 percent. Successful budgetary consolidation in individual countries could then lead to stronger GDP growth in 2015. The OECD takes the view that an increase of 1.6 percent is possible. In Germany, economic experts forecast stronger growth than else-where in Europe. The IMF’s estimates are for a 1.6 percent rise. High employment levels and consumer spending will be key to this upturn. The OECD predicts that GDP will increase by 2.0 percent in 2015.
General Sector-Specific Conditions
In the main industries for our business, we expect economic trends to present a mixed picture in 2014.
SemiconductorWafer Demand Likely to Rise in 2014According to Gartner’s market research experts, semiconductor-wafer market volume will grow in 2014. They anticipate that worldwide silicon-wafer sales by surface area sold will rise 5 percent year on year to 63.6 billion cm2. The 300 mm segment is expected to deliver above-average growth of 7 percent. The segment for wafers with diameters below 300 mm is also projected to grow slightly. The Gartner analysts estimate that semiconductor revenues will rise by 8 per cent globally in 2014 to around US$ 8.6 billion. For 2015, Gartner also envisages increases in worldwide volumes and revenues. WACKER should benefit from further market growth for 300 mm wafers. A decisive factor, however, will be the extent to which price pressures in this segment persist.

167Wacker Chemie AGAnnual Report 2013
Combined Management ReportOutlook
WACKER’s Key Customer Sectors
Sectors Trends in 2013 Trends in 2014
Construction Growth Growth
Photovoltaic
Growth, continuing market overcapacity and ongoing consolidation
Strong growth, continuing market overcapacity and ongoing consolidation
Semiconductor Subdued growth Subdued growth
Energy /electrical Slight growth Slight growth
Chemical Weak growth Moderate growth
Photovoltaic Market Remains Challenging but Will Continue to GrowThe photovoltaic market will remain challenging in 2014. It is still suffering from production overcapacity, low prices, and uncertainty about financial incentives for renewable energy. The market trend could also be impeded by anti-dumping investigations in China against European polysilicon manufacturers.
PhotovoltaicMarket Trend in 2014
Installation of New PV Capacity (MW)
Growth in 2014
2014 2013 %
Germany 2,500 3,300 –24
Italy 1,800 1,800 –
Rest of Europe 6,200 6,000 3
USA 6,400 4,200 52
Japan 9,300 7,700 21
China 13,500 11,000 23
Other regions 7,800 5,000 56
Total 47,500 39,000 22
Sources: UBS Investment Research, WACKER’s own market research and Germany’s Federal Network Agency, GTM Research and Solar Industries Association (SEIA), U.S. Solar Market Insight
The substantial fall in prices right along the supply chain has made photovoltaics even more competitive compared with other energy sources. Increased competitiveness is opening up new markets and promoting growth in global solar-application markets. China overtook Germany as the world’s biggest market in 2013. The coming years will see a continuation of this shift toward Asia and other emerging markets outside Europe. According to the EPIA (European Photovoltaic Industry Association), countries with additional growth potential include China, the USA, Japan, India and South Africa.
Based on its own research, WACKER anticipates substantial photovoltaic-market growth in 2014, with newly installed photovoltaic (PV ) capacity likely to come in at between 42 and 50 gigawatts (GW).
T 4.2
T 4.3

168Wacker Chemie AGAnnual Report 2013
Combined Management ReportOutlook
Chemical Industry Again to See Some Growth in 2014After a mixed year in 2013, the German Chemical Industry Association ( VCI ) expects production and sales to edge up in 2014, with prices for chemical products declining slightly. Output should rise 2 percent and sales 1.5 percent. Exports remain the growth driver in Germany’s chemical sector. In 2014, the VCI expects somewhat more momentum from the domestic market. The USA remains by far the biggest trading partner.
WACKER’s chemical divisions primarily see growth opportunities in the BRIC countries, in other emerging economies and in the USA. Amid increasing emerging-economy affluence, we will increase our sales further in such countries as China and India, as well as in South-east Asia. The WACKER portfolio includes many high-end products that are in demand among new customer groups. WACKER POLYMERS sees good growth prospects for VAE dispersions in the European carpet market, where they are replacing styrene-butadiene. WACKER SILICONES expects higher sales in the electrical and electronics sectors, in cosmetics and personal care, and in medical technology. Moreover, high-end products should continue to increase their share of sales compared with standard products.
Global Construction Industry to Remain on Growth PathAccording to Global Insight’s market researchers, the construction industry will continue expanding over the next few years. The market is expected to grow by 4.1 percent on average until 2017. The main drivers of this development will be China, India and Asia as a whole. Global Insight also expects substantial growth for the USA in 2014, above all in the private-housing sector. For Western Europe, Global Insight predicts 2014 will deliver growth for the first time since 2007. Renovation projects and energy efficiency will continue to offer WACKER very good growth prospects for the coming years.
At WACKER POLYMERS, we anticipate that our construction-sector sales will climb in every region during 2014. We see continued growth, for example, with interior paints and dry-mix mortars. At WACKER SILICONES, the percentage of high-end construction products in the portfolio is expected to increase further. There are good growth opportunities not only for hybrid products made from silane-modified organic polymer building blocks and innovative silicone resins for high-end paint and plaster applications, but also for the (all-round) adhesives and (crystal-clear joint) sealants formulated from these resins, and for silicone cartridges sold under our own brand.
Average Growth in Global Construction from 2012 to 2017
Worldwide
Asia
North America
South America
Middle East and Africa
Eastern Europe
Western Europe
0 2 4 6 8
Source: Global Insight
Electrical and Electronics Industries with Moderate Growth Expectations for 2014 The electrical and electronics sectors anticipate moderate growth for 2014. According to estimates by the German Electrical and Electronic Manufacturers’ Association (ZVEI), market volumes could rise further in 2014. The ZVEI expects to see production output increase by
G 4.4%
4.1
5.8
4.8
3.5
3.5
1.6
0.9

169Wacker Chemie AGAnnual Report 2013
Combined Management ReportOutlook
2 percent. There will be double-digit expansion in the BRIC countries, which remain the key driving force behind the global electrical and electronics sectors. The German electronics market is projected to achieve sales of around € 170 billion (2013: € 173 billion). In several application sectors, we see good prospects for expanding our electrical and electronics business. One sector is energy, where new power networks, for example, are being planned in Germany. WACKER SILICONES is a leading player in the USA, Europe and India with its high-temperature-curing silicone rubber for long-rod insulators and its liquid silicone rubber for hollow insulators and cable fittings.
We also anticipate good growth prospects in automotive electronics, which remains a dynamic market. Demand for products exhibiting superior temperature and media resistance is rising. This is an area in which WACKER SILICONES supplies UV-initiated silicones and innovative potting compounds for engines. We expect to generate extra growth through products for optical applications (LEDs) and screens (displays), areas in which we have launched various innovation projects.
Positioning the Group for the Next Two Years
Three levers will continue to determine WACKER’s business strategy over the next two years: expansion into emerging markets and regions, innovations, and the substitution of existing products with WACKER products. The focal regions for further growth remain Brazil, China, India, Southeast Asia and the Middle East. Of these, China offers the greatest potential. We also see opportunities for sales growth in the USA, an established market.
In recent years, WACKER has invested substantial capital in expanding its global production capacities – especially major facilities for upstream products – in order to secure further growth and increase its worldwide presence. With the exception of the Tennessee production site, these investments have been completed. In the next five years, the strategic focus will be on improving profitability and generating a positive net cash flow. On the products side, we are concentrating on increasing the share of high-end products within the overall mix.
WACKER will drive forward its international expansion over the next two years. We will be transferring even greater operational responsibility to the regions. We intend to tailor our products even better to local requirements. We are expanding our network of technical competence centers and WACKER ACADEMY sites in a targeted manner.
In 2014, we will carry on with our intensive efforts to improve our profitability. We have drawn up a series of measures for that purpose. The principal aspects are the following:
ResourceManagement Measures
Measures
Productivity measures relating to the “Wacker Operating System” (WOS) program
Productivity and cost-related measures at WACKER POLYSILICON and Siltronic
Projects relating to corporate departments
Careful personnel planning
The target capital structure for 2014 is thus 60 percent equity and 40 percent borrowed capital.
T 4.5

170Wacker Chemie AGAnnual Report 2013
Combined Management ReportOutlook
The WACKER Group’s Prospects
Our expectations are based on the assumption that the global economy will grow in 2014. For the first time since 2011, Europe’s economy is likely to expand slightly. The strongest growth impetus, though, will come from Asia and the USA.
Our capital expenditures over the next two years will prioritize the completion of our polysilicon production site in Tennessee (USA), which we aim to start up in the second half of 2015. Generally, we are shifting our investment focus toward plants for manufacturing downstream products. WACKER’s priority is to grow its business organically. In our opinion, applications and markets continue to offer good growth potential. As in 2013, capital expenditures will remain below depreciation for the next two years.
WACKER POLYMERS is expanding its production facilities for dispersible polymer powders at Nanjing, China. Annual output there will double from 30,000 to 60,000 metric tons. In 2014, WACKER SILICONES will be investing in plants for downstream products. At Siltronic, capital expenditures are focused on meeting the latest design rules for 300 mm technology.
Future Products and ServicesThe substitution of styrene-butadiene with WACKER’s VAE dispersions will continue, the main markets being the packaging and carpet sectors. The greatest potential for the substitution business is in the USA and Western Europe. Given that we are already very successful in the USA, we will now intensify our efforts in Europe. The European carpet market is the second-biggest in the world, accounting for 30 percent of the total volume. Both markets combined are worth around US$ 15 billion. We aim to strengthen our market position in the fire-protection coatings segment with a new VINNAPAS ® product that provides steel girders in high-rise buildings with superior fire protection. In the event of a fire, intumescent coatings act as an efficient insulating layer that can help save lives. Researchers at Frost & Sullivan expect the market for these coatings to grow to more than US$ 2.5 billion by 2020.
Environmentally friendly interior paints are a rapidly expanding market, particularly in Asia and South America. We aim to profit from further growth in these markets with a new VINNAPAS ® dispersion that has been specially developed for such applications. According to the “marketsandmarkets” research institute, the market for environmentally friendly coatings will grow by some 6 percent on average. It already reached a volume of US$ 60 billion in 2012.
WACKER SILICONES plans to intensify its marketing of specialty silicones. In the lighting techno-logy area, we have developed highly transparent liquid silicones for flexible optical lenses. These lenses improve light control in LED lamps. They also pave the way for the development of new, adaptive headlamp systems for cars. According to a McKinsey study, the lighting market will grow to € 100 billion by 2020, with annual growth rates of between 3 and 5 percent.
WACKER SILICONES is supplying new products for cosmetics and personal-care products in Asia. In China and India, we make silicone emulsions for shampoos and conditioners formulated specifically for Asian consumers. Euromonitor estimates that the Asia-Pacific region’s market for cosmetics and personal-care products is growing by over 4 percent annually. Its total volume will reach € 100 billion by 2017. WACKER BIOSOLUTIONS has developed a new binder system under the VINNEX ® trademark. The system improves the physical properties of bioplastics and facilitates industrial processing. According to a study compiled by the European Bioplastics association, 1.2 million metric tons of bioplastics were produced in 2011. Production output should climb to around 6 million metric tons by 2016.

171Wacker Chemie AGAnnual Report 2013
Combined Management ReportOutlook
Research & DevelopmentThe Group’s research and development work remains focused on key strategic projects. In 2014, WACKER intends to spend 20 percent (2013: 20 percent) of its R & D budget on these projects. One major aspect of R & D work in 2014 will be to implement our New Solutions initiative for developing technically and commercially superior solutions for new applications. The R & D budget planned for 2014 amounts to about € 169 million. Our R & D priorities remain the highly promising fields of energy, catalysis, biotechnology, construction applications and semiconductors. We are devoting particular attention to energy storage and renewable energy generation.
In 2014, WACKER will partner with the Technical University of Berlin in organizing an international science convention. The 17th International Symposium on Silicon Chemistry ( ISOS XVII ) and the jointly organized 7th European Silicon Days are expected to attract as many as 600 researchers from the field of silicon and silicone chemistry to Berlin. During the convention, WACKER will present – for the 14th time – the WACKER Silicone Award for outstanding achieve ments in this area of research.
ProductionWACKER will bring additional production capacity on stream over the next two years. In 2014, WACKER BIOSOLUTIONS will commence operations for PVAc solid resins (annual capacity: 20,000 metric tons) at Nanjing, China. Once that site has met the necessary requirements to qualify for food manufacturing, the old site in Wuxi will close. At Nanjing, we are also planning to expand production capacity for dispersible polymer powders. Current annual capacity there is to rise by 30,000 metric tons to 60,000 metric tons. At WACKER SILICONES, we intend to expand a facility at Burghausen to enable the production of short-chain silicone fluids, vinyl polymers and DEHESIVE® systems for paper coatings. The start-up there is planned for 2015. WACKER POLYSILICON will be commissioning its new polysilicon cleaning plant at the Burghausen site in 2014. During the second half of 2015, polysilicon production is expected to start at the new site in the US state of Tennessee. The Group’s “Wacker Operating System” (WOS) program is focused on further improving productivity, and that involves scrutinizing all the main productivity levers (raw-material and energy efficiency, capacities, and labor productivity). The emphasis is on key projects that have a high economic impact on both costs and benefits.
Facility StartUps in 2014 and 2015
Location Project Start-Up
Burghausen Polysilicon cleaning plant 2014
Zhangjiagang Emulsion plant 2014
Burghausen Expansion of Silicones 1 2014
Nanjing Solid resins 2014
Burghausen New steam turbine 2014
In 2014, maintenance costs will remain at about € 360 million, the prior-year level.
T 4.6

172Wacker Chemie AGAnnual Report 2013
Combined Management ReportOutlook
Procurement and LogisticsEnergy and raw-material procurement continues to have an important bearing on WACKER’s profitability. Our energy and raw-material costs account for over one-third of the cost of goods sold. WACKER anticipates that raw-material prices will remain flat, provided the oil price per barrel stays within a corridor of US$ 100 to 110. Our four key raw materials are subject to mixed price trends, even within individual regions. For silicon metal, prices are likely to continue their slight decline in 2014. We expect vinyl-acetate-monomer (VAM) prices to be a little lower in the Americas, but to edge up in Europe. The price of ethylene will remain flat in 2014. We anticipate rising methanol prices over the same period.
On the energy front, the price trend is dominated by regulatory effects. Their influence is greater than any of the market fluctuations on power exchanges. We expect to see electricity-intensive production processes exempted from the German EEG levy in 2014. At the same time, we anticipate substantially higher grid charges and a higher EEG levy for our non-exempted production areas. Energy costs for 2014 will be at the prior-year level.
Supplies of raw materials and energy are secure for the next two years. The markets where we source our raw materials are sufficiently liquid for bottlenecks to be unlikely. We have largely secured the required volumes of our four main raw materials for 2014 and, in most cases, for 2015. We will continue broadening the global reach of WACKER’s portfolio of raw-material suppliers during the coming two years. At the same time, we will keep an even sharper eye on the raw-material purchasing sources that are relevant to us, so that we can access new suppliers.
We have adopted the same approach with technical procurement, where we aim to systematically optimize our supplier portfolio to measurably increase the business value contribution to the company’s success over the next two years. The priority, here, is the targeted expansion of our global procurement network. There are two main areas of focus. According to a policy of “from the region and for the region,” we will systematically scout out suitable local suppliers as WACKER partners for new projects in Asia, primarily China and South Korea. At the same time, we will increase supplies from China, India and South Korea for our sites in the Americas and Europe. These efforts also involve enhancing the IT and communication networks of our international procurement organization. Key areas are the gradual internationalization of work on goods categories and regular information-sharing by the regional purchasing organizations.
On the logistics front, the new public freight terminal (combined road / rail terminal ) at Burghausen will open in 2014. Our goal is to use the new terminal to shift more freight from road to rail.
Sales and MarketingWACKER will increase the number of sales employees in Asia. The aim is to step up our pre-sence and achieve greater market penetration. We have been using the “WACKER on Wheels” pilot project to present our polymer products directly on construction sites in Vietnam, and now plan to extend the approach to other Asian countries, such as Indonesia. Important tradeshows for us in 2014 include in-cosmetics in Hamburg in April and Compamed in Düsseldorf in November. We will be participating in two major tradeshows for coatings and paints: in Dubai in March, and in the USA in April.

173Wacker Chemie AGAnnual Report 2013
Combined Management ReportOutlook
EmployeesWACKER will adhere to its conservative approach toward hiring new employees. Overall, we estimate that our workforce will grow in 2014 due to the acquisition of Scil Proteins Production in Halle and the consolidation of Siltronic Samsung Wafer Pte. Ltd. We also expect employee numbers to increase in 2015.
In 2014, we will conclude the introduction of a new talent-management process. With it, WACKER aims to promote employee potential across the Group and identify a sufficient number of qualified candidates who can assume challenging tasks in the long term. To im-prove preventive healthcare for our employees, we are opening a new Health Center at our largest site, Burghausen, in 2014.
We intend to extend the diverse flextime arrangements already in place by introducing four models over the next few years:
Family-care time, to enable employees to care for relatives Reduced full-time employment, available to standard-pay-scale employees over 60
with more demanding jobs Sabbaticals, which enable employees to manage their personal working time flexibly
by taking a block of time off work New qualification programs that offer options for taking advanced training courses
either part-time alongside work or full-time while in employment
SustainabilityWACKER is continuing to work on improving its energy efficiency. The planned start of polysilicon production in Tennessee in 2015 will increase our power consumption. We aim to reduce our specific energy consumption (amount of energy per unit of net production output) by 11 percent in Germany by 2022. From 2014 on, we will pursue three quantifiable environmental goals, focused on products, climate protection and emissions. We have therefore selected parameters that are relevant to our production operations: carbon dioxide (CO2) equivalent, non-methane volatile organic compounds (NMVOC s), and particulate matter. We aim to cut our particulate-matter emissions by 25 percent over the next ten years for a com parable product portfolio. We are also striving for a 25 percent reduction in NMVOC emissions. In Germany, we are planning to scale back specific CO2-equivalent emissions by 15 percent per metric ton of net production.
Our 2015 goal for occupational safety is to reduce our groupwide accident rate (the number of workplace accidents per million hours worked) to below 2.0. As part of our efforts toward this goal, we intend to reduce the 2014 accident rate at German sites to below 3.0 per million hours worked.
We are currently preparing a further 160 substance dossiers for the third REACH stage, which runs until mid-2018. We will publish further descriptions of the safe, environmentally compliant use of chemicals (GPS safety summaries) for the substances we have registered with the European Chemicals Agency (ECHA).

174Wacker Chemie AGAnnual Report 2013
Combined Management ReportOutlook
Outlook for 2014
WACKER’s main assumptions in its planning relate to raw-material and energy costs, per sonnel expenses and exchange rates. For 2014, we are planning on an exchange rate of US$ 1.35 and ¥ 135 to € 1.
Performance Indicators and ValueBased ManagementWACKER’s key financial performance indicators are unchanged compared with the previous year.
In 2014, WACKER will see its sales and EBITDA performance influenced by two decisions, both announced in January 2014. Siltronic’s acquisition of a majority joint-venture stake in Siltronic Samsung Wafer Pte. Ltd., in which Siltronic and Samsung had previously each held 50 percent, will positively impact sales and EBITDA trends. At WACKER POLYSILICON, the restructuring of the contractual and delivery relationship with one of its solar-silicon customers will have a positive impact of € 115 million on the division’s EBITDA and EBIT. Both these factors have been given due consideration in projections about WACKER’s development in 2014.
Group Sales and Volumes Set to Grow in 2014WACKER expects volumes to rise at every division in 2014. In our planning assumptions, we anticipate that silicon-wafer prices will remain low (at levels below those of the prior year) and polysilicon prices will be somewhat above the prior-year level, with Group sales rising by a mid-single-digit percentage. For this forecast, we have also assumed that no trade barriers will be introduced for polysilicon shipped from Europe to China and that semiconductor demand will pick up in 2014.
Economic uncertainties mean the actual performance of the WACKER Group and its divisions could depart from our assumptions, either positively or negatively.
From today’s perspective, sales will climb at our chemical divisions and at WACKER POLYSILICON and Siltronic. We anticipate that Asia will deliver the biggest sales gains for our products. In 2015, sales should increase further compared with 2014 – provided that the world economy remains on its growth path, as predicted by business research institutes, and that there are no unforeseeable slumps in WACKER’s key regions and industries.
Outlook for 2014
Reported in 2013
Outlook for 2014
Key Financial Performance IndicatorsEBITDA margin (%) 15.2 Slight increase
ROCE (%) 2.2 Slight increase
EBITDA (€ million) 678.7 At least 10 percent higher
Net cash flow (€ million) 109.7 Balanced net cash flow
Supplementary Financial Performance IndicatorsSales (€ million) 4,478.9 Mid-single-digit % increase
Investments (€ million) 503.7 Approx. 550
Net financial debt (€ million) 792.2 Increase of between 300 and 400
Depreciation (€ million) 564.4 Approx. 600
T 4.7

175Wacker Chemie AGAnnual Report 2013
Combined Management ReportOutlook
Outlook for the Key Performance Indicators at Group LevelFrom today’s perspective, the main key performance indicators at Group level will develop as follows:
EBITDA margin and EBITDA: the EBITDA margin should rise slightly compared with the previous year. Our projection is for EBITDA in 2014 to be at least 10 percent above its prior-year level as a result of higher volumes, further cost savings, first-time consolidation of Siltronic Samsung Wafer Pte. Ltd., and positive earnings effects due to restructuring of our contractual and delivery relationship with a solar-silicon customer. We anticipate continued price pressure for standard chemical products and silicon wafers. We expect a year-on-year improvement in Group net income amid higher depreciation and a tax rate of over 50 percent.
ROCE: our ROCE will edge up slightly compared with the 2013 figure of 2.2 percent.
Net cash flow: in 2014, we are aiming for a balanced net cash flow. Higher year-on-year invest ments and weaker positive effects from our inventory management will cause net cash flow to be substantially lower than last year.
Outlook for Supplementary Performance Indicators at Group LevelInvestments: in 2014, investments are expected to total about € 550 million. The capital contributions made to acquire a majority stake in the joint venture with Samsung are not shown as investments, but as financing for the repayment of the joint venture’s financial liabilities. It is unlikely that the anticipated cash flow from operating activities will fully cover capital expenditures. Investments of a similar amount are budgeted for 2015. Depreciation will come in at about € 600 million in 2014. The majority-stake acquisition in the Samsung joint venture causes an increase of around € 80 million.
Investments by Division in 2014
WACKER POLYSILICON
WACKER SILICONES
WACKER POLYMERS
SILTRONIC
WACKER BIOSOLUTIONS
Infrastructure / Other
0 25 50 75 100
Net financial debt: our net financial debt will increase year-on-year by about € 300–400 million (2013: € 792.2 million). This increase stems mainly from the acquisition by Siltronic of a majority stake in Siltronic Samsung Wafer Pte. Ltd. and from our polysilicon deliveries to customers for advance payments already received from them.
Divisional Sales and EBITDA Trends At our chemical divisions, we posted what were, in some cases, one-time cost savings in 2013 that will not recur in this form in 2014.
At WACKER SILICONES, we anticipate substantially higher 2014 sales, with no significant pressure from raw-material costs, though the price squeeze on standard products will remain. The division’s volume growth in percentage terms is likely to outperform global GDP expansion. Growth will be generated mainly in Asia, where rising affluence is prompting higher per-capita consumption of silicone products. Additionally, ever increasing quality demands are accelerating the process of substituting simple products with value-added versions that incorporate silicones. We expect the steepest growth from products for
G 4.8%
50
16
11
9
3
11

176Wacker Chemie AGAnnual Report 2013
Combined Management ReportOutlook
personal care, for the electrical and electronics sectors, and for medical technology. EBITDA is projected to be slightly lower than last year, owing to the fact that the prior-year figure included a non-recurring effect in the amount of € 13.7 million (for reversal of a provision for purchase contract obligations in China).
At WACKER POLYMERS, we expect sales to climb substantially compared with last year. In dis persions, the main growth driver remains the shift away from styrene-butadiene toward VAE dispersions in the carpet sector in the USA and Western Europe. In emerging economies, we expect to see further growth in construction applications, especially interior paints. The regions with the highest sales growth are likely to be China, India and the Americas. We anticipate only a slight sales improvement in Europe. We will continue to pursue market strategies tailored to individual regions in order to fully harness growth potential. A slight year-on-year increase is expected in EBITDA.
At WACKER BIOSOLUTIONS, our projection is for substantial sales growth in 2014. We aim to step up our biologics business following the takeover of Scil Proteins Production. WACKER BIOSOLUTIONS now has a fermenter with a capacity of up to 1,500 liters. It can be used not only to manufacture pharmaceutical actives for clinical testing, but also for the market supply phase. We expect to see continued sales growth in the other segments (phar-maceuticals / agrochemicals and food) as well. We see the greatest growth opportunities not only in Asia, as before, but also in Germany. EBITDA is projected to come in at the prior-year level.
WACKER’s polysilicon business is expected to generate volume and sales growth in 2014. Our assumption is that the photovoltaic market will continue on its growth trajectory. Never-theless, overcapacity is still a feature of the entire supply chain. We expect a very slight recovery in polysilicon prices for photovoltaic applications. However, our business could be adversely affected if the Chinese Ministry of Commerce were to impose punitive tariffs on European polysilicon manufacturers. Our main focus remains on achieving another substantial reduction in polysilicon production costs. Our EBITDA forecast is for substantial growth compared with the previous year. EBITDA performance will benefit from the restructuring of the contractual and delivery relationship with a customer from the solar sector. This will result in special income from retained advance payments and from damages received.
At Siltronic, we expect substantial sales growth in 2014, fueled primarily by the full consolidation of Siltronic Samsung Wafer Pte. Ltd., the joint venture that is now 78 percent owned by Siltronic. As previously, we anticipate that 2014 will see price pressure impeding sales growth. In the market for 300 mm silicon wafers, we expect continued growth. In the 200 mm and smaller-diameter segments, we forecast stable demand from today’s perspective. Our EBITDA projection is for a substantial increase on last year owing to con-solidation of the joint venture.
Future DividendsWACKER’s policy on dividends is generally oriented toward distributing at least 25 percent of net income to shareholders, assuming the business situation allows this and the corporate bodies responsible agree.

177Wacker Chemie AGAnnual Report 2013
Combined Management ReportOutlook
FinancingThe main aspects of our financing policy remain valid. Even if the debt level rises further in 2014, we are confident that we have a strong financial profile with a sensible capital structure and healthy maturities for our debt. As of December 31, 2013, WACKER had some € 700 million in unused credit lines with maturities of more than one year.
MediumTerm GoalsAt WACKER’s Capital Markets Day on July 1, 2013 in London, the company disclosed its medium-term targets through 2017 to the capital markets for the first time. Our focus for this period is on increasing the Group’s profitability and generating a positive cash flow.
WACKER’s MediumTerm Targets through 2017
Targets for 2017
Sales € 6 billion to € 6.5 billion
EBITDA € 1.2 billion
EBITDA margin Approx. 20 percent
ROCE Over 11 percent
Investments At the level of or below depreciation
Executive Board Statement on Overall Business ExpectationsDue to the positive projections, WACKER anticipates that the world economy will deliver stronger year-on-year growth in 2014. From today’s perspective, the global economy is expected to continue growing in 2015.
In 2014, we expect Group sales to rise, with all five business divisions increasing their sales. On the EBITDA front, our forecast is for substantial year-on-year growth of more than 10 percent, which will improve the EBITDA margin. The EBITDA trend will be influenced, though, by special income arising from the restructuring of our contractual and delivery relationship with a customer from the solar sector. This will result in special income from retained advance payments and from damages received. We anticipate that energy and raw-material costs – the main factors affecting cost of goods sold – will stay at the prior-year level. Price pressure is expected, particularly on silicon wafers and standard silicone and polymer products. In our polysilicon business, we assume that prices will rise slightly and that demand will pick up.
ROCE will edge up relative to last year.
Investments will be somewhat above the prior-year level at about € 550 million. Depreciation will be slightly higher at around € 600 million and thus higher than in the previous year. We are aiming to achieve a balanced cash flow. Net financial debt will climb by about € 300 – 400 million. Group net income should be higher than in the previous year.
T 4.9

178Wacker Chemie AGAnnual Report 2013
Combined Management ReportOutlook
WACKER supplies outstanding products and holds at least a No. 3 position in the markets of its four biggest divisions. The Group’s technological and innovative strength and its presence in key markets offer us a firm basis for reinforcing and even expanding our market positions.
After two years of steep price declines, particularly in polysilicon, we now see good prospects for growing sales and EBITDA in 2014. Given our current strategy, we also consider WACKER well equipped to continue growing profitably beyond 2014.
Up to the date of preparing the financial statements, nothing changed in our forecast.

Co
nso
lida
ted
Fin
an
cia
l Sta
tem
en
ts
Sustainable Management
Climate change and the constant rise in energy demand – a dilemma that cannot be solved without renewable energy sources. Consequently, photovoltaics is playing a crucial role in the energy mix of ever more countries. As a global market leader, WACKER supplies hyperpure polysilicon to all major solarcell manufacturers.
Consolidated Financial Statements
5

Co
nso
lida
ted
Fin
an
cia
l Sta
tem
en
ts
181 Statement of Income of the WACKER Group
182 Statement of Comprehensive Income of the WACKER Group
183 Statement of Financial Position of the WACKER Group
185 Statement of Cash Flows of the WACKER Group
186 Statement of Changes in Equity of the WACKER Group
187 Reconciliation of Other Equity Items
188 Segment Information by Division
190 Segment Information by Region
191 Notes of the WACKER Group
265 Supervisory Board
267 Executive Board
268 Corporate Governance Report and Declaration on Corporate Management
278 Declaration by the Executive Board on Accounting Methods and Auditing
279 Auditors’ Report
Further Information
280 Multiyear Overview
282 Chemical Glossary
284 Financial Glossary
285 List of Tables and Figures
287 Index
Consolidated Financial Statements

181Wacker Chemie AGAnnual Report 2013
Consolidated Financial Statements
Statement of Income of the WACKER GroupFor the Period January 1 to December 31
Statement of Income
€ million Notes 2013 2012 *
Sales 01 4,478.9 4,634.9
Cost of goods sold – 3,815.4 – 3,815.4
Gross profit from sales 663.5 819.5
Selling expenses – 272.0 – 279.5
Research and development expenses – 173.8 – 173.7
General administrative expenses – 111.7 – 118.5
Other operating income 01 254.5 366.7
Other operating expenses 01 – 210.2 – 265.4
Operating result 150.3 349.1
Result from investments in joint ventures and associates 02 – 36.1 – 82.6
Other investment income 02 0.1 0.1
EBIT (earnings before interest and taxes) 114.3 266.6
Interest income 02 15.0 16.0
Interest expenses 02 – 41.8 – 26.2
Other financial result 02 – 56.5 – 52.5
Financial result – 83.3 – 62.7
Income before taxes 31.0 203.9
Income taxes 03 – 24.7 – 89.2
Net income for the year 6.3 114.7
Of whichAttributable to Wacker Chemie AG shareholders 2.6 120.7
Attributable to non-controlling interests 12 3.7 – 6.0
Earnings per common share (€ ) (basic/diluted) 19 0.05 2.43
* Adjusted for the effects of the adoption of IAS 19 (revised); see Changes in Accounting and Valuation Methods in the Notes section.
T 5.1

182Wacker Chemie AGAnnual Report 2013
Consolidated Financial Statements
Statement of Comprehensive Income of the WACKER GroupFor the Period January 1 to December 31
Statement of Comprehensive Income
€ million 2013 2012 *
Before taxes
Deferred taxes
Before taxes
Deferred taxes
Net income for the year 6.3 114.7
Items not reclassified to the statement of incomeRemeasurement of defined benefit plans 204.7 –51.9 152.8 –383.2 104.5 –278.7
Sum of items not reclassified to the statement of income 204.7 –51.9 152.8 –383.2 104.5 –278.7
Items reclassified to the statement of incomeDifference from foreign currency translation adjustments –54.7 – –54.7 –13.0 – –13.0
Changes in market values of the securities available for sale –0.8 0.2 –0.6 0.6 –0.1 0.5
Changes in market values of derivative financial instruments (cash flow hedge) 12.1 –3.4 8.7 6.1 –1.7 4.4
Of which recognized in profit and loss –2.5 0.7 –1.8 –3.3 0.9 –2.4
Effects of net investments in foreign operations –2.6 – –2.6 – – –
Share of cash flow hedge in associates accounted for using the equity method –0.7 – –0.7 1.8 – 1.8
Non-controlling interests –2.2 – –2.2 –0.7 – –0.7
Sum of items reclassified to the statement of income –48.9 –3.2 –52.1 –5.2 –1.8 –7.0
Income and expenses recognized in equity 155.8 –55.1 100.7 –388.4 102.7 –285.7
Total income and expenses reported in the fiscal year 107.0 –171.0
Of whichAttributable to Wacker Chemie AG shareholders 105.5 –164.3
Attributable to non-controlling interests 1.5 –6.7
* Adjusted for the effects of the adoption of IAS 19 (revised); see Changes in Accounting and Valuation Methods in the Notes section.
T 5.2
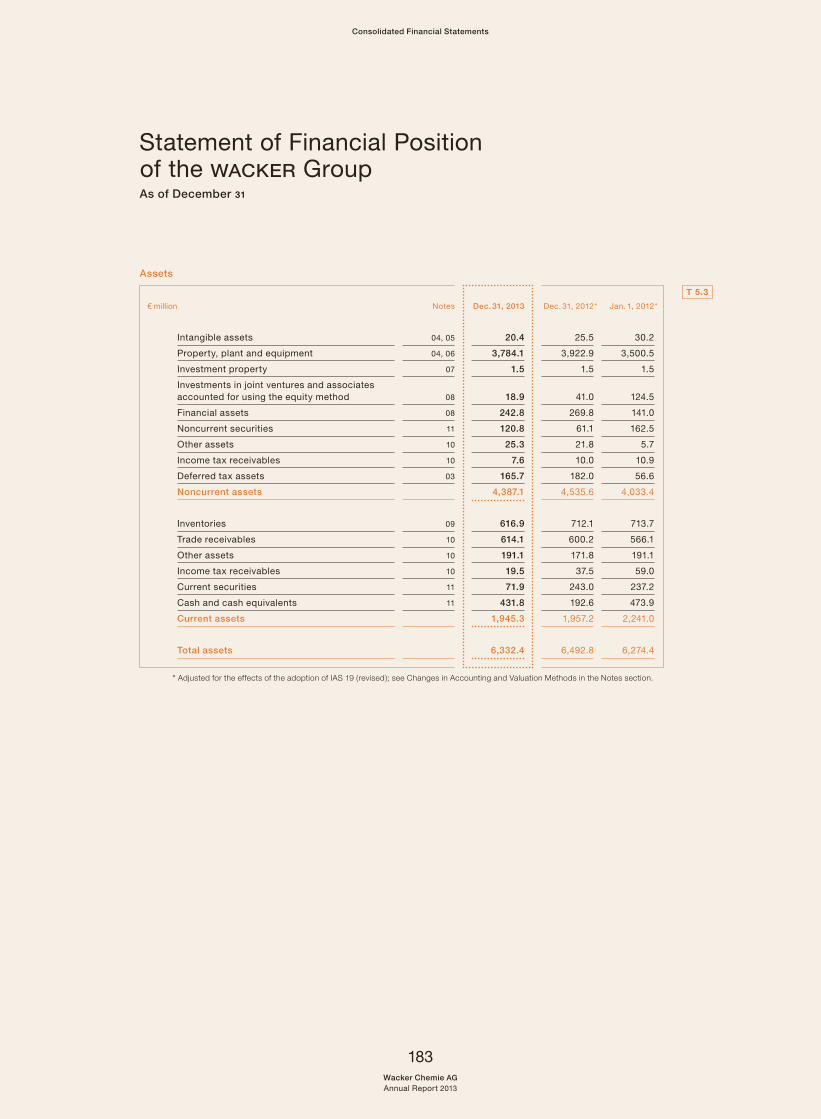
183Wacker Chemie AGAnnual Report 2013
Consolidated Financial Statements
Statement of Financial Position of the WACKER GroupAs of December 31
Assets
€ million Notes Dec. 31, 2013 Dec. 31, 2012 * Jan. 1, 2012 *
Intangible assets 04, 05 20.4 25.5 30.2
Property, plant and equipment 04, 06 3,784.1 3,922.9 3,500.5
Investment property 07 1.5 1.5 1.5
Investments in joint ventures and associates accounted for using the equity method 08 18.9 41.0 124.5
Financial assets 08 242.8 269.8 141.0
Noncurrent securities 11 120.8 61.1 162.5
Other assets 10 25.3 21.8 5.7
Income tax receivables 10 7.6 10.0 10.9
Deferred tax assets 03 165.7 182.0 56.6
Noncurrent assets 4,387.1 4,535.6 4,033.4
Inventories 09 616.9 712.1 713.7
Trade receivables 10 614.1 600.2 566.1
Other assets 10 191.1 171.8 191.1
Income tax receivables 10 19.5 37.5 59.0
Current securities 11 71.9 243.0 237.2
Cash and cash equivalents 11 431.8 192.6 473.9
Current assets 1,945.3 1,957.2 2,241.0
Total assets 6,332.4 6,492.8 6,274.4
* Adjusted for the effects of the adoption of IAS 19 (revised); see Changes in Accounting and Valuation Methods in the Notes section.
T 5.3

184Wacker Chemie AGAnnual Report 2013
Consolidated Financial StatementsStatement of Financial Position of the WACKER Group
Equity and Liabilities
€ million Notes Dec. 31, 2013 Dec. 31, 2012 * Jan. 1, 2012 *
Subscribed capital of Wacker Chemie AG 260.8 260.8 260.8
Capital reserves of Wacker Chemie AG 157.4 157.4 157.4
Treasury shares –45.1 –45.1 –45.1
Retained earnings 1,973.9 2,001.1 1,989.7
Other equity items –168.2 –271.1 13.9
Equity attributable to Wacker Chemie AG shareholders 2,178.8 2,103.1 2,376.7
Non-controlling interests 18.3 18.2 26.3
Equity 12 2,197.1 2,121.3 2,403.0
Provisions for pensions 13 1,079.3 1,235.5 826.7
Other provisions 14 148.2 164.7 190.7
Income tax provisions 14 34.5 32.1 61.3
Deferred tax liabilities 3 1.5 2.8 1.5
Financial liabilities 15 1,247.4 958.5 662.1
Other liabilities 16 565.8 816.6 1,007.8
Noncurrent liabilities 3,076.7 3,210.2 2,750.1
Other provisions 14 92.8 100.7 114.7
Income tax provisions 14 47.1 42.3 7.2
Income tax liabilities 16 1.5 1.2 0.9
Financial liabilities 15 169.3 238.7 115.8
Trade payables 16 309.4 379.8 402.6
Other liabilities 16 438.5 398.6 480.1
Current liabilities 1,058.6 1,161.3 1,121.3
Liabilities 4,135.3 4,371.5 3,871.4
Total equity and liabilities 6,332.4 6,492.8 6,274.4
* Adjusted for the effects of the adoption of IAS 19 (revised); see Changes in Accounting and Valuation Methods in the Notes section.
T 5.4

185Wacker Chemie AGAnnual Report 2013
Consolidated Financial Statements
Statement of Cash Flows of the WACKER GroupFor the Period January 1 to December 31
Statement of Cash Flows
€ million Notes 2013 2012 *
Net income for the year 6.3 114.7
Depreciation and impairments / write-ups of noncurrent assets 564.4 528.8
Changes in provisions 47.3 98.7
Changes in deferred taxes –41.0 –21.6
Other non-cash expenses and income –43.9 –81.0
Result from disposal of noncurrent assets 3.2 –2.0
Result from equity accounting and joint venture dividends 39.4 85.2
Changes in inventories 95.8 –20.4
Changes in trade receivables –22.5 –49.2
Changes in other assets 13.1 –6.6
Changes in other liabilities 2.8 –129.0
Changes in advance payments received –200.9 –154.4
Cash flow from operating activities (gross cash flow) 21 464.0 363.2
Investment in intangible assets, property, plant and equipment, and investment property –567.1 –942.9
Investment in financial assets – –0.3
Payments for loans to joint ventures and associates accounted for using the equity method – –117.8
Proceeds from the disposal of intangible assets, property, plant and equipment 4.9 7.2
Proceeds from the disposal of investments 7.0 –
Cash flow from longterm investing activities before securities –555.2 –1,053.8
Acquisition of securities –147.1 –151.3
Disposal of securities 252.8 234.7
Cash flow from investing activities 21 –449.5 –970.4
Dividends paid –29.8 –109.3
Dividends paid to non-controlling interests –1.4 –1.4
Bank loans raised 84.3 505.9
Bank loans repaid –124.7 –66.1
Other financial liabilities raised 306.3 3.7
Other financial liabilities repaid –7.1 –6.2
Cash flow from financing activities 21 227.6 326.6
Changes due to exchange-rate fluctuations –2.9 –0.7
Changes in cash and cash equivalents 11 239.2 –281.3
At the beginning of the year 192.6 473.9
At the end of the year 431.8 192.6
Additional information on payment transactions included in the cash flow from operating activitiesTaxes paid –37.9 –85.2
Interest paid –43.9 –37.0
Interest received 13.4 24.2
Dividends received 3.5 2.8
* Adjusted for the effects of the adoption of IAS 19 (revised); see Changes in Accounting and Valuation Methods in the Notes section.
T 5.5

186Wacker Chemie AGAnnual Report 2013
Consolidated Financial Statements
Statement of Changes in Equity of the WACKER GroupFor the Period January 1 to December 31
Statement of Changes in Equity
€ million
Sub-scribed capital
Capital reserves
Treasury shares
Retained earnings
Other equity items
Total
Non- con trolling
interests
Total
Jan. 1, 2012 (as previously reported) 260.8 157.4 –45.1 2,216.4 13.9 2,603.4 26.3 2,629.7
Effects of retroactive application of IAS 19 (revised) – – – –226.7 – –226.7 – –226.7
Jan. 1, 2012 * 260.8 157.4 –45.1 1,989.7 13.9 2,376.7 26.3 2,403.0
Net income for the year – – – 120.7 – 120.7 –6.0 114.7
Dividends paid – – – –109.3 – –109.3 –1.4 –110.7
Income and expenses recognized in equity – – – – –285.0 –285.0 –0.7 –285.7
Dec. 31, 2012 * 260.8 157.4 –45.1 2,001.1 –271.1 2,103.1 18.2 2,121.3
Jan. 1, 2013 260.8 157.4 –45.1 2,001.1 –271.1 2,103.1 18.2 2,121.3
Net income for the year – – – 2.6 – 2.6 3.7 6.3
Dividends paid – – – –29.8 – –29.8 –1.4 –31.2
Income and expenses recognized in equity – – – – 102.9 102.9 –2.2 100.7
Dec. 31, 2013 260.8 157.4 –45.1 1,973.9 –168.2 2,178.8 18.3 2,197.1
* Adjusted for the effects of the adoption of IAS 19 (revised); see Changes in Accounting and Valuation Methods in the Notes section.
T 5.6

187Wacker Chemie AGAnnual Report 2013
Consolidated Financial Statements
Reconciliation of Other Equity ItemsFor the Period January 1 to December 31
Reconciliation of Other Equity Items
€ million
Changes in market values of
securities available
for sale
Difference from foreign
currency translation
adjustments
Changes in market values of
derivative financial
instruments (cash flow
hedge)
Re measure-ment of defined
benefit plans
Effects of net investments
in foreign operations
Total (excluding
noncontrolling
interests)
Jan. 1, 2012 0.9 16.8 –3.8 – – 13.9
Additions 0.5 – 3.0 –278.7 – –275.2
Other changes – – 5.6 – – 5.6
Reclassification in the statement of income – – –2.4 – – –2.4
Changes in exchange rates – –13.0 – – – –13.0
Dec. 31, 2012 * 1.4 3.8 2.4 –278.7 – –271.1
Jan. 1, 2013 1.4 3.8 2.4 –278.7 – –271.1
Additions – – 7.5 152.8 – 160.3
Other changes – – 2.3 – – 2.3
Disposals – 0.6 – – – – – 0.6
Reclassification in the statement of income – – –1.8 – – –1.8
Changes in exchange rates – –54.7 – – –2.6 –57.3
Dec. 31, 2013 0.8 –50.9 10.4 –125.9 –2.6 –168.2
* Adjusted for the effects of the adoption of IAS 19 (revised); see Changes in Accounting and Valuation Methods in the Notes section.
T 5.7

188Wacker Chemie AGAnnual Report 2013
Consolidated Financial Statements
Segment Information by DivisionFor the Period January 1 to December 31
2013
€ million Silicones Polymers Bio- solutions
Poly-silicon
Siltronic Other Con-solidation
Group
External sales 1,672.0 958.3 158.4 844.9 735.8 109.5 – 4,478.9
Internal sales 0.2 20.4 – 79.3 7.2 83.2 –190.3 –
Total sales 1,672.2 978.7 158.4 924.2 743.0 192.7 –190.3 4,478.9
EBIT 151.1 112.9 17.2 0.1 –95.9 –73.1 2.0 114.3
Depreciation and impairments / write-ups 79.1 34.9 6.4 233.8 122.4 87.8 – 564.4
EBITDA 230.2 147.8 23.6 233.9 26.5 14.7 2.0 678.7
EBIT includes:Result from investments in joint ventures and associates 5.9 – – – –42.5 – 0.5 –36.1
Impairment losses – – – –1.4 –34.8 –0.8 – –37.0
Additions to property, plant and equipment 1 85.4 36.8 10.2 290.0 30.9 50.4 – 503.7
Additions to financial assets 2 – – – – – – – –
Asset additions 85.4 36.8 10.2 290.0 30.9 50.4 – 503.7
Assets (Dec. 31) 1,186.9 481.2 116.1 2,331.9 1,095.6 1,500.4 –379.7 6,332.4
Liabilities (Dec. 31) 691.8 280.6 60.7 1,809.4 302.8 1,365.4 –375.4 4,135.3
Net assets (Dec. 31) 495.1 200.6 55.4 522.5 792.8 135.0 –4.3 2,197.1
Investments in joint ventures and associates included in net assets (Dec. 31) 18.9 – – – – – – 18.9
Research and development expenses 34.6 12.3 7.0 20.6 59.2 43.4 –3.3 173.8
Employees (Dec. 31) 4,109 1,377 371 2,102 3,746 4,304 – 16,009
Employees (average) 4,110 1,377 371 2,126 3,806 4,344 – 16,134
1 Intangible assets; property, plant and equipment; investment property2 Investments in joint ventures and associates, financial assets
The segment information by division is an integral part of the Notes to the Consolidated Financial Statements. For explanations of the key indicators, see Note 22.
T 5.8

189Wacker Chemie AGAnnual Report 2013
Consolidated Financial StatementsSegment Information by Division
2012*
€ million Silicones Polymers Bio- solutions
Poly-silicon
Siltronic Other Con-solidation
Group
External sales 1,633.8 975.3 154.1 949.4 858.5 63.8 – 4,634.9
Internal sales 14.2 27.8 3.5 186.4 9.4 106.1 –347.4 –
Total sales 1,648.0 1,003.1 157.6 1,135.8 867.9 169.9 –347.4 4,634.9
EBIT 106.4 110.7 17.8 200.8 –92.2 –76.8 –0.1 266.6
Depreciation and impairments / write-ups 82.9 36.7 6.7 226.7 92.9 82.9 – 528.8
EBITDA 189.3 147.4 24.5 427.5 0.7 6.1 –0.1 795.4
EBIT includes:Result from investments in joint ventures and associates –55.9 – – – –26.6 – –0.1 –82.6
Impairment losses – – – – –2.5 – – –2.5
Additions to property, plant and equipment 1 70.9 58.8 19.3 698.1 73.3 56.9 – 977.3
Additions to financial assets 2 87.9 – – – 29.9 0.3 – 118.1
Asset additions 158.8 58.8 19.3 698.1 103.2 57.2 – 1,095.4
Assets (Dec. 31) 1,174.6 483.2 107.6 2,417.6 1,136.6 1,446.3 –273.1 6,492.8
Liabilities (Dec. 31) 691.2 265.4 55.8 1,996.8 385.6 1,240.2 –263.5 4,371.5
Net assets (Dec. 31) 483.4 217.8 51.8 420.8 751.0 206.1 –9.6 2,121.3
Investments in joint ventures and associates included in net assets (Dec. 31) 19.3 – – – 22.2 – –0.5 41.0
Research and development expenses 31.3 13.0 6.6 12.8 67.4 47.6 –5.0 173.7
Employees (Dec. 31) 3,960 1,365 357 2,349 3,978 4,283 – 16,292
Employees (average) 3,947 1,370 349 2,325 4,351 4,321 – 16,663
1 Intangible assets; property, plant and equipment; investment property2 Investments in joint ventures and associates, financial assets
The segment information by division is an integral part of the Notes to the Consolidated Financial Statements. For explanations of the key indicators, see Note 22.
* Adjusted for the effects of the adoption of IAS 19 (revised); see Changes in Accounting and Valuation Methods in the Notes section.
T 5.9

190Wacker Chemie AGAnnual Report 2013
Consolidated Financial Statements
Segment Information by RegionFor the Period January 1 to December 31
2013
€ million Germany Rest of Europe
The Americas
Asia Other regions
Con-solidation
Group
External sales by customer location 647.0 1,073.8 761.0 1,826.1 171.0 – 4,478.9
External sales by Group company location 3,782.3 144.7 742.1 761.6 7.0 –958.8 4,478.9
Additions to property, plant and equipment 1 186.5 5.7 280.7 30.8 – – 503.7
Asset additions 186.5 5.7 280.7 30.8 – – 503.7
Assets (Dec. 31) 5,552.5 1,259.6 1,472.6 635.6 5.0 –2,592.9 6,332.4
Liabilities (Dec. 31) 3,462.9 43.0 627.8 436.3 1.5 –436.2 4,135.3
Net assets (Dec. 31) 2,089.6 1,216.6 844.8 199.3 3.5 –2,156.7 2,197.1
Noncurrent assets 3 2,344.1 232.6 1,223.3 342.8 2.9 –40.1 4,105.6
Research and development expenses 161.0 – 9.8 3.5 – –0.5 173.8
Employees (Dec. 31) 12,322 363 1,499 1,783 42 – 16,009
2012*
€ million Germany Rest of Europe
The Americas
Asia Other regions
Con-solidation
Group
External sales by customer location 686.0 1,090.7 834.2 1,862.0 162.0 – 4,634.9
External sales by Group company location 3,972.9 156.8 817.6 729.7 6.8 –1,048.9 4,634.9
Additions to property, plant and equipment 1 301.1 4.0 604.4 67.6 0.2 – 977.3
Additions to financial assets 2 0.3 117.8 – – – – 118.1
Asset additions 301.4 121.8 604.4 67.6 0.2 – 1,095.4
Assets (Dec. 31) 6,365.1 1,271.2 1,851.1 690.3 5.6 –3,690.5 6,492.8
Liabilities (Dec. 31) 3,908.1 140.3 592.1 530.3 2.9 –802.2 4,371.5
Net assets (Dec. 31) 2,457.0 1,130.9 1,259.0 160.0 2.7 –2,888.3 2,121.3
Noncurrent assets 3 2,659.4 352.2 1,019.6 360.3 3.4 –17.3 4,377.6
Research and development expenses 158.0 – 10.7 6.4 – –1.4 173.7
Employees (Dec. 31) 12,635 361 1,531 1,725 40 – 16,292
1 Intangible assets; property, plant and equipment; investment property2 Investments in joint ventures and associates, financial assets3 Noncurrent assets as per IFRS 8 (excluding financial instruments, deferred tax assets and benefits after termination of the employment relationship)
The segment information by region is an integral part of the Notes to the Consolidated Financial Statements. For explanations of the key indicators, see Note 22.
* Adjusted for the effects of the adoption of IAS 19 (revised); see Changes in Accounting and Valuation Methods in the Notes section.
T 5.10
T 5.11

191Wacker Chemie AGAnnual Report 2013
Consolidated Financial Statements
Notes of the WACKER Group
Accounting Principles and MethodsThe WACKER Group (WACKER) is a globally active company with state-of-the-art specialty chemical products. Its business divisions operate in the fields of silicone and polymer chemistry, specialty and fine chemistry, polysilicon production and semiconductor technol-ogies. The activities of the individual segments are explained in the management report.
The Group’s parent company, Wacker Chemie AG, is a listed company with headquarters in Munich, Germany. Its address is: Wacker Chemie AG, Hanns-Seidel-Platz 4, 81737 München, Germany.
Wacker Chemie AG is registered under the number HRB 159705 at the Munich District Court. The consolidated financial statements, the combined management report and any other documents subject to disclosure requirements are submitted to the publisher of the online German Federal Bulletin. The consolidated financial statements and the combined manage-ment report for the WACKER Group and Wacker Chemie AG can also be viewed on the WACKER website. www.wacker.com /annualreport
The declaration concerning the German Corporate Governance Code required by Section 161 of the German Stock Corporation Act (AktG) has been submitted and made accessible to the shareholders on WACKER’s website. www.wacker.com /corporategovernance
Wacker Chemie AG’s consolidated financial statements have been prepared in accordance with the International Financial Reporting Standards ( IFRS), as applicable in the European Union (EU), and the supplementary rules in Section 315 a (1) of the German Commercial Code (HGB). All of the IFRS published by the International Accounting Standards Board ( IASB) and valid for the fiscal year in question were adopted by the European Commission for appli-cation in the EU. The interpretations of the International Financial Reporting Interpretations Committee ( IFRIC) that are applicable to the current fiscal year have also been applied.
The fiscal year corresponds to the calendar year. Assets and liabilities are reported in the statement of financial position in line with their maturities. The Group classifies assets and liabilities as current if it expects to realize or settle them within 12 months of the reporting date. The statement of income is prepared using the cost of sales method. To improve the clarity of presentation, various items in the statement of income and the statement of financial position have been combined. These items are shown and explained separately in the Notes.
The Group’s functional currency is the euro. All amounts are shown in millions of euros (€ million) unless otherwise stated. There may be slight deviations in the additions as all amounts have been rounded up to the nearest whole number after the decimal point.
Material events occurring after the balance sheet date are described in detail in the Supple-mentary Report, which forms part of the Group management report. The Executive Board of Wacker Chemie AG authorized the consolidated financial statements on March 5, 2014. They will be submitted to the Supervisory Board for its meeting on March 13, 2014.
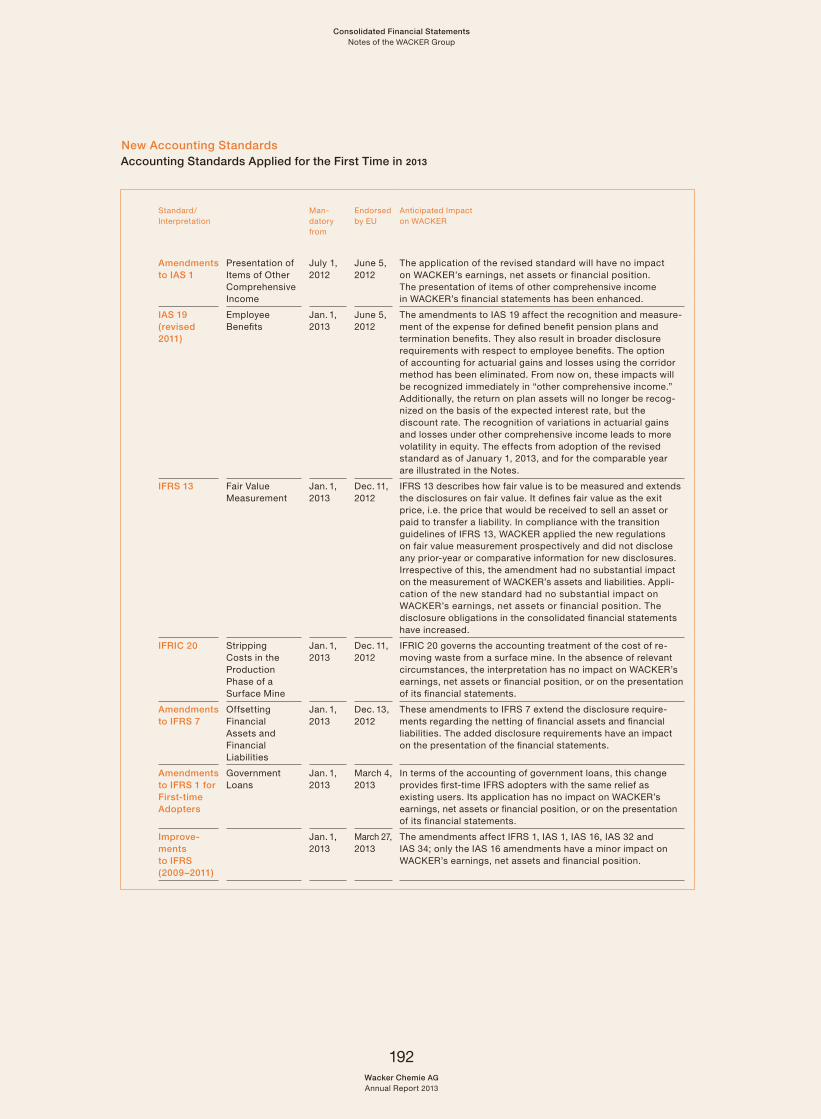
192Wacker Chemie AGAnnual Report 2013
Consolidated Financial StatementsNotes of the WACKER Group
New Accounting StandardsAccounting Standards Applied for the First Time in 2013
Standard / Interpretation
Man-datory from
Endorsed by EU
Anticipated Impact on WACKER
Amendments to IAS 1
Presentation of Items of Other Comprehensive Income
July 1, 2012
June 5, 2012
The application of the revised standard will have no impact on WACKER’s earnings, net assets or financial position. The presentation of items of other comprehensive income in WACKER’s financial statements has been enhanced.
IAS 19 (revised 2011)
Employee Benefits
Jan. 1, 2013
June 5, 2012
The amendments to IAS 19 affect the recognition and measure-ment of the expense for defined benefit pension plans and termination benefits. They also result in broader disclosure requirements with respect to employee benefits. The option of accounting for actuarial gains and losses using the corridor method has been eliminated. From now on, these impacts will be recognized immediately in “other comprehensive income.” Additionally, the return on plan assets will no longer be recog-nized on the basis of the expected interest rate, but the discount rate. The recognition of variations in actuarial gains and losses under other comprehensive income leads to more volatility in equity. The effects from adoption of the revised standard as of January 1, 2013, and for the comparable year are illustrated in the Notes.
IFRS 13
Fair Value Measurement
Jan. 1, 2013
Dec. 11, 2012
IFRS 13 describes how fair value is to be measured and extends the disclosures on fair value. It defines fair value as the exit price, i.e. the price that would be received to sell an asset or paid to transfer a liability. In compliance with the transition guidelines of IFRS 13, WACKER applied the new regulations on fair value measurement prospectively and did not disclose any prior-year or comparative information for new disclosures. Irrespective of this, the amendment had no substantial impact on the measurement of WACKER’s assets and liabilities. Appli-cation of the new standard had no substantial impact on WACKER’s earnings, net assets or financial position. The disclosure obligations in the consolidated financial statements have increased.
IFRIC 20
Stripping Costs in the Production Phase of a Surface Mine
Jan. 1, 2013
Dec. 11, 2012
IFRIC 20 governs the accounting treatment of the cost of re-moving waste from a surface mine. In the absence of relevant circumstances, the interpretation has no impact on WACKER’s earnings, net assets or financial position, or on the presentation of its financial statements.
Amendments to IFRS 7
Offsetting Financial Assets and Financial Liabilities
Jan. 1, 2013
Dec. 13, 2012
These amendments to IFRS 7 extend the disclosure require-ments regarding the netting of financial assets and financial liabilities. The added disclosure requirements have an impact on the presentation of the financial statements.
Amendments to IFRS 1 for Firsttime Adopters
Government Loans
Jan. 1, 2013
March 4, 2013
In terms of the accounting of government loans, this change provides first-time IFRS adopters with the same relief as existing users. Its application has no impact on WACKER’s earnings, net assets or financial position, or on the presentation of its financial statements.
Improvements to IFRS (2009–2011)
Jan. 1, 2013
March 27, 2013
The amendments affect IFRS 1, IAS 1, IAS 16, IAS 32 and IAS 34; only the IAS 16 amendments have a minor impact on WACKER’s earnings, net assets and financial position.

193Wacker Chemie AGAnnual Report 2013
Consolidated Financial StatementsNotes of the WACKER Group
Standard / Interpretation
Man-datory from
Endorsed by EU
Anticipated Impact on WACKER
Amendments to IFRS 1 for Firsttime Adopters
Severe Hyper-Inflation and Removal of Fixed Dates
Jan. 1, 2013
Dec. 11, 2012
The amendment replaces the existing references to the date of January 1, 2004, with a reference to the timing of the transition to IFRS. This amendment also includes rules for those cases in which hyperinflation makes it impossible for an entity to comply with all IFRS stipulations. Its application has no impact on WACKER’s earnings, net assets or financial position, or on the presentation of its financial statements.
Amendments to IAS 12
Deferred Tax: Recovery of Underlying Assets
Jan. 1, 2013
Dec. 11, 2012
The amendment contains a partial clarification of the treatment of temporary taxable differences from IAS 40’s fair value model. In the case of investment property, it is often difficult to assess whether existing differences are recovered as part of continuing use or in the wake of a sale. The amendment therefore generally makes it necessary to presume recovery due to a sale. Its appli cation has no impact on WACKER’s earnings, net assets or financial position, or on the presentation of its financial state-ments. WACKER measures its investment property exclusively at amortized cost.
Accounting Standards / Interpretations Not Applied PrematurelyThe International Accounting Standards Board ( IASB) has published the following standards, interpretations, and changes to existing standards of which the application is not yet man-datory and which WACKER is not applying earlier than required. WACKER continuously evaluates the new standards to determine their impact on the consolidated financial statements.

194Wacker Chemie AGAnnual Report 2013
Consolidated Financial StatementsNotes of the WACKER Group
Standards, Interpretations, and Changes to Existing Standards Already Endorsed by the EU
Standard / Interpretation
Man-datory from
Endorsed by EU
Anticipated Impact on WACKER
IFRS 10
Consolidated Financial Statements
Jan. 1, 2014
Dec. 11, 2012
IFRS 10 changes the definition of “control” so that the same criteria are applied to all companies in determining control. The standard replaces the consolidation guide-lines in the previous IAS 27 and SIC 12. The new rules may lead to major changes in the scope of consolidation compared with the previous determination of the Group pursuant to IAS 27. At this point in time, WACKER is of the opinion that application of the revised standard will have no influence on the current determination of the scope of consolidation.
IFRS 11
Joint Arrangements
Jan. 1, 2014
Dec. 11, 2012
IFRS 11 governs the accounting of arrangements where a company exercises joint control over a joint venture or a joint operation. The standard replaces IAS 31. In the future, joint ventures will be accounted for using the equity method only. The option of proportionate consolidation has been abolished. This has no impact on WACKER’s earnings, net assets or financial position because WACKER already accounts for joint ventures using the equity method. WACKER has examined the other effects of IFRS 11, also with respect to joint operations. The analysis did not result in any reassessment of the joint ventures accounted for up to now using the equity method.
IFRS 12
Disclosure of Interests in Other Entities
Jan. 1, 2014
Dec. 11, 2012
IFRS 12 regulates the disclosures in the consolidated financial statements that enable readers of the financial statements to assess the nature, risk and financial effects of the entity’s involvement in subsidiaries, associates, joint arrangements and unconsolidated structured entities. Application of the revised standard will lead to a sub-stantial broadening of the disclosures in WACKER’s consolidated financial statements.
Amendments to IAS 27
Separate Financial Statements
Jan. 1, 2014
Dec. 11, 2012
In the future, IAS 27 will deal only with separate financial statements. The existing guidelines for separate financial statements remain unchanged. Application of the revised standard will have no impact on WACKER’s earnings, net assets or financial position, or on the presentation of its financial statements.
Amendments to IAS 28
Investments in Associates and Joint Ventures
Jan. 1, 2014
Dec. 11, 2012
IAS 28 now also governs the accounting of joint ventures using the equity method. Application of the revised standard will have no substantial impact on WACKER’s earnings, net assets or financial position, or on the presentation of its financial statements.
Amendments to IFRS 10, IFRS 11 and IFRS 12
Transition Guidelines
Jan. 1, 2014
April 4, 2013
The purpose of the amendments is to clarify the transition guidelines in IFRS 10 and facilitate the transition to IFRS 10, IFRS 11 and IFRS 12. Application of the changes will have no impact on WACKER’s earnings, net assets or financial position, or on the presentation of its financial statements.
Amendments to IFRS 10, IFRS 12 and IAS 27
Investment Entity
Jan. 1, 2014
Nov. 20, 2013
The changes focus primarily on redefinition of the term “investment entity.” In addition, investment entities are exempted from the obligation to consolidate majority-controlled subsidiaries in their consolidated financial state ments. The amendments have no impact on WACKER’s earnings, net assets or financial position, or on the presentation of its financial statements.

195Wacker Chemie AGAnnual Report 2013
Consolidated Financial StatementsNotes of the WACKER Group
Standard / Interpretation
Man-datory from
Endorsed by EU
Anticipated Impact on WACKER
Amendments to IAS 32
Offsetting Financial Assets and Financial Liabilities
Jan. 1, 2014
Dec. 13, 2012
This amendment to IAS 32 clarifies the requirements for offsetting of financial instruments. Application of the revised standard will have no substantial impact on WACKER’s earnings, net assets or financial position.
Amendments to IAS 36
Impairment of Assets – Disclosure of the Recoverable Amount of Non-Financial Assets
Jan. 1, 2014
Dec. 19, 2013
IFRS 13 “Fair Value Measurement” introduced a new rule amending IAS 36 “Impairment of Assets.” It requires disclosure of the recoverable amount of every cash-generating unit (or group of cash-generating units) for which a substantial amount of goodwill or substantial intangible assets of in-definite useful life have been recognized. The amendments in connection with IAS 36 have no impact on WACKER’s earnings, net assets or financial position, or on the pre-sentation of its financial statements. WACKER does not currently recognize any goodwill or any intangible assets of indefinite useful life.
Amendments to IAS 39
Novation of Derivatives and Continuation of Hedge Accounting
Jan. 1, 2014
Dec. 19, 2013
Due to the EU regulation on OTC derivatives, central counter-parties and trade repositories (also known as EMIR), clearing via a central counterparty is planned for standardized OTC derivatives. As per IAS 39 in its current version, the clearing obligation and the related novation to a central counterparty lead to termination of the hedging relationship under hedge accounting and thus to ineffectiveness compared to the prior hedging relationship. The amendment states that, under certain conditions, clearing via a central counterparty shall not lead to termination of the hedging relationship, and that the hedge shall continue to qualify for hedge accounting in accordance with IAS 39. The amendments in connection with IAS 39 have no impact on WACKER’s earnings, net assets or financial position, or on the presentation of its financial statements since WACKER does not have any OTC derivatives that are subject to the clearing obligation.
Standards, Interpretations and Changes to Existing Standards Not Yet Endorsed by the EU
Standard / Interpretation
Publica-tion by IASB
Effective Date
Endorsed by EU
Anticipated Impact on WACKER
IFRS 9
Financial Instruments
Nov. 12, 2009
–
Post-poned
In the future, financial assets will be measured either at amortized cost or at fair value, depending on the business model of the company in question. At the moment, WACKER cannot conclusively assess what impacts the first-time application of this standard will have, should it be endorsed by the EU in its current form.
Amendments to IFRS 9 and IFRS 7
Mandatory Effective Date and Transition Disclosures
Dec. 16, 2011
–
Post-poned
The amendments postpone the effective date of IFRS 9 and provide for additional disclosure requirements. As WACKER cannot yet assess what impact the first-time application of the standard will have, it is also not yet possible to evaluate the potential impact of these amendments to IFRS 9 and IFRS 7.

196Wacker Chemie AGAnnual Report 2013
Consolidated Financial StatementsNotes of the WACKER Group
Standard / Interpretation
Publica-tion by IASB
Effective Date
Endorsed by EU
Anticipated Impact on WACKER
IFRS 9 – Hedge Accounting and Amendments to IFRS 9, IFRS 7 and IAS 39
Nov. 19, 2013
–
Post-poned
The amendments concern clarifications of the existing regulations as well as new regulations for the hedge accounting model. The goal of the new hedge accounting model under IFRS 9 is to better reflect risk management activities in the financial statements. Cash flow hedge accounting, fair value hedge accounting and hedging of a net invest-ment in a foreign operation remain admissible hedging relationships. In each case, the number of qualifying underlying and hedging transactions was extended. As WACKER cannot yet assess what impact the first-time application of the standard will have, it is also not yet possible to evaluate the potential impact of these amendments to IFRS 9, IFRS 7 and IAS 39.
Amendments to IAS 19
Defined Benefit Plans: Employee Contributions
Nov. 21, 2013
July 1, 2014
Expec-ted in Q3 2014
The amendments clarify those regulations that concern the allocation of contributions by employees or third parties to service periods in cases where the contributions are linked to the same period of service. In addition, relief is granted in cases where the contributions are independent of the number of years of service. The amendments have no impact on WACKER’s earnings, net assets or financial position, or on the presentation of its financial statements.
IFRIC 21
Levies
May 20, 2013
Jan. 1, 2014
Expec-ted in Q2 2014
IFRIC 21 “Levies” contains rules for the recognition of obligations to pay public levies that are not defined as taxes within the meaning of IAS 12 “Income Taxes.” Application of this interpretation may result in an obligation to pay a levy being recognized in the accounts at a different point in time than previously, especially if the obligation to pay arises only if certain circumstances occur at a certain time. The amendments in connection with IFRIC 21 are unlikely to have any impact on WACKER’s earnings, net assets or financial position, or on the presentation of its financial statements.
Improvements to IFRS (2010–2012)
Dec. 12, 2013
July 1, 2014
Expec-ted in Q3 2014
The amendments affect IFRS 2, IFRS 3, IFRS 8, IFRS 13, IAS 16, IAS 24 and IAS 38. Their appli-cation has no substantial impact on WACKER’s earnings, net assets or financial position.
Improvements to IFRS (20112013)
Dec. 12, 2013
July 1, 2014
Expec-ted in Q3 2014
The amendments affect IFRS 1, IFRS 3, IFRS 13 and IAS 40. Their application has no substantial impact on WACKER’s earnings, net assets or financial position.
Scope of ConsolidationThe consolidated financial statements include the financial statements of Wacker Chemie AG and its subsidiaries. Subsidiaries are defined as companies in which Wacker Chemie AG directly or indirectly holds a voting majority or has, in any other way, the power to govern the financial and business policies of an entity in order to benefit from its activities. In assessing control, we take into account potential voting rights that are currently exercisable or con ver-tible. The financial statements of subsidiaries are included in the consolidated financial statements from the date that control commences until the date that control ceases.

197Wacker Chemie AGAnnual Report 2013
Consolidated Financial StatementsNotes of the WACKER Group
Special-purpose entities (SPES) are also consolidated if the economic substance of the relationship indicates the existence of control.
Joint ventures and associated companies are defined as companies in which Wacker Chemie AG exercises significant influence. This normally means that it holds 20–50 percent of the voting rights. These companies are included in the consolidated financial statements using the equity method. If joint ventures and associated companies have their own subsidiaries, these are not included in the table below.
Companies in which Wacker Chemie AG has a shareholding of less than 20 percent or does not exercise significant influence are shown as other investments under noncurrent financial assets.
Number Germany Rest of Europe
The Americas
Asia Other regions
Total
Fully consolidated subsidiaries ( incl. parent company)Jan. 1, 2013 14 13 5 16 2 50
Dec. 31, 2013 14 13 5 16 2 50
Companies consolidated using the equity methodJan. 1, 2013 – – – 4 – 4
Dec. 31, 2013 – – – 4 – 4
Nonconsolidated affiliated companiesJan. 1, 2013 1 – – – – 1
Dec. 31, 2013 1 – – – – 1
TotalJan. 1, 2013 15 13 5 20 2 55
Dec. 31, 2013 15 13 5 20 2 55
Specialpurpose entitiesJan. 1, 2013 1 – – – – 1
Dec. 31, 2013 1 – – – – 1
There were no acquisitions in 2013. The scope of consolidation has not changed compared with December 31, 2012.
A total of 14 domestic and 40 foreign companies were included in the consolidated financial statements.
As it had no substantial impact on the Group’s earnings, net assets or financial position, the W.E.L.T. Reisebüro GmbH subsidiary was not consolidated. In 2012, both its sales and its total assets were below € 0.5 million. This subsidiary, in which WACKER holds a 51-percent stake, is valued at cost under noncurrent financial assets.
Apart from directly or indirectly controlled companies, WACKER consolidates one special-purpose entity where its influence amounts to control. This is a special fund (trust) into which Wacker Chemie AG has paid investment funds. This trust was established exclusively for WACKER, and all shares of the fund are held by WACKER. Because of the special stipula-tions of the investment fund, the contribution is subject to SIC 12.10.

198Wacker Chemie AGAnnual Report 2013
Consolidated Financial StatementsNotes of the WACKER Group
Consolidation MethodsThe consolidated financial statements are based on the separate financial statements of Wacker Chemie AG and its consolidated subsidiaries and special-purpose entities. All of these companies have their balance sheet date on December 31.
All of the significant financial statements included in the consolidated financial statements were audited by independent auditors.
First-time consolidation is carried out in accordance with the purchase method, by setting off the acquisition cost against the Group’s share in the equity of the consolidated sub-sidiaries at the time of their acquisition or first inclusion in the consolidated financial statements. The consolidated subsidiaries’ equity is calculated on the basis of all identifiable assets, liabilities and contingencies, while all items in the statement of financial position are measured at fair value. Any positive difference between the subsidiary’s acquisition cost and the pro rata equity ascertained in this way is capitalized as goodwill and subjected to an annual impairment test. Any negative difference is recognized directly as income. The capital consolidation is carried out by setting off the carrying amounts of the investments against the proportional equity of the subsidiaries.
Investments accounted for using the equity method are initially measured at cost when the acquisition is made. If the cost exceeds the pro rata share of equity, the difference (goodwill ) is included in the carrying amount of the investment. The carrying amount has to be tested for possible impairment losses as of the balance sheet date. If the cost is lower than the share of equity at the time of acquisition, this difference is included in the carrying amount and recorded in the statement of income as income from investments in joint ventures and associates. The carrying amounts for these companies are increased or decreased annually to reflect their pro rata earnings, dividend payouts or other changes in equity. If there is any indication that the value of the investment has been permanently reduced, an impairment is recognized through profit or loss. Long-term interests that, in substance, form part of the investor’s net investment in the associate are included in the statement of changes in equity.
Interim results, sales, expenses, income, receivables and liabilities between the consoli dated companies, as well as pro rata profits and losses resulting from transactions with associated companies, are eliminated. For those consolidation entries which affect income, the income tax effect is taken into account and deferred taxes are included.
AcquisitionsAcquired businesses are accounted for using the purchase method, which requires that the assets acquired and liabilities assumed be recorded at their respective fair values applicable on the date that WACKER gains control.
The determination of the fair values requires certain estimates and assumptions especially con cerning the acquired intangible assets, property, plant and equipment, as well as the liabilities assumed and the useful lives of the acquired intangible assets, property, plant and equipment.
Measurement is based to a large extent on anticipated cash flows. If actual cash flows vary from those used in calculating fair values, this may affect future net income.
For significant acquisitions, the purchase price allocation is carried out with assistance from independent third-party valuation specialists. The valuations are based on information available at the acquisition date.

199Wacker Chemie AGAnnual Report 2013
Consolidated Financial StatementsNotes of the WACKER Group
Acquisitions and Majority Takeovers after the Balance Sheet DateOn January 2, 2014, Wacker Biotech GmbH, a WACKER subsidiary, acquired 100 percent of the shares in Halle-based Scil Proteins Production GmbH by means of a share deal. The provisional purchase price was paid on the same date. A provisional lump-sum payment in the high single-digit million range was agreed, as were potential milestone payments in the low million range. These milestone payments essentially depend on the achievement of various production, technology and marketing targets. The acquisition is an opportunity for WACKER BIOSOLUTIONS to expand its know-how and production capacities in the field of therapeutic proteins. Scil Proteins Production has expertise in protein refolding. Refolding is a key technology for achieving the desired active properties in proteins that cannot be produced in an active form in bacterial cells. This know-how represents a significant addition to WACKER BIOSOLUTIONS’ process chain. WACKER will take over the company’s production facilities as well as its patent portfolio and customer base. The purchase price mainly applies to the company’s noncurrent assets.
The purchase price allocation for Scil Proteins Production GmbH has not yet been completed as the underlying financial data is still being compiled and analyzed.
On January 24, 2014, WACKER signed a contract to take over the majority of shares in the joint venture Siltronic Samsung Wafer Pte. Ltd. in Singapore, which had previously been jointly managed by Siltronic and Samsung Electronics Co. Ltd. on a 50:50 basis. WACKER has now assumed control. Siltronic sub scribed new shares as part of a capital increase for a total of SG $ 150 million (equivalent to around € 85 million) and will hold a 78-percent stake in the company in the future. In addition, Siltronic and Samsung will make additional payments amounting to about € 120 million, which will help repay the bank loans of around € 200 million taken out for project financing. The capital increase enables WACKER to secure a majority in one of the most efficient production sites for 300 mm wafers in Asia. Since Siltronic’s facilities for producing 200 mm wafers in Singapore are in the immediate vicinity, there will be additional benefits from synergies and cost advantages. The financial closing of the contract was definitively concluded on February 28, 2014.
In 2013, the joint venture was accounted for using the equity method. The purchase in 2014 will be accounted for in accordance with the rules for step acquisitions provided for in IFRS 3. The valuations and purchase price allocation have not yet been completed as the underlying financial data is still being compiled and analyzed.
Foreign Currency TranslationIn the Group companies’ separate financial statements, all of the receivables and liabilities in foreign currencies are translated at the rate prevailing on the balance sheet date, regard-less of whether or not they have been hedged. Forward contracts which, from an economic point of view, are used for hedging are reported at fair value. The resulting translation differences are recognized in profit or loss or, if cash flow hedges are in place, recognized directly in equity under other equity items.
In Q1 2013, WACKER defined a long-term loan denominated in a foreign currency as a net investment in a foreign operation in accordance with IAS 21. The currency translation differences in connection with this loan are recognized in other result under other equity items and presented separately.

200Wacker Chemie AGAnnual Report 2013
Consolidated Financial StatementsNotes of the WACKER Group
The financial statements of consolidated companies that are prepared in foreign currencies are translated on the basis of the functional currency principle using the modified reporting date rate method, in which balances are translated from the functional currency to the reporting currency using the average rates of exchange prevailing on the balance sheet date, while income statement amounts are translated using the period’s average exchange rates. As the Group’s subsidiaries conduct their business along autonomous lines financially, commercially and organizationally, their functional currencies are basically identical to the respective company’s local currency. Any net gains or losses arising from the translation of equity are recognized directly in equity in the other equity items. Translation differences resulting from divergent exchange rates in the statement of income are likewise included there. If any Group companies are removed from the scope of consolidation, any translation difference is reclassified from equity to profit or loss.
The exchange rates between the most important currencies reported in these financial statements and the euro were as follows:
ISO Code Exchange rate as of Average exchange rate
Dec. 31, 2013 Dec. 31, 2012 2013 2012
US dollar USD 1.38 1.32 1.36 1.29
Japanese yen JPY 144.72 113.51 136.61 102.50
Singapore dollar SGD 1.74 1.61 1.70 1.61
Chinese renminbi CNY 8.34 8.22 8.29 8.11
Estimates and Assumptions Used in Preparing the Consolidated Financial StatementsThe preparation of the consolidated financial statements in compliance with IFRS necessitates assumptions and estimates affecting the amounts and the reporting of the recognized assets and debts, income and expenses, and contingencies. These assumptions and estimates comply with the conditions and appraisals prevailing on the balance sheet date. In this regard, they also impact the amount of income and expenses reported on for the fiscal years in question. The assumptions on which the estimates are based relate primarily to the uniform determination of useful lives throughout the Group, the ascertain-ment of fair values of financial instruments, the recognition and measurement of provisions, the realizability of future tax benefits, and assumptions made in connection with impairment tests and purchase price allocations.
In individual cases, the actual values may differ from the assumptions and estimates that were made. Changes in value are recognized as soon as they become apparent and affect the net results for the period when the change occurred and, if applicable, in future reporting periods.
Intangible Assets and Property, Plant and Equipment / Investments in Associates Accounted for Using the Equity Method
The expected useful life of intangible assets and of property, plant and equipment, together with their amortization / depreciation schedules, are based on past experience, plans and estimates. This includes estimates of the period and allocation of future cash inflows derived from the investments made and from future technical advancements. The carrying amount of intangible assets and property, plant and equipment was € 3.81 billion (2012: € 3.95 billion). An amount of € 18.9 million (2012: € 41.0 million) was recognized in the statement of financial position for investments in associates accounted for using the equity method.

201Wacker Chemie AGAnnual Report 2013
Consolidated Financial StatementsNotes of the WACKER Group
Impairment tests are performed for assets if specific indicators point toward a possible impairment loss or reversal of an impairment loss. In the case of a possible impairment, an estimate must be made of the recoverable amount of the affected asset that corresponds to the higher value of the fair value less costs to sell or the value in use. To ascertain the value in use, the discounted future cash flows of the affected asset must be determined. The estimate of the discounted future cash flows contains significant assumptions such as, in particular, those regarding future selling prices and sales volumes, costs, and discount rates. Although WACKER is assuming that the estimates of the relevant expected useful lives and of discounted future cash flows, as well as the assumptions regarding the general eco-nomic conditions and the development of the economic sectors are reasonable, a change in the assumptions or circumstances might necessitate a change in the analysis. This could result in additional impairments or reversals of impairment losses in the future. See Note 4
ProvisionsSignificant risks inherent in environmental protection provisions and in provisions stemming from claims for damages and onerous contracts are possible changes in future cost / benefit estimates, changes in the likelihood of their utilization, and enhanced statutory provisions concerning the elimination and prevention of environmental damage. The carrying amount of provisions for environmental protection was € 53.9 million (2012: € 52.4 million) and the carrying amount for sales / purchasing provisions amounted to € 24.9 million (2012: € 44.7 million). See Note 14
The accounting of pensions and similar obligations is in accordance with actuarial valuations. These valuations are based on statistical and other factors in order to anticipate future events. The factors include the discount rate, expected salary and pension increases, the mortality rate and rate increases for preventive healthcare. If market and economic con-ditions change, these assumptions could vary considerably from actual developments, consequently leading to major changes in pension and similar obligations, as well as the associated future expenses. The carrying amount of the provision for pensions totaled € 1.08 billion (2012: € 1.24 billion). See Note 13
The pension-obligation amount is valued by discounting the WACKER-specific, expected future cash flows. The discount rate is derived from the yield curve of high-grade, fixed-interest corporate bonds with maturities matching the pension obligations, as calculated at the balance sheet date. The bonds are all denominated in the same currency as their under-lying pension obligations and have a rating of at least AA from one of the three major rating agencies. This is based on information from Bloomberg as of the closing date and on a maturity that nearly matches the maturity of the pension obligation.
Deferred TaxesAt the end of each reporting period, the Group assesses whether the probability of future tax benefits being realized is sufficient to recognize deferred taxes. Among other things, this requires that management evaluate the tax benefits resulting from currently available tax strategies and future taxable income, as well as taking additional positive and negative factors into account. The carrying amount of deferred tax assets recognized in the state-ment of financial position amounted to € 165.7 million (2012: € 182.0 million).

202Wacker Chemie AGAnnual Report 2013
Consolidated Financial StatementsNotes of the WACKER Group
Accounting and Valuation MethodsThe financial statements of Wacker Chemie AG and its German and international subsidiaries are prepared in accordance with uniform accounting an valuation methods.
The accounting methods correspond to those used for the last consolidated financial state-ments as of the end of the previous fiscal year. They have been supplemented by new accounting standards to be applied for the first time in 2013. There may be limits to compa-rability in the case of significant acquisitions of fully consolidated companies. If this is the case, this topic is dealt with in the explanation of the scope of consolidation. Where prior-year figures have been adjusted, explanations are provided in the relevant Notes and the figures are restated in the section entitled “Changes in Accounting and Valuation Methods.”
The Group’s consolidated financial statements are based on acquisition and production costs (historical costs), with the exception of the items reflected at fair value, such as available- for-sale financial assets, derivatives, and plan assets within the scope of pension obligations.
Certain financial instruments are recognized at fair value, while other assets and liabilities are usually disclosed at fair value in the notes to the financial statements. The fair value of an asset or liability is the price that would be received to sell an asset or paid to transfer a liability in an orderly transaction between market participants at the measurement date.
Calculation of the fair value of financial instruments may require making quite involved estima tes, the nature of which is determined by the extent to which non-observable input parameters are taken into account. When calculating fair value, WACKER strives to include as many observable input parameters as possible and to keep the use of non-observable factors to a minimum. Various factors determine whether the value of an input parameter is observable or not, including the type of financial instrument in question, the existence of a market for the instrument, specific features of the transaction, liquidity and general market conditions. If the fair value cannot be reliably determined, the carrying amount is taken as an approximate value to determine fair value.
In accordance with IFRS 13, financial assets and liabilities that are measured or recognized at fair value in the consolidated financial statements must be measured and classified according to the fair value hierarchy. This hierarchy consists of three levels, to which the input parameters are assigned in accordance with the extent to which they are observable during the corresponding measurement process.
Sales encompass the fair value of the counterperformance or claim received for the goods and services that were sold within the scope of ordinary activities. These are reported without VAT and other taxes incurred in connection with sales and without discounts and price reductions. Sales revenues are recognized when the goods and services owed have been delivered and the main opportunities and risks of ownership have passed to the purchaser. Sales from services are recognized once services are rendered. Sales are not reported if there are risks attached to the receipt of the consideration. Provisions are recognized for risks from returns of finished goods and merchandise, warranties and other complaints using the specific identification method. Information on the development of sales by division and region is provided in the section on segment reporting.
WACKER does not conduct any business that requires using the percentage-of-completion method for recognizing sales of long-term production contracts.

203Wacker Chemie AGAnnual Report 2013
Consolidated Financial StatementsNotes of the WACKER Group
Cost of goods sold shows the costs of the products, merchandise and services sold. In addition to directly attributable costs, such as material costs, personnel expenses and energy costs, it includes overheads including depreciation and inventory writedowns. This item also includes the cost of outward freight.
Selling expenses include costs incurred by the sales organization and the cost of advertising, market research, and application support on customers’ premises. This item also includes commission expenses.
Research and development expenses include costs incurred in the development of products and processes. Research costs in the narrow sense are recognized as expenses when they are incurred, and are not capitalized. Development costs are capitalized only if all the prescribed recognition criteria have been met, the research phase can be separated clearly from the development phase, and the costs incurred can be allocated to the individ-ual project phases without any overlaps. Additionally, there must be sufficient certainty that future cash inflows will take place.
General administrative expenses include the pro rata payroll and material costs of corpo-rate control functions, human resources, accounting and information technology, unless they have been charged as an internal service to other cost centers and thus, in certain circumstances, to other functional areas.
Operating expenses are reported as expenses when the service is utilized, i.e. when the expense is incurred. Interest income is valued pro rata temporis, taking account of the out-standing loan amount and the effective interest rate to be applied. Dividend income from financial investments is reported when the legal claim to payment arises.
Intangible assets acquired against payment are measured at cost and, if their useful lives can be determined, are amortized on a straight-line basis. The useful life is taken to be between three and 15 years unless otherwise indicated, e.g. by the life of a patent. The useful life is reviewed annually and, if necessary, revised to correspond to new expectations. Amorti zation of intangible assets (apart from goodwill ) is allocated to the functional areas that use the assets. Intangible assets with indefinite useful lives undergo an annual impair-ment test. At present, no intangible assets with indefinite useful lives have been capitalized.
Internally generated intangible assets are capitalized if it is probable that a future eco-nomic benefit can be associated with the use of the asset and the costs of the asset can be determined reliably. They are recognized at cost and amortized on a straight-line basis. Their stated useful lives correspond to those of the intangible assets acquired against payment. If development costs are capitalized, they consist of the costs directly attributable to the development process. Capitalized development costs are amortized over the useful life of the corresponding production facilities as from the start of production.
Goodwill is not amortized. Existing goodwill undergoes an annual impairment test. If the impairment test indicates a recoverable amount that is lower than the carrying amount, the goodwill is reduced to its recoverable amount and an impairment loss is recognized. Furthermore, the intrinsic value is examined when events or circumstances indicate possible impairment. Impairments of goodwill are presented under other operating expenses.

204Wacker Chemie AGAnnual Report 2013
Consolidated Financial StatementsNotes of the WACKER Group
Property, plant and equipment is capitalized at cost and depreciated on a straight-line basis over its expected economic life. The useful life is reviewed annually and, if necessary, revised to correspond to new expectations. In addition to the purchase price, acquisition costs include incidental acquisition costs as well as any costs incurred in the demolition, dismantling, and / or removal of the asset in question from its site and in the restoration of that site. Any reductions in the price of acquisition reduce the acquisition costs. Property, plant and equipment is not revalued on the basis of the provisions in IAS 16. Day-to-day maintenance and repair costs are expensed as incurred. Costs for replacing parts or carrying out major overhauls of property, plant and equipment are capitalized if future economic benefits are likely accrue to the Group and if the costs can be measured reliably.
Grants from third parties reduce acquisition and production costs. Unless otherwise indicated, these grants ( investment incentives) are provided by government bodies. Income grants that are not offset by future expenses are recognized as income. Until the funds have been received, grants are recognized as separate assets. For grants involving a legal claim, the claim to the grant is capitalized as an asset if the company has fulfilled, on the balance sheet date, the material requirements for provision of such a grant and has submitted, by the closing date, the necessary application form or is highly likely to do so by this date.
Financing costs that were incurred in connection with particular, qualifying assets and which can be attributed directly or indirectly to them are capitalized as part of acquisition or production costs until the assets are used for the first time. In addition, financing costs are not reported as part of acquisition or production costs. WACKER accounts for financing costs in accordance with IAS 23 (Borrowing Costs) if they concern major, long-term investments in production plants.
The cost of internally generated assets includes all costs directly attributable to the production process as well as an appropriate portion of the production-related overheads.
If property, plant and equipment is permanently shut down, sold or given up, the acqui-sition or production costs are derecognized, along with the corresponding accumulated depreciation. Any resulting gain or loss from the difference between the sale proceeds and the residual carrying amount is recognized under other operating income or expenses.
Property, plant and equipment also includes assets relating to leasing transactions. Items of property, plant and equipment financed by means of finance leases are recognized at fair value at their time of addition, unless the present values of the minimum lease payments are lower. The assets are depreciated on a straight-line basis over the expected useful life or the contractual term, if shorter. The obligations resulting from future lease payments are recognized under financial liabilities. The lease installments to be paid are split up into a redemption component and an interest component, in accordance with the effective interest method.

205Wacker Chemie AGAnnual Report 2013
Consolidated Financial StatementsNotes of the WACKER Group
Depreciation of property, plant and equipment is generally based on the following useful lives:
In years Useful life
Production buildings 10 –40
Other buildings 10 –30
Plant and machinery 6 –12
Motor vehicles 4 –10
Factory and office equipment 4 –12
If, having been measured in accordance with the above principles, the carrying amounts of intangible assets or items of property, plant and equipment that were amortized or depre-ciated are higher than their recoverable amounts as of the reporting date, corres ponding impairment losses are recognized as an expense.
The impairment is tested when relevant events or changes in circumstances indicate that it might no longer be possible to realize the net carrying amount. At the end of every reporting period, WACKER checks whether there are triggering events for recognizing (or reversing) impairments. An impairment loss is then recognized in the amount by which the carrying amount exceeds the recoverable amount. The recoverable amount is the higher amount of the fair value less costs to sell, and the value in use. The value in use results from the present value of the estimated future cash flows from the use of the asset. In order to assess this value, risk-adjusted pre-tax interest rates are used in a segment-specific manner. In order to determine the cash flow, assets are combined, if required, at the lowest level for which cash flows can be identified separately (cash-generating units). If the reasons for recognizing impairments no longer exist, impairment losses are reversed. The revised amount cannot exceed the carrying amount that would have been determined had no impairment loss been recognized. Impairments are reported under other operating expenses and reversals of impairment losses under other operating income.
Like property, plant and equipment, investment property is measured in accordance with the cost model. Investment property consists of land and buildings that are held to earn rental income or for capital appreciation, and not for use in captive production, for the supply of goods or services, for administrative purposes or for sale in the normal course of business. The fair value of this property is regularly measured through external property valuations.
Leasing transactions are classified either as finance leases or as operating leases. Assets used under an operating lease are not capitalized. Lease payments to be made are recognized in profit or loss in the period in which they fall due. A finance lease is a leasing arrangement in which essentially all of the risks and rewards inherent in the ownership of the property are transferred to the lessee. Assets used under a finance lease are recognized at the present value of the minimum lease payments. Leasing contracts can be embedded within other contracts. If there is a separation obligation for an embedded leasing arrangement in accordance with IFRS rules, the contractual components are separated, and recognized and measured according to the respective rules.
206Wacker Chemie AGAnnual Report 2013
Consolidated Financial StatementsNotes of the WACKER Group
Shares in nonconsolidated affiliated companies and investments are measured at cost, unless divergent market values are available. Changes in market values are posted to the statement of income upon realization through disposal or if the market value falls below the acquisition cost. Loans are measured at amortized cost, except for non-interest-bearing and low-interest loans, which are recognized at their present value.
Investments in joint ventures and associates are accounted for using the equity method, with the carrying amount generally reflecting the Group’s pro rata share of equity. Pro rata net results are posted to the consolidated income statement, and the carrying amount is increased or decreased accordingly. Any changes in equity recognized directly in the investee’s equity are also recognized directly in equity in the consolidated financial statements. Dividends paid by joint ventures and associates reduce their equity and, there-fore, reduce the carrying amount without affecting profit. If a joint venture or associate faces losses that have exhausted its equity, the carrying amount of the investment is written off in full in the consolidated statement of financial position. Further losses are taken into account only if there are noncurrent unsecured receivables against the associated company or the Group has entered into additional obligations or made payments for the associated company. The carrying amount is not increased until the loss carryforward has been set off and the equity is positive again.
Additionally, an impairment test is carried out in the presence of corresponding indications and, where necessary, an impairment is recognized. The recoverable amount is determined in accordance with IAS 36 regulations. Impairment losses are reported in the income from investments in joint ventures and associates.
A financial instrument is a contract that gives rise to a financial asset at one company and a financial liability or equity instrument at another company. Financial instruments are rec-ognized in the consolidated financial statements at the time that WACKER becomes a contracting party to the financial instrument.
However, in the case of purchases or sales on usual market terms (purchase or sale within the framework of a contract of which the terms require delivery of the asset within the time frame generally established by regulations or conventions prevailing on the market in ques-tion), the settlement date – i.e. the date on which the asset is delivered to or by WACKER – is relevant for initial recognition and derecognition. In general, financial assets and financial liabilities are not netted. A net amount is presented in the statement of financial position if, and only if, the entity currently has a right to net the recognized amounts and intends to settle on a net basis. Where financial instruments are combined, borrowed capital and equity components are separated and shown separately by the issuer.
Financial instruments are measured at fair value on initial recognition. The transaction costs directly attributable to the acquisition must be taken into account for all financial assets and liabilities not subsequently measured at fair value through profit or loss. The fair values recognized in the statement of financial position generally correspond to the market prices of the financial assets and liabilities. If these are not immediately available, they must be calculated using standard valuation models on the basis of current market parameters.

207Wacker Chemie AGAnnual Report 2013
Consolidated Financial StatementsNotes of the WACKER Group
The fair value of financial instruments is generally equal to the amount the Group would receive or pay if it exchanged or settled the financial instruments on the balance sheet date. If available, quoted market prices are used for financial instruments. Otherwise, fair values are calculated based on the market conditions prevailing on the reporting date – interest rates, exchange rates, commodity prices – using average rates. The fair value is calculated using financial-mathematical methods, e.g. via discounting future payment flows using the market interest rate or by applying recognized option-pricing models. The fair values of some derivatives are based on external valuations by our financial partners.
Financial assets at WACKER comprise, in particular, cash and cash equivalents, trade receiv ables, loans granted and other receivables, held-to-maturity financial investments, and primary and derivative financial assets held for trading. WACKER makes no use of the option to measure financial assets at fair value through profit or loss on initial recognition.
Financial liabilities must generally be settled using cash or another financial asset. This includes, in particular, the Group’s own bonds and other securitized liabilities, trade payables, liabilities to banks, finance lease payables, promissory notes (German Schuldscheine) and derivative financial liabilities. WACKER makes no use of its option to measure financial liabilities at fair value through profit or loss on initial recognition.
The manner in which financial assets and liabilities are subsequently measured depends on whether a financial instrument is held for trading or until it matures, whether such a financial instrument is available for sale, or whether the financial assets concerned are loans and receivables granted by the company.
Financial instruments held for trading are measured at fair value through profit or loss. This category also includes all derivative financial instruments that do not involve hedge accounting.
If it is both intended and, in economic terms, to be expected with sufficient certainty that a financial instrument will be held to maturity, the instrument in question is measured at amortized cost using the effective interest method. Held-to-maturity financial investments include current and noncurrent securities, and components of items reported under other financial assets.
Loans and receivables are non-derivative financial assets that are not quoted in an active market. They are measured at amortized cost using the effective interest method. This category comprises trade receivables, the financial receivables and loans included in other financial assets, the additional financial receivables and loans reported under other assets, and cash and cash equivalents.
All other primary financial assets that are not loans and receivables, must be classified as available for sale and are reported at fair value if their fair value can be determined reliably. Basically, these assets comprise equity instruments, and also debt instruments not being held to maturity. Unrealized gains and losses are recorded taking account of deferred taxes and are recognized in other equity items with no effect on income. If equity instruments have no price quoted on an active market and if their fair value cannot be determined reliably, they are measured at cost.

208Wacker Chemie AGAnnual Report 2013
Consolidated Financial StatementsNotes of the WACKER Group
If the fair value of available-for-sale financial assets falls below the acquisition costs or there are objective signs that an asset’s value has been impaired, the cumulative loss recognized directly in equity is reversed and shown in the statement of income. The com-pany bases its assessment of possible impairments on all available information, such as market conditions and prices, investment-specific factors, and the duration and extent of the drop in value below acquisition costs. Impairments affecting a debt instrument are reversed in subsequent periods, provided that the reasons for the impairment no longer apply. When the financial instruments are disposed of, the cumulative gains and losses recognized in equity are included in the statement of income.
Derivative financial instruments are used for hedging purposes with the sole aim of reducing the Group’s exposure to foreign-currency exchange rates, interest rates, and commodity price risks arising from operating activities and the resultant financing requirements.
Where derivative financial instruments are used to hedge risks stemming from future payment flows and items in the statement of financial position, IAS 39 permits special hedge-accounting regulations to be applied under certain circumstances. In this way, volatility in the statement of income can be reduced. Depending on the type of underlying transaction designated as a hedged item, a distinction is made between a fair value hedge, a cash flow hedge and a hedge of a net investment in a foreign operation.
Derivative financial instruments are recognized as of the trade date. Derivative financial instruments are always measured at fair value, irrespective of the purpose or intention for which they were concluded. Positive market values are recognized as a receivable and negative market values as a liability.
Changes in the market value of financial instruments used to limit the risk of lower future cash inflows or higher cash outflows from assets and liabilities recognized in the statement of financial position (cash flow hedges) are recognized under other equity items while taking account of any related tax effects when their efficiency is adequate and documented as such. The profit contribution of the hedging instrument is not released to the statement of income until the hedged item is realized. If such a derivative is sold or the hedging relation-ship is discontinued, the change in its value continues to be reported under other equity items until the underlying transaction occurs. Steps taken to hedge the risk of changes in the market values of recognized assets or liabilities, or to hedge unrecognized fixed con-tractual obligations, lead to fair value hedges. Changes in fair values are recorded for both the hedged underlying transaction and the derivative financial instruments used for hedging, and are presented in the statement of income. At the moment, WACKER does not hedge any net investments in foreign operations.
Contracts concluded in order to receive or deliver non-financial goods for the Group’s own use are not accounted for as derivatives, but treated as pending transactions.
Changes in the values of forward exchange contracts and currency options are reflected in other operating income and expenses, while changes in the value of interest rate swaps and interest rate options are recognized in net interest income. Changes in foreign exchange derivatives concluded to hedge financial liabilities assumed in foreign currencies are posted under other financial result. Changes in the fair value of commodity futures and commodity options are recognized under cost of goods sold. The hedging of planned transactions in foreign currencies is included in other operating income and expenses. The expenses and income are not netted.

209Wacker Chemie AGAnnual Report 2013
Consolidated Financial StatementsNotes of the WACKER Group
Inventories are measured at cost using the average cost method. Lower net realizable values or prices as of the balance sheet date are taken into account by means of impairments to fair value less costs to sell. The cost of goods sold includes directly attribut-able costs, appropriate portions of indirect material and labor costs, and straight-line depreciation. Due to the relatively short-term production processes, financing costs are not included as part of acquisition or production costs. The overhead cost markups are determined on the basis of average capacity utilization. Value adjustments are recognized for inventory risks resulting from extended periods of storage and reduced usability and to reflect other reductions in the recoverable amount. In the statement of income, the cost of unused production capacity is also included in the cost of goods sold. For production-related reasons, unfinished and finished goods are combined and reported under products.
Emissions certificates allotted free of charge are measured at a nominal value of zero. Emissions allowances acquired against payment are carried at cost. Thereafter, they are carried at market prices, but never higher than cost. If the fair value is lower as of the reporting date, the carrying amount is reduced accordingly. Proceeds from the sale of emission certificates are recognized in profit or loss.
Trade receivables and other assets ( including tax receivables), with the exception of financial derivatives, are generally recognized at amortized cost. Risks are taken into account through appropriate valuation allowances. Allowances for uninsured receivables – or for the deductible in the case of insured receivables – are made whenever legal action is taken. If payment of a receivable is no longer expected even though legal action has been taken, the gross receivable is derecognized and any valuation allowances made are reversed. Noncurrent receivables which are non-interest-bearing or low-interest-bearing are discounted. WACKER is not a contractor for long-term production orders.
Receivables from finance lease agreements where WACKER acts as the lessor are reported under other assets. The gross value of the outstanding lease payments, less unrealized interest earnings, is capitalized as a receivable. The lease installments received are apportioned to the interest amount and the repayment amount of the outstanding receivable in such a way that the interest amount reflects a constant rate of interest on the outstanding receivable. The interest amount is reported under other financial result in the statement of income.
Cash and cash equivalents comprise cash in hand, demand deposits, and financial assets that can be converted into cash at any time and are only subject to a slight fluctuation in value. They have a residual term of up to three months when received and are measured at amortized cost, which is equivalent to their nominal values.
Deferred tax assets and liabilities are recognized for temporary differences between tax bases and carrying amounts, and for consolidation measures recognized in the statement of income. The deferred tax assets include tax relief entitlements resulting from the an tic-ipated use of existing loss carryforwards in future years, the realization of which is assured with sufficient probability. Deferred taxes are determined on the basis of the tax rates which, under current law, are applicable or anticipated in the individual countries when they are realized. The deferred tax assets and liabilities are netted out only to the extent possible under the same tax authority. Deferred tax assets and liabilities are recognized in the statement of income. In cases where profits or losses are recognized directly in equity, the deferred tax asset or liability is likewise posted under other equity items.

210Wacker Chemie AGAnnual Report 2013
Consolidated Financial StatementsNotes of the WACKER Group
Provisions for pensions are recognized in accordance with the projected unit credit method. This method takes account not only of pensions and entitlements to future pensions known as of the balance sheet date, but also of estimated increases in salaries and pensions. Moreover, the calculation is based on actuarial valuations and takes account of biometric and financial calculation principles. The plan assets at fair value are subtracted from the present value of the pension obligations, resulting in either a net pension liability or the assets of the defined benefit plans. If the fund’s assets exceed the obligation from the pension commitment, an asset is generally recognized. Such recognition, however, is per-mitted only on the condition that the reporting entity can draw an economic benefit from these assets, e.g. in the form of refunds from the plan or reductions in future contributions to the plan. The net interest cost in the fiscal year is determined by applying the discount rate set at the beginning of the year to the net pension liability calculated at the same time. The applicable interest rate for assessing the defined benefit obligation is used as the discount factor. The net interest from the net pension liability is the difference between the calculated interest income from plan assets and the interest cost from the defined benefit obligation.
Actuarial gains and losses stemming from the difference between the estimate at the start of the period and actual developments during the period – or a newer estimate on the balance sheet date – in relation to probable mortality rates, retirement and salary trends and discount rates are recognized in other comprehensive income. Actuarial gains and losses posted under other comprehensive income cannot be recognized in profit or loss in subsequent periods. Similarly, differences between the interest income from plan assets calculated at the start of the period and the actual income from plan assets determined at the end of the period are recognized in other comprehensive income. Both effects are posted in other equity items as remeasurements of defined benefit plans.
If the present value of a defined benefit obligation changes due to a plan modification or curtailment, WACKER recognizes the resultant effect as past service cost. This is immediately recognized in profit or loss when it occurs. The profits and losses resulting from settlement are also recognized immediately in the statement of income when settlement takes place. Administrative expenses that are not related to the management of plan assets are recog-nized in profit or loss when incurred, too.
The expense incurred in funding the pension provisions (service cost) is allocated to the costs of the functional areas concerned. The interest cost is reported under other financial result.
Provisions for phased early retirement and anniversaries are measured and set aside in accor dance with actuarial appraisals. Owing to their structure, provisions for phased early retirement also constitute other noncurrent employee benefits in accordance with IAS 19 (revised 2011) since they are linked to the rendering of future service. WACKER structures phased-early-retirement agreements exclusively as a block model. The corresponding pro-visions are recognized pro rata over the service period of the claim during the work phase. The outstanding settlement amount, i.e. that part of their salary that employees forgo during the work phase, is treated as plan assets. The phased-early-retirement provision represents WACKER’s net liability, i.e after the plan assets have been offset against the total obligation. The top-up payments are not viewed as completely earned until the required work has been rendered in full by the employees. Top-up payments that have already been paid out even though the corresponding work has yet to be completed are capitalized.
Provisions are recognized in the statement of financial position for present legal or constructive obligations toward third parties if an outflow of resources to settle these obli-gations is probable and its amount can be estimated reliably. The amounts recognized are

211Wacker Chemie AGAnnual Report 2013
Consolidated Financial StatementsNotes of the WACKER Group
based on the amounts that will be required to cover the Group’s future payment obligations, identifiable risks and contingencies. As a rule, all those cost components that are also capitalized under inventories are included in the measurement of other provisions. Future price increases are also taken into account in the measurement. Noncurrent provisions are measured at the discounted present value as of the reporting date. The discount rate applied is the current market interest rate for risk-free investments with terms corresponding to the residual term of the obligation to be settled. Expected refunds, provided that they are sufficiently secure or legally enforceable, are not offset against provisions. Instead, they are capitalized as separate assets if their realization is virtually certain.
Provisions for restructuring costs are recognized if a detailed formal plan for restructuring has been drawn up and conveyed to the affected parties. Provisions for contingent losses arising from onerous contracts are recognized if the expected benefits to be derived from a contract are lower than the unavoidable costs of meeting the contractual obligations. Provisions for environmental protection are recognized if the future cash outflows for com-plying with environmental legislation or for cleanup measures are likely, the costs can be estimated with sufficient accuracy and no future acquired benefit can be expected from the measures. Provisions are recognized if the available portfolio of emission allowances does not cover the anticipated obligations.
If an amended estimate results in a reduction in the scope of the obligations, a proportion of the provision is reversed and the earnings are allocated to the functional area originally charged with the expense when the provision was set aside.
Financial liabilities are measured at fair value on initial recognition. For all financial liabilities not subsequently measured at fair value through profit or loss, the transaction costs directly attributable to the acquisition are included in the recognized liability. Liabilities from finance lease agreements are shown as financial liabilities at the present value of the future lease installments.
Trade payables and other liabilities ( including tax liabilities) are measured at amortized cost using the effective interest method.
Contingencies are potential obligations that arise from past events and the existence of which depends on uncertain future events which are beyond the Group’s influence, and on existing obligations that cannot be carried as liabilities because either an outflow of re-sources is unlikely or the amount of the obligation cannot be estimated with sufficient reliability. Contingencies are shown at values corresponding to the degree of liability that exists on the balance sheet date.
In accordance with the management approach, segment reporting at WACKER is based on an internal organizational and reporting structure. The data used to determine key internal management ratios is derived from the consolidated financial statements drawn up in accordance with IFRS.
Disposal groups and discontinued operations are reported in accordance with criteria defined in IFRS 5. The Group reports the assets and liabilities of a disposal group separately in the statement of financial position. Unless a disposal group qualifies for discontinued operations reporting, the income and expenses of the disposal group remain within continuing operations until the date of disposal. Categorized on initial classification as held for sale, noncurrent assets are recognized at the lower of the carrying amount and fair value less costs to sell, and depreciation and amortization ceases.

212Wacker Chemie AGAnnual Report 2013
Consolidated Financial StatementsNotes of the WACKER Group
Changes in Accounting and Valuation MethodsReclassification of Other Taxes within Current and Noncurrent Assets / Current Liabilities:Other taxes are now recognized in the statement of financial position as either “other assets” or “other liabilities.” Previously, these taxes were recognized together with income taxes under the items “tax receivables” or “tax liabilities.” The prior-year figures have been adapted to improve comparability. As of December 31, 2012, € 14.5 million was reclassified from non-current tax receivables to other noncurrent assets. An amount of € 53.3 million was reclas-sified from current tax receivables to other current assets. These were, for the most part, VAT receivables. On the equity and liabilities side, € 16.0 million was reclassified from current tax liabilities to other current liabilities.
IAS 19 “Employee Benefits” (revised 2011): WACKER is applying IAS 19 “Employee Benefits” (revised 2011) – which the IASB published in June 2011 – for the first time in fiscal 2013. The standard is mandatory for fiscal years which begin on or after January 1, 2013. On June 5, 2012, the revised standard was adopted by the European Commission for application in the EU.
The standard will have the following substantial impact on WACKER’s consolidated financial statements. IAS 19 (revised 2011) affects the recognition, measurement and statement of pension provisions. Previously, WACKER used the corridor method, in accordance with which actuarial gains and losses were carried off-balance-sheet and recognized as a provision pro rata throughout employees’ remaining service years only once they exceeded a specified corridor of 10 percent of the pension obligation. As a result, the net pension liability to employees and the pension provisions recognized in the statement of financial position differed significantly in the past. This method is no longer permitted under the new standard. Actuarial gains and losses are now recognized immediately in equity as “remeasurements of defined benefit plans” under “other equity items.” The pension provisions are thus calculated as the net defined benefit liability, i.e. the value of the defined benefit obligation (DBO) less plan assets at fair value.
Moreover, the interest expense from the present value of the DBO and the interest income – now likewise calculated with the discount rate – from plan assets are combined under “net interest expense” in the statement of income. This net interest expense is calculated by applying the discount rate to the net defined benefit liability. The applicable interest rate for assessing the defined benefit obligation is used as the discount rate. The net interest expense from the net defined benefit liability is therefore the difference between the calculated interest income from plan assets and the interest expense from the defined benefit obligation. The difference between the calculated interest income from plan assets and the actual return on plan assets is posted as “remeasurements of defined benefit plans” under “other equity items.” No effects for WACKER result from the fact that non-vesting past service cost is now recognized immediately in the statement of income when it is incurred rather than being recognized over the vesting period. Similarly, no impact ensues from the recognition – upon performance of service – of administrative expenses not associated with the management of plan assets.

213Wacker Chemie AGAnnual Report 2013
Consolidated Financial StatementsNotes of the WACKER Group
Obligations from phased early retirement contracts now have to be revalued in accordance with IAS 19 “Employee Benefits” (revised 2011). The mandatory payment of top-up amounts will no longer qualify as termination benefits. As long as employee service is required to earn these benefits, the corresponding obligations represent long-term employee benefits to be accrued in line with the period of service. Due to this change in classification, WACKER adjusted its provisions for phased early retirement by € –7.8 million as of January 1, 2012. As per December 31, 2012, phased-early-retirement provisions were € 1.8 million lower. If the outstanding settlement amount is measured in actuarial terms at its present value, a shortfall of € 1.9 million results and fiscal-year 2012 earnings rose by € 5.9 million.
The following tables illustrate the effects of the amended reporting principles on the statement of financial position at December 31, 2012 and the impact on the prior-year period.
Statement of Income
€ million 12M 2012
Reported Adjustment Restated
Sales 4,634.9 – 4,634.9
Cost of goods sold –3,821.8 6.4 –3,815.4
Gross profit from sales 813.1 6.4 819.5
Selling, R & D and general administrative expenses –573.9 2.2 –571.7
Profit / loss from operations 340.5 8.6 349.1
EBIT 258.0 8.6 266.6
Financial result –64.8 2.1 –62.7
Income before taxes 193.2 10.7 203.9
Income taxes –86.4 –2.8 –89.2
Net income for the year 106.8 7.9 114.7
Of whichAttributable to Wacker Chemie AG shareholders 112.8 7.9 120.7
Attributable to non-controlling interests –6.0 – –6.0
Earnings per share (basic /diluted) (€ ) 2.27 0.16 2.43
EBITDA 786.8 8.6 795.4

214Wacker Chemie AGAnnual Report 2013
Consolidated Financial StatementsNotes of the WACKER Group
Statement of Financial Position as of Dec. 31, 2012
€ million Dec. 31, 2012
Reported Adjustment Restated
AssetsDeferred tax assets 13.3 168.7 182.0
Other noncurrent assets 27.6 –5.8 21.8
Total assets 6,329.9 162.9 6,492.8
Equity and LiabilitiesRetained earnings 2,219.9 –218.8 2,001.1
Other equity items 6.6 –277.7 –271.1
Equity 2,617.8 –496.5 2,121.3
Provisions for pensions 569.3 666.2 1,235.5
Other noncurrent provisions 161.3 3.4 164.7
Deferred tax liabilities 13.0 –10.2 2.8
Noncurrent liabilities 2,550.8 659.4 3,210.2
Liabilities 3,712.1 659.4 4,371.5
Total equity and liabilities 6,329.9 162.9 6,492.8
Equity ratio (%) 41.4 32.7
Statement of Cash Flows
€ million 12M 2012
Reported Adjustment Restated
Net income for the year 106.8 7.9 114.7
Changes in provisions 107.6 –8.9 98.7
Changes in deferred taxes –24.4 2.8 –21.6
Changes in other assets –4.8 –1.8 –6.6
Cash flow from operating activities (gross cash flow) 363.2 – 363.2

215Wacker Chemie AGAnnual Report 2013
Consolidated Financial StatementsNotes of the WACKER Group
Statement of Comprehensive Income 12M 2012
€ million Reported Adjustment Restated
Before taxes
Deferred taxes
Before taxes
Deferred taxes
Before taxes
Deferred taxes
Net income for the year – – 106.8 7.9 – – – 114.7
Remeasurements of defined benefit plans – – – –383.2 104.5 –383.2 104.5 –278.7
Difference from foreign currency translation adjustments –14.0 – –14.0 1.0 – –13.0 – –13.0
Income and expenses recognized in equity –6.2 –1.8 –8.0 –382.2 104.5 –388.4 102.7 –285.7
Total income and expenses reported – – 98.8 – – – – –171.0
Of whichAttributable to Wacker Chemie AG shareholders – – 105.5 – – – – –164.3
Attributable to non-controlling interests – – –6.7 – – – – –6.7
Consolidated Statement of Changes in Equity 12M 2012
€ million
Sub-scribed capital
Capital reserves
Treasury shares
Retained earnings
Other equity items
Total
Non- con-
trolling interests
Total
ReportedJan. 1, 2012 260.8 157.4 –45.1 2,216.4 13.9 2,603.4 26.3 2,629.7
Net income for the year – – – 112.8 – 112.8 –6.0 106.8
Dividends paid – – – –109.3 – –109.3 –1.4 –110.7
Income and expenses recognized in equity – – – – –7.3 –7.3 –0.7 –8.0
Dec. 31, 2012 260.8 157.4 –45.1 2,219.9 6.6 2,599.6 18.2 2,617.8
AdjustmentAdjustment of retained earnings – – – –226.7 – –226.7 – –226.7
Net income for the year – – – 7.9 – 7.9 – 7.9
Income and expenses recognized in equity – – – – –277.7 –277.7 – –277.7
RestatedJan. 1, 2012 260.8 157.4 –45.1 1,989.7 13.9 2,376.7 26.3 2,403.0
Net income for the year – – – 120.7 – 120.7 –6.0 114.7
Dividends paid – – – –109.3 – –109.3 –1.4 –110.7
Income and expenses recognized in equity – – – – –285.0 –285.0 –0.7 –285.7
Dec. 31, 2012 260.8 157.4 –45.1 2,001.1 –271.1 2,103.1 18.2 2,121.3

216Wacker Chemie AGAnnual Report 2013
Consolidated Financial StatementsNotes of the WACKER Group
If WACKER had not applied IAS 19 (revised 2011) as of January 1, 2013, it would have reported additional after-tax expenses of around € 17 million. The provisions for pensions would have been around € 470 million lower. Deferred tax assets would have been around € 120 million lower. Other provisions would have been about € 15 million higher owing to provisions for phased early retirement. Equity would have been around € 350 million higher.
Summary of Significant Accounting and Valuation MethodsThe main accounting and valuation methods are summarized in the following overview:
Accounting and Valuation Method Description
Recognition of sales and income Sales are recognized on delivery of goods or services and on the transfer of risk to the purchaser.
Expense recognition Expenses are recognized when incurred and when the service is utilized.
Taxes
Deferred taxes are recognized for temporary differences, for consolidation measures recognized in income and for tax loss carryforwards whenever their realization is sufficiently probable.
Intangible assets and property, plant and equipment
These are measured at amortized cost. They are generally amortized /depreciated on a straight-line basis.
Government grantsIncentives provided by government bodies either reduce acquisition or production costs, or are recognized in the statement of income.
Inventories These are measured at amortized cost using the average cost method.
Receivables and other assets These are measured at amortized cost. Risks are accounted for through valuation allowances.
Provisions for pensions and similar obligations
These are determined using the projected unit credit method. Actuarial gains and losses are recognized in equity under other equity items. The return on plan assets is calculated using the discount rate for the defined benefit obligation.
Financial instruments On initial recognition, financial instruments (other financial assets and financial liabilities) are measured at fair value.

01 Sales / Cost of Goods Sold / Other Operating Income / Other Operating Expenses
€ million 2013 2012
SalesProceeds from deliveries of products and merchandise 4,392.1 4,541.5
Proceeds from other services 86.8 93.4
Total 4,478.9 4,634.9
Cost of goods sold –3,815.4 –3,815.4
Cost of goods sold includes the following reversals (+) / recognitions (-) of impairments of inventories 11.5 –20.2
Other operating incomeIncome from currency transactions 103.8 144.6
Income from reversal of provisions 14.3 27.7
Insurance compensation 2.1 2.0
Income from reversal of valuation allowances for receivables 0.8 1.0
Income from disposal of property, plant and equipment and financial assets 9.9 5.9
Income from incentives /grants 7.9 6.7
Income related to the termination of long-term supply contracts and to the receipt of advance payments 91.9 158.0
Other operating income 23.8 20.8
Total 254.5 366.7
Other operating expensesLosses from currency transactions –106.6 –152.5
Losses from valuation allowances for receivables –1.7 –19.1
Losses from disposal of assets –9.9 –3.9
Losses from impairment of property, plant and equipment –37.0 –2.5
Losses from restructuring measures –3.9 –10.3
Other operating expenses –51.1 –77.1
Total –210.2 –265.4
Cost of goods sold for the previous year includes net income totaling € 74.9 million from a reduction in provisions for expected losses from WACKER’s silicone business in China. This was due to a change in transfer pricing policy between WACKER’s Chinese subsidiaries and the siloxane-production associate Dow Corning (ZJG) Co. Ltd., China. Adjustment of these transfer prices resulted in an impairment of € 77.0 million in the carrying amount of Dow Corning (ZJG) Co. Ltd., China, which is accounted for using the equity method.
In fiscal 2013, impairments amounting to € 37.0 million were recognized. Of this amount, € 34.8 million is attributable to the Siltronic division, which retired noncurrent assets no longer used. The remaining impairment losses related to the shutdowns of smaller plants at other divisions.
Expenses for restructuring measures relate to the Siltronic division. In the previous year restructuring costs mainly comprised expenses in connection with the closure of the 150 mm wafer production plant at Portland and restructuring costs incurred in Germany.
217Wacker Chemie AGAnnual Report 2013
Consolidated Financial StatementsNotes of the WACKER Group

Other operating expenses mainly comprise costs that are related to the construction of polysilicon facilities in the US and that cannot be capitalized.
02 Income from Investments in Joint Ventures and Associates / Other Investment Income /Net Interest Income / Other Financial Results
€ million 2013 2012
Result from investments in joint ventures and associates –36.1 –82.6
Of which pro rata result attributable to joint ventures –36.8 –22.3
Of which pro rata result attributable to associated companies 0.7 16.7
Of which impairments – –77.0
Other investment resultOther financial income 0.1 0.1
Total 0.1 0.1
Net interest incomeInterest income 15.0 16.0
Of which from available-for-sale financial instruments 1.5 2.1
Of which from held-to-maturity financial instruments 0.8 3.3
Interest expenses –41.8 –26.2
Total –26.8 –10.2
Other financial resultOther financial income 31.4 20.5
Interest effect of interest-bearing provisions / liabilities / finance leases –53.5 –50.1
Other financial expenses –34.4 –22.9
Total –56.5 –52.5
The income from investments in joint ventures and associates relates mainly to companies in China and Singapore. This income includes not only the pro rata shares of net results for the year, but also effects from pro rata eliminations of intercompany profits.
Long-term supply contracts based on fixed transfer prices are in place with the associated company Dow Corning (ZJG) Co. Ltd., Zhangjiagang, China. Changes in the transfer pricing policy made in the previous year led to a substantial reduction in future transfer prices, bringing about a change in the associated company’s expected cash inflows. For this reason, WACKER had reduced – by € 77.0 million – the related carrying amount of the associate, which is accounted for using the equity method. The impairment test performed was based on the value-in-use method. The discount rate amounted to 10.7 percent (after tax). The charge was allocated to the silicones segment.
Borrowing costs of € 2.0 million (2012: € 14.2 million) were capitalized in the year under review, resulting in a corresponding improvement in the net interest result. The average borrowing interest rate applied by the Group in the 2013 financial year was 3.1 percent, as in the previous year.
The interest effect of interest-bearing provisions includes net interest expenses from accrued interest on pension obligations and calculated proceeds from plan assets totaling € 42.3 million (2012: € 36.6 million) and interest cost and interest income from provisions of € 9.3 million (2012: € 11.2 million).
218Wacker Chemie AGAnnual Report 2013
Consolidated Financial StatementsNotes of the WACKER Group

Other financial income and expenses primarily result from exchange-rate effects in connection with financial transactions.
03 Income TaxesIncome taxes are calculated on the basis of applicable or anticipated tax rates according to the prevailing legal situation in the individual countries as of the realization date. These tax rates are generally based on the legal statutes valid or adopted as of the balance sheet date. In Germany, a solidarity surcharge is added to corporate tax. Trade income tax, which varies depending on the municipality in which a company is located, must also be paid.
Tax Rates in Germany
% 2013 2012
Weighted average trade income tax rate 12.3 11.6
Corporate tax rate 15.0 15.0
Solidarity surcharge on corporate tax 5.5 5.5
Deferred taxes of German companies are therefore measured based on a total tax rate ( including solidarity surcharge) of 28.2 percent (2012: 27.5 percent). The income from foreign Group companies is subject to taxation at the tax rates valid in the country in which the respective company is based. The respective local income tax rates applicable in each country for foreign companies range from 10.0 percent to 39.0 percent (2012: from 10.0 percent to 40.5 percent).
Deferred taxes on undistributed profits of subsidiaries were recognized only if distribution is planned. The amount of € 537.1 million (2012: € 492.5 million) is available for distribution.
219Wacker Chemie AGAnnual Report 2013
Consolidated Financial StatementsNotes of the WACKER Group

€ million 2013 2012
Current taxes, domestic –52.9 –84.0
Current taxes, foreign –12.8 –26.8
Current taxes –65.7 –110.8
Deferred taxes, domestic 47.0 20.6
Deferred taxes, foreign –6.0 1.0
Deferred taxes 41.0 21.6
Income taxes –24.7 –89.2
Derivation of the effective tax rateIncome before taxes 31.0 203.9
Income tax rate for Wacker Chemie AG (%) 28.2 27.5
Expected tax expenses –8.7 –56.1
Tax rate divergences 5.1 –2.5
Tax effect of non-deductible expenses –21.3 –9.7
Tax effect of tax-free income 10.1 5.2
Taxes relating to other periods (current earnings) 6.2 1.8
Effects of loss carryforwards and temporary differences –5.3 –4.1
Group equity result –11.1 –22.9
Other divergences 0.3 –0.9
Total income tax –24.7 –89.2
Effective tax rate (%) 79.7 43.7
The tax expenses of € 24.7 million reported for fiscal 2013 were € 16.0 million higher than the expected tax expenses of € 8.7 million that would have resulted from the application of the total tax rate for Germany of 28.2 percent.
Income taxes include current tax income for prior years of € 1.2 million (2012: tax expenses of € 2.9 million) and deferred tax income from other periods of € 5.0 million (2012: € 4.7 million).
220Wacker Chemie AGAnnual Report 2013
Consolidated Financial StatementsNotes of the WACKER Group

Allocation of Deferred Taxes
€ million 2013 2012
Deferred tax
assets
Deferred tax
liabilities
Deferred tax
assets
Deferred tax
liabilities
Intangible assets 11.6 – 12.3 –
Property, plant and equipment 5.9 63.7 3.7 94.4
Financial assets 0.5 – 0.8 –
Current assets 11.1 5.1 10.6 4.1
Provisions for pensions 165.5 – 207.0 –
Other provisions 32.8 4.2 28.5 0.6
Liabilities 9.7 0.1 14.0 0.1
Loss carryforwards 0.2 – 1.5 –
Setting off for companies with profit and loss transfer agreement –0.6 –0.6 –0.6 –0.6
Total 236.7 72.5 277.8 98.6
Setoffs –71.0 –71.0 –95.8 –95.8
Amount recorded in Statement of Financial Position 165.7 1.5 182.0 2.8
Deferred tax assets and liabilities are offset whenever there are future tax amounts imposed on, or credited to, the same taxpayer by the same tax authority. In addition, deferred tax assets are recognized only if it is probable that these tax benefits will be realized.
The substantial changes of € 41.0 million in deferred tax assets and liabilities were recognized in profit or loss (2012: € 21.6 million), while € –55.1 million was recognized directly in equity (2012: € 102.7 million). The existing tax loss carryforwards can be used as follows:
€ million 2013 2012
Within 1 year 13.0 –
Within 2 years 18.7 13.3
Within 3 years 73.1 20.5
Within 4 years 76.9 74.5
Within 5 years or later 98.1 152.1
Total 279.8 260.4
Of which loss carryforwards not expected to be realizable –279.4 –255.1
Of which loss carryforwards expected to be realizable 0.4 5.3
221Wacker Chemie AGAnnual Report 2013
Consolidated Financial StatementsNotes of the WACKER Group

Tax loss carryforwards generated outside Germany amount to a total of € 279.8 million (2012: € 260.4 million). A total of € 0.4 million (2012: € 5.3 million) relates to realizable loss carryforwards. Associated deferred tax assets for 2013 amounted to € 0.2 million (2012: € 1.5 million). Deferred taxes are not recognized on losses that are not realizable. In theory, however, an amount of € 78.7 million (2012: € 70.2 million) would have resulted from such recognition. Of the loss carryforwards that are not realizable for tax purposes, the amount of € 55.7 million (2012: € 8.4 million) is unlimited as to time and amount. As of December 31, 2013, no deferred tax assets were recognized for tax-deductible temporary differences of € 267.7 million (2012: € 325.4 million).
04 Development of Fixed Assets
2013
€ million
Intangible assets
Property, plant and
equipment
Investment property
Investments
in joint ventures
and associates accounted
for using the equity
method
Financial assets
Total
Acquisition or production costBalance as of Jan. 1, 2013 156.6 10,490.1 11.7 41.0 271.8 10,971.2
Additions 2.1 501.6 – – – 503.7
Disposals –14.1 –163.4 – – –2.2 –179.7
Transfers 2.1 –2.1 – – – –
Other changes 1 – – – –18.9 –9.0 –27.9
Exchange-rate differences –4.8 –167.3 – –3.2 –16.2 –191.5
Balance as of Dec. 31, 2013 141.9 10,658.9 11.7 18.9 244.4 11,075.8
DepreciationBalance as of Jan. 1, 2013 131.1 6,567.2 10.2 – 2.0 6,710.5
Additions 8.6 518.8 – – – 527.4
Impairment – 37.0 – – – 37.0
Disposals –14.1 –150.5 – – – –164.6
Exchange-rate differences –4.1 –97.7 – – –0.4 –102.2
Balance as of Dec. 31, 2013 121.5 6,874.8 10.2 – 1.6 7,008.1
Carrying amounts as of Dec. 31, 2013 20.4 3,784.1 1.5 18.9 242.8 4,067.7
Reduction in cost due to investment grant 470.3
1 This item includes the changes resulting from application of the equity method, as well as noncurrent interest receivables from loans and the fair-value measurement of investments in joint ventures and associates.
222Wacker Chemie AGAnnual Report 2013
Consolidated Financial StatementsNotes of the WACKER Group

2012
€ million
Intangible assets
Property, plant and
equipment
Investment property
Investments
in joint ventures
and associates accounted
for using the equity
method
Financial assets
Total
Acquisition or production costBalance as of Jan. 1, 2012 155.8 9,953.6 11.7 124.5 143.2 10,388.8
Additions 2.3 975.0 – – 118.1 1,095.4
Disposals –2.4 –366.4 – – – –368.8
Transfers 2.5 –2.5 – – – –
Other changes 1 – – – –83.4 2 8.0 –75.4
Exchange-rate differences –1.6 –69.6 – –0.1 2.5 –68.8
Balance as of Dec. 31, 2012 156.6 10,490.1 11.7 41.0 271.8 10,971.2
DepreciationBalance as of Jan. 1, 2012 125.6 6,453.1 10.2 – 2.2 6,591.1
Additions 9.4 516.9 – – – 526.3
Impairment – 2.5 – – – 2.5
Disposals –2.0 –361.6 – – – –363.6
Exchange-rate differences –1.9 –43.7 – – –0.2 –45.8
Balance as of Dec. 31, 2012 131.1 6,567.2 10.2 – 2.0 6,710.5
Carrying amounts as of Dec. 31, 2012 25.5 3,922.9 1.5 41.0 269.8 4,260.7
Reduction in cost due to investment grant 483.6
1 This item includes the changes resulting from application of the equity method, as well as noncurrent interest receivables from loans and the fair-value measurement of investments in joint ventures and associates.
2 This item includes € 77.0 million in impairment losses in the carrying amount of Dow Corning (ZJG) Co. Ltd., which is accounted for using the equity method.
05 Intangible AssetsIntangible assets include industrial property rights, similar rights and other assets acquired against payment.
223Wacker Chemie AGAnnual Report 2013
Consolidated Financial StatementsNotes of the WACKER Group

06 Property, Plant and Equipment
2013
€ million
Land, buildings and similar rights
Technical equipment
and machinery
Other equipment,
factory and office
equipment
Assets under
construction
Total
Acquisition or production costBalance as of Jan. 1, 2013 1,494.5 7,332.1 622.8 1,040.7 10,490.1
Additions 12.0 88.8 21.3 379.5 501.6
Disposals –4.8 –137.5 –19.6 –1.5 –163.4
Transfers 46.0 130.3 6.2 –184.6 –2.1
Exchange-rate differences –52.1 –64.6 –4.3 –46.3 –167.3
Balance as of Dec. 31, 2013 1,495.6 7,349.1 626.4 1,187.8 10,658.9
DepreciationBalance as of Jan. 1, 2013 854.8 5,216.6 494.9 0.9 6,567.2
Additions 53.0 426.9 38.9 – 518.8
Impairment 22.3 12.8 – 1.9 37.0
Disposals –1.2 –130.0 –19.3 – –150.5
Transfers 0.6 1.3 –1.9 – –
Exchange-rate differences –41.2 –53.4 –3.1 – –97.7
Balance as of Dec. 31, 2013 888.3 5,474.2 509.5 2.8 6,874.8
Carrying amounts as of Dec. 31, 2013 607.3 1,874.9 116.9 1,185.0 3,784.1
Of which assets from finance leasesGross values – 82.7 – – 82.7
Depreciation – –47.6 – – –47.6
Carrying amounts – 35.1 – – 35.1
224Wacker Chemie AGAnnual Report 2013
Consolidated Financial StatementsNotes of the WACKER Group
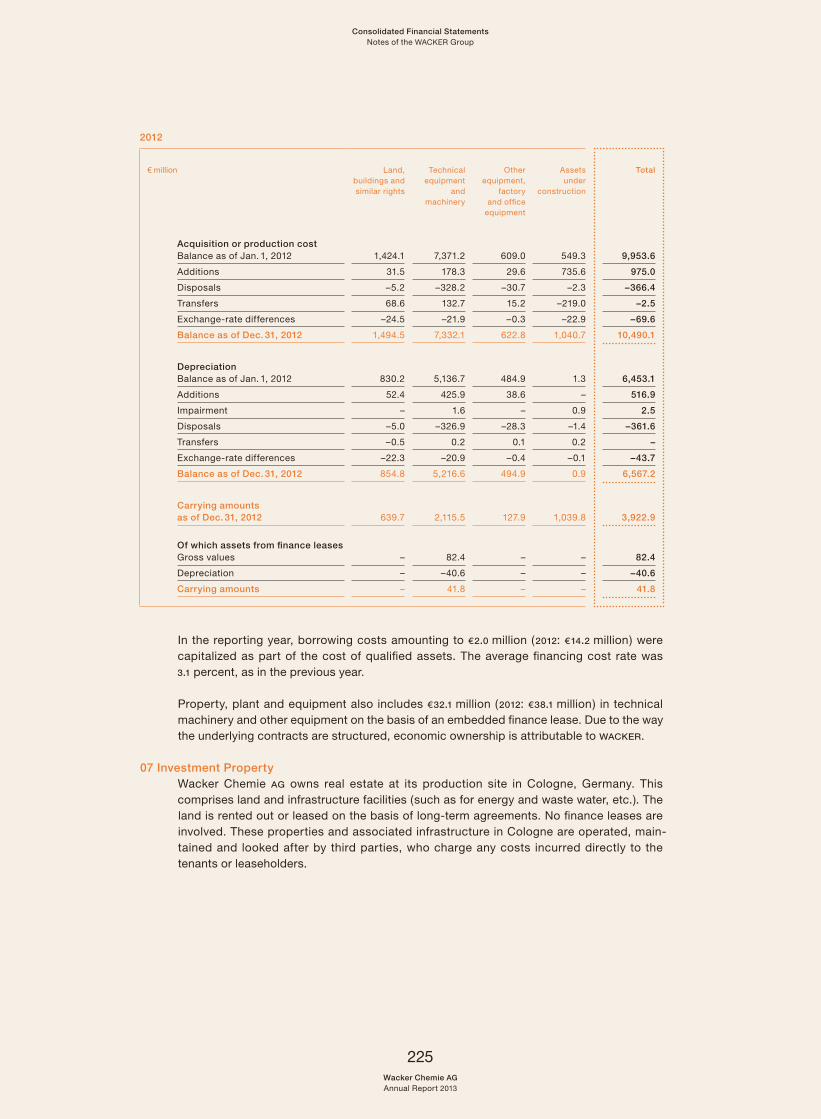
2012
€ million
Land, buildings and similar rights
Technical equipment
and machinery
Other equipment,
factory and office
equipment
Assets under
construction
Total
Acquisition or production costBalance as of Jan. 1, 2012 1,424.1 7,371.2 609.0 549.3 9,953.6
Additions 31.5 178.3 29.6 735.6 975.0
Disposals –5.2 –328.2 –30.7 –2.3 –366.4
Transfers 68.6 132.7 15.2 –219.0 –2.5
Exchange-rate differences –24.5 –21.9 –0.3 –22.9 –69.6
Balance as of Dec. 31, 2012 1,494.5 7,332.1 622.8 1,040.7 10,490.1
DepreciationBalance as of Jan. 1, 2012 830.2 5,136.7 484.9 1.3 6,453.1
Additions 52.4 425.9 38.6 – 516.9
Impairment – 1.6 – 0.9 2.5
Disposals –5.0 –326.9 –28.3 –1.4 –361.6
Transfers –0.5 0.2 0.1 0.2 –
Exchange-rate differences –22.3 –20.9 –0.4 –0.1 –43.7
Balance as of Dec. 31, 2012 854.8 5,216.6 494.9 0.9 6,567.2
Carrying amounts as of Dec. 31, 2012 639.7 2,115.5 127.9 1,039.8 3,922.9
Of which assets from finance leasesGross values – 82.4 – – 82.4
Depreciation – –40.6 – – –40.6
Carrying amounts – 41.8 – – 41.8
In the reporting year, borrowing costs amounting to € 2.0 million (2012: € 14.2 million) were capitalized as part of the cost of qualified assets. The average financing cost rate was 3.1 percent, as in the previous year.
Property, plant and equipment also includes € 32.1 million (2012: € 38.1 million) in technical machinery and other equipment on the basis of an embedded finance lease. Due to the way the underlying contracts are structured, economic ownership is attributable to WACKER.
07 Investment PropertyWacker Chemie AG owns real estate at its production site in Cologne, Germany. This comprises land and infrastructure facilities (such as for energy and waste water, etc.). The land is rented out or leased on the basis of long-term agreements. No finance leases are involved. These properties and associated infrastructure in Cologne are operated, main-tained and looked after by third parties, who charge any costs incurred directly to the tenants or leaseholders.
225Wacker Chemie AGAnnual Report 2013
Consolidated Financial StatementsNotes of the WACKER Group

The rent and lease income is included in the following schedule.
€ million 2013 2012
Fair value 13.8 13.8
Income from rent/operating leases 0.8 0.8
Costs –0.2 –0.2
The fair value is based on an external expert opinion and is updated periodically. It was last updated in 2010.
From an economic standpoint, the only option open to a potential buyer would be to discon-tinue current operations and tear down the existing buildings to make the land available for a new use. The fair value was therefore determined using the market value based on potential proceeds from liquidation of the plant. This measurement took into account the current market situation and thus current prices. The fair value of investment property is allocated to level 2 in the fair value hierarchy.
The valuation process has not been changed since the previous valuation date.
08 Investments in Joint Ventures and Associates, Financial Assets
2013
€ million
Investments in joint
ventures and associates accounted
for using the equity
method
Investments
Other financial
assets
Financial assets
Acquisition or production costBalance as of Jan. 1, 2013 41.0 15.4 256.4 271.8
Disposals – –2.2 – –2.2
Other changes – – 12.2 12.2
Changes resulting from application of equity method –18.9 – –21.2 –21.2
Exchange-rate differences –3.2 –0.4 –15.8 –16.2
Balance as of Dec. 31, 2013 18.9 12.8 231.6 244.4
DepreciationBalance as of Jan. 1, 2013 – 2.0 – 2.0
Exchange-rate differences – –0.4 – –0.4
Balance as of Dec. 31, 2013 – 1.6 – 1.6
Carrying amounts as of Dec. 31, 2013 18.9 11.2 231.6 242.8
226Wacker Chemie AGAnnual Report 2013
Consolidated Financial StatementsNotes of the WACKER Group

2012
€ million
Investments in joint
ventures and associates accounted
for using the equity
method
Investments
Other financial
assets
Financial assets
Acquisition or production costBalance as of Jan. 1, 2012 124.5 13.1 130.1 143.2
Additions – 0.3 117.8 118.1
Other changes – 2.1 5.9 8.0
Changes resulting from application of equity method –83.4 – – –
Exchange-rate differences –0.1 –0.1 2.6 2.5
Balance as of Dec. 31, 2012 41.0 15.4 256.4 271.8
DepreciationBalance as of Jan. 1, 2012 – 2.2 – 2.2
Exchange-rate differences – –0.2 – –0.2
Balance as of Dec. 31, 2012 – 2.0 – 2.0
Carrying amounts as of Dec. 31, 2012 41.0 13.4 256.4 269.8
In 2013, WACKER sold a small investment measured at amortized cost because a call option was exercised. The sale generated euro earnings in the single-digit million range.
Negative changes resulting from application of the equity method were set off for the first time in the amount of € 21.2 million against a loan considered a net investment.
In the previous year, further shareholder loans of € 29.9 million were issued to Siltronic Samsung Wafer Pte. Ltd., Singapore. The addition was shown under other financial assets. Over and above the interest and repayment agreements, the loan agreements grant WACKER the right – as is already the case with existing agreements – to convert the loan into equity (call option). The call options have differing exercise periods, with the longest running until March 31, 2016, and were not exercisable as of the reporting date. In addition, a shareholder loan in the amount of € 87.9 million was disbursed in 2012 to Zhangjiagang-based Dow Corning (ZJG) Co. Ltd., China. Shareholder loans were granted at normal market terms.
Further financial information on associated companies and joint ventures is contained in Note 23.
09 Inventories
€ million 2013 2012
Raw materials and supplies 169.7 185.4
Products 390.0 475.3
Merchandise 51.3 46.3
Services not charged 0.3 0.3
Advance payments 5.6 4.8
Total 616.9 712.1
Of which recorded at net realizable value 129.2 122.4
227Wacker Chemie AGAnnual Report 2013
Consolidated Financial StatementsNotes of the WACKER Group

10 Accounts Receivable / Other Assets / Income Tax Receivables
€ million 2013 2012
Total of which non
current
of which current
Total of which non-
current
of which current
Trade receivables 614.1 – 614.1 600.2 – 600.2
Other receivables from associated companies 0.5 – 0.5 0.5 – 0.5
Advance payments to associated companies 8.6 8.6 – – – –
Loan and interest receivables 4.7 – 4.7 3.4 – 3.4
Derivative financial instruments 22.1 2.5 19.6 11.4 2.9 8.5
Accruals and deferrals 7.5 0.5 7.0 7.8 1.3 6.5
Investment fund shares 1 5.9 5.9 – 2.9 2.9 –
Claims arising from investment grants 7.0 – 7.0 10.9 – 10.9
Claims against suppliers 5.0 0.1 4.9 6.4 0.2 6.2
Other tax receivables 59.6 7.5 52.1 67.8 14.5 53.3
Deposits 18.0 0.2 17.8 19.1 – 19.1
Restricted cash and cash equivalents 6.8 – 6.8 9.5 – 9.5
Sundry assets 70.7 – 70.7 53.9 – 53.9
Other assets 216.4 25.3 191.1 193.6 21.8 171.8
Of which noncurrent, falling due > 5 years 0.2 –
Income tax receivables 27.1 7.6 19.5 47.5 10.0 37.5
Of which noncurrent, falling due > 5 years – –
1 The investment fund shares were originally intended to secure obligations for the phased-early-retirement program and are classified as available for sale.
The sundry assets mainly comprise advance payments to the pension fund.
Receivables are shown at amortized cost, which corresponds to their market values. If not covered by insurance or advance payments received, default risks are taken into account with adequate valuation allowances.
Valuation allowances and overdue debts developed as follows:
2013
€ million
Carrying amount
Of which: neither
impaired nor overdue as of the
reporting date
Of which: not impaired, yet overdue as of the reporting date
Of which: impaired as of the
reporting date
overdue by up to 30 days
overdue by 31 to 45 days
overdue by over 45 days
Trade receivables 614.1 490.2 90.4 2.5 22.1 8.9
Other assets 216.4 215.0 0.3 – 1.1 –
Total 830.5 705.2 90.7 2.5 23.2 8.9
228Wacker Chemie AGAnnual Report 2013
Consolidated Financial StatementsNotes of the WACKER Group

2012
€ million
Carrying amount
Of which: neither
impaired nor overdue as of the
reporting date
Of which: not impaired, yet overdue as of the reporting date
Of which: impaired as of the
reporting date
overdue by up to 30 days
overdue by 31 to 45 days
overdue by over 45 days
Trade receivables 600.2 465.4 103.9 22.9 1.2 6.8
Other assets 193.6 192.2 0.6 0.2 0.6 –
Total 793.8 657.6 104.5 23.1 1.8 6.8
Development of Valuation Allowances / Overdue Debts
€ million 2013 2012
Trade receivables
Other assets
Total Trade receivables
Other assets
Total
Valuation allowances As of Jan. 1 16.7 0.8 17.5 5.6 0.9 6.5
Utilization –1.9 – –1.9 –0.7 – –0.7
Additions / reversals –0.6 –0.1 –0.7 12.5 –0.1 12.4
Exchange-rate differences –1.2 – –1.2 –0.7 – –0.7
As of Dec. 31 13.0 0.7 13.7 16.7 0.8 17.5
Valuation allowances are set up for identifiable credit risks and exchange-rate fluctuations. We continuously monitor the creditworthiness of our debtors to assess the intrinsic value of the corresponding receivables and, where appropriate, we take out credit default insurance. The maximum default risk is equal to the carrying amount of the uninsured receivables. No loans or receivables were renegotiated to prevent an overdue debt or possible impairment. Based on past experience and on the conditions prevailing as of the reporting date, there are no restrictions with regard to credit quality. The additions and reversals in the valuation allowances for receivables in the reporting year mainly relate to companies in the Siltronic Group and to Wacker Chemie AG.
229Wacker Chemie AGAnnual Report 2013
Consolidated Financial StatementsNotes of the WACKER Group

11 Cash and Cash Equivalents /Securities
€ million 2013 2012
Securities 1 192.7 304.1
of which current 71.9 243.0
of which noncurrent 120.8 61.1
Cash and cash equivalentscash equivalents 51.3 –
Demand deposits, cash on hand (cash) 380.5 192.6
431.8 192.6
1 The securities mainly consist of bonds from various issuers which are classified as “available for sale.”
Demand deposits and cash on hand are shown at their nominal amounts. Cash and cash equivalents mainly consist of commercial paper (from issuers with first-class credit standing) classified as “held to maturity.”
12 Equity /NonControlling InterestsThe subscribed capital (capital stock) of Wacker Chemie AG amounts to € 260,763,000. It consists of 52,152,600 no-par-value shares (total ). This corresponds to a notional par value of € 5 per share. There are no different classes of shares. All of the shares are common shares.
In the course of the IPO in April 2006, the number of shares outstanding increased due to the sale of some shares previously held as treasury shares. The following table shows the development in the year under review and in the previous year:
Units 2013 2012
Shares outstanding at the start of the fiscal year 49,677,983 49,677,983
Shares outstanding at the end of the fiscal year 49,677,983 49,677,983
Treasury shares in portfolio 2,474,617 2,474,617
Total shares 52,152,600 52,152,600
For more information on Wacker Chemie AG’s shareholder structure, please refer to Note 24 – Related Party Disclosures.
Capital reserves include the amounts generated with share issues over and above their nominal values in previous years, as well as other contributions made to equity.
Retained earnings include the amounts set aside at Wacker Chemie AG in previous fiscal years, transfers from the Group’s earnings for the year, the earnings of the consolidated companies less amounts due to non-controlling interests, changes to consolidated items affecting income, and changes in the scope of consolidation.
230Wacker Chemie AGAnnual Report 2013
Consolidated Financial StatementsNotes of the WACKER Group

The differences arising from the translation of the financial statements of foreign subsidiaries with reporting currencies other than the euro – and the effects of the valuation of financial instruments and pensions with no immediate effect on income – are recognized in other equity items.
The net result attributable to non-controlling interests is made up of the following profits and losses:
€ million 2013 2012
Profits 3.7 3.0
Losses – –9.0
Net result attributable to noncontrolling interests 3.7 –6.0
In managing its capital, Wacker Chemie AG complies with the legal stipulations on capital maintenance. The company’s Articles of Association do not stipulate any capital re quire-ments. No special capital terminology is used.
The Group’s policy on dividends is generally oriented toward distributing at least 25 percent of net income to shareholders, assuming the business situation allows this and the corporate bodies responsible agree.
13 Provisions for PensionsFor WACKER Group employees, there are various post-employment pension plans, which depend on the legal, economic and fiscal conditions prevailing in the respective countries. These pension plans generally take account of employees’ length of service and salary levels.
The company pension plan makes a distinction between defined contribution and defined benefit plans. Defined contribution plans lead to no further obligation for the company beyond paying contributions into special-purpose funds. Group companies have both defined-contribution and defined-benefit plans, partially financed by Pensionskasse der Wacker Chemie VVaG and by funds. Pension obligations result from defined benefit plans in the form of entitlements to future pensions and ongoing payments for eligible active and former employees of the WACKER Group and their surviving dependents. The various pension plans basically ensure employees a life-long pension either on the basis of their average salary during employment at WACKER (career average plan) or on the basis of lump-sum payments.
The retirement benefits for Group employees comprise the following benefit plans:
Benefits supplied by the company pension fundEmployees at Wacker Chemie AG and other German Group companies are granted a basic pension plan via Pensionskasse der Wacker Chemie VVaG, a legally independent German pension fund. The pension fund is financed by member and company contributions. The payments comprise old-age, disability and survivor benefits.
231Wacker Chemie AGAnnual Report 2013
Consolidated Financial StatementsNotes of the WACKER Group

The pension fund is a small mutual insurance company within the meaning of Section 53 of the German Insurance Supervision Act and is regulated by Section 118 b (3) of this act. It is thus subject to the provisions that apply to German insurers and is monitored by the Federal Financial Supervisory Authority. There are statutory minimum financing obligations.
Employees who joined the pension plan by the end of 2004 receive a basic pension based on a defined benefit obligation, which is to be taken into consideration in determining pension obligations. The pension amount is the same regardless both of the employee’s age when paying contributions and of the interest generated from assets. A new basic-pension model applies for employees who joined the pension fund on or after January 1, 2005. Under that model, the guaranteed payments are based on a fixed interest rate and the benefit amount depends on the age at which the employee pays contributions. Annual profit distributions can increase the future payment. These plans do not affect the determination of pension obligations because of their insurance-related characteristics and are thus classified as defined contribution plans.
In addition, employees in Germany may make voluntary payments to the “PK+” supple-mentary insurance fund of Pensionskasse der Wacker Chemie VVaG. Contributions in connection with retirement benefit plans governed by the collective bargaining agreements concerning one-off payments, retirement benefits and “Working Life and Demography” are paid into the voluntary supplementary insurance fund. Voluntary payments to supplementary insurance funds are also not taken into account when determining pension obligations because of their insurance-related characteristics and are thus classified as defined contribution plans.
Direct Commitments of the WACKER GroupIn addition to the pension fund commitments, employees in Germany receive direct commit-ments in the form of an additional pension. The additional pension insures salary elements above and beyond the pension insurance contribution assessment ceiling. Employees who joined the company before the end of 2004 – and their surviving dependents – receive a pension. The amount of that pension depends on the average salary earned during the period of employment with WACKER (career average plan). For employees who joined the plan on or after January 1, 2005, a certain percentage of the salary exceeding the pension insurance contribution assessment ceiling is paid in. This capital accrues interest. The benefits may be drawn as a life-long pension or, in the case of commitments from 2005 onward, as a lump sum. Employees and their surviving dependents are eligible to receive benefits. Employee entitlements are included when measuring pension obligations, regardless of whether the employees joined the company before the end of 2004 or after the beginning of 2005.
Executive Board members are granted individual pension commitments. For more information on
Executive Board member pension plans, please refer to the Corporate Governance Report on page 268.
Employees in Germany with salaries above the standard pay scale may pay into an employee- financed pension plan (deferred compensation). This plan affords employees the option of converting part of their future salary claims into equivalent pension capital. Pension capital accrues interest according to the date the pension plan was entered into (commitment) at either 7 percent (1996 –2001), 6 percent (2002 –2010) or 5 percent (2011 –2013). Plans bearing 7 percent or 6 percent interest may be drawn in the form of either a pension or a lump sum. Plans bearing 5 percent interest are paid out exclusively in lump-sum form.
232Wacker Chemie AGAnnual Report 2013
Consolidated Financial StatementsNotes of the WACKER Group

Pension commitments made by December 31, 2000 are measured ( in accordance with the projected unit credit method) at the present value of years’ service to date /years served to retirement, whereas any commitments made on or after January 1, 2001 are measured at the present value of the defined benefit obligation.
Pension entitlements in Germany are protected against insolvency by the pension guarantee fund (Pensionssicherungsverein a. G). This insolvency insurance is capped. There are no statutory minimum financing obligations.
Pension Commitments outside of GermanyVarious pension plans are available for employees of foreign subsidiaries, subject to the statutory provisions applicable in the respective countries. With the exception of the US pension plans, these pension plans are not significant to the Group.
In the US, defined benefit plans exist for employees of Siltronic Corporation Portland and Wacker Chemicals Corporation. However, both plans were closed for new applications effective after December 31, 2003, and defined benefits are carried only for legacy policies. Retirement benefits are paid out on a monthly basis as from age 65 and are based on the last average salary paid. Special provisions apply to early retirement as of age 55 depending on the employee’s years of service. In view of their pension-like character, obligations relating to medical care of retired employees and severance payments are likewise included under pension provisions. New employees are offered only defined contribution plans.
The present value of defined benefit plans may be reconciled with the provisions recognized in the balance sheet as follows:
Net Liability of Defined Benefit Obligations
€ million Dec. 31, 2013 Dec. 31, 2012
Germany Foreign Total Germany Foreign Total
Present value of the at least partially fund-financed defined benefit obligations 1,718.0 160.7 1,878.7 1,759.5 180.2 1,939.7
Fair value of plan assets 1,462.0 122.1 1,584.1 1,383.3 119.3 1,502.6
Funded status 256.0 38.6 294.6 376.2 60.9 437.1
Present value of unfunded defined benefit obligations 780.6 4.1 784.7 793.4 5.0 798.4
Net liability of defined benefit obligations 1,036.6 42.7 1,079.3 1,169.6 65.9 1,235.5
Impact of minimum funding requirement /asset ceiling – – – – – –
Provisions for pensions and similar obligations 1,036.6 42.7 1,079.3 1,169.6 65.9 1,235.5
233Wacker Chemie AGAnnual Report 2013
Consolidated Financial StatementsNotes of the WACKER Group

Changes in the Net Liability of Defined Benefit Obligations
€ million
Present value of pension
plan obligations
Market value of
plan assets
Total
Impact of asset
ceiling
Total
As of January 1, 2012 2,248.9 1,422.2 826.7 – 826.7
Current service cost 52.1 – 52.1 – 52.1
Interest expense /income 99.5 62.9 36.6 – 36.6
Past service cost /effects from settlements and curtailments –16.1 –9.4 –6.7 – –6.7
RemeasurementsGains /losses from plan assets without amounts already recognized in interest income – 35.1 –35.1 – –35.1
Gains /losses from changes in demographic assumptions – – – – –
Gains /losses from changes in financial assumptions 420.3 – 420.3 – 420.3
Gains /losses from changes in experience-based assumptions –2.0 – –2.0 – –2.0
Changes in asset ceilings without amounts recognized in interest expense – – – – –
Effects of exchange-rate differences –4.6 –2.2 –2.4 – –2.4
Contributions byEmployer – 34.8 –34.8 – –34.8
Pension plan beneficiaries 9.5 9.5 – – –
Pension payments –70.2 –50.3 –19.9 – –19.9
Transfers/settlements 0.7 – 0.7 – 0.7
As of December 31, 2012 2,738.1 1,502.6 1,235.5 – 1,235.5
Current service cost 67.5 – 67.5 – 67.5
Interest expense /income 95.1 52.8 42.3 – 42.3
Past service cost /effects from settlements and curtailments 0.2 – 0.2 – 0.2
Remeasurements Gains /losses from plan assets without amounts already recognized in interest income – 37.4 –37.4 – –37.4
Gains/losses from changes in demographic assumptions 0.2 – 0.2 – 0.2
Gains /losses from changes in financial assumptions –154.1 – –154.1 – –154.1
Gains /losses from changes in experience-based assumptions –13.4 – –13.4 – –13.4
Changes in asset ceilings without amounts recognized in interest expense – – – – –
Effects of exchange-rate differences –6.8 –4.9 –1.9 – –1.9
Contributions byEmployer – 37.8 –37.8 – –37.8
Pension plan beneficiaries 9.5 9.5 – – –
Pension payments –73.0 –51.5 –21.5 – –21.5
Transfers/settlements 0.1 0.4 –0.3 – –0.3
As of December 31, 2013 2,663.4 1,584.1 1,079.3 – 1,079.3
234Wacker Chemie AGAnnual Report 2013
Consolidated Financial StatementsNotes of the WACKER Group

The effects from settlements and curtailments in 2012 basically concern the disposal in connection with the closure of part of Siltronic Corporation’s Portland production facility.
AssumptionsThe pension obligations are calculated by taking account of company-specific and country-specific biometric calculation principles and parameters. The calculations are based on actuarial valuations that factor in the following parameters:
% 2013 2012
Germany USA Germany USA
Discount rate 3.8 4.75 3.5 4.0
Salary growth rate 3.0 3.0 3.0 3.0/3.5
Pension growth rate 2.0/1.0/2.5 – 2.0/1.0/2.5 –
Life expectancy calculations in Germany are based on Prof. Dr. Klaus Heubeck’s modified 1998 guideline tables. The pension fund portfolio (basic pension) is based on the official mortality tables (reduction of male mortality to 75 percent of the guideline table value, and 85 percent for females). The portfolio for other pension commitments is based on a reduction of male mortality to 60 percent of the Heubeck values and 85 percent for women, which takes into account in particular the recognized connection between life expectancy and the amount of pension paid (“Influence of socio-economic status” ). For the US, the RP-2000 Combined Healthy Fully Generational Mortality Table (Scale AA to 2020) is used for men and women.
The discount rates and salary increase rates underlying the calculation of the pension obligation were determined in line with the general economic situation and by applying uniform standards. The discount rate is based on a yield curve that is derived from the yields of country-specific, high-grade, fixed-interest corporate bonds with maturities corresponding to the pension obligations. The discount rate takes account of the WACKER-specific, expected future cash flows for these obligations.
Sensitivity AnalysisThe following sensitivity analysis involves an adjustment of only one assumption – i.e. the other assumptions remain unchanged from the original valuation, so that the sensitivity of each individual assumption can be observed in isolation. As a consequence, possible correlation effects between the individual assumptions cannot be taken into consideration. Due to the first-time adoption of IAS 19 (revised in 2011), there are no reference figures from the previous periods for the sensitivity analyses.
The following table shows the possible changes in the present value of pension obligations resulting from changes in the basic actuarial assumptions.
235Wacker Chemie AGAnnual Report 2013
Consolidated Financial StatementsNotes of the WACKER Group

Dec. 31, 2013Effect on defined benefit obligation
Defined benefit obligation in
€ million
Change (%)
Present value of pension obligations as of the reporting date 2,663.4
Present value of all pension obligations ifthe discount rate increases by 0.5% 2,450.4 –8.0
the discount rate decreases by 0.5% 2,905.9 9.1
salaries increase by 0.5% 2,696.8 1.3
salaries decrease by 0.5% 2,634.9 –1.1
future pension increases are 0.25% higher 2,735.0 2.7
future pension increases are 0.25% lower 2,594.9 –2.6
life expectancy goes up by one year 2,749.1 3.2
Composition of Plan Assets Pensionskasse der Wacker Chemie VVaG invests plan assets pursuant to statutory provisions and the provisions of its by-laws. The company pension fund invests nearly half of its assets in equity funds and fixed-income funds. The other half is invested directly in promissory notes (German Schuldscheindarlehen), real estate, real estate mortgages and private equity. The remaining part of assets is retained for liquidity purposes. The investment strat egy follows the investment guideline provided by the executive board of the pension fund.
The plan assets of pension funds set up in the US are generally invested in stocks and funds in accordance with the applicable investment provisions.
The composition of plan assets for the Group is shown in the following table:
€ million Dec. 31, 2013 Dec. 31, 2012
Market prices listed in an active
market
No listing in an active
market
Total
Market prices listed in an active
market
No listing in an active
market
Total
Real estate – 255.7 255.7 – 228.0 228.0
Loans /fixed-interest securities 479.3 449.5 928.8 456.4 457.9 914.3
Shares /funds 258.8 65.4 324.2 243.1 64.6 307.7
Liquidity – 75.4 75.4 – 52.6 52.6
Total plan assets 738.1 846.0 1,584.1 699.5 803.1 1,502.6
WACKER Group was using € 80.2 million of plan assets for its own purposes as of December 31, 2013. The asset mentioned is the real estate used by Wacker Chemie AG for its head-quarters in Munich.
RisksIn addition to the usual actuarial risks, the risk connected with the defined benefit obligation relates in particular to financial risks connected with plan assets. In Germany, substantial amounts of the defined benefit obligation are administered by the pension fund. The current and future relationship between the portfolio structure and obligations are analyzed and
236Wacker Chemie AGAnnual Report 2013
Consolidated Financial StatementsNotes of the WACKER Group

projected as part of an annual asset-liability study. The result is the long-term return required of the pension fund. On this basis, the pension fund defines a strategic target portfolio. This leads to an annual review and coordination of the required return, company contributions of sponsoring entities and strategic asset allocation.
All capital investments are exposed to market price fluctuation risks. These risks may comprise shifts in interest rates, share prices or exchange rates. The pension fund aims to limit losses to a pre-defined amount using overlay management. The pension fund uses derivatives only to reduce risk.
In addition to actuarial risks, the defined benefit plans used in the US are also subject to market-price fluctuation risks because plan assets are invested in stocks and funds.
Applicable statutes and by-laws require WACKER to reduce under-funding of pension plans by increasing the amount of liquid funds.
Actuarial risks arise in particular in connection with the life expectancy of the beneficiaries and the interest rate guarantee risk. Commitments granted in Germany up to 2004 in particular have a high guaranteed interest rate that cannot be achieved in the current market envi ronment without taking risks. The interest rate guarantee risk is regularly monitored as part of the risk management process. It constitutes a major focus of the company pension fund when determining the long-term interest requirements and how to fulfill them. Interest rate guarantee risks also affect the deferred compensation plans.
Pension Plan FinancingIn 2013, benefits in the amount of € 66.7 (2012: € 64.1 million) were paid under pension plans in Germany and € 6.3 million (2012: € 6.1 million) under pension plans outside of Germany. WACKER anticipates that pension payments will reach approximately € 80.0 million in the coming fiscal year. Employer contributions to plan assets will amount to around € 40.0 million in 2014. The weighted duration of pension obligations as of December 31, 2013 was 18.3 years in Germany and 13.5 years in the US.
Projected Payment Periods for Pension Benefits
€ million 2014 2015 2016 2017 2018
Expected pension benefits disbursed –78.1 –82.3 –88.3 –92.4 –95.1
Composition of Pension Expenses
€ million 2013 2012
Pension expensesDefined benefit plan expenses –110.0 –82.0
Defined contribution plan expenses –7.4 –3.7
Other pension expenses –0.5 –9.0
Contributions to state pensions –58.8 –63.8
Total retirement benefits –176.7 –158.5
237Wacker Chemie AGAnnual Report 2013
Consolidated Financial StatementsNotes of the WACKER Group

14 Other Provisions/Tax Provisions
€ million 2013 2012
Total
of which non
current
of which current
Total
of which non-
current
of which current
Personnel 88.1 83.7 4.4 99.6 96.5 3.1
Sales/purchasing 24.9 – 24.9 44.7 7.8 36.9
Environmental protection 53.9 53.7 0.2 52.4 49.9 2.5
Restructuring 5.0 0.1 4.9 7.8 0.9 6.9
Sundry 69.1 10.7 58.4 60.9 9.6 51.3
Other provisions 241.0 148.2 92.8 265.4 164.7 100.7
Tax provisions 81.6 34.5 47.1 74.4 32.1 42.3
Provisions for PersonnelThese include obligations for anniversary payments and funeral expenses as well as provisions for early-retirement and phased-early-retirement plans. There is a continuous outflow of noncurrent provisions for anniversary payments. The provisions for phased-early-retirement plans will be completely paid out in two to six years. Up to that time, the outflow will be continual.
Sales/Purchasing ProvisionsThese provisions cover warranty and product-liability obligations, as well as discounts, cash bonuses and other price reductions still to be granted, commissions payable to sales agents, and contingent losses from contractual agreements. Of the provisions for contingent losses from contractual agreements, the amount of € 21.0 million was used in fiscal 2013. The remaining amount will be used for payouts in the coming year.
Provisions for Environmental ProtectionProvisions for environmental protection are formed for anticipated obligations regarding contaminated-site remediation, water pollution control, recultivation of landfills, the clean-up of contaminated storage and production sites, and similar environmental measures. These provisions also include environmental protection charges likely to be imposed by govern-ment bodies. Most noncurrent provisions for environmental protection will be utilized within a period of 20 years.
Restructuring ProvisionsThe provisions for restructuring comprise severance payments for departing employees, anticipated site closure expenses, demolition obligations, and similar charges.
Sundry ProvisionsThese provisions are formed for a multiplicity of identifiable individual risks and contin-gencies (e.g. damages, legal disputes).
The interest rates ranged between 0 percent and 10 percent. They primarily related to provi-sions associated with purchasing, environmental provisions, provisions for phased-early-retirement plans and anniversary-payment provisions.
238Wacker Chemie AGAnnual Report 2013
Consolidated Financial StatementsNotes of the WACKER Group

Other Provisions
€ million
Jan. 1, 2013
Utilization
Reversal
Addition
Interest effect
Exchange rate
differ-ences
Other
Dec. 31, 2013
Personnel 99.6 – 26.5 –0.2 15.4 – –0.2 – 88.1
Sales/purchasing 44.7 –38.2 –1.1 16.5 3.1 –0.1 – 24.9
Environmental protection 52.4 –3.1 –1.3 2.5 3.5 –0.1 – 53.9
Restructuring 7.8 –2.2 –2.3 2.8 – – –1.1 5.0
Sundry 60.9 –6.5 –8.7 21.1 2.7 –0.4 – 69.1
Total 265.4 –76.5 –13.6 58.3 9.3 –0.8 –1.1 241.0
Tax ProvisionsTax provisions contain amounts for current income tax obligations, risks from tax audits, and legal action. The existing noncurrent tax provisions will largely be used over the next two to four years.
Tax Provisions
€ million
Jan. 1, 2013
Utilization
Reversal
Additions /interest
effect
Exchange rate
differ-ences
Scope of consoli-dation /
Other
Dec. 31, 2013
Taxes 74.4 –5.1 –3.0 15.8 –0.5 – 81.6
15 Financial Liabilities
€ million 2013 2012
Total of which non
current
of which current
Total of which non-
current
of which current
Liabilities to banks 1,079.2 927.6 151.6 1,142.5 920.3 222.2
Of which > 5 years 8.1 30.2
Liabilities from lease obligations 1 38.2 30.8 7.4 45.3 38.2 7.1
Of which > 5 years 9.5 13.6
Other financial liabilities 299.3 289.0 10.3 9.4 – 9.4
Of which > 5 years 238.4 –
Financial liabilities 1,416.7 1,247.4 169.3 1,197.2 958.5 238.7
Of which > 5 years 256.0 43.8
1 Liabilities from leasing arrangements mainly include liabilities related to leasing the Burghausen plant’s CCGT power station as well as liabilities for technical facilities.
In the first quarter of 2013, WACKER privately placed senior unsecured notes in three installments for a total of US$ 400 million among investors on the US financial market. The three installments have varying maturities, namely five, seven and ten years. The placement was made on customary market terms and conditions. It was recorded under other financial liabilities.
No collateral exists for financial liabilities. Financial liabilities are not secured through liens or similar rights. Some of the liabilities to banks are fixed-interest and others have variable
239Wacker Chemie AGAnnual Report 2013
Consolidated Financial StatementsNotes of the WACKER Group

interest rates. Moreover, some of the liabilities to banks were granted on condition that particular covenants be complied with.
The liabilities to banks comprise the following:
€ million 2013 2012
Currency
Carrying amount
€ million
Term until
Currency
Carrying amount
€ million
Term until
Special loan EUR 200.0 2017 EUR 200.0 2017
Special loan EUR 200.0 2016 EUR 200.0 2016
Loans JPY 69.0 2017 JPY 88.1 2017
Loans EUR 50.0 2018 EUR 50.0 2013
Club deals CNY 79.0 2019 CNY 80.1 2019
Club deals CNY 31.2 2016 CNY 41.4 2016
Club deals CNY 6.2 2013
Promissory notes (German Schuldscheine) EUR 150.0 2015 EUR 150.0 2015
Promissory notes (German Schuldscheine) EUR 150.0 2017 EUR 150.0 2017
Promissory notes (German Schuldscheine) EUR 19.0 2013
Other CNY 2.8 2016 CNY 10.6 2016
Other CNY 10.8 2015 CNY 13.4 2014
Other 136.4 2014 133.7 2013
Total 1,079.2 1,142.5
Fair value 1,101.7 1,182.1
The private placement of unsecured notes can be broken down as follows:
€ million 2013
Currency
Carrying amount
€ million
Term until
Private placement (1st installment) USD 50.8 2018
Private placement (2nd installment) USD 94.4 2020
Private placement (3rd installment) USD 143.8 2023
Total 289.0
Fair value 277.6
As in the prior year, the special loans include variable-interest-rate loan amounts. The variable portion totals € 200.0 million and has a residual term until 2016. In 2013, loans included variable-interest-rate loan amounts of € 34.5 million (€ 44.0 million) with a residual term until the end of 2017. The promissory notes (German Schuldscheine) include variable loan amounts of € 101.0 million (2012: € 101.0 million) with a residual term until 2015 and € 39.0 million (2012: € 39.0 million) with a residual term until 2017. As in the prior year, the club deals and other loans have variable interest rates. All the private placements have fixed interest rates.
240Wacker Chemie AGAnnual Report 2013
Consolidated Financial StatementsNotes of the WACKER Group

The carrying amounts of the current financial liabilities correspond to the repayment amounts. With the exception of the club deals, all the loans fall due on maturity. Other loans from banks mainly contain working capital lines of credit.
The following table shows the future principal and interest payments for loans.
€ million 2014 2015 2016 2017 2018 to 2020
Principal 151.6 184.8 232.6 438.9 360.3
Interest 37.0 29.0 26.6 20.3 42.1
There are also unused long-term credit lines amounting to € 700.7 million (2012: € 643.6 million), all conditions for the utilization of which have been met.
As of the reporting date, the future minimum lease payments under finance lease agreements amount to:
€ million 2013 2012
Nominal value
Interest Present value
Nominal value
Interest Present value
Minimum lease payment within a year 8.9 1.5 7.4 9.0 1.9 7.1
Minimum lease payment between one and five years 24.5 3.2 21.3 29.3 4.7 24.6
Minimum lease payment over five years 10.1 0.6 9.5 14.3 0.7 13.6
Total 43.5 5.3 38.2 52.6 7.3 45.3
There are no conditional lease payments from finance leases.
Wacker Chemie AG has capitalized a finance lease for the leased CCGT (combined-cycle gas turbine) power station at its Burghausen site. The lease for the power station is due to expire in 2019 at the latest. WACKER has the right to acquire the power station at a price oriented to book values in accordance with German commercial law. If WACKER acquires this power station, it may not be sold to a third party for five years.
WACKER also has leasing agreements for several technical facilities that qualify as finance leases and were capitalized accordingly. Here, too, the company in some cases has rights of pre-emption and lease rollover options.
The lease agreements serve to simplify the procurement and financing of operating materials and fixed assets. The long-term commitment that they involve, however, leads to a constant future outflow of cash from which the company cannot extract itself.
241Wacker Chemie AGAnnual Report 2013
Consolidated Financial StatementsNotes of the WACKER Group

16 Liabilities
€ million 2013 2012
Total
of whichnon
current
of whichcurrent
Total
of which non-
current
of which current
Trade payables 309.4 – 309.4 379.8 – 379.8
Other tax liabilities 14.9 – 14.9 16.0 – 16.0
Payables relating to social security 2.5 – 2.5 2.8 – 2.8
Payroll liabilities 3.8 – 3.8 2.6 – 2.6
Profit-sharing and other bonuses 55.1 – 55.1 51.8 – 51.8
Other personnel liabilities 24.5 – 24.5 28.9 – 28.9
Derivative financial instruments 33.2 1.2 32.0 18.1 12.5 5.6
Accruals and deferrals 0.8 – 0.8 1.3 0.4 0.9
Advance payments received (third parties) 847.2 564.4 282.8 1,048.1 803.4 244.7
Other liabilities 22.3 0.2 22.1 45.6 0.3 45.3
Other liabilities 1004.3 565.8 438.5 1,215.2 816.6 398.6
Of which > 5 years 16.2 58.0
Income tax liabilities 1.5 – 1.5 1.2 – 1.2
In addition to those tax amounts for which Group companies are liable, tax liabilities include taxes paid for the account of third parties.
Payables relating to social security refer in particular to social-insurance contributions that have yet to be paid.
The other payroll liabilities include, in particular, vacation and flextime credits, as well other HR-related liabilities.
The advance payments received relate primarily to future polysilicon deliveries.
No collateral exists for other liabilities. Other liabilities are not secured through liens or similar rights.
17 Contingencies, Other Financial Obligations and Other RisksContingencies
Contingencies are potential obligations that are based on past events and the existence of which will not be confirmed until the occurrence of one or more uncertain future events that are beyond the Group’s influence. Present obligations, moreover, can likewise be contingencies if the likelihood of an outflow of resources is not strong enough to justify the formation of a provision and /or the amount of the obligations cannot be estimated with suf-ficient reliability. The values assigned to contingencies correspond to the degree of liability that exists on the reporting date.
The contingencies and other obligations shown below are nominal values.
€ million 2013 2012
Guarantees 33.9 194.6
242Wacker Chemie AGAnnual Report 2013
Consolidated Financial StatementsNotes of the WACKER Group

In 2013 the financing of associated companies was restructured, thereby negating the need for a number of guarantees. There was a decrease in the existing guarantees for customers’ advance payments to former joint ventures from which WACKER was released by the purchaser but for which no transfer to the purchaser has occurred.
In view of the present financial situation of the companies for which WACKER has taken on guarantees, utilization of these guarantees is unlikely.
Other Financial Obligations and Other Risks
€ million 2013 2012
Obligations from rent and operating leasesDue within one year 25.7 33.5
Due between one and five years 58.1 66.8
Due after five years or more 20.7 25.4
Total 104.5 125.7
Lease payments occasioned by operating leases 35.8 35.2
Total expected minimum lease payments from subtenancies 1.3 2.5
The Group leases property, plant and equipment, motor vehicles and IT equipment by way of rental agreements and operating leases. These leases generally have terms of between three and five years. Tenancy agreements for office space, property, plant and equipment, etc. have considerably longer terms.
€ million 2013 2012
Obligations from orders for planned investment projects (commitments) 223.6 431.9
Obligations from orders for planned investment projects (commitments) amount to € 223.6 million (2012: € 431.9 million) and mainly concern investments in the polysilicon segment.
Long-term purchasing commitments of some € 110.0 million annually (2012: € 118.0 million) enable the Group to ensure capacity utilization at its joint venture companies with Dow Corning and Samsung. WACKER has pledged its investment in the joint venture with Samsung. The stake serves as collateral for bank loans for joint venture project financing. The pledging ceases with repayment of the project loans on February 28, 2014 following WACKER’s acqui-sition of a majority stake.
Within the framework of its raw-material supplies, WACKER has entered into long-term agree ments to purchase strategic raw materials, electricity and gas. As a result, the company has, on balance, other financial obligations in connection with minimum purchasing obli-gations in the amount of € 2.27 billion (2012: € 2.41 billion). The reduction over the previous year’s figure is due to the expiration of existing long-term supply contracts to secure raw materials and energy. The agreements have terms of between one and ten years.
The Group receives government incentives and allowances for investing activities. These incentives are granted on condition that a certain number of jobs be created or maintained at certain sites. If these contractual commitments are not fulfilled, any funding received must be paid back either in full or in part. The period for which the Group has to fulfill its con tractual commitments is limited.
243Wacker Chemie AGAnnual Report 2013
Consolidated Financial StatementsNotes of the WACKER Group

The aforementioned other financial liabilities also include possible burdens on liquidity arising from potential back payments relating to the German Renewable Energy Act (EEG) levy. In mid-December 2013, the EU Commission began an investigation into the EEG. The subject of the investigation is, among other things, whether the partial exemptions granted power-intensive companies are justified or whether they possibly unreasonably distort competition. Wacker Chemie AG, as a power-intensive company, was granted this type of partial exemption in the terms sought. If the outcome of the proceedings is negative, back payments of exemptions granted may be required. In light of current European Court of Justice case law and the pending amendment to the German Renewable Energy Act, the German federal government is convinced that it will be able to dispel the Commission’s reservations regarding the legality of the incentives. In this regard, Wacker Chemie AG currently rates the risk of a future negative impact arising from back payments of EEG levy exemptions as being low.
WACKER is occasionally involved in legal or arbitration proceedings as well as official investigations and procedures. Pending proceedings can have a negative impact on WACKER’s earnings, net assets or financial position. At the present time, WACKER does not expect any significant negative effects from pending proceedings.
18 Other Disclosures
€ million 2013 2012
Cost of materials –2,060.2 –2,033.6
Personnel expensesWages and salaries –901.3 –979.5
Social benefits and financial aid funds –155.9 –158.9
State pension contributions 58.8 63.8
Social security contributions –97.1 –95.1
Pension expenses –75.8 –58.4
Contributions to state pensions –58.8 –63.8
Pension expenses –134.6 –122.2
Total –1,133.0 –1,196.8
Social benefits relate mainly to the employer’s share of social insurance contributions and to employers’ liability insurance association contributions. The pension expenses consist mainly of pension payments and allocations to pension provisions. Related interest is shown in the financial result. The expenses incurred in transfers to external pension funds and pension plans are likewise included in pension expenses.
€ million 2013 2012
Expenses for Auditors’ FeesAudit 0.7 0.7
Other certification services 0.4 0.3
Total 1.1 1.0
244Wacker Chemie AGAnnual Report 2013
Consolidated Financial StatementsNotes of the WACKER Group

The other certification services consist primarily of the cost of interim reviews. Auditors’ fees in the amount € 1.0 million were paid to KPMG AG Wirtschaftsprüfungsgesellschaft, of which € 0.7 million was for financial statement auditing services and € 0.3 million for other certification services.
19 Earnings per Share /Dividend
2013 2012
Average number of outstanding common shares (units) 49,677,983 49,677,983
Number of common shares outstanding at the end of the year (units) 49,677,983 49,677,983
Dividend per dividend-bearing common share (€ ) 0.50 0.60
Net result for the year after non-controlling interests (€ million) 2.6 120.7
Earnings due to common shares (€ million) 2.6 120.7
Earnings per common share (average, € ) 0.05 2.43
Earnings per common share (as of reporting date, € ) 0.05 2.43
The diluted earnings per share are identical to the basic earnings in both the year under review and the previous year.
In the absence of relevant circumstances, earnings per share relating to results from continuing or discontinued operations are not reported. Changes in accounting and valuation methods resulted in positive effects in the amount of € 0.16 per share in 2012.
The dividend payout for 2012 amounted to € 29.8 million, or € 0.60 per dividend-bearing share. The amount of € 230.0 million from Wacker Chemie AG’s retained profit was allocated to retained earnings.
For 2013, the Executive Board of Wacker Chemie AG has proposed the above-mentioned dividend. The proposed dividend relates solely to dividend-bearing shares, i.e. excluding treasury shares. The acceptance or rejection of this proposal is incumbent on the Annual Shareholders’ Meeting of Wacker Chemie AG. Subject to acceptance of the proposal, an amount of € 24,838,991.50 will be distributed for the 49,677,983 no-par-value shares that are not held by the company.
20 Financial InstrumentsThe following table shows a presentation of financial assets and liabilities by measurement categories and classes. Also presented are liabilities from finance leases and derivatives for which hedge accounting is used, even though they do not belong to any of the IAS 39 measurement categories.
The fair value of financial instruments measured at amortized cost is determined based on discounting, taking into account customary market interest rates that are adequate to the specific risk and correspond to the relevant maturity. For reasons of immateriality, the carrying amount of current balance-sheet items is the same as their fair value.
245Wacker Chemie AGAnnual Report 2013
Consolidated Financial StatementsNotes of the WACKER Group

Financial Assets and Liabilities by Measurement Category and Class as of Dec. 31, 2013
€ million
Measure - ment
pursuant to IAS 39
Measure - ment
pursuant to IAS 17
Balance sheet
carrying amount Dec. 31,
2013
(Amor tized) cost
Fair value through profit or
loss
Fair value through
other compre-hensive income
Amortized cost
Fair value Dec. 31,
2013
Trade receivables 614.1 614.1 614.1
Other financial assets 1 573.6 352.9 5.4 215.3 583.6
Held-to-maturity securities – –
Available-for-sale securities 198.6 198.6
Loans and receivables 341.7 362.9
Available-for-sale financial assets 2 11.2 –
Derivatives for which hedge accounting is not used (assets held for trading) 5.4 5.4
Derivatives for which hedge accounting is used 16.7 16.7
Cash and cash equivalents 431.8 431.8 431.8
Held-to-maturity securities 51.3 51.3
Loans and receivables 380.5 380.5
Total financial assets 1,619.5 1,629.5
Of which pursuant to IAS 39 measurement categories:
Loans and receivables 1,336.3 1,336.3 – – – 1,357.5
Held-to-maturity securities 51.3 51.3 – – – 51.3
Available-for-sale financial assets 209.8 11.2 – 198.6 – 198.6
Derivatives for which hedge accounting is not used (assets held for trading) 5.4 – 5.4 – – 5.4
Derivatives for which hedge accounting is used 16.7 – – 16.7 – 16.7
Financial liabilities 1,378.5 1,378.5 1,389.6
Financial liabilities recognized at amortized cost 1,378.5 1,389.6
Liabilities from finance leases 38.2 38.2 38.2
Trade payables 309.4 309.4 309.4
Financial liabilities recognized at amortized cost 309.4 309.4
Other financial liabilities 3 141.4 108.2 31.3 1.9 141.4
Financial liabilities recognized at amortized cost 108.2 108.2
Derivatives for which hedge accounting is not used (financial liabilities held for trading) 0.8 0.8
Derivatives for which hedge accounting is used 30.5 1.9 32.4
Total financial liabilities 1,867.5 1,878.6
Of which pursuant to IAS 39 measurement categories:
Financial liabilities recognized at amortized cost 1,796.1 1,796.1 – – – 1,807.2
Derivatives for which hedge accounting is not used (financial liabilities held for trading) 0.8 – 0.8 – – 0.8
Derivatives for which hedge accounting is used 32.4 – 30.5 1.9 – 32.4
1 Does not include tax receivables, advance payments made, or accruals and deferrals.2 This item contains available-for-sale financial assets the market values of which cannot be calculated reliably and which have been recognized at cost. This item, along with noncurrent loans, is shown in the statement of financial position under noncurrent financial assets.
3 Includes other liabilities shown in the statement of financial position, with the exception of advance payments received, accruals and deferrals, and tax liabilities.
246Wacker Chemie AGAnnual Report 2013
Consolidated Financial StatementsNotes of the WACKER Group

Financial Assets and Liabilities by Measurement Category and Class as of Dec. 31, 2012
€ million
Measure - ment
pursuant to IAS 39
Measure - ment
pursuant to IAS 17
Balance sheet
carrying amount Dec. 31,
2012
(Amor tized) cost
Fair value through profit or
loss
Fair value through
other compre-hensive income
Amortized cost
Fair value Dec. 31,
2012
Trade receivables 600.2 600.2 600.2
Other financial assets 1 689.8 486.5 5.6 197.7 673.8
Held-to-maturity securities 115.1 112.5
Available-for-sale securities 191.9 191.9
Loans and receivables 358.0 358.0
Available-for-sale financial assets 2 13.4 –
Derivatives for which hedge accounting is not used (assets held for trading) 5.6 5.6
Derivatives for which hedge accounting is used 5.8 5.8
Cash and cash equivalents 192.6 192.6 192.6
Held-to-maturity securities – –
Loans and receivables 192.6 192.6
Total financial assets 1,482.6 1,466.6
Of which pursuant to IAS 39 measurement categories:
Loans and receivables 1,150.8 1,150.8 – – – 1,150.8
Held-to-maturity securities 115.1 115.1 – – – 112.5
Available-for-sale financial assets 205.3 13.4 – 191.9 – 191.9
Derivatives for which hedge accounting is not used (assets held for trading) 5.6 – 5.6 – – 5.6
Derivatives for which hedge accounting is used 5.8 – – 5.8 – 5.8
Financial liabilities 1,151.9 1,151.9 1,191.5
Financial liabilities recognized at amortized cost 1,151.9 1,191.5
Liabilities from finance leases 45.3 45.3 45.3
Trade payables 379.8 379.8 379.8
Financial liabilities recognized at amortized cost 379.8 379.8
Other financial liabilities 3 149.7 129.5 16.9 3.3 149.7
Financial liabilities recognized at amortized cost 129.5 129.5
Derivatives for which hedge accounting is not used (financial liabilities held for trading) 5.3 5.3
Derivatives for which hedge accounting is used 11.6 3.3 14.9
Total financial liabilities 1,726.7 1,766.3
Of which pursuant to IAS 39 measurement categories:
Financial liabilities recognized at amortized cost 1,661.2 1,661.2 – – – 1,700.8
Derivatives for which hedge accounting is not used (financial liabilities held for trading) 5.3 – 5.3 – – 5.3
Derivatives for which hedge accounting is used 14.9 – 11.6 3.3 – 14.9
1 Does not include tax receivables, advance payments made, or accruals and deferrals.2 This item contains available-for-sale financial assets the market values of which cannot be calculated reliably and which have been recognized at cost. This item, along with noncurrent loans, is shown in the statement of financial position under noncurrent financial assets.
3 Includes other liabilities shown in the statement of financial position, with the exception of advance payments received, accruals and deferrals, and tax liabilities.
247Wacker Chemie AGAnnual Report 2013
Consolidated Financial StatementsNotes of the WACKER Group
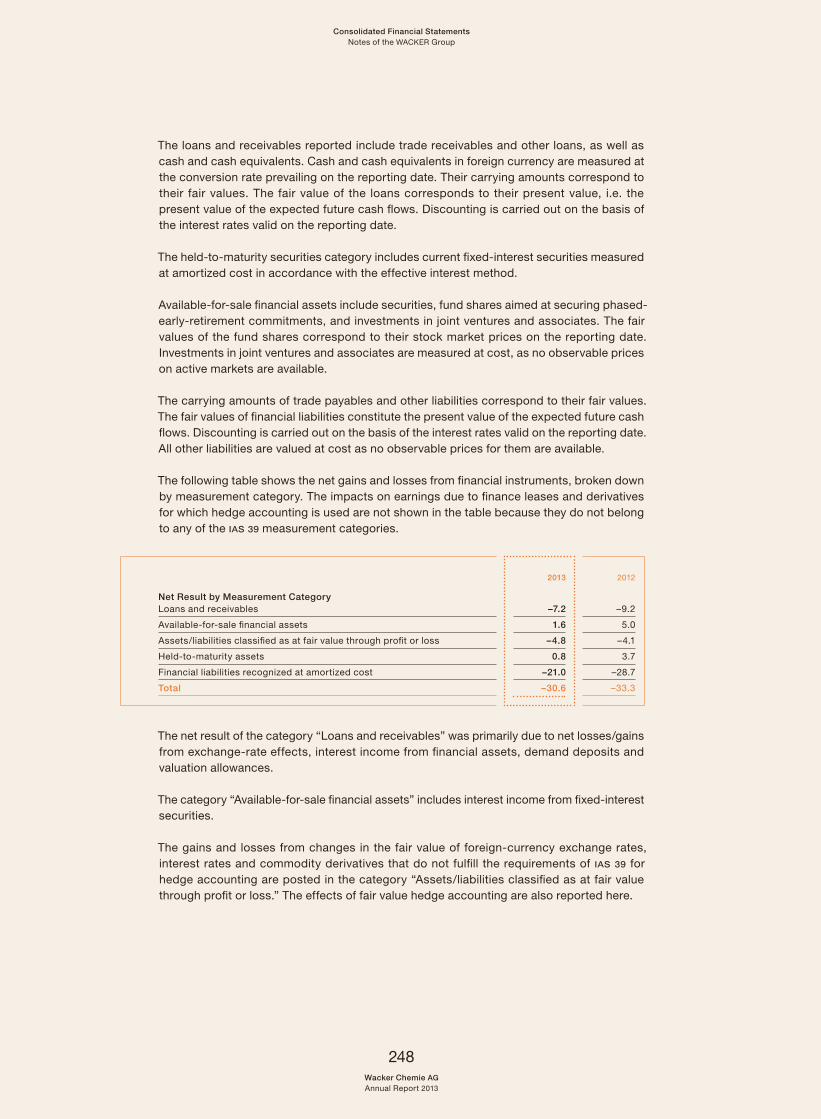
The loans and receivables reported include trade receivables and other loans, as well as cash and cash equivalents. Cash and cash equivalents in foreign currency are measured at the conversion rate prevailing on the reporting date. Their carrying amounts correspond to their fair values. The fair value of the loans corresponds to their present value, i.e. the present value of the expected future cash flows. Discounting is carried out on the basis of the interest rates valid on the reporting date.
The held-to-maturity securities category includes current fixed-interest securities measured at amortized cost in accordance with the effective interest method.
Available-for-sale financial assets include securities, fund shares aimed at securing phased-early-retirement commitments, and investments in joint ventures and associates. The fair values of the fund shares correspond to their stock market prices on the reporting date. Investments in joint ventures and associates are measured at cost, as no observable prices on active markets are available.
The carrying amounts of trade payables and other liabilities correspond to their fair values. The fair values of financial liabilities constitute the present value of the expected future cash flows. Discounting is carried out on the basis of the interest rates valid on the reporting date. All other liabilities are valued at cost as no observable prices for them are available.
The following table shows the net gains and losses from financial instruments, broken down by measurement category. The impacts on earnings due to finance leases and derivatives for which hedge accounting is used are not shown in the table because they do not belong to any of the IAS 39 measurement categories.
2013 2012
Net Result by Measurement CategoryLoans and receivables –7.2 –9.2
Available-for-sale financial assets 1.6 5.0
Assets /liabilities classified as at fair value through profit or loss –4.8 –4.1
Held-to-maturity assets 0.8 3.7
Financial liabilities recognized at amortized cost –21.0 –28.7
Total –30.6 –33.3
The net result of the category “Loans and receivables” was primarily due to net losses /gains from exchange-rate effects, interest income from financial assets, demand deposits and valuation allowances.
The category “Available-for-sale financial assets” includes interest income from fixed-interest securities.
The gains and losses from changes in the fair value of foreign-currency exchange rates, interest rates and commodity derivatives that do not fulfill the requirements of IAS 39 for hedge accounting are posted in the category “Assets /liabilities classified as at fair value through profit or loss.” The effects of fair value hedge accounting are also reported here.
248Wacker Chemie AGAnnual Report 2013
Consolidated Financial StatementsNotes of the WACKER Group

The interest income from financial assets which are not recognized at fair value through profit or loss amounts to € 13.3 million (2012: € 13.5 million). This interest income mainly stems from demand deposits and loans as well as from held-to-maturity securities.
The interest expenses from financial liabilities which are not recognized at fair value through profit or loss total € 42.7 million (2012: € 37.4 million). These interest expenses are mainly due to financial liabilities.
The category “Held-to-maturity assets” mainly comprises interest income from noncurrent and current corporate bonds that are posted under securities.
The net losses in the category “Financial liabilities recognized at amortized cost” primarily consist of interest expenses on bank liabilities and other financial liabilities.
Neither in the year under review nor in the previous year were there any reclassifications of financial assets between those recognized at amortized cost and those recognized at market value or vice versa.
The financial assets and liabilities measured at fair value in the financial statements were allocated to one of three categories in accordance with the fair value hierarchy described in IFRS 13. Allocation to these categories reveals which of the fair values reported were settled through market transactions and the extent to which the measurement was based on models in the absence of observable market transactions.
The following are the levels of the hierarchy.
Level 1: financial instruments measured using quoted prices in active markets, the fair value of which can be derived directly from prices in active liquid markets and for which the financial instrument observable in the market is representative of the financial instrument being measured. These include fixed-interest securities traded in liquid markets.
Level 2: financial instruments measured using valuation methods based on observable market data, the fair value of which can be determined using similar financial instruments traded in active markets or using valuation methods all of whose parameters are observable. These include hedging and non-hedging derivative financial instruments, loans and financial debt.
Level 3: financial instruments measured using valuation methods not based on observable parameters, the fair value of which cannot be determined using observable market data and which require application of different valuation methods. The financial instruments belonging to this category have a value component that is not market-observable and has a major impact on fair value. These include over-the-counter derivatives and unquoted equity instruments.
249Wacker Chemie AGAnnual Report 2013
Consolidated Financial StatementsNotes of the WACKER Group

The following table shows the categories in the fair value hierarchy to which the financial assets and liabilities measured at fair value in the statement of financial position are allocated. The table also shows financial assets and liabilities measured at cost in the statement of financial position. Their fair values are given in the Notes:
Fair Value Hierarchy as of Dec. 31, 2013
Fair value hierarchy Total
Level 1 Level 2 Level 3
Financial assets measured at fair valueFair value through profit or loss
Derivatives for which hedge accounting is not used (assets held for trading) – 5.4 – 5.4
Fair value through other comprehensive incomeDerivatives for which hedge accounting is used – 16.7 – 16.7
Available-for-sale financial assets 198.6 – – 198.6
Total 198.6 22.1 – 220.7
Financial assets measured at amortized costLoans and receivables
Loans – 252.8 – 252.8
Total – 252.8 – 252.8
Financial liabilities measured at fair valueFair value through profit or loss
Derivatives for which hedge accounting is not used ( liabilities held for trading) – 0.8 – 0.8
Fair value through other comprehensive income /through profit or loss
Derivatives for which hedge accounting is used – 32.4 – 32.4
Total – 33.2 – 33.2
Financial liabilities recognized at amortized costFinancial liabilities
Financial liabilities recognized at amortized cost – 1,389.6 – 1,389.6
Total – 1,389.6 – 1,389.6
250Wacker Chemie AGAnnual Report 2013
Consolidated Financial StatementsNotes of the WACKER Group

Fair Value Hierarchy as of Dec. 31, 2012
Fair value hierarchy Total
Level 1 Level 2 Level 3
Financial assets measured at fair valueFair value through profit or loss
Derivatives for which hedge accounting is not used (assets held for trading) – 5.6 – 5.6
Fair value through other comprehensive incomeDerivatives for which hedge accounting is used – 5.8 – 5.8
Available-for-sale financial assets 191.9 – – 191.9
Total 191.9 11.4 – 203.3
Financial assets measured at amortized costLoans and receivables
Loans – 256.4 – 256.4
Total – 256.4 – 256.4
Financial liabilities measured at fair valueFair value through profit or loss
Derivatives for which hedge accounting is not used ( liabilities held for trading) – 5.3 – 5.3
Fair value through other comprehensive income/through profit or loss
Derivatives for which hedge accounting is used – 14.9 – 14.9
Total – 20.2 – 20.2
Financial liabilities recognized at amortized costFinancial liabilities
Financial liabilities recognized at amortized cost – 1,191.5 – 1,191.5
Total – 1,191.5 – 1,191.5
WACKER regularly reviews whether its financial instruments are still appropriately allocated to the fair-value-hierarchy levels. As was the case in the previous year, no reclassifications were carried out within the fair value hierarchy in 2013.
In the period under review, WACKER exclusively measured financial assets and liabilities at fair value. The market values are calculated using market information available on the reporting date and based on counterparties’ quoted prices or via appropriate valuation methodologies (discounted cash-flow or well-established actuarial methodologies, such as the par method).
Derivative financial instruments and available-for-sale financial assets are recognized at fair value and are thus subject to a recurring fair-value assessment.
The fair value of derivative financial instruments is calculated based on market data such as exchange rates or yield curves in accordance with market-specific valuation methodologies. The calculation of the fair value contains our own and the counterparty’s default risk, using maturity-matching and market-observable CDS values. The fair value of available-for-sale financial assets can be derived from prices listed in active markets.
251Wacker Chemie AGAnnual Report 2013
Consolidated Financial StatementsNotes of the WACKER Group

Loans and financial liabilities are measured at amortized cost. However, the fair values must be provided in the Notes.
The fair value of the loans corresponds to the present value of expected future cash flows. Application of the discounted cash flow method using market interest rates means that the carrying amount of the loans corresponds to their fair value.
The fair value of financial liabilities is determined using the net present value method and is based on standard market interest rates.
It was not possible to calculate the fair value of the equity instruments that WACKER measures at amortized cost as no stock market prices or market values are available. The instruments in question are shares in unlisted companies for which there was no indication of a lasting impairment on the reporting date and the fair value of which cannot reliably be determined. WACKER had no intention of selling any of the shares reported as of December 31, 2013.
WACKER does not currently have any financial instruments measured at fair value that are allocated to level 3 of the fair value hierarchy.
In the period under review, no non-recurring fair value measurements were carried out.
There were no changes to the valuation methodology compared with the previous year.
Financial RisksIn the normal course of business, WACKER is exposed to credit, liquidity, and market risks from financial instruments. The aim of financial risk management is to limit risks from operating business and the resultant financing requirements by using certain derivative and non-derivative hedging instruments.
The risks connected with the procurement, financing and selling of WACKER’s products and services are described in detail in the management report. WACKER counters financial risks via the risk management system it has in place. That system is monitored by the Supervisory Board. The fundamental purpose of the risk management system is to identify, analyze, coordinate, monitor and communicate risks in a timely manner. The Executive Board receives regular analyses on the extent of those risks. The analyses focus on market risks, in particular on the potential impact of raw-material-price risks, foreign-currency exchange risks, and interest rate risks on EBITDA and net interest income.
Credit risk (risk of default): In terms of financial instruments, the Group is exposed to a default risk should a contractual party fail to fulfill its commitments. The maximum risk is therefore the amount of the respective financial instrument’s positive fair value. To limit the risk of default, transactions are conducted only within defined limits and with partners of very high credit standing. To make efficient risk management possible, the market risks within the Group are controlled centrally. The conclusion and handling of transactions comply with internal guidelines and are subject to monitoring procedures that take account of the separation of duties. As for operations, outstanding receivables and default risks are continually monitored and hedged against by means of trade credit insurance. Receivables from major customers are not so high as to represent an extraordinary concentration of risks. Default risks are accounted for by impairment, taking advance payments received into account.
252Wacker Chemie AGAnnual Report 2013
Consolidated Financial StatementsNotes of the WACKER Group

Liquidity risk: A liquidity risk means that a company may not be able to meet its existing or future financial obligations due to inadequate funds. To ensure uninterrupted solvency and financial flexibility, the Group holds long-term credit lines and liquid funds based on multiyear financial planning and rolling monthly liquidity planning.
To limit this risk, WACKER keeps liquid reserves in the form of current investments and credit lines. WACKER has also concluded agreements with a number of banks for long-term syndicated loans and bilateral loans.
For information on the maturity analysis for non-derivative financial liabilities, please refer to Note 15.
Market risks: Market risks refer to the risk that fair values or future cash flows of a primary or derivative financial instrument could fluctuate due to changing risk factors.
Foreign Exchange RiskThe potential currency exposure to be hedged with derivative financial instruments is determined on the basis of major foreign-currency income and expenditure. The greatest risk is posed by the US dollar. US-dollar income is taken to mean all sales invoiced in US dollars, while all purchases in US dollars as well as site costs incurred in US dollars are reported under US-dollar expenditure. The evaluation of potential risks includes not only direct US-dollar income and expenditure, but also the indirect US-dollar impact of WACKER’s main raw materials (methanol and natural gas). At the same time, indirect euro-denominated sales are deducted from currency exposure. The US dollar is the only relevant risk variable for the sensitivity analysis in accordance with IFRS 7, since the largest share of foreign-currency cash flows is in US dollars. By comparison, increases in the euro exchange rate against the Singapore dollar, Chinese renminbi and Japanese yen have a minor impact. In determining sensitivity, we simulate a 10-percent US-dollar devaluation against the euro, which would have had an EBITDA effect of € –59 million as per December 31, 2013 and € –56 million as per December 31, 2012. The effect from cash-flow-hedge designated items would have increased equity before income taxes by € 36.8 million (2012: € 36.4 million). The Group’s currency exposure amounted to € 586.0 million as per December 31, 2013 (2012: € 564.0 million).
Interest Rate RiskThe interest rate risk results mainly from financial debt and interest-bearing investments. The Executive Board determines the mixture of fixed and variable-interest net financial debt. Interest rate derivatives are concluded as required, taking account of the given structure. Depending on whether the instrument in question (financial liabilities, investments or interest rate derivatives) has a fixed or variable interest rate, the interest rate risks are measured on the basis of either market-value sensitivity or cash-flow sensitivity. Financial liabilities and fixed-interest investments are measured at amortized cost and are therefore, in accordance with IFRS 7, not subject to any interest-rate risk. Available-for-sale securities are recognized at fair value. Due to their short maturities, they are not subject to a significant risk of changes in interest rates. Hedge accounting is not used for any of the interest rate derivatives. Changes in market interest rates have an impact on the net interest income generated by variable-interest financial instruments and are thus included in the calculation of earnings-related sensitivity. Changes in the market interest rates of interest rate derivatives affect the financial result, and are consequently included in any earnings-related sensitivity analysis. If current interest rates had been 100 base points higher ( lower) on average as of December 31, 2013, net interest income would have been € 0.1 million (2012: € 2.9 million) lower (higher). The net financial debt at the end of the fiscal year does not correspond to the average net debt in the year under review.
253Wacker Chemie AGAnnual Report 2013
Consolidated Financial StatementsNotes of the WACKER Group

Raw Material Price RiskIn general, the company is faced with the risks that its supplies of raw materials may be inadequate and that potential increases in raw-material prices could threaten its results.
Derivative Financial InstrumentsFinancial risks are also hedged using derivative financial instruments. The raw-material price risks that WACKER hedges against result principally from ongoing energy procurement. Electricity-supply price hedging takes place via contractual stipulations, for which the “own-use exemption” provisions of IAS 39 can mainly be used. These contracts, which are concluded for the purpose of receiving or delivering non-financial goods according to WACKER’s own needs, are not recognized as derivatives, but rather as pending transactions.
In those cases where WACKER hedges against currency risks, it uses derivative finan cial instruments, in particular currency forward exchange contracts and foreign exchange swaps. Derivatives are used only if they are backed by positions, cash deposits and funding, or scheduled transactions arising from operations (underlying transactions). The scheduled transactions also include anticipated, but not yet invoiced, sales in foreign currencies.
Foreign exchange hedging is carried out mainly for the US dollar, Japanese yen and Singa-pore dollar. Potential interest rate hedges are based on the maturities of the underlying transactions.
Operational hedging in the foreign exchange area relates to the receivables and liabilities already recognized, and generally covers time horizons of between three and four months. The time horizon for strategic hedging is between four and a maximum of 21 months. The hedged cash flows influence the statement of income at the time when sales are realized. The cash inflows are usually recorded shortly afterward, depending on the payment dead-line. As well as receivables from, and liabilities to, third parties, intercompany financial receivables and liabilities are hedged.
The market values refer to the repurchase values (redemption values) of the financial deriva-tives as of the balance sheet date and are calculated using recognized actuarial methods.
The derivatives are recognized at their market values, irrespective of their stated purpose. They are reported in the statement of financial position under other assets or other liabilities. Where permissible, cash flow hedge accounting is applied for the strategic hedging of currency exchange risks from future foreign exchange positions. In such cases, changes in the market values of foreign exchange contracts and changes in the intrinsic values of currency options are recognized under equity with no effect on net income until the underlying transaction takes place, insofar as the hedge is effective. When future transactions are realized, the effects accumulated under equity are reversed through profit or loss. The changes in the fair value of the currency-option contracts not subject to cash flow hedge accounting are recognized in profit or loss. Depending on the nature of the underlying transaction, they are posted in the statement of income either under the operating result or, if financial liabilities are being hedged, under net interest income or other financial result.
254Wacker Chemie AGAnnual Report 2013
Consolidated Financial StatementsNotes of the WACKER Group

For strategic hedging purposes, graduated hedging ratios of between 25 and 50 percent are used in relation to the expected net exposure in US dollars. The expected net exposure for 2014 is about 50 percent hedged, with the expected additional semiconductor-business net exposure for 2015 being around 30 percent hedged. The hedging ratio for operational hedging in US dollars is around 70 percent.
In the fiscal year, the accumulated income and expenses recorded directly in equity included an unrealized pre-tax result from cash flow hedges amounting to € 11.4 million (2012: € 7.9 million). In the result for the period, no gains or losses from hedge accounting ineffec-tiveness were recorded, as the hedging relationships were almost entirely effective.
The purpose of fair value hedges is to hedge against changes in the fair value of financial assets and liabilities that come about because of fluctuations in the value of currencies (foreign currency swap). If the hedge is effective, the carrying amount of the corresponding underlying transaction is amended to reflect the changes in the fair value of the hedged risks. At the end of 2013, WACKER recognized an expense of € –18.9 million (2012: € –11.6 million) from the valuation of the hedging instrument under fair value hedges. At the same time, income of € 19.0 million (2012: € 11.2 million) was realized on the underlying transaction. According to the underlying transaction, the change in the fair value is recognized in the financial result.
The company has only a small number of embedded derivatives. They are generally measured at market values – or at amortized cost if market values cannot be derived – and are reported under other assets or other liabilities.
€ million Dec. 31, 2013 Dec. 31, 2012
Nominal values
Market values
Nominal values
Market values
Foreign exchange derivatives 991.0 –9.1 1,325.8 –5.1
Other derivatives 12.5 –1.9 52.1 –3.7
Total 1,003.5 –11.0 1,377.9 –8.8
Market values for derivative financial instruments within the framework of hedge accounting 14.8 2.5
The foreign exchange derivatives mainly contain forward exchange contracts amounting to US$ 942.7 million, ¥15.5 billion and SG$ 178.4 million (2012: US$ 1,206.2 million, ¥17.2 billion and SG$ 295.1 million).
Other derivatives involve electricity futures traded on the Norwegian market for a nominal amount of € 12.5 million (2012: € 20.2 million). The electricity futures are used to limit the risk of rising spot-market prices for energy via structured price setting on the electricity market. The hedged amount represents 90 percent of the Holla (Norway) site’s future silicon-production power needs. The futures fall due after a maximum of one year. Derivatives with terms until 2015 were concluded. In the previous year, other derivatives still included interest rate swaps for a nominal amount of € 25.0 million.
255Wacker Chemie AGAnnual Report 2013
Consolidated Financial StatementsNotes of the WACKER Group

The following table contains information on the netting of financial assets and liabilities in the consolidated statement of financial position. It also demonstrates the financial effects of a possible setting off of financial instruments from netting agreements, enforceable global netting agreements or similar agreements.
€ million I II I + II Related amounts not
set off in the balance sheet
Net amount
Gross amounts of recognized
financial assets /
liabilities
Gross amounts of recognized
financial assets /
liabilities set off in the
balance sheet
Net amounts of financial
assets /liabilities
presented in the balance
sheet
Financial instruments
Cash collateral received
Dec. 31, 2013Derivatives with a positive market value 22.8 –0.7 22.1 –0.8 – 21.3
Derivatives with a negative market value –33.9 0.7 –33.2 0.8 – –32.4
Dec. 31, 2012Derivatives with a positive market value 12.7 –1.3 11.4 –3.5 – 7.9
Derivatives with a negative market value –21.5 1.3 –20.2 3.5 – –16.7
In addition to the amounts complying with the provisions on netting pursuant to IAS 32, the table also includes those amounts that are subject to netting agreements but may not be netted pursuant to IAS 32.
WACKER does not net any significant financial assets and liabilities. As a part of strategic hedging of international sales, WACKER closes out forward-exchange contracts prior to maturity by means of offsetting transactions. The strategic forward-exchange contract and the corresponding offsetting forward-exchange transaction are recognized as a net amount in accordance with IAS 32 criteria. In addition, general offsetting agreements, which apply only in cases of insolvency, have been concluded with a number of banks.
WACKER has not received any pledged cash security for positive market values of derivatives nor pledged any cash security for negative market values.
The net amount shows the amount of financial assets or liabilities that, despite netting and global netting agreements, is not received or must be paid in the event of insolvency.
256Wacker Chemie AGAnnual Report 2013
Consolidated Financial StatementsNotes of the WACKER Group

257Wacker Chemie AGAnnual Report 2013
Consolidated Financial StatementsNotes of the WACKER Group
21 Notes to the Statement of Cash FlowsCash flow from operating activities is calculated using the indirect method, which adjusts the relevant changes in statement-of-financial-position items for any exchange-rate effects and effects of changes in the scope of consolidation. This means that changes to the relevant statement-of-financial-position items cannot be reconciled with the corresponding values based on the published consolidated statements of financial position.
In the case of cash flow from investing activities, the actual outflows of funds are recognized. As a result, it is also not possible to reconcile these figures with the additions to investments in the consolidated statement of financial position. If subsidiaries or business activities are acquired or sold, the effects of these transactions are shown as separate items in the state-ment of cash flows. Investment in securities falling due in more than three months is reported separately under cash flow from investing activities because, in economic terms, these trans actions are considered an element of liquidity.
The Group is financed mainly by bank loans granted in the form of loan commitments. Within the defined approval limits for loan commitments, our utilization of credit may be subject to considerable fluctuations both within a given year and over several years. The raising and repayment of loans in foreign currencies are translated at the exchange rate prevailing as of the time of transaction, with the result that here, too, it is not possible to reconcile all the in-flows and outflows with the changes in financial liabilities in the statement of financial position.
For more details on the composition of funds made up of cash and cash equivalents, see Note 11
Other Non Cash Expenses and Income
€ million 2013 2012
SILICONES –11.8 –75.2
POLYMERS –0.4 –0.7
BIOSOLUTIONS – –0.2
POLYSILICON –14.4 18.2
SILTRONIC –4.7 7.5
Other –12.6 –30.6
–43.9 –81.0

258Wacker Chemie AGAnnual Report 2013
Consolidated Financial StatementsNotes of the WACKER Group
22 Explanatory Notes on Segment ReportingThe Group’s segment reporting is geared toward the internal organizational and reporting structure. WACKER reports on five operating segments (Siltronic, Silicones, Polymers, Poly-silicon and Biosolutions), which are organized and managed autonomously on the basis of the type of products they offer and their different risk and income structures. Any activities not assigned to an operating segment are shown under “Other.” Currency translation results that cannot be assigned to a segment are likewise shown in this item. In 2013, the Bio solutions segment for the first time passed the thresholds set down in IFRS 8, thus officially becoming subject to reporting requirements. As WACKER had previously opted to report on the Bio-solutions segment in view of its specific product and customer structure, segment reporting did not change compared with the previous year.
Items in the statement of financial position and statement of income are assigned to the operating segments in accordance with the commercial power of disposition. Assets used jointly by several segments are generally shown under “Other” if they cannot be assigned clearly to a particular segment. A similar approach is adopted for borrowed funds. For the geographical regions, the assets and liabilities are assigned in accordance with where the respective Group company’s site is located. Sales are classified in accordance with both the customer’s location and the respective Group company’s site.
WACKER measures the segments’ success using the segment profitability variable EBITDA. EBITDA is calculated by adjusting EBIT for depreciation and amortization, impairments, and write-ups. EBIT consists of the gross result from sales, selling and general administrative expenses, research and development expenses, and other operating income and expenses less income from investments in joint ventures and associates and other income from investments.
Asset additions, depreciation, amortization and write-ups refer to intangible assets, to prop-erty, plant and equipment, to investment property and to financial assets. Internal sales show the sales that are generated between the segments. They are settled mainly on the basis of market prices or planned cost of sales. Segment information is based on the same pre sentation and accounting methods used for the consolidated financial statements. Receivables and liabilities, provisions, income, expenses, and results between the segments are eliminated in the course of consolidation.
As a rule, the assets reported for the segments encompass all of their assets. Loans, cash and cash equivalents, and deferred tax assets, however, are allocated to the “Other” segment.
The liabilities shown for the segments represent all of their liabilities – except deferred tax liabilities, which are shown under “Other.” The Group’s financial liabilities are allocated to individual segments in proportion to the segment assets.
Several non-core organizational units were reorganized within the segments effective January 1, 2013. WACKER’s salt business, the sales and profit for which were previously reported under WACKER POLYSILICON, is now treated as part of the “Other” segment. In 2013, sales from this business to be recognized in the “Other” segment reached a euro amount in the double-digit millions, making a positive contribution to earnings. There were effects of a similar magnitude in the previous year and no adjustment was made. In addition, internal cost allocation between the segments was harmonized, causing the volume of internal sales reported for the segments to decrease. The decrease caused the internal sales figures for 2012 to drop by around € 100 million.

259Wacker Chemie AGAnnual Report 2013
Consolidated Financial StatementsNotes of the WACKER Group
Important valuation changes not recognized through profit or loss include changes in the market value of derivative financial instruments (cash flow hedging) and changes in value from the remeasurement of defined benefit pension plans.
Of the changes in the market value of derivative financial instruments from cash flow hedging, € 5.9 million (2012: € 6.6 million) is attributable to the Siltronic segment and € 2.1 mil-lion (2012: € –0.1 million) to “Other.” The changes in value from the remeasurement of defined ben efit pension plans are distributed among the segments as follows: € 28.4 million (2012: €–52.1 million) for the Silicones segment; € 11.1 million (2012: € – 21.4 million) for the Polymers segment; € 2.6 million (2012: € – 4.9 million) for the Biosolutions segment; € 18.7 million (2012: € –44.4 million) for the Polysilicon segment; € 40.6 million (2012: € –55.9 million) for the Siltronic segment; and € 51.4 million (2012: € – 100.0 million) for the Other segment.
In addition to Germany, the USA and China are the only countries in which WACKER generates significant sales from a Group viewpoint. Measured in relation to the location of the selling unit in the USA, sales amounted to € 609.8 million (2012: € 672.5 million). Measured by the respective customer location in the USA and China, the sales generated were € 604.4 mil lion (2012: € 681.2 million) and € 754.0 million (2012: € 717.3 million), respectively. There are no major customers that account for large proportions of our sales.
The reconciliation of the segments’ aggregate results with the net income for the year is shown in the following list:
Reconciliation of Segment Results (EBIT )
€ million 2013 2012
Operating result of reporting segments 112.3 266.7
Consolidation 2.0 –0.1
Group EBIT 114.3 266.6
Financial result –83.3 –62.7
Income before taxes 31.0 203.9
Income taxes –24.7 –89.2
Net income for the year 6.3 114.7

260Wacker Chemie AGAnnual Report 2013
Consolidated Financial StatementsNotes of the WACKER Group
23 Breakdown of Shareholdings / Key Indicators of Joint Ventures and Associated Companies
Unless otherwise stated, the following figures for international subsidiaries were calculated in accordance with IFRS.
Affiliated Companies
Serial number
Identifier*
Equity in € ’000
Net in-come for the year in € ’000
Capital share in %
Held by serial
number 1
Germany
1 Alzwerke GmbH, Munich a), b) 7,160 – 100 0
2 DRAWIN Vertriebs-GmbH, Hohenbrunn a), b) 5,016 – 100 0
3 W.E.L.T. Reisebüro GmbH, Munich 2 156 126 51 0
4 Wacker-Chemie Versicherungsvermittlung GmbH, Munich a), b) 26 – 100 0
5 Wacker-Chemie Beteiligungsfinanzierungs GmbH, Munich 30 – 100 22
6 Wacker Polysilicon Geschäftsführungs GmbH, Nünchritz 27 – 100 0
7 Wacker-Chemie Erste Venture GmbH, Munich 80 – 100 22
8 Wacker-Chemie Zweite Venture GmbH, Munich 36 – 100 0
9 Wacker-Chemie Dritte Venture GmbH, Munich a), b) 387,727 – 100 0
10 Wacker-Chemie Sechste Venture GmbH, Munich 28 – 100 0
11 Wacker Biotech GmbH, Jena a), b) 290 – 100 0
12 Wacker-Chemie Siebte Venture GmbH, Munich 25 – 100 0
13 Wacker-Chemie Achte Venture GmbH, Munich a), b) 2,753 – 100 0
14 Siltronic AG, Munich a), b) 718,048 – 90 9
10 0
Rest of Europe15 Wacker Chemicals Finance B.V.,
Krommenie / Amsterdam, Netherlands 919,900 4,505 100 0
16 Wacker-Chemicals Ltd., Egham, Surrey, Great Britain 812 678 100 0
17 Wacker-Chemie Italia S.r.L., Peschiera Borromeo / Milan, Italy 2,395 783 100 0
18 Wacker-Chemie Benelux B.V., Krommenie / Amsterdam, Netherlands 394 376 100 15
19 Wacker Chimie S.A.S., Lyon, France 492 293 100 0
20 Wacker-Kemi AB, Solna, Sweden 703 519 100 0
21 Wacker Química Ibérica, S.A., Barcelona, Spain 317 178 100 0
22 Siltronic Holding International B.V., Krommenie / Amsterdam, Netherlands 304,427 33,409 100 14
23 Wacker-Chemie S.r.o., Prague, Czech Republic 3,171 158 100 0
24 Wacker-Chemie Polska Sp. z o.o., Warsaw, Poland 393 249 100 0
25 Wacker-Chemie Hungária Kft., Budapest, Hungary 294 98 100 0
26 OOO Wacker Chemie RUS, Moscow, Russia 1,081 773 100 0
27 Wacker Chemicals Norway AS, Holla, Norway 37,219 933 100 15
The Americas28 Wacker Química do Brasil Ltda., São Paulo, Brazil 2,002 –7,482 100 0
29 Wacker Mexicana S.A. de C.V., Mexico, D.F., Mexico 1,178 519 100 0
30 Wacker Chemical Corp., Adrian, Michigan, USA 950,169 15,052 100 15
31 Wacker Polysilicon North America L.L.C., Cleveland, Tennessee, USA 424,298 –49,812 100 30
32 Siltronic Corp., Portland, Oregon, USA 19,997 6,214 100 22
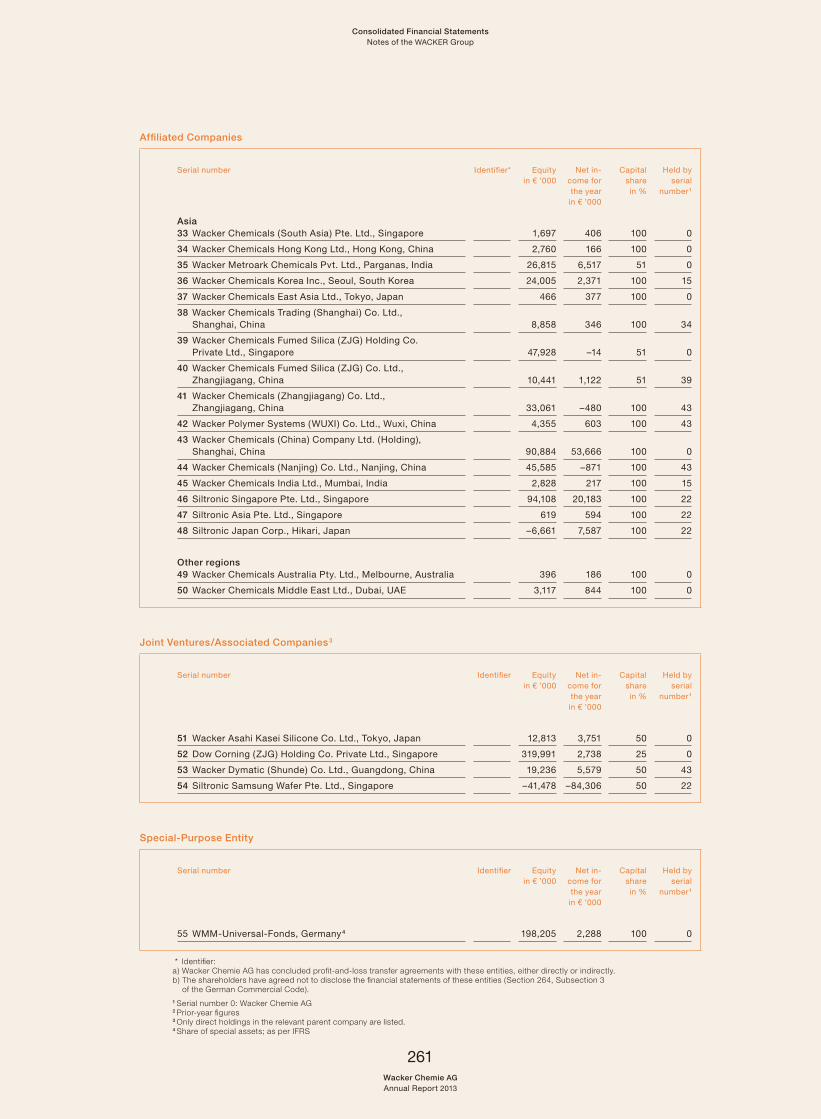
261Wacker Chemie AGAnnual Report 2013
Consolidated Financial StatementsNotes of the WACKER Group
Affiliated Companies
Serial number
Identifier*
Equity in € ’000
Net in-come for the year in € ’000
Capital share in %
Held by serial
number 1
Asia33 Wacker Chemicals (South Asia) Pte. Ltd., Singapore 1,697 406 100 0
34 Wacker Chemicals Hong Kong Ltd., Hong Kong, China 2,760 166 100 0
35 Wacker Metroark Chemicals Pvt. Ltd., Parganas, India 26,815 6,517 51 0
36 Wacker Chemicals Korea Inc., Seoul, South Korea 24,005 2,371 100 15
37 Wacker Chemicals East Asia Ltd., Tokyo, Japan 466 377 100 0
38 Wacker Chemicals Trading (Shanghai ) Co. Ltd., Shanghai, China 8,858 346 100 34
39 Wacker Chemicals Fumed Silica (ZJG) Holding Co. Private Ltd., Singapore 47,928 –14 51 0
40 Wacker Chemicals Fumed Silica (ZJG) Co. Ltd., Zhangjiagang, China 10,441 1,122 51 39
41 Wacker Chemicals (Zhangjiagang) Co. Ltd., Zhangjiagang, China 33,061 –480 100 43
42 Wacker Polymer Systems (WUXI) Co. Ltd., Wuxi, China 4,355 603 100 43
43 Wacker Chemicals (China) Company Ltd. (Holding), Shanghai, China 90,884 53,666 100 0
44 Wacker Chemicals (Nanjing) Co. Ltd., Nanjing, China 45,585 –871 100 43
45 Wacker Chemicals India Ltd., Mumbai, India 2,828 217 100 15
46 Siltronic Singapore Pte. Ltd., Singapore 94,108 20,183 100 22
47 Siltronic Asia Pte. Ltd., Singapore 619 594 100 22
48 Siltronic Japan Corp., Hikari, Japan –6,661 7,587 100 22
Other regions49 Wacker Chemicals Australia Pty. Ltd., Melbourne, Australia 396 186 100 0
50 Wacker Chemicals Middle East Ltd., Dubai, UAE 3,117 844 100 0
Joint Ventures / Associated Companies 3
Serial number
Identifier
Equity in € ’000
Net in-come for the year in € ’000
Capital share in %
Held by serial
number 1
51 Wacker Asahi Kasei Silicone Co. Ltd., Tokyo, Japan 12,813 3,751 50 0
52 Dow Corning (ZJG) Holding Co. Private Ltd., Singapore 319,991 2,738 25 0
53 Wacker Dymatic (Shunde) Co. Ltd., Guangdong, China 19,236 5,579 50 43
54 Siltronic Samsung Wafer Pte. Ltd., Singapore –41,478 –84,306 50 22
SpecialPurpose Entity
Serial number
Identifier
Equity in € ’000
Net in-come for the year in € ’000
Capital share in %
Held by serial
number 1
55 WMM-Universal-Fonds, Germany 4 198,205 2,288 100 0
* Identifier:a) Wacker Chemie AG has concluded profit-and-loss transfer agreements with these entities, either directly or indirectly.b) The shareholders have agreed not to disclose the financial statements of these entities (Section 264, Subsection 3
of the German Commercial Code).1 Serial number 0: Wacker Chemie AG 2 Prior-year figures3 Only direct holdings in the relevant parent company are listed.4 Share of special assets; as per IFRS

262Wacker Chemie AGAnnual Report 2013
Consolidated Financial StatementsNotes of the WACKER Group
Key Figures for Joint Ventures
€ million 2013 2012
Total Attributable to WACKER
Total Attributable to WACKER
Sales 262.4 131.2 318.5 159.3
Operating result –56.3 –28.2 –24.0 –12.0
Result after taxes –74.9 –37.5 –44.9 –22.4
Noncurrent assets 338.3 169.2 461.5 230.8
Current assets 96.8 48.4 124.4 62.3
435.1 217.6 585.9 293.1
Equity –9.4 –4.7 76.8 38.5
Noncurrent liabilities 348.5 174.2 400.6 200.4
Current liabilities 96.1 48.0 108.5 54.4
435.2 217.5 585.9 293.3
Key Figures for Associated Companies
€ million 2013 2012
Total Attributable to WACKER
Total Attributable to WACKER
Sales 258.0 64.5 445.0 111.2
Operating result 27.4 6.9 108.7 27.2
Result after taxes 2.7 0.7 66.9 16.8
Noncurrent assets 841.5 210.4 905.0 226.2
Current assets 95.6 23.9 94.5 23.6
937.1 234.3 999.5 249.8
Equity 320.0 80.0 321.9 80.4
Noncurrent liabilities 380.2 95.1 361.9 90.5
Current liabilities 236.9 59.2 315.7 78.9
937.1 234.3 999.5 249.8
24 Related Party DisclosuresIAS 24 stipulates that parties which control, or are controlled by, Wacker Chemie AG must be disclosed unless they are already included in Wacker Chemie AG’s consolidated financial statements as a consolidated company. A shareholder is deemed to have control if it has more than half of the voting rights in Wacker Chemie AG or, by virtue of provisions in the Articles of Association or contractual arrangements, has the possibility of controlling the financial and business policy of the WACKER Group’s Executive Board.
In the year under review, the WACKER Group was affected by the disclosure obligations under IAS 24 in respect of the business relations with Wacker Chemie AG’s major share-holders and its Executive and Supervisory Board members. The principles of IAS 24 also apply to all transactions with non-consolidated subsidiaries, associated companies and joint ventures, since Wacker Chemie AG exercises significant influence over them.

263Wacker Chemie AGAnnual Report 2013
Consolidated Financial StatementsNotes of the WACKER Group
The WACKER Group is controlled by its majority shareholder, Dr. Alexander Wacker Familien-gesellschaft mbH, which holds over 50 percent of the voting shares in Wacker Chemie AG.
Provision of services between Wacker Chemie AG and its majority shareholder Dr. Alexander Wacker Familiengesellschaft mbH, as well as with the shareholders of Dr. Alexander Wacker Familiengesellschaft mbH and their close family members, is of subordinate importance, and concerns the renting of office space and exchange of services. None of these services is of significant business scope. The provision of services takes place at standard market terms.
Wacker Chemie AG’s pension fund is also considered a related party pursuant to IAS 24. Provision of services takes place between the two entities in the area of company pension plan benefits. WACKER makes payments to plan assets to cover pension obligations. Wacker Chemie AG also rents the headquarters building and the property on which it stands from a subsidiary of Pensionskasse der Wacker Chemie VVaG. The total expenditures amounted to € 41.4 million (2012: € 40.0 million), while the receivables from the pension fund totaled € 40.3 million (2012: € 35.3 million).
Apart from that, WACKER Group companies have not conducted any significant transactions whatsoever with members of Wacker Chemie AG’s Executive or Supervisory Boards or with any other key management personnel or with companies of which these persons are members of executive or supervisory bodies. The same applies to close relatives of the aforementioned persons.
Dr. Alexander Wacker Familiengesellschaft mbH, Munich, informed Wacker Chemie AG on June 7, 2006, that it holds over 50 percent of the voting shares in Wacker Chemie AG. Blue Elephant Holding GmbH, Pöcking, informed Wacker Chemie AG on April 12, 2006, that it holds over 10 percent of the voting shares in Wacker Chemie AG.
Business with joint ventures and associates, the pension fund, and non-consolidated sub-sidiaries is conducted under conditions that are customary between outside third parties (arm’s length transactions). For joint-venture and associated-company product shipments, contractually agreed transfer-price formulas have been defined.
Related Party Disclosures
€ million 2013 2012
Income Expenses
Receivables
Liabilities Income Ex-penses
Receiv-ables
Liabilities
Associated companies 5.7 81.7 2.0 7.6 4.7 128.3 – 6.2
Joint ventures 69.0 51.5 25.3 3.9 88.1 54.6 16.8 4.3
Other – – – 0.2 – – – 0.3
Transactions with joint ventures and associates relate to such supplies and services as arise during the normal course of business (for example in connection with sales revenue, license revenue and administrative expense allocations). Joint ventures and associates submitted invoices for material purchases and commissions. Any guarantees or other security pledges are reported under other financial obligations. See Note 17.

264Wacker Chemie AGAnnual Report 2013
Consolidated Financial StatementsNotes of the WACKER Group
In addition, there are loans to joint ventures totaling € 231.6 million (2012: € 256.2 million). These loans contain capitalized interest income for the period under review of € 10.1 million (2012: € 5.9 million).
Information Regarding Compensation of the Supervisory and Executive Boards:
Compensation for the Executive and Supervisory Boards
€ Fixed compensation
Variable compensation
Pensions 1 Total
Executive Board compensation 2013 2,273,953 1,945,000 1,829,267 6,048,220
Executive Board compensation 2012 2,593,532 2,976,000 1,856,216 7,425,748
Pension commitments for active members of the Executive Board 2013 18,136,630
Pension commitments for active members of the Executive Board 2012 23,875,776
Compensation for former members of the Executive Board and their surviving dependents 2013 2,162,941
Compensation for former members of the Executive Board and their surviving dependents 2012 1,346,172
Pension commitments for former members of the Executive Board and their surviving dependents 2013 28,152,095
Pension commitments for former members of the Executive Board and their surviving dependents 2012 21,932,911
Supervisory Board compensation 2013 1,758,482 – – 1,758,482
Supervisory Board compensation 2012 1,758,000 – – 1,758,000
1 Pensions include the interest cost as well as the service cost.
Detailed information about Executive Board compensation is contained in the compensation report, which forms part of the management report. German commercial law (HGB) requires the inclusion of this information in the notes to the consolidated financial statements.
Other business relations with members of the Supervisory and Executive Boards comprise the purchase and sale of shares in Wacker Chemie AG. Such transactions take place on customary market terms and conditions. These transactions were published both in the German register of companies and on the Wacker Chemie AG website at: www.wacker.com /
directorsdealings.
The members of Wacker Chemie AG’s Supervisory and Executive Boards are listed on the following pages.
Munich, March 5, 2014Wacker Chemie AG
Rudolf Staudigl Tobias Ohler
Joachim Rauhut Auguste Willems

265Wacker Chemie AGAnnual Report 2013
Consolidated Financial Statements
Supervisory Board
Dr. PeterAlexander Wacker 1, 2, 3
ChairmanStarnbergFormer President & CEOof Wacker Chemie AG, businessman
Chairman of the Supervisory Board and Advisory CouncilGiesecke & Devrient GmbH
Chairman of the Administrative Council and Board of Trusteesifo Institute – Leibniz Institute for Economic Research at the University of Munich
Anton Eisenacker* 1, 2, 3
Deputy ChairmanPerachMaster Chemical Technician
Peter Áldozó*BurghausenHR Specialist
Dr. Gregor Biebl(since May 8, 2013)MunichUndersecretaryBavarian Ministry of Finance
Matthias BieblMunichAttorney and bank in-house lawyerUniCredit Bank AG
Dr. Werner Biebl(until May 8, 2013)MunichChief Public Prosecutor (retired), Managing Director of Dr. Alexander Wacker Familiengesellschaft mbH
Dagmar Burghart*(since May 8, 2013)KirchdorfIndustrial Mechanic
Deputy Chairwoman of the Supervisory BoardPensionskasse der Wacker Chemie VVaG
Marko Fartelj*(until May 8, 2013) KirchdorfMachine Operator
Konrad Kammergruber*BurghausenDirector of Infrastructure Services
EduardHarald Klein*NeuöttingOperator
Manfred Köppl* 1
KirchdorfIndustrial Mechanic
FranzJosef Kortüm1, 2
MunichFormer Chairman of the Executive Board of Webasto SE
Deputy Chairman of the Supervisory Board Webasto SE
Member of the Supervisory BoardSchaeffler AG
Chairman of the Advisory CouncilBrose Fahrzeugteile GmbH & Co. KG (since July 2013)
Seppel Kraus*OlchingRegional head of the IG BCE labor union, Bavaria
Member of the Supervisory BoardNovartis Deutschland GmbHHexal AGGerresheimer AG
Harald Sikorski*MunichAltötting District Chairman of the IG BCE labor union
Member of the Supervisory BoardSiltronic AG**
* Employee representative** Affiliated company
1 Mediation Committee (Chairman: Dr. Peter-Alexander Wacker)2 Executive Committee (Chairman: Dr. Peter-Alexander Wacker)3 Audit Committee (Chairman: Dr. Bernd W. Voss)
266Wacker Chemie AGAnnual Report 2013
Consolidated Financial StatementsSupervisory Board
Dr. Thomas StrüngmannTegernseeCo-Managing Director, ATHOS Service GmbH
Dr. Bernd W. Voss 3
Kronberg i.T.Former member of the Board of Managing Directors of Dresdner Bank AG
Member of the Supervisory BoardContinental AG
Member of the Central Advisory BoardCommerzbank AG (until December 31, 2013)
Dr. Susanne WeissMunich Attorney, and a Partner in the law firm Weiss Walter Fischer-Zernin
Chairwoman of the Supervisory BoardROFA AG
Member of the Supervisory Board and Advisory CouncilGiesecke & Devrient GmbH
Member of the Supervisory BoardUniCredit Bank AGHypoVereinsbank AG (until December 31, 2013)Porr AG, AustriaSchattdecor AG (since June 24, 2013)
Member of the Advisory Council Alu-Sommer GmbH, Austria(since September 2013)
Prof. Dr. ErnstLudwig WinnackerMunichProfessor emeritus of Biochemistry at LMU, Munich, Secretary General HFSP Human Frontier Science Program, Strasbourg
Chairman of the Supervisory BoardMediGene AG (until July 16, 2013)
Member of the Supervisory BoardBayer AG
* Employee representative** Affiliated company
1 Mediation Committee (Chairman: Dr. Peter-Alexander Wacker)2 Executive Committee (Chairman: Dr. Peter-Alexander Wacker)3 Audit Committee (Chairman: Dr. Bernd W. Voss)

267Wacker Chemie AGAnnual Report 2013
Consolidated Financial Statements
Executive Board
Dr. Rudolf Staudigl
President & CEOWACKER POLYSILICONExecutive PersonnelCorporate DevelopmentCorporate CommunicationsInvestor RelationsCorporate AuditingLegalCompliance
Chairman of the Supervisory BoardSiltronic AG ** (until February 26, 2013)Pensionskasse der Wacker Chemie VVaG
Member of the Supervisory BoardGroz-Beckert KG
Member of the Advisory Council, BavariaDeutsche Bank AG
Dr. Tobias Ohler
WACKER POLYMERSHuman Resources (Personnel Director)Technical Procurement & LogisticsRaw Materials ProcurementRegion: Asia
Member of the Supervisory BoardSiltronic AG ** (since February 26, 2013)
Dr. Joachim Rauhut
SILTRONICCorporate Accounting and Tax Corporate ControllingCorporate Finance and InsuranceCorporate EngineeringInformation TechnologyRegion: The Americas
Member of the Supervisory BoardSiltronic AG ** (until February 26, 2013)Pensionskasse der Wacker Chemie VVaGMTU Aero Engines AGB. Braun Melsungen AG
Chairman of the Supervisory Board Siltronic AG ** (since February 26, 2013)
Member of the Advisory CouncilJ. Heinrich Kramer Holding GmbH
Member of the Regional Advisory Council SouthCommerzbank AG
Auguste Willems
WACKER SILICONESWACKER BIOSOLUTIONSSales & DistributionCorporate Research & DevelopmentIntellectual PropertySite Management Corporate SecurityEnvironment, Health, Safety Product StewardshipRegions: Europe, Middle East
Member of the Supervisory BoardSiltronic AG **
Member of the Bavarian State Branch Advisory CommitteeTÜV Süd AG
** Affiliated company

268Wacker Chemie AGAnnual Report 2013
Consolidated Financial Statements
Corporate Governance Report and Declaration on Corporate Management
Corporate governance is an important part of a company’s success, responsible corporate management and supervision. Wacker Chemie AG attaches great importance to the rules of proper corporate governance. In this report, the Executive Board provides details – also for the Supervisory Board – on corporate governance in accordance with Item 3.10 of the German Corporate Governance Code (Code) and Section 289a (1) of the German Commercial Code (HGB).
Declaration of Conformity and Corporate Governance ReportingIn the 2013 fiscal year, the Executive and Supervisory Boards dealt intensively with the company’s corporate governance and the alterations to the Code published on May 13, 2013. The Executive Board and the Supervisory Board resolved on December 10, 2013 to issue the following Declaration of Conformity as per Section 161 of the German Stock Corporation Act (AktG). The Declaration of Conformity has since been made permanently available to the general public on the company’s website.
The 2013 Declaration of Conformity Issued by Wacker Chemie AG’s Executive and Supervisory BoardsGeneral Declaration Pursuant to Section 161 of the German Stock Corporation Act
In December 2012, the Executive Board and the Supervisory Board of Wacker Chemie AG issued a declaration of conformity pursuant to Section 161 of the German Stock Corporation Act. Since that time, Wacker Chemie AG has complied with the recommendations of the German Corporate Governance Code in the version dated May 15, 2012, with the following exceptions, and will continue to comply with the recommendations of the Code in the ver-sion dated May 13, 2013, except as follows:
Exceptions a) D & O Insurance Deductible for Supervisory Board Members German law and a company’s Articles of Association set clear limits in regards to the Super-visory Board’s ability to exert influence on the business activities of a stock corporation. Pursuant to Section 76 (1) of the German Stock Corporation Act, the Executive Board is responsible for independently managing the corporation. A Supervisory Board is instrumental in defining the main features of corporate strategy. However, beyond this contribution, the Supervisory Board’s abilities are limited in terms of influencing operations or the implemen-tation of corporate strategy. The same applies to measures taken to avert damage or loss to the company. Since the Supervisory Board members receive a relatively low representation allowance compared with the Executive Board members’ compensation, we do not consider a deductible to be reasonable for members of the Supervisory Board.
b) Severance Pay Cap We will comply with this recommendation of the Code as of January 2014.

269Wacker Chemie AGAnnual Report 2013
Consolidated Financial StatementsCorporate Governance Report and Declaration on Corporate Management
c) Appropriate Representation of Women on the Executive Board The considerable importance that Wacker Chemie AG attaches to diversity extends to Ex-ecutive Board membership. Nonetheless, expertise – including experience gained abroad – and qualifications are the key criteria here. For this reason, we do not consider it expedient to prioritize “the aim of appropriate representation of women” over expertise and qualifications.
d) Formation of a Nomination Committee within the Supervisory Board The Supervisory Board is to establish a Nomination Committee that is exclusively composed of shareholder representatives and whose task it is to make recommendations to the Super-visory Board with regard to candidates suitable for proposal to the Annual Shareholders’ Meeting.
We do not comply with this recommendation because, in view of our shareholder structure, we do not believe that the formation of such a committee is appropriate. Due to the majority situation, nominations to the Supervisory Board must be agreed with the majority share-holder in any case, so that an additional nomination committee would not serve to increase efficiency.
e) Announcement to the Shareholders of Proposed Candidates for the Chair of the Supervisory Board According to this recommendation, shareholders are to be informed of any candidates for the Supervisory Board chair even though, as a rule, the Supervisory Board has not yet been appointed. Under German law, the Supervisory Board chair must be elected by, and from among, the Supervisory Board members. There is no legal requirement to announce the candidates for the chair from among a yet-to-be-appointed group of Supervisory Board members. Furthermore, this would result in a de facto predetermination, which is also not provided for under German law. For these reasons, we do not comply with this recommendation.
f ) Naming of a Specific Target Number of Independent Members of the Supervisory Board In its current composition, Wacker Chemie AG’s Supervisory Board complies with the requirements concerning an adequate number of independent supervisory board members. What is more, in its future recommendations to the shareholders in respect of appointments, the Supervisory Board will make sure it proposes what it considers to be an adequate number of independent candidates. Setting a specific target for the number of independent Supervisory Board members would not only restrict the selection of suitable candidates for that body, but also curb the rights of the shareholders to select those candidates that they consider the most appropriate for the task. For these reasons, we do not comply with this recommendation.
Corporate Governance Reporting Shareholders and Annual Shareholders’ Meeting
Transparent Information for Shareholders and the Public WACKER’s aim is to inform all of the company’s target groups – whether shareholders, share-holder representatives, analysts, media, or the interested general public – promptly and without preference. We regularly publicize important dates for the company in a financial calendar published in our Annual Report, in the interim reports and on our website. Capital market participants are in close contact with our Investor Relations team. We inform

270Wacker Chemie AGAnnual Report 2013
Consolidated Financial StatementsCorporate Governance Report and Declaration on Corporate Management
investors and analysts about the current and future development of business in telephone conferences held whenever a quarterly report is published. We regularly attend roadshows and investors’ conferences and organize a “Capital Markets Day” once a year. Important presentations can be viewed freely on the internet, where all of the press releases and ad-hoc disclosures in both German and English, the online version of the Annual Report, all interim reports and the Sustainability Report can also be found. Further information is provided by our online customer magazine, media library and Podcast Center. www.wacker.com
Annual Shareholders’ Meeting The Annual Shareholders’ Meeting provides an efficient and inclusive forum for informing shareholders about the company’s situation. Even before the Annual Shareholders’ Meeting begins, shareholders receive important information about the previous fiscal year in the Annual Report. The agenda items are described and the conditions of attendance explained in the invitation to the Annual Shareholders’ Meeting. The notice of the Annual Shareholders’ Meeting – together with all legally prescribed reports and documents, including the Annual Report (of which the consolidated financial statements and the combined management report form part) – as well as the annual financial statements of Wacker Chemie AG are also available on the company’s website. After the Annual Shareholders’ Meeting, we publish the attendance figures and the results of the votes on the internet. All these communication measures contribute to the regular exchange of information with our shareholders. WACKER helps its shareholders exercise their voting rights by giving them the option of casting their vote either in person or by proxy. Proxies are available to exercise shareholders’ voting rights as instructed and can also be contacted during the Annual Shareholders’ Meeting.
Working Methods of the Executive and Supervisory Boards Wacker Chemie AG has a dual management system as prescribed in the German Stock Corporation Act. It consists of the Executive Board, which manages the company, and the Supervisory Board, which supervises the company. These two bodies are kept strictly sepa-rate from one another with regard to both their membership and their spheres of competence. The Executive and Supervisory Boards collaborate closely to ensure WACKER’s sustainable long-term success.
Executive Board The Executive Board currently consists of four members. The Executive Board bears com-plete responsibility for managing the company and represents Wacker Chemie AG in all dealings with third parties. The Executive Board’s actions and decisions are driven by the company’s interest and the aim to sustainably increase the Group’s value. With this goal in mind, the Executive Board determines the WACKER Group’s strategic alignment. It then steers and monitors this by allocating funds, resources and capacities, and by supporting and overseeing the operating units. The Executive Board also ensures compliance with legal requirements and establishes an appropriate risk management system.
The members of the Executive Board bear joint responsibility for managing the company, but are fully responsible for managing their respective units. All Executive Board decisions require a simple majority. In the case of a tie of votes, the president & CEO has the deciding vote. However, he / she does not have the right to veto Executive Board resolutions.
Close Collaboration between the Executive and Supervisory Boards The Executive and Supervisory Boards work together closely to promote the interests of the company. Their common goal is the sustainable growth of the company and the enhance-ment of its value. The Executive Board reports to the Supervisory Board regularly, promptly and comprehensively about all issues of strategy, planning, business development, risk exposure, risk management and compliance that are relevant to the company. Between meetings, the Supervisory Board chairman maintains contact with the Executive Board, in particular with the president & CEO, consulting with that body on the above-mentioned

271Wacker Chemie AGAnnual Report 2013
Consolidated Financial StatementsCorporate Governance Report and Declaration on Corporate Management
issues. The Executive Board explains to the Supervisory Board any deviations in the course of business from the approved plans and objectives, and specifies the reasons for them.
Certain transactions defined in the Rules of Procedure of Wacker Chemie AG’s Executive Board require the Supervisory Board’s approval prior to their conclusion. These include approving the annual budget ( including financial and investment planning), acquiring and disposing of shares in companies, establishing new production or business units, or sus-pen ding existing ones, and concluding sizable long-term loans.
Supervisory Board The Supervisory Board appoints, oversees and advises the Executive Board and is directly involved in any decisions of crucial importance to WACKER. Fundamental decisions on the company’s development require Supervisory Board approval.
The Supervisory Board comprises 16 members. In compliance with the German Co-Deter-mination Act (MitbestG), it has an equal number of shareholder and employee represent-atives. The Supervisory Board appoints the members of the Executive Board and oversees and advises them on the management of the company.
As members of the Supervisory Board cannot simultaneously sit on the Executive Board, this structure ensures a high degree of independence in monitoring the Executive Board.
Where necessary, in particular when forming resolutions in respect of personnel, the Supervisory Board convenes without the Executive Board.
Committees Increase the Supervisory Board’s Efficiency The Supervisory Board has constituted three professionally qualified committees to help it perform its duties optimally. The work of those committees is reported on regularly at Supervisory Board meetings.
The Executive Committee prepares the Supervisory Board’s personnel decisions, especially the appointment and dismissal of Executive Board members and the nomination of the president & CEO. In addition, it deals with contracts with Executive Board members and develops the system for Executive Board compensation, on the basis of which the meeting of the full Supervisory Board determines the compensation payable to Executive Board members. The Executive Committee consists of the Chairman of the Supervisory Board, Dr. Peter-Alexander Wacker, and Supervisory Board members Anton Eisenacker and Franz-Josef Kortüm.
The Audit Committee does the groundwork for the Supervisory Board’s decisions on the adoption of the annual financial statements and the approval of the consolidated financial statements. Its work also includes an audit of the consolidated interim financial statements for the first half-year, discussion of the quarterly reports, and issues involving risk manage-ment. In connection with this, the committee is obliged to pre-audit the annual financial statements, the consolidated financial statements, the combined management report and the proposal for the appropriation of profits. In particular, this committee monitors the accounting processes, the company’s compliance with laws and regulations, and the effectiveness of the internal control, risk management and auditing systems. It performs these tasks in close cooperation with the external auditors. The Audit Committee also pre-pares the agreement with the external auditors and takes suitable steps to monitor the auditors’ independence and the services they deliver. On this basis, it gives the Supervisory Board a recommendation as to which auditors it should propose to the Annual Shareholders’ Meeting. The members of this committee are Dr. Bernd W. Voss, Dr. Peter-Alexander Wacker and Anton Eisenacker. The chairman of the Audit Committee is Dr. Bernd W. Voss, who has never served on the Executive Board and is independent. Dr. Voss has extensive expertise
272Wacker Chemie AGAnnual Report 2013
Consolidated Financial StatementsCorporate Governance Report and Declaration on Corporate Management
and experience in accounting and auditing as former CFO of Dresdner Bank AG and thanks to his many years of service on the audit committees of other companies’ supervisory boards.
The Group also has a statutory Mediation Committee, the tasks of which are stipulated by German law. Chaired by Dr. Peter-Alexander Wacker, this committee also consists of Anton Eisenacker, Franz-Josef Kortüm and Manfred Köppl.
Key Corporate Management Practices Compliance as a Key Managerial Duty of the Executive Board
At WACKER, managerial and monitoring duties include ensuring that the company complies with legal requirements and that employees observe internal company regulations. The Group’s compliance policy is regularly reviewed and adapted.
WACKER’s compliance organization is responsible in this regard. The company has appointed and trained compliance officers in Germany, Norway, the USA, China, Japan, India, South Korea, Brazil, Mexico and Singapore, who hold regular training courses to inform employees of key legal provisions and internal regulations. They also serve as contacts whenever employ ees have questions or need advice about compliance. One focus of compliance man agement in 2013 continued to be in improving communication with the company’s international sites within the compliance organization and in training the local employees at those sites.
Responsible Care® and the Global Compact – Integral Parts of Corporate Management Two voluntary global initiatives form the basis for sustainable corporate management: the chemical industry’s Responsible Care ® initiative and the UN’s Global Compact. WACKER has been an active member of the Responsible Care ® initiative since 1991. Program participants are committed to continually improve health, safety and environmental performance on a voluntary basis – even in the absence of statutory requirements. WACKER is equally com-mitted to the UN’s Global Compact initiative. We observe the Global Compact’s ten principles, which address social and environmental standards, anticorruption and the protection of human rights. We also expect our suppliers to respect the principles of the Global Compact, and we evaluate them on this point in our risk assessments.
In 2011, WACKER created an internal Corporate Sustainability department that implements its voluntary commitments under Responsible Care ® and the Global Compact, and coordinates WACKER’s sustainability activities worldwide.
Social Commitments Companies can be commercially successful only if they have society’s trust. Consequently, WACKER takes its social responsibilities seriously toward communities near its sites and wherever people are in need around the world. We regularly promote and support a wide variety of charitable projects, organizations and initiatives. Our commitment covers activities relating to science, education, sport and various charities.
Further Information on Corporate Governance at WACKER Compliance with the Provisions of Section 15 of the German Securities Trading Act (WpHG)
We comply with the statutory provisions of Section 15 of the German Securities Trading Act. For a number of years, we have maintained an “ad-hoc publicity” coordination unit in which representatives of various specialist areas examine issues for their ad-hoc relevance. In this way, we guarantee that potential insider information is handled in accordance with the law. Employees required to access to insider information as part of their job are listed in an insider directory.

273Wacker Chemie AGAnnual Report 2013
Consolidated Financial StatementsCorporate Governance Report and Declaration on Corporate Management
Share Dealings by the Executive and Supervisory Boards Section 15a of the German Securities Trading Act stipulates that members of the Executive and Supervisory Boards and certain of their dependents are obliged to notify the German Federal Financial Supervisory Authority (BaFin) and the company of any purchase or sale of WACKER shares or any other rights related to such shares if an amount of € 5,000 is exceeded within one calendar year.
In 2013, members of the Supervisory Board and their dependents subject to reporting requirements gave notification of three sales and acquisitions of between 200 to 300 WACKER shares. The volumes of the individual transactions ranged from € 15,660 to € 22,400.
Blue Elephant Holding GmbH, which is majority-owned by Dr. Peter-Alexander Wacker (Supervisory Board Chairman of Wacker Chemie AG), holds over 10 percent of the shares in Wacker Chemie AG.
Dealing Responsibly with Opportunities and Risks Dealing responsibly with risks is an important part of good corporate governance. WACKER has in place an opportunity and risk management system to regularly identify and monitor material risks and opportunities. Its objective is to recognize risks at an early stage and minimize them through systematic risk management. The Executive Board informs the Super-visory Board regularly about existing risks and their development. The Audit Committee regularly reviews the accounting process and the effectiveness of the internal control, risk management and auditing systems. It is also involved in auditing the financial statements. The opportunity and risk management system is continuously being enhanced and adapted to meet changing conditions.
Accounting and Auditing As stipulated by the Corporate Governance Code, we have agreed with the auditors, KPMG AG Wirtschaftsprüfungsgesellschaft, Munich, that the Chairman of the Supervisory Board shall be informed without delay during the audit about any grounds for disqualification and/ or bias. In addition, the auditors shall immediately report all significant discoveries and events which concern the Supervisory Board’s duties. If, in the course of their audit activities, the auditors establish facts that reveal errors in the Declaration of Conformity pursuant to Section 161 of the German Stock Corporation Act, the Supervisory Board shall be notified accordingly and /or a note included in the audit report.
D & O insurance WACKER has concluded a financial liability insurance policy that also covers the activities of the Executive and Supervisory Board members ( i.e. D & O insurance). This insurance provides for the statutory deductible for the members of the Executive Board.
Targets for Supervisory Board Composition WACKER has always placed importance on having highly qualified individuals sit on its Super visory Board. Pursuant to Item 5.4.1 of the German Corporate Governance Code in the version of May 26, 2010, WACKER’s Supervisory Board resolved at its meeting of December 9, 2010 to set itself the following specific targets in respect of its composition, which also in-clude the qualifications, international experience and gender of Supervisory Board members:
1. An appropriate number of Supervisory Board members – at least one – should have international experience.
2. The Supervisory Board’s Rules of Procedure already deal extensively with members’ conflicts of interest. In addition, the Supervisory Board actively strives to prevent such conflicts of interest and will also take this goal into account when making recommendations to the Annual Shareholders’ Meeting.

274Wacker Chemie AGAnnual Report 2013
Consolidated Financial StatementsCorporate Governance Report and Declaration on Corporate Management
3. In the interests for even greater diversity, the Supervisory Board will strive to increase the number of female Supervisory Board members to at least two over the next two terms. In its bid to meet this goal, the Supervisory Board plans to appoint at least one female employee representative and at least one female shareholder representative.
The Supervisory Board’s Rules of Procedure already define an age limit.
As the Supervisory Board believes that an adequate number of its members are independent, it does not comply with the additional recommendation made in Section 5.4.1 of the German Corporate Governance Code in the version dated May 13, 2013 to name a specific target number of independent members. The reasons for this decision are given in the Declaration of Conformity of December 10, 2013.
The Supervisory Board took account of its adopted composition-related targets in its recommendations to shareholders as part of the scheduled Supervisory Board elections held in 2013. During those elections, two female Supervisory Board members – one each from the shareholder representative and employee representative sides – were nominated and elected. Thus, all of the Supervisory Board’s composition-related targets were met.

275Wacker Chemie AGAnnual Report 2013
Consolidated Financial StatementsCorporate Governance Report and Declaration on Corporate Management
Report on Executive Board CompensationThe following compensation report is part of the combined management report and of the audited consolidated financial statements.
The full Supervisory Board, following preparation by the Executive Committee, is respon-sible for determining the individual compensation paid to members of Wacker Chemie AG’s Executive Board.
The compensation system in effect since January 1, 2010 is in accordance with the legal requirements of the German Act on the Appropriateness of Management Board Compen-sation (VorstAG) as of August 2009.
The Executive Board’s compensation was comprised of the following key components:
( I ) A fixed annual salary:The fixed annual salary is paid monthly in identical installments.
( II ) A variable, performance related bonus:The amount of the variable bonus, which is paid annually and retrospectively, depends on the attainment of agreed annual Group targets set by the Supervisory Board for all Executive Board members. The bonus is calculated based on goal achievement in the reporting year, as well as on average overall target attainment for both prior years. For fiscal 2011, the targets were based on three key indicators: business value contribution, cash flow and target return. An additional performance indicator – Return on Capital Employed (ROCE) – was added for fiscal 2012 and 2013. Depending on the Executive Board member in question, the computational target bonus in the event of 100 percent target attainment during the evaluation period amounts to 180 percent or 140 percent of the average annual base salary in the last year of the evaluation period, whereas the maximum bonus amounts to 220 percent or 180 percent of the average annual base salary in the last year of the evaluation period. Thus, the Supervisory Board has the discretion to increase or reduce the calculated bonus based on overall recognition of all circumstances, including individual performance within a specified frame-work. The Executive Board members are obligated to purchase Wacker Chemie AG shares in the amount of 15 percent of their annual gross bonus. A holding period of two years is in effect for these shares.
( III ) A contribution to retirement benefits:The members of the Executive Board become entitled to the payment of an annual retirement pension should the event insured against occur, i.e. when the member in question reaches retirement age or becomes afflicted by permanent occupational disability. Before the event insured against occurs, Dr. Rudolf Staudigl and Dr. Joachim Rauhut have a basic entitlement to the premature payment of an annual pension if they leave the Executive Board against their will without good cause or if they, of their own accord, cease their activity for good cause, the company being responsible for said cause. The pension sum is calculated in accordance with the last fixed annual salary received and the length of Executive Board membership. A percentage of the base salary is defined as a basic amount and adjusted by means of an annual percentage rate of increase for each year of service. Entitlement to a pension presupposes at least five years of service on the Executive Board.
The company grants the members of the Executive Board appropriate insurance coverage, in particular D & O insurance, with a deductible in accordance with “VorstAG” stipulations.
After all, if they leave the company, the Executive Board members are subject to a 12-month obligatory waiting period, which is tied to competitive-restriction compensation. The com-petitive- restriction compensation is calculated on the basis of 50 percent of the most

276Wacker Chemie AGAnnual Report 2013
Consolidated Financial StatementsCorporate Governance Report and Declaration on Corporate Management
recently received overall annual compensation (average of the last three years). Any pension will be set off against the competitive-restriction compensation.
WACKER implemented a large number of programs to reduce costs and improve productivity in 2013 in response to the challenging earnings situation. In order to set a positive example, the members of the Executive Board reduced the amount of their fixed monthly salaries by 10 percent from March to November inclusive.
The table below lists the current level of each Executive Board member’s compensation:
Executive Board Compensation
€ Fixed compensation
1
Variable compensation
Pensions 2 Total
Dr. Rudolf Staudigl2013 747,780 675,000 727,603 2,150,383
2012 803,203 930,000 705,004 2,438,207
Dr. Joachim Rauhut2013 562,978 495,000 322,974 1,380,952
2012 604,144 682,000 291,132 1,577,276
Dr. Tobias Ohler2013 402,256 280,000 291,931 974,187
2012 – – – –
Auguste Willems2013 560,939 495,000 486,759 1,542,698
2012 601,503 682,000 398,548 1,682,051
Dr. Wilhelm Sittenthaler2013 – – – –
2012 584,682 682,000 461,532 3 1,728,214
Total2013 2,273,953 1,945,000 1,829,267 6,048,220
2012 2,593,532 2,976,000 1,856,216 7,425,748
1 The fixed compensation also includes the use of a company car.2 The pension includes the interest cost, as well as the service cost. The interest cost amounts to € 610,049 (2012: € 859,431).3 Pension levels and years of service have been synchronized.
Dr. Sittenthaler stepped down as Executive Board member prematurely for personal reasons effective December 31, 2012. Up until his employment contract expired as scheduled on April 30, 2013, Dr. Sittenthaler received all the compensation due to him under that contract. After leaving the company, he was paid the agreed competitive-restriction compensation, After determination of the variable compensation for 2013, that corresponds to a total amount of € 779,541.
Compensation for Former Executive Board Members and Their Surviving Dependents
€ Total
2013 2,162,941
2012 1,346,172

277Wacker Chemie AGAnnual Report 2013
Consolidated Financial StatementsCorporate Governance Report and Declaration on Corporate Management
Pension Obligations for Executive Board Members
€ Total
Pension obligations for active Executive Board members2013 18,136,630
2012 23,875,776
Pension obligations for former members of the Executive Board or their dependents2013 28,152,095
2012 21,932,911
Report on Supervisory Board CompensationThe compensation of Wacker Chemie AG’s Supervisory Board members is governed by the company’s Articles of Association.
In return for their work, the members of the Supervisory Board receive fixed annual com-pen sation in the amount of € 70,000 payable when the fiscal year expires and are additionally refunded any VAT payable on their compensation. Supervisory Board members who join, or depart from, the Supervisory Board during the ongoing fiscal year receive the appropriate pro rata compensation.
The compensation is multiplied by a factor of 3 for the Chairman of the Supervisory Board, by a factor of 2 for the Vice Chairman and for committee chairmen, and by a factor of 1.5 for members of committees. This arrangement does not take account of double and multiple functions.
The members of the Supervisory Board are compensated for any outlays incurred in con nec-tion with the execution of their duties with an annual lump sum of € 18,000. They are additionally refunded any VAT payable on their compensation.
The company grants the members of the Supervisory Board appropriate insurance coverage; in particular, the company concludes a D & O insurance policy for the benefit of the Supervisory Board’s members.
Supervisory Board Compensation
€ Fixed compensation
1
Variable compensation
Total
2013 1,758,482 – 1,758,482
2012 1,758,000 – 1,758,000
1 Fixed compensation includes the aforementioned annual lump sum.

278Wacker Chemie AGAnnual Report 2013
Consolidated Financial Statements
Declaration by the Executive Board on Accounting Methods and Auditing
The Executive Board is responsible for preparing Wacker Chemie AG’s consolidated financial statements and combined management report. WACKER’s consolidated financial statements were prepared in compliance with the rules published in London by the International Accounting Standards Board ( IASB) and endorsed by the European Union. WACKER has set up effective internal monitoring and steering systems to guarantee that the combined mana ge ment report and the consolidated financial statements comply with the applicable rules and procedures of proper corporate reporting. The reliability and workability of the monitoring and steering systems are examined continuously by the internal auditing division on a worldwide basis. KPMG AG Wirtschaftsprüfungsgesellschaft has audited Wacker Chemie AG’s consolidated financial statements and Group management report and granted them an unqualified audit opinion. WACKER’s consolidated financial statements, its com bined management report and the auditors’ report were discussed in detail by the Supervisory Board’s Audit Committee at its meeting on March 4, 2014. For information about the Super-visory Board’s audit, please refer to its report.
Assurance by the Legal Representatives in Accordance with Sections 297 (2) and 315 (1) HGBTo the best of our knowledge, and in accordance with the applicable reporting principles, the consolidated financial statements give a true and fair view of the Group’s net assets, earnings and financial position, and the combined management report includes a fair review of the development and performance of the business and the position of the Group, together with a description of the principal opportunities and risks associated with the Group’s expected development.
Munich, Germany, March 5, 2014 Wacker Chemie AG
Rudolf Staudigl Tobias Ohler
Joachim Rauhut Auguste Willems

279Wacker Chemie AGAnnual Report 2013
Consolidated Financial Statements
Auditors’ Report
We have audited the consolidated financial statements prepared by Wacker Chemie AG, Munich – comprising the statement of financial position, income statement, statement of comprehensive income, statement of changes in equity, statement of cash flows and explan atory notes – together with the report on the position of the Company and the Group for the business year from January 1 to December 31, 2013. The preparation of the consoli-dated financial statements and the report on the position of the Company and the Group in accordance with IFRSs, as adopted by the EU, and the additional requirements of German commercial law pursuant to Section 315 a (1) HGB (Handelsgesetzbuch: “German Commercial Code”) are the responsibility of the parent company’s management. Our responsibility is to express an opinion on the consolidated financial statements and on the report on the position of the Company and the Group based on our audit.
We conducted our audit of the consolidated financial statements in accordance with Section 317 HGB (“German Commercial Code”) and German generally accepted standards for the audit of financial statements promulgated by the Institut der Wirtschaftsprüfer ( Institute of Public Auditors in Germany) ( IDW). Those standards require that we plan and perform the audit such that misstatements materially affecting the presentation of the net assets, fin an-cial position and results of operations in the consolidated financial statements in accordance with the applicable financial reporting framework and in the report on the position of the Company and the Group are detected with reasonable assurance. Knowledge of the busi-ness activities and the economic and legal environment of the Group and expectations as to possible misstatements are taken into account in the determination of audit procedures. The effectiveness of the accounting-related internal control system and the evidence suppor ting the disclosures in the consolidated financial statements and the report on the position of the Company and the Group are examined primarily on a test basis within the framework of the audit. The audit includes assessing the annual financial statements of those entities included in consolidation, the determination of entities to be included in con-solidation, the accounting and consolidation principles used and significant estimates made by management, as well as evaluating the overall presentation of the consolidated financial statements and Group management report. We believe that our audit provides a reasonable basis for our opinion.
Our audit has not led to any reservations.
In our opinion, based on the findings of our audit, the consolidated financial statements comply with IFRSs, as adopted by the EU, and with the additional requirements of German commercial law pursuant to Section 315 a (1) HGB, and give a true and fair view of the net assets, financial position and results of operations of the Group in accordance with these requirements. The report on the position of the Company and the Group is consistent with the consolidated financial statements and as a whole provides a suitable view of the Group’s position and suitably presents the opportunities and risks of future development.
Munich, Germany, March 5, 2014 KPMG AG Wirtschaftsprüfungsgesellschaft
Pastor Prof. GrottelAuditor Auditor

280Wacker Chemie AGAnnual Report 2013
Further Information
Multiyear Overview
Multiyear Overview
€ million 2013 Changein %
2012
2011 2010 2009 2008 2007
Sales 4,478.9 –3.4 4,634.9 4,909.7 4,748.4 3,719.3 4,298.1 3,781.3
Income before taxes 31.0 –84.8 203.9 567.4 732.3 3.3 641.8 632.1
Net income for the year 6.3 –94.5 114.7 356.1 497.0 –74.5 438.3 422.2
EBITDA 678.7 –14.7 795.4 1,104.2 1,194.5 606.7 1,055.2 1,001.5
EBIT 114.3 –57.1 266.6 603.2 764.6 26.8 647.9 649.6
Fixed assets 4,067.7 –4.5 4,260.7 3,797.7 3,273.5 3,017.5 2,951.7 2,401.9
Intangible assets 20.4 –20.0 25.5 30.2 33.2 22.0 24.7 10.1
Property, plant and equipment, including investment property 3,785.6 –3.5 3,924.4 3,502.0 3,027.2 2,778.5 2,659.6 2,123.4
Financial assets 261.7 –15.8 310.8 265.5 213.1 217.0 267.4 268.4
Current assets, incl. deferred taxes + accruals and deferrals 2,264.7 1.5 2,232.1 2,439.3 2,227.7 1,524.4 1,673.4 1,516.2
Liquid funds 431.8 > 100 192.6 473.9 545.2 363.6 204.2 366.5
Equity 2,197.1 3.6 2,121.3 2,629.7 2,446.8 1,942.4 2,082.8 1,865.6
Subscribed capital 260.8 – 260.8 260.8 260.8 260.8 260.8 260.8
Capital reserves 157.4 – 157.4 157.4 157.4 157.4 157.4 157.4
Treasury shares –45.1 – –45.1 –45.1 –45.1 –45.1 –45.1 –45.1
Retained earnings / consolidated net income /other equity items 1,805.7 4.4 1,730.0 2,230.3 2,049.0 1,552.4 1,695.3 1,477.2
Non-controlling interests 18.3 0.5 18.2 26.3 24.7 16.9 14.4 15.3
Borrowed capital 4,135.3 –5.4 4,371.5 3,607.3 3,054.4 2,599.5 2,542.3 2,052.5
Provisions 1,401.9 –11.0 1,575.3 904.2 893.2 867.8 719.5 651.6
Liabilities, incl. deferred taxes + accruals and deferrals 2,733.4 –2.2 2,796.2 2,703.1 2,161.2 1,731.7 1,822.8 1,400.9
Net financial debt (–) Net financial receivables (+) –792.2 13.1 –700.5 95.7 264.0 –76.1 32.9 148.7
Total assets 6,332.4 –2.5 6,492.8 6,237.0 5,501.2 4,541.9 4,625.1 3,918.1
Employees (average for the year) 16,134 –3.2 16,663 16,934 16,033 15,719 15,798 14,926
Employees (Dec. 31) 16,009 –1.7 16,292 17,168 16,314 15,618 15,922 15,044
Employees (total ) 16,009 –1.7 16,292 17,168 16,314 15,618 15,922 15,044

281Wacker Chemie AGAnnual Report 2013
Further InformationMultiyear Overview
€ million 2013 Changein %
2012
2011 2010 2009 2008 2007
Key profitability figuresReturn on sales (EBIT ) = EBIT / sales (%) 2.6 –55.2 5.8 12.3 16.1 0.7 15.1 17.2
Return on sales (EBITDA) = EBITDA / sales (%) 15.2 –11.6 17.2 22.5 25.2 16.3 24.6 26.5
Return on equity = net income for the year / equity (as of Dec. 31) (%) 0.3 –94.4 5.4 14.0 22.6 –3.7 22.2 30.2
ROCE – return on capital employed = EBIT/capital employed (%) 2.2 –58.5 5.2 13.9 19.1 0.7 19.2 21.9
Key statementof financialposition figuresInvestment intensity of the fixed assets = fixed assets / total assets (%) 64.2 –2.1 65.6 60.9 59.5 66.4 63.8 61.3
Equity ratio = equity / total assets (%) 34.7 6.1 32.7 42.2 44.5 42.8 45.0 47.6
Capital structure = equity / borrowed capital (%) 53.1 9.5 48.5 72.9 80.1 74.7 81.9 90.9
Cash flow and investmentsCash flow from operating activities 464.0 27.8 363.2 867.0 1,103.1 767.5 1,005.4 1,322.5
Cash flow from long-term investing activities –555.2 –47.3 –1,053.8 –831.5 –681.5 –800.4 –983.7 –678.8
Cash flow from financing activities 227.6 –30.3 326.6 37.4 3.7 92.5 –87.7 –318.9
Net cash flow = CF from operating activi ties + CF from inves ting activities – additions from finance leases 109.7 > 100 –536.2 6.2 421.6 –32.9 21.7 643.6
Investments 503.7 –54.0 1,095.4 981.2 695.1 740.1 916.3 699.3
Share and valuationConsolidated net income 6.3 –94.5 114.7 352.6 490.7 –70.8 439.4 422.0
Earnings per share (€ ) = consolidated net income / number of shares 0.05 –97.9 2.43 7.1 9.9 –1.4 8.8 8.5
Market capitalization (total number of shares without treasury shares) 3,994.1 61.9 2,466.5 3,087.5 6,487.9 6,066.7 3,710.9 9,821.3
Number of shares 49,677,983 – 49,677,983 49,677,983 49,677,983 49,677,983 49,677,983 49,677,983
Price as of reporting date Dec. 31 80.4 61.8 49.7 62.2 130.6 122.1 74.7 197.7
Dividend per share (€ ) 0.50 –16.7 0.60 2.20 3.20 1.20 1.80 3.00
Dividend yield (%) 0.8 –20.0 1.0 3.5 2.8 1.4 1.5 2.0
Capital employed 5,238.2 5.2 4,979.0 4,343.8 4,004.4 3,846.3 3,371.8 2,973.0

282Wacker Chemie AGAnnual Report 2013
Further Information
Chemical Glossary
B BiotechnologyBiotech processes use living cells or enzymes to transform and produce substances. De pend-ing on the application, a distinction is made between red, green and white biotechnology. Red biotechnology: medical and pharma ceu-tical applications. Green biotechnology: agri-cultural applications. White biotechnology: biotech-based products and industrial proc-ess es, e.g. in the chemical, textile and food industries.
C ChlorosilanesCompounds of silicon, chlorine and hydrogen. The semiconductor industry mainly uses tri-chlo rosilane to make polysilicon and for the epitaxial deposition of silicon.
CyclodextrinsCyclodextrins belong to the family of cyclic oligosaccharides ( i.e. ring-shaped sugar mole-cules). They are able to encapsulate foreign substances such as fragrances and to release active ingredients at a controlled rate. WACKER BIOSOLUTIONS produces and markets cyclodex-trins.
CysteineCysteine is a sulfur-containing amino acid. It belongs to the non-essential amino acids, as it can be formed in the body. It is used, for example, as an additive in food and cough mixtures. Cysteine and its derivatives are a business field at WACKER BIOSOLUTIONS.
D DispersionsBinary system in which one component is finely dispersed in another. VINNAPAS® disper-sions from WACKER are vinyl-acetate-based binary copolymers and terpolymers in liquid form. They are mainly used as binders in the construction industry, e.g. for grouts, plasters and primers.
Dispersible Polymer PowdersCreated by drying dispersions in spray or disc dryers. VINNAPAS® polymer powders from WACKER are recommended as binders in the construction industry, e.g. for tile adhesives, self-leveling compounds and repair mortars. The powders improve adhesion, cohesion, flexibility and flexural strength, as well as water-retention and processing properties.
E ElastomersPolymers that exhibit almost perfectly elastic behavior, i.e. they deform when acted upon by an external force and return to their exact original shape when the force is removed. While the duration of the force has no effect on perfectly elastic behavior, the temperature does.
EthyleneEthylene is a colorless, highly reactive gas and a key raw material in the chemical industry.
P PolymerA polymer is a large molecule made up of smaller molecular units (monomers). It con-tains between 10,000 and 100,000 monomers. Polymers can be long or ball-shaped.
Polymer BlendsMixtures of synthetic and natural products in which the renewable raw material forms the main component comprising at least 65 percent. The VINNEX® binder system allows polymer blends to be produced from renew-able raw materials such as starch, polylactic acid (PLA) or polyhydroxyalkanoates (PHA).
PolysiliconHyperpure polycrystalline silicon from WACKER POLYSILICON is used for manufacturing wafers for the electronics and solar industries. To produce it, metallurgical-grade silicon is converted into liquid trichlorosilane, highly distilled and deposited in hyperpure form at 1,000 °C.

283Wacker Chemie AGAnnual Report 2013
Further InformationChemical Glossary
Pyrogenic SilicaWhite, synthetic, amorphous silicon dioxide (SiO2) in powder form, made by flame hydrol-ysis of silicon compounds. It is versatile in applications as an additive for silicone rubber grades, sealants, surface coatings, pharma-ceu ticals and cosmetics.
S SemiconductorA substance whose electrical conductivity is much lower than that of metals, but increases dramatically as the temperature rises. Semi-conductors can be modified for a particular purpose by doping with foreign atoms.
SilanesSilanes are used as monomers for the synthe-sis of siloxanes or sold directly as reagents or raw materials. Typical applications include surface treatment, reagents in pharmaceutical synthesis or coupling agents for coatings.
SiliconAfter oxygen, silicon is the most common element in the earth’s crust. In nature, it occurs without exception in the form of compounds, chiefly silicon dioxide and silicates. Silicon is obtained through energy-intensive reaction of quartz sand with carbon and is the most im-por tant raw material in the electronics industry.
Silicon WaferA silicon wafer is a disc with a thickness of between approximately 200 and 800 μm and is used by the semiconductor industry for the manufacture of semiconductor devices, i.e. integrated circuits and discrete components.
SiliconesGeneral term used to describe compounds of organic molecules and silicon. According to their areas of application, silicones can be classified as fluids, resins or rubber grades. Silicones are characterized by a myriad of outstanding properties. Typical areas of application include construction, the electrical and electronics industries, shipping and transportation, textiles and paper coatings.
SiloxanesSystematic name given to compounds com-prising silicon atoms linked together via oxy-gen atoms and with the remaining valences occupied by hydrogen or organic groups. Siloxanes are the building blocks for the poly-mers (polysiloxane and polyor ganosi loxane) that form silicones.
V VINNAPAS®
VINNAPAS® is the name of WACKER’s product line of dispersions, polymer powders, solid resins and their associated product solutions. VINNAPAS® dispersions and polymer powders are primarily used in the construction industry as polymeric binders, e.g. in tile adhesives, exterior insulation and finish systems (EIFS)/external thermal insulation composite systems (ETICS), self-leveling compounds, and plasters.

284Wacker Chemie AGAnnual Report 2013
Further Information
Financial Glossary
B Business Value Contribution (BVC)BVC is a financial performance measurement that determines the value created by the WACKER Group and its units once all capital costs have been deducted. BVC is the differ-ence between profit (EBIT ) and cost of capital (WACC x CE). BVC is a profit variable that is ad-justed to allow for extraordinary effects (e.g. sale of parts of the company). This makes it an ideal tool for measuring business performance.
C Capital Employed (CE)Capital employed is made up of average non-current fixed assets ( less noncurrent secu-rities), plus inventories, and trade receivables less trade payables. It is a variable used in calcu lating the cost of capital.
Cash FlowCash flow represents the movement of cash and cash equivalents into or out of a business activity during a finite period. Net cash flow is the sum of cash flow from operating activities (excluding changes in advance payments received) and cash flow from ongoing investing activities (before securities), including addi-tions due to finance leases.
E EBITEarnings before interest and taxes: EBIT is a good indicator for comparing companies’ profitability, since it is widely used across the corporate world.
EBITDAEarnings before interest, taxes, depreciation and amortization = EBIT + depreciation.
Equity RatioThe equity ratio is calculated from the ratio of equity to a company’s total assets. It indicates the level of economic and financial stability at a company.
I IFRSThe International Financial Reporting Stan-dards (until 2001 International Accounting Standards, IAS) are compiled and published by the London-based International Accounting Standards Board ( IASB). Since 2005, publicly-listed EU-based companies have been required to use IFRS in accordance with IAS regulations.
R Return on Capital Employed (ROCE)Return on capital employed is the profitability ratio relating to the capital employed.

285Wacker Chemie AGAnnual Report 2013
Further Information
List of Tables and Figures
CoverWACKER at a Glance U1
Key Events in 2013 U2
Vision U3
WACKER Share Performance U3
Divisional Shares in Group Sales U3
Earnings per Share U3
EBITDA Margin U3
Return on Capital Employed ( ROCE ) U3
Financial Calendar 2014 U4
1 For Our ShareholdersG 1.1 WACKER Share Performance ( indexed to 100) 48
T 1.2 Facts & Figures on Wacker Chemie AG’s Stock 48
T 1.3 Useful Information on WACKER Stock 49
T 1.4 Dividend Trends 49
T 1.5 The Following Banks and Investment Firms Monitor and Assess WACKER 50
2 Combined Management Report of the WACKER Group and of Wacker Chemie AG
Group Business Fundamentals
G 2.1 WACKER’s Production and Sales Sites and Technical Competence Centers 56
G 2.2 Key Factors for Multidivisional Sites 57
G 2.3 WACKER’s Structure 57
G 2.4 Group Structure in Terms of Managerial Responsibility 57
T 2.5 Executive Board Responsibilities 58
T 2.6 WACKER’s Competitive Positions 60
T 2.7 Leading Operational Indicators 62
T 2.8 WACKER’s Medium-Term Targets through 2017 64
T 2.9 Non-Financial Performance Indicators Used for Decision-Making in Parts of the Company 68
T 2.10 Planned and Actual Figures 69
T 2.11 ROCE and BVC 69
G 2.12 Strategic and Operational Planning 70
T 2.13 Financing Measures in 2013 71
G 2.14 Statutory Information on Takeovers 72
3 Combined Management Report Business Report
G 3.1 GDP Trends in 2013 75
T 3.2 Installation of New PV Capacity in 2012 and 2013 77
G 3.3 Spot-Price Trends for WACKER’s Key Raw Materials 78
G 3.4 Global Construction Industry by Region in 2013 79
T 3.5 Comparing Actual with Forecast Performance 82
T 3.6 Expenses by Cost Types 83
G 3.7 Year-on-Year Sales Comparison 85
T 3.8 Domestic and International Sales (by Customer Location) 85
T 3.9 Non -Recurring Effects in 2013 86
T 3.10 Non -Recurring Effects in 2012 86
T 3.11 Combined Statement of Income 88
T 3.12 Key Data: WACKER SILICONES 89
T 3.13 Key Data: WACKER POLYMERS 90
T 3.14 Key Data: WACKER BIOSOLUTIONS 91
T 3.15 Key Data: WACKER POLYSILICON 92
T 3.16 Key Data: SILTRONIC 92
G 3.17 Divisional Shares in External Sales 93
T 3.18 External Sales by Customer Location 94
T 3.19 External Sales by Group Company Location 94
G 3.20 Asset and Capital Structure 95
T 3.21 Combined Statement of Financial Position 99
T 3.22 Net Cash Flow 101
G 3.23 Net Cash Flow 101
G 3.24 Net Financial Debt 102
G 3.25 Cash Flow from Operating Activities (Gross Cash Flow) 102
G 3.26 Cash Flow from Long-Term Investing Activities before Securities 103
G 3.27 Changes in Cash and Cash Equivalents 103
T 3.28 R & D Costs 106
G 3.29 New-Product Rate (NPR) 106
G 3.30 Licensing Income 107
G 3.31 Investment in R & D Facilities 107
G 3.32 Breakdown of R & D Expenditures 108

286Wacker Chemie AGAnnual Report 2013
Further InformationList of Tables and Figures
G 3.33 R & D Organization 110
T 3.34 Employees in R & D as of December 31, 2013 110
T 3.35 Key Product Launches in 2013 113
T 3.36 Number of Employees on December 31, 2013 114
T 3.37 Number of Temporary Workers on December 31, 2013 114
T 3.38 Personnel Expenses 115
T 3.39 Idea Management 117
G 3.40 Demographic Analysis of German and International Sites in 2013 117
T 3.41 Employee Turnover Rate 118
T 3.42 Emissions into the Air: Business Divisions / Metallurgy 121
T 3.43 Environmental Indicators from 2007 to 2013 122
G 3.44 Product Lifecycles 123
G 3.45 Electricity Supply 124
T 3.46 Energy Consumption 125
T 3.47 Workplace Accidents Involving Permanent Staff and Temporary Workers 126
T 3.48 Transport Accidents 127
T 3.49 Procurement Volumes ( including Procurement for Capital Expenditures) 128
G 3.50 Electronic Procurement Orders 129
G 3.51 Transport Volumes for the Burghausen Logistics Hub 130
T 3.52 Plant-Capacity Utilization in 2013 131
T 3.53 Key Start-Ups 131
G 3.54 Productivity Projects According to Focus 132
G 3.55 Percentage of Marketing Costs 133
G 3.56 Tradeshows in 2013 133
T 3.57 Statement of Income 135
T 3.58 Statement of Financial Position 137
G 3.59 Risk Management System 142
G 3.60 Basis of Our Internal Control System ( ICS ) 143
T 3.61 Probability and Possible Impact of Our Risks in 2014 146
T 3.62 Controlling Financial Risks 152
G 3.63 Development of Risks in 2014 159
G 3.64 Opportunity Management System 160
T 3.65 Sales Volumes: Opportunities and Risks 161
T 3.66 Overview of Business Opportunities 162
4 Combined Management Report OutlookG 4.1 GDP Trends in 2014 165
T 4.2 WACKER’s Key Customer Sectors 167
T 4.3 Photovoltaic-Market Trend in 2014 167
G 4.4 Average Growth in Global Construction from 2012 to 2017 168
T 4.5 Resource-Management Measures 169
T 4.6 Facility Start-Ups in 2014 and 2015 171
T 4.7 Outlook for 2014 174
G 4.8 Investments by Division in 2014 175
G 4.9 WACKER’s Medium-Term Targets through 2017 177
5 Consolidated Financial Statements T 5.1 Statement of Income 181
T 5.2 Statement of Comprehensive Income 182
T 5.3 Assets 183
T 5.4 Equity and Liabilities 184
T 5.5 Statement of Cash Flows 185
T 5.6 Statement of Changes in Equity 186
T 5.7 Reconciliation of Other Equity Items 187
T 5.8 Segment Information by Division in 2013 188
T 5.9 Segment Information by Division in 2012 189
T 5.10 Segment Information by Region in 2013 190
T 5.11 Segment Information by Region in 2012 190

287Wacker Chemie AGAnnual Report 2013
Further Information
Index
A accounting and valuation methods 202–216auditors’ report 279
B balance sheet 42
C cash flow 64, 66, 67, 69, 70, 100–104, 139, 174, 175, 177
compensation 275–277consolidated financial statements 181–279corporate governance 44, 59, 268–274
D depreciation 64, 83, 86, 87, 96, 102, 104, 136, 139, 174, 203- 205, 222–227
dividend 48, 49, 83, 104, 176, 245
E earnings 84–88earnings per share 48, 49, 245EBIT 66, 69, 86EBITDA 64, 66–69, 81, 84, 85, 174–178economic trends 75employees 55, 68, 83, 110, 114–118, 158, 173environmental protection 120–123equity 95, 97, 104, 137, 138, 186, 216executive board 35–40, 42, 57–59, 69, 80, 83,
104, 162, 177, 264, 267, 272, 275, 278
F financial liabilities 95, 101 137, 139, 175, 207, 239–241
financial position 100–104financial situation 68financing measures 70, 71fixed assets 138, 222
G glossaries 282–284group structure 57
I innovations 111, 160, 162, 169intangible assets 96, 99, 183, 200, 222, 223 inventories 69, 86, 95–97, 102, 138, 175, 227investments 64, 67, 81, 82, 89, 96, 101,
104, 150, 152, 174, 175investor relations 40, 58, 267
L legal structure 57liabilities 95, 98, 101, 137–139, 240, 242liquidity 67, 95, 96, 98, 100, 101, 138, 152, 153
M management processes 66–71, 174management report 55–178
N net assets 95–99net financial debt 68, 82, 98, 101, 102, 104,
105, 139, 174, 175, 177net interest income 87, 137, 208, 218, 252–254noncurrent assets 95, 96notes 191–264
O opportunities report 160–162outlook 140, 165–178
P pension provisions, provisions for pensions 95–97, 137, 154, 210,
212, 216, 231, 233, 244personnel expenses 83, 104, 114, 115, 135, 136procurement 128–130, 172products 55, 59, 64, 65, 76, 113, 150, 170property, plant and equipment 81, 96, 103, 198, 200,
204, 205, 224, 225provisions 85–87, 95–97, 102, 136,
139, 201, 211, 238, 239
288Wacker Chemie AGAnnual Report 2013
Further InformationIndex
R rating 104report of the supervisory board 41–45reporting principles 202–216, 278research & development, R & D 82, 106–113, 171risk management system 141–145
S sales growth 25, 32, 77, 84, 174, 175sales performance 104sales trend 62scope of consolidation 196–198sector-specific 160, 166–169sectors 55, 59, 76–80segment reporting 202, 211segments 88–93, 175, 176, 258share 48–52, 83, 104, 245, 273share price 43, 48, 49Siltronic 61, 65, 76, 79, 92, 105, 176sites 55–57, 60, 141, 148, 161social commitments 272social responsibilities 127statement of cash flows 185, 214, 257statement of financial position 95–99, 137,
183, 214statement of income 88, 135, 181
statutory information on takeovers 72stock 46–52, 273strategy 64, 65, 169supervisory board 41- 45, 58, 59, 264–266supplementary report 105, 191sustainability 119–128, 173
T technical competence centers 55, 56training 115, 116, 127
U underlying economic conditions 165
W WACKER BIOSOLUTIONS 59, 61, 65, 90, 91, 131, 171, 176
WACKER POLYMERS 59, 60, 65, 77, 79, 81, 89, 90, 168, 170, 176
WACKER POLYSILICON 59–61, 65, 79, 81, 84, 85, 91, 92, 149, 156, 161, 176
WACKER SILICONES 59, 60, 64, 65, 77, 79, 80, 88, 89, 160, 170, 175, 176
Our Annual Report was published on March 18, 2014. It is available in German and English and you can access both versions online. www.wacker.com/annualreport
This Annual Report contains forward-looking statements based on assumptions and estimates of WACKER’s Executive Board. Although we assume the expectations in these forward-looking statements are realistic, we cannot guarantee they will prove to be correct. The assumptions may harbor risks and uncertainties that may cause the actual figures to differ considerably from the forward-looking statements. Factors that may cause such discrepancies include, among other things, changes in the economic and business environment, variations in exchange and interest rates, the introduction of competing products, lack of acceptance for new products or services, and changes in corporate strategy. WACKER does not plan to update the forward-looking statements, nor does it assume the obligation to do so.

Wacker Chemie AGHanns-Seidel-Platz 481737 München, GermanyTel. + 49 89 6279 - 0Fax + 49 89 6279 -1770www.wacker.com
An
nu
al R
ep
ort
201
3