the application of a noise mapping tool deployed in …€¦ · tool deployed in grid...
TRANSCRIPT
Maciej SzczodrakJózef KotusAndrzej CzyżewskiBożena Kostek
THE APPLICATION OF A NOISE MAPPINGTOOL DEPLOYED IN GRIDINFRASTRUCTURE FOR CREATINGNOISE MAPS OF URBAN AREAS
Abstract The concept and implementation of the system for creating dynamic noise mapsin PL-Grid infrastructure are presented. The methodology of dynamic acousti-cal maps creating is introduced. The concept of noise mapping, based on noisesource and propagation models, was developed and employed in the system.The details of incorporation of the system to the PL-Grid infrastructure arepresented. The results of simulations performed by the system prototype aredepicted. The results in the form of noise maps obtained by a system are com-pared with some other solutions in order to investigate accuracy.
Keywords noise, noise map, noise modeling, grid computing
17 maja 2013 str. 1/12
Computer Science • 14 (2) 2013 http://dx.doi.org/10.7494/csci.2013.14.2.231
231
1. Introduction
The threat that environmental noise poses to human health has become an issueof considerable significance, especially in the heavily urbanized areas [1, 2, 3, 4].This detrimental factor has profound implications on the quality of life but also onpublic health. In order to assess the threat, the European Parliament and Councilissued the legal foundation for undertaking urban noise monitoring in all MemberStates. In 2002 the European Parliament and Council issued the European Directive2002/49/EC relating to the assessment and management of environmental noise. Themain aim of this Directive is to provide a common basis for tackling the noise problemacross the EU [5]. It commits the EC-member states to evaluate the noise impact forall agglomerations, for all major roads and major railways and for all major airportswithin their territories and to present it on strategic noise maps. Until 30 June 2007noise maps had to be prepared for all cities – or more precise, for agglomerations– with more than 250,000 inhabitants. Till 30 June 2012 all agglomerations withmore than 100,000 inhabitants have to be mapped, too. The commercially availableapplications deliver full functionality to prepare the noise map, but they work mainlyon windows platform. Computation of noise map for large city areas would resultin high calculation time [6]. To solve that problem the software to calculate roadand railway noise on supercomputer platform was proposed and developed [6, 7, 8].The procedure for preparing the noise map requires a knowledge of source data andpropagation environment. The model for calculating the acoustic field distribution inurban area is based on the acoustic ray tracing method. Considering source models, weneed to note that road and railway noise are the most frequent sources of disturbancethat people are exposed to. The achievements of European Harmonoise and Imagineprojects providing a description of road and railway models were utilized during theimplementation of the software engineered by the authors. The Harmonoise model[9, 10] was intended to unify all the methods worked out by European Union statemembers.
Similar work concerning noise mapping with the use of a computational grid hasbeen accomplished in the GDI-Grid project [11]. The presented approach was basedon dividing the calculation area on some smaller tiles and on the parallel processingof tiles. Our method is different because it uses a more sophisticated parallelizationtechnique yielding the proper cluster load balancing. It is provided by the utilizationof the MPI standard and finer granularity obtained because the area is broken intosingle points.
A process of computation of sound level distribution in urban areas, realized bynoise map calculation software optimized towards working on a supercomputing clu-ster, was presented in this paper along with a detailed description in the next Sections.The aim of the work undertaken is to provide efficient computational tools for thecommunity of acousticians engaged in noise threat reduction. The developed softwa-re allows also for conducting scientific investigations devoted to verify mathematicalmodels against environmental measurements.
17 maja 2013 str. 2/12
232 Maciej Szczodrak, Józef Kotus, Andrzej Czyżewski, Bożena Kostek

2. Description of the problem solving
2.1. Noise source and propagation model
The method of creating a noise map is based on mathematical models of noise sourceand propagation. The source model consists of vehicle and traffic models. The soundpower of a single vehicle is calculated on the basis of velocity as one of the inputparameters. The traffic model is utilized to combine the noise emission of numeroussingle vehicles according to traffic statistics. The output of the source model is thesound power per one meter length of linear source. The resultant sound level is calcu-lated in defined grid of receiver points using the propagation model. The concept ofsound propagation paths describing schematic lines of acoustic wave traverse betweena single point source to receiver is utilized in the model. The sound propagation pathsare obtained by employing the acoustic ray tracing method [12, 13]. This method isused for investigating sound wave propagation in urban areas. The diagram of raytracing algorithm is presented in Figure 1. A set of rays is sent from each receiverpoint. The algorithm detects the collision of the ray with barriers (i.e. buildings) orsources. Then, geometrical cross-sections, representing paths along which acousticalenergy is transmitted from source point to receiver point, are determined.
Get receiver
Construct ray
Object intersection?
Get next object
Add object info to the list
YES
Sort object list
All objects?
YES
NO
NO
All rays?
Obtain propagation paths
Save paths attenuations
NO Calculate total sources contribution
YES
Figure 1. Acoustic ray tracing algorithm.
The propagation method [12, 14] describes the attenuation between each pair ofpoint source and the receiver. Point sources are introduced by the segmentation of thelinear source which is done by ray tracing. In the real atmosphere a number of factorsaffects sound propagation, including absorption of sound in air, non-uniformity of
17 maja 2013 str. 3/12
The application of a noise mapping tool deployed . . . 233

the propagation medium due to meteorological conditions, and interaction with anabsorbing ground and solid obstacles (such as barriers) [15]. Total sound level in eachreceiver is obtained by an aggregation of the influences of sources found by ray tracingwith respect to calculated values of sound attenuations on the propagation paths.
2.2. Parallel implementation of the model
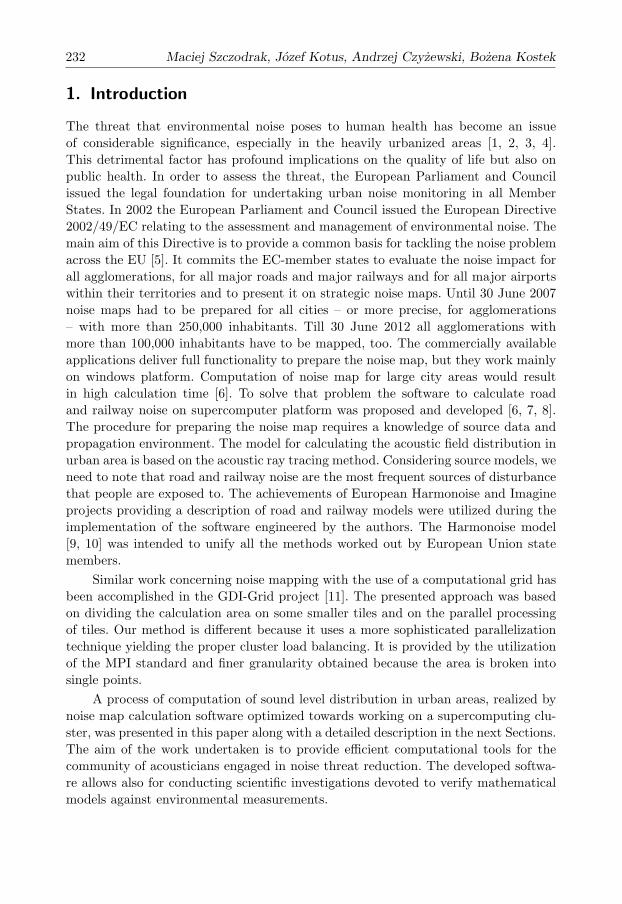
Achieving a tolerable time of computation of dynamic noise maps required implemen-tation of a method for parallel data processing. The applied method of noise modelinghas such advantage that the sound level can be estimated in each point of the inputgrid, independently. The algorithm is presented in Figure 2. The authors developedtheir own code for the noise prediction model based on open source programminglibraries [6, 7, 8]. The main engine of the propagation model includes the imple-mentation of the acoustic ray tracing method. For exploiting the computer clustercapabilities, a master-slave parallel programming paradigm was applied in connectionwith the MPI programming standard to achieve a proper load balance. The previousversion of the Noise Prediction Model software was compiled and utilized within onesupercomputer cluster (‘Galera+’ in CI TASK).
2.3. Integration with PL-Grid infrastructure
The software was deployed on selected supercomputers of the PL-Grid infrastructure.The integration of the Noise Prediction Model with the PL-Grid run in two phasesand QosCosGrid client software was used as the middleware over the queue systemson clusters [16]. First, the software was compiled on the clusters ‘Galera+’ and ‘Zeus’.The mentioned supercomputers belong to the group of the most powerful machinesin Poland, having, respectively, 10 384 and 23 932 cores. On the TOP500 rating ofJune 2012, ‘Zeus’ took a high, 89th position and ‘Galera+’ was on placed 447th
position. Assignment of the task to a physical computational resource (cluster) wasdetermined by the user in the configuration file. For task management, QCG-Brokerwas employed.
In the second phase, the multi-cluster run scenario was incorporated. In order toachieve the result, a code was build with qcg-ompi libraries. The application was com-piled preliminarily on two supercomputer clusters ‘Nova’ in WCSS (6400 cores) and‘Zeus’ in Cyfronet. This approach will allow for more convenient utilizing distributedcomputational resources while being regarded as one logical cluster. In the prototypeversion of the PLGrid Plus ‘Noise’ service, the interface is in form of text console ac-cess. The user has to provide the input data by uploading it into the storage. The inputdata have to be prepared by the user locally with dedicated software. The user spe-cifies the location of the input data in the configuration options of the program. Theuser manages the computations with the QCG text client. When a calculation processis completed, the user downloads the output data and performs post-processing andvisualization on the local terminal. The diagram showing the use of the system ispresented in Figure 3.
17 maja 2013 str. 4/12
234 Maciej Szczodrak, Józef Kotus, Andrzej Czyżewski, Bożena Kostek
Read input data
All tasks calculated?
Spread data to all cores
YES
NO
Prepare output data
START
Receive data
Calculate sound level
Send output
Receive data
Calculate sound level
Send output
...
Wait for workers’ output
Send next task to worker core
STOP
Figure 2. Algorithm for creating noise maps.
Input data source
Input data editor
Acces node (QCG-UI)
PlGrid Clusters
Outcome analysis/ visualization
PlGrid Infrastructure
Figure 3. Typical workflow in the prototype version of ‘Noise’ service.
3. Results
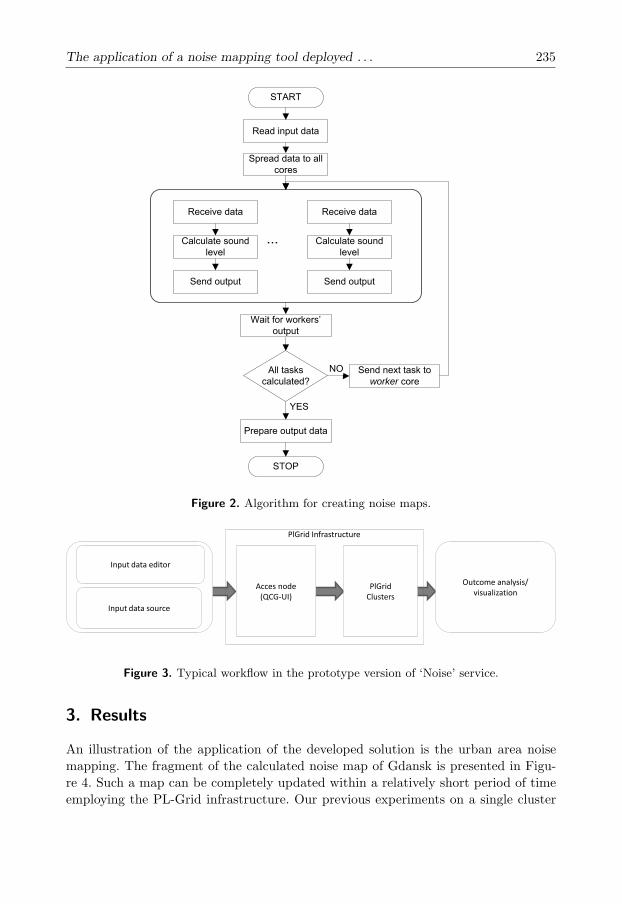
An illustration of the application of the developed solution is the urban area noisemapping. The fragment of the calculated noise map of Gdansk is presented in Figu-re 4. Such a map can be completely updated within a relatively short period of timeemploying the PL-Grid infrastructure. Our previous experiments on a single cluster
17 maja 2013 str. 5/12
The application of a noise mapping tool deployed . . . 235
show that the discussed map can be updated daily [6]. A series of tests of developedapplication in the PL-Grid infrastructure have been conducted including map accura-cy and computation efficiency. The first test case concerns investigation of calculationtime for diverse grid size, the second test case shows accuracy of created noise map incomparison to the reference map. The input data for the noise map creation is iden-tical for both test cases. The following main parameters of the propagation modelwere set: reflections of the 1st order, search ray 2000 meters, reflected ray 100 m, thedistance between the following rays 2 degrees, and the building sound reflection coef-ficient 0.8. The input data consisted of a geometrical description of roads (3639 roadsegments) and buildings (92 234 buildings), the traffic volume (archive measurements)and the vehicle speed (50 km/h for each vehicle category). All other parameters inthe program were set to the default values, i.e. stone mastic asphalt pavement type,uninterrupted traffic flow. The ground type for the whole area was set to ‘hard sur-face’ (representing asphalt or concrete). Calculated maps show a sound level LA,Eqaveraged for 1 hour.
Figure 4. The noise map of Gdansk, area shown of 8000×4000 m.
The computation time for the diverse grid size is presented in Table 1. From thepoint of view of the end user, the denser grid is better. Nevertheless, the numerical costof creating such map would be very high. Therefore, the comparison of computationtime was conducted in order to estimate the reasonable tradeoff between qualityand cost. The size of both maps was 256×256 meters. The discussed map representsa fragment of the city centre, where the concentration of infrastructure is very high.The cost of the calculation map for the dense grid is 3.8 to 3.2 times slower than thesparse grid. The graphical illustration of considered outcomes is presented in Figure 5.
17 maja 2013 str. 6/12
236 Maciej Szczodrak, Józef Kotus, Andrzej Czyżewski, Bożena Kostek
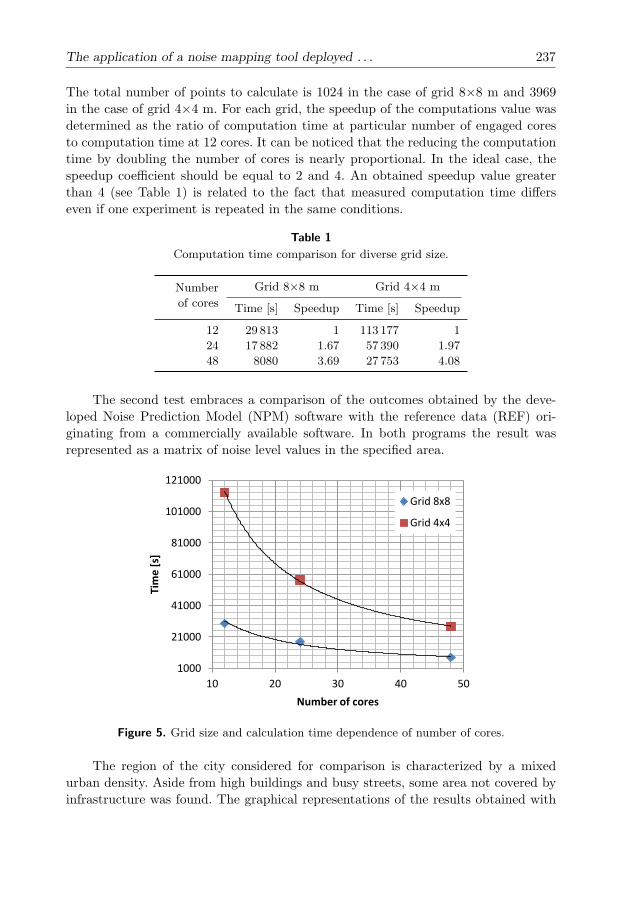
The total number of points to calculate is 1024 in the case of grid 8×8 m and 3969in the case of grid 4×4 m. For each grid, the speedup of the computations value wasdetermined as the ratio of computation time at particular number of engaged coresto computation time at 12 cores. It can be noticed that the reducing the computationtime by doubling the number of cores is nearly proportional. In the ideal case, thespeedup coefficient should be equal to 2 and 4. An obtained speedup value greaterthan 4 (see Table 1) is related to the fact that measured computation time differseven if one experiment is repeated in the same conditions.
Table 1Computation time comparison for diverse grid size.
Numberof cores
Grid 8×8 m Grid 4×4 m
Time [s] Speedup Time [s] Speedup
12 29 813 1 113 177 124 17 882 1.67 57 390 1.9748 8080 3.69 27 753 4.08
The second test embraces a comparison of the outcomes obtained by the deve-loped Noise Prediction Model (NPM) software with the reference data (REF) ori-ginating from a commercially available software. In both programs the result wasrepresented as a matrix of noise level values in the specified area.
1000
21000
41000
61000
81000
101000
121000
10 20 30 40 50
Tim
e [
s]
Number of cores
Grid 8x8
Grid 4x4
Figure 5. Grid size and calculation time dependence of number of cores.
The region of the city considered for comparison is characterized by a mixedurban density. Aside from high buildings and busy streets, some area not covered byinfrastructure was found. The graphical representations of the results obtained with
17 maja 2013 str. 7/12
The application of a noise mapping tool deployed . . . 237

the reference software and with the Noise Prediction Model are shown in Figure 6 andFigure 7. The difference map showing the Noise Prediction Model results subtractedfrom reference software results is presented in Figure 8.
Figure 6. Noise map created by reference application (REF).
Figure 7. Noise map created by NPM application.
The prevailing discrepancies remain within the range of ±1 dB. High similarityof sound level can be observed in nearly all areas. The differences are noticed in si-tuations of screening by large building aggregations, where NPM gives overestimatedvalues. Other discrepancies can be observed in a free field, where NPM outcomes areunderestimated. A clear influence of propagation factors is dominating in this situ-
17 maja 2013 str. 8/12
238 Maciej Szczodrak, Józef Kotus, Andrzej Czyżewski, Bożena Kostek
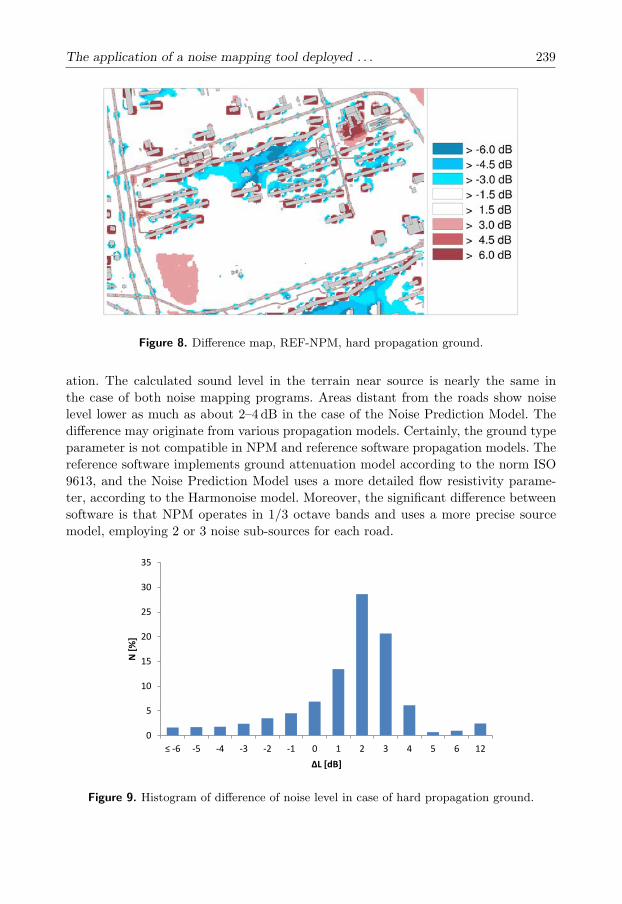
Figure 8. Difference map, REF-NPM, hard propagation ground.
ation. The calculated sound level in the terrain near source is nearly the same inthe case of both noise mapping programs. Areas distant from the roads show noiselevel lower as much as about 2–4 dB in the case of the Noise Prediction Model. Thedifference may originate from various propagation models. Certainly, the ground typeparameter is not compatible in NPM and reference software propagation models. Thereference software implements ground attenuation model according to the norm ISO9613, and the Noise Prediction Model uses a more detailed flow resistivity parame-ter, according to the Harmonoise model. Moreover, the significant difference betweensoftware is that NPM operates in 1/3 octave bands and uses a more precise sourcemodel, employing 2 or 3 noise sub-sources for each road.
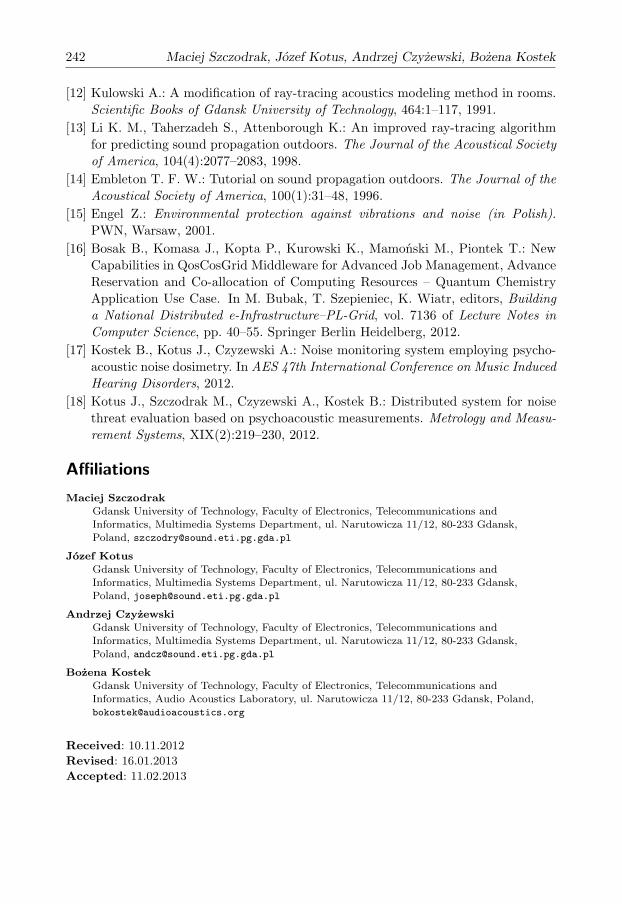
0
5
10
15
20
25
30
35
≤ -6 -5 -4 -3 -2 -1 0 1 2 3 4 5 6 12
N [
%]
ΔL [dB]
Figure 9. Histogram of difference of noise level in case of hard propagation ground.
17 maja 2013 str. 9/12
The application of a noise mapping tool deployed . . . 239

Error distribution is presented in Figure 9. We can observe that the prevailingvalue of discrepancies is situated in the range of 1–4 dB. In order to achieve a more de-sired error distribution, a ground type parameter value in NPM software was changedto 10 000 kNsm−4, what means softer ground (previous value 20 000). The resultantdifference map is presented in Figure 10. For this type of surface, the propagation iscorrect, and we can observe the differences in noise level in areas where high buildingsscreening influence occur.
Figure 10. Difference map, REF-NPM, softer propagation ground case.
4. Conclusions and future work
The concept and results of exploiting the system for creating noise maps with the useof supercomputer clusters were presented. The outcomes of the experiments show thatachieving a reasonable computation time of dynamic noise maps is possible. However,the update period in the case of a constant size of the input data is dependent on thearea size and available resources. The experiments demonstrate the usefulness of theso-called cloud computing concept employed for environmental noise monitoring andcreating acoustic maps in urban areas. The user will be able to run the applicationon all clusters within PL-Grid infrastructure. The idea is to offer a platform whichprovides the software for environmental noise modeling together with a sufficient com-putational power. It can be used by researchers or urban planners for simulating ofthe noise influence on the environment or for planning new urban infrastructures.Achieving of high computational power is difficult in current configuration of queuesystems. It takes long time to wait for running computational tasks in queue sys-tems. Some queue systems have limits in maximum allowed number of cores for onetask. We believe that some queue system priorities and limits would be changed. Theexperience was gathered from users who have tested the prototype service. They ma-
17 maja 2013 str. 10/12
240 Maciej Szczodrak, Józef Kotus, Andrzej Czyżewski, Bożena Kostek

inly express request for more convenient access to the developed noise mapping tool.Therefore, the future work will focus on preparing and implementing a graphical userinterface. Moreover, the efforts aimed for running the developed service with Unicoresystem were undertaken. In the future the noise map could be calculated engaging thelarge scale computational power of other supercomputers connected in the PL-Gridinfrastructure. The possibility of showing TTS induced by traffic noise [17, 18] as anextra layer may be an additional advantage of the presented system.
Acknowledgements
This research has been partially supported by the European Regional DevelopmentFund program no. POIG.02.03.00-00-096/10 as part of the PL-Grid PLUS project.
References
[1] Engel Z., Zawieska W.: The State of Protection Against Noise in the Environmentin the Year of Poland’s Accession to the European Union. In 13th InternationalConf. on Noise Control, 2004.
[2] Kompala J., Lipowczan A.: Noise hazard to the population of areas connectedwith functioning of roadway frontier crossings. Archives of Acoustics, 32(2):279–286, 2007.
[3] Kucharski R.: Complex noise indicator for noise mapping based on the EU wor-king groups’ and Polish results of the annoyance investigations. Archives of Acou-stics, 32(2):273–302, 2007.
[4] Popescu D. I., Moholea I. F.: Monitoring the reaction and response of people tourban noise. Archives of Acoustics, 35(2):237–244, 2010.
[5] Directive 2002/49/EC of the European Parliament and of the Council. OfficialJournal of the European Communities, June 2002.
[6] Szczodrak M., Czyzewski A.: Software for calculation of noise maps implementedon the supercomputer. Task Quarterly, 13(4):363–377, 2009.
[7] Czyzewski A., Szczodrak M., Kotus J.: Creating acoustic maps employing super-computing cluster. Archives of Acoustics, 36(2):1–24, 2011.
[8] Czyzewski A., Kotus J., Szczodrak M.: Online urban acoustic noise monitoringsystem. Noise Control Eng. J., 60(1):69–84, 2012.
[9] Nota R., et al.: Harmonoise WP 3 Engineering method for road traffic and railwaynoise after validation and fine-tuning. Harmonoise Technical Report, 2005.
[10] Maercke, Van D., Defrance J.: Development of an Analytical Model for OutdoorSound Propagation Within the Harmonoise Project. Acta Acustica united withAcustica, 93(2):201–212, April 2007.
[11] Stapelfeldt H., Siepmann D., Fleuren T.: Automated Workflows in Linux HighPerformance Grid Computing or Standard Windows Applications. In 39th In-ternational Congress on Noise Control Engineering – Inter-Noise 2010, Lisbon,2010.
17 maja 2013 str. 11/12
The application of a noise mapping tool deployed . . . 241
[12] Kulowski A.: A modification of ray-tracing acoustics modeling method in rooms.Scientific Books of Gdansk University of Technology, 464:1–117, 1991.
[13] Li K. M., Taherzadeh S., Attenborough K.: An improved ray-tracing algorithmfor predicting sound propagation outdoors. The Journal of the Acoustical Societyof America, 104(4):2077–2083, 1998.
[14] Embleton T. F. W.: Tutorial on sound propagation outdoors. The Journal of theAcoustical Society of America, 100(1):31–48, 1996.
[15] Engel Z.: Environmental protection against vibrations and noise (in Polish).PWN, Warsaw, 2001.
[16] Bosak B., Komasa J., Kopta P., Kurowski K., Mamoński M., Piontek T.: NewCapabilities in QosCosGrid Middleware for Advanced Job Management, AdvanceReservation and Co-allocation of Computing Resources – Quantum ChemistryApplication Use Case. In M. Bubak, T. Szepieniec, K. Wiatr, editors, Buildinga National Distributed e-Infrastructure–PL-Grid, vol. 7136 of Lecture Notes inComputer Science, pp. 40–55. Springer Berlin Heidelberg, 2012.
[17] Kostek B., Kotus J., Czyzewski A.: Noise monitoring system employing psycho-acoustic noise dosimetry. In AES 47th International Conference on Music InducedHearing Disorders, 2012.
[18] Kotus J., Szczodrak M., Czyzewski A., Kostek B.: Distributed system for noisethreat evaluation based on psychoacoustic measurements. Metrology and Measu-rement Systems, XIX(2):219–230, 2012.
Affiliations
Maciej SzczodrakGdansk University of Technology, Faculty of Electronics, Telecommunications andInformatics, Multimedia Systems Department, ul. Narutowicza 11/12, 80-233 Gdansk,Poland, [email protected]
Józef KotusGdansk University of Technology, Faculty of Electronics, Telecommunications andInformatics, Multimedia Systems Department, ul. Narutowicza 11/12, 80-233 Gdansk,Poland, [email protected]
Andrzej CzyżewskiGdansk University of Technology, Faculty of Electronics, Telecommunications andInformatics, Multimedia Systems Department, ul. Narutowicza 11/12, 80-233 Gdansk,Poland, [email protected]
Bożena KostekGdansk University of Technology, Faculty of Electronics, Telecommunications andInformatics, Audio Acoustics Laboratory, ul. Narutowicza 11/12, 80-233 Gdansk, Poland,[email protected]
Received: 10.11.2012Revised: 16.01.2013Accepted: 11.02.2013
17 maja 2013 str. 12/12
242 Maciej Szczodrak, Józef Kotus, Andrzej Czyżewski, Bożena Kostek