precision pressure/temperature logging tool1 precision pressure/temperature logging tool ......
TRANSCRIPT

SAND98-0165Unlimited Release
Printed January 1998
Precision Pressure/Temperature Logging Tool
Joseph A. Henfling and Randy A. NormannGeothermal Research Department
Sandia National LaboratoriesP.O. Box 5800
Albuquerque, NM 87185-1033
Abstract
Past memory logging tools have provided excellent pressure/temperature data when usedin a geothermal environment, and they are easier to maintain and deploy than toolsrequiring an electric wireline connection to the surface. However, they are deficient sincethe tool operator is unaware of downhole conditions that could require changes in thelogging program. Tools that make “decisions” based on preprogrammed scenarios canpartially overcome this difficulty, and a suite of such memory tools has been developed atSandia National Laboratories. The first tool, which forms the basis for future instruments,measures pressure and temperature. Design considerations include a minimization of costwhile insuring quality data, size compatibility with diamond-cored holes, operation inholes to 425°C (800°F), transportability by ordinary passenger air service, and ease ofoperation. This report documents the development and construction of thepressure/temperature tool. It includes: 1) description of the major components; 2)calibration; 3) typical logging scenario; 4) tool data examples; and 5) conclusions. Themechanical and electrical drawings, along with the tool’s software, will be furnished uponrequest.
This work was sponsored by the U.S. Department of Energy, Office of GeothermalTechnologies.
DistributionCategory UC-1240
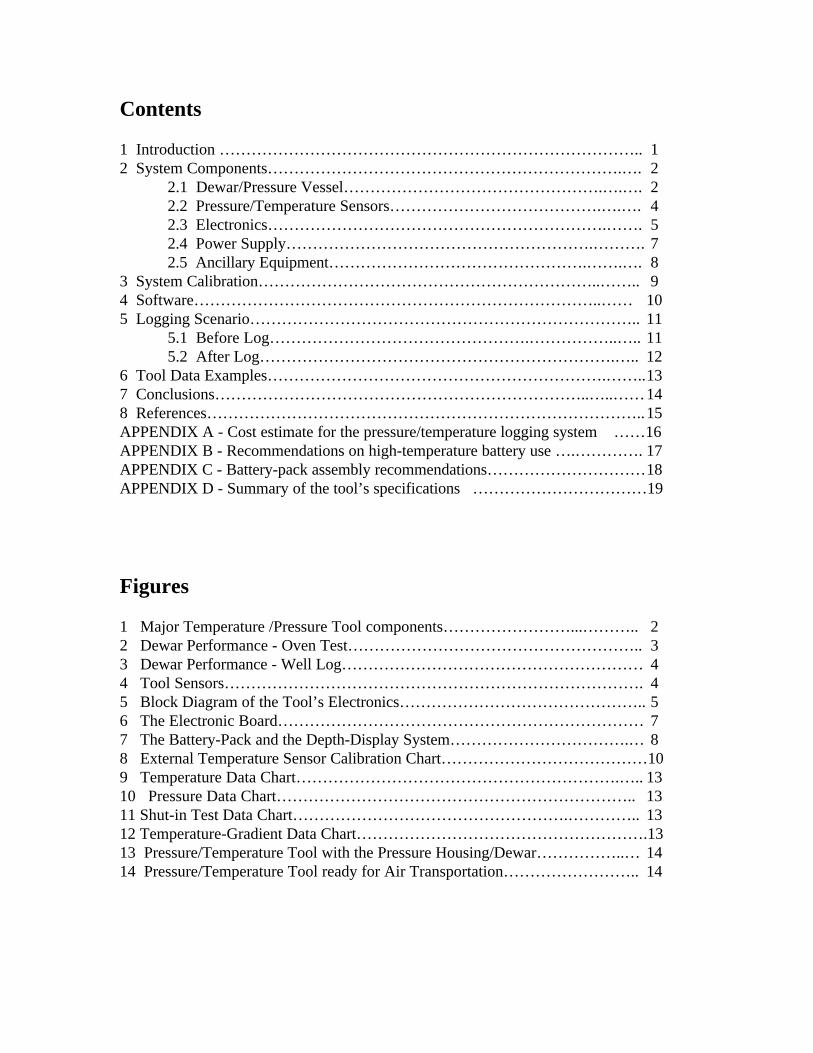
Contents
1 Introduction …………………………………………………………………….. 12 System Components………………………………………………………….…. 2
2.1 Dewar/Pressure Vessel………………………………………….….…. 22.2 Pressure/Temperature Sensors………………………………….….…. 42.3 Electronics……………………………………………………….……. 52.4 Power Supply………………………………………………….………. 72.5 Ancillary Equipment………………………………………….…….…. 8
3 System Calibration………………………………………………………..…….. 94 Software…………………………………………………………………..…… 105 Logging Scenario……………………………………………………………….. 11
5.1 Before Log………………………………………….……………..….. 115.2 After Log………………………………………………………….….. 12
6 Tool Data Examples……………………………………………………….……..137 Conclusions……………………………………………………………..…..……148 References………………………………………………………………………..15APPENDIX A - Cost estimate for the pressure/temperature logging system ……16APPENDIX B - Recommendations on high-temperature battery use ….…………. 17APPENDIX C - Battery-pack assembly recommendations…………………………18APPENDIX D - Summary of the tool’s specifications ……………………………19
Figures
1 Major Temperature /Pressure Tool components……………………...……….. 22 Dewar Performance - Oven Test……………………………………………….. 33 Dewar Performance - Well Log………………………………………………… 44 Tool Sensors……………………………………………………………………. 45 Block Diagram of the Tool’s Electronics……………………………………….. 56 The Electronic Board…………………………………………………………… 77 The Battery-Pack and the Depth-Display System…………………………….… 88 External Temperature Sensor Calibration Chart…………………………………109 Temperature Data Chart…………………………………………………….….. 1310 Pressure Data Chart………………………………………………………….. 1311 Shut-in Test Data Chart…………………………………………….………….. 1312 Temperature-Gradient Data Chart……………………………………………….1313 Pressure/Temperature Tool with the Pressure Housing/Dewar……………..… 1414 Pressure/Temperature Tool ready for Air Transportation…………………….. 14
1
Precision Pressure/Temperature Logging Tool
1 Introduction
Downhole temperature measurements are necessary for the evaluation of geothermalreservoirs, and they have been accomplished through the use of numerous devices.Simple measurements are made by using maximum-reading thermometers, or by using tabsconstructed of temperature-sensitive materials that change color whenever a criticaltemperature is exceeded. Both devices return one data point per deployment, so acontinuous log is not practical. The data from these devices may be in question becausethey respond to maximum temperature, and this may not be the bottom-hole temperaturethe user is assuming. Continuous logs from a single deployment are made by tools thatreturn data to the surface through the use of an electric wireline, or from memory toolsthat store data either mechanically (by scribing a curve on a rotating cylinder) orelectronically.
Continuous and repeated temperature measurements have been found to be much moredesirable, especially when made at convenient times during a drilling operation, such aswhen the drill rig is receiving maintenance. The resulting data yields valuable informationpertinent to the reservoir, and it helps in the design of the well itself. For example, evensmall lost-circulation zones produce a fine-structure on a temperature log, and these zonesare candidates for future production since they exhibit above-average permeability.Furthermore, exercises involving the injection of cool fluids into the casing-formationannulus have been used to identify zones that possess an unsatisfactory cement bond.
Wireline tools and memory tools provide the user with the same quality measurement.Both systems have their advantages and disadvantages. The disadvantage of wireline toolsis that they require the use of a logging truck and an electric cable which typically has atemperature limit of approximately 300°C (572°F). Logging trucks and high-temperaturecable are expensive and require maintenance to ensure a quality log. The advantage is thatthe data is real-time, and as such, the tool functionality is known and unexpectedsituations can be overcome. The disadvantage of memory-based tools is that the tool’sfunctionality is not known until the tool is retrieved and downloaded after the log. Theadvantage is that the tool can be deployed using a slickline which is inexpensive and isfound at virtually all drilling operations. Therefore, no logging truck is required to deploythe tool.
Sandia National Laboratories, with funding from the U.S. Department of Energy, hasdeveloped geothermal logging tools based on the memory concept.1 For a memory-basedtool to be practical for use in the geothermal environment, it must possess some basicqualities: 1) the tool must be smart in the sense that it can be programmed to make
2
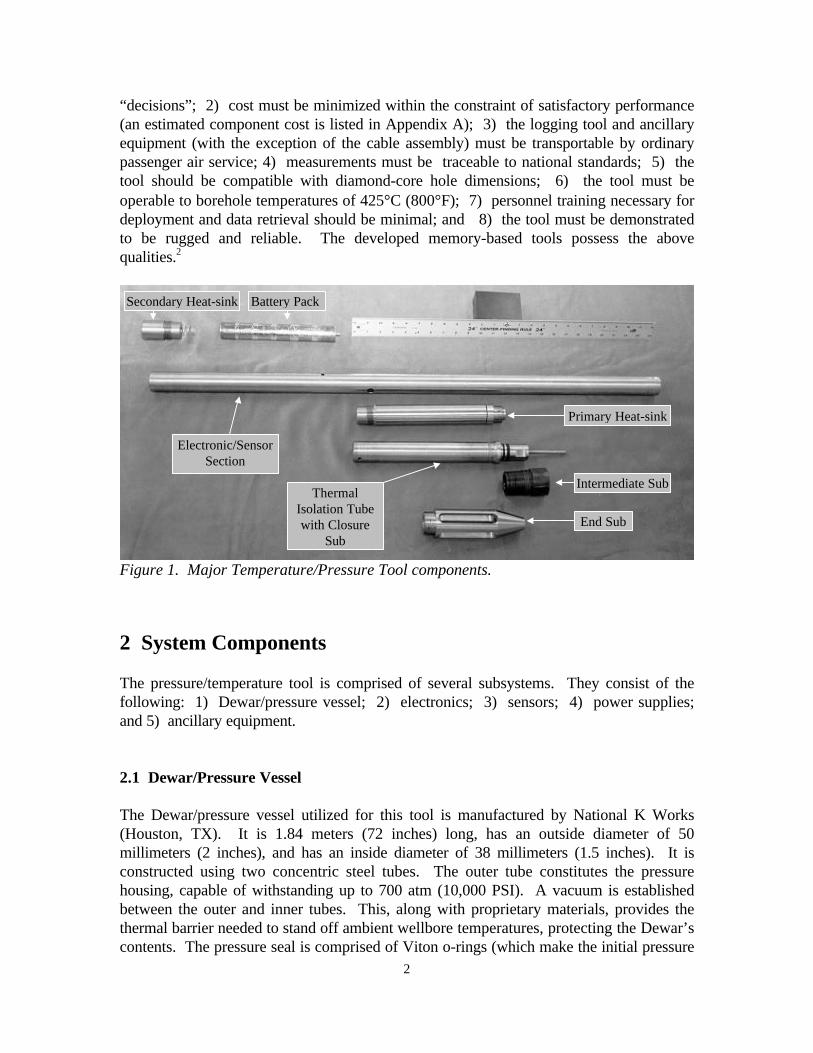
“decisions”; 2) cost must be minimized within the constraint of satisfactory performance(an estimated component cost is listed in Appendix A); 3) the logging tool and ancillaryequipment (with the exception of the cable assembly) must be transportable by ordinarypassenger air service; 4) measurements must be traceable to national standards; 5) thetool should be compatible with diamond-core hole dimensions; 6) the tool must beoperable to borehole temperatures of 425°C (800°F); 7) personnel training necessary fordeployment and data retrieval should be minimal; and 8) the tool must be demonstratedto be rugged and reliable. The developed memory-based tools possess the abovequalities.2
Figure 1. Major Temperature/Pressure Tool components.
2 System Components
The pressure/temperature tool is comprised of several subsystems. They consist of thefollowing: 1) Dewar/pressure vessel; 2) electronics; 3) sensors; 4) power supplies;and 5) ancillary equipment.
2.1 Dewar/Pressure Vessel
The Dewar/pressure vessel utilized for this tool is manufactured by National K Works(Houston, TX). It is 1.84 meters (72 inches) long, has an outside diameter of 50millimeters (2 inches), and has an inside diameter of 38 millimeters (1.5 inches). It isconstructed using two concentric steel tubes. The outer tube constitutes the pressurehousing, capable of withstanding up to 700 atm (10,000 PSI). A vacuum is establishedbetween the outer and inner tubes. This, along with proprietary materials, provides thethermal barrier needed to stand off ambient wellbore temperatures, protecting the Dewar’scontents. The pressure seal is comprised of Viton o-rings (which make the initial pressure
Electronic/SensorSection
Primary Heat-sink
ThermalIsolation Tubewith Closure
Sub
Secondary Heat-sink Battery Pack
Intermediate Sub
End Sub
3
seal), and a metal-to-metal seal. This seal is needed for operations above 300°C where o-rings will fail. Sandia has considerable experience using this type of seal arrangement withexcellent results. The outer tube is made of PH17-4 stainless steel. This material has ahigh yield strength and good corrosion-resistant properties. Other applications, such aslong deployments in highly corrosive wells or applications requiring the use of amagnetometer, will require other alloys to be utilized. The inner tube does not have thestrength or corrosion requirements of the outer tube. As such, it is made out of 300-seriesstainless steel. The sealing sub contains a thermowell (providing pressure protection forthe temperature sensor) and a filtered pressure port.
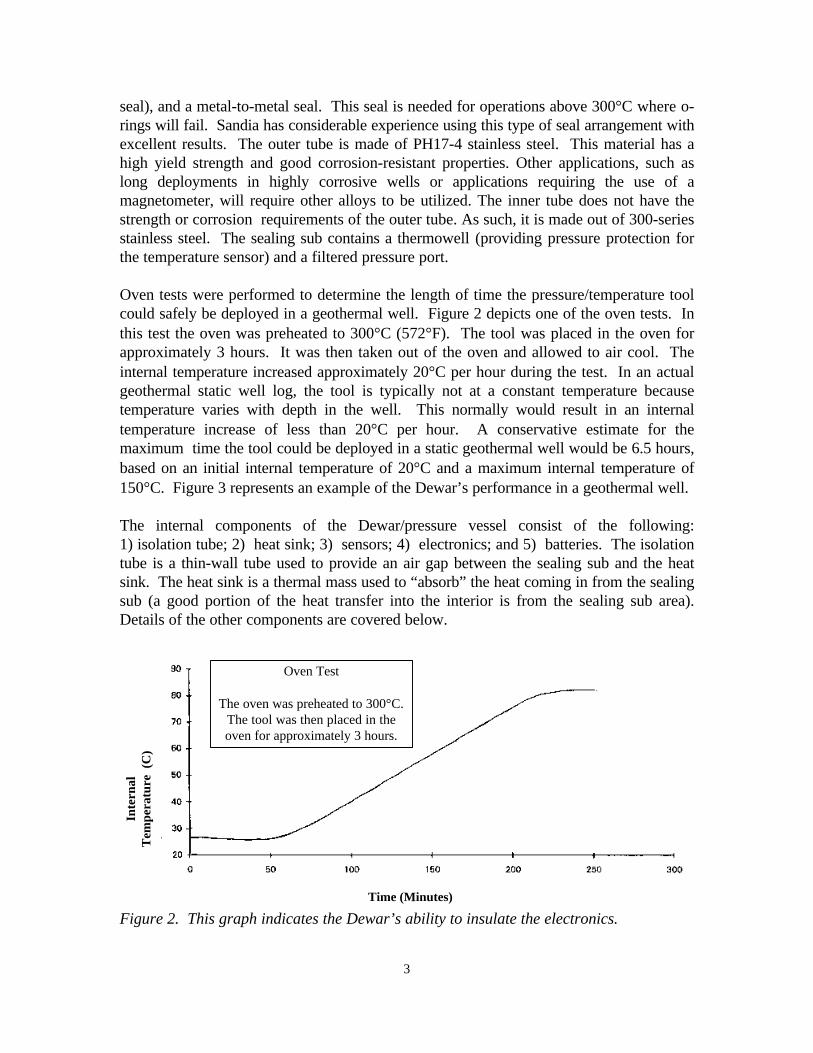
Oven tests were performed to determine the length of time the pressure/temperature toolcould safely be deployed in a geothermal well. Figure 2 depicts one of the oven tests. Inthis test the oven was preheated to 300°C (572°F). The tool was placed in the oven forapproximately 3 hours. It was then taken out of the oven and allowed to air cool. Theinternal temperature increased approximately 20°C per hour during the test. In an actualgeothermal static well log, the tool is typically not at a constant temperature becausetemperature varies with depth in the well. This normally would result in an internaltemperature increase of less than 20°C per hour. A conservative estimate for themaximum time the tool could be deployed in a static geothermal well would be 6.5 hours,based on an initial internal temperature of 20°C and a maximum internal temperature of150°C. Figure 3 represents an example of the Dewar’s performance in a geothermal well.
The internal components of the Dewar/pressure vessel consist of the following:1) isolation tube; 2) heat sink; 3) sensors; 4) electronics; and 5) batteries. The isolationtube is a thin-wall tube used to provide an air gap between the sealing sub and the heatsink. The heat sink is a thermal mass used to “absorb” the heat coming in from the sealingsub (a good portion of the heat transfer into the interior is from the sealing sub area).Details of the other components are covered below.
Inte
rnal
Tem
pera
ture
(C
)
Time (Minutes)
Figure 2. This graph indicates the Dewar’s ability to insulate the electronics.
Oven Test
The oven was preheated to 300°C.The tool was then placed in theoven for approximately 3 hours.

4
Figure 3. This graph represents the Dewar’s behavior in a geothermal well.
2.2 Pressure/Temperature Sensors
Figure 4. The photo on the left depicts the RTD temperature probe. It is 1/8 inch indiameter and 12 inches in length. The photo on the right depicts the pressure transducer.It is one inch in diameter and 9 inches in length.
Pressure measurements are needed to define the characteristics of a producing reservoir.Furthermore, pressure and temperature measurements provide a determination of depthassuming that the equation of state of the borehole fluid is known.3 Measurementrequirements are satisfied if pressure determinations can be made to ± 0.07 atm (± 1.0psi). Quartz-oscillator transducers are capable of exceeding this requirement. Precisiontemperature measurements can be utilized to help characterize wells. Characteristics suchas production zone, lost-circulation zones, change in lithology and steam-liquid interfacescan be ascertained from this measurement.
Presently, the tool utilizes the Quartzdyne, Inc, (Salt Lake City, UT) Model QB-10Kquartz pressure transducer. By virtue of its design, it is well suited for use in a downholeapplication. It is robust for downhole applications and can handle air and truck shipments.It features a frequency output based on pressure, a frequency output based on thetemperature of the transducer (this is used to maintain accurate pressure readings atelevated temperatures) and a reference frequency that can be used to determine thepressure frequency. Paroscientific, Inc. (Redmond, WA) Model 46K-178 pressure sensorswere initially chosen for pressure measurements since they fit conveniently into thepressure vessel, and they were secondary standards used by the calibration teams atSandia. While these sensors performed satisfactorily when used downhole, we found themsensitive to shock, and one unit was damaged in transit. Since the purchase of theQuartzdyne transducers, Paroscientific has developed a pressure transducer for downholeapplications that is less shock-sensitive. Sandia has not tested this transducer.
External Temperature
Internal Temperature
5
Temperature measurements are made with an RDF Corporation (Hudson, NH) Model218a(SP)-21-20-A-96 platinum Resistance Temperature Detector (RTD). Presently, thetool utilizes an Analog Devices part number AD7711 analog-to-digital converter tomeasure the resistance change of the RTD. It employs a sigma-delta conversion techniqueto realize up to 24 bits with no missing codes. This enables temperatures of ± .001°C tobe resolved. It features a programmable-gain front end (which allows the use of differentresistance-value RTD’s without hardware changes), two-channel input (one differentialanalog input and one single-ended analog input), programmable digital filter, and access tothe chip’s on board calibration, all through a 3-wire serial interface. This device alsofeatures RTD excitation currents, but due to the temperature range the electronics will beexposed to, this option did not possess the temperature stability needed for thisapplication. The excitation for the RTD is provided by an Analog Devices part numberAD780 voltage reference. This device has excellent temperature stability.
The AD7711 has an operating temperature limit of 125° to 135°C (depending on thedevice tested). The device “shuts down” above this value until it is allowed to cool. Thetool’s microprocessor switches from the AD7711 to an Analog Devices voltage-to-frequency converter (AD537) to make the external temperature measurement when thetool electronics’ internal temperature exceeds 115°C. An AD537 voltage-to-frequencyconverter was initially chosen for making this measurement in the prototype tool. TheAD537 is operable above 150°C. It has an approximate 14-bit resolution capability(resolution of ± 0.008°C). After fielding this instrument, it was discovered that advancedtemperature gradient measurements require a higher resolution than the AD537 couldprovide. This was not an original tool design criterion but would be useful in somegeothermal applications.
2.3 Electronics
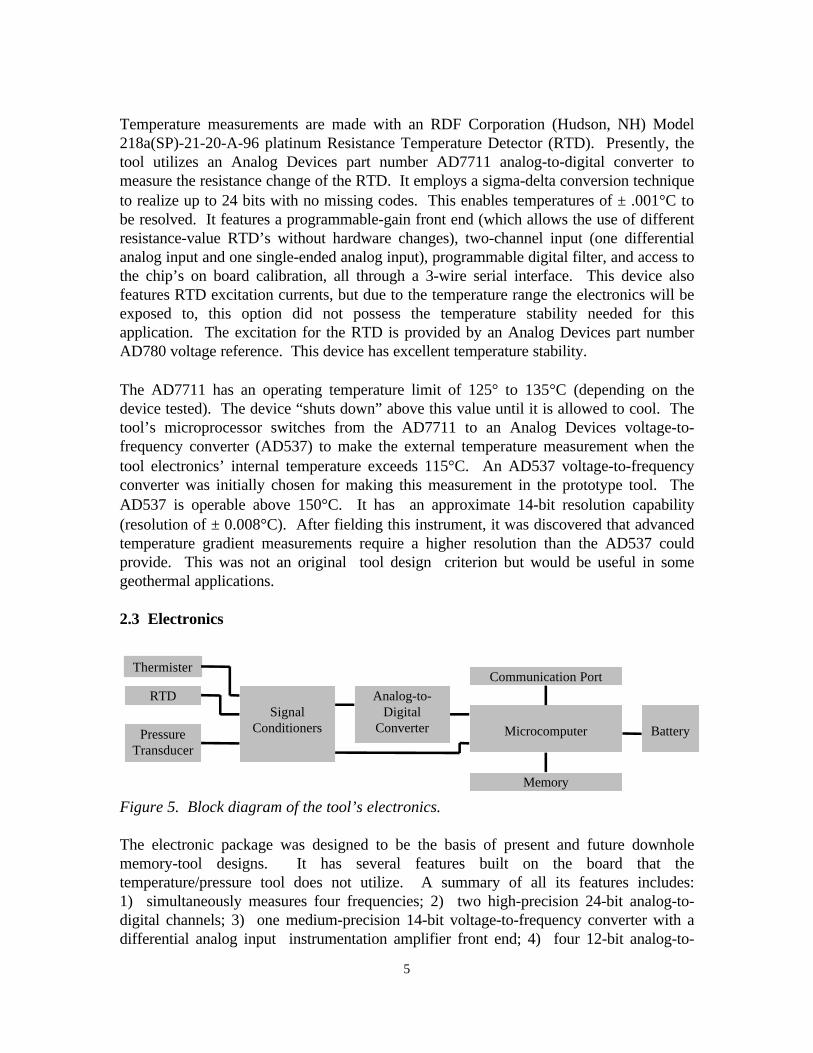
Figure 5. Block diagram of the tool’s electronics.
The electronic package was designed to be the basis of present and future downholememory-tool designs. It has several features built on the board that thetemperature/pressure tool does not utilize. A summary of all its features includes:1) simultaneously measures four frequencies; 2) two high-precision 24-bit analog-to-digital channels; 3) one medium-precision 14-bit voltage-to-frequency converter with adifferential analog input instrumentation amplifier front end; 4) four 12-bit analog-to-
RTD
PressureTransducer
SignalConditioners
Analog-to-Digital
Converter
Communication Port
Microcomputer
Memory
Battery
Thermister

6
digital channels; 5) battery backup for the data; 6) board temperature; 7) main batteryvoltage monitor; 8) two thermister inputs; 9) operation of an external relay; 10) sevenI/O ports; and 11) tool status indicator.
The temperature/pressure tool is utilizing three of the frequency channels. Two channelsare needed to make the pressure measurement (one for the pressure and the other for thetemperature of the pressure transducer), and the third channel is needed to determine thefrequency from the voltage-to-frequency converter AD537. The tool also utilizes a board-mounted, high-temperature lithium battery for memory back-up in the event the mainbatteries fail. A small light-emitting diode (LED) is used to provide the operator with anindication of tool status upon installation of the main batteries. The tool also monitorsthe board temperature and the battery voltage.
The heart of the electronic package is a microcomputer purchased from Onset ComputingCompany (North Falmouth, MA). Their Model 5F is of a size compatible with the 38-millimeter (1.5-inch) interior diameter of the pressure vessel. The microcomputer featuresone frequency (or period) port capable of measuring frequencies up to 30 KHz, eight 12-bit single-ended analog-to-digital input channels, fourteen I/O ports that can passinformation to another computer or to switches, relays, and other devices such as theAD7711 used to make the external temperature measurement. It has 32 four-byteEEPROM storage locations that can be used to store sensor calibrations, serial numbers,etc. that would be unique to a particular tool. This memory has a finite number of writecycles. It has a 32K-by-8 flash EEPROM to store the operating system and the user’sprogram. It has one 512K-by-8 static RAM chip. This provides 480K bytes for datastorage. The remaining memory is used to store the user’s program and the associatedvariables. While these features made the Model 5F suitable for this application, the systemwas not rated for operation at 150°C, the anticipated maximum operational temperature ofthe tool electronics. A series of oven tests, however, proved the system to be functionalabove this temperature. Qualifying components in excess of manufacturer’s specificationsare common within the high-temperature electronics industry. The market is so small thatalmost no manufacturer tests above the military specification of 125°C. The Model 5Fuses CMOS electronics and is a good candidate for high-temperature operation. ManyCMOS devices have been qualified for operation up to 200°C.
The Model 5F requires some modifications to allow its use in this application. Theyinclude the following: 1) Battery backup capability. This feature is essential for adownhole tool. The RAM is backed up by a high-temperature battery that lasts for morethan a year. This modification allows the data to be retained if the main battery fails. 2)Crystal-oscillator upgrade. Stable time is essential to allow the tool’s data to be properlysynchronized with the uphole computer time and for accurate frequency-dependentmeasurements. A 9.8304 MHz crystal-oscillator from Hi-Temp Research Labs (WestlakeVillage, CA), Model C17TA, designed for use between 0 and 150°C (32 - 302°F) with atemperature stability of ± 50 PPM, is used by the microcomputer, the AD7711 analog-to-digital converter, and the field-programmable gate array (FPGA). 3) Modification toallow direct PC board mounting.
7
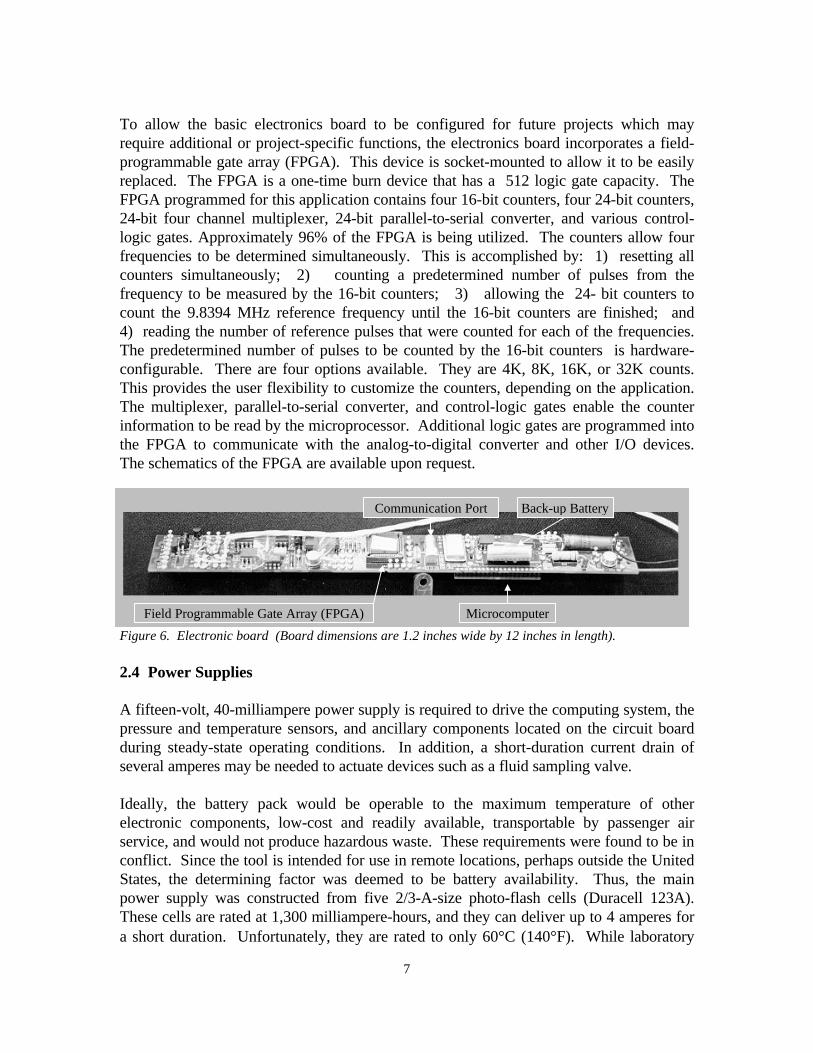
To allow the basic electronics board to be configured for future projects which mayrequire additional or project-specific functions, the electronics board incorporates a field-programmable gate array (FPGA). This device is socket-mounted to allow it to be easilyreplaced. The FPGA is a one-time burn device that has a 512 logic gate capacity. TheFPGA programmed for this application contains four 16-bit counters, four 24-bit counters,24-bit four channel multiplexer, 24-bit parallel-to-serial converter, and various control-logic gates. Approximately 96% of the FPGA is being utilized. The counters allow fourfrequencies to be determined simultaneously. This is accomplished by: 1) resetting allcounters simultaneously; 2) counting a predetermined number of pulses from thefrequency to be measured by the 16-bit counters; 3) allowing the 24- bit counters tocount the 9.8394 MHz reference frequency until the 16-bit counters are finished; and4) reading the number of reference pulses that were counted for each of the frequencies.The predetermined number of pulses to be counted by the 16-bit counters is hardware-configurable. There are four options available. They are 4K, 8K, 16K, or 32K counts.This provides the user flexibility to customize the counters, depending on the application.The multiplexer, parallel-to-serial converter, and control-logic gates enable the counterinformation to be read by the microprocessor. Additional logic gates are programmed intothe FPGA to communicate with the analog-to-digital converter and other I/O devices.The schematics of the FPGA are available upon request.
Figure 6. Electronic board (Board dimensions are 1.2 inches wide by 12 inches in length).
2.4 Power Supplies
A fifteen-volt, 40-milliampere power supply is required to drive the computing system, thepressure and temperature sensors, and ancillary components located on the circuit boardduring steady-state operating conditions. In addition, a short-duration current drain ofseveral amperes may be needed to actuate devices such as a fluid sampling valve.
Ideally, the battery pack would be operable to the maximum temperature of otherelectronic components, low-cost and readily available, transportable by passenger airservice, and would not produce hazardous waste. These requirements were found to be inconflict. Since the tool is intended for use in remote locations, perhaps outside the UnitedStates, the determining factor was deemed to be battery availability. Thus, the mainpower supply was constructed from five 2/3-A-size photo-flash cells (Duracell 123A).These cells are rated at 1,300 milliampere-hours, and they can deliver up to 4 amperes fora short duration. Unfortunately, they are rated to only 60°C (140°F). While laboratory
Field Programmable Gate Array (FPGA) Microcomputer
Communication Port Back-up Battery
8
experiments indicate that the cells are operable to at least 100°C (212°F), the tool shouldnot be operated with these batteries where internal temperatures may exceed 60°C sincethe behavior of energetic devices containing corrosive chemicals is unpredictable.
Alternately, the tool can be supplied with high-temperature lithium/thionyl chloride cellsavailable from Battery Engineering, Inc. (Hyde Park, MA). These cells cannot provide thehigher currents, are not widely available, and are five times the price, but they will operateup to 150°C (302°F). Because of the chemistry needed to allow operation up to 150°C,they do not behave as predictably as standard batteries. An internal passivaton layerquickly forms during battery storage which seriously degrades battery performance. Aprocedure must be followed to de-passivate the batteries prior to deployment. This is notan insurmountable problem, but the user must be aware of this inherent characteristic.Recommendations for using high temperature batteries are documented in Appendix B.
In either case, the batteries are housed in a cylinder with spring-loaded contacts. Battery-pack assembly recommendations are given in Appendix C.
2.5 Ancillary Equipment
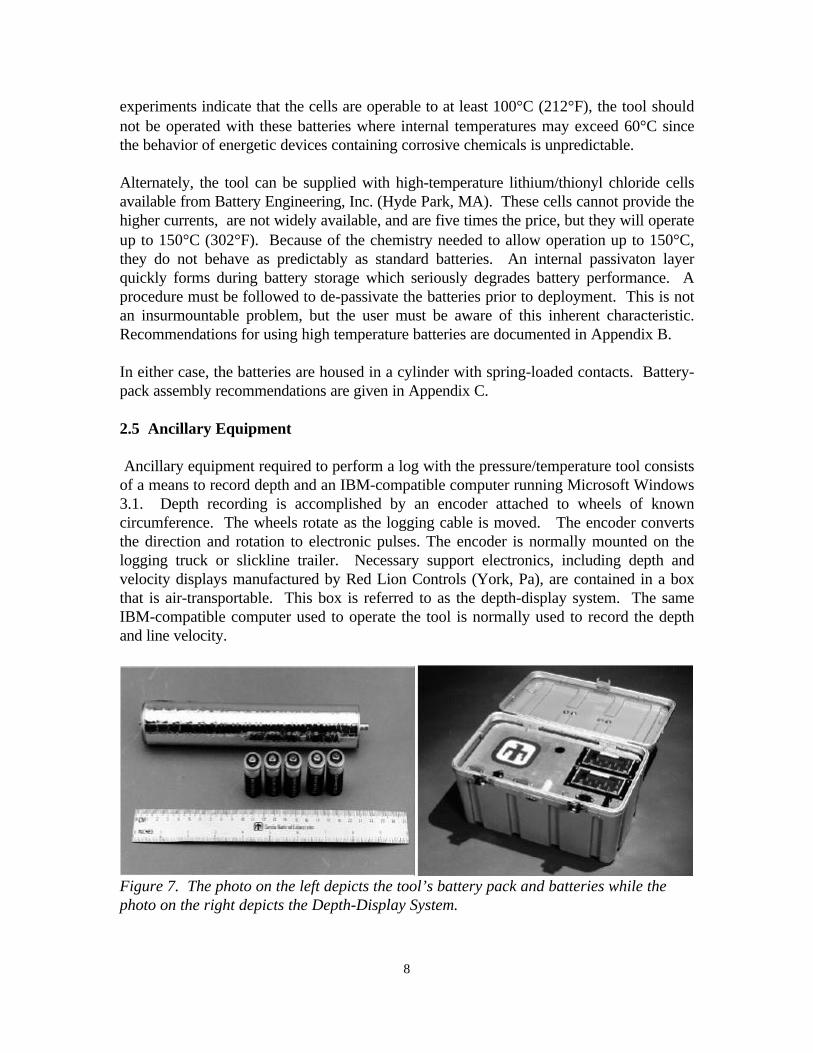
Ancillary equipment required to perform a log with the pressure/temperature tool consistsof a means to record depth and an IBM-compatible computer running Microsoft Windows3.1. Depth recording is accomplished by an encoder attached to wheels of knowncircumference. The wheels rotate as the logging cable is moved. The encoder convertsthe direction and rotation to electronic pulses. The encoder is normally mounted on thelogging truck or slickline trailer. Necessary support electronics, including depth andvelocity displays manufactured by Red Lion Controls (York, Pa), are contained in a boxthat is air-transportable. This box is referred to as the depth-display system. The sameIBM-compatible computer used to operate the tool is normally used to record the depthand line velocity.
Figure 7. The photo on the left depicts the tool’s battery pack and batteries while thephoto on the right depicts the Depth-Display System.

9
3 System Calibration
Prior to system calibration, the electronic board is “burned-in” to identify any componentsthat may fail prematurely. This is accomplished by operating the electronics whileperforming a minimum of three cycles through the expected internal temperature rangeinside the Dewar. This temperature range is 0 to 150°C (32 - 302°F). The electronics areheld at 150°C (302°F) for a minimum of seven hours at the completion of each cycle.
To establish the measurement variation the electronics will have due to increasing boardtemperature inside the Dewar, the electronics are placed in an oven with the pressuretransducer. Borehole temperatures are simulated through inputs from a calibratedresistance box outside the oven. Likewise, pressure is imposed on the pressure transducerwith a calibrated dead-weight test device. Ten predetermined resistance values andpressures were imposed on the electronics at six temperatures between 0 and 150°C (32 -302°F). The variation due to temperature is recorded and, if needed, can then becompensated. In testing, the AD7711 required no compensation. The pressure transducerhas a temperature sensor built into the unit to compensate for temperature variations thatwould affect the pressure measurement. The manufacturer’s coefficients were verified,and no further compensation was required. The AD537, however, does need to becompensated. The oven temperature is monitored using a calibrated thermometer. Oventemperatures are used to calibrate the board-mounted thermister that provides the internal-temperature measurement.
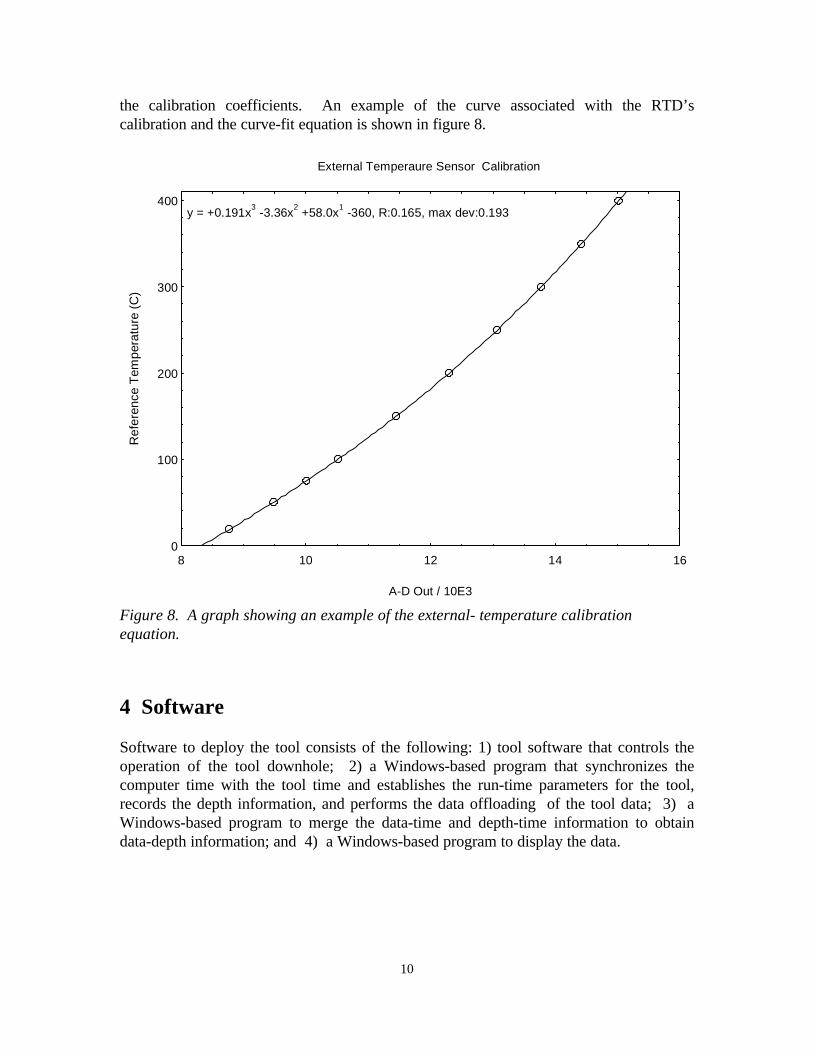
The final step in the calibration process is to incorporate into the system the RTD that willbe used to make the external temperature measurement. This is done by connecting theRTD to the electronics using the proper length of wire to enable its use in the assembledtool. The RTD is placed in an RTD heat source. This device has an aluminum block withseveral holes. The RTD to be calibrated is placed into this block along with a primary-standards-quality reference probe. Ten temperature values between ambient and 400°C(752°F) are used to formulate the coefficients needed to calibrate the tool’s RTD. Usingthe generated data, a scientific plotting and data analysis software package from SpiralSoftware is utilized to generate a third-order polynomial equation. The tool’s softwarecalculates the temperature using this equation. A probe calibrated to primary-standardsrelies on known melting and freezing points of different materials. These values areknown to a very high degree of accuracy. The reference probe can then be calibrated to ahigh degree of accuracy. It is standard practice for temperature measurements to reducethe claimed accuracy of a probe that is calibrated using another probe for reference by afactor of 10 for a calibration interval of one year. The higher the accuracy of the referenceprobe, the higher the secondary probe’s claimed accuracy can be. The reference probeused to calibrate the RTD has an accuracy of ± 0.02°C for temperatures up to 100°C and± 0.05°C for temperatures between 101° and 400°C. Therefore, the tool’s RTD, when itis calibrated as a system, can have a claimed accuracy of ± 0.2°C for temperatures up to100°C and ± 0.5°C for temperatures between 101° and 400°C. Calibration is verified tobe correct by heating the probe in the RTD heat source to values not used to determine
10
the calibration coefficients. An example of the curve associated with the RTD’scalibration and the curve-fit equation is shown in figure 8.
0
100
200
300
400
8 10 12 14 16
y = +0.191x3 -3.36x
2 +58.0x
1 -360, R:0.165, max dev:0.193
A-D Out / 10E3
Ref
eren
ce T
empe
ratu
re (
C)
External Temperaure Sensor Calibration
Figure 8. A graph showing an example of the external- temperature calibrationequation.
4 Software
Software to deploy the tool consists of the following: 1) tool software that controls theoperation of the tool downhole; 2) a Windows-based program that synchronizes thecomputer time with the tool time and establishes the run-time parameters for the tool,records the depth information, and performs the data offloading of the tool data; 3) aWindows-based program to merge the data-time and depth-time information to obtaindata-depth information; and 4) a Windows-based program to display the data.

11
5 Logging Scenario
While there are many factors that may influence the set-up and operation of thepressure/temperature tool, the following is an example of the steps required to operate thetool:
5.1 Before Log1) Prepare the battery pack for deployment. Details on the battery pack assembly are
documented in Appendix C.2) Purge the pressure transducer line. This is accomplished by removing the outer sleeve
from the primary heat-sink to expose the purge fitting. Remove this fitting and installthe oil can adapter fitting. Inject oil into this line until no bubbles are present at thepressure inlet port (the tool’s end sub should be slightly elevated). Replace the purgefitting and re-install the outer sleeve to the primary heat-sink.
3) Connect the encoder to the wireline or slickline that will be used to lower the tool intothe well. Verify depth calibration with the wireline/slickline operator. Note:Calibration may require the scale factor for the depth display system to be adjusted.
4) Install the battery pack and replace the secondary heat-sink.5) Connect the tool to a laptop computer.6) Click on the PT Tool software icon. Press the “tool start” button. This Windows-
based program will step the user through the tool set-up procedure. This includessynchronizing the computer time with the tool time and establishing the run-timeparameters for the tool.
7) After the tool is started and the light-emitting-diode (LED) indicator is illuminating atevery data interval, disconnect the tool from the computer.
8) Assemble the tool. This is accomplished by: a) Attaching the appropriate tool topadapter to the top of the Dewar to enable connection to the slickline/wireline. b)Sliding the tool into the Dewar and attaching the proper end sub. Note: The tool iskept from rotating when the end sub is screwed into place by utilizing the end subwrench. This wrench has pins that engage into the tool’s pressure sub and is heldwhile the end sub is screwed into place. c) Installing the Belleville washers along withthe brass load washer. d) Attaching the bull nose that protects the thermal well andhas a tapered bottom end. Note: The Dewar is prevented from rotating using a girthwrench placed approximately 6 inches from the end of the Dewar’s opened end.
9) Connect the assembled tool to the slickline/wireline.10) Connect the depth display system to the computer. Press the “record depth” button.
This part of the program steps the user though the process required to record thedepth information. Recording of the depth information dominates the computer forthe duration of the logging process. When the time is appropriate, initiate the start ofthe depth file by clicking on the “start test’ button. The user can set flags which areindicated in the depth file as a flag number with a time stamp. This feature is useful tolater identify logging activities that may have transpired during the log (such as thetool “hanging up” in the well). Note: The laptop computer used to take the depthinformation must have the power- and screen-saving options turned off.
12
5.2 After Log
1) Disconnect the tool from the slickline/wireline.2) Stop the computer from taking depth information by clicking on the “end test” button.
Enter any post-log comments. The program will display the main menu.3) Disassemble the tool and remove the electronics from the Dewar.4) Connect the communication port to the computer and click the “offload tool” button
from the main menu. The program will prompt the user for the file name to use tostore the tool’s data. Click the “offload” button to initiate the offload. The programwill display the status of the offload process and will display the main menu when theoffload is complete. Click the “exit” button to terminate this program.
5) Click the “merge” icon. This will initiate the merging of the data vs. time file from thetool with the depth vs. time from the depth file to create the depth vs. data file. Theprogram will prompt the user for the two files to merge and the name of the file thatwill contain the merged data. As the files are being merged, the program will displaythe maximum temperature of the well for the user’s convenience. When this process iscomplete, select “file” and then “exit” to terminate this program.
6) Now the data is ready for displaying. This is accomplished by clicking on the“display” icon. This program will display the data vs. time or depth. The user canselect what data to display by choosing a variety of predefined buttons. The user candisplay two sets of data on one plot. Buttons can be added or edited to better displaydata for a particular application. The data can be filtered, if needed, by setting up thefilter option in this software. This program has several unique features to enable thetool’s data to be displayed and printed easily. Alternately, the data can be importedinto other programs such as Lotus or Excel for plotting.
13
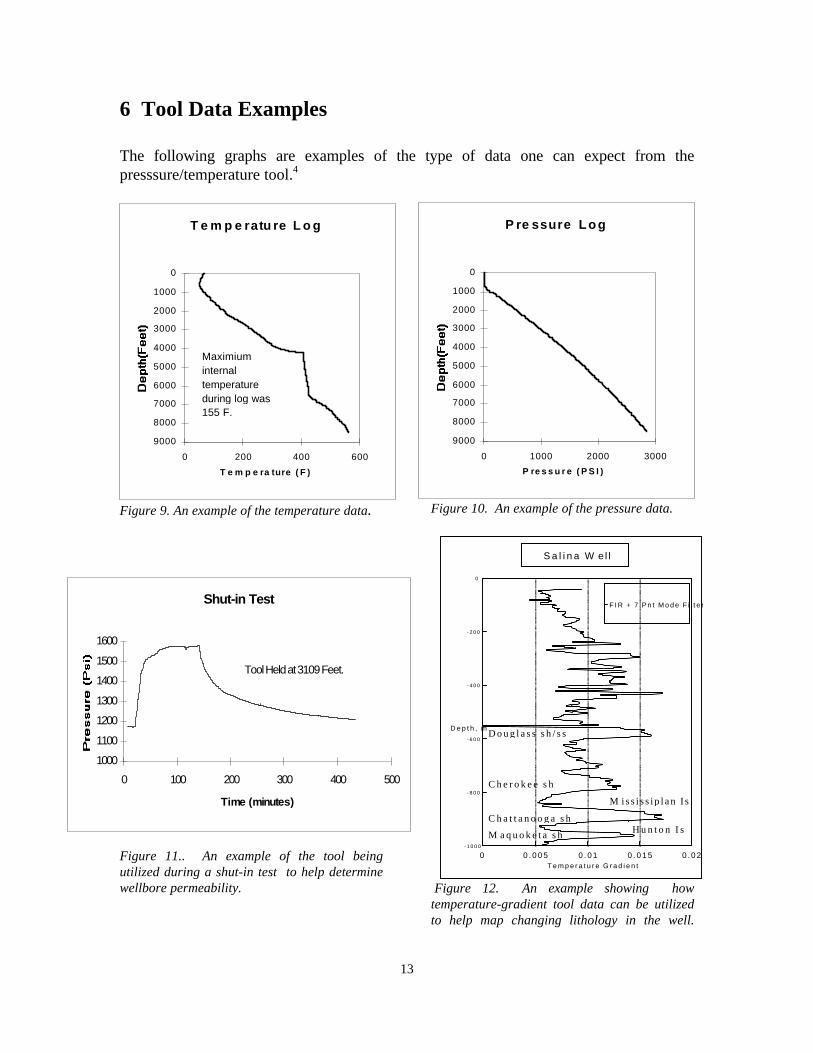
6 Tool Data Examples
The following graphs are examples of the type of data one can expect from thepresssure/temperature tool.4
T e m p e ratu re L o g
0
1000
2000
3000
4000
5000
6000
7000
8000
9000
T e m p e ra ture ( F )
0 200 400 600
Maximium internal temperature during log was 155 F.
P re ssure Log
0
1000
2000
3000
4000
5000
6000
7000
8000
9000
P re s s u r e ( P S I )
0 1000 2000 3000
Figure 9. An example of the temperature data. Figure 10. An example of the pressure data.
Figure 11.. An example of the tool beingutilized during a shut-in test to help determinewellbore permeability. Figure 12. An example showing how
temperature-gradient tool data can be utilizedto help map changing lithology in the well.
0 0 . 0 0 5 0 . 0 1 0 . 0 1 5 0 . 0 2- 1 0 0 0
- 8 0 0
- 6 0 0
- 4 0 0
- 2 0 0
0
T e m p e r a t u r e G r a d i e n t
D e p t h , m
F I R + 7 P n t M o d e F i l t e r
S a l i n a W e l l
C h a t t a n o o g a s hH u n t o n I sM a q u o k e t a s h
M i s s i s s i p l a n I s
C h e r o k e e s h
D o u g l a s s s h / s s
Shut-in Test
1000
1100
1200
1300
1400
1500
1600
0 100 200 300 400 500
Time (minutes)
Tool Held at 3109 Feet.

14
7 Conclusion
This tool was designed to provide the geothermal industry with a reliable, easilytransportable, precision pressure/temperature tool with design attributes that minimizecost. It has been utilized in the harsh geothermal environment to perform several dozenlogs without a single failure or loss of data. Software to deploy the tool is Windows-based and has been developed to be easy to implement. The tool is easily transportable.The tool and its associated components have been checked as “baggage” on many airlineflights and flown to job sites.
The mechanical and electrical drawings along with the tool’s software will be furnishedupon request.
Figure 13. Pictured above is the Pressure/Temperature Tool. The tool isapproximately six feet in length.
Figure 14. Pictured above is the Pressure/Temperature Tool and its associatedcomponents ready for air transportation to the well site.
Payload
Pressure Housing/ Dewar
15
8 References
1. Lysne, P., R. Normann, and J. Henfling, “Instrumentation Development in Support of theGeothermal Industry”, Federal Geothermal Research Program Update 1995, U.S. Department ofEnergy, pp.3-23 through 3-28, 1995.
2. Lysne, P.,and J. Henfling, “Design of a Pressure/Temperature Logging System for GeothermalApplications”, Proc. U.S. Dept. of Energy Geothermal Program Review XII, pp.155-161, 1994.
3. Lysne,P., “Pressure, Volume, Temperature States within the VC-2B Corehole, VallesCaldera, New Mexico, USA”, Applied Geochemistry, Vol. 6, p. 665, 1991.
4. Normann, R., J. Henfling, and D. Blackwell, “Development and Field Use of a Memory-BasedPressure/Temperature Logging Tool for the Geothermal Industry”, Proc. U.S. Dept. of EnergyGeothermal Program Review XIV, pp. 255-260, 1996.

16
Appendix A
Component Cost Estimate for the Pressure/TemperatureLogging System
The total component cost of the pressure/temperature logging system (excluding the IBM-compatible computer and Microsoft Windows operating system, is estimated to be$17,700. The cost is summarized in Table 1. These costs reflect the component parts,and they do not take into account engineering overhead and any profit that a servicecompany would require if it is to undertake support of the tool.
Pressure transducer $ 5600External temperature sensor (RTD) 100Electronics board 1500Internal hardware 500Dewar/Pressure housing 9000Depth-Display System 1000 Totals $17,700
Table 1. Estimate of the component cost.

17
Appendix B
Recommendations on High-Temperature Battery Use
Before the high-temperature batteries from Battery Engineering can be utilized, a test todetermine the presence of a passivation layer must be performed. The following stepsmust be taken:1) Place the battery pack into the battery carrier.2) Connect a 1300-ohm load connector to the battery carrier and monitor the voltage.3) If the voltage does not drop to less than 16.5 volts, proceed to step 4. If the voltage
does drop to less than 16.5 volts, there is a passivation layer. The load must remainconnected until the voltage is greater than 16.5 volts. This may take up to 72 hours.
4) Connect a 500-ohm load and monitor the voltage for 15 minutes. The voltage shouldnot drop below 14 volts. If it does, do not use the battery pack.
5) Disconnect the load. The battery pack is ready for service.
High-temperature batteries have a reduced current capability and capacity at roomtemperature. The time it takes to depassivate the battery pack in step three of the aboveprocedure could be reduced by heating the battery pack to 40°C. Better batteryperformance is realized if the battery pack is preheated to 40°C prior to deployment.

18
Appendix C
Battery-Pack Assembly Recommendations
Commercially available photo-flash batteries (Duracell 123A)* and high-temperaturebatteries from Battery Engineering can be utilized in the battery pack carrier. Thefollowing is a description of the technique used to assemble a battery pack:
The photo-flash batteries are prepared by cutting a length of shrink tubing slightly shorterthan the length of five cells. The shrink tubing is pre-shrunk to a diameter slightly largerthan the batteries. This is done by placing the shrink tubing on a pre-heated mandrel (aheat gun is used as the heat source). While the tubing is warm, remove the shrink tubing,from the mandrel. The batteries are installed in series inside the prepared shrink tubingand the batteries are held together as the shrink tubing is shrunk to its final size. Thebatteries are now ready for installation into the battery carrier housing.
The high-temperature batteries are larger in diameter and shorter in length. A metal sleeveis removed from the battery-carrier housing to allow for this larger diameter. Analuminum spacer is used in conjunction with the battery pack to accommodate the shorterlength. The battery is available in a “button cap” arrangement allowing for similar batterypack assembly as with the photo-flash batteries.
*Warning: Sandia, has used the Duracell 123A batteries successfully on themajority of well logs. In each case we understood the hazard and took precautions.In NO logging tests did we expose the batteries to temperatures greater than 85°°C(oven tests were performed to 100°°C). Use these batteries at your own risk.
19
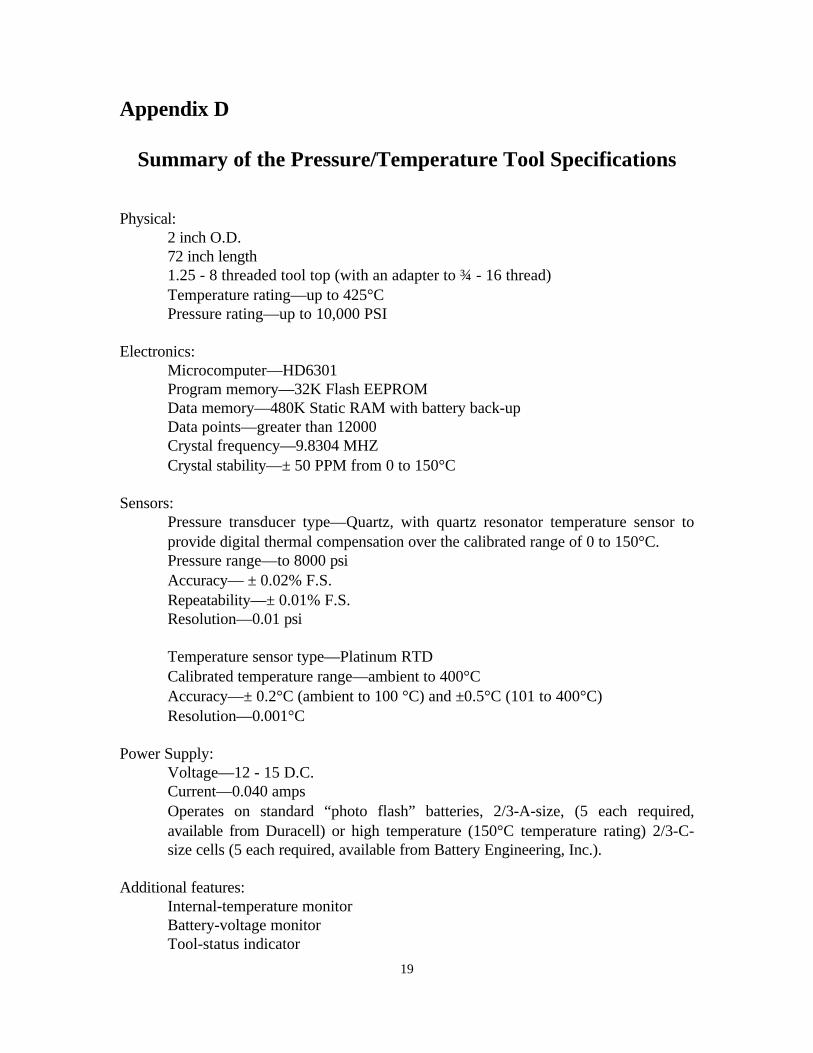
Appendix D
Summary of the Pressure/Temperature Tool Specifications
Physical:2 inch O.D.72 inch length1.25 - 8 threaded tool top (with an adapter to ¾ - 16 thread)Temperature rating—up to 425°CPressure rating—up to 10,000 PSI
Electronics:Microcomputer—HD6301Program memory—32K Flash EEPROMData memory—480K Static RAM with battery back-upData points—greater than 12000Crystal frequency—9.8304 MHZCrystal stability—± 50 PPM from 0 to 150°C
Sensors:Pressure transducer type—Quartz, with quartz resonator temperature sensor toprovide digital thermal compensation over the calibrated range of 0 to 150°C.Pressure range—to 8000 psiAccuracy— ± 0.02% F.S.Repeatability—± 0.01% F.S.Resolution—0.01 psi
Temperature sensor type—Platinum RTDCalibrated temperature range—ambient to 400°CAccuracy—± 0.2°C (ambient to 100 °C) and ±0.5°C (101 to 400°C)Resolution—0.001°C
Power Supply:Voltage—12 - 15 D.C.Current—0.040 ampsOperates on standard “photo flash” batteries, 2/3-A-size, (5 each required,available from Duracell) or high temperature (150°C temperature rating) 2/3-C-size cells (5 each required, available from Battery Engineering, Inc.).
Additional features:Internal-temperature monitorBattery-voltage monitorTool-status indicator

20
Distribution:
1 Dr. David BlackwellSouthern Methodist University219 Heroy HallDallas, Texas 75275
2 Eddie PruettPruett Industries Inc.8915 Rosedale HwyBakersfield, California 93312
1 Bill LivesayLivesay Consultants, Inc.126 Countrywood LaneEncinitas, California 92024
1 Michael C. AdamsEarth Sciences and ResourcesInstituteUniversity of Utah421 Wakara Way, Suite 125Salt Lake City, UT 84108
1 Ted ClutterExecutive DirectorGeothermal Resources CouncilP.O. Box 1350Davis, CA 95617
1 Timothy AndersonResearch CoordinatorUnocal Geothermal OperationsP.O. Box 6854Santa Rosa, CA 95406-0854
1 Steve BarnwellBoart-LongyearPO Box 1000Dayton, NV 89403
1 Dave RitterBoart-LongyearP.O. Box 330North Bay, OntarioCanada P1B 8H6
1 Tom BoxCalpine1160 N. DuttonSanta Rosa, CA 95406
1 Eric CallSB Geo1010 Power Plant DriveSteamboat, NV 89511
1 Louis E. Capuano, Jr.Drilling Engineer and PresidentThermaSource, Inc.P.O. Box 1236Santa Rosa, CA 95402
1 Jim CombsGeo-Hills Associates7790 Edgerton RoadLos Altos Hills, CA 94022
1 Dr. George CooperUC-Berkeley595 Evans HallBerkeley, CA 94720
1 Colin Goranson1498 Aqua Vista RoadRichmond, CA 94805
1 Mohinder S. GulatiChief EngineerUnocal Geothermal Operations2929 East Imperial HighwayBrea, CA 92621
21
1 Gerald W. HuttrerGeothermal ManagementCompanyP O Box 2425Frisco, CO 80443
1 Joseph N. MooreEarth and Geoscience InstituteUniversity of Utah423 Wakara WaySalt Lake City, UT 84108
1 Marshall PardeyQD Tech, Inc.4558 South Kayland CircleSalt Lake City, UT 84117
1 Larry PistoTonto Drilling Services, Inc.2200 South 4000 WestSalt Lake City, UT 84126
1 Bill RickardResource Group40201 Sagewood DrivePalm Desert, CA 92260
1 Bill SmithNCPAPO Box 663Middletown, CA 95461
1 Paul SpielmanCalifornia Energy Co., Inc.900 N. Heritage, Building DRidgecrest, CA 93555
1 Bill TeplowTrans-Pacific Geothermal Corp.1901 Harrison, Suite 1590Oakland, CA 94612-3501
1 Jim WitcherP.O. Box 30001/Dept. 3SOLNew Mexico State UniversityLas Cruces,NM 88003-8001
1 V.P. ZodiacoOxbow Power Corporation5250 South Virginia StreetSuite 304Reno, NV 89502
5 MS 1033 J.A. Henfling50 1033 D.A. Glowka1 1033 R.A. Normann1 9018 Central Technical
Files, 8940-25 0899 Technical Library, 49162 0619 Review & Approval
Desk, 12690For DOE/OSTI