the answers tm - cx with certainty | foresee answers tm american employee study a new perspective on...
TRANSCRIPT

THE ANSWERSTM AMERICAN EMPLOYEE STUDYA New Perspective on Employee Attitudes and Behaviors
NOVEMBER 2014
COMMENTARY AND ANALYSIS BY:
Eric Feinberg Senior Director, Product Strategy
RESEARCH BY:
Ray Seghers Research Analyst
José R. Benki, PhD Research Scientist
© 2014 Answers
WWW.ANSWERS.COM | EMPLOYEE EXPERIENCE ANALYTICS
2 T H E A N S W E R S A M E R I C A N E M P L O Y E E S T U D Y
% Disagree My employer …
32% … knows if I am happy in my role.
43% … has an ongoing process to understand my job satisfaction and likelihood to stay at the company.
48% … understands what my career goals are in the future.
FIGURE 1. HOW WELL EMPLOYERS KNOW EMPLOYEES
NOT THE SAME OLD STORYEmployers and employees deserve better. Every year, we see the same headlines touting the results of the latest studies on
the American workplace and the mindset of the American worker. And every year, we hear the same things: average American
employees are not satisfied, and it’s primarily because of their bosses.
But is there more to it than just that? AnswersTM has decided to apply its proven and patented cause-and-effect methodology
to this critical dialogue: What makes an employee satisfied and engaged? We’ve brought the same level of science and rigor
to this paradigm that we bring to our measurements of customer experience. Workplace issues are too important to your
company’s success to simply continue with the unproven and biased “measurement” concepts previously used. It is well
established that business success is often predicated on how well employers understand and react to their employees’ needs.
Employees have a choice, and they ultimately vote with their feet. If they are satisfied and engaged, they are more likely to
stay. Conversely, if they’re not satisfied and engaged, why would they stay? Moreover, why would they recommend their
company to other people, support the brand and otherwise do the things they ideally would? And even more important, if they
aren’t satisfied and engaged, why would they work to satisfy your company’s customers?
We KNOW that traditional employee satisfaction studies and analytics are NOT working. How do we know this? Well, we know
that nearly half of our study participants report they have never even been asked by an employer to take an employee survey.
Even fewer have any confidence that their employers know what motivates them (Figure 1).
WWW.ANSWERS.COM | EMPLOYEE EXPERIENCE ANALYTICS
3 T H E A N S W E R S A M E R I C A N E M P L O Y E E S T U D Y
Worse, perhaps, than conducting no study at all is conducting a poor one that results in a bunch of numbers and no direction
and no action. Eighty-five percent of our respondents who had participated in an employee survey in the past report that they
saw little action taken by their employer as a result of providing feedback.
This is because understanding to what degree your workforce is satisfied and engaged, and how that will affect future
behavior, is not simple. It’s complex. And coming at it with preconceived notions about employee attitudes (they hate their
boss, they want more money, etc.) isn’t moving anyone forward—or providing any actionable insights about what companies
can really do to increase engagement and employee retention. That’s why we undertook this study.
And, by the way, 86% of American employees like their bosses.
Leveraging our ForeSee methodology, an Answers solution, we were able to apply our time-tested, cause-and-effect framework,
based on empirical findings from 80 years of social psychology research, 20 years of econometric research and more than a
decade of practical field implementation at leading global organizations, to measure the employee attitudes that lead to behaviors
that employers want to cultivate. This study measures both attitudes (an employee’s satisfaction with and engagement in their
work) and specific future behaviors (retention, as measured by an employee’s intent to stay with the company).
By using predictive analytics to understand the relationship between employee satisfaction, engagement and future behaviors,
we are able to provide strategic insights into employee motivation and tactical insights into what employers can do to improve
the employee experience. In The Answers American Employee Study, we use this knowledge to reveal what’s happening with
the American employee experience as a whole.
WWW.ANSWERS.COM | EMPLOYEE EXPERIENCE ANALYTICS

WWW.ANSWERS.COM | EMPLOYEE EXPERIENCE ANALYTICS
4 T H E A N S W E R S A M E R I C A N E M P L O Y E E S T U D Y
IT’S NOT ALL ABOUT THE MONEYIn our inaugural look at the American employee experience, overall worker satisfaction is rated at 65, on a 0-100 scale. While
there are some wildly enthusiastic, loyal, Monday-loving employees among the study respondents, and disheartened, on-
their-way-out participants as well, a score of 65 indicates that most employees are somewhere squarely in the middle. Where
other studies may classify these people as checked out, we consider them the silent majority; they aren’t terribly satisfied or
dissatisfied, but they can have a tremendous impact on an organization—and taking steps to increase their satisfaction can
result in positive outcomes for all involved. Tapping into the needs and wants of the silent majority is where ideas for real
retention materialize.
By graphing the various employment factors with their corresponding satisfaction scores and quantified impacts on a
Priority Map (Figure 2), it is clear that ideas on what is driving employee satisfaction are being challenged. It is not just
about compensation or how one gets along with his or her supervisor. Yes, those are present and accounted for, but the big
new idea here is that employees hold their leadership accountable for much more than they used to. Employees want to
be in the know regarding how their company is doing, what direction it is headed and that long-term decisions are being
made that consider their best interests. Our analytical engine produced clear guidance that companies are not delivering on
this modern employee need.
TOP PRIORITY
MAINTAIN OR IMPROVESTATUS QUO REQUIRED
MONITOR
I M PA C TL O W H I G H
SC
OR
ELO
WH
IGH
LEADERSHIP
JOB
WORKLOAD
COWORKERS
ADVANCEMENT
FIGURE 2. DRIVERS OF EMPLOYEE SATISFACTION
SUPERVISOR
COMPENSATION
WWW.ANSWERS.COM | EMPLOYEE EXPERIENCE ANALYTICS
5 T H E A N S W E R S A M E R I C A N E M P L O Y E E S T U D Y
So what to make of all this? Back in
the days of gold watches and pension
plans, the employee/employer
relationship was a two-way street —
the employee provided years of loyal
service and, in return, the employer
provided job security. As employees
became more empowered and the
notion of dedicated service to a single
company throughout a career became
extinct, employers began to lose sight
of many of the intangible things that
made work rewarding and, instead,
began to focus on things they felt
this new workforce was seeking, like
compensation and benefits packages.
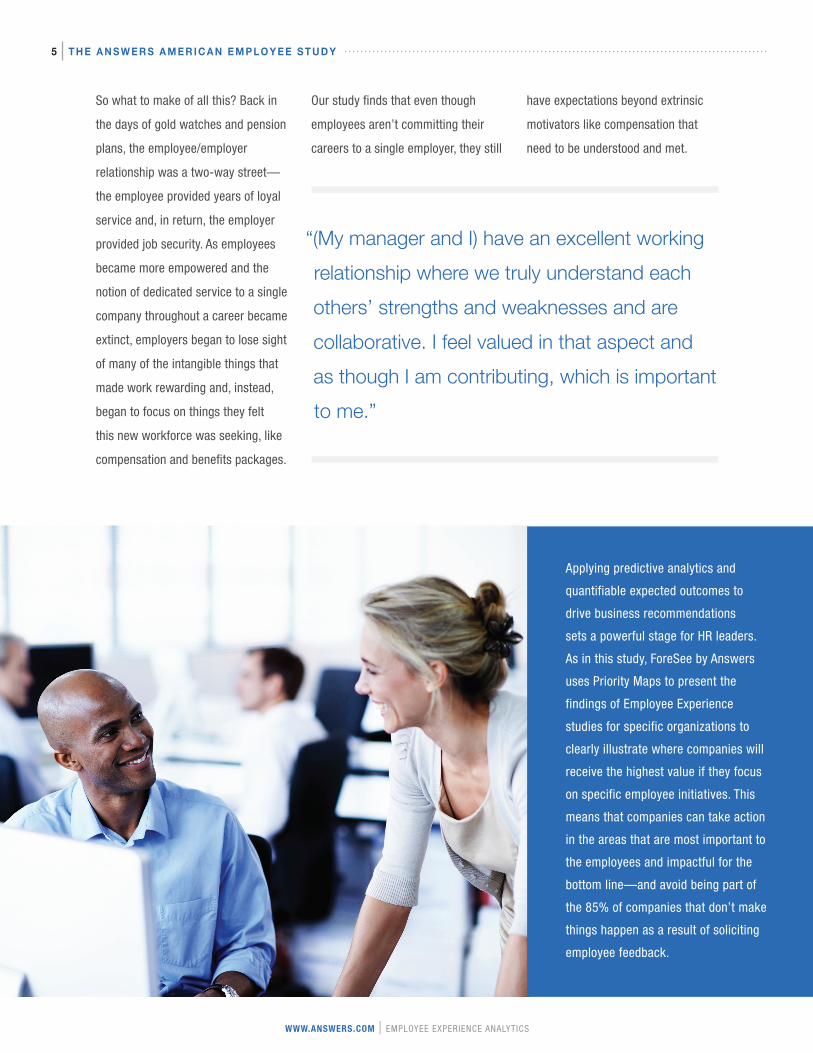
Our study finds that even though
employees aren’t committing their
careers to a single employer, they still
have expectations beyond extrinsic
motivators like compensation that
need to be understood and met.
“(My manager and I) have an excellent working relationship where we truly understand each others’ strengths and weaknesses and are collaborative. I feel valued in that aspect and as though I am contributing, which is important to me.”
Applying predictive analytics and
quantifiable expected outcomes to
drive business recommendations
sets a powerful stage for HR leaders.
As in this study, ForeSee by Answers
uses Priority Maps to present the
findings of Employee Experience
studies for specific organizations to
clearly illustrate where companies will
receive the highest value if they focus
on specific employee initiatives. This
means that companies can take action
in the areas that are most important to
the employees and impactful for the
bottom line—and avoid being part of
the 85% of companies that don’t make
things happen as a result of soliciting
employee feedback.
WWW.ANSWERS.COM | EMPLOYEE EXPERIENCE ANALYTICS
6 T H E A N S W E R S A M E R I C A N E M P L O Y E E S T U D Y
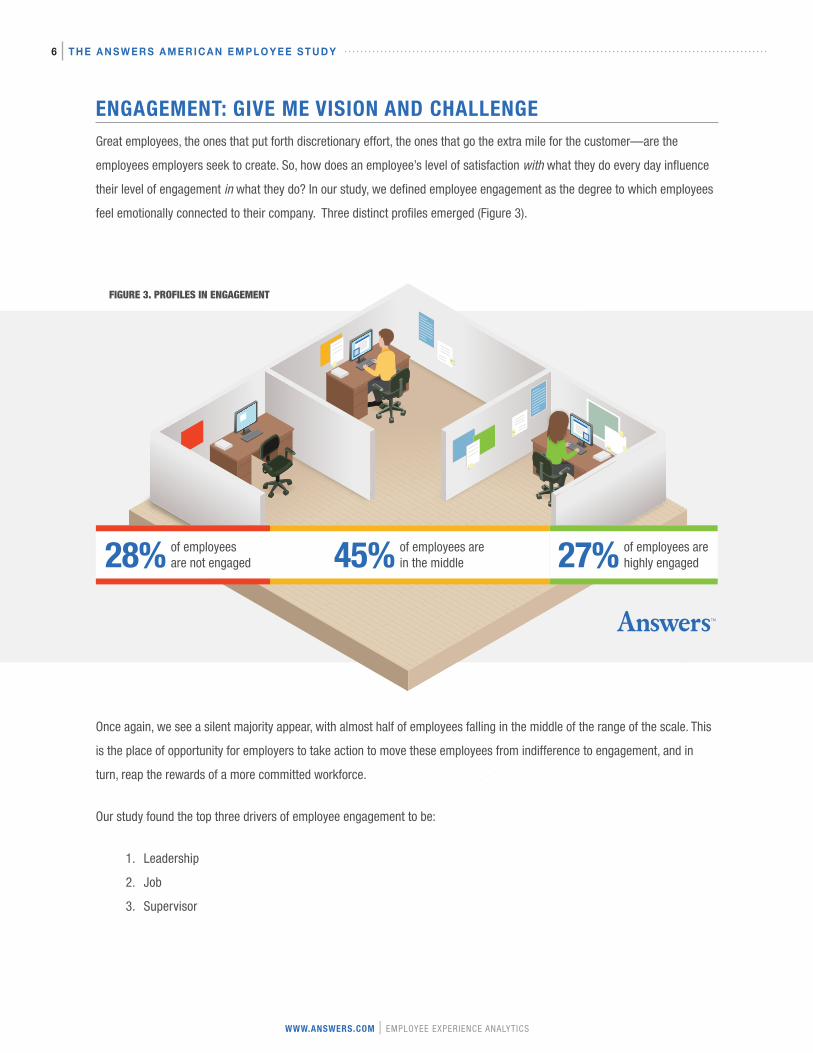
ENGAGEMENT: GIVE ME VISION AND CHALLENGE Great employees, the ones that put forth discretionary effort, the ones that go the extra mile for the customer—are the
employees employers seek to create. So, how does an employee’s level of satisfaction with what they do every day influence
their level of engagement in what they do? In our study, we defined employee engagement as the degree to which employees
feel emotionally connected to their company. Three distinct profiles emerged (Figure 3).
28% of employees are not engaged 45% of employees are
in the middle 27% of employees are highly engaged
Once again, we see a silent majority appear, with almost half of employees falling in the middle of the range of the scale. This
is the place of opportunity for employers to take action to move these employees from indifference to engagement, and in
turn, reap the rewards of a more committed workforce.
Our study found the top three drivers of employee engagement to be:
1. Leadership
2. Job
3. Supervisor
FIGURE 3. PROFILES IN ENGAGEMENT

WWW.ANSWERS.COM | EMPLOYEE EXPERIENCE ANALYTICS
7 T H E A N S W E R S A M E R I C A N E M P L O Y E E S T U D Y
JOB
Sure, the nature of the work itself
(whether it’s challenging, motivating
and interesting) and role clarity
(whether the task is clearly defined
and understood) contribute to
satisfaction and engagement. While
study participants gave relatively high
marks when it came to understanding
how their job contributed to the overall
success of the organization and
providing a sense of accomplishment,
employers should find ways to ensure
employees feel that they are given
opportunities to challenge their skills
and abilities.
LEADERSHIP
The American employee deeply craves
company leadership that supports
long-term growth over short-terms
gains and that can provide a clear
vision of the company’s direction. They
also want to be informed and expect
leaders to effectively and frequently
communicate company information
and updates. The complexities
of the modern economy—
internationalization, importance of
maintaining competitive advantage,
ease of “information leaks”—all
contribute to many companies taking
the easier path of simply not sharing
information. This will prove to be a
long-term error, as it will lead to lower
employee retention.
SUPERVISOR
Finally, let’s discuss an employee’s
day-to-day manager/supervisor. The
reality is that employees who feel that
they receive praise and recognition
when they do a good job and who also
receive constructive feedback when
necessary are much more satisfied
and engaged than those whose
supervisors do not provide this sort
of mentorship. In addition, relative
to non-managers, managers (those
who have direct reports) are much
more satisfied (71 satisfaction score
vs. 62 satisfaction score), are more
engaged (68 engagement score vs.
54 engagement score) and have a
higher propensity to stay (70 retention
score vs. 61 retention score). The irony
of the existing canon of employee
engagement research is that so
much of it is focused on solving some
over-exaggerated issue with the
supervisory relationship. That would
be helpful if most people didn’t have a
good relationship with their manager,
but most do (86% report good dealings
with their supervisor).
W | EMPLOYEE EXPERIENCE ANALYTICSWWW.ANSWERS.COM

WWW.ANSWERS.COM | EMPLOYEE EXPERIENCE ANALYTICS
8 T H E A N S W E R S A M E R I C A N E M P L O Y E E S T U D Y
ALL DIFFERENT AND ALL THE SAME, JUST LIKE ALL OF USOther studies assert that employee satisfaction and engagement differ by generation, but our findings suggest differently
(Figure 4).
While there are indeed unifying themes like Leadership that drive these attitudes, employers who are really seeking to
understand their workforce need to dig deeper than making assumptions about superficial generational differences. For
example, our study found that people who work at the headquarters of a company feel the most emotionally connected to the
organization, while people who work from home are more satisfied. Neither of these was dependent upon age, yet both pose
a clear dichotomy for employers who are seeking to understand what makes their employees tick and take action to improve
both satisfaction and engagement.
FIGURE 4. SATISFACTION BY AGE, GENDER, AND SECTOR
Age Satisfaction Engagement
18 – 34 66 62
35 – 44 65 59
45 – 54 63 56
55+ 65 57
Gender Satisfaction Engagement
Females 65 59
Males 65 57
Sector Satisfaction Engagement
Blue Collar 63 55
White Collar 66 59
WWW.ANSWERS.COM | EMPLOYEE EXPERIENCE ANALYTICS
9 T H E A N S W E R S A M E R I C A N E M P L O Y E E S T U D Y
RETENTION: WHY SHOULD I STAY?Why should employers care about employee satisfaction and
engagement? Because ultimately, they influence employee
behaviors that companies want to cultivate—including
keeping good employees with the company. According to
a 2012 report from the Center for American Progress, it
costs businesses roughly one-fifth of a worker’s salary to
replace him or her when an employee leaves the company.
Other studies cite the cost of replacing a knowledgeable,
salaried executive to be as high as 213% of that executive’s
salary. Additionally, the opportunity costs resulting from
filling in vacated roles, like overtime incurred by remaining
employees, new training costs, lost knowledge, recruiting
costs and the time required for interviewing new candidates,
can be high.
We’ve discussed the impact that the supervisor and
leadership have on satisfaction and engagement for the
American workforce, so it comes as no surprise that these
two elements also emerged as the strongest drivers of
employees’ intention to stay with their current company.
Work/Life Balance also appeared in the study as a key retention
driver. We define this as the ability to balance work and family,
the work to be performed being predictable each day, and the
ability to accomplish all of one’s tasks in a given day. Managing
employee workload is hard for an employer to do since it is
so individualized. One key ingredient to support an employee
at work and to encourage retention is training. We found that
offering any form of training has a massive impact on retention.
Of those with the highest stay intent, 88% reported that they
have received some kind of training on the job, while 30% of
those with low stay intent have not received training at all.
The bottom line? Americans want company leadership with
long-term vision, and they want to be kept in the know about
the organization. Americans want to be fairly compensated—
but they also value managers who consistently provide
appropriate guidance and recognition. Finally, they will stay
with employers when they feel their work is challenging,
rewarding and not intrusive of their personal time. It all sounds
so easy, but it’s not.
“When something is added to the workload, something else needs to be taken away. I can’t keep doing justice to all my tasks if every year I have more tasks.”
“We have a good relationship, but I would not leave my boss, no matter what. He is a great boss, and good jobs and great bosses are hard to find!”
WWW.ANSWERS.COM | EMPLOYEE EXPERIENCE ANALYTICS
10 T H E A N S W E R S A M E R I C A N E M P L O Y E E S T U D Y
NOT ALL COMPANIES ARE CREATED EQUAL This study provides a broad perspective of the American employee overall, not of a specific group of employees at a specific
company under specific circumstances. Drivers of satisfaction, engagement and employee retention—and the degree to
which those drivers have an impact—will differ by employer. Therefore, organizations wanting to proactively guide their silent
majorities, the masses huddled in the middle of the satisfaction and engagement bell curves, must thoroughly understand
the employee experience in the context of their own enterprise.
So, we’re back where we began. Understanding to what degree your workforce is satisfied and engaged, and how that will affect
future behavior, is not simple. It’s complex.
To truly understand and influence the employee experience, begin by asking the right questions in the right way, using a
methodology that will yield the insights you need to take predictively successful actions. By understanding how and which aspects
of satisfaction and engagement impact specific behaviors, organizations can effectively design employee initiatives that will
achieve measurable business outcomes.
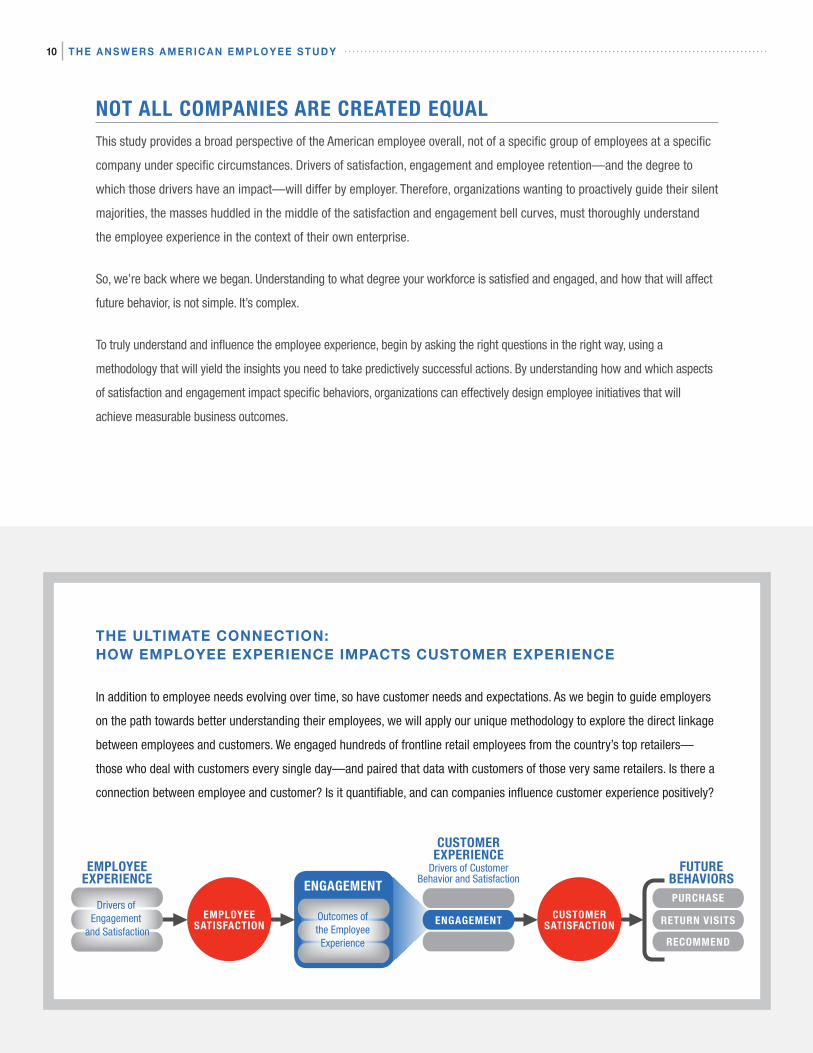
THE ULTIMATE CONNECTION: HOW EMPLOYEE EXPERIENCE IMPACTS CUSTOMER EXPERIENCE
In addition to employee needs evolving over time, so have customer needs and expectations. As we begin to guide employers
on the path towards better understanding their employees, we will apply our unique methodology to explore the direct linkage
between employees and customers. We engaged hundreds of frontline retail employees from the country’s top retailers—
those who deal with customers every single day—and paired that data with customers of those very same retailers. Is there a
connection between employee and customer? Is it quantifiable, and can companies influence customer experience positively?
CUSTOMERSATISFACTION
EMPLOYEESATISFACTION
PURCHASE
RETURN VISITS
RECOMMEND
ENGAGEMENT
FUTURE BEHAVIORSENGAGEMENT
CUSTOMER EXPERIENCE
Drivers of Customer Behavior and Satisfaction
EMPLOYEE EXPERIENCE
Drivers of Engagement
and SatisfactionOutcomes of the Employee Experience

WWW.ANSWERS.COM | EMPLOYEE EXPERIENCE ANALYTICS
11 T H E A N S W E R S A M E R I C A N E M P L O Y E E S T U D Y
ABOUT THIS STUDYIn the autumn of 2014, ForeSee, an Answers solution, measured the work experience of 4,115 American employees by
industry as well as by role, age, gender, tenure, organization size and work location. The study methodology was based on
decades of research in the fields of industrial organization, human resources management, applied psychology, psychometrics
and statistics.
Using a Structural Equation Model framework to demonstrate causal relationships, we explored which drivers (e.g.,
advancement, compensation, teamwork, job, leadership, relationship with manager, workload) most affect overall American
employee satisfaction, and how those different elements of the work experience influence employee engagement and future
behaviors (e.g., intent to stay, likelihood to recommend the employer or brand, willingness to demonstrate initiative).
ABOUT THE AUTHOREric Feinberg, Senior Director, Product Strategy at Answers, works with product, delivery, sales and marketing teams to
ensure that the company brings innovation and operational excellence to its offerings. Since joining ForeSee in 2004, he
has contributed to the organization’s strategic growth, particularly providing leadership around the organization’s employee
experience measurement as well as its customer experience mobile solutions.
Eric is an elected board member of the Digital Analytics Association (DAA). Previously, he worked as a web analyst, multichannel
strategy consultant, usability specialist and focus group moderator. He is a graduate of the University of Michigan.
ABOUT THE RESEARCH TEAMRay Seghers, Research Analyst at ForeSee, has more than 35 years of research and consulting experience in employee and
customer experience, focusing on national and international research as well as on client organization improvement. Ray
has extensive experience designing questionnaires, conducting and analyzing focus groups, performing data analysis and
presenting complex technical information in a non-technical manner that allows organizations to take effective action.
José R. Benkí, PhD, Research Scientist at ForeSee and Adjunct Assistant Research Scientist in the Survey Research Center at
the University of Michigan, has worked in survey and public opinion research for over 10 years. José has expertise in survey
participation, interviewing, speech science, and cross-cultural and cross-language survey research. He is a member of the
American Association for Public Opinion Research and the Acoustical Society of America.

WWW.ANSWERS.COM | EMPLOYEE EXPERIENCE ANALYTICS
12 T H E A N S W E R S A M E R I C A N E M P L O Y E E S T U D Y
ABOUT ANSWERSAnswers empowers consumers, brands and organizations by connecting them with the information they need to make better-
informed decisions. The Answers platform leverages the sizeable reach of Answers.com, along with leading cloud-based
solutions from ForeSee, Webcollage and ResellerRatings, to enable businesses and organizations to engage with customers
at every interaction point. By driving investment decisions based on customer insights, developing an engaged workforce that
results in satisfied customers and delivering content that powers the customer experience, the platform helps businesses
measure and improve the multichannel customer experience, resulting in better business outcomes. Answers is headquartered
in St. Louis with offices in Ann Arbor, New York, Atlanta, Beijing, Cleveland, London, Silicon Valley, Tel Aviv and Vancouver.
CONTACT USTo learn how we can help you gain comprehensive insights into the employee experience, contact us at
FS-1357-1114

WWW.ANSWERS.COM | EMPLOYEE EXPERIENCE ANALYTICS
13 T H E A N S W E R S A M E R I C A N E M P L O Y E E S T U D Y A P P E N D I X A
APPENDIX A: OTHER FINDINGS OF THE ANSWERS AMERICAN EMPLOYEE STUDY
Industry Satisfaction Engagement Stay Intent
Construction 70 65 71
Education 66 62 65
Energy/Utility 70 61 67
Finance and Insurance 68 62 69
Government 63 55 65
Health Care 65 58 63
Hospitality 64 58 62
Manufacturing 64 55 64
Other Industries 59 52 57
Restaurant 60 55 61
Retail 63 56 62
Telecommunication 67 59 63
FIGURE 1. SATISFACTION BY INDUSTRY
Satisfaction for construction and energy/utility workers tops the industry list at 70, 5 points above the overall average.
Their likelihood to stay is also higher.
*Only industries with 100+ responses are shown.

WWW.ANSWERS.COM | EMPLOYEE EXPERIENCE ANALYTICS
14 T H E A N S W E R S A M E R I C A N E M P L O Y E E S T U D Y A P P E N D I X A
LOYALTY TO LEADERSHIPOnly 8% claim they would walk out if their CEO
were unceremoniously relieved of duty.
AMERICA VS. THE WORLDJust 68% think America can compete in the global
market—but those employees have a satisfaction
score that is 12 points higher than those who don’t
find America competitive. This group is also more
engaged and more likely to stay.
A CASE OF THE MONDAYS61% say Monday is their least favorite work day.
MY BOSS IS BETTERThree-quarters of employees feel that they are
not more qualified than their boss, and these
employees are more likely to stay (67 retention
score vs. 53 retention score). They are more
satisfied and more engaged as well.
PRODUCT VS. EMPLOYER68% of employees are willing to recommend
their employer’s products and services
to others, but only 60% are willing to
recommend the company as an employer.
ANNOYING COWORKERSOver half of Americans work with someone that
really annoys them (55%) and it impacts their
satisfaction (58 satisfaction score when annoyed
vs. 72 satisfaction when not annoyed).
(And, only 20% say that annoying person is their direct supervisor.)
ROMANCE IS IN THE AIR4% of our study respondents are in a romantic
relationship at work—60% of those are with a
supervisor or direct report!
CORPORATE DIRECTIONOnly 54% think their company is headed in the
right direction, but 68% think they will remain
competitive in the next five years.
#! ?