the analysis of the financing method for hospital...
TRANSCRIPT

Year XI, No.13/2011 107
Introduction
In literature, a widely accepted view is related to the fact that medical care services are considered a “luxury”, and the extent to which a country’s economy grows triggers bigger revenues allotted for covering medical care.
At the same time, it is known that the performance of hospital care providers is approached in terms of the connection between provided hospital services (i.e. financial resources) and the obtained results. In this respect, most often, the overriding concern relates to cost-efficiency: transforming costs into results. It should be noted that due to the area and context in which this concern takes place (i.e. health performance contributes to social welfare), the results are not an end in itself, but rather they should be primarily viewed from the perspective of the qualitative indicators, so that a certain “optimum level” of patient satisfaction is recorded.
By using two indicators out of the total 3E, this paper tries to determine the performance level recorded by a part of the hospital service providers in Romania. It also wants to conduct an analysis of the financing method (i.e. the value of DRG) of hospital units and of the correlation between the examined indicators.
Literature review
Authors like Mark Williams, Scott A. Flanders and Winthrop F. Whitcomb are approaching performance (a.n. in this area) in terms of strategic planning: Strategic area planning serves as a
structured framework for making key decisions and allocating limited resources, and it is the basis for more detailed planning…The leader must also review past performance of the group (a.n. or organization) as means of retrospectively determining the causes of historical successes and failures. [Wiliams et al., 2007:930]
In his book Performance management in health care: improving patient outcomes: an integrated approach, author Jan Walburg (2006) highlights how healthcare organization are able to organise and arrange the work in ways that maximise the opportunities for learning and improvement –a model for outcome management that builds on ‘outcome thinking’ in healthcare. [Walburg, 2006:21].
In literature there are also views according to which someone would first need to compile an Organizational Profile and then make an assessment of performance management (Goonan, 2007:21). In this context, author Kathleen Jennison Goonan believes that the Profile summarizes: organizational and competitive environment; purpose mission, vision and culture; key strategic challenges and advantages; performance improvement system (Goonan, 2009:21).
The authors La Forgia & Couttolenc highlight in their book Hospital Performance in Brazil: the search for excellence (2009:106) the relationship between different types of efficiency that may occur at the level of a hospital service provider (i.e. technical efficiency and allocative efficiency). At the same time, they analyze aspects related to
THE ANALYSIS OF THE FINANCING METHOD FOR HOSPITAL SERVICES PROVIDERS. THE SITUATION OF
MUNICIPAL HOSPITALS IN ROMANIA Lect. Iulian Bogdan DOBRA PhD University of Alba Iulia “1 Decembrie 1918”
108 Finance – Challenges of the Future
hospital complexity, case mix, and quality from a facility survey (2009:111). By linking together large scale and routinely collected datasets, the Centre for Health Economics specialists from University of York, UK, produced and compared productivity estimates across the ten Strategic Health Authorities in England. They analyse data from Hospital Episode Statistics, the Reference Costs, Financial Returns and workforce census. (CHE, 2010:24).
Research methodology Our approach used several
research methods and techniques, such as: documentation and archive study, field study, data classification (i.e. hospital service providers), comparison and graphical representation. Documentation and archive study
The actions taken to prepare and finalize the case study required conducting a research of the specific literature and legislative acts.
Next we will highlight a few of the specialized papers that constituted an important reference point for the case study: Breaz, N., (2004), Elements of Statistical Inference, theory and applications, Didactica Series, “1 Decembrie 1918” University Alba Iulia; Breaz N. & Jaradat, M., (2009) Descriptive Statistics. Theory and applications, Risoprint Publishing House, Cluj Napoca; Hollongsworth, E. & Peacock, S., (2008) Efficiency Measurement in Health and Health Care. International study on healthcare, Volume 6, Routledge Publishing House, New York, USA; Marinker, M., (2006) Constructive conversations about health. Policies and values, Radcliffe Publishing Oxford, Oxford, UK; Wholey, J., & Zapico-Goni, E., (2007), Monitoring performance in the public sector: Future directions from international experience, Transaction Publishers, New Brunswick, New Jersey, USA; Romanian Court of
Accounts, (2005) Performance audit handbook, handbook financed by the European Union, available online at www.curteadeconturi.ro.
In addition to the papers mentioned above, there were several legislative acts that represented a rich source of data and information for the case study, such as: Law no. 95/20061 on healthcare reform as amended and supplemented; Methodological Norms for implementing the Framework Agreement regarding conditions for granting medical assistance within the social health insurance system for the years 2005-2009, and the Orders of the Ministry of Health and of the President of the National Health Insurance House: 56/45 of 03.02.2005; 681/243 of 13/02.06.2006; 1.781/CV 558 of 28/15.12.2006; 522/236 of 27.03.2008 and 416/428 of 31.03.20092
Depending on certain indicators used in performance audit, the analyzed units were separated into categories.
. Field study
The field study was used to directly examine the contracting and payment of the hospital care services by the Health Insurance House of Alba County – the Contracting, Statistics, Hospital Care and Pre-hospital Emergency Office. At the same time, the investigation aimed to collect data from a number of 52 hospital units (municipal hospitals) from Romania, which were the sample of the research – out of a statistical population of 500 hospitals functioning at the end of 2009, the sample representing 10,4%. Classification of hospital service providers
1 Law 95 on healthcare reform of April 14, 2006, published in the Official Gazette of Romania, part I, no. 372 of 28.04.2006; 2 The legislative documents were published in the Official Gazette of Romania, part I, number 134 bis of 14.02.2005; number 569 bis of 30.06.2006; number 1.057 bis of 30.12.2006; number 257 bis of 01.04.2008 and number 210 bis of 01.04.2009.

Year XI, No.13/2011 109
Thus, during the examined period, namely between 2005 and 2009, we tried to rank the first ten municipal hospitals in accordance to the type of the analyzed performance indicator. Comparison
Comparison was made for the same hospital units, namely municipal hospitals from 31 counties in Romania. The goal is to highlight the similarities and the differences between hospital services providers.
It should be noted that in order to use this research technique, a series of collected information from the data base of the Center of Health Services Research and Evaluation (CCESS) were processed, this center functions within the National School of Public Healthcare and Health Management Bucharest, but also from other specific legislative acts. Graphical representation
A series of imagistic methods to represent data were highlighted with the help of graphs. In order to expose the processed data in a clear manner, multiple types of graphical representations were chosen, such as: types appropriate for descriptive and inferential statistics: structure/radial diagram – for qualitative and nominal variables; cronograma, histograms and scatter plot diagrams.
Describing the scientific research process
The scientific research process
for the case study was structured on several stages, as follows: choosing the area of interest, formulating hypotheses, outlining a working methodology, collecting and analyzing experimental data, and conclusions. Choosing the area of interest Generally, the debates on social health insurances are often focused on political and technical issues, such as sharing
risks, solidarity, the management of the insurance system. Even though these aspects play a major role in the equitable functioning of the healthcare system, the major concern remains the benefits of the insured.
Given that the total value contracted by hospitals with Heath Insurance Houses is over 80% of the amounts associated with hospital care services, whose payment is done on the basis of the Diagnosis-related group (DRG), we hope the scientific approach that we bring forward will add more value to the performance audit of the Romanian social health insurance system. Therefore, we believe that checking the activity with the help of the indicator called Tariff value for solved case (DRG) may be useful for audit missions conducted by internal auditors in hospital units (a.n. there are entities which have departments of internal audit in their organizational chart, and in the hospital that don’t have such a department, the activity is conducted by the auditors from the Departments of public health), as well as by external auditors (the auditors of the Romanian Court of Accounts as Supreme Audit Institution3
3 The Supreme Audit Institutions (SAI) represent public non-political bodies that operate autonomously and have the main common purpose to check accounts and report about the use of public funds. In Romania, SAI is represented by the Court of Accounts.
). The diagnostic classification was
discovered in the 1970s in the United States of America by a group of researchers that included doctors, economists and statisticians from Yale University, New Haven, Connecticut. The Health Care Financing Administration (HCFA) decided in 1983 to start using this system for funding hospitals for the pacients insured in the social health insurance system, meaning most beneficiaries of the Medicare programme.

110 Finance – Challenges of the Future
This system may be defined as follows (CCESS, 2010): a patient classification scheme based on diagnoses... similar to the International Classification of Diseases (ICD), in which diagnoses are divided into classes and subclasses. In contrast, the DRG system uses an additional classification criterion, namely the cost of the resources used to care for the patient.
Therefore, this system is intended to make classifications of beneficiaries/patients according to their pathology, as well as in accordance to the costs of the services, which ensures the opportunity of grouping patients in terms of complexity and length of the hospital stay and in terms of the implied costs.
In the opinion of the experts at the Center of Health Services Research and Evaluation, the groups of diagnoses have two essential features, namely (CCESS, 2010):
clinical homogeneity, meaning the cases (patients) are similar from a clinical perspective in a certain DRG, but not
identical cost homogeneity, meaning every
DRG includes cases that require a similar consumption of resources. It is known that the most important indicator by which hospital service providers contract budgets with second credit accountants (Health Insurance Houses) is Tariff value on solved case (DRG). According to the law (e.g. Framework Agreement), this indicator is considered a quantitative indicator because of the elements that are included into its composition.
The calculus formula for contracted DRG is the result between Number of discharged cases (NDC) – negotiated with the Health Insurance House, the Case-mix index for the previous year (CMI) – stipulated in the norms, and the Tariff on average case for the current year (TAC) – stipulated in the norms. Therefore, in order to illustrate, we will show the calculus method of the amount paid for hospital care services for which the payment is done in accordance to the DRG for the year 2009:
Figure 1. Calculus of the Tariff for solved case for 2009
(Source: The implementation norms of the Framework Agreement, 2009) where: NDC2009 –The number of discharged cases negotiated for the year 2009 by hospital “A” with the Health Insurance House; CMI2008 –Case-Mix Index for the year 2008 for hospital “A”; TAC2009 –Tariff on average case for the year 2009
The Case-Mix Index, called also Case complexity index, is a number without unit that expresses the totality of sources or reserves that may be capitalized in order to satisfy the needs of the hospital services providers in line with the treated patients.
It should also be mentioned that the CMI’s values are calculated on the basis of the data reported by the hospitals in the year previous to signing the services contract and on the basis of the set of relative values used by the social health insurance system.
The reported data refers to the information provided to the Health Insurance Houses, to the National School of Public Healthcare and Health Management and to the line ministry, and the set of relative values, introduced in Romania in 2003, reflects a series of numbers without unit that express the ratio between a DRG tariff and the average tariff of all DRGs, determined in
2009200820092009 xTACxCMINDCDRG =
Year XI, No.13/2011 111
accordance to the relative quantity of labour, supplies and capital resources needed for the full treatment of the patient suffering from that disease (implementation norms of the Framework Agreement, 2009:188). The relative values of the American healthcare system were used between 2003 and August 2008. Following the implementation of the diagnostic classification system in Australia, it was decided to change the American set of relative values and introduce the one used by the Australian public system.
It must be noted that starting with 2006, the development process of the local relative values was commenced, a process that is continuously changing, improving, but which is suffering from a lack of local funds at the level of responsibilities. In this sense, we believe that the use of relative values that don’t completely reflect the situation of the national system and “borrow” a series of data specific for other systems, may create a certain confusion for central authorities.
In the subsequent period, between the years 2007 and 2009, the relative values existent in the Implementation norms of the Framework Agreement are permanently adjusted on the basis of the data regarding costs per
patient. It’s obvious that this adjustment is done at a relatively slow pace, which led to a working hypothesis for our case study. The working methodology for the observed statistical population Observation, systematization and representation of statistical data
Reaching the goal aimed in the case study required the clarification of the following aspects, which will ensure a scientific preparation of the statistical observation: delimiting the population subjected to observation, meaning the hospital services providers; defining the statistical units that will be observed, namely the municipal hospitals in Romania; the observation period, namely the period between 2005 and 2009; choosing the statistical variables (i.e. DRG) which best characterize the population and which meet the objective, meaning the providers that recorded no “extreme values”; developing primary series, and at the end presenting the data with the help of specific graphs used to represent statistical data. Data systematization
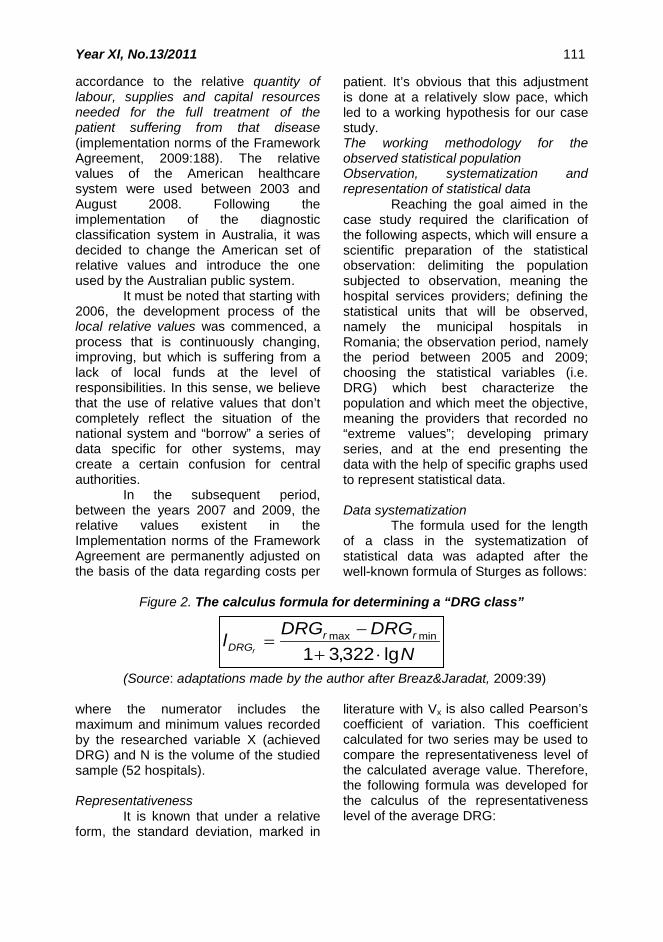
The formula used for the length of a class in the systematization of statistical data was adapted after the well-known formula of Sturges as follows:
Figure 2. The calculus formula for determining a “DRG class”
(Source: adaptations made by the author after Breaz&Jaradat, 2009:39) where the numerator includes the maximum and minimum values recorded by the researched variable X (achieved DRG) and N is the volume of the studied sample (52 hospitals). Representativeness
It is known that under a relative form, the standard deviation, marked in
literature with Vx is also called Pearson’s coefficient of variation. This coefficient calculated for two series may be used to compare the representativeness level of the calculated average value. Therefore, the following formula was developed for the calculus of the representativeness level of the average DRG:
NDRGDRG
l rrDRGr lg322,31
minmax
⋅+−
=

112 Finance – Challenges of the Future
Figure 3. DRGrMH Representativeness
(Source: adaptations made by the author after Breaz & Jaradat, 2009:106) where:
DRGrMHσ - average standard deviation of DRG in municipal hospitals; DRGrMH - DRG’s average in municipal hospitals. Statistical correlation
The correlations between the indicators obtained by the hospital services providers were done for each year of the analyzed period by starting from the calculus formula of the tariff value for solved case. Therefore, for start, the following correlations were
done: NDC and CMI, NDC and TAC, CMI and TAC, and in the end the most influent factor over DRG was calculated, meaning the correlation between DRG and each of the NDC, CMI and TAC factors.
The correlations between the indicators highlighted previously were established by starting from the well-known correlation coefficient introduced by statistician Karl Pearson. Based on this coefficient, the following formula was written:
Figure 4. The calculus formula of the correlation between NDC and CMI
(Source: adaptations made by the author after Breaz&Jaradat, 2009:148) On the same lines were
determined the correlations between NDC and TAC, and CMI and TAC, and in the end the most influent factor over DRG. Formulating hypotheses
The starting points for formulating hypotheses refer to: the defining aspects regarding the audit of hospital services providers (a.n. aspects highlighted in the references mentioned above), previous concerns, suggested solution and possible difficulties. Also, by taking into account the features of the activity conducted by the analyzed providers and the accounting for medical services, is considered useful and beneficial to change the calculus formula for achieved DRG The usefulness lies in the fact the auditor is
able to build an accurate picture of the work done by the audited entity. Given that all the indicators of the calculus formula for DRG refer to the same period, we believe a “reference point” may be established, which may be really helpful in the audit performance missions. In this regard, we wish to emphasize that the relative values, which contribute to determining the CMI of the hospital unit, face a series of changes caused by several exogenous and endogenous factors (e.g. relative amount of labour – the wages of the medical and ancillary personnel will suffer changes during the financial year; supplies and capital resources – the prices of these factors may also suffer a series of adjustments, especially in the context of macroeconomic and global economic imbalances on various markets).
100×=DRGrMH
V DRGrMHDRGrMH
σ
∑∑∑
−−
−−=
22 )()(
))((,
CMICMINDCNDC
CMICMINDCNDCr CMINDC

Year XI, No.13/2011 113
The benefit may occur as a result of the potential effects (efficient management of public resources) caused by the recommendations of the auditor in the audit reports.
Another working hypothesis was the influence level exercised over DRG by the three indicators, namely: Number of discharged cases (NDC), Case-Mix Index (CMI) and Tariff on average case (TAC). Regarding its importance, we believe that during the performance audit missions, the internal or external auditor may create a series of indicators that will help him in expressing an opinion and in making recommendations.
In order to achieve a high representativeness level for the studied sample, it was considered useful to classify hospital units according to the achieved DRG. To reach the objective of the research (to highlight the features of the researched population), it’s required to present in an organized form the statistics resulted through observation and materialized in questionnaires, namely a statistical series.
In general, the results of the observation may be presented as frequency series that reproduce the structure of the researched population in relation to one or several variables or may be presented as variation series, especially chronological, which reproduce the evolution of certain phenomena (Breaz & Jaradat,2009:39).
On these lines, unidimensional series of attributes were developed for each year as follows: the first line of the series included the DRG values achieved by municipal hospitals (the units of the sample); the second line included the occurrence frequency of different values of the variable. The goal is to exclude from the statistical sample (52 hospital units) the hospital services providers that recorded during the analyzed period (2005-2009) values placed at a bigger „distance” („+” or „-”) from the average DRG. Therefore, in the end, a new statistical sample of 30 units will be
formed, whose average achieved DRG will be representative.
Shaping the working methodology
The following working methodologies were considered for the case study:
observation, systematization and representation of statistical data;
determining the representativeness level of the average DRG achieved by the hospital units of the sample;
creating correlations between the analyzed indicators;
determining the influence level of the indicators over achieved DRG, followed by a simulation on changing influences; It should be mentioned that the development of the working methodologies was based on the data and information collected from various institutions that operate within the social health insurance system in Romania. In this sense, the most important entities were: National Health Insurance House, Health Insurance Houses across the country, part of the municipal hospitals and the Center of Health Services Research and Evaluation (CCESS) within the National School of Public Healthcare and Health Management Bucharest.
Another aspect in terms of working methodology refers to the interpretation and modification of the basic relation regarding the DRG value achieved by the hospital services providers (DRGrMH). Given that in the calculus formula all the indicators are related to the same period, it is believed that the DRG value is more representative for the performance audit. It is known that the values recorded by these indicators (especially CMI and TAC) will suffer a series of changes, influenced by endogeneous factors – from inside the healthcare system, or exogeneous factors – at macro and global economic level (e.g. the prices of

114 Finance – Challenges of the Future
the factors needed for the complete care of patients).
At the same time, the study aimed to measure the dependence between the analyzed indicators with the help of the correlation coefficient, called Pearson correlation coefficient. The goal of this correlation is to determine the type and extent to which variables influence each other.
Collecting, processing and analyzing experimental data
The necessary data from total
hospital services providers were collected, processed and analyzed in this stage. The figure below shows the categories of specific units that operated in Romania at the end of 2009.
Figure 5. Classification of hospital service providers
(Source: adaptations made by the author on the basis of data provided by the Center of Health Services Research and Evaluation, 2010).
It is obvious that the share of municipal hospital units is 13.6% at the end of 2009, which in absolute size represents 68 providers. We note that in 2005 only 52 units were included in this category, the difference established at the end of 2009 being due to the change of status for some of the providers during the five analyzed years.
Consequently, the statistical sample for 2005, which is considered the
base period, was 52 units, located in 31 counties.
After defining the sample, we moved to the following stage: to determine the DRG value achieved by hospital units in 2005. It should be mentioned that, as stated in the working hypotheses, the calculus formula for DRG was changed, therefore all the indicators were related to the same reference period.

Year XI, No.13/2011 115
Figure 6. The DRG value achieved by hospital units in 2005 (Source: adaptations made by the author on the basis of the data provided by the Center of Health Services Research and Evaluation, 2010)
In 2005, the DRG value achieved by the units in the sample is shown in figure 6, The DRG value achieved by hospital units in 2005.
After processing the data, the following aspects were noticed: the minimum DRG value was recorded at Săcele Municipal Hospital in Braşov County, amounting to 1.440.226 lei; and
the maximum value was recorded by Hunedoara Municipal Hospital in Hunedoara County, amounting to 20.636.731 lei. The average for the 52 units was 6.169.183 lei.
The next stage was to determine the length of the range with the help of the formula in figure 3, as follows:
Figure 7. The length of DRGr2005
(Source: adaptations made by the author after Breaz & Jaradat, 2009:39).
It should be said that the value
obtained for the range’s length determines the establishment of over 100 DRG classes, most of them with zero frequency. Consequently, in order to interpret the data, it was more useful to
establish four classes, the structure of the series being shown in figure 8 One-dimensional series DRGr2005, as well as in figure 9 Histogram of the DRGr2005 series.
Figure 8. One-dimensional series DRGr2005
(Source: adaptations made by the author, 2010) The DRG series achieved in
2005 show the following aspects: most values recorded by municipal hospitals are included in the first two classes. In
the first class, 27 units recorded a DRGr2005 between 1.07 million lei and 5.96 million lei, which in relative sizes represents approximately 52% of total. In
leiDRGDRG
l rrxDRGr 243.148
70,6446.070.1731.636.20
52lg332,31min2005max2005
2005 ≈−
=⋅+
−=
[ ) [ ) [ )
−−−−142027
]731.636.20160.745.15[160.745.15589.853.10589.853.10018.962.5018.962.5446.070.1:2005DRGrX

116 Finance – Challenges of the Future
the second class, 20 hospital units recorded a DRGr2005 between 5.96 million lei and 10.85 million lei, meaning 38,46% of total in relative sizes. The latter two classes include 5 municipal hospitals,
which in absolute sizes represents values between 10.85 million lei and approximately 20.64 million lei, and in relative sizes it represents about 10% of total.
Figure 9. Histogram of the DRGr2005 series (Source: adaptations made by the author, 2010)
Starting from the results obtained after processing the data for the year 2005, a new sample of 30 units was formed, these units being extracted so that both classes of values with a high frequency will be represented in the sample. Consequently, the share of hospital services providers is 44.12% of total units, which are located in 24 counties, meaning approximately 57% of total counties in our country.
The graphical representation is figure 10 DGR value of hospital units in 2005 – s30.
The graphical representation shows that the average recorded value for the 30 units in the sample is approximately 5 million lei, with a minimum value of 3.168.566 lei and a maximum value of 7.106.603 lei, and the length of a range is approximately 1.3 million lei. Given that the sample doesn’t include “extreme” values, we believe this is a good aspect for the statistical estimation and for the statistical test, as well as for the calculus of the performance indicators that are about to be determined. The “coherence” of the sample may be seen in figure 10 and 11.
Figure 10. DGR value of hospital units in 2005 – s30 (Source: adaptations made by the author, 2010)

Year XI, No.13/2011 117
At the level of the four classes of the series there are 10 services providers that recorded values between 3.17 million and 4.15 million lei, which in
relative sizes represents 33.33% of total sample; 5 providers recorded values between 4.15 million and 5.14 million lei, meaning 16,67% of total.
Figure 11. Histogram of the DRGr2005 series –e30
(Source: adaptations made by the author, 2010)
A number of 6 units has DRG values between 5.14 million lei and 6.12 million lei, meaning 20% of total sample, and 9 units recorded values between 6.12 million and 7.11 million lei, representing 30% of total. Determining the representativeness level of the average achieved DRG
The next step in our scientific approach is to establish the representativeness of the sample for all the studied years. Therefore, with the help of the formula in figure 3 DRGrMH Representativeness, we determined the standard deviation , the average and the sample’s representativeness. The results obtained
for the five years are included in table no. 1.
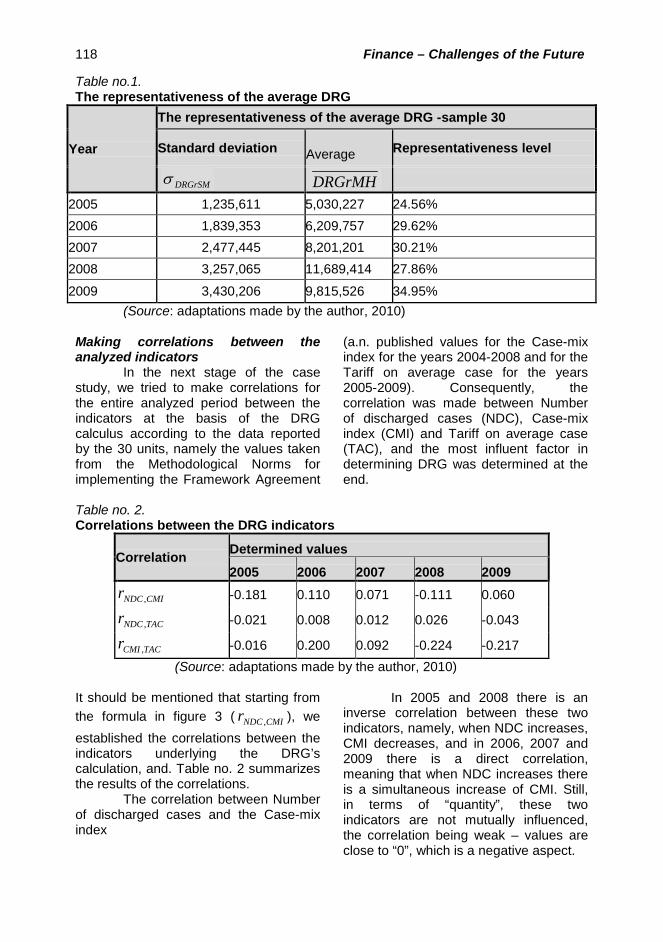
In the majority of the studied years (i.e. 2005 with 34.56%, 2006 with 29.62% and 2008 with 27.89%) the representativeness level of the average DRG for the sample consisting of 30 hospitals is absolutely representative, meaning < 30%, the exception being recorded in 2007 (30.21%) and 2009 (34.95%) when the level was located between 30% and 60%, being considered relatively representative. Nevertheless, even if in these two years the level is relatively representative, it is obvious that it approaches the upper limit of absolute representativeness, and the average DRG for the five analyzed years is considered representative for all 30 units.
118 Finance – Challenges of the Future
Table no.1. The representativeness of the average DRG
Year
The representativeness of the average DRG -sample 30
Standard deviation Average Representativeness level
DRGrSMσ DRGrMH
2005 1,235,611 5,030,227 24.56% 2006 1,839,353 6,209,757 29.62% 2007 2,477,445 8,201,201 30.21% 2008 3,257,065 11,689,414 27.86%
2009 3,430,206 9,815,526 34.95% (Source: adaptations made by the author, 2010)
Making correlations between the analyzed indicators
In the next stage of the case study, we tried to make correlations for the entire analyzed period between the indicators at the basis of the DRG calculus according to the data reported by the 30 units, namely the values taken from the Methodological Norms for implementing the Framework Agreement
(a.n. published values for the Case-mix index for the years 2004-2008 and for the Tariff on average case for the years 2005-2009). Consequently, the correlation was made between Number of discharged cases (NDC), Case-mix index (CMI) and Tariff on average case (TAC), and the most influent factor in determining DRG was determined at the end.
Table no. 2. Correlations between the DRG indicators
Correlation Determined values
2005 2006 2007 2008 2009
CMINDCr , -0.181 0.110 0.071 -0.111 0.060
TACNDCr , -0.021 0.008 0.012 0.026 -0.043
TACCMIr , -0.016 0.200 0.092 -0.224 -0.217 (Source: adaptations made by the author, 2010)
It should be mentioned that starting from the formula in figure 3 ( CMINDCr , ), we established the correlations between the indicators underlying the DRG’s calculation, and. Table no. 2 summarizes the results of the correlations.
The correlation between Number of discharged cases and the Case-mix index
In 2005 and 2008 there is an inverse correlation between these two indicators, namely, when NDC increases, CMI decreases, and in 2006, 2007 and 2009 there is a direct correlation, meaning that when NDC increases there is a simultaneous increase of CMI. Still, in terms of “quantity”, these two indicators are not mutually influenced, the correlation being weak – values are close to “0”, which is a negative aspect.

Year XI, No.13/2011 119
Figure 12. The evolutions of the average NDC and average CMI between 2005 and 2009
(Source: adaptations made by the author, 2010) Thus, even if in general, both the
average Number of discharged cases and the average Case-mix index recorded an increase, which was highlighted in the figure below, it is obvious there is no strong correlation between these two indicators. Given that the increase of number of treated patients determines an increase of costs, we believe that increasing the clinical complexity should ensure the necessary resources for the hospital in accordance with the treated patients. Consequently, in terms of performance audit, we consider that the index should record a bigger increase during the analyzed period. The correlation between Number of discharged cases and the Tariff on average case
Table no. 2 shows that in 2005 and 2009 there is an inverse correlation between the two indicators, namely when
NDC increases, TAC decreases, and between 2006 and 2008 the correlation is direct, meaning that when NDC increases there is a simultaneous increase of TAC. Still, in terms of “quantity”, these two indicators are not mutually influenced, the correlation being weak – values are close to “0”, which is a negative aspect.
Although during most of the time the average Number of discharged cases and the average Tariff value for solved case has recorded an increase, which is highlighted in figure 13, there is no strong correlation between these two indicators. Even if in the last two years the average TAC has recorded a bigger increase than NDC, the tariff should contribute to securing funds for the “full”, normal treatment of the insured. In conclusion, in terms of performance audit, we believe that the Tariff on average case should record an evolution superior to the one of NDC.

120 Finance – Challenges of the Future
Figure 13. The evolutions of the average NDC and average TAC between 2005 and 2009 (Source: adaptations made by the author, 2010) Correlation between Case-mix index and Tariff on average case
By their nature and their calculus method, by what they represent, we believe that the relationship between these two indicators may become a useful “tool” for the auditor in the performance audit missions. On one hand, the Case-mix index is determined with the help of the relative value, depending on the necessary resources to treat the patient; on the other hand, the Tariff on average case represents the reimbursing value of an average case at hospital level. In this regard, we believe that out of all three correlations, the most representative for performance audit is the CMI-TAC correlation.
In 2005, 2008 and 2009, there is an inverse correlation between the two
indicators, namely when CMI increases, TAC decrease; and in 2006 and 2007, the correlation is direct, meaning that when CMI increases there is a simultaneous increase of TAC. Still, in terms of “quantity”, these two indicators are not mutually influenced, the correlation being weak – values are close to “0”, which is a negative aspect.
During the five studied years, the CMI and TAC averages have known an increase in dynamics, which was shown in figure 14, but there is no strong correlation between the two indicators. Even if in the last three years there was an increase of the average Tariff on average case, the growth rate for the Case-mix index remains high.
Figure 14. The evolutions of the average CMI and average TAC between 2005 and 2009 (Source: adaptations made by the author, 2010)

Year XI, No.13/2011 121
Therefore, we believe that the value of the tariff on average value shouldn’t be at a relatively low level because it may lead to the underfunding of the services and to an increased hospital debt. Thus, in terms of performance audit, we think that during the analyzed period, the Tariff on average case could have recorded a higher value.
Determining the influence level of indicators over DRG
The next stage of the case study refers to determining the influence level of the three indicators over the DRG’s calculus with the help of the formula in figure 4.
Table no. 3. The influence of the indicators over DRG
Correlation Determined values
2005 2006 2007 2008 2009
NDCDRGrr , 0.799 0.828 0.861 0.857 0.888
CMIDRGrr , 0.221 0.509 0.468 0.335 0.436
TACDRGrr , 0.429 0.439 0.324 0.183 0.095 (Source: adaptations made by the author, 2010) It is obvious that during the five
years the most influential indicator is NDC, with an average of 0.847, followed by CMI with an average of 0.394; the lowest influence is exerted by TAC, with an average of 0.294.
In our opinion, the intense correlation between DRG and NDC is mostly due to the fact that when contracting the hospital care services, this indicator, according to the methodological norms, is the only one that may be negotiated and, implicitly, the most influent in terms of the DRG value.
In terms of performance audit, we believe that the complexity index of the cases (CMI) and the redemption value for average case at the level of the hospital (TAC) should represent the “key elements” at the time of contracting the services, they should have a bigger influence of the DRG value. Given that CMI incorporates a part of the cost elements of the suppliers (e.g. relative value), and TAC represents a “source” of financing the costs, we believe it is useful for the influence of these factors over
DRG to know another share, to have a different influence.
In order to increase the importance of the influence level of the two indicators, our study conducted a simulation of their influence over DRG. In this regard a series of “tricks” were carried out at the level of the three indicators for each period as follows: for both NDC and CMI were operated a series of adjustments within the hospital units that recorded values higher than the sample’s average, their values being replaced with the average. There was also a change in terms of increasing the tariff by 45% for TAC.
The result of the simulation is presented in table 4. Therefore, the most influent indicator remains NDC, with an average of 0.66, followed by TAC with an average of 0.57, and the lowest influence is exerted by CMI, with an average of 0.38.
It is obvious that during the analyzed period, NDC declined by an average of 10% per year, and CMI by 5% per year, declines that led to an increase of 24% per year for DRG for most

122 Finance – Challenges of the Future
hospital services providers. Although there was a increase of approximately 24% for DRG, a few hospital units
obtained a lower DRG than the one previous to the simulation.
Table no. 4. Simulation regarding the influence of the indicators over DRG
Correlation Determined values
2005 2006 2007 2008 2009
NDCDRGrr , 0.75 0.60 0.61 0.64 0.71
CMIDRGrr , 0.31 0.46 0.52 0.28 0.35
TACDRGrr , 0.70 0.66 0.62 0.47 0.38 (Source: adaptations made by the author, 2010)
A series of conclusions may be drawn at the end of the simulation:
the objective of the simulation has been achieved, meaning the influence of the two indicators (TAC, CMI) has grown;
given that TAC was increased by 45%, there were situations when a part of the units obtained a lower DRG value, which causes us to believe that in reality the redemption value of an average case may still bear increases;
reducing CMI with an average of 5% each year, in conjunction with other adjustments, has produced a positive effect over the influence and over DRG’s value;
the Number of discharged cases remains the most influential factor when determining DRG. Given the nature of this indicator, in reality it can’t be reduced very much (a.n. the number of discharged patient can’t be estimated with precision), which is why it is considered that the made reduction (an average of 10% per year) didn’t negatively impact DRG’s value.
Conclusions
It is known that resources are limited within the healthcare system, regardless of the system’s type or of the economic system of organization and functioning of the exchange economy,
which is why it is completely immoral to waste them. An inefficient use of resources in a certain area leads to a lack of services in other areas, where they might really be needed. Therefore, it is a moral condition to identify the most efficient organization of all healthcare services, namely the use of economic thinking.
At the same time, in literature it is known that efficiency is related to economicity. For economicity, as well as for efficiency, the main concerns are related to the deployed resources. The main question is whether these resources have been used in an optimum or at least satisfying manner, or whether the results are identical or similar in terms of quality, which could have been achieved with less resources.
The following aspects may be distinguished after our scientific approach:
• the correlation between the Number of discharged cases and the Case-mix index: increasing the number of treated patients determines an increase of costs, and in this regard, we believe that increasing the complexity index of the cases should ensure an optimum level of the resources needed by the hospital. Therefore, in terms of performance audit, we believe that during the analyzed period, the index should have recorded a bigger increase;

Year XI, No.13/2011 123
• the correlation between Number of discharged cases and Tariff on average case: in the last two years, the tariff on average case has risen more than the number of discharged cases, which is a positive thing, but, from the conducted studies and from the statistics of the European Union, it is known that the funds allotted in healthcare are at a relatively low level. Therefore, in terms of performance audit, we believe the Tariff on average case should have had a superior evolution of NDC during the entire studied period;
• the correlation between Case-mix index and Tariff on average case: even if in the last three years there was an increase of the average Tariff on average case, the growing rhythm of CMI remains high. It should be noted that the value of the tariff on average case doesn’t have to be at a relatively low level because it may lead to underfunding and to an increase of hospital debt. Therefore, we believe that for this type of correlation, TAC could have recorded a higher value;
• in order to have an accurate picture of the DRG value, the authorities should complete within the shortest amount of time the adjustment of the relative values written in the Methodological Norms for implementingthe Framework Agreement, on the basis of the data related to patient costs;
• regarding the determination of the influence level of the indicators over DRG: the Case-mix index (CMI) and the reimbursement value of an average case at the level of the hospital (TAC) should represent “key elements” at the time of contracting the services, they should have a bigger influence of the DRG value. Given that CMI incorporates a part of the cost elements of the suppliers (e.g. relative value), and TAC represents a
“source” of financing the costs, we believe it is useful for the influence of these factors over DRG to know another share, to have a different influence. At the end of the simulation period, a series of conclusions may be drawn:
• the objective of the simulation was reached, meaning the influence of the two indicators (TAC, CMI) has grown;
• given that TAC was increased by 45%, there were situations when a part of the units obtained a lower DRG value, which causes us to believe that in reality the redemption value of an average case may still bear increases;
• reducing CMI with an average of 5% each year, in conjunction with other adjustments, has produced a positive effect over the influence and over DRG’s value;
• the Number of discharged cases remains the most influential factor when determining DRG. Given the nature of this indicator, in reality it can’t be reduced very much (a.n. the number of discharged patient can’t be estimated with precision), which is why it is considered that the made reduction (an average of 10% per year) didn’t negatively impact DRG’s value.
Regarding the relative values, we believe the authorities should step up efforts to complete the development process of local relative values. In this sense, we consider that the use of relative values that don’t fully reflect the situation of the national system and “borrow” a series of data specific for other system, may create some confusions at the level of the Romanian central authorities.

124 Finance – Challenges of the Future
Bojke, C., et al., (2010)
„Regional Variation in the Productivity of the English National Health Service”, CHE Research Paper 57, Centre for Health Economics, University of York, UK, on line: http://www.york.ac.uk/media/che/documents/papers/researchpapers/rp57.pdf;
Breaz, N., (2004) Elemente de statistică inferenţială, teorie şi aplicaţii, Seria Didactică, Universitatea "1 Decembrie 1918" Alba Iulia, România;
Statistică descriptivă. Teorie şi aplicaţii, Editura Risoprint, Cluj Napoca, România;
Breaz, N. & Jaradat, M. (2009) La Forgia, G., M. and Couttolenc, B., (2009)
Hospital performance in Brazil: the search for excellence, Vol. 828, World Bank e-Library;
Hollingsworth., E & Peacock, S., (2008)
Efficiency measurement in health and health care International Studies in Healthcare, Vol. 6 Routledge international studies in health economics Routledge, New York, USA;
Marinker, M., (2006) Constructive conversations about health: policy and values, Radcliffe Publishing Oxford, Oxford, UK;
Walburg, J., (2006) Performance management in health care: improving patient outcomes : an integrated approach, Health Management Series, Routledge health management series, New York, USA;
Williams, M., Flanders, S., A., and Whitcomb, W., F., (2007)
Comprehensive hospital medicine: an evidence based approach, SAUNDERS Elsevier, Philadelphia, PA, USA;
Wholey, J., & Zapico-Goni, E., (2007)
Monitoring Performance in the Public Sector: Future Directions from International Experience Comparative Policy Evaluation, Transaction Publishers, New Brunswick, New Jersey, USA;
Curtea de Conturi a României, (2005)
Manualul de audit al performanţei, manual editat printr-un proiect finanţat de Uniunea Europeană, accesibil on-line: www.curteadeconturi.ro;
Centrul de Cercetare şI Evaluare a Serviciilor de Sănătate –baza de date acesibilă on line
www.drg.ro;
***** Ordinele ministrului sănătăţii publice şi al preşedintelui Casei Naţionale de Asigurări de Sănătate numerele: 56/45 din 03.02.2005; 681/243 din 13/02.06.2006; 1.781/CV 558 din 28/15.12.2006; 522/236 din 27.03.2008 şi 416/428 din 31.03.2009 publicate în Monitoarele Oficiale ale României, partea I, numărul 134 bis din 14.02.2005; numărul 569 bis din 30.06.2006; numărul 1.057 bis din 30.12.2006; numărul 257 bis din 01.04.2008 şi numărul 210 bis din 01.04.2009.
REFERENCES