the amygdala of patients with parkinson’s disease is ... · the amygdala of patients with...
TRANSCRIPT

TS
NAa
Hb
ic
J
Asonctvsdrwmcsrsctapgafttcpatcp©
Kd
*U1EAermPt3
Neuroscience 131 (2005) 523–534
0d
HE AMYGDALA OF PATIENTS WITH PARKINSON’S DISEASE IS
ILENT IN RESPONSE TO FEARFUL FACIAL EXPRESSIONSIsacemtlf
pt(pHpgapfn1sgreo(pebp1tfOet
asirrtlttT
. YOSHIMURA,a M. KAWAMURA,a,c* Y. MASAOKAb
ND I. HOMMAb
Department of Neurology, Showa University School of Medicine,atanodai 1-5-8, Shinagawa-ku, Tokyo 142-8555, Japan
Second Department of Physiology, Showa University School of Med-cine, Hatanodai 1-5-8, Shinagawa-ku, Tokyo 142-8555, Japan
CREST, Japan Science and Technology Corporation, Kawaguchi-shi,apan
bstract—We previously found that patients with Parkin-on’s disease (PD) were impaired with respect to recognitionf fear and disgust in facial expressions. To investigate theeural mechanisms that underlie this impairment, we re-orded visual event-related potentials (ERPs) in response tohe viewing of fearful facial expressions. Ten normal elderlyolunteers and nine patients with PD were studied. Fearful,urprised, and neutral facial expressions were presented ran-omly for 500 ms each, with a probability of 0.1, 0.1, and 0.8,espectively. The locations of the components of the ERPsere analyzed using a scalp–skull–brain/dipole tracingethod. The ERPs elicited in response to the facial stimuli
onsisted of a negative peak (N1), two positive peaks, and aubsequent slow negative shift. For N1, the equivalent cur-ent dipoles were concentrated in the fusiform gyrus, rightuperior temporal gyrus, parahippocampal gyrus, cingulateortex, and cerebellum, in normal subjects. In response tohe fearful stimulus, dipoles were also generated from themygdala in seven out of 10 normal subjects. In contrast, inatients with PD, N1 was centered bilaterally in the angularyrus and supramarginal gyrus, and there was no neuronalctivity in the amygdala. After N1, dipoles moved toward therontal region in normal subjects, whereas they remained inhe parietal lobes in patients with PD. These results suggesthat neither the amygdala nor the temporal visual-associatedortices are involved in responding to fearful expressions inatients with PD. Corticostriatal connections may be variablyffected by a lack of dopamine or by pathological changes inhe amygdala. Thus, somatosensory recruitment may over-ome the mild cognitive emotional deficits that are present inatients with PD owing to a dysfunction of the amygdala.2005 IBRO. Published by Elsevier Ltd. All rights reserved.
ey words: event-related potentials, face recognition, amyg-ala, dipole tracing method, Parkinson’s disease.
Correspondence to: M. Kawamura, Department of Neurology, Showaniversity School of Medicine, Hatanodai 1-5-8, Shinagawa-ku, Tokyo42-8555, Japan. Tel: �81-3-3784-6761; fax: �81-3-3784-1936.-mail address: [email protected] (M. Kawamura).bbreviations: ANOVA, analysis of variance; DT, dipole tracing; ECD,quivalent current dipole; EEG, electroencephalogram; ERP, event-elated potential; fMRI, functional magnetic resonance imaging; MEG,agnetoencephalography; MRI, magnetic resonance imaging; PD,arkinson’s disease; PET, positron emission tomography; RT, reac-
sion time; SSB, scalp-skull-brain; STAI, state trait anxiety inventory;-D, three-dimensional.
306-4522/05$30.00�0.00 © 2005 IBRO. Published by Elsevier Ltd. All rights reseroi:10.1016/j.neuroscience.2004.09.054
523
n social interactions, comprehension of the emotionaltates of others is essential for understanding behaviornd avoiding unnecessary conflict. Facial expressions areentral to communicating emotion, and interpreting facialxpression is crucial for effective social interaction. In pri-ates, including humans, the amygdala is important for
he expression of appropriate social behavior and particu-arly for interpreting non-verbal communication such asacial expression.
Several recent neuropsychological studies have re-orted deficits that affect the recognition of specific emo-ions. Patients with selective lesions of the amygdalaAdolphs et al., 1994, 1995, 1999a) show severely im-aired recognition of facial expressions of fear. People withuntington’s disease (Sprengelmeyer et al., 1996) arearticularly poor at recognizing facial expressions of dis-ust. In the case of Parkinson’s disease (PD), the findingsre less clear. While some studies have reported thatatients with PD exhibit deficits in comparing emotionalacial expressions (Jacobs et al., 1995), others have foundo impairment of emotion recognition (Adolphs et al.,998). In a previous study, we found that patients with PDhowed deficits in recognizing fear and disgust in photo-raphs and video recordings of facial expressions, butecognition of emotion in written verbal stimuli was appar-ntly normal in the same patients (Kan et al., 2002). Thisbservation was supported by Sprengelmeyer et al.2003), who reported that medicated and unmedicatedatients with PD exhibited impaired recognition of facialxpressions. Functional neuroimaging has revealed thatoth the amygdala and striatum or insula are involved inrocessing expressions of fear and disgust (Morris et al.,996; Phillips et al., 1997; Krolak-Salmon et al., 2003). As
here is evidence that the amygdala and striatum do notunction normally in patients with PD (Mattila et al., 1999;uchi et al., 1999), it is possible that the disturbance ofmotional recognition in patients with PD can be attributedo pathological changes in these regions of the brain.
In this study, we hypothesized that dysfunction of themygdala in patients with PD changes the neural sub-trates that are normally used to recognize emotion. To
nvestigate the neural mechanisms that are involved inecognizing facial expressions in patients with PD, weecorded visual event-related potentials (ERPs) related tohe recognition of fearful expressions, and determined theocation of the equivalent current dipoles (ECDs). We es-imated the location of the source of the ECDs by means ofhe scalp–skull–brain/dipole tracing (SSB/DT) method.he SSB/DT method can approximate the distribution of
urface potentials of human electroencephalogramsved.

(EteHmiH
S
Tm5iassaebSeeo
E
Wwt2sat
E
Damff0msDtEiEwsw
D
EtriPbT22o
dnNTra
D
Frbtranfstras
awtEsaersvptifS
caMJhdadsfclwddcdcis
twYp
N. Yoshimura et al. / Neuroscience 131 (2005) 523–534524
EEGs) to the position and vector dipole moment of anCD, estimated by minimizing the mean squared error of
he dipole potentials that are recorded from the surfacelectrodes (He et al., 1987; Nishijo et al., 1994, 1996;ayashi et al., 1995; Homma et al., 1994). The SSB/DTethod has been used to reliably evaluate neural activity
n deep locations, such as the limbic system (Masaoka andomma, 2000; Masaoka et al., 2003).
EXPERIMENTAL PROCEDURES
ubjects
en elderly healthy normal volunteers (range of age: 49–71 years;edian: 63.5; all male) and nine patients with PD (range of age:1–79 years; median: 72; seven males, two females) participated
n the study. All patients were treated with medications that areppropriate for patients with PD. The severity of parkinsonianymptoms in all cases was equivalent to 2 or 3 on the Hoehn–Yahrcale (Hoehn and Yahr, 1967). As anxiety causes activation of themygdala (Masaoka and Homma, 2000), the state of anxiety ofach patient was measured before each experiment using Spiel-erger’s state trait anxiety inventory (STAI; Spielberger, 1983).TAI consists of two anxiety scales, state anxiety, and trait anxi-ty. Informed consent was obtained from each participant, and thexperimental procedures were approved by the Ethics Committeef Showa University School of Medicine.
xperimental paradigm
e used a three-stimulus oddball paradigm. Facial expressionsere performed by professional male and female actors, and were
he same as those that were used in our previous study (Kan et al.,002). We used three different facial expressions, namely, fearful,urprised, and neutral (see below). The fearful face was defineds the target stimulus, the surprised face as a rare non-target, andhe neutral face as a frequent non-target.
xperimental setup
igitized color photographs of faces edited to a height of 10 cmnd a width of 13 cm were displayed on a 15-inch TFT-LCDonitor that was placed at a distance of approximately 80 cm in
ront of the eyes of the subject. Fearful, surprised, and neutralacial expressions were presented for 500 ms, with a probability of.1, 0.1, and 0.8 in random order, respectively, at intervals of 1500s. The order of stimulus presentation was controlled by a per-
onal computer (Compaq Presario Desktops; Hewlett-Packardevelopment Company, L.P., CA, USA). Subjects were instructed
o keep their eyes open and to fix their gaze on the monitor screen.ach subject was asked to press a button with his or her right
ndex finger as soon as a target stimulus appeared on the monitor.ach subject completed four to six experimental sessions, each ofhich consisted of the presentation of 150 stimuli. Three randomequences were used to create the order of stimulus presentationithin each session.
ata acquisition
EGs were recorded using 19 Ag/AgCl electrodes that were fixedo the scalp according to the International 10/20 system, and aeference electrode was attached to the right earlobe. Electrodempedances were held below 5 k� throughout the recording.otentials were amplified and bandpass-filtered (0.53–120.00 Hz)y the EEG recorder (EEG-1100; Nihon Kohden Corporation,okyo, Japan), and data were stored on an EEG analyzer (DAE-100; Nihon Kohden Corporation). The data were sampled at-ms intervals (sampling rate, 500 Hz) and thereafter were stored
n magnetic optical disks for off-line analysis. PTo construct an SSB/DT model of the head on which the ECData could be overlaid, we obtained T1-weighted magnetic reso-ance imaging (MRI) recordings using a 1.5 Tesla system (MAG-ETOM Impact Expert; Siemens-Asahi Medical Technologies,okyo, Japan) in the DICOM3 format from each subject, and theneconstructed wire-frame models for the shape of the scalp, skull,nd brain of each subject.
ata analysis
or the off-line analysis of data, waveforms were averaged afterejecting the trials containing signals that were compromised bylinking or excessive eye movement (�50 �V). We also excludedrials in which the subject failed to perform the task correctly. Theemaining trials that were contaminated with other artifacts, suchs slow potential shifts caused by sweating, were carefully elimi-ated from the final average. The time window for averaging wasrom 100 ms before to 900 ms after the presentation of each visualtimulus. Reaction time (RT) was defined as the interval betweenhe presentation of the target stimulus and the pressing of theesponse button by the subject. Consequently, there were threeveraged waveforms for each subject corresponding to the threetimuli (target, frequent non-target, rare non-target).
The zero baseline for measuring the ERPs was obtained byveraging the amplitudes of the first 100 ms of the whole analysisindow for each channel. As will be described in the Results,
hree peaks (two positive and one negative) were identified in theRPs. The peak latency and amplitude of each wave were mea-ured in the average waveform for each stimulus. Average peakmplitudes during the 50-ms period on either side of the peak (forxample, from 350 to 450 ms for P400) were calculated withespect to the pre-stimulus baseline for each stimulus for eachubject. The data were analyzed using a three-way analysis ofariance (ANOVA) with repeated measures [group (normal oratients: between-subjects factor)�stimulus (target, frequent non-arget or rare non-target: within-subjects factors)�electrode (with-n-subjects factors)]. Similarly, a separate ANOVA was conductedor the six temporal electrodes (P3, T5, O1 vs. P4, T6, O2).tatistical significance was set at P�0.05.
To determine the location of the stereotaxic coordinates of theurrent source generators of the ERPs, ERP data were analyzedccording to the methods of Masaoka and Homma (2000) andasaoka et al. (2003) with a Brain Space Navigator (BS-navi;
apan Graphics, Tokyo, Japan), using the realistic three-layeread model (SSB) for each subject, and assuming standard con-uctivity (0.33 S/m for skin and brain, 0.0041 S/m for bone). Usingboundary element method, the SSB/DT can calculate potential
istributions generated by one or two assumed dipoles on theurface of the head. The actual potential distributions recordedrom the 19 scalp electrodes (Vobs) were compared with thealculated potential distribution (Vcal) for one or two ECDs and theocations and vector moments of one or two dipoles were changedithin the three-dimensional (3-D) head model until the squaredifference between the Vobs and the Vcal was minimal (one-ipole estimation or two dipole estimation, respectively). Wehose the two dipole estimation in this study. We evaluated onlyipoles for which root-mean-square quality of fit (dipolarity) ex-eeded 98%, because only dipolarity values greater than 98%ndicate agreement between the estimated dipoles and the ob-erved potential (Homma et al., 1994).
Differences in the percentage of incorrect responses, RT, andhe anxiety score between patients with PD and normal subjectsere analyzed using the Mann-Whitney U statistic. �2 Tests withates’ adjustment were used to compare the appearance of di-oles between normal subjects and patients with PD. In all cases,
�0.05 was considered statistically significant.
T
To9rtWip4Pas
E
TPtfcipagwP
ttsols2sEjs
sectFwpo2awsmpt
T
N
P
*f
N. Yoshimura et al. / Neuroscience 131 (2005) 523–534 525
RESULTS
ask performance
he normal subjects responded correctly to 98.5�1.24%f the stimuli, whereas the patients with PD responded to8.9�0.65%. As is evident from the percentage of correctesponses and RTs (Table 1), normal subjects and pa-ients with PD performed the task equally well (Mann-
hitney U test, P�0.05). The mean STAI scores for anx-ety were 40.2�5.9 in normal subjects and 42.3�11.2 inatients with PD. The mean scores for state anxiety were0.9�8.6 in normal subjects and 37.6�8.4 in patients withD. There were no significant differences between thenxiety scores of patients with PD and those of normalubjects.
RPs
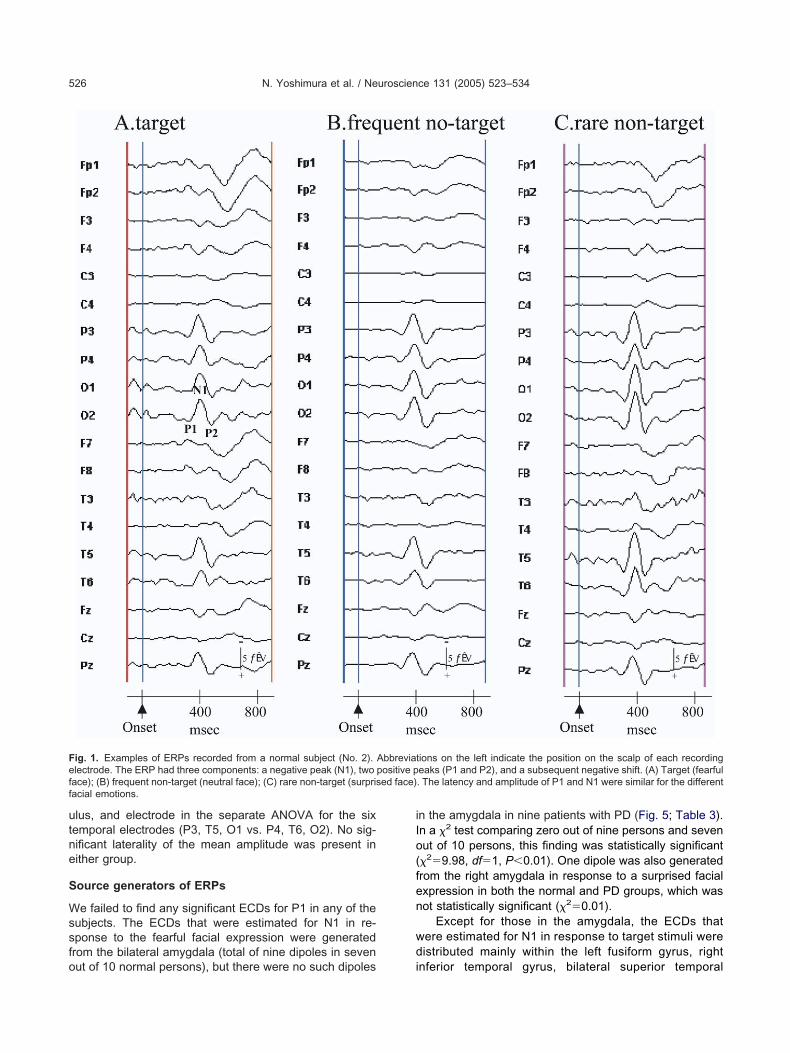
ypical ERPs for one normal subject and one patient withD for the three stimuli [target (fearful face), rare non-
arget (surprised face), and frequent non-target (neutralace)] are shown in Figs. 1 and 2, respectively. Threeomponents of the ERPs elicited by each stimulus weredentified, namely, a negative peak (N1), two positiveeaks (P1 and P2), and a slow negative shift. The latencynd amplitude of P1 and N1 appeared to be similar, re-ardless of the stimuli. The general morphology of theaveform was similar in normal subjects and patients with
able 1. Task performance by normal subjects and patients with Park
Age(y.o.) Sex RT (sec
ormal subjects (N 10)No. 1 55 M 0.539No. 2 53 M 0.727No. 3 49 M 0.584No. 4 67 M 0.730No. 5 63 M 0.626No. 6 61 M 0.691No. 7 71 M 0.830No. 8 64 M 0.789No. 9 66 M 0.594No. 10 64 M 0.671Mean 0.68�0
atients of Parkinson disease(N9)
No. 1 51 M 0.900No. 2 77 M 0.966No. 3 76 F 0.937No. 4 68 F 0.707No. 5 72 M 0.576No. 6 60 M 0.532No. 7 70 M 0.772No. 8 79 M 0.663No. 9 73 M 0.576Mean 0.74�0
The number of trials excluded from the final average divided by theace, rare non-targetsurprised face. M, male; F, female.
D. N1 and P1 were present predominantly at occipito- m
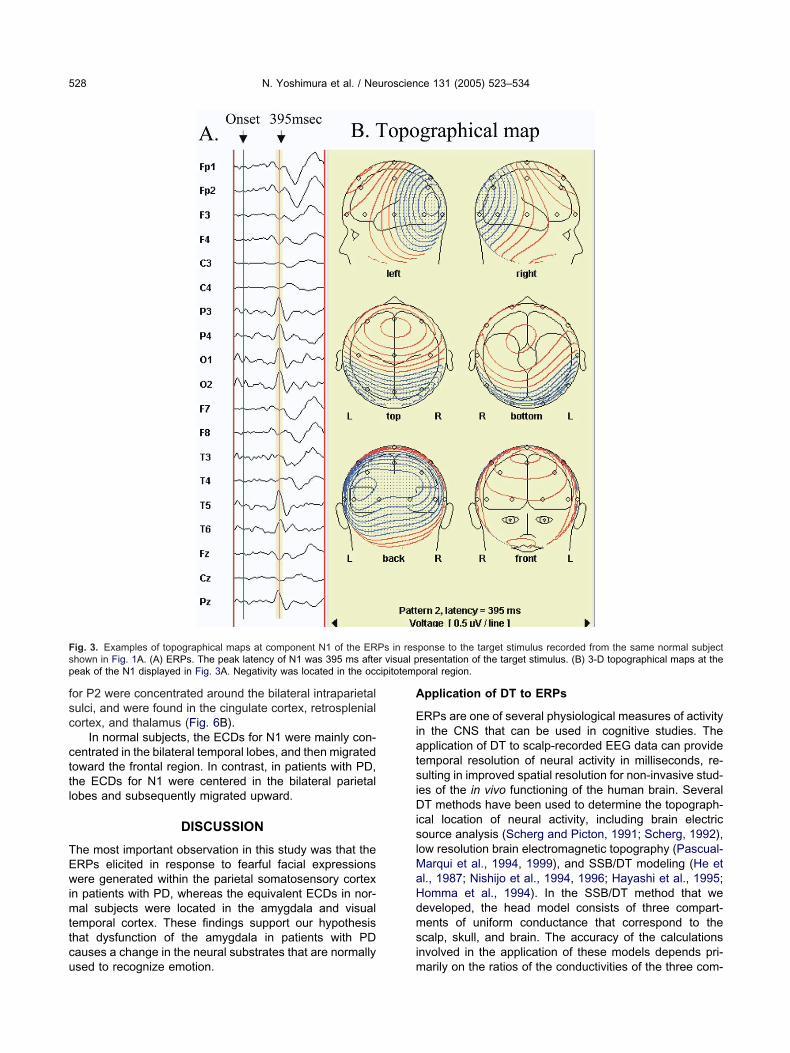
emporal sites on the scalp (O1, O2, T5, and T6). Theopographical map of the N1 peak in Figs. 3A and 4A (theame as those shown in Figs. 1A and 2A) also indicatedccipitotemporal negativity (Figs. 3B and 4B). The mean
atency of these components (measured at O1) is pre-ented in Table 2. The latency of N1 was within a range of50–550 ms, although the range varied among differentubjects. Consequently, we estimated the location of theCDs for each component of the waveform for each sub-
ect, rather than using an overall averaged waveform of allubjects.
The mean amplitudes of P1, N1, and P2 were analyzedeparately using three-way ANOVA (group�stimulus�lectrode). The main effects were not significant in theomponents of P1 or N1. There was a significant interac-ion of group�stimulus in both P1 and N1 [P1,(2,54)3.918, P�0.05; N1, F(2,54)6.606, P�0.01],hich indicated a stimulus-specific amplitude increase inatients with PD. P2 was maximal at O1. The mean valuef the average amplitude of P2 measured at O1 was.2�2.5 �V (target), 1.9�1.8 �V (frequent non-target),nd 3.7�2.2 �V (rare non-target) in normal subjects,hereas it was 6.7�4.3, 7.2�4.7, and 6.5�4.0 �V, re-pectively, in patients with PD. There was a significantain effect of group [F(1,72)12.802, P�0.05]. The am-litudes of the P2 voltages in patients with PD were largerhan in the normal subjects. There was neither a significant
isease
Correctresponse (%)
Rejection ratio* (%)
Frequentnon-target
Raretarget
Rarenon-target
99.6 3.2 1.9 1.999.8 27.4 1.6 8.399.6 48.4 3.2 16.798.0 37.5 11.4 28.897.6 38.0 12.0 28.699.7 1.6 2.0 3.298.3 45.1 10.1 17.995.9 29.0 7.3 13.298.0 17.7 13.4 20.598.2 24.3 6.7 7.198.5�1.24
99.7 15.7 2.6 7.498.8 24.1 29.1 8.299.0 22.5 21.8 23.697.8 21.6 13.7 14.799.6 12.3 6.2 3.598.9 18.3 4.2 24.499.3 10.9 6.4 4.499.0 23.0 15.9 5.398.0 27.0 8.9 10.298.9�0.65
ber of frequent non-target stimulusneutral face, rare targetfearful
inson’s d
onds)
.09
.17
total num
ain effect nor a significant interaction among group, stim-
utne
S
Wssfo
iIo(fen
wd
Feff
N. Yoshimura et al. / Neuroscience 131 (2005) 523–534526
lus, and electrode in the separate ANOVA for the sixemporal electrodes (P3, T5, O1 vs. P4, T6, O2). No sig-ificant laterality of the mean amplitude was present inither group.
ource generators of ERPs
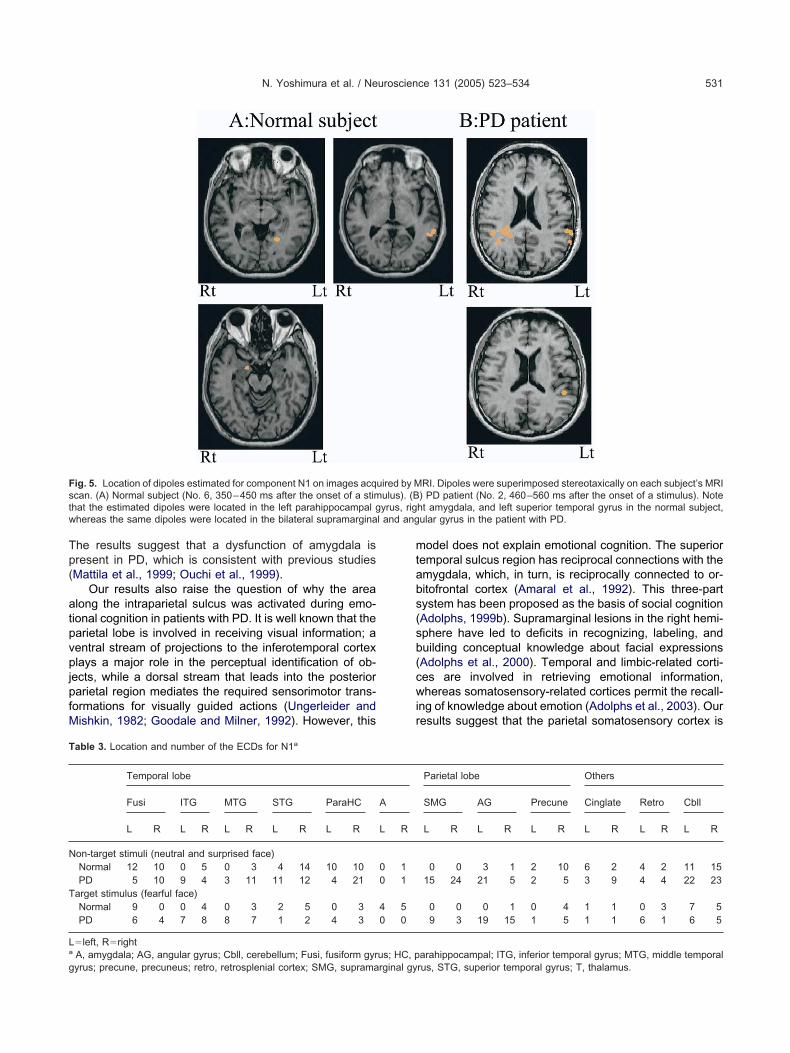
e failed to find any significant ECDs for P1 in any of theubjects. The ECDs that were estimated for N1 in re-ponse to the fearful facial expression were generatedrom the bilateral amygdala (total of nine dipoles in seven
ig. 1. Examples of ERPs recorded from a normal subject (No. 2).lectrode. The ERP had three components: a negative peak (N1), twoace); (B) frequent non-target (neutral face); (C) rare non-target (surprisacial emotions.
ut of 10 normal persons), but there were no such dipoles i
n the amygdala in nine patients with PD (Fig. 5; Table 3).n a �2 test comparing zero out of nine persons and sevenut of 10 persons, this finding was statistically significant�29.98, df1, P�0.01). One dipole was also generatedrom the right amygdala in response to a surprised facialxpression in both the normal and PD groups, which wasot statistically significant (�20.01).
Except for those in the amygdala, the ECDs thatere estimated for N1 in response to target stimuli wereistributed mainly within the left fusiform gyrus, right
ions on the left indicate the position on the scalp of each recordingeaks (P1 and P2), and a subsequent negative shift. (A) Target (fearful. The latency and amplitude of P1 and N1 were similar for the different
Abbreviatpositive ped face)
nferior temporal gyrus, bilateral superior temporal

gteecapdwls
PfigaPwltu
F( whereas
N. Yoshimura et al. / Neuroscience 131 (2005) 523–534 527
yrus, and cerebellum, in normal subjects. In responseo non-target stimuli (both neutral and surprised facialxpressions), the ECD were also distributed in the bilat-ral fusiform gyrus, parahippocampal gyrus, cingulateortex, retrosplenial cortex, and right precuneus, as wells in the right inferior temporal gyrus and bilateral su-erior temporal gyrus. In patients with PD, the ECDsistributed in regions similar to those of normal subjectsere less abundant, and most of the dipoles were
ocated in the parietooccipital cortex, particularly in the
ig. 2. Examples of ERPs recorded from a patient with PD (No. 5). (A)surprised face). The general morphology of the waveform was similar,
upramarginal and angular gyrus. f
In normal subjects, the ECDs that were estimated for2 in response to fearful facial expressions were diversi-ed in the right inferior temporal gyrus, bilateral angularyrus, left orbitofrontal gyrus, right middle frontal gyrus,nd left retrosplenial cortex (Fig. 6, Table 4). The ECDs for2 in response to non-target stimuli were distributed moreidely than those in response to the target stimulus, being
ocated in the bilateral inferior temporal gyrus, left superioremporal gyrus, parahippocampal gyrus, right superior lob-le, right precuneus, left orbitofrontal gyrus, and left middle
earful face); (B) frequent non-target (neutral face); (C) rare non-targetthe peak amplitude was larger than in the normal subject (see Fig. 1).
Target (f
rontal gyrus. In contrast, in patients with PD, the dipoles
fsc
cttl
TEwimttcu
A
EiatsiDislMaHdmsi
Fs r visual pp ipitotemp
N. Yoshimura et al. / Neuroscience 131 (2005) 523–534528
or P2 were concentrated around the bilateral intraparietalulci, and were found in the cingulate cortex, retrosplenialortex, and thalamus (Fig. 6B).
In normal subjects, the ECDs for N1 were mainly con-entrated in the bilateral temporal lobes, and then migratedoward the frontal region. In contrast, in patients with PD,he ECDs for N1 were centered in the bilateral parietalobes and subsequently migrated upward.
DISCUSSION
he most important observation in this study was that theRPs elicited in response to fearful facial expressionsere generated within the parietal somatosensory cortex
n patients with PD, whereas the equivalent ECDs in nor-al subjects were located in the amygdala and visual
emporal cortex. These findings support our hypothesishat dysfunction of the amygdala in patients with PDauses a change in the neural substrates that are normally
ig. 3. Examples of topographical maps at component N1 of the ERhown in Fig. 1A. (A) ERPs. The peak latency of N1 was 395 ms afteeak of the N1 displayed in Fig. 3A. Negativity was located in the occ
sed to recognize emotion. m
pplication of DT to ERPs
RPs are one of several physiological measures of activityn the CNS that can be used in cognitive studies. Thepplication of DT to scalp-recorded EEG data can provideemporal resolution of neural activity in milliseconds, re-ulting in improved spatial resolution for non-invasive stud-
es of the in vivo functioning of the human brain. SeveralT methods have been used to determine the topograph-
cal location of neural activity, including brain electricource analysis (Scherg and Picton, 1991; Scherg, 1992),
ow resolution brain electromagnetic topography (Pascual-arqui et al., 1994, 1999), and SSB/DT modeling (He etl., 1987; Nishijo et al., 1994, 1996; Hayashi et al., 1995;omma et al., 1994). In the SSB/DT method that weeveloped, the head model consists of three compart-ents of uniform conductance that correspond to the
calp, skull, and brain. The accuracy of the calculationsnvolved in the application of these models depends pri-
ponse to the target stimulus recorded from the same normal subjectresentation of the target stimulus. (B) 3-D topographical maps at theoral region.
Ps in res
arily on the ratios of the conductivities of the three com-
p(afiedWmrsdmhi(
C
S1
l2nhfgccfwcfafs(at
Fs r visual pp
N. Yoshimura et al. / Neuroscience 131 (2005) 523–534 529
artments that correspond to the scalp, skull, and brainHomma et al., 1994, 1995). It has been reported that thebsolute mean deviation of actual dipoles (generated arti-cially at known coordinates in the monkey brain) fromstimated dipoles (calculated from the surface potentialistributions) was within 3.0–9.0 mm (Nishijo et al., 1994).e found previously that the location of the dipoles esti-ated by SSB/DT corresponded to the location of intrace-
ebral depth electrodes, which were able to record epilepticpikes simultaneously (Homma et al., 2001). While noetailed comparative study has been made of the afore-entioned SSB/DT methods techniques, our techniqueas been shown to be useful in the investigation of activity
n the amygdala and other areas of the limbic systemMasaoka and Homma, 2000; Masaoka et al., 2003).
omparison of components N1 and N170
tudies of ERPs recorded from the scalp (Bentin et al.,
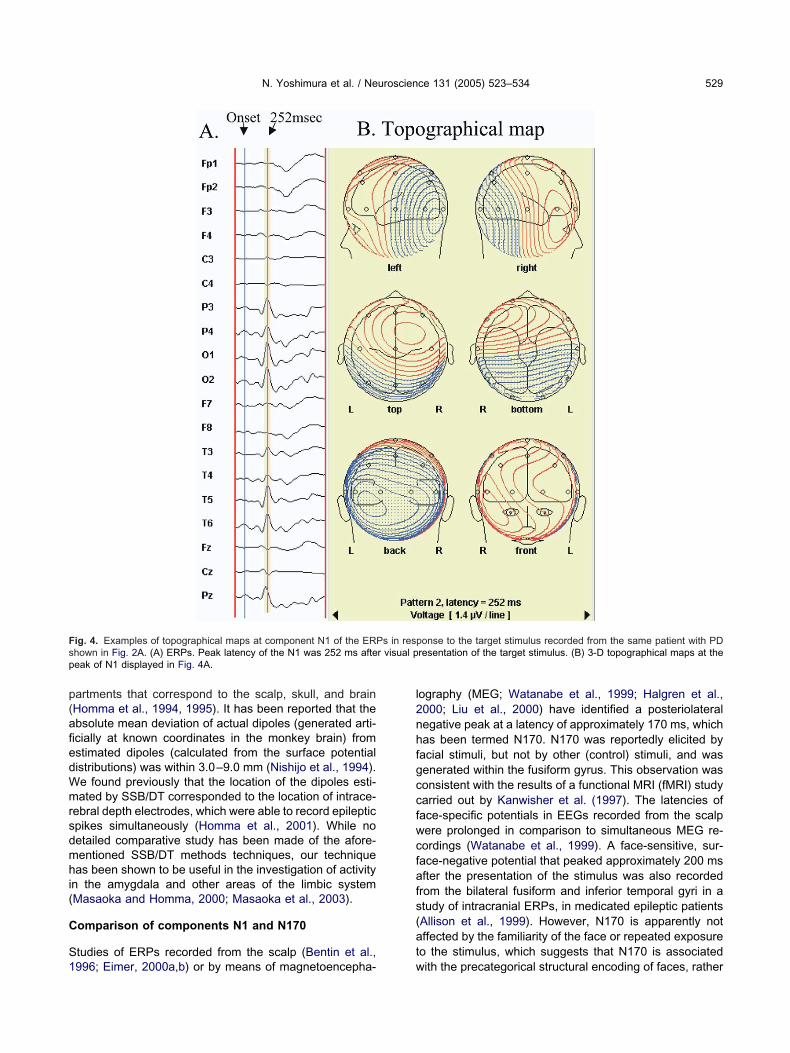
ig. 4. Examples of topographical maps at component N1 of the ERPhown in Fig. 2A. (A) ERPs. Peak latency of the N1 was 252 ms afteeak of N1 displayed in Fig. 4A.
996; Eimer, 2000a,b) or by means of magnetoencepha- w
ography (MEG; Watanabe et al., 1999; Halgren et al.,000; Liu et al., 2000) have identified a posteriolateralegative peak at a latency of approximately 170 ms, whichas been termed N170. N170 was reportedly elicited byacial stimuli, but not by other (control) stimuli, and wasenerated within the fusiform gyrus. This observation wasonsistent with the results of a functional MRI (fMRI) studyarried out by Kanwisher et al. (1997). The latencies oface-specific potentials in EEGs recorded from the scalpere prolonged in comparison to simultaneous MEG re-ordings (Watanabe et al., 1999). A face-sensitive, sur-ace-negative potential that peaked approximately 200 msfter the presentation of the stimulus was also recordedrom the bilateral fusiform and inferior temporal gyri in atudy of intracranial ERPs, in medicated epileptic patientsAllison et al., 1999). However, N170 is apparently notffected by the familiarity of the face or repeated exposureo the stimulus, which suggests that N170 is associated
onse to the target stimulus recorded from the same patient with PDresentation of the target stimulus. (B) 3-D topographical maps at the
s in resp
ith the precategorical structural encoding of faces, rather

tohmtrpe1ataauslfpsr
rvciuNsaupanitlshTtad
T
Idcbcsafvpatacd
T
N
P
a F, fear; N, neutral; S, surprise.
N. Yoshimura et al. / Neuroscience 131 (2005) 523–534530
han with the subsequent processes involved in face rec-gnition or identification (Eimer, 2000a). Several studiesave addressed the differences between the cerebralechanisms that subserve facial identification and those
hat are involved in recognizing facial emotion using ERPecordings (Münte et al., 1998; Bobes et al., 2000; Cam-anella et al., 2002; Eimer and Holmes, 2002), positronmission tomography (PET), and fMRI (Sergent et al.,994; Puce et al., 1995; Phillips et al., 1998; Narumoto etl., 2001). In this study, we identified three components ofhe ERPs evoked in the emotion-recognition task, namely,negative wave (N1), two positive waves (P1 and P2), andsubsequent negative shift. These potentials were distrib-ted bilaterally within the occipitotemporal region of thecalp. The ECDs estimated for N1 in normal subjects were
ocated in the fusiform gyrus, parahippocampal gyrus, in-erior and superior temporal gyri, and amygdala. We sus-ect that the N1 component of ERPs, as described in thistudy, is a wave that is distinct from N170 and may includeesponses to other visual or emotional processes.
The latency of N1 recorded from O1 was within theange 250–550 ms, although there were large interindi-idual differences in this range. In a previous study, theomponents of emotion-modulated ERPs were observed
n the range 250–600 ms (Münte et al., 1998) and individ-al differences in latency were greater than the latency of170 reported by Watanabe et al. (1999). The extremelytrong correlation between RT and N1 latency might bettributable to some unidentified problem within the stim-lus delivery system, in that most of the variations in botharameters were due to variations between the supposednd actual stimulus presentation time. However, this doesot explain why latencies were consistently much shorter
n some subjects than in others. Another explanation forhe differences among individuals with respect to the N1atency is age. Age-related slowing of access to domain-pecific memory representations and response decisionsas been noted in previous studies (Pfütze et al., 2002;akakura et al., 2003). Finally, prolongation of the RT and
he N1 latency may reflect impairment of visual acuity orttention, which is more prominent in elderly people; el-erly individuals, of course, were participants in this study.
he source generators of ECDs
n patients with PD, the locations of the ECDs for N1iffered markedly from those in normal subjects. Specifi-ally, in patients with PD, the dipoles were concentratedilaterally in the parietal cortex along the intraparietal sul-us, including the supramarginal gyrus, angular gyrus, anduperior parietal lobule; there was no involvement of themygdala in any of the PD patients in response to fearfulacial expressions. As high levels of anxiety produce acti-ation in the amygdala (Masaoka and Homma, 2000), it isossible that, in our study, the observed differences inctivation of the amygdala in normal subjects and in pa-ients with PD were owing to differences in the degree ofnxiety in each group. However, this is unlikely to be thease, because the anxiety scores were not significantly
able 2. Peak latencies of waveform and reaction timea
StimulationP1(ms)
N1(ms)
P2(ms)
RT(seconds)
ormal subjectsNo. 1 N 204 251 460
F 197 243 460 0.54S 203 243 460
No. 3 N 213 278 360F 200 278 356 0.58S 227 282 369
No. 9 N 199 278 396F 201 270 388 0.59S 201 271 410
No. 5 N 226 278 412F 213 282 478 0.63S 213 282 482
No. 10 N 282 370 510F 282 385 504 0.67S 282 378 504
No. 6 N 300 395 482F 326 404 482 0.69S 321 404 478
No. 2 N 456 512 599F 460 521 582 0.72S 456 521 582
No. 4 N 469 521 595F 469 530 604 0.73S 473 530 599
No. 8 N 482 538 617F 473 530 638 0.79S 482 543 617
No. 7 N 465 547 630F 473 543 656 0.83S 472 551 664
D patientsNo. 6 N 221 274 365
F 217 278 478 0.53S 226 291 473
No. 5 N 191 247 330F 195 252 352 0.58S 191 217 360
No. 9 N 188 221 330F 191 227 330 0.58S 191 224 321
No. 8 N 334 399 508F 302 384 530 0.66S 280 367 530
No. 4 N 204 247 321F 204 252 330 0.70S 191 243 326
No. 7 N 326 395 569F 333 395 578 0.77S 326 404 560
No. 1 N 321 417 508F 313 399 525 0.90S 330 417 517
No. 3 N 326 412 582F 360 404 582 0.93S 330 430 473
No. 2 N 447 512 595F 452 512 578 0.97S 456 512 573
ifferent in normal subjects, as compared with PD patients.
Tp(
atpvpjpfM
mtabs(sb(cwir
Fst yrus, rigw l and ang
T
N
T
La
g
N. Yoshimura et al. / Neuroscience 131 (2005) 523–534 531
he results suggest that a dysfunction of amygdala isresent in PD, which is consistent with previous studiesMattila et al., 1999; Ouchi et al., 1999).
Our results also raise the question of why the arealong the intraparietal sulcus was activated during emo-
ional cognition in patients with PD. It is well known that thearietal lobe is involved in receiving visual information; aentral stream of projections to the inferotemporal cortexlays a major role in the perceptual identification of ob-
ects, while a dorsal stream that leads into the posteriorarietal region mediates the required sensorimotor trans-
ormations for visually guided actions (Ungerleider andishkin, 1982; Goodale and Milner, 1992). However, this
ig. 5. Location of dipoles estimated for component N1 on images acqcan. (A) Normal subject (No. 6, 350–450 ms after the onset of a stimhat the estimated dipoles were located in the left parahippocampal ghereas the same dipoles were located in the bilateral supramargina
able 3. Location and number of the ECDs for N1a
Temporal lobe
Fusi ITG MTG STG ParaHC
L R L R L R L R L R
on-target stimuli (neutral and surprised face)Normal 12 10 0 5 0 3 4 14 10 10PD 5 10 9 4 3 11 11 12 4 21
arget stimulus (fearful face)Normal 9 0 0 4 0 3 2 5 0 3PD 6 4 7 8 8 7 1 2 4 3
left, RrightA, amygdala; AG, angular gyrus; Cbll, cerebellum; Fusi, fusiform gyr
yrus; precune, precuneus; retro, retrosplenial cortex; SMG, supramarginal gyodel does not explain emotional cognition. The superioremporal sulcus region has reciprocal connections with themygdala, which, in turn, is reciprocally connected to or-itofrontal cortex (Amaral et al., 1992). This three-partystem has been proposed as the basis of social cognitionAdolphs, 1999b). Supramarginal lesions in the right hemi-phere have led to deficits in recognizing, labeling, anduilding conceptual knowledge about facial expressionsAdolphs et al., 2000). Temporal and limbic-related corti-es are involved in retrieving emotional information,hereas somatosensory-related cortices permit the recall-
ng of knowledge about emotion (Adolphs et al., 2003). Ouresults suggest that the parietal somatosensory cortex is
RI. Dipoles were superimposed stereotaxically on each subject’s MRI) PD patient (No. 2, 460–560 ms after the onset of a stimulus). Noteht amygdala, and left superior temporal gyrus in the normal subject,ular gyrus in the patient with PD.
Parietal lobe Others
SMG AG Precune Cinglate Retro Cbll
L R L R L R L R L R L R
0 0 3 1 2 10 6 2 4 2 11 1515 24 21 5 2 5 3 9 4 4 22 23
0 0 0 1 0 4 1 1 0 3 7 59 3 19 15 1 5 1 1 6 1 6 5
arahippocampal; ITG, inferior temporal gyrus; MTG, middle temporal
uired by Mulus). (B
A
L R
0 10 1
4 50 0
us; HC, p
rus, STG, superior temporal gyrus; T, thalamus.
pwctndo
lwm
r(lfIscrmlw
Fs5n the intraps
T
N
T
La
pp
N. Yoshimura et al. / Neuroscience 131 (2005) 523–534532
referentially recruited for emotional recognition in patientsith PD, because both the amygdala and orbitofrontalortex show relatively less response to facial expressionshan is the case in normal subjects. Mild deficits in recog-ition of fear and disgust in facial expressions, due toysfunction of the amygdala in patients with PD, may bevercome by enhanced recruitment of the parietal cortex.
In this study, the value obtained by subtracting theatency of N1 from RT was significantly greater in patientsith PD than in normal subjects. In addition to slowing ofovement, slowing of cognitive processing—which is not
ig. 6. Location of dipoles estimated for component P2 and the subuperimposed stereotaxically on each subject’s MRI scan. (A) Normal, 300–400 ms after the onset of a stimulus). Note that estimated dipormal subject, whereas the same dipoles were concentrated arounduperior parietal lobule in the patient with PD.
able 4. Location and number of the ECDs for P2 and the following n
Temporal lobe Parietal lobe
ITG STG ParaHC SMG AG SPL P
L R L R L R L R L R L R L
on-target stimuli (neutral and surprised face)Normal 7 8 4 1 7 9 0 0 2 2 2 8 2PD 8 3 1 3 5 13 6 15 31 27 7 10 6
arget stimulus (fearful face)Normal 0 3 1 0 0 1 0 0 2 3 2 1 0PD 1 1 2 0 4 0 1 6 5 6 2 2 0
left, RrightAG, angular gyrus; Cbll, cerebellum; IFG, inferior frontal gyrus; ITGaraHC, parahippocampal gyrus; PoG, postcentral gyrus; precune, pr
arietal lobule; STG, superior temporal gyrus; T, thalamus.estricted to the motor domain—can occur in PDSawamoto et al., 2002). We suspect that the relativelyonger RT of patients with PD after recognition of a fearfulacial expression includes a change in emotional cognition.n such patients, the ECDs calculated from P2 and theubsequent negative shift were generated in the parietalortex along the intraparietal sulci, cingulate cortex, andetrosplenial cortex; the same dipoles in normal subjectsigrated from the temporal and parietal lobes to the frontal
obe. Perception of static facial expressions—as comparedith dynamic emotional perception—activated a motor,
negative shift in the ERP on images acquired by MRI. Dipoles wereNo. 4, 550–650 ms after the onset of a stimulus). (B) PD patient (No.e located in the left straight and orbital gyrus, cingulate cortex in thearietal sulcus and were also observed within the cingulate cortex and
a
Frontal lobe Others
ecune OrG IFG MFG Cinglate Retro T Cbll
R L R L R L R L R L R L R L R
4 8 0 3 1 10 1 7 2 3 6 2 0 4 22 3 4 2 1 6 0 3 5 7 4 6 5 5 15
0 4 0 1 0 1 3 1 0 2 0 0 0 0 23 0 1 0 1 0 0 3 6 3 8 1 3 2 11
temproral gyrus; MFG, middle frontal gyrus; OrG, orbitofrontal gyrus;retro, retrosplenial cortex; SMG, supramarginal gyrus; SPL, superior
sequentsubject (oles wer
egativity
oG Pr
R L
2 01 4
0 00 3
, inferiorecuneus;

piEejoaaf1nbo
TPfEtmegldeinf
ABMIS(e
iRtSsc
A
A
A
A
A
A
A
A
A
B
B
C
D
E
E
E
G
H
H
H
H
H
H
H
J
K
K
N. Yoshimura et al. / Neuroscience 131 (2005) 523–534 533
refrontal, and parietal cortical network, which is involvedn motor imagery (Kilts et al., 2003). The migration of theCDs also raises the possibility that different mental strat-gies are involved in emotional processing in normal sub-
ects and in patients with PD. Patients with mild symptomsf PD have been reported to perform cognitive tasks asccurately as normal subjects, although the pattern ofctivation (as measured by PET) in normal subjects dif-ered from that of patients with PD (Owen and Doyon,999; Dagher et al., 2001). Similarly, corticostriatal con-ections may be variably affected by a lack of dopamine ory pathological changes in the amygdala during the rec-gnition of facial expressions in patients with PD.
CONCLUSIONS
his study revealed that normal subjects and patients withD use different neural substrates to recognize emotion in
acial expressions. The ECDs for component N1 of theRPs evoked by fearful facial expressions were located in
he parietal-associated cortex, in patients with PD. In nor-al subjects, the dipoles for the same stimulus were gen-rated in the fusiform gyrus, amygdala, parahippocampalyrus, and superior temporal gyrus, and then moved to the
eft orbitofrontal gyrus and middle frontal gyrus. The mildeficits in the recognition of fear in facial expressionsxhibited by patients with PD may be attributable to visual
nformation, related to facial emotion being analyzed, usingeural pathways that differ from those subserving thisunction in normal subjects.
cknowledgments—We are grateful to Dr. T. Nagamine (Humanrain Research Center, Kyoto University Graduate School ofedicine) for technical advice, and to Prof. Y. Okamoto (Chiba
nstitute of Technology), Dr. M. Inoue (Department of Neurology,howa University School of Medicine), and Prof. Y. Iwamura
Kawasaki University of Medical Welfare) for useful criticism of anarlier version of this manuscript.
This study was supported in part by a Showa University Grant-n-Aid for Innovative Collaborative Research Projects, a Specialesearch Grant-in-Aid for Development of Characteristic Educa-
ion from the Japanese Ministry of Education, Culture, Sports,cience, and Technology, and a Grant-in-Aid for Scientific Re-earch on Priority Areas (c) from the Japanese Ministry of Edu-ation, Culture, Sports, Science and Technology (No.15590910).
REFERENCES
dolphs R, Tranel D, Damasio H, Damasio A (1994) Impaired recog-nition of emotion in facial expressions following bilateral damage tothe human amygdala. Nature 372:669–672.
dolphs R, Tranel D, Damasio H, Damasio AR (1995) Fear and thehuman amygdala. J Neurosci 15:5879–5891.
dolphs R, Shull R, Tranel D (1998) Intact recognition of facial emotionin Parkinson’s disease. Neuropsychology 12:253–258.
dolphs R, Tranel D, Hamann S, Young AW, Calder AJ, Phelps EA,Anderson A, Lee GP, Damasio AR (1999a) Recognition of facialemotion in nine individuals with bilateral amygdala damage. Neu-ropsychologia 37:1111–1117.
dolphs R (1999b) Social cognition and the human brain. TrendsCogn Sci 3:469–479.
dolphs R, Damasio H, Tranel D, Cooper G, Damasio AR (2000) A
role for the somatosensory cortices in the visual recognition ofemotion as revealed by three-dimensional lesion mapping. J Neu-rosci 20:2683–2690.
dolphs R, Tranel D, Damasio AR (2003) Dissociable neural systemsfor recognizing emotions. Brain Cogn 52:61–69.
llison T, Puce A, Spencer DD, McCarthy G (1999) Electrophysiolog-ical studies of human face perception: I. Potentials generated inoccipitotemporal cortex by face and non-face stimuli. Cereb Cortex9:415–430.
maral DG, Price JL, Pitkänen A, Carmichael ST (1992) Anatomicalorganization of the primate amygdaloid complex. In: Theamygdala: neurobiological aspect of emotion, memory and mentaldysfunction (Aggleton JP, ed), pp 1–66. New York: Wiley-Liss.
entin S, Allison T, Puce A, Perez E, McCarthy G (1996) Electrophys-iological studies of face perception in humans. J Cogn Neurosci8:551–565.
obes MA, Martín M, Olivares E, Valdés-Sosa M (2000) Differentscalp topography of brain potentials related to expression andidentity matching of faces. Brain Res Cogn Brain Res 9:249–260.
ampanella S, Quinet P, Bruyer R, Crommelinck M, Guerit J-M (2002)Categorical perception of happiness and fear in facial expressions:an ERP study. J Cogn Neurosci 14:210–227.
agher A, Owen AM, Boecker H, Brooks DJ (2001) The role of thestriatum and hippocampus in planning: a PET activation study inParkinson’s disease. Brain 124:1020–1032.
imer M (2000a) Event-related brain potentials distinguish processingstages involved in face perception and recognition. Clin Neuro-physiol 111:694–705.
imer M (2000b) The face-specific N170 component reflects late stagesin the structural encoding of faces. Neuroreport 11:2319–2324.
imer M, Holmes A (2002) An ERP study on the time course ofemotional face processing. Neuroreport 13:427–431.
oodale MA, Milner AD (1992) Separate visual pathways for percep-tion and action. Trends Neurosci 15:20–25.
algren E, Raij T, Marinkovic K, Jousmäki V, Hari R (2000) Cognitiveresponse profile of the human fusiform face area as determined byMEG. Cereb Cortex 10:69–81.
ayashi N, Nishijo H, Ono T, Endo S, Tabuchi E (1995) Generators ofsomatosensory evoked potentials investigated by dipole tracing inthe monkey. Neuroscience 68:323–338.
e B, Musha T, Okamoto Y, Homma S (1987) Electric dipole tracing inthe human brain by means of the boundary element method and itsaccuracy. IEEE Trans Biomed Eng 34:406–414.
oehn MN, Yahr MD (1967) Parkinsonism: onset, progression andmortality. Neurology 17:427–442.
omma I, Masaoka Y, Hirasawa K, Yamane F, Hori T, Okamoto Y(2001) Comparison of source localization of interictal epilepticspike potentials in patients estimated by the dipole tracing methodwith the focus directly recorded by the depth electrodes. NeurosciLett 304:1–4.
omma S, Musha T, Nakajima Y, Okamoto Y, Blom S, Flink R,Hagbarth KE, Mostrum U (1994) Localization of electric currentsources in the human brain estimated by the dipole tracing methodof the scalp-skull-brain (SSB) head model. Electroencephalogr ClinNeurophysiol 91:374–382.
omma S, Musha T, Nakajima Y, Okamoto Y, Blom S, Flink R,Hagbarth KE (1995) Conductivity ratio of the scalp-skull-brain headmodel in estimating equivalent dipole sources in human brain.Neurosci Res 22:51–55.
acobs DH, Shuren J, Bowers D, Heilman KM (1995) Emotional facialimagery, perception, and expression in Parkinson’s disease. Neu-rology 45:1696–1702.
an Y, Kawamura M, Hasegawa Y, Mochizuki S, Nakamura K (2002)Recognition of emotion from facial, prosodic and written verbalstimuli in Parkinson’s disease. Cortex 38:623–630.
anwisher N, McDermott J, Chun MM (1997) The fusiform face area:a module in human extrastriate cortex specialized for face percep-
tion. J Neurosci 17:4302–4311.
K
K
L
M
M
M
M
M
N
N
N
O
O
P
P
P
P
P
P
S
S
S
S
S
S
S
T
U
W
N. Yoshimura et al. / Neuroscience 131 (2005) 523–534534
ilts CD, Egan G, Gideon DA, Ely TD, Hoffman JM (2003) Dissociableneural pathways are involved in the recognition of emotion in staticand dynamic facial expression. Neuroimage 18:156–168.
rolak-Salmon P, Hénaff M-A, Isnard J, Tallon-Baudry C, Guénot M,Vighetto A, Bertrand O, Mauguière F (2003) An attention modu-lated response to disgust in human ventral anterior insula. AnnNeurol 53:446–453.
iu J, Higuchi M, Marantz A, Kanwisher N (2000) The selectivity of theoccipitotemporal M170 for faces. Neuroreport 11:337–341.
asaoka Y, Homma I (2000) The source generator of respiratory-related anxiety potential in the human brain. Neurosci Lett283:21–24.
asaoka Y, Hirasawa K, Yamane F, Hori T, Homma I (2003) Effectsof left amygdala lesions on respiration, skin conductance, heartrate, anxiety, and activity of the right amygdala during anticipationof negative stimulus. Behav Modif 27:607–619.
attila PM, Rinne JO, Helenius H, Röyttä M (1999) Neuritic degener-ation in the hippocampus and amygdala in Parkinson’s disease inrelation to Alzheimer pathology. Acta Neuropathol 98:157–164.
orris JS, Frith CD, Perrett DI, Rowland D, Young AW, Calder AJ,Dolan RJ (1996) A differential neural response in the humanamygdala to fearful and happy facial expressions. Nature383:812–815.
ünte TF, Brack M, Grootheer O, Wieringa BM, Matzke M, JohannesS (1998) Brain potentials reveal the timing of face identity andexpression judgment. Neurosci Res 30:25–34.
arumoto J, Okada T, Sadato N, Fukui K, Yonekura Y (2001) Attentionto emotion modulates fMRI activity in human right superior tempo-ral sulcus. Brain Res Cogn Brain Res 12:225–231.
ishijo H, Hayashi N, Fukuda M, Ono T (1994) Localization of dipoleby boundary element method in three-dimensional reconstructedmonkey brain. Brain Res Bull 33:225–230.
ishijo H, Ikeda H, Miyamoto K, Endo S, Ono T (1996) Localization ofan ictal onset zone using a realistic 4-shell head model of scalp,skull, liquor, and brain. Soc Neurosci Abstr 22:185
uchi Y, Yoshikawa E, Okada H, Futatsubashi M, Sekine Y, Iyo M,Sakamoto M (1999) Alterations in binding site density of dopaminetransporter in the striatum, orbitofrontal cortex, and amygdala inearly Parkinson’s disease: compartment analysis for beta-CFTbinding with positron emission tomography. Ann Neurol45:601–610.
wen AM, Doyon J (1999) The cognitive neuropsychology of Parkin-son’s disease: a functional neuroimaging perspective. In: Advanceof neurology, Vol. 80 (Stern GM, ed), pp 49–56. Philadelphia:Lippincott Williams & Wilkins.
ascual-Marqui RD, Michel CM, Lehmann D (1994) Low resolutionelectromagnetic tomography: a new method for localizing electrical
activity in the brain. Int J Psychophysiol 18:49–65.ascual-Marqui RD, Lehmann D, Koenig T, Kochi K, Merlo MCG, Hell D,Koukkou M (1999) Low resolution brain electromagnetic tomography(LORETA) functional imaging in acute, neuroleptic-naive, first-epi-sodic, productive schizophrenia. Psychiatry Res 90:169–179.
fütze E-M, Sommer W, Schweinberger SR (2002) Age-related slow-ing in face and name recognition: evidence from event-relatedbrain potentials. Psychol Aging 17:140–160.
hillips ML, Yong AW, Senior C, Brammer M, Andrew C, Calder AJ,Bullmore ET, Perrett DI, Rowland D, Williams SCR, Gray JA, DavidAS (1997) A specific neural substrate for perceiving facial expres-sions of disgust. Nature 389:495–498.
hillips ML, Bullmore ET, Howard R, Woodruff PWR, Wright IC, Wil-liams SCR, Simmons A, Andrew C, Brammer M, David AS (1998)Investigation of facial recognition memory and happy and sadfacial expression perception: an fMRI study. Psychiatry Res83:127–138.
uce A, Allison T, Gore JC, McCarthy G (1995) Face-sensitive regionsin human extrastriate cortex studied by functional MRI. J Neuro-physiol 74:1192–1199.
awamoto N, Honda M, Hanakawa T, Fukuyama H, Shibasaki H(2002) Cognitive slowing in Parkinson’s disease: a behavioral eval-uation independent of motor slowing. J Neurosci 22:5198–5203.
cherg M, Picton TW (1991) Separation and identification of event-related potential components by brain electric source analysis.Electroenceph Clin Neurophysiol Suppl 42:24–37.
cherg M (1992) Functional imaging and localization of electromag-netic brain activity. Brain Topogr 5:103–111.
ergent J, Ohta S, McDonald B, Zuck E (1994) Segregated processingof facial identity and emotion in the human brain: a PET study.Visual Cogn 1:349–369.
pielberger CD (1983) Manual for the State-Trait Anxiety Inventory.Palo Alto, CA: Consulting Psychologists Press.
prengelmeyer R, Young AW, Calder AJ, Karnat A, Lange H, HömbergV, Perrett DI, Rowland D (1996) Loss of disgust: perception of facesand emotions in Huntington’s disease. Brain 119:1647–1665.
prengelmeyer R, Young AW, Mahn K, Shroeder U, Woitalla D, Bütt-ner T, Kuhn W, Przuntek H (2003) Facial expression recognition inpeople with medicated and unmedicated Parkinson’s disease.Neuropsychologia 41:1047–1057.
akakura H, Umeno K, Tabuchi E, Hori E, Miyamoto K, Aso S, Wa-tanabe Y, Ono T, Nishijo H (2003) Differential activation in themedial temporal lobe during a sound-sequence discrimination taskacross age in human subjects. Neuroscience 119:517–532.
ngerleider L, Mishkin M (1982) Two cortical visual systems. In:Analysis of visual behavior (Ingel D, ed), pp 549–586. Cambridge,MA: MIT Press.
atanabe S, Kakigi R, Koyama S, Kirino E (1999) Human face per-ception traced by magneto- and electro-encephalography. Brain
Res Cogn Brain Res 8:125–142.(Accepted 20 September 2004)(Available online 22 January 2005)