nilotinib in patients with advanced parkinson’s …€¦ · 11/05/2020 · helen matthews –...
TRANSCRIPT

1
NILOTINIB IN PATIENTS WITH ADVANCED PARKINSON’S DISEASE: A
RANDOMIZED PHASE 2A STUDY (NILO-PD):
Authorship: The Parkinson Study Group NILO-PD Investigators:
Steering Committee:
Tanya Simuni, MD – Full Professor, Department of Neurology, Northwestern University
Feinberg School of Medicine, Chicago, Illinois, United States ([email protected])
Brian Fiske, PhD – Senior Vice President, Research Programs, MJFF, New York, New York,
United States ([email protected])
Kalpana Merchant, PhD – Department of Neurology, Northwestern University, Chicago,
Illinois, United States ([email protected])
Christopher S. Coffey, PhD – Full Professor, Department of Biostatistics, College of Public
Health, University of Iowa, Iowa City, Iowa, United States ([email protected])
Elizabeth Klingner, MS – Department of Biostatistics, College of Public Health, University of
Iowa, Iowa City, Iowa, United States ([email protected])
Chelsea Caspell-Garcia, MS – Department of Biostatistics, College of Public Health,
University of Iowa, Iowa City, Iowa, United States ([email protected])
David-Erick, Lafontant, MS – Department of Biostatistics, College of Public Health,
University of Iowa, Iowa City, Iowa, United States ([email protected])
Helen Matthews – Chief Operating Officer, The Cure Parkinson’s Trust, London, United
Kingdom ([email protected])
Richard K. Wyse, MD – Director, Research and Development, The Cure Parkinson’s Trust,
London, United Kingdom ([email protected])
Patrik Brundin, MD – Full Professor, Van Andel Institute, Center for Neurodegenerative
Science, Grand Rapids, Michigan, United States ([email protected])
David K. Simon, MD – Beth Israel Deaconess Medical Center, Harvard Medical School,
Boston, Massachusetts, United States ([email protected])
Michael Schwarzschild, MD – Department of Neurology, Massachusetts General Hospital,
Boston, Massachusetts, United States ([email protected])
. CC-BY-NC 4.0 International licenseIt is made available under a is the author/funder, who has granted medRxiv a license to display the preprint in perpetuity. (which was not certified by peer review)
The copyright holder for this preprint this version posted May 12, 2020. ; https://doi.org/10.1101/2020.05.11.20093146doi: medRxiv preprint
NOTE: This preprint reports new research that has not been certified by peer review and should not be used to guide clinical practice.

2
David Weiner, MD – Consultant, Austin, Texas, United States ([email protected])
Jaime Adams, MD – Department of Neurology, University of Rochester, Rochester, New York,
United States ([email protected])
Charles Venuto, Pharm D – CHET CTCC, University of Rochester, Rochester, New York,
United States ([email protected])
Ted M. Dawson, MD – Full Professor, Department of Neurology, Johns Hopkins University
School of Medicine, Baltimore, Maryland, United States ([email protected])
Liana Baker, MS – CHET CTCC, University of Rochester, Rochester, New York, United
States ([email protected])
Melissa Kostrzebski MS – CHET CTCC, University of Rochester, Rochester, New York,
United States ([email protected])
Tina Ward – Department of Neurology, Northwestern University Feinberg School of Medicine,
Chicago, Illinois, United States ([email protected])
Gary Rafaloff, MS – Steven’s Institute of Technology, Marlboro, New Jersey, United States
Corresponding Author
Tanya Simuni, MD
Department of Neurology
Northwestern University Feinberg School of Medicine
710 North Lake Shore Drive, 1126
Chicago, IL 60611
Phone 312-503-2970
Fax 312-908-5073
Dr. Tanya Simuni had full access to all the data in the study and takes responsibility for the
integrity of the data and the accuracy of the data analysis.
Title: N characters including spaces
Running Head: Nilotinib in PD
Abstract word count: 297 (limit 300)
. CC-BY-NC 4.0 International licenseIt is made available under a is the author/funder, who has granted medRxiv a license to display the preprint in perpetuity. (which was not certified by peer review)
The copyright holder for this preprint this version posted May 12, 2020. ; https://doi.org/10.1101/2020.05.11.20093146doi: medRxiv preprint

3
Word Count (not including figures, tables, abstract, references): N= 4491 (limit 4500)
Tables: 4
Figures 3
Supplementary tables: 1
Supplementary Figures: 0
Other supplementary documents
Supplement 1. Protocol
Supplement 2. Statistical analysis plan
Supplement 3. Analytical methods to determine nilotinib concentrations in the serum and CSF.
Supplement 4. Analytical method for assessment of monoamines and their metabolites in the CSF
Supplement 5. Serum and CSF Pharmacokinetic Study in the Dog
Supplement 6. List of Non-Author contributors (to be listed so they can be searched in the
PubMed)
References = 22
Study funding: Funded by Michael J Fox Foundation for Parkinson’s Research
(MJFF)/ The Cure Parkinson Trust / Van Andel Institute, clinicaltrials.gov NCT03205488
. CC-BY-NC 4.0 International licenseIt is made available under a is the author/funder, who has granted medRxiv a license to display the preprint in perpetuity. (which was not certified by peer review)
The copyright holder for this preprint this version posted May 12, 2020. ; https://doi.org/10.1101/2020.05.11.20093146doi: medRxiv preprint

4
Abstract (words 297/300) JCI limit =250
Background: Nilotinib, a tyrosine kinase Abelson inhibitor, exhibits neuroprotective effects in
preclinical Parkinson disease (PD) models.
Methods: This Phase 2A double-blind placebo-controlled study in moderate/advanced PD
randomized participants 1:1:1 to placebo:150:300 mg nilotinib in matching capsules once daily
for 6 months. The primary outcomes were safety and tolerability, the latter defined as ability to
complete the study on assigned dose. Secondary outcomes included change in PD disability
(Movement Disorder Society Unified Parkinson’s Disease Rating Scale (MDS-UPDRS), Part
3 OFF/ON). Additional exploratory outcomes included serum and cerebrospinal fluid (CSF)
pharmacokinetic (PK) profile, and CSF dopamine metabolites.
Findings: The study screened 125 and enrolled 76 participants (39% screen failure) between
November 2017 and December 2018 at 25 US sites. The last participant completed the study in
September 2019. At baseline, mean (standard deviation) age was 64.6 years (7.5), disease
duration 9.9 years (4.7), MDS-UPDRS Part 1-3 OFF score 66.4(19.3) and ON score 48.4(16.2),
Montreal Cognitive Assessment (MoCA) score 27.1(2.2). Tolerability was 21(84%):19
(76%):20 (77%) in placebo:150:300 mg arm, respectively. Both active doses were safe. The
most common reasons for drug suspension were elevations of amylase and/or lipase, which
were dose-dependent. The 300 mg group had transitory worsening of MDS-UPDRS-3 ON at 1
month compared to placebo (p<0.01), which resolved by 6 months. There was no difference in
the change of MDS-UPDRS-3 OFF from baseline to 6 months between the groups (p=0.17).
CSF/serum PK ratio was 0.2-0.3%. There was no evidence of treatment-related elevation of any
dopamine metabolites.
. CC-BY-NC 4.0 International licenseIt is made available under a is the author/funder, who has granted medRxiv a license to display the preprint in perpetuity. (which was not certified by peer review)
The copyright holder for this preprint this version posted May 12, 2020. ; https://doi.org/10.1101/2020.05.11.20093146doi: medRxiv preprint

5
Interpretation: Both doses of nilotinib were safe and tolerable in these participants, who were
selected with strict inclusion/exclusion criteria. There was no evidence of any symptomatic
benefit of nilotinib. The drug had low CSF exposure and failed to change dopamine metabolites.
These findings do not warrant further testing of nilotinib in PD.
Funding: The study was funded by Funded by Michael J Fox Foundation for Parkinson’s
Research / The Cure Parkinson Trust / Van Andel Institute. Clinicaltrials.gov NCT03205488
. CC-BY-NC 4.0 International licenseIt is made available under a is the author/funder, who has granted medRxiv a license to display the preprint in perpetuity. (which was not certified by peer review)
The copyright holder for this preprint this version posted May 12, 2020. ; https://doi.org/10.1101/2020.05.11.20093146doi: medRxiv preprint

6
Introduction
Background and Objectives
Parkinson’s disease (PD) is the second most common neurodegenerative disease and affects
1% of the population above the age 65(1). Despite numerous prior studies, there are no proven
strategies for slowing the PD progression, making this gap a major unmet need(2).
Nilotinib, a BCR-Abelson (c-Abl) tyrosine kinase inhibitor, currently approved for the
treatment of chronic myeloid leukemia, has been shown to protect dopamine neurons and
prevent accumulation of α-synuclein in animal models of PD(3, 4). Moreover, aberrant
activation of c-Abl has been reported in autopsied PD brains and animal models(5) . Finally,
deletion of the gene encoding c-Abl in mice reduced α-synuclein aggregation and
neurobehavioral deficits whereas overexpression of constitutively active c-Abl accelerated α-
synuclein aggregation, neuropathology, and neurobehavioral deficits(6). Thus, inhibition of c-
Abl has emerged as a therapeutic strategy that has the potential to slow PD progression(3, 7, 8).
However, based on the intrinsic risk profile of nilotinib and other oncology drugs in this class,
safety and tolerability are major factors that will influence the feasibility of development of
nilotinib for PD.
At the time of the launch of this study, the only clinical experience with nilotinib in PD was
limited to a small, single center open label study(9). That study concluded that nilotinib at tested
doses was safe, tolerable, increased dopamine metabolite homovanillic acid (HVA), and
decreased phosphorylated c-Abl in the cerebrospinal fluid (CSF) in PD. The study also reported
significant symptomatic improvement in motor and cognitive function of the participants.
However, the small sample size and open label design of the study precluded firm conclusions,
and further investigation was warranted. The primary objective of this study was to assess the
safety and tolerability of nilotinib in participants with moderate to advanced PD.
. CC-BY-NC 4.0 International licenseIt is made available under a is the author/funder, who has granted medRxiv a license to display the preprint in perpetuity. (which was not certified by peer review)
The copyright holder for this preprint this version posted May 12, 2020. ; https://doi.org/10.1101/2020.05.11.20093146doi: medRxiv preprint
7
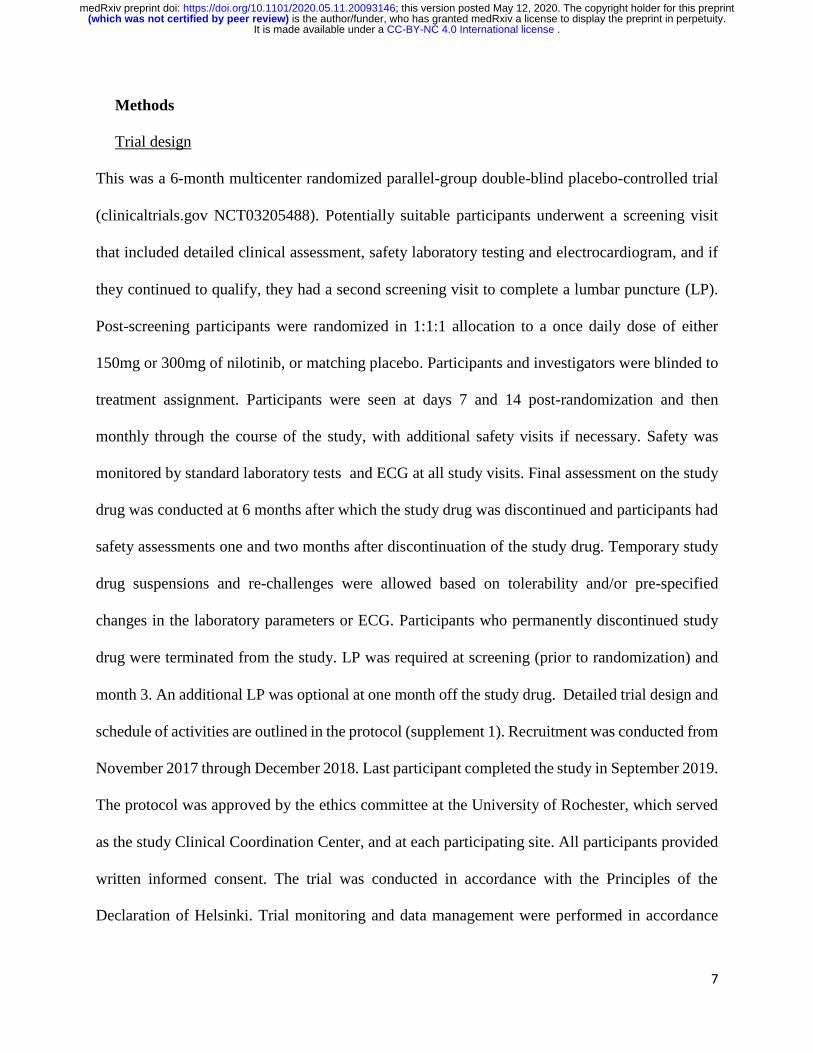
Methods
Trial design
This was a 6-month multicenter randomized parallel-group double-blind placebo-controlled trial
(clinicaltrials.gov NCT03205488). Potentially suitable participants underwent a screening visit
that included detailed clinical assessment, safety laboratory testing and electrocardiogram, and if
they continued to qualify, they had a second screening visit to complete a lumbar puncture (LP).
Post-screening participants were randomized in 1:1:1 allocation to a once daily dose of either
150mg or 300mg of nilotinib, or matching placebo. Participants and investigators were blinded to
treatment assignment. Participants were seen at days 7 and 14 post-randomization and then
monthly through the course of the study, with additional safety visits if necessary. Safety was
monitored by standard laboratory tests and ECG at all study visits. Final assessment on the study
drug was conducted at 6 months after which the study drug was discontinued and participants had
safety assessments one and two months after discontinuation of the study drug. Temporary study
drug suspensions and re-challenges were allowed based on tolerability and/or pre-specified
changes in the laboratory parameters or ECG. Participants who permanently discontinued study
drug were terminated from the study. LP was required at screening (prior to randomization) and
month 3. An additional LP was optional at one month off the study drug. Detailed trial design and
schedule of activities are outlined in the protocol (supplement 1). Recruitment was conducted from
November 2017 through December 2018. Last participant completed the study in September 2019.
The protocol was approved by the ethics committee at the University of Rochester, which served
as the study Clinical Coordination Center, and at each participating site. All participants provided
written informed consent. The trial was conducted in accordance with the Principles of the
Declaration of Helsinki. Trial monitoring and data management were performed in accordance
. CC-BY-NC 4.0 International licenseIt is made available under a is the author/funder, who has granted medRxiv a license to display the preprint in perpetuity. (which was not certified by peer review)
The copyright holder for this preprint this version posted May 12, 2020. ; https://doi.org/10.1101/2020.05.11.20093146doi: medRxiv preprint

8
with the International Conference on Harmonization Good Clinical Practice Guidelines. An
Independent Data Safety Monitoring Board (DSMB) reviewed blinded and unblinded data on a
regular basis. The authors attest to compliance with the protocol and accuracy and completeness
of the data and analyses.
Setting and Participants
Participants were recruited from 25 Parkinson Study Group (PSG) sites. The PSG is a non-profit
consortium of expert Parkinson centers in North America. Participants were eligible to participate
in the trial if they had a diagnosis of PD for more than 5 years confirmed by the site investigator
based on the established diagnostic criteria(10), were age 40-79, were Hoehn and Yahr stage 2.5
or 3 in the medications ON state(11), were willing to undergo repeated LPs and were on a stable
regimen of PD medications that had to include levodopa. Use of monoamine oxidase B (MAO-
B) inhibitors initially was exclusionary but was subsequently allowed provided that the dose had
been stable for 60 days prior to enrollment. Participants were excluded if they had a diagnosis of
atypical parkinsonism, clinically significant depression, history of cardiovascular conditions,
liver or pancreatic disease, presence of laboratory or electrocardiographic abnormalities at
screening, presence of dementia based on the clinician’s assessment, or a Montreal Cognitive
Assessment (MoCA©) score < 21 at baseline, or any other conditions or concomitant medications
that were associated with increased risk of use of nilotinib as per the drug package insert(12). See
full list of inclusion / exclusion criteria in the Protocol.
Randomization and Interventions
After screening assessments, eligible participants were randomly assigned in a 1:1:1 ratio by a
central web-based program to receive a once daily dose of 150mg or 300mg of nilotinib or
matching placebo. Nilotinib (150 mg) and matching placebo were provided by the drug
. CC-BY-NC 4.0 International licenseIt is made available under a is the author/funder, who has granted medRxiv a license to display the preprint in perpetuity. (which was not certified by peer review)
The copyright holder for this preprint this version posted May 12, 2020. ; https://doi.org/10.1101/2020.05.11.20093146doi: medRxiv preprint

9
manufacturer, Novartis, in kind, and delivered to the University of Rochester Clinical Materials
Services Unit which implemented the randomization assignment and delivered study drug kits to
the participating sites. Randomization, conducted by the Biostatistics Coordinating Center at the
University of Iowa, used random permuted blocks of sizes three and six. All participants started
with one capsule daily (150mg or matching placebo) and the dose was escalated to 2 capsules 2
weeks later based on the randomized dose assignment. Participants were instructed to take the
study drug at the same time in the morning on an empty stomach as the bioavailability of nilotinib
is increased with food, and also to avoid grapefruit products and other foods that are known to
inhibit nilotinib metabolism via CYP3A4.
Outcomes
The primary objective of this study was to assess the safety and tolerability of two doses of
nilotinib versus placebo. Tolerability was defined as the percentage of participants who completed
the study on their assigned dose across the three study arms. This outcome could be met despite
temporary drug interruptions. Conversely, any participant who discontinued study drug, or who
completed the study on a dose below their assigned dose, or who failed to complete the study for
any reason was deemed not to have tolerated their assigned medication.
Safety was assessed by examining the frequency of treatment-related serious adverse events across
all groups within each cohort. Adverse events were collected at every visit through open ended
questions and rated by the investigator on severity and causality. An Independent Medical Monitor
reviewed all serious adverse events and made adjudications on causality, severity and
expectedness.
A key secondary objective was to conduct a futility analysis within each treatment group by
comparing the observed change in the Movement Disorder Society Unified Parkinson’s Disease
. CC-BY-NC 4.0 International licenseIt is made available under a is the author/funder, who has granted medRxiv a license to display the preprint in perpetuity. (which was not certified by peer review)
The copyright holder for this preprint this version posted May 12, 2020. ; https://doi.org/10.1101/2020.05.11.20093146doi: medRxiv preprint

10
Rating Scale (MDS-UPDRS)(13) Part III “ON” score between baseline and month 6. Other
secondary objectives of the study were to 1) establish the degree of symptomatic effect of nilotinib
as measured by change in MDS-UPDRS part III (motor) in the PD medications ON state
(approximately one hour after a dose of PD medication) between baseline and Visit 2 (1 month)
and final visit on study drug and 30 days off study drug; 2) To explore the impact of nilotinib on
progression of PD disability as measured by the change in the MDS-UPDRS Part III score in the
defined medications OFF state (at least 12 hours after the last dose of PD medications) between
baseline and 6 months. A number of clinical exploratory outcomes measuring change in disability,
quality of life and functional status from baseline to 6 months were pre-specified in the statistical
analysis plan (SAP), see supplement 2.
Exploratory pharmacokinetics and biomarkers samples and analysis
During study visit month 3, pre-dose trough and post-dose serum samples were collected for
pharmacokinetic assessment at steady-state. The post-dose serum sample was collected
approximately 2 hours following administration of an in-clinic dose to approximate the time at
which maximum concentration (Cmax) is achieved in the serum (reported Tmax ~2-3 hours(12, 14).
A corresponding CSF sample was also collected 2 hours post-dose. Total serum and CSF
concentrations of nilotinib were measured using validated liquid chromatography with tandem
mass spectrometry assays (WuXi AppTec, Shanghai, China). The lower limits of quantitation for
the serum and CSF assays were 2.50 and 0.200 ng/mL, respectively. Additional serum samples
were collected at other study visits for future pharmacokinetic analysis (see Protocol). Serum and
CSF samples were analyzed to: (a) determine the serum PK and exposures of nilotinib at steady
state, (b) investigate the ability of nilotinib to cross the blood brain barrier and (c) correlate CSF
levels with the clinical and biomarker outcomes.
. CC-BY-NC 4.0 International licenseIt is made available under a is the author/funder, who has granted medRxiv a license to display the preprint in perpetuity. (which was not certified by peer review)
The copyright holder for this preprint this version posted May 12, 2020. ; https://doi.org/10.1101/2020.05.11.20093146doi: medRxiv preprint

11
For the biomarkers, we assayed phospho-cAbl levels in the CSF using PathScan® pan-tyrosine
ELISA, as reported by Pagan et al9. Levels of dopamine, its metabolites, other monoamine
neurotransmitters (norepinephrine, epinephrine, serotonin, histamine) and their metabolites, were
tested using an analytically validated mass spectrometric multiplexed assay of 17 analytes
(Supplement 3). Nilotinib-induced changes in each biomarker were determined by comparing
values at the screening visit versus those at 3 months, as well as by comparing the values in the
placebo group with each nilotinib arm. Additional blood, serum, plasma, DNA and CSF samples
were stored for future exploratory research. See supplement 4 for detailed summaries of the
biologic samples collection and processing.
Statistical Methods
The first objective was assessed by comparing the proportion of study participants who met the
study definition of tolerability among the placebo group and each of the treatment groups, with a
one-sided Fisher’s exact test using a significance level of 0.05 used for each test.
The safety objective was primarily assessed by comparing the proportion of study participants with
any treatment-related SAE among the placebo group and each of the treatment groups using a
Fisher’s exact test. To provide an overall summary of the safety of each nilotinib dose, additional
safety assessment involved further comparisons of AEs and SAEs across the three groups. The
safety and tolerability information were synthesized and reviewed by the steering committee at the
end of the study.
The key secondary objective involved a single group hypothesis within each PD group to assess
“futility” for replicating the large difference observed in the prior study(9) . That study observed
a mean change over 6 months in the 150 mg nilotinib group of 7.0 (SD = 12.9) points on the
. CC-BY-NC 4.0 International licenseIt is made available under a is the author/funder, who has granted medRxiv a license to display the preprint in perpetuity. (which was not certified by peer review)
The copyright holder for this preprint this version posted May 12, 2020. ; https://doi.org/10.1101/2020.05.11.20093146doi: medRxiv preprint

12
UPDRS(15). Since we used the MDS-UPDRS, we included a correction factor of 1.4 as specified
in Goetz et al(16). Thus, this objective was assessed by conducting a futility test within each
nilotinib dose group based on a null hypothesis that the observed difference was less than a 9.8
unit reduction on the MDS-UPDRS (7.0 x 1.4) versus an alternative that the reduction was less
than 9.8 units (or an increase was observed over time). Rejecting the null hypothesis would imply
that a future study is unlikely to observe the large reductions previously reported. However, that
would not rule out potentially meaningful effects on a smaller scale. This null hypothesis was
evaluated based on an assessment of parameter estimates from a non-linear mixed effects model
of change from baseline with time a categorical variable and baseline MDS-UPDRS and calculated
levodopa equivalent daily dose (LEDD) included as covariates(17).
Similar linear mixed models were used to compare other secondary and exploratory objectives
involving the MDS-UPDRS. For each comparison, a global two degree of freedom test was
initially used to test for any differences among the three groups. If the global test was significant,
then stepdown pairwise comparisons were used to further explore any observed differences.
Similar non-linear mixed models were used to assess the exploratory PDQ-39 and LEDD
outcomes. The categories for the Clinical Global Impression Scale (CGI) score for both the
participant and investigator were collapsed into three categories (improved, stayed the same,
worsened) and were compared using a Fisher’s exact test. Pharmacokinetic and biomarker results
were summarized by nilotinib dose level using geometric means and 95% confidence intervals
(CI). Association between CSF nilotinib concentrations and dopamine turnover indices were
assessed by Spearman correlation.
Sample Size
. CC-BY-NC 4.0 International licenseIt is made available under a is the author/funder, who has granted medRxiv a license to display the preprint in perpetuity. (which was not certified by peer review)
The copyright holder for this preprint this version posted May 12, 2020. ; https://doi.org/10.1101/2020.05.11.20093146doi: medRxiv preprint

13
We assumed that at least 90% of participants on placebo would meet the study definition of
tolerability, and that an absolute decrease of 30% or greater with respect to tolerability for active
treatment arms versus placebo would provide sufficient tolerability concerns that would not
warrant further study of that dose. Hence, the sample size was chosen to provide sufficient power
to compare an expected 90% vs. 60% or lower tolerability rate in the placebo group versus each
of the treatment groups. Under these assumptions, a total of 75 participants provided at least 80%
power at the one-sided 0.05 significance level.
Role of the funding agency: This study was funded by the Michael J Fox Foundation for
Parkinson’s Research (MJFF), The Cure Parkinson Trust and Van Andel Institute. Research
officers (BF, RW, PB, HM) from the three funding agencies were involved in the study design,
interpretation of results, review/revision of this manuscript, and decision to submit this manuscript
for publication and are listed amongst the authors. Novartis provided the drug and placebo supply
as in kind contribution but were not involved in the study design or execution.
. CC-BY-NC 4.0 International licenseIt is made available under a is the author/funder, who has granted medRxiv a license to display the preprint in perpetuity. (which was not certified by peer review)
The copyright holder for this preprint this version posted May 12, 2020. ; https://doi.org/10.1101/2020.05.11.20093146doi: medRxiv preprint

14
Results
Participants
Of 125 participants screened for eligibility, 76 were enrolled and randomized: 25 to nilotinib
150mg: 26 to nilotinib 300mg and 25 to placebo. There was a high percent of screen failures
(49/125) (Figure 1). The major reasons for exclusion were comorbid conditions (12), exclusionary
ECG (10), cardiovascular conditions (7) and low HY stage (7). Baseline characteristics of the
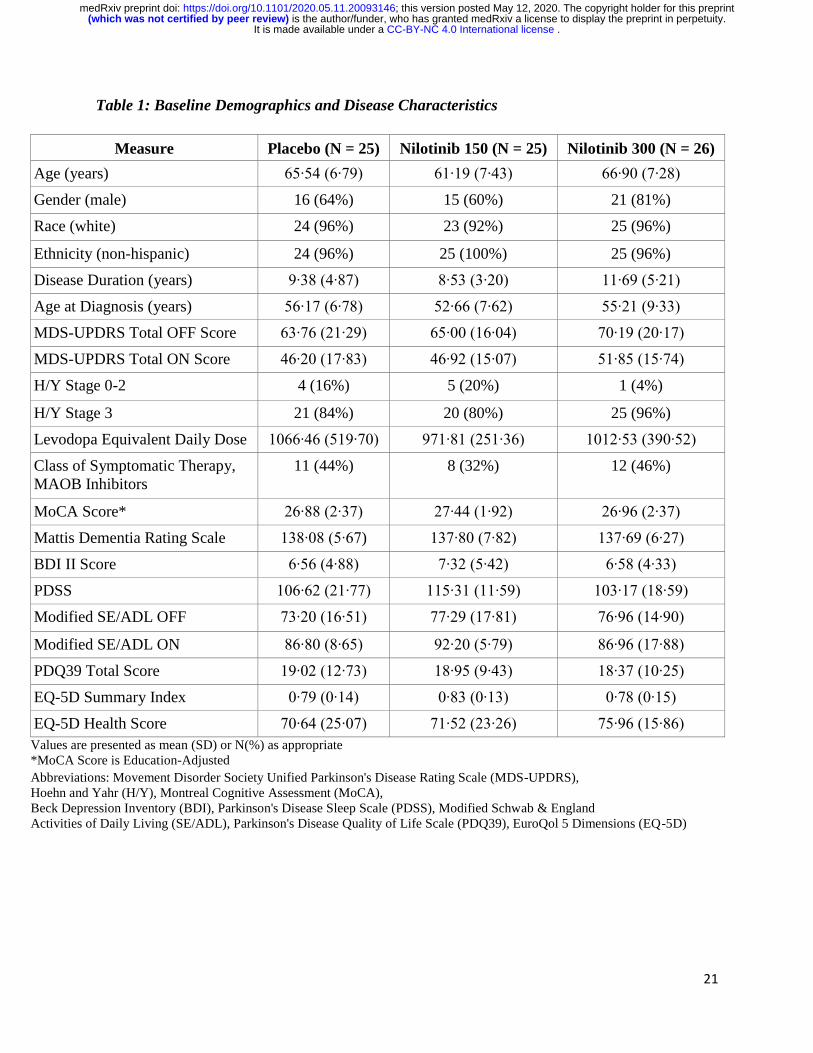
enrolled cohort are detailed in Table 1. The groups were generally well balanced, but disease
duration was slightly higher in the nilotinib 300mg group and age lower in nilotinib 150mg group
(Table 1). There were 8 premature withdrawals: one in the placebo arm (tremor), 2 in the nilotinib
150mg arm (anxiety and increase in lipase) and 5 in the nilotinib 300mg arm [increase in lipase
(2), arthritis, arrhythmia and an abnormal ECG]. The latter was present at screening but was not
identified until the participant was randomized so was not considered treatment related.
Both doses of nilotinib were tolerable, with 21(84%): 19(76%): 20(77%) meeting the study
definition of tolerability for the placebo: nilotinib 150 mg: nilotinib 300 mg, respectively (p=0.36
for nilotinib 150mg and p=0.39 for nilotinib 300 mg, respectively, versus placebo; Table 2).
However, there were more premature withdrawals due to adverse events in the nilotinib 300mg
group (Figure 1). The most common reasons for dose reduction or temporary suspension were
increase in lipase and /or amylase with no significant imbalance between the groups and no
associated clinical symptoms. There was no difference in the numbers of serious adverse events
between the groups: 2 in placebo: 1 in nilotinib 150mg: 1 in nilotinib 300mg groups. Only one
serious adverse event was considered treatment related (arrhythmia in nilotinib 300mg group).
Adverse events presented in the order of frequency are listed in Table 2.
. CC-BY-NC 4.0 International licenseIt is made available under a is the author/funder, who has granted medRxiv a license to display the preprint in perpetuity. (which was not certified by peer review)
The copyright holder for this preprint this version posted May 12, 2020. ; https://doi.org/10.1101/2020.05.11.20093146doi: medRxiv preprint
15
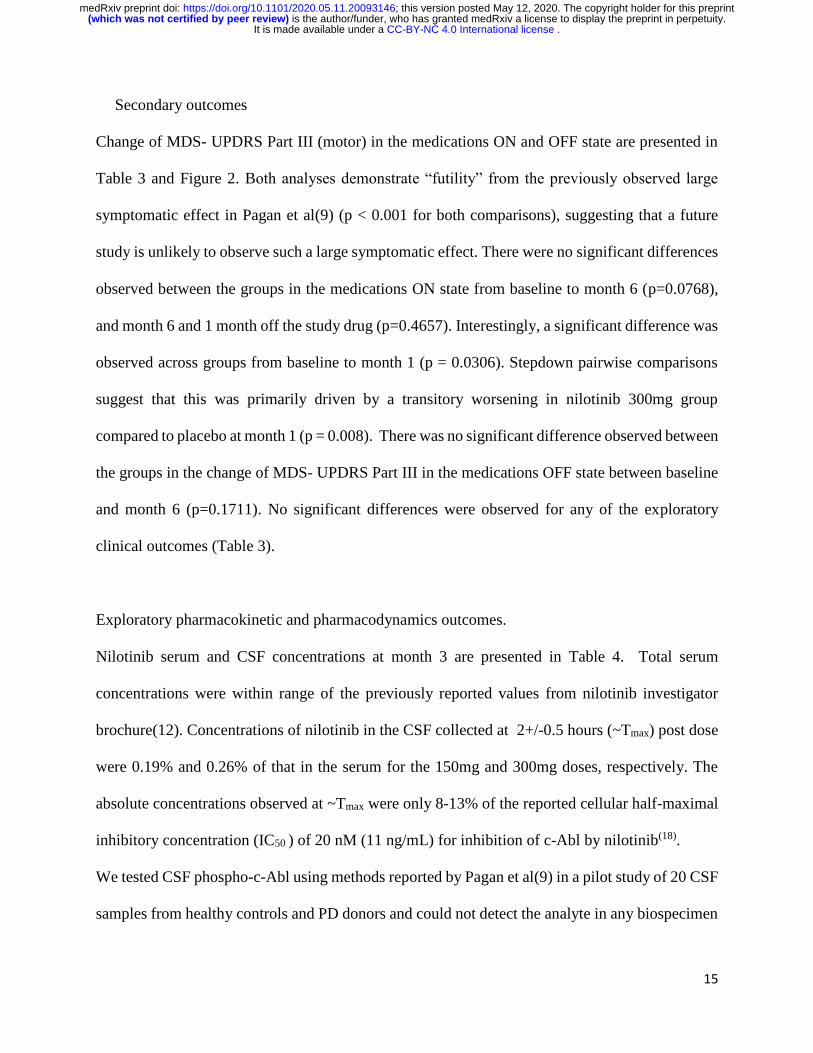
Secondary outcomes
Change of MDS- UPDRS Part III (motor) in the medications ON and OFF state are presented in
Table 3 and Figure 2. Both analyses demonstrate “futility” from the previously observed large
symptomatic effect in Pagan et al(9) (p < 0.001 for both comparisons), suggesting that a future
study is unlikely to observe such a large symptomatic effect. There were no significant differences
observed between the groups in the medications ON state from baseline to month 6 (p=0.0768),
and month 6 and 1 month off the study drug (p=0.4657). Interestingly, a significant difference was
observed across groups from baseline to month 1 (p = 0.0306). Stepdown pairwise comparisons
suggest that this was primarily driven by a transitory worsening in nilotinib 300mg group
compared to placebo at month 1 (p = 0.008). There was no significant difference observed between
the groups in the change of MDS- UPDRS Part III in the medications OFF state between baseline
and month 6 (p=0.1711). No significant differences were observed for any of the exploratory
clinical outcomes (Table 3).
Exploratory pharmacokinetic and pharmacodynamics outcomes.
Nilotinib serum and CSF concentrations at month 3 are presented in Table 4. Total serum
concentrations were within range of the previously reported values from nilotinib investigator
brochure(12). Concentrations of nilotinib in the CSF collected at 2+/-0.5 hours (~Tmax) post dose
were 0.19% and 0.26% of that in the serum for the 150mg and 300mg doses, respectively. The
absolute concentrations observed at ~Tmax were only 8-13% of the reported cellular half-maximal
inhibitory concentration (IC50 ) of 20 nM (11 ng/mL) for inhibition of c-Abl by nilotinib(18).
We tested CSF phospho-c-Abl using methods reported by Pagan et al(9) in a pilot study of 20 CSF
samples from healthy controls and PD donors and could not detect the analyte in any biospecimen
. CC-BY-NC 4.0 International licenseIt is made available under a is the author/funder, who has granted medRxiv a license to display the preprint in perpetuity. (which was not certified by peer review)
The copyright holder for this preprint this version posted May 12, 2020. ; https://doi.org/10.1101/2020.05.11.20093146doi: medRxiv preprint
16
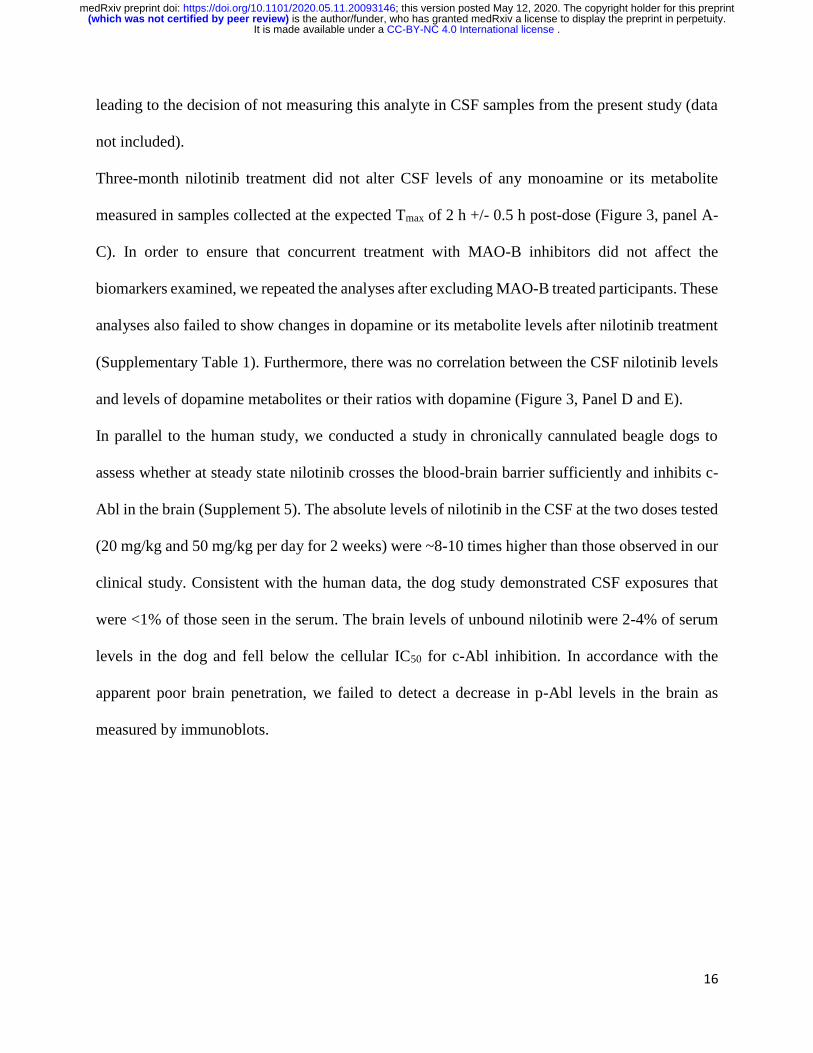
leading to the decision of not measuring this analyte in CSF samples from the present study (data
not included).
Three-month nilotinib treatment did not alter CSF levels of any monoamine or its metabolite
measured in samples collected at the expected Tmax of 2 h +/- 0.5 h post-dose (Figure 3, panel A-
C). In order to ensure that concurrent treatment with MAO-B inhibitors did not affect the
biomarkers examined, we repeated the analyses after excluding MAO-B treated participants. These
analyses also failed to show changes in dopamine or its metabolite levels after nilotinib treatment
(Supplementary Table 1). Furthermore, there was no correlation between the CSF nilotinib levels
and levels of dopamine metabolites or their ratios with dopamine (Figure 3, Panel D and E).
In parallel to the human study, we conducted a study in chronically cannulated beagle dogs to
assess whether at steady state nilotinib crosses the blood-brain barrier sufficiently and inhibits c-
Abl in the brain (Supplement 5). The absolute levels of nilotinib in the CSF at the two doses tested
(20 mg/kg and 50 mg/kg per day for 2 weeks) were ~8-10 times higher than those observed in our
clinical study. Consistent with the human data, the dog study demonstrated CSF exposures that
were <1% of those seen in the serum. The brain levels of unbound nilotinib were 2-4% of serum
levels in the dog and fell below the cellular IC50 for c-Abl inhibition. In accordance with the
apparent poor brain penetration, we failed to detect a decrease in p-Abl levels in the brain as
measured by immunoblots.
. CC-BY-NC 4.0 International licenseIt is made available under a is the author/funder, who has granted medRxiv a license to display the preprint in perpetuity. (which was not certified by peer review)
The copyright holder for this preprint this version posted May 12, 2020. ; https://doi.org/10.1101/2020.05.11.20093146doi: medRxiv preprint

17
Discussion
Our study demonstrates acceptable safety and tolerability of both tested doses of nilotinib in
participants with moderately advanced PD. This is an important conclusion as nilotinib has a
significant risk profile including a black box warning for the risk of cardiac arrhythmias (QT
prolongation) and sudden death as well as a number of safety concerns regarding risk of
myelosuppression, cardiovascular occlusive disease, electrolyte abnormalities, hepatotoxicity,
pancreatitis and others. While it is reassuring that we did not observe significant increase in serious
or overall adverse events in nilotinib treated groups, it also has to be acknowledged that study
participants were selected based on stringent screening that excluded participants with history or
evidence of any conditions that would increase the risk of their exposure to nilotinib. As such the
study had a 39% screen failure rate, higher than the projected and usually observed 25% rate in
other PD studies. In addition, participants had stringent laboratory and ECG monitoring through
the course of the study which contributed to the participant burden. We did not observe any
significant hematological adverse events that would have been expected based on the mechanism
of action of the drug, likely related to the fact that we used lower doses than indicated for the
drug’s primary indication.
In regard to the secondary efficacy analysis, we did not observe any significant impact of either
dose of nilotinib on PD disability. The rationale for focusing on symptomatic effect of nilotinib in
this early phase safety study was based on a significant symptomatic effect on motor and cognitive
function reported in the prior open label study(9). We also did not observe trends for symptomatic
benefit of either dose of nilotinib on overall PD disability (MDS-UPDRS total score) OFF and
ON, severity of motor complications (MDS-UPDRS Part IV), cognition, sleep, or quality of life.
Our results are in line with the conclusions regarding safety, tolerability and lack of the
. CC-BY-NC 4.0 International licenseIt is made available under a is the author/funder, who has granted medRxiv a license to display the preprint in perpetuity. (which was not certified by peer review)
The copyright holder for this preprint this version posted May 12, 2020. ; https://doi.org/10.1101/2020.05.11.20093146doi: medRxiv preprint

18
symptomatic effect of nilotinib from another recently completed study that tested the same doses
in a similar population but extended the duration of follow up to 12 months(19). Results of both
studies highlight limitations of any read out of the symptomatic effects in the open label studies.
Lack of a short-term symptomatic effect is not surprising as the mechanism of action of nilotinib
as a putative PD disease modifying intervention is linked to improved cell autophagy and, if
effective, would be expected to change the trajectory of the disease progression rather than have
an immediate benefit. This study was not designed or powered to address long term benefits of
nilotinib. We had pre specified “go”/”no-go” criteria to inform whether this study results were
sufficient to move forward with the testing of nilotinib in a de novo PD cohort. The results from
the primary, secondary, and exploratory analyses reported here informed a steering committee
decision not to move forward.
Assessment of the pharmacokinetic profile and impact of nilotinib on the biomarkers panel, while
exploratory, is extremely important in interpreting of the study results. While nilotinib serum PK
data were previously published(14) , there were no published data on CSF penetration of the drug
in PD patients at steady state, aside from the small cohort from the open label study9. Defining
CNS penetration was essential for the decision regarding further development of nilotinib for PD
indication. Our data demonstrate serum concentrations that are in line with the previously reported
data but very low CSF concentrations, with 0.19-0.26% CSF to serum ratio. The CSF
concentrations are about 10 times below the IC50 for c-Abl inhibition in cell assays reported to be
at 20 nM(18). IC50 is a measure of potency of a drug in inhibiting its specific biological target. The
observed CSF concentrations of nilotinib indicate that minimal c-ABL inhibition would be
achieved at doses within the safe therapeutic range. We attempted direct testing of c-Abl inhibition
but there are no validated assays.
. CC-BY-NC 4.0 International licenseIt is made available under a is the author/funder, who has granted medRxiv a license to display the preprint in perpetuity. (which was not certified by peer review)
The copyright holder for this preprint this version posted May 12, 2020. ; https://doi.org/10.1101/2020.05.11.20093146doi: medRxiv preprint

19
As a measure of downstream effects of nilotinib reflecting improvement of dopaminergic cell
function we measured a panel of dopamine, dopamine metabolites and other monoamines. We did
not observe a change in any of these biomarkers as measured at the 3-month time point. We also
did not see a correlation between CSF nilotinib exposure and dopamine or dopamine metabolites
levels. These results indicate that nilotinib does not alter these indices of dopaminergic cell
function, potentially because it does not achieve a sufficient concentration in the CNS. Dopamine
metabolites are sensitive to the effect of PD dopaminergic therapy(20). Specifically, treatment with
MAO-B inhibitors can reduce the level of homovanillic acid (HVA), the major dopamine
metabolite, and potentially impact interpretation of the results. Our analysis controlled for the dose
and change in the dopaminergic therapy. Considering that about 30% of participants in our study
were receiving MAO-B inhibitors, we ran a post-hoc subgroup analysis excluding these
participants. That analysis did not change the conclusions. Our analysis of dopamine metabolites
differ from the ones reported by Pagan et al(9, 19, 21) where they found an increase in CSF HVA
level in 150mg but not in 300mg dose group. These differences might be attributed to the
methodological differences.
Our biomarkers panel did not include measurement of α–synuclein or tau. While appropriate CSF
samples were collected and stored, the low CNS penetration of nilotinib suggested that the
plausibility of observing an impact of the drug on these biomarkers was low.
Limitations
The study has a number of limitations. The study was conducted in participants with moderately
advanced PD which is not the population typically targeted for PD disease-modifying
interventions. The rationale for selecting that profile of PD was based on the need to test the large
symptomatic effect seen in the previously reported study by Pagan et al(9) as well as to test safety
. CC-BY-NC 4.0 International licenseIt is made available under a is the author/funder, who has granted medRxiv a license to display the preprint in perpetuity. (which was not certified by peer review)
The copyright holder for this preprint this version posted May 12, 2020. ; https://doi.org/10.1101/2020.05.11.20093146doi: medRxiv preprint

20
and tolerability of this drug in a more vulnerable PD population. Our study had 6-months duration
of intervention compared to 12 months in the recently reported study by Pagan at el(19).
Considering that the primary study objectives were to determine safety and tolerability, we believe
that 6 months exposure was sufficient to address these questions as well as our secondary
objectives to assess degree of symptomatic effect of nilotinib. The study was not designed to
address the question of a disease modifying effect of nilotinib. The dose of nilotinib was selected
in the lower range of approved doses and, as such, was expected to have lower serum and
corresponding CSF concentrations but, based on the safety profile of nilotinib, we do not expect
that testing higher doses will be feasible.
In conclusion, while we demonstrated acceptable safety and tolerability of nilotinib in the carefully
selected cohort of participants with moderately advanced PD, low CSF exposure of the drug and
failure to impact levels of dopamine and its metabolites, we concluded that nilotinib is not suitable
for further testing in PD. These results do not refute the hypothesis that c-Abl inhibition is a
potential important therapeutic target for PD neuroprotective interventions. Indeed, there are a
number of novel molecules targeting c-Abl pathway in development that have a better therapeutic
profile. Results of these studies are highly anticipated.
. CC-BY-NC 4.0 International licenseIt is made available under a is the author/funder, who has granted medRxiv a license to display the preprint in perpetuity. (which was not certified by peer review)
The copyright holder for this preprint this version posted May 12, 2020. ; https://doi.org/10.1101/2020.05.11.20093146doi: medRxiv preprint
21
Table 1: Baseline Demographics and Disease Characteristics
Measure Placebo (N = 25) Nilotinib 150 (N = 25) Nilotinib 300 (N = 26)
Age (years) 65∙54 (6∙79) 61∙19 (7∙43) 66∙90 (7∙28)
Gender (male) 16 (64%) 15 (60%) 21 (81%)
Race (white) 24 (96%) 23 (92%) 25 (96%)
Ethnicity (non-hispanic) 24 (96%) 25 (100%) 25 (96%)
Disease Duration (years) 9∙38 (4∙87) 8∙53 (3∙20) 11∙69 (5∙21)
Age at Diagnosis (years) 56∙17 (6∙78) 52∙66 (7∙62) 55∙21 (9∙33)
MDS-UPDRS Total OFF Score 63∙76 (21∙29) 65∙00 (16∙04) 70∙19 (20∙17)
MDS-UPDRS Total ON Score 46∙20 (17∙83) 46∙92 (15∙07) 51∙85 (15∙74)
H/Y Stage 0-2 4 (16%) 5 (20%) 1 (4%)
H/Y Stage 3 21 (84%) 20 (80%) 25 (96%)
Levodopa Equivalent Daily Dose 1066∙46 (519∙70) 971∙81 (251∙36) 1012∙53 (390∙52)
Class of Symptomatic Therapy,
MAOB Inhibitors
11 (44%) 8 (32%) 12 (46%)
MoCA Score* 26∙88 (2∙37) 27∙44 (1∙92) 26∙96 (2∙37)
Mattis Dementia Rating Scale 138∙08 (5∙67) 137∙80 (7∙82) 137∙69 (6∙27)
BDI II Score 6∙56 (4∙88) 7∙32 (5∙42) 6∙58 (4∙33)
PDSS 106∙62 (21∙77) 115∙31 (11∙59) 103∙17 (18∙59)
Modified SE/ADL OFF 73∙20 (16∙51) 77∙29 (17∙81) 76∙96 (14∙90)
Modified SE/ADL ON 86∙80 (8∙65) 92∙20 (5∙79) 86∙96 (17∙88)
PDQ39 Total Score 19∙02 (12∙73) 18∙95 (9∙43) 18∙37 (10∙25)
EQ-5D Summary Index 0∙79 (0∙14) 0∙83 (0∙13) 0∙78 (0∙15)
EQ-5D Health Score 70∙64 (25∙07) 71∙52 (23∙26) 75∙96 (15∙86)
Values are presented as mean (SD) or N(%) as appropriate
*MoCA Score is Education-Adjusted
Abbreviations: Movement Disorder Society Unified Parkinson's Disease Rating Scale (MDS-UPDRS),
Hoehn and Yahr (H/Y), Montreal Cognitive Assessment (MoCA),
Beck Depression Inventory (BDI), Parkinson's Disease Sleep Scale (PDSS), Modified Schwab & England
Activities of Daily Living (SE/ADL), Parkinson's Disease Quality of Life Scale (PDQ39), EuroQol 5 Dimensions (EQ-5D)
. CC-BY-NC 4.0 International licenseIt is made available under a is the author/funder, who has granted medRxiv a license to display the preprint in perpetuity. (which was not certified by peer review)
The copyright holder for this preprint this version posted May 12, 2020. ; https://doi.org/10.1101/2020.05.11.20093146doi: medRxiv preprint

22
Table 2: Safety and Tolerability Outcomes
Placebo Nilotinib 150 Nilotinib 300 (N = 25) (N = 25) (N = 26)
Primary Tolerability
Tolerability 21 (84%) 19 (76%) 20 (77%)
Primary Safety
Treatment-Related SAEs 0 0 1 (4%)
Other Safety and Tolerability
Any Adverse Event 22 (88%) 23 (92%) 23 (88%)
Any Serious Adverse Event 2 (8%) 1 (4%) 1 (4%)
Dose Suspensions* 3 (12%) 6 (24%) 5 (19%)
Study Drug Discontinuations† 1 (4%) 2 (8%) 5 (19%)
Serious Adverse Events
Arrhythmia 0 0 1 (4%)
Abdominal pain 1 (4%) 0 0
Gastrooesophageal reflux disease 1 (4%) 0 0
Suicidal ideation 0 1 (4%) 0
Adverse Events reported by > 10% in
any group
Fall¶ 5 (20%) 4 (16%) 0
Lipase increased 4 (16%) 7 (28%) 6 (23%)
Amylase increased 2 (8%) 4 (16%) 4 (15%)
Nasopharyngitis 5 (20%) 2 (8%) 2 (8%)
Fatigue 4 (16%) 4 (16%) 0
Nausea 0 2 (8%) 4 (15%)
Headache 2 (8%) 1 (4%) 3 (12%)
Dizziness 1 (4%) 4 (16%) 0
Gastrooesophageal reflux disease 4 (16%) 0 0
Anxiety 0 3 (12%) 1 (4%)
Myalgia 3 (12%) 0 0
Skin abrasion 3 (12%) 0 0
Values are presented as number of participants experiencing the event at least once (%).
*All dose suspensions are due to adverse events † All drug discontinuations are due to adverse events, except for one in the Nilotinib 300 group,
which was due to ineligibility ¶ Indicates significant group differences, p <0.05
. CC-BY-NC 4.0 International licenseIt is made available under a is the author/funder, who has granted medRxiv a license to display the preprint in perpetuity. (which was not certified by peer review)
The copyright holder for this preprint this version posted May 12, 2020. ; https://doi.org/10.1101/2020.05.11.20093146doi: medRxiv preprint

23
Table 3: Changes in Secondary and Exploratory Outcomes Over Time
Placebo Nilotinib 150 Nilotinib 300
Measure N Adjusted Change N Adjusted Change N Adjusted Change p value* LSM (95% CI) LSM (95% CI) LSM (95% CI)
Secondary Outcomes
MDS-UPDRS Part III ON,
Change from Baseline to 1
Month
25 -0∙49 (-3∙22,2∙24) 25 2∙08 (-0∙64,4∙80) 26 4∙67 (2∙00,7∙34) 0∙0306
MDS-UPDRS Part III ON,
Change from Baseline to 6
Months
25 -2∙95 (-5∙72,-0∙19) 25 1∙05 (-1∙76,3∙85) 26 0∙93 (-1∙86,3∙72) 0∙0768
MDS-UPDRS Part III OFF,
Change from Baseline to 6
Months
25 -4∙03 (-7∙83,-0∙22) 25 -0∙23 (-4∙32,3∙86) 26 0∙84 (-2∙85,4∙53) 0∙1711
MDS-UPDRS Part III ON,
Change from Month 6 to 30
Days Off Drug
25 -0∙30 (-2∙98,2∙37) 24 0∙50 (-2∙39,3∙39) 24 2∙08 (-0∙70,4∙86) 0∙4657
Exploratory Outcomes
MDS-UPDRS Total ON,
Change from Baseline to 1
Month
25 -3∙78 (-7∙70,0∙14) 25 -0∙00 (-3∙91,3∙91) 26 0∙62 (-3∙22,4∙47) 0∙2383
MDS-UPDRS Total ON,
Change from Baseline to 6
Months
25 -4∙35 (-8∙33,-0∙38) 25 1∙55 (-2∙48,5∙58) 26 -0∙02 (-4∙04,4∙00) 0∙1060
MDS-UPDRS Total OFF,
Change from Baseline to 6
Months
25 -5∙48 (-10∙48,-0∙49) 25 0∙07 (-5∙12,5∙27) 26 -0∙31 (-5∙38,4∙77) 0∙2309
MDS-UPDRS Total ON,
Change from Month 6 to 30
Days Off Drug
25 0∙47 (-3∙14,4∙08) 24 1∙51 (-2∙65,5∙67) 24 1∙39 (-2∙55,5∙33) 0∙9157
PDQ-39, Change from
Baseline to Month 6
25 -0∙76 (-4∙00,2∙47) 25 0∙87 (-2∙57,4∙30) 26 -3∙38 (-6∙68,-0∙07) 0∙2052
Mean (SD) Mean (SD) Mean (SD) p value†
LEDD at Month 6 24 1050∙17 (498∙15) 23 954∙85 (226∙17) 23 1024∙38 (408∙97) 0∙6981
CGII-P 24 N (%) 23 N (%) 22 N (%) p value¶
Improved 9 (38%) 8 (35%) 10 (45%) 0∙3135
No Change 10 (42%) 12 (52%) 5 (23%)
Worsened 5 (21%) 3 (13%) 7 (32%)
CGII-I 24 N (%) 23 N (%) 23 N (%) p value¶
Improved 9 (38%) 5 (22%) 6 (26%) 0∙6072
No Change 12 (50%) 13 (57%) 15 (65%)
Worsened 3 (13%) 5 (22%) 2 (9%)
*p values are from a two degrees of freedom test for any difference in adjusted slopes between
the treatment groups †p values are from a two degrees of freedom test for any difference in means at 6 months ¶ p values are from Fisher's Exact Test
. CC-BY-NC 4.0 International licenseIt is made available under a is the author/funder, who has granted medRxiv a license to display the preprint in perpetuity. (which was not certified by peer review)
The copyright holder for this preprint this version posted May 12, 2020. ; https://doi.org/10.1101/2020.05.11.20093146doi: medRxiv preprint

24
Table 4: Steady State Nilotinib Serum and CSF Concentrations at 3 Mon around
Tmax (2 +/-0.5 hr)
Nilotinib 150 Nilotinib 300
Cmax Serum Nilotinib (ng/mL)
N 20 21
Geometric Mean (95% CI) 424∙29 (343∙31, 524∙37) 549∙33 (485∙77, 621∙20)
CSF Nilotinib (ng/mL)
N 21 21
Geometric Mean (95% CI) 0∙84 (0∙61, 1∙10) 1∙44 (1∙10, 1∙90)
N < LOD 2 0
CSF-to-Serum Nilotinib Concentration (%) at Cmax
N 17 20
Geometric Mean (95% CI) 0∙19% (0∙16%, 0∙23%) 0∙26% (0∙20%, 0∙32%)
Values of 0 were imputed for observations below the limit of detection (LOD).
Samples were collected around Tmax defined as 2 +/-0.5 hr post last dose of Nilotinib.
Participants who had samples collected outside of the pre-defined window were excluded
from this analysis.
. CC-BY-NC 4.0 International licenseIt is made available under a is the author/funder, who has granted medRxiv a license to display the preprint in perpetuity. (which was not certified by peer review)
The copyright holder for this preprint this version posted May 12, 2020. ; https://doi.org/10.1101/2020.05.11.20093146doi: medRxiv preprint

25
Supplementary Table 1. CSF levels of Dopamine, its Metabolites by Treatment Group
Excluding Participants on MAO-B Inhibitors
Variable Placebo Active 150 Active 300 Total p-value
(N = 13) (N = 14) (N = 10) (N = 37)
Dopamine (DA) 0.95
Mean (SD) 0.07 (0.06) 0.05 (0.03) 0.07 (0.04) 0.06 (0.04)
Median 0.06 0.04 0.06 0.05
(Min, Max) (0.01, 0.25) (0.01, 0.10) (0.02, 0.13) (0.01, 0.25)
3,4-Dihydroxyphenylacetic
acid (DOPAC)
0.35
Mean (SD) 3.08 (2.03) 2.29 (2.03) 3.96 (3.75) 3.02 (2.61)
Median 2.70 1.42 2.61 2.39
(Min, Max) (0.27, 7.37) (0.39, 6.63) (0.84, 11.21) (0.27, 11.21)
Homovanillic acid (HVA) 0.96
Mean (SD) 142.30 (86.21) 89.98 (63.55) 111.10 (46.90) 114.07 (70.72)
Median 127.40 71.88 119.05 104.40
(Min, Max) (34.21, 348.40) (30.89,
255.80)
(21.65, 169.00) (21.65, 348.40)
DOPAC : DA 0.89
Mean (SD) 54.98 (47.76) 45.92 (24.94) 62.21 (51.47) 53.51 (41.12)
Median 49.53 39.61 39.48 42.56
(Min, Max) (15.98, 196.27) (16.64,
111.96)
(18.80, 156.06) (15.98, 196.27)
HVA : DA 0.27
Mean (SD) 2431.67
(1128.77)
2165.58
(1050.84)
1812.71 (813.00) 2163.70 (1024.14)
Median 2427.34 2506.25 1680.37 2387.99
(Min, Max) (860.75, 5066.60) (631.42,
4089.97)
(922.85, 3001.78) (631.42, 5066.60)
. CC-BY-NC 4.0 International licenseIt is made available under a is the author/funder, who has granted medRxiv a license to display the preprint in perpetuity. (which was not certified by peer review)
The copyright holder for this preprint this version posted May 12, 2020. ; https://doi.org/10.1101/2020.05.11.20093146doi: medRxiv preprint
26
Supplementary Materials
Supplement 1. Protocol
Supplement 2. Statistical analysis plan
Supplement 3. Analytical method for assessment of monoamines and their metabolites in the CSF.
Supplement 4. Analytical methods to determine nilotinib concentrations in the serum and CSF.
Supplement 5. Serum and CSF Pharmacokinetic Study in the Dog.
Supplement 6. List of Non-Author contributors (to be listed so they can be searched in PubMed).
Supplement 3. Analytical method for assessment of monoamines and their metabolites in
the CSF.
The CSF biospecimens were analyzed by Biocrates Life Sciences AG (Innsbruck, Austria) using
a validated multiplexed, mass spectrometry-based analytical platform. The table below shows the
17 distinct analytes measured and their respective Lower Limit of Detection (LOD) and Upper
Limit of Quantification (ULLQ) values. Absolute concentrations of monoamines and related
metabolites were determined using procedures adapted from Yamada et al(22). In brief, samples
were subjected to ultracentrifugation and derivatization prior to online solid-phase extraction and
LC-MS/MS analysis (Symbiosis Pharma, Spark, Emmen, Netherlands) coupled to an Applied
Biosystems API4000 MS/MS-System). Heavy isotope-labeled catecholamines used as internal
standards were added to the standard calibration curve as well as to each sample before extraction
to correct for random and systematic errors. Each analyte was normalized to its appropriate internal
standard, resulting in relative areas.
. CC-BY-NC 4.0 International licenseIt is made available under a is the author/funder, who has granted medRxiv a license to display the preprint in perpetuity. (which was not certified by peer review)
The copyright holder for this preprint this version posted May 12, 2020. ; https://doi.org/10.1101/2020.05.11.20093146doi: medRxiv preprint

27
. CC-BY-NC 4.0 International licenseIt is made available under a is the author/funder, who has granted medRxiv a license to display the preprint in perpetuity. (which was not certified by peer review)
The copyright holder for this preprint this version posted May 12, 2020. ; https://doi.org/10.1101/2020.05.11.20093146doi: medRxiv preprint

28
Supplement 4. Analytical methods to determine nilotinib concentrations in the serum and
CSF.
Bioanalytics for nilotinib concentrations in serum and CSF was performed at WuXi AppTec
(Shanghai, China) under Good Laboratory Practice (GLP) procedures. Frozen biospecimens
aliquots were shipped to WuXi on dry ice and stored at -800C until analysis of nilotinib
concentrations by previously validated LC-MS/MS assays for each matrix. Concentrations of
nilotinib were determined using the slope and intercept of calibration curves for each matrix as
described below. In addition, quality control samples were included in each batch analyses and
data were accepted only if calculated concentrations of the quality control samples were within
15% of their nominal values. The lack of carryover was demonstrated by injecting blank samples
after nilotinib injected at Upper Limit of Quantification for each matrix. Incurred sample
reproducibility was conducted for each matrix using 10% of study samples to demonstrate the
reproducibility of nilotinib concentration in the incurred samples under study storage conditions.
Serum Assay: The reference material was nilotinib and internal standard was [13C315N2] AMN107,
supplied by Novartis. Human serum was used as a blank matrix for preparation of 8-point
calibration curve (2.5 to 5000 ng/mL nilotinib). The Lower Limit of Quantification (LLOQ) and
Upper Limit of Quantification (ULOQ) were 2.5 ng/mL and 5000 ng/mL, respectively. Freshly
prepared quality control samples (6, 150, 1400 and 4000 ng/mL nilotinib) were tested in each
batch.
CSF assay: The reference material was nilotinib and internal standard was nilotinib-d6. Triton X-
100 (20 mg/mL) was added to artificial CSF (Harvard Apparatus, Cambridge, MA, USA) to reduce
non-specific binding to tubes and used as blank matrix. An 8-point calibration curve (0.200 to 100
ng/mL) was prepared in the blank matrix. The LLOQ and ULOQ for CSF were 0.200 ng/mL and
. CC-BY-NC 4.0 International licenseIt is made available under a is the author/funder, who has granted medRxiv a license to display the preprint in perpetuity. (which was not certified by peer review)
The copyright holder for this preprint this version posted May 12, 2020. ; https://doi.org/10.1101/2020.05.11.20093146doi: medRxiv preprint

29
100 ng/mL, respectively. The quality control samples (0.6, 4, 40 and 75 ng/mL nilotinib) were
prepared fresh in human CSF with Triton X-100 (20 mg/mL) and were tested for each batch of
CSF analyzed.
Pharmacokinetic Sampling Study Design
On day 14 and months 1 and 2 of the study, pre-dose trough serum samples were collected before
administration of the daily dose of study drug . Serum samples were also collected at 2 hours post
dose (reported as Tmax) at month 3 to approximate a maximum concentration (Cmax), and serum
samples at random times relative to dose at months 2, 4, and 6. Serum was also collected in month
7 after a month off the study drug. CSF samples were collected at screening (i.e., pre-drug) 2
hours post dose of study drug at month 3 and a month off the study drug (month 7); the latter CSF
collection was optional.
. CC-BY-NC 4.0 International licenseIt is made available under a is the author/funder, who has granted medRxiv a license to display the preprint in perpetuity. (which was not certified by peer review)
The copyright holder for this preprint this version posted May 12, 2020. ; https://doi.org/10.1101/2020.05.11.20093146doi: medRxiv preprint

30
Supplement 5. Serum and CSF Pharmacokinetics (PK) Study in the Dog
The objective of this study was to establish steady-state PK of nilotinib in the serum and CSF as
well as brain exposure at ~Tmax to evaluate its penetration into the CNS.
Methods
Animals and Surgery: The study was conducted at MPI Research (Mattawan, MI, USA) under a
protocol approved by the Institutional Animal Care and Use Committee (IACUC). Animal welfare
was in compliance with the U.S. Department of Agriculture’s (USDA) Animal Welfare Act (9
Code of Federal Regulations (CFR) Parts 1, 2 and 3), the Guide for the Care and Use of Laboratory
Animals, Institute of Laboratory Animal Resources (National Academy Press, Washington, D.C.).
Ten adult male beagle dogs weighing 9-12 Kg were surgically instrumented with a jugular vein
catheter for blood collection as well as an intrathecal catheter between L3 and L4 with an access
port for collection of cerebral spinal fluid (CSF) under general anesthesia.
Nilotinib treatment: Dogs were randomly assigned to 2 treatment arms of 5 animals each and
received either 20 mg/kg or 50 mg/kg nilotinib in a formulation of 1.5% Avicel/0.3% HPMC in
water via oral gavage daily for 14 days (dose volume = 5 mL/kg). The lower dose was selected
on the basis of dog PK data (Novartis Investigators’ Brochure) to target serum PK in the range of
human PK at 300 mg of nilotinib. The animals were not fasted prior to dosing and food/fluids were
provided ad libitum.
Biospecimen Collection and Bioanalytics: Blood and CSF samples were collected from 4 animals
of each dose group on Day 14. Blood collection from the jugular vein occurred at pre-dose, and
0.25, 0.5, 1, 2, 4, 8, 12, 24 and 48 hours post-dose and was processed for serum collection. CSF
collection occurred at pre-dose, and 1, 2, 4 and 12 hours post-dose. Dosing of the animals was
continued on day 15 and 16 as per their originally assigned dosage. On day 16, animals were
. CC-BY-NC 4.0 International licenseIt is made available under a is the author/funder, who has granted medRxiv a license to display the preprint in perpetuity. (which was not certified by peer review)
The copyright holder for this preprint this version posted May 12, 2020. ; https://doi.org/10.1101/2020.05.11.20093146doi: medRxiv preprint

31
euthanized 2 hours post-dose (~Tmax) for collection of brain tissue. An additional 2 treatment-
naïve dogs without catheterization were necropsied as controls for the brain exposures. All
biospecimens were frozen and stored at -60 to -900C until analyses. Nilotinib concentrations in
serum, CSF and brain homogenate were assessed by liquid chromatography-tandem mass
spectrometry (LC/MS-MS) using validated analytical methods developed by MPI Research.
Bioanalytics was conducted on samples from 4 animals per group (2 extra animals went through
surgery and treatment to ensure that at least 4 per group would remain patent and without major
tolerability issues).
Results
Table 1: Summary of nilotinib pharmacokinetics in the serum and CSF
Pharmacokinetic
Parameter
20 mg/kg (n=4) 50 mg/kg (n=4)
Geometric Mean [Interquartile
Range]
Geometric Mean [Interquartile Range]
Serum CSF Serum CSF
Cmax (ng/mL) 692 [182 - 3118] 6.4 [2.5, 24.2] 2,271 [1808 - 2605] 13.7 [11.8, 16.7]
Tmax (h) -- [1.5 - 2.0] -- [1.5, 2.0] -- [1.75 - 2.5] 3.4[3.5, 4.0]
C0/Cmin (ng/mL) 22.8 [10.3 - 60.9] 0.5 [0.4, 0.6] 342 [256 - 588] 4.1 [3.3, 4.6]
C24 (ng/mL) 4.8 [10.9 - 17.7] -- 59.7 [24.2 - 216] --
AUC0-tau,
ng*h/mL
3,482 [679 -
17849]
38.4 [10.9, 140] 17,606 [10169 -
27560]
116 [93, 142]
([CSF]/[Serum] at
2 h) x 100
0.92% 0.60%
Cmax: maximum concentration; Tmax: time to maximum concentration; C0: concentration at pre-
dose sample; Cmin: minimum concentration observed; C24: concentration at 24-hour post-dose
sample; AUC0-tau: area under the time-concentration curve over the dosing interval.
. CC-BY-NC 4.0 International licenseIt is made available under a is the author/funder, who has granted medRxiv a license to display the preprint in perpetuity. (which was not certified by peer review)
The copyright holder for this preprint this version posted May 12, 2020. ; https://doi.org/10.1101/2020.05.11.20093146doi: medRxiv preprint

32
High variability was seen in nilotinib concentrations in the 20 mg/kg group for both matrices for
reasons unknown. The Cmax concentration of nilotinib in the serum at 20 mg/kg was in the range
of that observed in the 300 mg arm of the clinical study. As seen in the clinical data, the CSF
levels of nilotinib were <1% of those observed in the serum.
Brain Tissue Concentrations of Nilotinib in the Dog
On day 16, paired samples of serum and brain tissue were collected at 2 h post-dose to target the
Tmax concentrations. The average (standard deviations) serum concentrations in the 20 mg/kg and
50 mg/kg dose groups were 1359 (1318) ng/mL and 1214 (597) ng/mL, respectively. The average
(standard deviations) brain tissue concentrations in the 20 mg/kg and 50 mg/kg dose groups were
4132 (4158) ng/g and 3355 (1392) ng/g, respectively. When corrected for protein binding
(reported dog plasma protein binding is 98.3%; Xia et al., 2012), the mean (standard deviation)
unbound concentration of nilotinib in the brain tissues were 70 (71) and 57 (24) ng/g tissue, which
reflects 4% and 2.3% of serum concentration for 20 mg and 50 mg/kg arms, respectively.
Assessment of c-Abl inhibition in the dog brain.
Methods
The dog brain tissues (cerebral cortex and cerebellum) were homogenized in RIPA buffer (50 mM
Tris, pH 8.0, 150mM NaCl, 1% NonidetTM P-40, 1% SDS, 0.5% sodium deoxycholate)
supplemented with phosphatase inhibitor cocktail II and III (Sigma-Aldrich), and complete
protease inhibitor mixture. The homogenate was centrifuged (20 min at 4 C, 15000 rpm) and the
resulting supernatant was collected. The protein concentrations of the samples were measured by
. CC-BY-NC 4.0 International licenseIt is made available under a is the author/funder, who has granted medRxiv a license to display the preprint in perpetuity. (which was not certified by peer review)
The copyright holder for this preprint this version posted May 12, 2020. ; https://doi.org/10.1101/2020.05.11.20093146doi: medRxiv preprint

33
BCA assay. Samples were electrophoresed on SDS-PAGE gels and transformed to nitrocellulose
membranes. Membranes were blocked with 5% non-fat dry milk (wt/vol) in Tris-buffered saline
with Tween-20 (TBS-T) and incubated with primary antibodies (mouse anti-c-Abl (# 554148, BD
Biosciences); Rabbit anti-pY245 c-Abl (# 2861, Cell Signaling)). After an incubation with
horseradish peroxidase-conjugated secondary antibody (anti-mouse IgG (# 7076S, Cell Signaling)
or Anti-rabbit (# 7074S Cell Signaling)), the immunoblot signal was detected using
chemiluminescent substrates (Thermo Scientific). The integrated band densities were measured
using ImageJ software and the relative densities of pY245 c-Abl and c-Abl were calculated with
respect to total c-Abl and beta-actin respectively.
Results
Nilotinib treatment did not affect total c-Abl or pY245 c-Abl levels normalized to total c-Abl in
the cortex or the cerebellum. The mean and (standard deviation) for the ratio of optical density of
pY245 c-Abl to total c-Abl bands in the cerebral cortex for the vehicle, 20 mg/kg nilotinib and 50
mg/kg nilotinib groups, respectively, were: 2.133±0.82, 2.551±1.153 and 4.060±1.393. The
corresponding values for the cerebellum were: 0.290±0.276, 0.766±0.544 and 0.792±0.444.
Statistical analyses using Sidak’s multiple comparison test showed p>0.15 for the cortex and
p>0.46 for the cerebellum.
Taken together, this carefully designed dog PK study with pharmacodynamic assessment indicates
that nilotinib has poor brain penetration resulting in concentrations in the CNS that are not
sufficient to inhibit c-Abl activity in the brain tissue.
. CC-BY-NC 4.0 International licenseIt is made available under a is the author/funder, who has granted medRxiv a license to display the preprint in perpetuity. (which was not certified by peer review)
The copyright holder for this preprint this version posted May 12, 2020. ; https://doi.org/10.1101/2020.05.11.20093146doi: medRxiv preprint
34
Other information
Reproducible Research Statement
The following documents are available to the readers
Protocol: available at
Statistical Analysis Plan: available at
Statistical Code: available at
Data: will be uploaded on the NINDS clinical trials data repository
. CC-BY-NC 4.0 International licenseIt is made available under a is the author/funder, who has granted medRxiv a license to display the preprint in perpetuity. (which was not certified by peer review)
The copyright holder for this preprint this version posted May 12, 2020. ; https://doi.org/10.1101/2020.05.11.20093146doi: medRxiv preprint

NILO-PD CONSORT Diagram Figure 1.
Enrollment
Analysed (n= 26) ♦ Excluded from analysis (n= 0)
Allocated to Placebo (n= 25) ♦ Received allocated intervention (n= 25) ♦ Did not receive allocated intervention (n= 0)
Assessed for eligibility (n= 125)
Follow-Up
Analysed (n= 25) ♦ Excluded from analysis (n= 0)
Lost to follow-up (n= 0)
Discontinued intervention (n= 1) ♦ Adverse Event (n= 1)
Lost to follow-up (n= 0)
Discontinued intervention (n= 2) ♦ Adverse Event (n= 2)
Analysed (n= 25) ♦ Excluded from analysis (n= 0)
Analysis
Lost to follow-up (n= 0)
Discontinued intervention (n= 5) ♦ Adverse Event (n= 4) ♦ Ineligible ECG at enrollment (n= 1)
Allocated to Nilotinib 150 (n= 25) ♦ Received allocated intervention (n= 25) ♦ Did not receive allocated intervention (n= 0)
Allocation
Excluded (n= 49) ♦ Not meeting inclusion criteria (n= 42 ) ♦ Declined to participate (n= 7) ♦ Other reasons (n= 0)
Randomized (n= 76)
Allocated to Nilotinib 300 (n= 26) ♦ Received allocated intervention (n= 26) ♦ Did not receive allocated intervention (n= 0)
. C
C-B
Y-N
C 4.0 International license
It is made available under a
is the author/funder, who has granted m
edRxiv a license to display the preprint in perpetuity.
(wh
ich w
as no
t certified b
y peer review
)T
he copyright holder for this preprint this version posted M
ay 12, 2020. ;
https://doi.org/10.1101/2020.05.11.20093146doi:
medR
xiv preprint

Table 1: Baseline Demographics and Disease Characteristics
Measure Placebo (N = 25) Nilotinib 150 (N = 25) Nilotinib 300 (N = 26)
Age (years) 65·54 (6·79) 61·19 (7·43) 66·90 (7·28)
Gender (male) 16 (64%) 15 (60%) 21 (81%)
Race (white) 24 (96%) 23 (92%) 25 (96%)
Ethnicity (non-hispanic) 24 (96%) 25 (100%) 25 (96%)
Disease Duration (years) 9·38 (4·87) 8·53 (3·20) 11·69 (5·21)
Age at Diagnosis (years) 56·17 (6·78) 52·66 (7·62) 55·21 (9·33)
MDS-UPDRS Total OFF Score 63·76 (21·29) 65·00 (16·04) 70·19 (20·17)
MDS-UPDRS Total ON Score 46·20 (17·83) 46·92 (15·07) 51·85 (15·74)
H/Y Stage 0-2 4 (16%) 5 (20%) 1 (4%)
H/Y Stage 3 21 (84%) 20 (80%) 25 (96%)
Levodopa Equivalent Daily Dose 1066·46 (519·70) 971·81 (251·36) 1012·53 (390·52)
Class of Symptomatic Therapy, MAOB Inhibitors 11 (44%) 8 (32%) 12 (46%)
MoCA Score* 26·88 (2·37) 27·44 (1·92) 26·96 (2·37)
Mattis Dementia Rating Scale 138·08 (5·67) 137·80 (7·82) 137·69 (6·27)
BDI II Score 6·56 (4·88) 7·32 (5·42) 6·58 (4·33)
PDSS 106·62 (21·77) 115·31 (11·59) 103·17 (18·59)
Modified SE/ADL OFF 73·20 (16·51) 77·29 (17·81) 76·96 (14·90)
Modified SE/ADL ON 86·80 (8·65) 92·20 (5·79) 86·96 (17·88)
PDQ39 Total Score 19·02 (12·73) 18·95 (9·43) 18·37 (10·25)
EQ-5D Summary Index 0·79 (0·14) 0·83 (0·13) 0·78 (0·15)
EQ-5D Health Score 70·64 (25·07) 71·52 (23·26) 75·96 (15·86) Values are presented as mean (SD) or N(%) as appropriate *MoCA Score is Education-Adjusted Abbreviations: Movement Disorder Society Unified Parkinson's Disease Rating Scale (MDS-UPDRS), Hoehn and Yahr (H/Y), Montreal Cognitive Assessment (MoCA), Beck Depression Inventory (BDI), Parkinson's Disease Sleep Scale (PDSS), Modified Schwab & England Activities of Daily Living (SE/ADL), Parkinson's Disease Quality of Life Scale (PDQ39), EuroQol 5 Dimensions (EQ-5D)
. C
C-B
Y-N
C 4.0 International license
It is made available under a
is the author/funder, who has granted m
edRxiv a license to display the preprint in perpetuity.
(wh
ich w
as no
t certified b
y peer review
)T
he copyright holder for this preprint this version posted M
ay 12, 2020. ;
https://doi.org/10.1101/2020.05.11.20093146doi:
medR
xiv preprint

Table 2: Safety and Tolerability Outcomes
Placebo Nilotinib 150 Nilotinib 300
(N = 25) (N = 25) (N = 26) Primary Tolerability Tolerability 21 (84%) 19 (76%) 20 (77%) Primary Safety Treatment-Related SAEs 0 0 1 (4%) Other Safety and Tolerability Any Adverse Event 22 (88%) 23 (92%) 23 (88%) Any Serious Adverse Event 2 (8%) 1 (4%) 1 (4%) Dose Suspensions* 3 (12%) 6 (24%) 5 (19%) Study Drug Discontinuations† 1 (4%) 2 (8%) 5 (19%) Serious Adverse Events Arrhythmia 0 0 1 (4%) Abdominal pain 1 (4%) 0 0 Gastrooesophageal reflux disease 1 (4%) 0 0 Suicidal ideation 0 1 (4%) 0 Adverse Events reported by > 10% in any group
Fall¶ 5 (20%) 4 (16%) 0 Lipase increased 4 (16%) 7 (28%) 6 (23%) Amylase increased 2 (8%) 4 (16%) 4 (15%) Nasopharyngitis 5 (20%) 2 (8%) 2 (8%) Fatigue 4 (16%) 4 (16%) 0 Nausea 0 2 (8%) 4 (15%) Headache 2 (8%) 1 (4%) 3 (12%) Dizziness 1 (4%) 4 (16%) 0 Gastrooesophageal reflux disease 4 (16%) 0 0 Anxiety 0 3 (12%) 1 (4%) Myalgia 3 (12%) 0 0 Skin abrasion 3 (12%) 0 0
Values are presented as number of participants experiencing the event at least once (%). *All dose suspensions are due to adverse events † All drug discontinuations are due to adverse events, except for one in the Nilotinib 300 group, which was due to ineligibility ¶ Indicates significant group differences, p <0.05
. C
C-B
Y-N
C 4.0 International license
It is made available under a
is the author/funder, who has granted m
edRxiv a license to display the preprint in perpetuity.
(wh
ich w
as no
t certified b
y peer review
)T
he copyright holder for this preprint this version posted M
ay 12, 2020. ;
https://doi.org/10.1101/2020.05.11.20093146doi:
medR
xiv preprint

Table 3: Changes in Secondary and Exploratory Outcomes Over Time Placebo Nilotinib 150 Nilotinib 300
Measure N Adjusted Change N Adjusted Change N Adjusted Change p value* LSM (95% CI) LSM (95% CI) LSM (95% CI)
Secondary Outcomes MDS-UPDRS Part III ON, Change from Baseline to 1 Month
25 -0·49 (-3·22,2·24) 25 2·08 (-0·64,4·80) 26 4·67 (2·00,7·34) 0·0306
MDS-UPDRS Part III ON, Change from Baseline to 6 Months
25 -2·95 (-5·72,-0·19) 25 1·05 (-1·76,3·85) 26 0·93 (-1·86,3·72) 0·0768
MDS-UPDRS Part III OFF, Change from Baseline to 6 Months
25 -4·03 (-7·83,-0·22) 25 -0·23 (-4·32,3·86) 26 0·84 (-2·85,4·53) 0·1711
MDS-UPDRS Part III ON, Change from Month 6 to 30 Days Off Drug
25 -0·30 (-2·98,2·37) 24 0·50 (-2·39,3·39) 24 2·08 (-0·70,4·86) 0·4657
Exploratory Outcomes MDS-UPDRS Total ON, Change from Baseline to 1 Month
25 -3·78 (-7·70,0·14) 25 -0·00 (-3·91,3·91) 26 0·62 (-3·22,4·47) 0·2383
MDS-UPDRS Total ON, Change from Baseline to 6 Months
25 -4·35 (-8·33,-0·38) 25 1·55 (-2·48,5·58) 26 -0·02 (-4·04,4·00) 0·1060
MDS-UPDRS Total OFF, Change from Baseline to 6 Months
25 -5·48 (-10·48,-0·49) 25 0·07 (-5·12,5·27) 26 -0·31 (-5·38,4·77) 0·2309
MDS-UPDRS Total ON, Change from Month 6 to 30 Days Off Drug
25 0·47 (-3·14,4·08) 24 1·51 (-2·65,5·67) 24 1·39 (-2·55,5·33) 0·9157
PDQ-39, Change from Baseline to Month 6
25 -0·76 (-4·00,2·47) 25 0·87 (-2·57,4·30) 26 -3·38 (-6·68,-0·07) 0·2052
Mean (SD) Mean (SD) Mean (SD) p value† LEDD at Month 6 24 1050·17 (498·15) 23 954·85 (226·17) 23 1024·38 (408·97) 0·6981 CGII-P 24 N (%) 23 N (%) 22 N (%) p value¶ Improved 9 (38%) 8 (35%) 10 (45%) 0·3135 No Change 10 (42%) 12 (52%) 5 (23%) Worsened 5 (21%) 3 (13%) 7 (32%) CGII-I 24 N (%) 23 N (%) 23 N (%) p value¶ Improved 9 (38%) 5 (22%) 6 (26%) 0·6072 No Change 12 (50%) 13 (57%) 15 (65%) Worsened 3 (13%) 5 (22%) 2 (9%)
*p values are from a two degrees of freedom test for any difference in adjusted slopes between the treatment groups †p values are from a two degrees of freedom test for any difference in means at 6 months ¶ p values are from Fisher's Exact Test
. C
C-B
Y-N
C 4.0 International license
It is made available under a
is the author/funder, who has granted m
edRxiv a license to display the preprint in perpetuity.
(wh
ich w
as no
t certified b
y peer review
)T
he copyright holder for this preprint this version posted M
ay 12, 2020. ;
https://doi.org/10.1101/2020.05.11.20093146doi:
medR
xiv preprint

Figure 2: Movement Disorder Society Unified Parkinson's Disease Rating Scale (MDS-UPDRS) Part III ON & OFF Over Time
Baseline
Month 3
Month 6
1 Mo. Post
2 Mo. Post
MDS-UPDRS OFF
Baseline
Month 3
Month 6
1 Mo. Post
2 Mo. Post
MDS-UPDRS OFF
Baseline
Day 14
Day 30
Month 3
Month 6
1 Mo. Post
2 Mo. Post
MDS-UPDRS ON
Baseline
Day 14
Day 30
Month 3
Month 6
1 Mo. Post
2 Mo. Post
MDS-UPDRS ON
. C
C-B
Y-N
C 4.0 International license
It is made available under a
is the author/funder, who has granted m
edRxiv a license to display the preprint in perpetuity.
(wh
ich w
as no
t certified b
y peer review
)T
he copyright holder for this preprint this version posted M
ay 12, 2020. ;
https://doi.org/10.1101/2020.05.11.20093146doi:
medR
xiv preprint

Table 4: Steady State Nilotinib Serum and CSF Concentrations at 3 Mon around Tmax (2 +/-0.5 hr)
Nilotinib 150 Nilotinib 300
Cmax Serum Nilotinib (ng/mL)
N 20 21
Geometric Mean (95% CI) 424·29 (343·31, 524·37) 549·33 (485·77, 621·20)
CSF Nilotinib (ng/mL)
N 21 21
Geometric Mean (95% CI) 0·84 (0·61, 1·10) 1·44 (1·10, 1·90)
N < LOD 2 0
CSF-to-Serum Nilotinib Concentration (%) at Cmax
N 17 20
Geometric Mean (95% CI) 0·19% (0·16%, 0·23%) 0·26% (0·20%, 0·32%)
Values of 0 were imputed for observations below the limit of detection (LOD). Samples were collected around Tmax defined as 2 +/-0.5 hr post last dose of Nilotinib. Participants who had samples collected outside of the pre-defined window were excluded from this analysis.
. C
C-B
Y-N
C 4.0 International license
It is made available under a
is the author/funder, who has granted m
edRxiv a license to display the preprint in perpetuity.
(wh
ich w
as no
t certified b
y peer review
)T
he copyright holder for this preprint this version posted M
ay 12, 2020. ;
https://doi.org/10.1101/2020.05.11.20093146doi:
medR
xiv preprint

Figure 3: CSF levels of Dopamine, its Metabolites & the Relationship between Nilotinib CSF Concentrations & Dopamine Turnover Indices
HVA/Dopamine
DOPAC/Dopamine
Homovanillic acid (HVA) ng/mL
3,4-Dihydroxyphenylacetic acid (DOPAC) ng/mL
Dopamine (DA) ng/mL
. C
C-B
Y-N
C 4.0 International license
It is made available under a
is the author/funder, who has granted m
edRxiv a license to display the preprint in perpetuity.
(wh
ich w
as no
t certified b
y peer review
)T
he copyright holder for this preprint this version posted M
ay 12, 2020. ;
https://doi.org/10.1101/2020.05.11.20093146doi:
medR
xiv preprint

Supplementary Table 1. CSF levels of Dopamine, its Metabolites by Treatment Group Excluding Participants on MAO-B Inhibitors
Variable Placebo Active 150 Active 300 Total p-value (N = 13) (N = 14) (N = 10) (N = 37) Dopamine (DA) 0.95 Mean (SD) 0.07 (0.06) 0.05 (0.03) 0.07 (0.04) 0.06 (0.04) Median 0.06 0.04 0.06 0.05 (Min, Max) (0.01, 0.25) (0.01, 0.10) (0.02, 0.13) (0.01, 0.25) 3,4-Dihydroxyphenylacetic acid (DOPAC) 0.35 Mean (SD) 3.08 (2.03) 2.29 (2.03) 3.96 (3.75) 3.02 (2.61) Median 2.70 1.42 2.61 2.39 (Min, Max) (0.27, 7.37) (0.39, 6.63) (0.84, 11.21) (0.27, 11.21) Homovanillic acid (HVA) 0.96 Mean (SD) 142.30 (86.21) 89.98 (63.55) 111.10 (46.90) 114.07 (70.72) Median 127.40 71.88 119.05 104.40 (Min, Max) (34.21, 348.40) (30.89, 255.80) (21.65, 169.00) (21.65, 348.40) DOPAC : DA 0.89 Mean (SD) 54.98 (47.76) 45.92 (24.94) 62.21 (51.47) 53.51 (41.12) Median 49.53 39.61 39.48 42.56 (Min, Max) (15.98, 196.27) (16.64, 111.96) (18.80, 156.06) (15.98, 196.27) HVA : DA 0.27 Mean (SD) 2431.67 (1128.77) 2165.58 (1050.84) 1812.71 (813.00) 2163.70 (1024.14) Median 2427.34 2506.25 1680.37 2387.99 (Min, Max) (860.75, 5066.60) (631.42, 4089.97) (922.85, 3001.78) (631.42, 5066.60)
. C
C-B
Y-N
C 4.0 International license
It is made available under a
is the author/funder, who has granted m
edRxiv a license to display the preprint in perpetuity.
(wh
ich w
as no
t certified b
y peer review
)T
he copyright holder for this preprint this version posted M
ay 12, 2020. ;
https://doi.org/10.1101/2020.05.11.20093146doi:
medR
xiv preprint