the american college teacher - higher education research institute · 2016-10-03 · the american...
TRANSCRIPT


The American College Teacher
National Norms for the 1992-93 HERI Faculty Survey
by
Eric L. Dey Claudia E. Ramirez
William S. Korn Alexander W. Astin
Higher Education Research Institute Graduate School of Education
University of California, Los Angeles
May, 1993
COOPERATIVE INSTITUTIONAL RESEARCH PROGRAM
The Cooperative Institutional Research Program (ClRP) is a national longitudinal study of the American higher education system. Established in 1966 at the American Council on Education, the CIRP is now the nation's largest and oldest empirical study of higher education, involving data on some 1,300 institutions, over 8 million students, and more than 1()(),OOO faculty. To maximize the use of these data in research and training, the CIRP was transferred to the Graduate School of Education at UCLA in 1973. The annual CIRP freshman and college student surveys are now administered by the Higher Education Research Institute at the University of California, Los Angeles, under the continuing sponsorship oCthe American Council on Education.
AMERICAN COUNCIL ON EDUCATION
The American Council on Education (ACE), founded in 1918, is a council of educational organizations and institutions. ACE seeks to advance education and educational methods through comprehensive voluntary and cooperative action on the part of American educational associations, organizations, and institutions.
HIGHER EDUCATION RESEARCH INSTITUTE University of California, Los Angeles
Alexander W. Astin, Professor and Director Mary L. Rabb, Assistant to the Director
The Higher Education Research Institute (HERI) is based in the Graduate School of Education at the University of California, Los Angeles. The Institute serves as an interdisciplinary center for research, evaluation, information, policy studies, and research training in postsecondary education. HERI's research program covers five broad areas: the outcomes of postsecondary education; academic administration and institutional management; faculty performance; federal and state policy assessment; and educational equity.
CIRP PROJECT STAFF
Eric L. Dey, Director Alexander W. Astin, Founding Director
William S. Korn, Associate Director for Operations Ellyne R. Riggs, Office Manager
CIRP ADVISORY COMMITTEE
Ansley A. Abraham Director, Doctoral Scholars Program Southern Re~ional Education Board
Alberto Cabrera, Assistant Professor State University of New York at Albany
Hugh Fordyce. Director of Research United Negro College Fund
John Muffo Director, Institutional Research Virginia Polytechnic & State University
EvaE.Nance Director, Institutional Research University of Notre Dame
Joseph Pettit, Vice President for Planning Georgetown University
Earl Richardson, President Morgan State University
Mary Elizabeth Shutler Provost & Vice President for Academic Affairs California State University at Los Angeles
Deborah Teeter Director, Institutional Research University of Kansas
Robert H. Atwell (ex-officio) President American Council on Education
Elaine EI-Khawas (ex-officio) Vice President American Council on Education
Published by the Higher Education Research Institute. Suggested citation:
Dey, E. L., Ramirez, C. E., Korn, W. S., & Astin, A. W. (1992). The American College Teacher: National Norms/or the 1992-93 HER! Faculty Survey. Los Angeles: Higber Education Research Institute, UCLA.
Additional copies of this report may be purchased from the Higher Education Research Institute, Graduate School of Education, 320 Moore Hall, University of California, Los Angeles, CA 90024-1521. Please remit $20.00 plus $3.00 for shipping with your order. Telephone inquiries: 310 /825-1925; Fax: 206-2228.
Copyright © 1993 by the Regents of the University of California
ISBN 1-878477-13-7

Section
1.
II.
III.
IV.
V.
The American College Teacher
National Nonns for the 1992-93 HERI Faculty Survey
Table of Contents
The American College Teacher: National Nonns for the 1992-93 Faculty SUlVey
National Nonnative Data
All Undergraduate Teaching Faculty Undergraduate Teaching Faculty: Males Undergraduate Teaching Faculty: Females
Appendix A: 1992 Faculty Survey Instrument
Appendix B: The Precision of the Nonnative Data
Appendix C: Participants in the 1992 HERI Faculty SUlVey
Pa&e
1
23 45 67
89
95
99

List of Tables
~ ~.
1. Institutional and faculty participation in the 1992/93 HERI faculty survey 3
2. Background characteristics of teaching faculty by institutional type 6
3. Faculty salaries by institutional type 6
4. Professional goals of teaching faculty by institutional type 7 5. Personal goals of faculty by gender 9
6. Selected personal goals of college freshmen 9
7. Principal activity and primary interests of teaching faculty by institutional type 10
8. Teaching and research activities by institutional type 12
9. Faculty goals for undergraduates by institutional type 14
10. Instructional methods used by teaching faculty by institutional type 15
11. Job satisfaction by institutional type 16
12. Sources of faculty stress by institutional type and gender 18
13. Perceived institutional priorities by institutional type 19
14. Faculty perceptions of the institutional climate by institutional type 21
11

Acknowledgements
Trying to acknowledge all of the people who contribute to projects such as this one is a good way to develop a partial understanding of the concept of infinity! Without the efforts of an untold number of people from campuses across the country, this project would not have been completed. As such, we would like to offer our thanks to the academic administrators and institutional researchers who helped coordinate the survey on each of the participating campuses.
Closer to home, we would also like to thank several members of the HER! staff. In addition to the authors of this report, Helen S. Astin, Tamela Heath, Linda J. Sax, Ellyne Riggs, Carolyn J. Thompson, and Sara Wakai contributed to the design of the faculty questionnaire. Claudia E. Ramirez managed the complex data collection process, with the able assistance of Ellyne Riggs and a small army of students and staff: Rawny Garay, Shirley Lee, Alison Mon-son-hing, Alex Niu, Mary Rabb, Sara Ann Schuchert, and Oenyce Tanioka. William S. Kom was responsible for the complex data processing tasks needed to produce the normative data.
Finally, we would also like to express our appreciation to the thousands of faculty who took time out of their busy lives to complete the questionnaire. This is just the first tabulation of their responses, and we are currently working on a number of more sophisticated analyses which we hope will enhance our understanding of college faculty, their institutions, and their students.
iii


The American College Teacher
National Norms for the 1992-93 HERI Faculty Survey


The American College Teacher: National Norms for the 1992-93 HERI Faculty Survey
This report summarizes the highlights of a national survey of college and university faculty
that was conducted by the Higher Education Research Institute (HERI) in the fall and winter of
1992-93. This is the second in a series of faculty surveys to be conducted on a triennial basis, the
flrst of which was conducted in 1989-90. The results of the flrst of this series of survey projects
are reported in Astin, Korn, and Dey (1991).
The results reported here are based on the responses of 29,771 full-time college and
university faculty members at 289 two-year colleges, four-year colleges, and universities across
the country. For this report, a 'faculty member' is deflned as any full-time employee of an
accredited college or university who spends at least part of his or her time teaching undergraduates.
Although the survey also covered academic administrators from these same institutions, only those
administrators who spend at least some time teaching undergraduates are included in the results
reported here.
The Survey Instrument
The survey questionnaire was based largely on the instrument used in the 1989-90 faculty
survey, which was designed in conjunction with a national study of the outcomes of general
education programs funded by the Exxon Education Foundation. The 1992-93 instrument has
been revised on the basis of the results of the 1989-90 survey, suggestions from faculty
respondents, as well as suggestions from our advisory board and researchers who are actively
involved in studying faculty issues. In addition to demographic and biographic information, the
revised questionnaire content focuses heavily on issues such as how faculty members spend their
time, how they interact with students, their preferred methods of teaching and examining students,
their perceptions of the institutional climate, and their primary sources of stress and satisfaction.
The instrument also includes a section allowing individual institutions to ask their faculty members
a set of up to ten locally-deyeloped additional questions (see Appendix A for a copy of the survey
instrument).
Institutional Sampling
Letters of invitation to participate in the survey were sent to the chief academic and
institutional research offlcers at nearly 2,600 institutions nationwide. Of the total population of
institutions who were invited, 344 institutions agreed to administer the survey. Of these 344
institutions, 55 were dropped from the national data base because of low response rates, leaving
289. A careful examination of the characteristics of the participating institutions revealed that every
1

major type of institution was well-represented. Given this, we have prepared national faculty
nonns for faculty in each of 12 different nonnative groups: all institutions, all four-year
institutions. all two-year institutions, public universities, private universities, public four-year
colleges, private four-year colleges (combined and broken down by three subgroupings:
nonsectarian, Roman Catholic, and Protestant), and public and private two-year colleges.
Weighting Procedures In order to approximate as closely as possible the results that would have been obtained if
all college and university teaching faculty in all institutions had responded to the survey, a
multistage weighting procedure was employed following Astin, Kom, and Dey (1991). The fIrst
set of weights was designed to adjust for response bias within participating institutions. The entire
faculty at each institution was sorted into twelve categories representing all combinations of gender
(male or female) and rank (professor, associate professor, assistant professor, instructor, lecturer,
other). The ratio between the number of faculty in the institution and the total number of
respondents in each category was used as the fIrst corrective weight Thus, if there were 20 female
full professo:rs and 10 of those responded, each of these respondent's weights would be 2.0 (20
divided by 10). This within-institution weight, which is designed to correct for any response bias
related to the gender or rank of the faculty member, adjusts the total number of respondents up to
the total number of faculty at the institution. l
To develop the second set of weights, institutions were sorted into 23 stratifIcation cells
based upon type (two-year, four-year, university), control (public, private-nonsectarian, Roman
Catholic, Protestant), and, for four-year institutions, selectivity (defIned as the average admissions
test score of the entering freshman class). Within each of these stratifIcation cells, faculty in all
institutions in the population were sorted into the same 12 gender by rank categories described
above. Data from all participating institutions within each institutional stratifIcation cell were then
combined, and the weigh ted number of respondents (using the fIrst weight described above) was
then determined separately for each of the gender by rank combinations. Thus, for each gender by
rank combination within a stratifIcation cell, we had two values: the total number of faculty in the
higher education population, and the weighted number of respondents to our survey. The ratio
between these two totals became the second weight, which was designed to correct for between
stratification cell differences in institutional participation. The final weight used for each respondent
consisted of the product of the two weights (that is, the within-institution weight and the between
stratifIcation weight).
lIn the event that an institution did not report the distribution of its faculty across different ranks, the withininstitution weight was based on gender alone.
2

Table 1 shows the total number of institutions and total number of institutional participants
by institutional type, together with the total number of faculty members, faculty surveyed, and
faculty respondents for each cell.
Table 1 Institutional andlaculty e.articie.ation in the 1992-93 HERItacul~ sUTV~
In~titytiQns Fa~l!l~
Partici- Used in Mailout Respon- Used in Intitutional type Total ,eating Norms Total Sam,ele dents1 Norms2
All institutions 2,582 344 289 416,911 72,417 43,940 29,771 All four-year institutions 1,460 267 228 325,474 62,182 38,693 26,029 All two-year institutions 1,122 67 61 91,437 10,235 5,247 3,742
Universities Public 119 16 11 106,410 13,737 7,614 3,790 Private 68 15 12 36,682 7,551 4,647 2,950
Four-year colleges Public 382 83 68 111,140 22,163 13,552 9,930 All Private 891 153 137 71,241 18,731 12,880 9,359
Nonsectarian 378 75 55 31,559 9,517 6,001 3,899 Catholic 166 29 28 17,166 3,870 2,805 2,140 Protestant 347 59 54 22,566 5,344 4,074 3,320
Two-year colleges Public 902 56 51 86,264 9,579 4,810 3,406 Private 220 11 10 5,173 656 437 336
lIncludes respondents who were not classified as full-time undergraduate faculty. 2Pull-time undergraduate faculty only.
Survey Response The rate of response to the survey was quite high, exceeding that achieved in the 1989-90
survey. Of the 72,417 questionnaires mailed out, usable returns were eventually received from
43,940, constituting a 61 percent response which compares favorably to the 55 percent response
rate achieved in the 1989-90 faculty survey (see Astin, Korn, & Dey, 1991). We believe that there
are several factors that may have contributed to the high response rate. First of all, the
questionnaire addresses a wide range of issues of concern to faculty members and the faculty
member's institution (faculty respondents were told that their institution would receive a profile of
faculty responses to each item). And even though the questionnaire contained nearly 200
questions, it was limited to only four pages (see Appendix A) and required a minimal amount of
reading coupled with a maximum amount of responding. Finally, the response rate was
3

substantially increased by the fact that a second wave of questionnaires was sent to nonrespondents
approximately four weeks after the first wave was sent.
Since it was necessary to identify each questionnaire recipient in order to be able to follow
up on nonrespondents with a second wave of survey instruments, we decided to imprint the faculty
member's name and address directly on the questionnaire (a procedure used in the earlier survey).
Although it may have been preferable to use a code number rather than the name and address, we
wanted there to be no ambiguity in the respondent's mind as to the fact that he or she was being
identified. We hoped that any concerns about confidentiality raised by printing the name and
address directly on the questionnaire would be mitigated to some extent by the fact that the
completed questionnaires were returned to a commercial processing center (and then to us at the
Higher Education Research Institute) rather than to the institution. This procedure ensured that
there would be no way for the responses of any individual faculty member to be known to the
institution.
In spite of these hopes and precautions, we received a good deal of critical mail from some
of those surveyed. While many of the critical comments focused on particular survey questions, by
far the most common complaint concerned the imprinting of the name and address. While there is
no way to know for sure how the normative figures have been affected by these concerns about
privacy, it should be emphasized that the number of critical letters received (approximately 300) is
really quite small, given that 72,417 surveys were mailed out, and given that we were surveying
college and university faculty who pride themselves on their critical skills.
Defining Faculty Groups
As already noted, only those full-time employees who were engaged in teaching
undergraduates were included in the normative data reported here. Full-time administrators, fu11-
time researchers, or faculty members who teach ~ at the postgraduate level have been excluded.
More specifically, a respondent was included in the normative data in one of three ways:
1) if he or she indicated full-time employment at an institution [question 2] .a.wl noted teaching
as his/her principal activity [question 1] .a.wl either
a) taught at least one undergraduate-level course [question 17] m: b) taught no classes at all in the most recent term (this last condition is included for
faculty on sabbatical leave or those currently engaged in research full-time).
2) if he or she indicated full-time employment at an institution [question 2] .a.wl taught at least
two courses in the last term [question 17], at least one of which was at the undergraduate
level.
4

3) if he or she indicated full-time employment at an institution [question 2].awI indicated that
he/she spent at least 9 hours per week in scheduled teaching [question 16], but did not
indicate any specific types of courses being taught [question 17].
Results Complete results of the faculty survey, reported separately for all faculty, men faculty, and
women faculty are provided later in this report. In this section we have abstracted highlights of
these results for discussion and interpretation. Results will be presented under six headings:
background characteristics, professional and personal goals, teaching and research environment,
teaching goals and practices, job satisfaction and stress, and perceptions of the institution.
Background Characteristics Demographic and background characteristics of the faculty are shown in Table 2. The
much-dis!;':ussed aging of American college and university faculty is clearly demonstrated by the
results: one-fourth of all faculty are 55 or older, and 6 out of 10 are 45 or older. By way of
contrast, only one faculty member in ten is younger than 35. Nearly 6 out of 10 college teachers
have been at their current institutions for 10 years or longer, and over one-fifth have been at their
current institution for twenty-two years or longer. Private institutions are slightly more likely to
have recently--hired faculty than are public institutions. This latter rmding is further reflected in the
fact that more professors in public than private institutions are tenured.
The doctorate is held by the great majority (over 80 percent) of university faculty and
almost two-thirds of faculty at four-year colleges, while Master's degrees predominate at two
year colleges. While the difference in degree attainment is substantial among institutional types, it
is negligible between public and private institutions of the same type.
The different types of institutions show wide variation in terms of their ability to attract and
retain women faculty. Both public and private universities have the fewest women faculty, with the
percentages of women faculty at two-year colleges being almost double that of the universities.
The salary data reported in Table 3 are largely consistent with the overall levels of
experience and education found at the different types of institutions. The faculty at private
universities have the highest median salaries ($50,000 for those on nine and ten month contracts),
as compared with a median salary of $42,000 for faculty at public universities. The median salaries
at four-year colleges are roughly equivalent regardless of control. while the median salary at public
two-year colleges is about 20 percent higher than it is at private two-year colleges.
If we look at the variability in faculty salaries, we find that nearly one-third of the faculty at
private universities make $60.000 or more per year, compared to 17 percent in the public
5

universities, less than ten percent in four-year colleges and less than five percent in two-year
colleges. At the same time, private universities have the fewest faculty members (5 percent) making
less than $30,000. By way of comparison, nearly 40 percent of the private two-year college
faculty make less than $30,000.
Table 2 Background characteristics of. teachinc..f.aculty ~ institutional !J:e.e (percentaees)
Four-year Two-year Universitis::~ "Qll~ges "Qlle~~
Background characteristics All Public Private Public Private Public Private
Age Less than 35 10 11 10 10 12 8 19 35-44 29 29 29 28 32 28 35 45-54 36 32 34 37 34 43 30 55 or more 25 28 28 25 23 21 17
Year Hired by Current Institution Before 1970 21 23 24 21 19 20 9 Between 1970 and 1984 38 37 36 37 35 43 31 Since 1984 41 39 40 42 46 37 60
Tenured 58 63 60 57 48 61 24
Highest Degree HeidI Bachelor's 3 1 1 2 2 9 10 Master's 29 14 11 25 26 63 53 Doctorate 59 80 83 66 64 12 21
Gender Women 31 24 23 31 33 42 48
1 Figures may not add to 100% because 'other' (e.g., professional) degrees are not included.
Table 3 Faculty salaries by institutional type
TyPe of Institution
Private universities
Public universities
Public four-year colleges
Private four-year colleges
Public two-year colleges
Median Salary (in $1,000)
50
42
39
38
36
Percentage making $60,000 Less than or more $30,000
31
17
7
8
5 Private two-year colleges 30 0
5 10
16
18
21
39 Note: Salary figures based on those faculty with 9 and 10 month contracts only.
6

Professional and Personal Goals Table 4 shows the percentages of faculty members who rate various professional goals as
either 'essential' or 'very important.' Practically every faculty member (99 percent) rates 'be a
good teacher' as a very important goal. Next in line is 'be a good colleague' (84 percent), followed
distantly by 'engage in research' (56 percent). As would be expected, professors in universities are
much more likely to give a high priority to research (76-77 percent) compared to professors in
two-year colleges (21-35 percent). It is interesting to note, however, that university faculty are
now less likely to endorse research as a high priority than they were in the previous survey
(dropping from 79 to 76 percent in public universities and from 85 to 77 percent in private
universities; see Table 4 in Astin, Korn, & Dey, 1991). It may be that the increased emphasis
being placed on undergraduate education is starting to affect the priority faculty place on research.
Professors in universities give lower priority than professors in other types of institutions
to good colleagueship, providing services to the community, participating in committee or
administrative work, and-perhaps surprisingly-engaging in outside activities. It would thus
appear that the high priority given research by professors in universities causes them to give lower
priority to practically all other major professional goals (with the exception of teaching).
Table 4 Professional goals of teaching faculty by institutional type (percentages)
Four-year Two-year Universitik~ ~lleges kQIleges
Rated 'Essential' or 'Very important' AD Public Private Public Private Public Private
Be a good teacher 99 98 99 99 99 100 98
Be a good colleague 84 81 83 84 86 88 91
Engage in research 56 77 76 57 55 21 35
Engage in outside activities 52 49 47 53 54 53 60
Provide services to the community 43 37 37 45 43 49 52
Participate in committee or administrative work 30 23 24 33 31 36 42
Faculty were also asked to rate the importance of ten 'life goals.' The relative importance
faculty place on these values is shown in Table 5, along with the responses of freshmen who
entered college in 1992. The gender differences shown among the personal goals of faculty are
quite enlightening. For example, there are only trivial differences between the goals held by men
and women faculty when it comes to goals directly related to the academic profession (becoming an
authority, obtaining recognition from colleagues). There are, however, large and consistent
7

gender-based differences in the other values, with women faculty being more likely to endorse
altruistic (helping others in difficulty, helping to promote racial understanding, helping with
environmental cleanup) and social action goals (influencing social values, influencing the political
structure). Men, on the other hand, are more likely to endorse 'being very well-off financially' and
'raising a family' as life goals.
One of the largest gender gaps is found with the goal of raising a family. It is interesting to
note that these differences are clearly reflected in the behavior of faculty. Nearly twice as many
women faculty have either never married (17 percent versus 8 percent of the men) or been divorced
(13 percent versus 6 percent of the men). Women faculty are also much less likely to have children:
Nearly 82 percent of the male faculty have at least one child, compared to 69 percent of the
women. These figures clearly suggest that the social norms related to the role of women in
American society continue to have differential effects on the personal choices of both men and
women faculty.
The data on personal goals also suggest a substantial gap between the values of incoming
students and faculty. The life goal that received the highest level of endorsement by the faculty (80
percent rated it as 'essential 'or 'very important')- developing a meaningful philosophy of life -
is endorsed by less than one-half of the entering freshmen (46 percent). Faculty are also far more
likely than entering freshmen are to support the goal of 'helping to promote racial understanding'
(64 versus 42 percent, respectively). Conversely, the goal of 'being very well-off financially" is
endorsed by 73 percent of the entering freshmen-the highest rate of support given to any of the
19 goals they were asked to consider-as opposed to only 37 percent of the faculty. While
differences between faculty and freshmen goals are smaller for the other values considered, faculty
are more likely to endorse 'helping' goals, while entering freshmen are more likely to endorse
goals related to power, influence, and status.
These value differences are probably attributable to both generational (or cohort) and
selection effects. More than half of the current faculty probably entered college as freshmen during
the mid- to late-1960s when freshman endorsement of material goals was much lower and
endorsement of intellectual goals was much higher (see the top panel of Table 6). The generational
explanation would suggest that those who come of age in a certain era tend to carry those values
with them into later life, regardless of value changes in the larger social environment. At the same
time, however, it is important to note that these value differences also seem to be attributable to a
selection effect. As indicated by the bottom panel of Table 6, an entering freshman who aspires to a
career as a college professor is more likely to endorse intellectual goals, and less likely to endorse
material values, than the average student. Regardless of the explanation for these differences, they
may help explain the difficulty that some campuses may have in attempting to develop a cohesive
campus community.
8

Table 5 Personal goals offaculty by gencier (percentages)
Facultt 1992 College Rated 'Essential' or 'Very important' All Men Women Freshmen
Developing a meaningful philosophy of life 80 79 83 46
Raising a family 74 78 66 71
Helping others who are in difficulty 68 65 75 63
Helping to promote racial understanding 64 61 70 42
Becoming an authority in my field 62 62 61 69
Obtaining recognition from my colleagues for contributions to my special field 48 48 48 55
Influencing social values 45 40 55 43
Becoming involved in programs to clean up the environment 41 39 47 34
Being very well-off financially 37 38 33 73
Influencins the political structure 18 17 22 20 Note: Student data are from Dey, Astin, Kom, & Riggs (1992).
Table 6 Selected personal goals of college freshmen (percentases)
Colle~ freshmen in
Rated 'Essential' or 'Very important' 1972 1982 1992
All college freshmen
Developing a meaningful philosophy of life
Being very well-off financially
71
41
College freshmen aspiring to careers as college professors
Developing a meaningful philosophy of life 80
47
69
68
46
73
68
Beins very well-off financially 34 45 47 Note: Student data are from Dey, Astin, & Kom (1991), Dey, Astin, Kom, & Riggs (1992). and unpublished
tabulations.
9

Teaching and Research Environment
Given the continuing controversy over the relative priorities assigned to research and
teaching, it is useful to determine how faculty members approach these two very important
functions. Table 7 shows results from two questions relating to this issue. In the fIrst set of
questions, faculty members were asked to indicate their 'principal activity.' Given how we defined
'teaching faculty' (see above), it is not surprising that almost all (92 percent) of college faculty say
that teaching is their principal activity; research and administration are identified as principal
activities by only three and four percent, respectively, of college faculty. As would be expected,
the percentages giving research as their principal activity are highest in universities (and especially
high in public universities). Virtually no faculty members in the two-year colleges identified
research as their principal activity.
A different picture emerges, however, when we inquire about faculty interests. Faculty
members were asked to indicate their relative degree of interest in teaching versus research along a
four point scale ranging from 'very heavily in teaching' to 'very heavily in research.' About one
quarter (24 percent) of all faculty members indicate that their interest either 'leans' more toward
research than teaching or is 'very heavily' in research. In the public universities this figure is nearly
half (45 percent), while in the private universities 39 percent prefer research over teaching.
Taken together, these percentages underscore the conflict between teaching and research:
Even though nine faculty in ten identify their principal job activity as teaching, almost one-quarter
admit to having a greater interest in research. These discrepancies between job responsibilities and
personal preferences are largest in the universities, but they exist at all institutional types.
Table 7 Principal activity and primary interests of teaching faculty by institutional type (percentages)
Four-year Two-year Universities colleges colleg~s
AIl Public Private Public Private Public Private
Principal activity Teaching 92 84 94 94 95 96 91 Research 3 11 3 I 1 0 0 Administration 4 4 3 4 3 3 7 Services to clients and 'Other' 1 1 1 1 1 2 2
Primary interest Very heavily in teaching 39 18 19 37 39 74 61 Leaning toward teaching 38 38 43 44 44 22 33 Leaning toward research 21 39 34 18 15 3 5 V ery heavily in research 3 6 5 2 1 0 1
10

If there is a conflict between responsibilities and interests, how is it reflected in the amount
of time spent in teaching and research? Table 8 shows the amount of time spent teaching classes
broken down by institutional type. University-based teaching faculty spend the least time teaching
classes, whereas faculty in the two-year colleges spend by far the most time. Indeed, more than
three-fourths of the community college faculty (80 percent) teach more than twelve hours of
classes per week, contrasted with only about one-third of the four-year college faculty and about
twelve percent of the university faculty.
The opposite pattern can be observed for time spent doing research. More than half of the
two-year college faculty spend .llQ time in research, compared to less than one-fourth of the four
year college faculty and only about eight percent of the university faculty. (It is probably the case
that this latter group consists mainly of administrators and lecturers.) By contrast, between one
quarter and one-half of the university faculty spend more than twelve hours per week doing
research, compared to about one in ten of the four-year college faculty and about two percent of
the two-year college faculty.
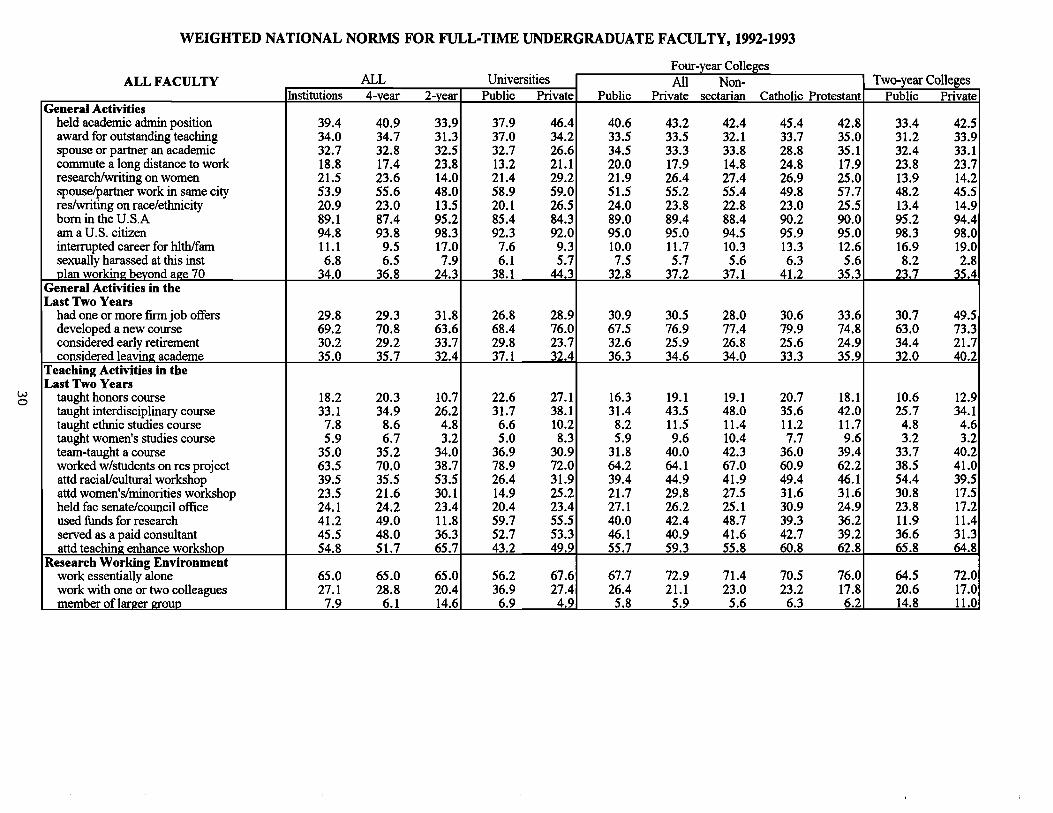
Teaching and research activities of faculty also vary by institutional type. Nearly 7 out of
10 faculty developed a new course in the past two years (69 percent), while over one-half
participated in a teaching enhancement workshop (55 percent). New course development is about
equally distributed across different types of institutions, although it is somewhat more likely to
happen at private institutions regardless of type. Participation in teaching effectiveness workshops,
on the other hand, is highest at institutions with a strong teaching focus: Nearly two-thirds of two
year college faculty participated in teaching effectiveness workshops, compared with less than
one-half of the university faculty. Interdisciplinary courses are more likely to have been taught in
private institutions. with this focus being especially high at private four-year colleges.
Although it is not too surprising to find that university faculty are the most likely to have
had research funding or to have worked with students on research projects, the pattern of
differences between these two activities is telling. For example, university faculty are about twice
as likely as two-year college faculty to have worked with students on research projects while being
about 5 times as likely to have received research funding. This suggests that research and other
scholarly activities at universities may be driven much more by funding opportunities than at other
types of institutions, where these activities may be more closely linked to other activities such as
teaching. The research environment also differs in terms of interaction with colleagues: University
faculty are more likely than faculty at other types of institutions to be working on research with one
or two colleagues, whereas two-year college faculty are more likely to be part of a larger group of
collaborators. Despite these patterns, working alone is the predominant mode of conducting
research at all types of institutions.
11

Table 8 Teaching and research activities by institutional type (percentages)
Four-year Two-year Universities ~Qll~ges cQll~g~!i
Activities All Public Private Public Private Public Private
Hours per week spent in scheduled teaching
Less than 9 30 57 56 19 23 8 13 More than 12 36 14 10 32 32 80 62
Hours per week spent doing research
None 24 8 8 19 23 59 53 1-4 32 22 25 39 41 30 35 More than 12 16 34 28 11 8 2 2
Teaching-related activities in the past two years
Developed a new course 69 68 76 68 77 63 73 Participated in a teaching
enhancement workshop 55 43 50 56 59 66 65 Te~taughtacourse 35 37 31 32 40 34 40 Taught interdisciplinary course 33 32 38 31 44 26 34 Taught an honors course 18 23 27 16 19 11 13
Research-related activities in the past two years
Worked with students on a research project 64 79 72 64 64 39 41
Used intra- or extramural funds for research 41 60 56 40 42 12 11
Current arrangements for research/scholarly endeavors
Essentially working alone 65 56 68 68 73 65 72 Working with one
or two colleagues 27 37 27 26 21 21 17 Member of a larger group 8 7 5 6 6 15 11
12
Teaching Goals and Practices
What kinds of goals do faculty have for their undergraduate students? Table 9 shows the
percen tages of faculty who rate various student developmental goals ~s either 'essential' or 'very
important.' Developing the 'ability to think clearly' is a near-universal goal for college faculty in all
types of institutions (99 percent). Faculty are also quite strong and consistent in wanting to
increase the 'desire and ability to undertake self-directed learning' (92 percent). Preparing students
for employment after college (68 percent) is the next most important goal for undergraduates
endorsed by faculty, followed closely by enhancing students' self-understanding (66 percent),
helping students develop personal values (62 percent), developing moral character (57 percent),
and preparing students for graduate or advanced education (55 percent). Less than one-third
endorsed the centrality of the classic works of Western civilization as an 'essential' or 'very
important' goal for undergraduates (29 percent), while only one in 5 endorsed preparing students
for family living (20 percent).
Generally speaking, faculty who teach in universities give lower priority than do faculty in
all the other types of institutions to goals other than developing the ability to think clearly. Faculty
in all three types of public institutions-universities, four-year colleges, and community
colleges-give somewhat higher priority to preparing students for employment after college than
do their counterparts in the private institutions. Faculty in private four-year colleges give relatively
high priority to most of the outcomes considered with the exception of employment. Faculty at
two-year colleges are the most likely to endorse employment preparation as an outcome, but they
are also relatively likely to endorse affective outcomes as well.
What methods do faculty use to help implement these goals for undergraduates? Table 10
shows faculty preferences for different instructional methods. Overall, the most frequently used
method is the class discussion (used in 'all' or 'most' courses by 70 percent of the faculty).
followed by 'extensive lecturing' (used by 54 percent of the faculty in all or most courses). All
other methods are used regularly by only small minorities of faculty members. Somewhat
surprisingly, there are few differences by type of institution in faculty preference for particular
instructional methods. Professors in universities show the greatest propensity toward extensive
lecturing, while faculty in private four-year colleges do the least lecturing. And, as would be
expected. faculty in the universities are by far the most likely to use teaching assistants in their
courses. With these exceptions, the faculty in different types of institutions use very similar
pedagogical approaches.
13

institutional ., x
Four-year Two-year Universities colleges colleges
"Very Important" or "Essential" Goals All Public Private Public Private Public Private
Develop ability to think clearly 99 99 99 99 100 99 99
Increase desire and ability to undertake self-directed learning 92 92 90 93 94 92 92
Prepare students for employment after college 68 64 53 71 64 79 81
Enhance students' self-understanding 66 57 63 68 71 72 77
Help students develop personal values 62 51 61 62 70 67 82
.... Develop moral character 57 46 58 57 65 62 81 ~
Prepare students for graduate or advanced education 55 55 55 57 61 49 48
Enhance the out-of-class experience of students 44 38 37 46 46 48 59
Provide for students' emotional development 40 30 35 40 45 48 62
Teach students the classic works of Western civilization 29 27 37 31 35 21 26
Prepare students for family living 20 12 17 20 22 26 34

Despite this similarity across institutional type, it is interesting to note that there are rather
substantial gender differences in teaching methods. Women faculty, for example, are about twice
as likely as men to use cooperative learning (49 versus 25 percent). In fact, women are more likely
to use nearly all of the teaching techniques considered with the exception of extensive lecturing and
teaching assistants. It appears that women not only have a wider pedagogical repertoire, but they
are also more likely to use nontraditional teaching methods.
Table 10 InstructiofUll methods used by teaching/acuity by institutional type (percentages)
Four-year Twtryear Allfacul~ :UniYClSi1i~s ~ll~gcs colleges
U sed in 'all' or 'mose courses All Men Women Public Private Public Private Public Private
Class discussions 70 66 77 63 74 71 74 71 73
Extensive lecturing 54 59 41 63 56 51 47 51 56
Independent projects 37 34 44 38 41 38 40 32 41
Cooperative leaming 33 25 49 26 31 34 37 36 33
Group projects 21 18 27 20 23 22 23 18 22
Recitals or demonstrations 20 19 23 19 18 21 19 22 25
Experiential learning/field studies 20 16 27 18 20 21 22 20 22
Student-developed activities 17 16 20 17 15 19 16 18 20
Computer/machine aided instruction 16 14 20 12 13 16 14 24 21
Readings on racial/ethnic issues 15 11 24 13 20 15 18 14 13
Readings on women/gender issues 14 10 24 13 20 13 18 12 11
Multiple drafts of written work 14 11 20 10 18 15 17 13 16
Student-selected topics 10 8 14 9 10 11 11 9 12
Teaching assistants 8 9 6 16 15 4 5 2 3
15

Job Satisfaction and Stress Table 11 shows how satisfied faculty are with various aspects of their work. In overall job
satisfaction, 70 percent of the faculty reported being 'satisfied' or 'very satisfied: with faculty at
public two-year colleges reporting the highest overall level of satisfaction. Of the various aspects
of their working lives, 'autonomy and independence' produces the highest level of satisfaction (83
percent). This shows the importance that most faculty place on maintaining freedom and flexibility
in their work lives. Undergraduate (78 percent) and graduate (71 percent) course assignments, and
job security (71 percent) are also generally satisfying. The least satisfying areas for faculty
included job visibility (39 percent), student quality (39 percent). and salary and fringe benefits (41 percent). with slightly more satisfaction being reported for scholarly opportunities (45 percent).
teaching load (52 percent), and relationships with administrators (54 percent).
Table 11 Job satisfaction by institutional type (percentages)
Four-year Two-year Universities colleges colleges
'Very satisfied' or'satisfied' All Public Private Public Private Public Private
Overall job satisfaction 70 65 72 67 72 77 72 Autonomy and independence 83 84 86 80 85 82 78 Undergraduate course assignments 78 77 78 76 80 80 75 Professional relationships
with other faculty 72 67 70 71 75 77 80 Graduate course assignments 71 74 74 68 70 49 50 Job security 71 70 71 69 68 76 65 Competency of colleagues 67 63 70 65 72 70 74 Working conditions 66 67 75 63 67 64 61 Social relationships
with other faculty 61 55 61 60 62 66 72 Relationships with administration 54 50 54 54 57 54 60
Teaching load 52 60 58 47 48 49 46 Opportunity for scholarly pursuits 45 52 52 38 42 44 37 Salary and fringe benefits 41 32 50 38 43 50 42 Quality of students 39 37 59 38 47 31 30
Visibility for jobs at other institutions/organizations 39 41 46 35 38 39 38
Note: Respondents marking 'not applicable' excluded from these tabulations.
16

Satisfaction with colleagues was measured along several different dimensions. Overall,
faculty are most satisfied with their professional relationships with other faculty (72 percent),
followed by satisfaction with the competency of their colleagues (67 percent) and social
relationships with other faculty (61 percent). Faculty at public institutions are slightly less satisfied
than faculty at private institutions with their professional relationships with other faculty and with
their colleagues' competence.
Faculty were also asked to rank the degree of stress they felt from certain aspects of their
work and personal life (see Table 12). Overall, 34 percent of faculty reported 'extreme' stress in
the past two years. Women faculty are more likely than men to report extreme stress (46 versus 29
percent), while men are nearly three times as likely to report little stress in the past two years (16
versus 6 percent for women). The highest stress levels for both men and women faculty is reported
at universities and four-year colleges (although women consistently report higher stress in all types
of institutions).
The individual sources of stress most commonly reported was time pressures (85 percent)
and lack of personal time (81 percent). Other common sources of stress included teaching load (68
percent), institutional red tape (68 percent), and managing household responsibilities (66 percent).
The biggest gender-based difference in sources of stress is related to subtle discrimination (39
percent of the women reported this to have been a source of stress, compared to 20 percent of the
men). Taken together, these percentages point to high levels of conflict between personal, home,
and professional duties. Given prevailing social norms, it is not surprising that women faculty
report more stress in virtually all of the individual sources considered. The gender differences in
the amount and kinds of stress appear to be pervasive and clearly need to be addressed.
17

Table 12 Sources o//aculty stress by institutional type and gender (percentages)
All facyltx . Pour-year Two-year All Men Women Universities colle~ colleses
Level 0/ stress in past two years
Extreme stress 34 29 46 35 34 33 Little stress 13 16 6 13 13 13
Sources 0/ stress
Time pressures 85 81 92 85 84 84
Lack of personal time 81 76 91 80 81 81
Teaching load 68 64 75 62 70 72
Institutional 'red tape' 68 69 68 69 68 67
Managing household responsibilities 66 61 76 63 65 73
Personal finances 61 59 63 59 61 62
Students 57 53 64 52 56 65
Colleagues 56 54 61 58 56 53
Committee work 54 52 60 54 54 55
Research or publishing demands 50 50 49 72 51 12
Faculty meetings 48 46 51 47 48 49
Review/promotion process 44 42 51 47 45 38
My physical health 40 38 46 39 40 44
Children's problems 33 33 35 31 32 40
Child care 33 31 35 31 32 36
Subtle discrimination 26 20 39 26 28 23
Care of elderly parent 26 25 29 25 25 30
Marital friction 25 26 24 25 24 27 Note: Sources of stress rated by faculty as 'extensive' or 'somewhat.'
18

Perceptions of the Institution
Table 13 shows the priorities that faculty see as being among the most important at their
institution. Note that these are not the personal priorities of the faculty, rather, they are institutional
priorities as perceived by the faculty. The goals of promoting students' intellectual development
(79 percent) and increasing or maintaining institutional prestige (69 percent) were considered to be
the highest priorities among all the faculty surveyed. Enhancing the institution's national image (58
percent), helping students examine their own personal values (52 percent), recruiting more
minority students (52 percent), and 'creating a diverse multi-cultural campus environment' (51
percent) are all noted by a majority of the faculty as being 'high' or 'highest' in priority.
Table 13 Perceived institutionall2.riorities by institutional !lE.e (percentages)
Four-year Two-year 'Highest' or 'High' Universi1i~s cQlle~s ~olle~s institutional Erioritl: All Public Private Public Private Public Private
Promote students' intellectual development 79 74 85 78 86 80 83
Increase or maintain institutional prestige 69 73 77 65 70 64 72
Enhance institution's national image 58 72 77 52 62 36 46
Help students examine and understand their personal values 52 34 70 48 72 53 73
Recruit more minority students 52 54 53 54 53 46 34
Create a diverse multi-cultural campus environment 51 46 58 51 54 52 36
Develop a sense of community among students and faculty 48 33 53 47 63 51 64
Hire more minority faculty and administrators 47 47 44 52 42 45 24
Develop leadership ability among students 44 32 48 45 54 44 57
Hire more women faculty and administrators 42 45 45 45 40 38 23
Promote student involvement in community service activities 31 18 53 28 45 29 39
Help students leam how to bring about change in American society 28 19 38 29 34 28 33
Hire faculty 'stars' 20 36 27 16 13 11 16
19

It is also clear that faculty tend not to perceive their institutions as having a very strong
commitment to impacting the larger community. Of the priorities considered in the survey,
'promoting student involvement in community service activities' (31 percent) and 'helping students
learn how to bring about change in American society' (28 percent) are near the bottom of the list in
terms of how faculty view their institution's commitment to this area.
Universities are most likely to be seen as giving high priority to resource and reputational
goals, while goals related to student development and campus community are most closely
associated with community colleges. Goals related to the topic of diversity are about equally as
high at universities and four-year colleges.
Faculty were also asked to report their perceptions of the campus climate at their institutions
(Table 14). The two statements reflecting the highest level of agreement are perceptions regarding
the treatment of faculty from underrepresented groups: Nearly 86 percent think faculty of color are
treated fairly, while a slightly lower percentage think that women faculty are treated fairly (82
percent). While this suggests that there is a general perception of fairness and equity, it is important
to consider the views of minority and women faculty. For example. 72 percent of the minority
faculty (as compared to 88 percent of the white faculty) thought faculty of color are treated fairly,
while 68 percent of the women (compared with 88 of the men) think that women faculty are treated
fairly. While a majority of all groups believe that underrepresented faculty are treated fairly, there is
still a substantial gap between the way underrepresented faculty view this issue as compared to
majority-group faculty. These perceptual gaps may help explain some of the friction associated
with programs designed to enhance equity.
The perceptions with the lowest percentage of agreement include trust between minority
student groups and administrators (37 percent), availability of courses with feminist perspectives
(32 percent), respect between people on campus (31 percent). and that there is a lot of campus
racial conflict at their institution (14 percent). In general, faculty at public universities indicate
lower percentages of agreement, as compared to the overall percentages, for all items. However,
faculty at these public universities are almost twice as likely to report that 'there is a lot of campus
racial conflict here' (23 percent compared to the overall number of only 14 percent). Also, faculty
at public universities are also more likely to report that 'there is little trust between minority student
groups and campus administrators' (48 percent compared to the overall figure of 37 percent).
Although faculty at public universities report more conflict in the area of race/ethnic relations,
research on students shows that there is little difference between public and private universities in
this regard (Hurtado, 1992).
20

institutional ra _0 x
Four-year Two-year Universities colleges ~llee:es
Agree 'strons:lt or 'somewhat' All Public Private Public Private Public Private
Faculty of color are treated fairly here 86 85 87 86 86 90 86 Women faculty are treated fairly here 82 78 83 80 84 85 86 Faculty are committed to welfare of the institution 82 73 87 78 89 87 89 Faculty are strongly interested in academic problems of undergraduates 80 65 84 79 91 88 93 Faculty are interested in students' personal problems 77 60 80 76 88 86 95 Most faculty here are sensitive to the issues of minorities 73 68 75 72 77 77 78 Administrators here act in good faith 64 59 66 63 71 66 76 Student affairs staff have the support and respect of faculty 60 57 63 57 65 61 67
N I-' Many courses include minority group perspectives 40 35 40 42 43 42 35
There is little trust between minority student groups and campus administrators 37 48 37 37 34 28 22
Many courses include feminist perspectives 32 31 37 30 37 28 19 People here don't treat each other with enough respect 31 35 25 34 28 30 24 Faculty feel that most students are weU-prepared academically 25 22 51 23 33 15 20 There is a lot of campus racial conflict here 14 23 10 14 11 9 6

References
Astin, A.W., Korn, W.S., & Dey, E.L. (1991). The American colleae teacher; National nonus for the 1989-90 fIERI faculty survey. Los Angeles; Higher Education Research Institute.
Dey, E.L., Astin, A.W., & Korn, W.S. (1991). The American freshman; Twenty-fiye year ~. Los Angeles; Higher Education Research Institute.
Dey, E.L., Astin, A.W., Korn, W.S., & Riggs, E.R. (1992). Th~ American freshman; National nonus for Fall 1992. Los Angeles; Higher Education Research Institute.
Hurtado, S. (1992). The campus racial climate: Contexts of conflict. Journal of Hiaher Education, Ql(5),539-569.
22

National Normative Data for
the 1992-93 HERI Faculty Survey
23


'" lJl
WEIGHTED NATIONAL NORMS FOR FULL-TIME UNDERGRADUATE FACULTY, 1992-1993
Four-vear Coli - -
ALL FACULTY ALL Universities All Non-Institutions 4-vear 2-vear Public Private Public Private sectarian Catholic Protestant
Number of Resoondents 29771 26029 3742 3790 2950 9930 9359 3899 2140 3320 Age as of December 31, 199%
less than 30 2.2 2.1 2.5 2.0 1.7 2.3 2.2 1.8 1.8 3.0 30 to 34 8.0 8.5 6.0 9.1 8.0 7.6 9.3 10.3 8.4 8.5 35 to 39 12.5 13.0 10.5 13.9 12.2 11.6 14.4 14.4 11.8 15.9 40 to 44 16.3 16.0 17.5 14.9 17.0 16.1 17.1 16.5 18.9 16.9 45 to 49 18.3 17.2 22.5 15.8 18.4 18.0 17.2 17.9 16.3 16.8 50 to 54 17.9 17.3 20.1 16.5 15.1 19.4 16.3 15.3 15.8 17.8 55 to 59 13.1 13.3 12.4 14.3 10.5 14.2 11.6 11.6 12.2 11.4 60 to 64 8.5 9.2 6.1 10.0 10.7 8.4 8.4 9.1 8.7 7.5 65 to 69 2.6 2.9 1.7 3.0 5.3 2.0 2.9 2.7 4.9 2.0 70 or more 0.6 0.5 0.6 0.4 1.0 0.6 0.4 0.4 1.1 0.2
Academic Rank professor 32.3 33.6 28.0 37.7 35.1 31.1 30.5 34.0 22.8 30.3 associate professor 25.9 27.5 20.0 28.2 29.7 26.2 27.6 27.6 3Ll 25.7 assistant professor 26.4 28.8 18.0 26.5 27.7 29.2 32.2 29.4 36.3 33.3 lecturer 2.5 2.9 0.9 3.0 3.3 3.7 1.2 1.5 1.0 1.1 instructor 11.8 6.5 30.6 4.3 3.2 9.0 7.5 6.1 7.8 9.1 other 1.1 0.7 2.5 0.4 1.0 0.8 1.0 1.4 1.0 0.5
Administrative Title not applicable 76.7 76.7 76.7 80.6 79.9 76.3 69.7 73.1 69.6 65.5 director or coordinator 9.7 10.1 8.3 10.6 9.4 10.1 9.8 8.7 11.2 10.4 department chair 8.9 8.3 11.0 3.5 6.5 8.8 15.6 13.4 14.3 19.1 dean 0.2 0.3 0.1 0.1 0.0 0.4 0.5 0.2 0.5 0.7 associate or assistant dean 0.4 0.5 0.2 0.5 0.8 0.5 0.4 0.4 0.3 0.4 vice-pres, provost, vice-chanc 0.1 0.1 0.1 0.1 0.0 0.0 0.1 0.2 0.1 0.0 president, chancellor 0.0 0.0 0.0 0.0 0.0 0.0 0.0 0.0 0.1 0.0 other 4.0 4.1 3.7 4.7 3.4 3.8 3.9 3.9 3.8 3.9
Principal Activity administration 3.5 3.7 3.0 3.9 2.5 4.0 3.4 3.1 3.7 3.6 teaching 91.9 90.9 95.3 83.8 93.5 94.2 94.9 95.0 95.3 94.7 research 3.4 4.3 0.0 10.9 3.3 0.8 0.5 0.9 0.2 0.3 services to clients and patients 0.6 0.5 0.9 0.8 0.2 0.4 0.4 0.5 0.4 0.5 other 0.6 0.6 0.7 0.6 0.4 0.6 0.7 0.6 0.5 0.9
Racial Background (1) White/Caucasian 91.5 90.5 95.0 91.9 92.2 87.7 91.8 93.0 94.7 88.7 African AmericanlBlack 3.4 3.6 2.4 2.0 1.5 6.3 3.1 1.5 1.0 6.3 American Indian 1.3 1.3 1.3 1.3 0.6 1.7 0.9 1.0 0.7 0.9 Asian American/Asian 3.6 4.2 1.3 5.0 4.2 4.0 3.4 3.6 3.0 3.3 Mexican American/Chicano 0.5 0.5 0.4 0.5 0.7 0.5 0.4 0.5 0.2 0.3 Puerto Rican 0.2 0.2 0.3 0.2 0.1 0.4 0.2 0.2 0.2 0.2 other Latino 1.0 1.0 0.8 0.9 2.2 1.0 0.9 1.3 0.9 0.4 other 1.4 1.3 1.4 1.5 1.6 1.5 1.7 1.1 1.4
(I) Percentages will swn to more than 100 if any respondents checked more than one category.
Two-year Colleges Public Private 3406 336
2.3 5.0 5.6 13.5
10.0 18.2 17.6 16.3 22.9 17.1 20.5 13.0 12.5 10.4 6.3 4.2 1.7 1.8 0.6 0.3
28.5 18.8 20.1 17.7 17.6 26.1 0.9 0.7
30.4 33.7 2.5 3.0
77.6 62.6 8.1 ILl
10.6 18.3 0.0 0.8 0.2 0.0 0.0 0.7 0.0 0.0 3.5 6.5
2.8 6.7 95.6 91.1 0.0 0.0 0.8 1.3 0.7 0.8
94.8 96.8 2.4 2.0 1.4 0.6 1.4 0.0 0.4 1.1 0.3 0.0 0.8 0.2 1.3 0.0

N 0\
WEIGHTED NATIONAL NORMS FOR FULL-TIME UNDERGRADUATE FACULTY, 1992-1993
Four-year Colleges ALL FACULTY ALL Universities All Non-
Institutions 4-vear 2-vear Public Private Public Private sectarian Catholic Protestant Highest Degree Earned
bachelor's (B.A., B.S., etc.) 3.1 1.4 9.2 1.0 0.8 1.5 2.2 2.8 1.3 1.9 master's (M.A., M.S., etc.) 29.1 19.8 62.7 13.5 10.8 24.8 26.2 24.9 26.4 27.6 LL.B., J.D 0.7 0.6 0.9 0.4 1.1 0.6 0.5 0.5 0.9 0.4 M.D., D.D.S. (or equivalent) 0.4 0.4 0.3 1.0 0.0 0.2 0.1 0.1 0.1 0.2 other first professional 0.5 0.5 0.6 0.5 0.6 0.4 0.7 0.8 0.4 0.7 Ed.D 4.9 5.5 2.9 4.4 2.3 8.3 4.4 3.3 4.2 5.9 Ph.D 54.3 66.5 10.1 75.4 80.3 57.9 59.6 62.1 60.3 56.0 other degree 3.9 3.6 5.0 2.7 2.8 4.3 4.4 3.5 4.6 5.3 none 3.1 1.6 8.3 1.2 1.4 1.9 2.0 2.1 1.8 1.9
Field of Highest Degree (2) agriculture or forestry 1.5 1.7 0.9 3.9 0.3 0.9 0.4 0.2 0.1 0.8 biological sciences 5.8 5.9 5.4 6.7 5.1 5.6 5.6 5.4 5.3 5.9 business 6.5 5.9 8.4 4.8 7.0 6.0 7.1 5.9 10.8 6.6 education 15.5 13.5 22.7 10.3 4.9 19.4 13.3 10.7 13.1 16.4 engineering 4.9 5.3 3.7 9.5 4.3 3.5 2.3 4.1 1.8 0.3 English 6.8 6.2 8.8 4.5 7.0 6.8 7.6 6.9 8.4 8.0 health related 5.5 4.1 10.4 5.3 2.2 4.0 3.6 3.2 5.7 2.9 history or political science 6.0 6.9 2.8 5.3 12.3 6.7 7.0 7.7 6.4 6.4 humanities 7.8 8.9 3.5 7.4 15.5 5.8 12.8 12.1 13.9 13.0 fine arts 8.6 9.5 5.4 9.5 6.8 9.4 10.7 12.3 5.0 11.8 mathematics or statistics 5.8 5.7 6.3 5.8 5.3 6.0 5.5 5.3 5.5 5.6 physical sciences 7.4 8.1 4.9 9.3 7.8 7.6 7.5 8.5 6.1 7.0 social sciences 11.5 12.5 7.7 12.4 15.9 11.7 12.2 12.4 13.4 11.3 other technical 2.0 1.5 3.8 1.1 1.4 1.8 1.8 2.2 1.9 1.3 other non-technical 4.4 4.1 5.5 4.3 4.3 4.8 2.8 2.9 2.6 2.7
Year Highest Degree Earned 1954 or earlier 2.0 1.7 3.0 1.7 2.6 1.4 1.6 2.0 1.4 1.3 1955 to 1959 2.8 3.0 2.4 3.8 5.1 1.9 2.4 2.6 3.2 1.7 1960 to 1964 7.4 7.5 6.8 9.8 8.5 5.7 6.5 7.2 5.7 6.2 1965 to 1969 13.2 12.9 14.3 14.4 12.3 13.0 11.0 11.6 10.4 10.5 1970 to 1974 16.9 17.1 16.4 17.1 16.1 18.4 15.7 16.8 15.4 14.5 1975 to 1979 14.6 14.3 16.0 12.4 15.2 15.0 15.5 14.9 15.3 16.3 1980 to 1984 15.4 15.1 16.4 13.6 14.4 15.8 16.7 16.3 17.4 16.9 1985 to 1989 17.6 17.9 16.4 17.0 16.5 17.6 20.6 19.6 20.0 22.2 1990 to 1992 10.0 10.4 8.3 10.3 9.4 11.2 10.0 9.1 11.3 10.3
Degree Currently Working Toward bachelor's (B.A., B.S., etc.) 0.9 0.1 3.5 0.0 0.0 0.3 0.1 0.1 0.1 0.2 master's (M.A., M.S., etc.) 5.4 2.3 16.1 1.4 0.8 2.6 3.8 4.0 2.7 4.2 LL.B., J.D 0.2 0.2 0.1 0.1 0.7 0.2 0.2 0.1 0.2 0.2 M.D., D.D.S. (or equivalent) 0.2 0.1 0.6 0.0 0.3 0.2 0.1 0.1 0.1 0.2 other first professional 0.2 0.1 0.3 0.1 0.1 0.1 0.3 0.2 0.3 0.5 Ed.D 3.1 2.4 5.5 1.4 1.0 3.2 3.3 3.7 4.0 2.6 Ph.D 13.1 12.4 15.9 6.6 8.4 16.1 17.1 13.5 18.9 20.6 other degree 2.5 1.9 4.3 1.8 1.0 2.4 1.9 1.6 1.3 2.5 none 74.5 80.4 53.7 88.6 87.7 74.9 73.1 76.7 72.4 69.1
(2) Recategorization of this item from a longer list is shown in The American College Teacher
Two-year Colleges Public Private
9.2 9.5 63.3 53.1 0.9 2.1 0.2 1.0 0.7 0.3 2.8 3.4 9.6 17.8 4.9 7.5 8.5 5.4
1.0 0.0 5.2 7.9 8.2 11.3
22.7 22.0 3.9 1.0 8.8 8.2
10.3 11.8 2.7 4.0 3.2 7.9 5.3 6.5 6.4 4.2 5.1 2.0 7.8 5.9 3.9 2.1 5.5 5.1
3.1 1.8 2.4 1.8 7.0 2.1
14.6 10.2 16.7 11.3 16.1 15.0 16.3 18.9 15.9 24.8 7.9 14.3
3.6 1.6 16.0 18.2 0.1 0.5 0.6 0.5 0.3 0.5 5.6 3.5
15.5 21.6 4.2 5.7
54.1 47.7

N -....J
WEIGHTED NATIONAL NORMS FOR FULL-TIME UNDERGRADUATE FACULTY, 1992-1993
Four-year Colleges ALL FACULTY ALL Universities All Non-
Institutions 4-vear 2-vear Public Private Public Private sectarian Catholic Protestant Department of Current Faculty Appointment (2)
agriculture or forestry 1.9 2.2 0.8 5.2 0.2 1.2 0.2 0.2 0.0 0.3 biological sciences 5.5 5.5 5.6 5.8 4.9 5.4 5.6 5.1 5.3 6.3 business 8.5 7.7 11.4 5.7 10.1 8.0 9.2 7.5 14.1 8.5 education 9.0 9.8 6.0 7.9 3.4 14.4 9.0 6.9 9.1 11.6 engineering 4.7 5.1 3.2 10.0 4.3 2.6 2.1 4.0 1.5 0.1 English 7.9 7.0 11.1 5.2 8.3 7.6 8.3 7.6 8.9 8.7 health related 6.6 5.0 12.1 6.5 2.4 5.0 4.2 3.6 7.6 3.1 history or political science 5.4 6.3 1.8 5.1 11.3 5.8 6.4 6.8 5.8 6.2 hwnanities 7.4 8.5 3.5 6.5 14.7 5.5 13.1 12.5 14.2 13.3 fine arts 8.7 9.7 4.8 10.1 6.9 9.8 10.6 11.8 5.1 12.0 mathematics or statistics 6.4 5.9 8.1 5.4 5.4 6.5 6.2 5.5 5.5 7.3 physical sciences 7.2 7.8 4.9 8.5 7.0 7.7 7.4 8.2 6.2 6.9 social sciences 10.9 11.5 8.8 10.8 14.0 11.3 11.6 12.0 10.6 11.6 other technical 4.5 2.8 10.4 2.1 1.7 3.6 3.3 4.4 3.2 1.8 other non-technical 5.5 5.0 7.3 5.3 5.3 5.7 3.1 3.8 2.9 2.2
Year Appointed to Current Position
1954 or earlier 1.2 1.2 1.1 1.2 1.7 1.0 1.2 1.1 1.6 1.1 1955 to 1959 1.2 1.5 0.5 1.6 2.4 0.7 2.0 2.4 2.1 1.4 1960 to 1964 4.6 5.1 3.0 5.4 6.6 4.3 5.3 5.9 5.1 4.8 1965 to 1969 13.9 13.7 14.6 15.1 13.0 14.5 10.7 12.6 9.1 9.3 1970 to 1974 13.0 12.3 15.4 12.7 12.9 14.1 8.9 9.6 7.9 8.5 1975 to 1979 11.4 11.1 12.3 12.0 10.7 10.7 10.9 11.2 12.1 9.8 1980 to 1984 13.5 13.1 15.0 12.7 12.7 12.4 15.0 15.6 15.4 14.0 1985 to 1989 21.5 21.9 20.3 21.3 20.9 21.0 24.5 22.6 25.1 26.6 1990 to 1992 19.6 20.1 17.7 18.0 19.3 21.4 21.6 19.1 21.6 24.5
Tenured? yes 57.6 57.2 59.1 62.8 59.8 57.2 47.9 51.8 48.1 43.0 no 42.4 42.8 40.9 37.2 40.2 42.8 52.1 48.2 51.9 57.0
Year Received Tenure 1954 or earlier 0.2 0.1 0.3 0.1 0.2 0.2 0.1 0.2 0.2 0.1 1955 to 1959 0.3 0.4 0.2 0.5 0.8 0.1 0.3 0.3 0.3 0.3 1960 to 1964 1.9 2.2 0.7 2.3 3.2 1.2 3.1 3.3 2.7 3.2 1965 to 1969 9.7 10.2 8.0 12.4 10.2 8.6 9.0 10.4 7.8 7.6 1970 to 1974 20.4 19.8 22.7 19.7 19.8 22.1 15.7 16.2 16.8 14.3 1975 to 1979 18.5 18.6 18.1 18.6 18.0 20.0 16.2 16.5 14.3 16.7 1980 to 1984 17.0 17.1 16.4 17.4 17.0 16.6 17.6 17.0 16.8 18.9 1985 to 1989 18.9 18.5 20.0 17.6 19.3 17.0 22.8 22.4 24.6 22.4 1990 to 1992 13.2 13.1 13.6 11.4 11.5 14.2 15.2 13.7 16.5 16.7
Primary Interest very heavily in teaching 39.0 29.3 73.1 17.9 18.6 37.3 39.4 35.0 40.4 44.2 leaning toward teaching 37.5 41.6 23.1 37.5 43.0 43.5 44.0 43.9 43.5 44.5 leaning toward research 21.0 25.9 3.4 39.1 33.7 17.5 15.3 19.3 15.1 10.7 Very heavilv in research 2.6 3.2 0.5 5.5 4.7 1.7 1.2 1.8 1.0 0.7
(2) Recategorization of this item from a longer list is shown in The American College Teacher
Two-year Colleges Public Private
0.9 0.0 5.6 6.0
11.4 12.9 5.8 10.3 3.4 0.4
11.3 8.3 12.0 15.3 1.8 2.8 3.2 8.5 4.7 6.4 8.3 5.1 5.0 2.6 8.9 6.6
10.4 10.1 7.5 4.6
1.2 0.3 0.5 0.5 3.0 1.5
15.1 6.3 15.9 6.2 12.4 11.3 15.1 13.7 19.9 27.0 16.8 33.0
61.3 24.31
38.7 75.7!
0.3 0.0 0.2 0.0 0.7 0.0 8.0 7.6
22.8 16.7 18.2 12.1 16.4 17.5 19.9 25.5 13.5 20.7
73.8 61.2 22.4 33.3 3.3 4.5 0.4 0.9

I'V 00
WEIGHTED NATIONAL NORMS FOR FULL-TIME UNDERGRADUATE FACULTY, 1992-1993
Four-year Colleges ALL FACULTY ALL Universities All Non-
Institutions 4-vear 2-vear Public Private Public Private sectarian Catholic Protestant Salary is Based On
9/10 months 79.1 78.9 79.8 80.8 77.8 80.3 74.2 71.1 75.7 77.2 11/12 months 20.9 21.1 20.2 19.2 22.2 19.7 25.8 28.9 24.3 22.8
Base Salary in Thousands for: Faculty on 9/10 Mo Contracts
less than 20 0.8 0.7 1.3 1.0 0.6 0.5 0.7 0.6 0.6 0.8 20 to 29 14.0 12.2 20.3 8.7 4.8 15.2 17.2 11.0 12.2 26.9 30to39 31.9 30.8 35.6 28.4 19.3 33.8 36.1 29.3 41.0 41.4 40 to 49 26.3 27.0 24.1 27.1 23.6 28.7 25.6 28.2 28.0 21.3 50 to 59 15.6 16.1 13.8 17.8 20.3 15.1 12.8 17.7 12.3 7.5 60 to 69 7.3 8.1 4.4 9.2 17.4 5.9 4.8 8.0 4.3 1.4 70 to 79 2.6 3.2 0.5 5.2 8.1 0.6 1.8 3.3 1.0 0.5 80 to 89 1.0 1.2 0.1 1.7 4.1 0.1 0.6 1.3 0.2 0.1 90 to 99 0.3 0.4 0.0 0.6 1.0 0.0 0.2 0.4 0.1 0.0 100 to 124 0.2 0.2 0.0 0.4 0.7 0.1 0.1 0.2 0.0 0.0 125 to 149 0.0 0.0 0.0 0.0 0.1 0.0 0.0 0.0 0.1 0.0 ISO or more 0.0 0.0 0.1 0.1 0.0 0.0 0.0 0.0 0.0 0.0
Faculty on 11/12 Mo Contracts less than 20 0.9 0.5 2.4 0.0 1.4 0.1 1.3 0.6 1.8 1.9 20 to 29 11.6 9.8 18.5 3.5 1.8 10.6 19.4 15.2 15.2 28.2 30 to 39 30.1 27.6 39.7 14.4 24.0 30.0 41.4 38.9 45.2 43.1 40 to 49 23.8 23.8 23.7 21.0 33.3 24.6 22.0 24.6 21.1 18.6 50 to S9 16.0 17.2 11.7 24.9 15.4 16.8 9.6 11.1 11.1 6.4 60 to 69 9.8 11.5 3.4 17.4 13.0 11.3 4.3 6.2 4.0 1.4 70 to 79 3.6 4.3 0.5 6.6 4.8 4.7 1.1 2.1 0.5 0.1 80 to 89 2.0 2.5 0.0 5.4 2.7 1.4 0.5 0.7 0.3 0.2 90 to 99 1.0 1.3 0.0 2.8 3.0 0.2 0.2 0.3 0.3 0.0 100 to 124 0.7 0.8 0.0 2.S 0.2 0.0 0.2 0.3 0.0 0.1 125 to 149 0.2 0.2 0.0 0.7 0.0 0.0 0.0 0.1 0.1 0.0 150 or more 0.3 0.3 0.0 0.7 0.4 0.2 0.1 0.0 0.4 0.0
Father's Education 8th grade or less 17.2 16.8 18.5 17.1 13.1 18.8 15.2 14.5 17.1 15.0 some high school 10.9 10.0 14.0 9.8 10.2 10.4 9.7 9.1 U.8 9.3 completed high school 23.7 22.0 29.7 21.1 19.5 23.7 22.0 20.8 23.4 22.7 some college 14.0 14.2 13.4 14.2 13.0 14.7 14.1 14.1 13.0 14.8 graduated from college 13.4 14.1 10.8 14.8 15.3 12.8 14.4 14.8 14.1 14.1 attended grad/prof school 5.1 5.5 3.7 5.2 6.9 5.0 6.0 6.5 5.5 5.6 attained advanced de~ee 15.7 17.3 9.9 17.8 22.0 14.6 18.6 20.2 15.2 18.5
Mother's Education 8th grade or less 12.2 12.0 13.0 11.8 9.7 13.2 11.4 10.8 12.9 11.4 some high school 10.6 10.0 12.7 10.0 10.0 11.1 8.4 8.7 10.6 6.9 completed high school 34.1 32.9 38.4 32.0 31.5 33.9 33.4 33.5 35.1 32.4 some college 16.5 17.0 14.5 16.9 17.1 16.9 17.5 16.2 16.0 19.8 graduated from college 15.4 16.1 12.8 17.4 16.9 14.0 17.2 17.6 15.8 17.5 attended grad/prof school 4.1 4.3 3.4 4.2 5.2 3.9 4.5 4.9 4.0 4.2 attained advanced de~ 7.1 7.7 5.2 7.7 9.6 7.0 7.6 8.3 5.6 7.8
Two-year Colleges Public Private
81.1 58.7 18.9 41.31
1.2 3.0 19.6 36.3 35.0 47.2 24.6 13.0 14.4 0.6 4.6 0.0 0.5 0.0 0.1 0.0 0.0 0.0 0.0 0.0 0.0 0.0 0.1 0.0
1.9 6.4 16.6 31.8 38.7 47.2 25.3 12.5 13.2 1.5 3.8 0.6 0.6 0.0 0.0 0.0 0.0 0.0 0.0 0.0 0.0 0.0 0.0 0.0
18.7 15.1 14.0 13.5 29.7 29.5 13.3 14.7 10.9 9.6 3.6 5.8 9.8 11.9
13.2 9.9 12.9 9.0 38.2 41.7 14.5 15.1 12.6 15.5 3.3 5.0 5.3 3.8
N \0
WEIGHTED NATIONAL NORMS FOR FULL-TIME UNDERGRADUATE FACULTY, 1992-1993
- - _ ... - - -_.-Four-vear CoU ALL FACULTY ALL Universities All Non-
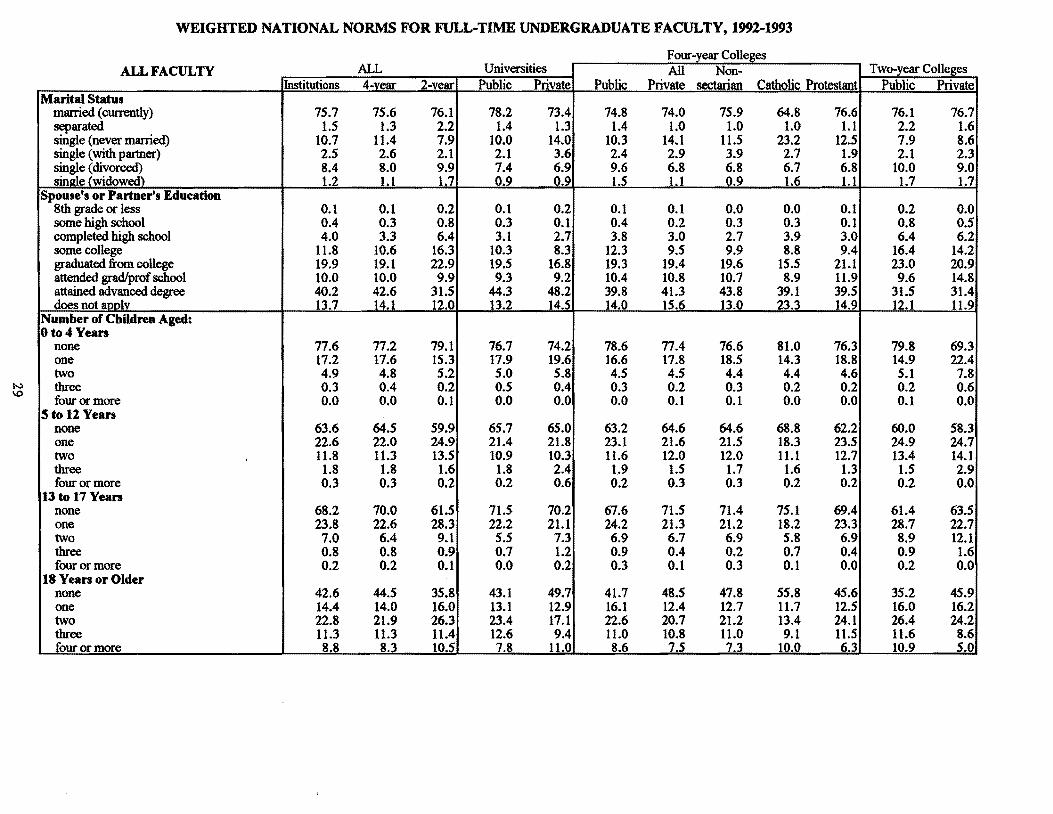
Institutions 4-vear 2-vear Public Private Public Private sectarian Catholic Protestant Marital Status
married (currently) 75.7 75.6 76.1 78.2 73.4 74.8 74.0 75.9 64.8 76.6 separated 1.5 1.3 2.2 1.4 1.3 1.4 1.0 1.0 1.0 1.1 single (never married) 10.7 11.4 7.9 10.0 14.0 10.3 14.1 11.5 23.2 12.5 single (with partner) 2.5 2.6 2.1 2.1 3.6 2.4 2.9 3.9 2.7 1.9 single (divorced) 8.4 8.0 9.9 7.4 6.9 9.6 6.8 6.8 6.7 6.8 sin2le (widowed) 1.2 1.1 1.7 0.9 0.9 1.5 1.1 0.9 1.6 1.1
Spouse's or Partner's Education 8th grade or less 0.1 0.1 0.2 0.1 0.2 0.1 0.1 0.0 0.0 0.1 some high school 0.4 0.3 0.8 0.3 0.1 0.4 0.2 0.3 0.3 0.1 completed high school 4.0 3.3 6.4 3.1 2.7 3.8 3.0 2.7 3.9 3.0 some college 11.8 10.6 16.3 10.3 8.3 12.3 9.5 9.9 8.8 9.4 graduated from college 19.9 19.1 22.9 19.5 16.8 19.3 19.4 19.6 15.5 21.1 attended grad/prof school 10.0 10.0 9.9 9.3 9.2 10.4 10.8 10.7 8.9 11.9 attained advanced degree 40.2 42.6 31.5 44.3 48.2 39.8 41.3 43.8 39.1 39.5 does not aDDlv 13.7 14.1 12.0 13.2 14.5 14.0 15.6 13.0 23.3 14.9
Number of ChUdren Aged: Oto4Years
none 77.6 77.2 79.1 76.7 74.2 78.6 77.4 76.6 81.0 76.3 one 17.2 17.6 15.3 17.9 19.6 16.6 17.8 18.5 14.3 18.8 two 4.9 4.8 5.2 5.0 5.8 4.5 4.5 4.4 4.4 4.6 three 0.3 0.4 0.2 0.5 0.4 0.3 0.2 0.3 0.2 0.2 four or more 0.0 0.0 0.1 0.0 0.0 0.0 0.1 0.1 0.0 0.0
Sto II Years none 63.6 64.5 59.9 65.7 65.0 63.2 64.6 64.6 68.8 62.2 one 22.6 22.0 24.9 21.4 21.8 23.1 21.6 21.5 18.3 23.5 two I 11.8 11.3 13.5 10.9 10.3 11.6 12.0 12.0 11.1 12.7 three 1.8 1.8 1.6 1.8 2.4 1.9 1.5 1.7 1.6 1.3 four or more 0.3 0.3 0.2 0.2 0.6 0.2 0.3 0.3 0.2 0.2
13 to 17 Years none 68.2 70.0 61.5 71.5 70.2 67.6 71.5 71.4 75.1 69.4 one 23.8 22.6 28.3 22.2 21.1 24.2 21.3 21.2 18.2 23.3 two 7.0 6.4 9.1 5.5 7.3 6.9 6.7 6.9 5.8 6.9 three 0.8 0.8 0.9 0.7 1.2 0.9 0.4 0.2 0.7 0.4 four or more 0.2 0.2 0.1 0.0 0.2 0.3 0.1 0.3 0.1 0.0
18 Years or Older none 42.6 44.5 35.8 43.1 49.7 41.7 48.5 47.8 55.8 45.6 one 14.4 14.0 16.0 13.1 12.9 16.1 12.4 12.7 11.7 12.5 two 22.8 21.9 26.3 23.4 17.1 22.6 20.7 21.2 13.4 24.1 three 11.3 11.3 11.4 12.6 9.4 11.0 10.8 11.0 9.1 11.5
~Qurormore 8.8 8.3 10.5 7.8 11.0 8.6 7.5 7.3 10.0 6.3
Two-year Colleges Public Private
76.1 76.7 2.2 1.6 7.9 8.6 2.1 2.3
10.0 9.0 1.7 1.7
0.2 0.0 0.8 0.5 6.4 6.2
16.4 14.2 23.0 20.9 9.6 14.8
31.5 31.4 12.1 11.9
79.8 69.3 14.9 22.4 5.1 7.8 0.2 0.6 0.1 0.0
60.0 58.3 24.9 24.7 13.4 14.1 1.5 2.9 0.2 0.0
61.4 63.5 28.7 22.7 8.9 12.1 0.9 1.6 0.2 0.0
35.2 45.9 16.0 16.2 26.4 24.2 11.6 8.6 10.9 5.0
\..V o
WEIGHTED NATIONAL NORMS FOR FULL-TIME UNDERGRADUATE FACULTY, 1992-1993
Four-year Colleges ALL FACULTY ALL Universities All Non-
Institutions 4-vear 2-year Public Private Public Private sectarian Catholic Protestant General Activities
held academic admin position 39.4 40.9 33.9 37.9 46.4 40.6 43.2 42.4 45.4 42.8 award for outstanding teaching 34.0 34.7 31.3 37.0 34.2 33.5 33.5 32.1 33.7 35.0 spouse or partner an academic 32.7 32.8 32.5 32.7 26.6 34.5 33.3 33.8 28.8 35.1 commute a long distance to work 18.8 17.4 23.8 13.2 21.1 20.0 17.9 14.8 24.8 17.9 research/writing on women 21.5 23.6 14.0 21.4 29.2 21.9 26.4 27.4 26.9 25.0 spouse/partner work in same city 53.9 55.6 48.0 58.9 59 .. 0 51.5 55.2 55.4 49.8 57.7 res/writing on race/ethnicity 20.9 23.0 13.5 20.1 26.5 24.0 23.8 22.8 23.0 25.5 born in the U.S.A 89.1 87.4 95.2 85.4 84.3 89.0 89.4 88.4 90.2 90.0 am a U.S. citizen 94.8 93.8 98.3 92.3 92.0 95.0 95.0 94.5 95.9 95.0 interrupted career for hlthlfam 11.1 9.5 17.0 7.6 9.3 10.0 11.7 10.3 13.3 12.6 sexually harassed at this inst 6.8 6.5 7.9 6.1 5.7 7.5 5.7 5.6 6.3 5.6 plan working bevond age 70 34.0 36.8 24.3 38.1 44.3 32.8 37.2 37.1 41.2 35.3
General Activities in the Last Two Years
had one or more firm job offers 29.8 29.3 31.8 26.8 28.9 30.9 30.5 28.0 30.6 33.6 developed a new course 69.2 70.8 63.6 68.4 76.0 67.5 76.9 77.4 79.9 74.8 considered early retirement 30.2 29.2 33.7 29.8 23.7 32.6 25.9 26.8 25.6 24.9 considered leaving academe 35.0 35.7 32.4 37.1 32.4 36.3 34.6 34.0 33.3 35.9
Teaching Activities in the Last Two Years
taught honors course 18.2 20.3 10.7 22.6 27.1 16.3 19.1 19.1 20.7 18.1 taught interdisciplinary course 33.1 34.9 26.2 31.7 38.1 31.4 43.5 48.0 35.6 42.0 taught ethnic studies course 7.8 8.6 4.8 6.6 10.2 8.2 11.5 11.4 11.2 11.7 taught women's studies course 5.9 6.7 3.2 5.0 8.3 5.9 9.6 10.4 7.7 9.6 team-taught a course 35.0 35.2 34.0 36.9 30.9 31.8 40.0 42.3 36.0 39.4 worked w/students on res project 63.5 70.0 38.7 78.9 72.0 64.2 64.1 67.0 60.9 62.2 attd raciaVcultural workshop 39.5 35.5 53.5 26.4 31.9 39.4 44.9 41.9 49.4 46.1 attd women'slminorities workshop 23.5 21.6 30.1 14.9 25.2 21.7 29.8 27.5 31.6 31.6 held fac senate/council office 24.1 24.2 23.4 20.4 23.4 27.1 26.2 25.1 30.9 24.9 used funds for research 41.2 49.0 11.8 59.7 55.5 40.0 42.4 48.7 39.3 36.2 served as a paid consultant 45.5 48.0 36.3 52.7 53.3 46.1 40.9 41.6 42.7 39.2 attd teaching enhance workshop 54.8 51.7 65.7 43.2 49.9 55.7 59.3 55.8 60.8 62.8
Research Working Environment work essentially alone 65.0 65.0 65.0 56.2 67.6 67.7 72.9 71.4 70.5 76.0 work with one or two colleagues 27.1 28.8 20.4 36.9 27.4 26.4 21.1 23.0 23.2 17.8 member of larger grOUP 7.9 6.1 14.6 6.9 4.9 5.8 5.9 5.6 6.3 6.2
Two-year Colleges Public Private
33.4 42.5 31.2 33.9 32.4 33.1 23.8 23.7 13.9 14.2 48.2 45.5 13.4 14.9 95.2 94.4 98.3 98.0 16.9 19.0 8.2 2.8
23.7 35.4
30.7 49.5 63.0 73.3 34.4 21.7 32.0 40.2
10.6 12.9 25.7 34.1
4.8 4.6 3.2 3.2
33.7 40.2 38.5 41.0 54.4 39.5 30.8 17.5 23.8 17.2 11.9 11.4 36.6 31.3 65.8 64.8
64.5 72.0 20.6 17.0 14.8 11.0
w -
WEIGHTED NATIONAL NORMS FOR FULL-TIME UNDERGRADUATE FACULTY, 1992-1993
Four-year Colleges ALL FACULTY ALL Universities All Non-
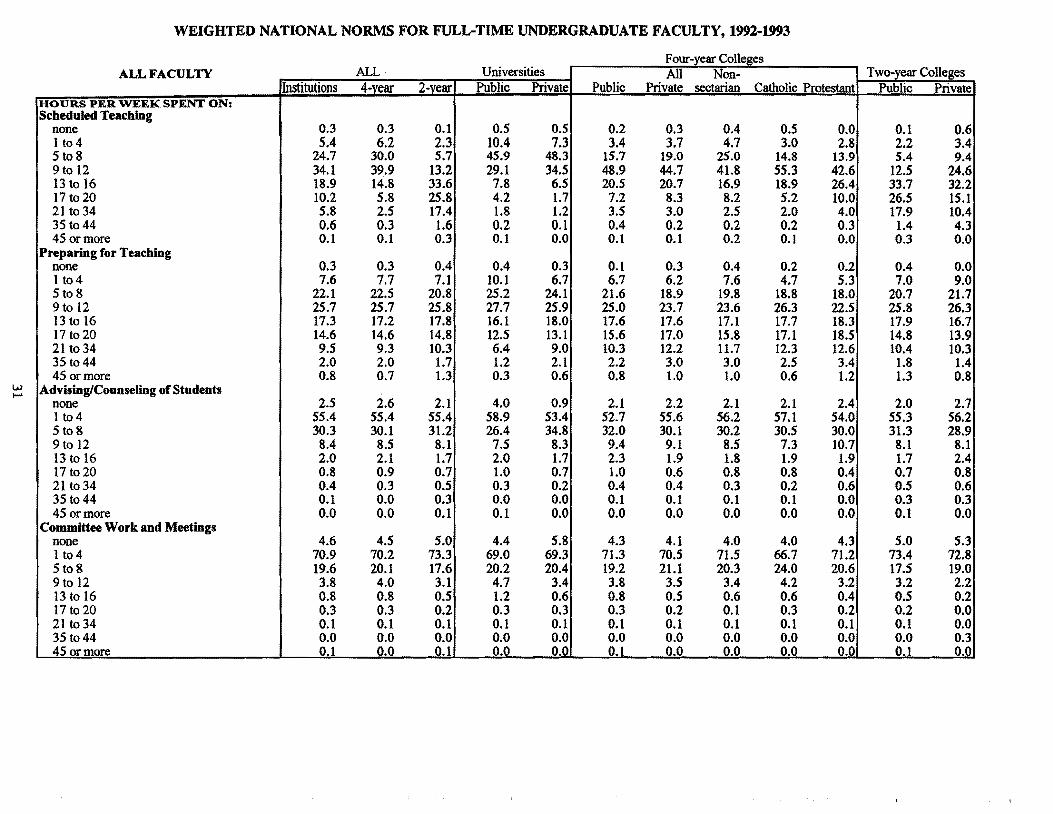
Institutions 4 .. year 2-vear Public Private Public Private sectarian Catholic Protestant HOURS PER WEEK SPENT ON: !
Scheduled Teaching none 0.3 0.3 0.1 0.5 0.5 0.2 0.3 0.4 O.S 0.0 1 t04 5.4 6.2 2.3 10.4 7.3 3.4 3.7 4.7 3.0 2.8 5 t08 24.7 30.0 5.7 45.9 48.3 15.7 19.0 25.0 14.8 13.9 9 to 12 34.1 39.9 13.2 29.1 34.5 48.9 44.7 41.8 55.3 42.6 13 to 16 18.9 14.8 33.6 7.8 6.5 20.5 20.7 16.9 18.9 26.4 17 to 20 10.2 5.8 25.8 4.2 1.7 7.2 8.3 8.2 5.2 lO.O 21 to 34 5.8 2.5 17.4 1.8 1.2 3.5 3.0 2.5 2.0 4.0 35 to 44 0.6 0.3 1.6 0.2 0.1 0.4 0.2 0.2 0.2 0.3 45 or more 0.1 0.1 0.3 0.1 0.0 0.1 0.1 0.2 0.1 0.0
Preparing for Teaching none 0.3 0.3 0.4 0.4 0.3 0.1 0.3 0.4 0.2 0.2 1 t04 7.6 7.7 7.1 10.1 6.7 6.7 6.2 7.6 4.7 5.3 5to 8 22.1 22.5 20.8 25.2 24.1 21.6 18.9 19.8 18.8 18.0 9 to 12 25.7 25.7 25.8 27.7 25.9 25.0 23.7 23.6 26.3 22.5 13 to 16 17.3 17.2 17.8 16.1 18.0 17.6 17.6 17.1 17.7 18.3 17 to 20 14.6 14.6 14.8 12.5 13.1 15.6 17.0 15.8 17.1 18.5 21 to 34 9.5 9.3 10.3 6.4 9.0 10.3 12.2 11.7 12.3 12.6 35 to 44 2.0 2.0 1.7 1.2 2.1 2.2 3.0 3.0 2.5 3.4 45 or more 0.8 0.7 1.3 0.3 0.6 0.8 1.0 1.0 0.6 1.2
Advising/Counseling of Students none 2.5 2.6 2.1 4.0 0.9 2.1 2.2 2.1 2.1 2.4 1 t04 55.4 55.4 55.4 58.9 53.4 52.7 55.6 56.2 57.1 54.0 5t08 30.3 30.1 31.2 26.4 34.8 32.0 30.1 30.2 30.5 30.0 9to 12 8.4 8.5 8.1 7.5 8.3 9.4 9.1 8.5 7.3 10.7 13 to 16 2.0 2.1 1.7 2.0 1.7 2.3 1.9 1.8 1.9 1.9 17 to 20 0.8 0.9 0.7 1.0 0.7 1.0 0.6 0.8 0.8 0.4 21 to 34 0.4 0.3 0.5 0.3 0.2 0.4 0.4 0.3 0.2 0.6 35 to 44 0.1 0.0 0.3 0.0 0.0 0.1 0.1 0.1 0.1 0.0 45 or more 0.0 0.0 0.1 0.1 0.0 0.0 0.0 0.0 0.0 0.0
Committee Work and Meetings none 4.6 4.5 5.0 4.4 5.8 4.3 4.1 4.0 4.0 4.3 1 t04 70.9 70.2 73.3 69.0 69.3 71.3 70.5 71.5 66.7 71.2 5t08 19.6 20.1 17.6 20.2 20.4 19.2 21.1 20.3 24.0 20.6 9 to 12 3.8 4.0 3.1 4.7 3.4 3.8 3.5 3.4 4.2 3.2 13 to 16 0.8 0.8 0.5 1.2 0.6 0.8 0.5 0.6 0.6 0.4 17 to 20 0.3 0.3 0.2 0.3 0.3 0.3 0.2 0.1 0.3 0.2 21 to 34 0.1 0.1 0.1 0.1 0.1 0.1 0.1 0.1 0.1 0.1 35 to 44 0.0 0.0 0.0 0.0 0.0 0.0 0.0 0.0 0.0 0.0 45 or more 0.1 0.0 0.1 0.0 0.0 0.1 0.0 0.0 0.0 0.0
Two-year Colleges Public Private
0.1 0.6 2.2 3.4 5.4 9.4
12.5 24.6 33.7 32.2 26.S 15.1 17.9 10.4
1.4 4.3 0.3 0.0
0.4 0.0 7.0 9.0
20.7 21.7 25.8 26.3 17.9 16.7 14.8 13.9 10.4 10.3
1.8 1.4 1.3 0.8
2.0 2.7 55.3 56.2 31.3 28.9 8.1 8.1 1.7 2.4 0.7 0.8 0.5 0.6 0.3 0.3 0.1 0.0
5.0 5.3 73.4 72.8 17.5 19.0 3.2 2.2 0.5 0.2 0.2 0.0 0.1 0.0 0.0 0.3 0.1 0.0

WEIGHTED NATIONAL NORMS FOR FULL-TIME UNDERGRADUATE FACULTY, 1992-1993
Four-vear con J
Two-year Colleges ALL Universities All Non-Institutions 4-vear 2-vear
ALL FACULTY Public Private
HOURS PER WEEK SPENT ON: Other Administration
none
Public Private sectarian Catholic Protestant Public· Private
40.4 33.1 lt04
37.0 38.7 37.7 34.7 36.2 34.7 32.937.6 36.9 39.9 36.6 38.7 40.5 37.4 37.2 38.9 42.2
5 t08 38.7 38.6 39.1 40.3 39.3
10.9 12.3 10.9 13.8 13.3 10.2 9.3 9 to 12
11.7 10.611.1 11.4 10.1 5.1 8.0
13 to 16 6.4 6.3 5.9 5.8 7.15.7 5.8 5.3 4.8 5.3
2.0 2.8 17 to 20
3.0 3.0 2.6 3.1 3.42.6 2.8 2.1 2.4 2.5 2.6 2.5 2.0 2.5 3.1 1.8 2.2
21 to 34 2.1 2.2 1.8 1.7 1.7
2.0 1.9 1.4 2.4 2.1 1.2 1.1 35 to 44
1.6 1.7 1.2 1.6 1.0 0.5 0.5 0.4 0.3 0.7 0.4 1.0
45 or more 0.4 0.4 0.4 0.2 0.4
0.2 0.3 Research and Scholarly Writing
none
0.2 0.1 0.2 0.0 0.20.2 0.2 0.2 0.2 0.4
58.8 52.8 1 to 4
19.1 23.2 19.7 21.7 28.224.1 14.9 58.5 7.8 7.6 29.8 34.8
5 t08 38.6 40.8 38.8 40.0 43.731.6 32.0 30.1 22.0 25.0 20.8 18.4 20.4 19.9 15.0 6.7 7.8
9 to 12 17.3 20.1 6.7 20.0 22.0
2.9 2.8 13 to 16
16.5 17.5 11.0 9.7 10.8 10.3 8.111.1 13.3 2.9 4.9 3.9 4.7 4.5 2.711.7 11.2 1.0 1.2
17 to 20 6.3 7.7 1.0
3.5 2.4 3.0 2.4 1.7 0.4 0.0 21 to 34
4.9 6.1 0.4 10.4 8.9 0.3 0.6
35 to 44 1.6 1.2 1.8 1.1 0.53.3 4.0 0.3 7.9 5.5
0.0 0.0 45 or more
0.3 0.2 0.4 0.0 0.11.0 1.3 0.0 2.7 1.8 0.0 0.00.2 0.1 0.3 0.0 0.00.4 0.5 0.0 1.0 0.5
W Creative Products & PerformancesN 66.8 67.5 69.0 69.6 64.5 65.8 64.5
1 t04 none 73.2 77.369.2 70.2 65.7
20.4 19.5 17.8 20.6 21.1 25.1 26.9 5 to 8
19.6 18.0 25.2 16.2 12.9 6.0 5.9 5.8 5.0 6.5 5.2 4.6
9 to 12 4.6 4.55.3 5.3 5.2
2.0 1.4 13 to 16
2.9 2.5 2.7 3.2 2.7 2.6 4.22.7 2.9 2.0 0.6 2.0
17 to 20 1.5 1.5 1.8 0.9 1.51.2 1.4 0.7 1.1 1.8
0.6 0.7 21 to 34
1.4 1.1 1.4 0.6 1.20.8 0.51.0 1.1 0.6 0.3 0.0
35 to 44 0.8 0.9 1.0 0.7 0.80.7 0.8 0.3 0.8 0.4 0.3 0.1 0.1 0.1 0.1 0.1 0.0
45 or more 0.2 0.00.2 0.2 0.1
0.1 0.2 0.4 0.0 0.1 0.2 0.0 Consultation with Clients or Patients
none
0.2 0.00.2 0.2 0.2
76.7 74.7 1 t04
79.2 84.4 78.9 80.4 82.0 78.2 79.879.2 79.9 76.5 15.8 17.1
5 to 8 14.8 14.5 15.9 15.1 10.6 15.7 13.4 12.4 14.8 13.8
4.3 4.5 9 to 12
3.3 3.6 3.4 3.9 3.83.5 3.3 4.4 3.2 3.0 1.6 2.3
13 to 16 1.3 1.4 1.2 1.7 1.61.3 1.31.4 1.3 1.6 0.2 0.5 0.4 0.5 0.5 0.5 1.3
17 to 20 0.4 0.30.4 0.3 0.6
0.5 0.0 21 to 34
0.3 0.2 0.3 0.4 0.10.3 0.3 0.5 0.3 0.1 0.2 0.2 0.1 0.4 0.2 0.3 0.0
35 to 44 0.3 0.10.2 0.2 0.3
0.1 0.1 0.1 0.2 0.1 0.2 0.0 45 or more
0.1 0.10.1 0.1 0.2 0.1 0.00.0 0.1 0.2 0.0 0.10.1 0.00.1 0.1 0.1

WEIGHTED NATIONAL NORMS FOR FULL-TIME UNDERGRADUATE FACULTY, 1992-1993
Four-vear CoIl ALL FACULTY ALL Universities All Non-
~
Two-year Colleges Institutions 4-vear 2-vear Public Private Public Private sectarian Catholic Protestant Public Private
HOURS PER WEEK SPENT ON: CommunitylPub6c Service
none 31.5 32.2 28.8 36.3 37.8 26.6 32.3 38.0 29.3 26.9 28.6 31.0 1 to 4 51.2 48.8 58.1 55.0 51.9 56.7 57.8 56.5 58.8 5to8
54.7 54.2 56.6 9.0 9.7 11.4 9.4 8.2 10.4 10.4 10.5 6.9
9 to 12 10.0 10.0 10.3
2.6 2.7 2.7 2.4 1.3 2.4 3.72.7 2.6 3.3 3.3 2.4 13 to 16 0.6 0.5 0.3 0.6 0.60.5 0.6 0.4 0.5 0.7 0.4 0.2 17 to 20 0.3 0.3 0.4 0.2 0.2 0.4 0.3 0.2 0.4 0.4 0.4 0.4 21 to 34 0.1 0.1 0.1 0.0 0.2 0.1 0.1 0.1 0.1 0.1 0.1 0.2 35 to 44 0.0 0.0 0.0 0.0 0.0 0.1 0.0 45 or more
0.0 0.0 0.1 0.1 0.0 0.1 0.1 0.1 0.1 0.0 0.1 0.0 0.1 0.0 0.0 0.1 0.0
Outside Counsulting or Freelance Work
none 61.8 60.6 66.0 57.0 56.3 62.5 65.4 65.6 63.7 66.1 66.1 65.2 1 t04 28.9 25.3 25.0 26.5 25.028.1 29.6 23.0 32.6 31.1 23.0 23.0 5 t08 5.3 6.0 6.0 6.3 5.8 6.2 4.6 9 to 12
6.4 6.5 6.1 7.3 8.9 2.2 2.4 2.1 1.8 1.9 2.1 1.6 2.5 3.4
13 to 16 2.2 2.1 2.6 0.8 0.7 1.0 0.6 0.8 0.7 0.9 0.8 0.8 0.9 0.9 1.7
17 to 20 0.4 0.3 0.8 0.3 0.2 0.4 0.4 0.5 0.5 0.4 0.8 0.4 21 to 34 0.1 0.1 0.3 0.1 0.2 0.2 0.1 0.2 0.2 1.0 35 to 44
0.0 0.2 0.1 0.0 0.0 0.0 0.1 0.1 0.40.1 0.0 0.1 0.0 0.1
w 0.0 0.0 0.1 0.0 0.045 or more 0.0 0.0 0.1 0.40.0 0.0 0.1w Household/Child Care Duties
none 17.5 14.3 15.4 10.5 10.9 12.3 9.014.0 14.8 11.2 11.2 9.9 1 t04 17.9 18.8 14.9 18.7 18.1 18.4 19.7 19.5 19.5 20.1 14.6 18.8 5 to 8 20.6 21.4 9 to 12
22.9 24.7 24.6 22.7 25.822.4 22.9 20.6 21.4 24.0 16.4 16.8 16.2 17.7 18.0 15.8 18.3 16.9 19.1
13 to 16 16.7 16.7 17.0
9.3 9.6 9.2 9.6 9.98.9 8.3 11.3 9.0 17 to 20
9.6 9.1 11.2 7.9 6.6 6.4 7.5 6.27.9 7.3 10.0 7.2 7.0 10.4 4.6
21 to 34 5.0 5.8 4.9 5.6 6.0 5.4 5.1 6.8 6.6 35 to 44
5.5 5.2 6.8 2.2 2.6 2.2 2.8 2.9 3.7 4.1
45 or more 2.7 2.4 3.7 2.4 2.3
4.5 6.5 Number of Days Spent Off-Campus for Professional Activities
none
3.2 2.8 4.6 2.7 3.2 3.1 4.4 2.62.6 3.2
8.1 12.3 13.5 12.5 11.9 12.6 13.3 16.5 21.1 lto2
12.6 11.4 16.8 15.5 16.1 15.5 17.9 15.8 26.1 20.8
3 t04 15.8 13.0 25.8 9.5 9.7
25.0 27.8 25.4 27.1 31.1 30.9 29.9 5 to 10
24.7 23.0 30.8 18.4 21.2 35.9 34.2 31.7 30.8 32.3 29.5 29.7 20.4 21.0
11 to 20 30.4 33.2 20.5
4.6 21 to 50
11.5 13.4 4.7 10.6 8.5 10.2 8.7 6.519.2 14.5 2.7 3.1 3.4 3.5 2.4 1.03.9 4.6 1.2 7.2 6.0 1.2 5'11
1.1 1.4 0.2 1.7 2.2 0.9 1.2 1.5 0.8 1.2 0.2 0.6~
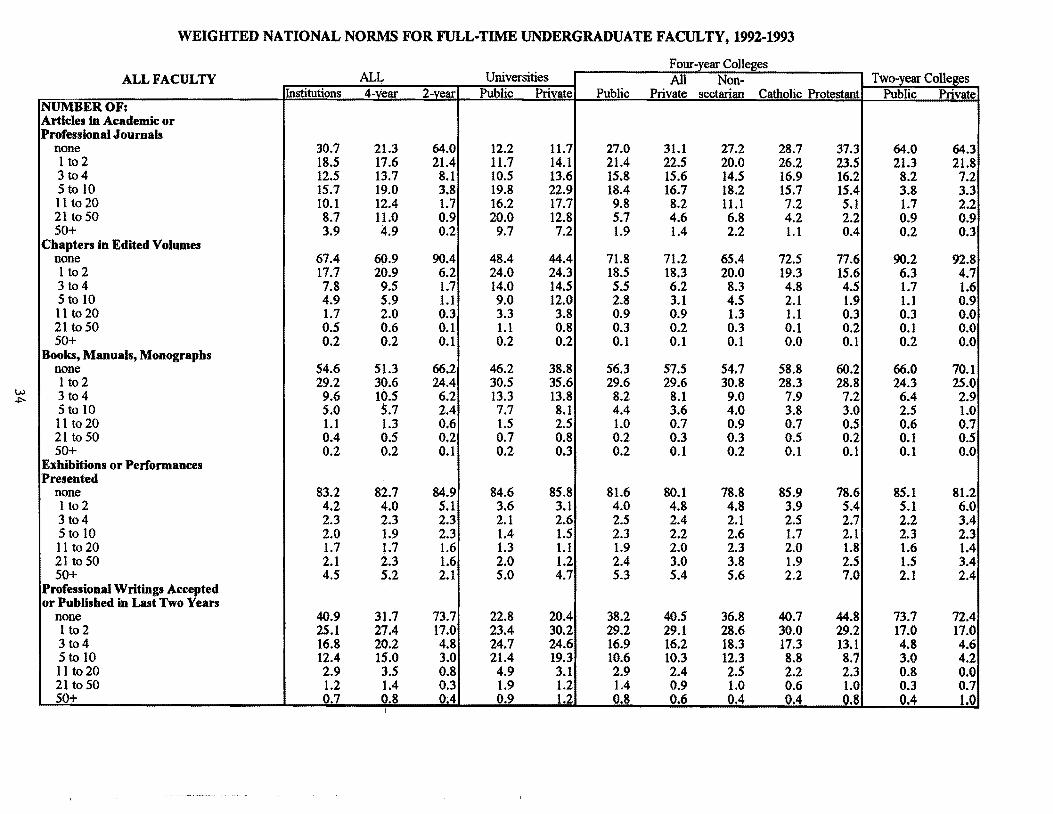
w .j:'-
WEIGHTED NATIONAL NORMS FOR FULL-TIME UNDERGRADUATE FACULTY, 1992-1993
Four-vear Coli .. -~.-.~-.-
ALL FACULTY ALL Universities All Non-Institutions 4-vear 2-vear Public Private Public Private sectarian Catholic Protestant
NUMBER OF: Articles in Academic or Professional Journals
none 30.7 21.3 64.0 12.2 11.7 27.0 31.1 27.2 28.7 37.3 1 to 2 18.5 17.6 21.4 11.7 14.1 21.4 22.5 20.0 26.2 23.5 3 t04 12.5 13.7 8.1 10.5 13.6 15.8 15.6 14.5 16.9 16.2 5 to 10 15.7 19.0 3.8 19.8 22.9 18.4 16.7 18.2 15.7 15.4 11 to 20 10.1 12.4 1.7 16.2 17.7 9.8 8.2 11.1 7.2 5.1 21 to 50 8.7 11.0 0.9 20.0 12.8 5.7 4.6 6.8 4.2 2.2 50+ 3.9 4.9 0.2 9.7 7.2 1.9 1.4 2.2 1.1 0.4
Chapters in Edited Volumes none 67.4 60.9 90.4 48.4 44.4 71.8 71.2 65.4 72.5 77.6 I to 2 17.7 20.9 6.2 24.0 24.3 18.5 18.3 20.0 19.3 15.6 3 t04 7.8 9.5 1.7 14.0 14.5 5.5 6.2 8.3 4.8 4.5 5 to 10 4.9 5.9 1.1 9.0 12.0 2.8 3.1 4.5 2.1 1.9 11 to 20 1.7 2.0 0.3 3.3 3.8 0.9 0.9 1.3 1.1 0.3 21 to 50 0.5 0.6 0.1 1.1 0.8 0.3 0.2 0.3 0.1 0.2 50+ 0.2 0.2 0.1 0.2 0.2 0.1 0.1 0.1 0.0 0.1
Books, Manuals, Monographs none 54.6 51.3 66.2 46.2 38.8 56.3 57.5 54.7 58.8 60.2 1 t02 29.2 30.6 24.4 30.5 35.6 29.6 29.6 30.8 28.3 28.8 3 t04 9.6 10.5 6.2 13.3 13.8 8.2 8.1 9.0 7.9 7.2 5 to 10 5.0 5.7 2.4 7.7 8.1 4.4 3.6 4.0 3.8 3.0 11 to 20 1.1 1.3 0.6 1.5 2.5 1.0 0.7 0.9 0.7 0.5 21 to 50 0.4 0.5 0.2 0.7 0.8 0.2 0.3 0.3 0.5 0.2 50+ 0.2 0.2 0.1 0.2 0.3 0.2 0.1 0.2 0.1 0.1
Exhibitions or Performances Presented
none 83.2 82.7 84.9 84.6 85.8 81.6 80.1 78.8 85.9 78.6 1 to 2 4.2 4.0 5.1 3.6 3.1 4.0 4.8 4.8 3.9 5.4 3t04 2.3 2.3 2.3 2.1 2.6 2.5 2.4 2.1 2.5 2.7 5 to 10 2.0 1.9 2.3 1.4 1.5 2.3 2.2 2.6 1.7 2.1 11 to 20 1.7 1.7 1.6 1.3 1.1 1.9 2.0 2.3 2.0 1.8 21 to 50 2.1 2.3 1.6 2.0 1.2 2.4 3.0 3.8 1.9 2.5 50+ 4.5 5.2 2.1 5.0 4.7 5.3 5.4 5.6 2.2 7.0
Professional Writings Accepted or Published in Last Two Years
none 40.9 31.7 73.7 22.8 20.4 38.2 40.5 36.8 40.7 44.8 1 to 2 25.1 27.4 17.0 23.4 30.2 29.2 29.1 28.6 30.0 29.2 3104 16.8 20.2 4.8 24.7 24.6 16.9 16.2 18.3 17.3 13.1 5 to 10 12.4 15.0 3.0 21.4 19.3 10.6 10.3 12.3 8.8 8.7 11 to 20 2.9 3.5 0.8 4.9 3.1 2.9 2.4 2.5 2.2 2.3 21 to 50 1.2 1.4 0.3 1.9 1.2 1.4 0.9 1.0 0.6 1.0 50+ 0.7 0.8 0.4 0.9 1.2 0.8 0.6 0.4 0.4 0.8
Two-year Colleges Public Private
64.0 64.3 21.3 21.8 8.2 7.2 3.8 3.3 1.7 2.2 0.9 0.9 0.2 0.3
90.2 92.8 6.3 4.7 1.7 1.6 1.1 0.9 0.3 0.0 0.1 0.0 0.2 0.0
66.0 70.1 24.3 25.0 6.4 2.9 2.5 1.0 0.6 0.7 0.1 0.5 0.1 0.0
85.1 81.2 5.1 6.0 2.2 3.4 2.3 2.3 1.6 1.4 1.5 3.4 2.1 2.41
73.7 72.41 17.0 17.0
4.8 4.6 3.0 4.2 0.8 0.01 0.3 0.7
... 0.4 1.0

W \.n
WEIGHTED NATIONAL NORMS FOR FULL-TIME UNDERGRADUATE FACULTY, 1992-1993
Four-vear con ~
ALL FACULTY ALL Universities All Non-IInstitutions 4-vear 2-vear Public Private Public Private sectarian Catholic Protestant
NUMBER OF COURSES TAUGHT IN: General Education
none 50.4 51.6 46.1 64.3 48.6 46.6 43.6 49.5 48.0 34.5 one 20.4 23.1 10.8 21.9 30.0 21.3 24.2 24.9 18.4 26.3 two 13.8 14.6 11.1 9.2 16.2 16.9 17.3 14.6 17.7 20.1 three 7.6 7.0 9.6 3.2 3.7 9.7 9.5 7.1 10.5 11.7 four 3.7 2.7 7.6 1.2 0.9 3.7 3.9 2.7 3.8 5.3 five or more 4.1 1.1 14.7 0.2 0.5 1.8 1.6 1.2 1.6 2.1
Other BA or BS Undergraduate Credit Courses
none 10.3 6.9 24.7 6.8 7.7 6.9 6.6 7.5 5.7 6.0 one 26.2 30.2 9.6 40.3 38.6 23.7 21.0 22.1 21.0 19.8 two 27.7 30.6 15.5 32.9 33.7 27.6 30.4 33.0 29.1 28.0 three 18.2 18.8 15.8 13.8 16.4 21.4 23.2 22.7 22.8 24.1 four 10.3 9.6 13.2 4.3 2.3 14.8 13.3 10.5 17.2 14.5 five or more 7.2 3.9 21.3 1.9 1.2 5.6 5.5 4.2 4.2 7.6
Non-BA Credit Courses (develop-mental or remedial)
none 88.4 93.5 71.5 96.1 94.4 91.8 92.2 92.0 93.4 91.7 one 4.9 3.5 9.5 2.5 3.4 4.1 3.8 3.6 4.1 3.9 two 2.4 1.1 6.8 0.6 1.1 1.0 2.0 2.2 1.3 2.1 three 1.7 0.8 4.5 0.5 0.9 0.8 1.0 1.2 0.3 1.0 four 1.3 0.7 3.3 0.1 0.1 1.3 0.8 0.6 0.8 1.1 five or more 1.4 0.5 4.4 0.2 0.1 1.0 0.3 0.4 0.1 0.2
Graduate Courses none 62.2 55.0 98.3 36.0 44.7 64.6 81.3 80.9 70.6 88.1 one 30.8 36.6 1.3 52.8 47.5 27.7 14.0 14.9 20.7 8.9 two 5.5 6.6 0.2 8.4 7.0 6.0 3.6 3.1 6.7 2.3 three 1.1 1.3 0.1 1.9 0.6 1.3 0.7 0.5 1.7 0.4 four 0.3 0.3 0.0 0.4 0.2 0.2 0.3 0.3 0.2 0.2 five or more 0.2 0.2 0.1 0.4 0.1 0.1 0.1 0.2 0.1 0.1
Professional &:tals Noted as Very Important or Essential
engage in research 55.8 65.3 21.4 77.1 76.4 56.8 55.3 59.9 56.2 49.2 engage in outside activities 51.8 51.3 53.7 49.2 46.8 53.4 53.5 52.4 54.6 54.2 provide services to the cmty 42.6 40.8 48.9 36.6 36.6 45.0 42.5 38.0 47.3 45.6 participate in connnladmin work 29.9 28.0 36.6 22.5 24.3 32.8 30.8 26.9 37.5 32.0 be a good colleague 84.4 83.5 87.7 81.0 82.9 84.4 86.3 85.1 86.8 87.6 be a szood teacher 98.7 98.5 99.5 97.8 98.5 98.9 99.1 99.2 99.1 99.0
Faculty Expects Students to (3) think for themselves 81.3 82.2 78.3 80.8 85.5 81.7 83.4 84.5 84.4 81.4 work cooperatively w/oth stdnts 50.9 48.7 58.9 42.7 43.6 53.2 53.1 51.3 53.7 54.9 openly challenge ideas 47.4 48.4 44.0 45.4 50.5 49.9 49.4 50.9 52.5 46.0 compete for grades 8.1 8.2 7.8 8.5 7.0 9.6 5.9 5.6 5.5 6.5 seek frequent feedback 36.2 34.3 43.1 31.0 29.8 38.6 34.7 33.4 36.1 35.4 work indeoendentlv 48.0 48.5 46.5 48.6 46.9 49.5 47.4 47.9 48.0 46.5
(3) Percentage responding "agree strongly" only.
Two-year Colleges Public Private
46.4 42.1 10.9 9.1 10.8 16.6 9.2 15.0 7.6 7.6
15.0 9.7
24.7 23.5 9.5 11.3
15.5 16.0 15.8 15.7 13.0 15.8 21.5 17.7
70.9 81.0 9.6 7.4 6.8 6.6 4.6 3.1 3.4 0.8 4.6 1.0
98.4 97.2 1.2 2.8 0.2 0.0 0.1 0.0 0.0 0.0 0.1 0.0
20.6 34.9 53.3 59.8 48.8 52.2 36.3 41.6 87.5 90.9 99.6 97.8
78.2 79.3 58.8 60.9 43.8 47.5 7.7 9.8
42.7 49.8 46.5 ~.3

w '"
WEIGHTED NATIONAL NORMS FOR FULL-TIME UNDERGRADUATE FACULTY, 1992-1993
Four-vear Coll< ALL FACULTY ALL Universities All Non-
Institutions 4-vear 2-vear Public Private Public Private sectarian Catholic Protestant Evaluation Methods Used in Most or AU Undergraduate Counes
multiple-choice mid-tennslfinals 35.4 31.6 49.1 33.3 18.5 36.6 27.8 21.1 32.0 33.6 essay mid-tennslfinals 41.7 44.9 30.2 39.0 58.2 43.2 49.6 46.5 54.3 50.7 short-answer mid-tennslfinals 36.7 37.7 33.1 38.8 38.3 36.7 37.2 33.5 38.5 41.0 quizzes 40.9 37.8 52.0 38.3 28.5 40.8 37.0 32.9 38.0 41.4 weekly essay assignments 17.6 16.6 21.1 14.5 18.6 16.6 18.6 18.3 18.6 19.0 student presentations 29.8 31.4 24.2 27.7 33.6 31.0 36.6 36.0 36.2 37.5 tennlresearch papers 32.1 34.7 22.8 32.9 43.5 32.1 37.0 36.7 40.4 35.7 stdnt evals of each others' work 12.0 12.3 10.9 10.8 12.9 12.8 13.4 13.4 13.3 13.6 grading on a curve 18.2 20.4 10.4 25.4 22.9 16.7 17.3 18.6 17.9 15.3 competencv-based 2I"adine: 55.7 55.6 55.7 55.3 61.8 54.8 54.3 54.3 54.0 54.5
Instruction Methods Used in Most or AU Undergraduate Counes
class discussions 69.8 69.4 71.3 62.9 74.0 70.9 74.3 73.8 74.1 75.0 computer/machine-aided instruct 16.0 13.9 23.8 12.1 12.5 15.7 14.2 13.2 13.7 15.7 cooperative learning 32.5 31.7 35.7 25.8 31.4 33.9 36.9 34.9 39.5 38.0 experientiallearninglfield stud 19.8 19.8 19.9 17.9 20.1 20.5 21.5 19.9 23.4 22.3 teaching assistants 7.9 9.5 2.5 15.9 14.7 4.3 5.3 7.1 2.6 4.6 recitals or demonstrations 20.1 19.6 21.9 19.4 17.8 20.5 19.4 20.0 18.5 19.3 group projects 20.9 21.6 18.4 19.7 22.7 22.1 23.3 22.4 25.6 23.1 independent projects 37.1 38.5 32.3 37.5 40.5 37.9 39.8 40.0 39.0 40.0 extensive lecturing 53.6 54.2 51.5 62.5 55.7 50.6 47.1 45.0 49.5 48.3 multiple drafts of written work 14.1 14.4 13.1 10.2 18.1 15.4 17.2 16.8 16.6 18.1 readings on racial/ethnic issues 15.2 15.6 13.5 13.4 20.4 14.7 17.9 16.7 16.0 20.5 readings on women/gender issues 14.2 14.7 12.1 12.7 20.1 12.8 18.1 17.5 15.8 20.1 student-developed activities 17.1 16.9 18.0 16.5 14.6 18.5 16.1 14.6 16.4 17.7 student-selected tooics 9.8 10.1 8.7 9.0 10.0 11.0 10.5 10.0 11.1 10.8
Goals for Undergraduates Noted as Very Important or Essential
develop ability to think clearly 99.3 99.4 99.0 99.3 99.4 99.3 99.5 99.4 99.5 99.6 increase self-directed learning 92.2 92.4 91.6 91.6 90.3 93.1 93.5 93.3 93.7 93.6 prepare for employment 68.4 65.3 79.2 63.8 52.6 71.4 64.4 59.6 68.0 68.5 prepare for graduate education 55.0 56.7 49.3 54.6 55.1 56.6 60.6 56.4 60.2 66.0 develop moral character 57.0 55.3 63.4 46.0 57.5 57.2 64.8 59.6 66.9 70.0 provide for emotional developmnt 39.7 37.2 48.4 30.1 35.0 39.5 45.2 39.8 45.2 51.9 prepare for family living 19.5 17.5 26.6 11.9 16.9 19.9 22.4 18.5 21.8 27.4 teach classics of western civ 29.0 31.1 21.3 26.8 37.3 30.8 35.0 32.4 37.9 36.6 help develop personal values 61.8 60.0 68.0 51.2 61.2 61.9 69.7 64.5 71.0 75.2 enhance out-of-class experience 43.5 42.2 48.3 37.9 36.6 45.5 46.1 41.8 46.5 51.1 enhance self-understaDdin2 66.2 64.6 71.9 57.4 62.5 68.1 71.0 67.5 71.7 75.0
Two-year Colleges Public Private
48.9 52.9 30.0 33.8 33.1 33.8 52.0 52.7 21.2 19.2 23.5 36.8 22.3 30.8 10.8 12.5 10.4 10.5 56.1 48.9
71.2 72.5 24.0 21.4 35.8 33.4 19.8 21.5 2.4 2.9
21.6 25.4 18.2 22.1 31.9 40.6 51.2 55.9 12.9 16.4 13.6 12.6 12.1 10.8 17.9 19.8 8.5 11.5
99.0 99.1 91.6 92.0 79.1 81.3 49.4 47.9 62.3 80.5 47.6 62.3 26.2 33.8 21.0 25.7 67.1 82.3 47.6 59.3 71.6 77.2

w
"
WEIGHTED NATIONAL NORMS FOR FULL-TIME UNDERGRADUATE FACULTY, 1992-1993
Four-vear CoU ALL FACULTY ALL Universities All Non-
Institutions 4-vear 2-vear Public Private Public Private sectarian Catholic Protestant Political Orientation
far left 4.2 4.9 1.7 4.5 . 6.6 4.1 5.8 7.8 4.1 4.3 liberal 39.1 41.3 31.2 43.0 45.7 37.8 41.9 42.9 44.1 39.4 middle-of-the-road 35.0 33.7 39.4 33.9 31.6 35.7 31.4 30.0 35.5 31.0 conservative 21.2 19.6 27.1 18.1 15.6 21.9 20.4 18.9 16.1 24.5 farrildlt 0.5 0.5 0.6 0.4 0.5 0.5 0.5 0.4 0.2 0.7
Agrees Strongly or Somewhat abolish death penalty 42.2 44.4 34.4 43.9 53.8 39.1 48.7 49.9 53.3 44.6 national health care plan needed 83.9 84.7 80.9 85.1 87.1 83.5 84.8· 86.1 87.0 82.2 abortion should be legal 78.1 79.2 73.8 84.7 76.1 78.6 73.5 77.9 67.1 71.5 probibit racist/sexist speech 54.2 52.2 61.3 48.8 49.6 54.0 55.8 52.5 58.6 58.3 West Civ foundation ofUG curric 54.5 55.4 51.5 53.7 60.2 55.6 55.1 52.0 61.9 55.3 college can ban extreme speakers 26.9 25.5 31.9 20.3 28.0 25.1 32.4 28.1 32.7 37.4 college increases earning power 23.8 20.4 36.0 19.9 14.5 24.8 17.0 17.4 17.2 16.5 diversity yields undprep stdnts 30.3 29.4 33.8 30.8 27.0 31.8. 24.8 25.5 26.4 23.1 colI should helD solve soc orobs 65.9 66.9 62.4 64.9 67.7 67.0 69.3 66.5 70.7 72.0
Agrees Strongly or Somewbat fac interested in students' prob 76.6 73.9 86.2 60.3 79.5 76.2 87.7 83.2 88.6 92.7 fac sensitive to minority issues 72.9 71.8 76.8 67.7 75.0 71.6 76.7 75.4 74.2 79.7 people don't respect each other 31.3 31.9 29.5 34.6 25.0 34.0 28.0 30.2 26.5 26.1 students well prep academically 25.1 28.0 14.9 22.4 50.7 22.7 32.9 35.5 25.4 33.6 StOOt Aff staff supported by fac 59.7 59.3 60.9 ·56.5 63.1 57.1 65.0 63.7 65.2 66.5 fac committed to welfare of inst 81.5 80.0 86.6 73.3 87.1 78.4 89.0 88.0 87.6 91.1 courses incl minority perspect 39.9 39.6 41.1 34.6 40.0 42.1 42.9 43.2 39.4 44.2 low trust btwn minorities/admin 37.2 39.9 27.7 48.2 37.3 36.9 33.7 37.8 28.7 31.3 fac interest in stdnts acad prob 80.0 77.7 88.0 65.4 83.5 79.2 90.6 89.1 89.4 93.1 a lot of racial conflict here 14.2 15.6 9.2 22.9 9.6 14.1 10.5 12.1 8.9 9.3 courses inel feminist perspect 31.6 32.7 27.6 31.0 36.9 29.9 37.3 40.5 35.5 34.3 faculty of color treated fairly 86.4 85.6 89.4 84.9 86.6 85.8 85.7 85.2 87.5 85.3 women faculty treated fairly 81.6 80.6 85.0 78.4 82.8 79.9 83.9 85.4 85.4 81.5 administrators act in good faith 64.3 63.7 66.6 58.9 65.8 63.0 70.8 69.8 71.2 71.8 unionization enhances teaching 31.5 27.7 44.3 26.3 24.8 31.3 25.5 26.6 28.4 22.5 tenure is an outmoded conceot 40.2 39.5 42.4 39.2 39.3 40.4 38.8 39.4 39.2 37.8
Issues Noted as Being ofHigb or Highest Priority
promote intellectual development 79.4 79.2 80.3 74.2 84.8 77.7 85.9 85.8 85.3 86.4 help students understand values 52.0 51.4 54.1 34.4 69.5 48.3 72.3 65.1 78.2 77.8 hire more minority faculty/admin 46.5 47.2 44.2 47.3 43.5 52.0 41.5 46.8 35.1 38.3 devel community among stdnts/fac 47.7 46.5 51.7 32.7 52.6 47.1 63.2 58.7 61.9 69.2 dev leadersbip ability in stoots 43.6 43.2 44.8 32.4 47.9 44.8 54.4 52.1 52.9 58.0 hire more women faculty/admin 42.3 43.8 37.1 44.8 44'.6 44.9 40.0 44.1 37.5 36.3 involvement in community svcs 31.1 31.6 29.4 18.2 52.6 28.4 45.4 .38.8 51.4 50.2 teach students how to change soc 27.8 27.6 28.3 18.7 37.5 28.8 33.9 31.5 35.4 36.0 increase/maintain inst prestige 68.9 70.0 64.7 72.6 77.0 65.2 70.1 71.5 68.8 69.2 hire faculty 'stars' 20.4 23.1 11.0 35.9 27.1 16.0 13.1 14.3 11.9 12.2 recruit more minority students 51.9 53.7 45.4 53.7 53.2 54.3 53.1 57.5 50.6 49.1 enhance inst's national image 57.8 63.7 36.8 72.4 76.7 52.4 61.6 68.3 53.2 57.9 create multi-cultural environ 50.8 50.9 50.6 45.8 58.2 51.2 54.1 57.8 54.4 49.4
Two-year Colleges Public Private
1.8 0.3 31.6 25.3 39.6 36.3 26.5 36.5 0.5 1.6
34.7 27.9 81.6 69.0 74.6 61.7 61.0 67.3 51.1 57.7 31.0 45.4 36.5 27.1 33.9 31.4 62.2 65.3
85.7 94.7 76.7 78.0 29.8 24.4 14.6 20.1 60.6 67.1 86.5 89.4 41.5 34.9 28.0. 21.9 87.7 93.3 9.4 6.2
28.1 18.6 89.6 86.3 84.9 86.2 66.1 75.6 45.5 25.7 42.0 49.9
80.1 83.2 53.0 72.5 45.4 24.3 51.0 63.7 44.1 56.5 37.9 23.4 28.8 39.4 28.0 32.6 64.3 71.6 to.7 15.8 46.1 33.7 36.3 46.0 51.5 35.6

w co
WEIGHTED NATIONAL NORMS FOR FULL-TIME UNDERGRADUATE FACULTY, 1992-1993
Four-vear Coil - ---
ALL FACULTY ALL Universities All Non-Institutions 4-vear 2-vear Public Private Public Private sectarian Catholic Protestant
Percentage Noting AUributes as: Very Descriptive of Institution
easy to see fac outside ofc hour 39.7 39.1 41.8 27.2 42.6 38.0 56.5 54.8 55.6 58.9 great confonnity among students 25.9 29.2 14.1 25.1 36.0 27.3 34.8 30.8 36.8 38.7 most students are very bright 8.9 10.7 2.5 5.7 29.0 7.4 13.8 21.0 5.8 9.4 faculty at odds with admin 17.3 17.5 16.9 17.4 13.6 19.8 15.9 16.9 20.5 12.2 faculty respect each other 32.0 29.7 40.0 23.8 37.0 26.6 39.6 36.8 39.4 43.1 most stdnts treated like nwnbers 4.9 5.4 3.3 9.7 2.7 4.4 1.7 2.3 1.7 1.0 social activities overemphasized 9.8 11.8 2.7 14.6 12.2 9.2 11.4 10.9 8.2 13.6 little student/faculty contact 3.0 3.2 2.2 4.8 2.1 3.0 1.7 2.1 1.4 1.5 inst committed to minorities 32.7 31.0 38.7 25.6 31.5 33.6 34.5 33.3 35.3 35.5 intercoll sports overemphasized 19.3 22.6 7.7 38.9 12.6 17.9 10.7 8.8 10.3 13.1 stdnts don't socialize regularly 3.1 2.3 ' 6.1 1.8 0.7 3.9 1.3 1.4 1.6 1.2 fac rewarded for good teaching 9.9 lOA 8.5 5.4 17.6 8.3 17.3 19.0 15.3 16.2
Not Descriptive of Institution easy to see fac outside ofc hour 9.8 10.4 7.9 15.3 8.9 10.1 4.3 6.0 4.3 2.4 great confonnity among students 18.4 15.7 27.7 16.5 15.0 16.0 14.7 18.4 13.8 10.5 most students are very bright 44.4 40.6 58.0 45.1 22.0 47.2 33.3 27.4 45.9 33.6 faculty at odds with admin 33.6 33.1 35.1 30.5 37.7 32.0 36.3 33.4 34.3 41.0 faculty respect each other 6.9 7.5 4.6 8.8 6.1 8.1 5.3 6.6 4.4 4.4 most stdnts treated like nwnbers 72.6 70.6 79.4 52.1 81.9 72.7 89.0 87.0 87.8 92.3 social activities overemphasized 62.4 56.8 82.3 51.8 50.3 63.8 56.8 59.2 66.9 48.6 little student/faculty contact 72.3 70.8 71.7 58.0 79.0 71.5 84.5 83.3 82.0 87.4 inst committed to minorities 10.9 11.7 8.3 12.4 11.6 10.8 12.1 11.7 12.6 12.2 intercoll sports overemphasized 54.8 48.6 76.8 28.3 55.7 55.6 64.3 70.0 63.2 57.8 stdnts don't socialize regularly 68.7 74.9 47.1 77.2 83.6 66.7 79.8 78.8 73.0 84.6 fac rewarded for 1Z00d teachinlZ 41.5 40.2 46.1 47.4 26.2 45.0 29.0 28.0 30.5 29.5
Aspects of Job Noted as Very Satisfactory or Satisfactory (4)
salary and fringe benefits 40.8 38.3 49.5 32.1 49.6 37.6 43.2 48.2 44.0 36.7 oppty for scholarly pursuits 44.8 45.1 43.4 52.2 52.2 38.1 41.8 45.0 41.2 38.1 teaching load 51.9 52.7 48.8 60.4 57.5 46.8 48.2 53.0 48.2 42.2 quality of students 39.4 41.8 31.0 36.9 59.3 37.6 46.8 52.3 38.4 44.5 working conditions 65.6 66.2 63.5 66.6 74.5 62.7 67.1 71.5 65.8 62.3 autonomy and independence 82.7 83.1 81.3 83.8 85.7 80.4 84.7 86.8 83.8 82.6 prof relations w/other faculty 72.0 70.5 77.3 67.1 70.4 71.0 75.1 73.7 74.8 76.9 social relations w/other faculty 60.6 59.1 66.1 55.0 61.4 60.3 62.0 59.6 62.6 64.7 competency of colleagues 67.1 66.3 69.9 63.0 69.5 64.6 72.1 71.6 70.3 73.6 visibility for jobs 38.9 38.8 39.0 41.2 46.3 34.7 37.7 39.7 33.8 37.2 job security 70.7 69.3 75.4 70.2 71.3 68.9 67.6 69.1 69.7 64.6 undergraduate course assignments 77.9 77.5 79.5 77.3 78.0 76.4 79.5 81.7 78.7 77.2 graduate course assignments 71.1 71.8 48.7 74.0 73.9 68.2 69.5 69.4 70.7 68.4 relationships with admin 53.5 53.4 53.9 50.1 54.2 53.7 57.3 56.3 57.5 58.6 overall iob satisfaction 69.6 67.7 76.3 64.6 71.5 66.6 72.0 13.0 71.4 71.1
(4) Respondents marking "not applicable" are not included in tabulations.
Two-year Colleges Public Private
40.9 56.6 13.4 26.2 2.4 4.2
17.3 to.5 38.9 58.1 3.4 2.1 2.5 5.9 2.2 1.2
38.6 39.2 7.5 to.9 6.4 0.6 8.2 12.6
7.8 9.1 28.3 16.5 58.6 49.5 34.5 45.4 4.7 3.3
78.7 90.9 82.8 74.3 77.1 87.0
8.1 11.2 76.9 75.2 45.9 66.7 46.5 39.8
49.9 42.3 43.8 36.7 48.9 45.8 31.1 29.9 63.7 60.7 81.5 78.3 77.2 79.5 65.8 72.2 69.6 74.3 39.0 38.4 76.0 65.0 79.8 75.1 48.5 50.4 53.5 60.2 16.S 72.4

W IC
WEIGHTED NATIONAL NORMS FOR FULL-TIME UNDERGRADUATE FACULTY, 1992-1993
Four-vear Coll - .~~
ALL FACULTY ALL Universities All Non-Institutions 4-vear 2-vear Public Private Public Private sectarian Catholic Protestant
Personal Goals Noted as Very Important or Essential
become authority in own field 61.9 63.6 55.7 72.3 65.1 59.5 56.4 58.1 54.5 55.3 influence political structure 18.3 18.5 17.7 16.1 20.9 19.4 19.6 19.1 21.7 19.0 influence social values 44.7 43.9 47.7 36.0 48.3 45.2 51.5 49.1 52.4 54.0 raise a family 73.9 73.1 76.5 74.9 70.6 73.0 72.0 72.9 65.0 74.7 be very well-off financially 36.5 35.0 42.0 37.8 31.9 36.9 29.3 30.6 28.2 28.2 help others in difficulty 68.1 66.6 73.4 61.8 65.3 68.7 71.4 67.5 72.3 75.7 be involved in environ clean-up 41.3 40.1 45.4 38.7 31.1 44.3 40.3 37.7 41.1 43.1 develop philosophy of life 80.2 79.9 81.2 76.5 80.5 81.1 82.9 79.6 85.9 85.3 promote racial understanding 63.5 64.1 61.5 57.5 65.7 66.3 69.7 67.1 71.3 72.0 obtain recog from colleagues 47.7 50.6 37.4 58.5 55.4 46.2 42.9 45.5 44.8 38.8
Amount of Stress Experienced in the Last Two Years
extreme 34.1 34.4 32.9 34.5 34.2 33.5 35.7 36.1 35.1 35.5 moderate 53.3 53.1 53.7 52.9 53.4 52.9 53.6 52.8 55.1 53.7 little 12.7 12.5 13.4 12.5 12.3 13.6 10.7 11.1 9.7 10.8
Sources of Stress (5) household responsibilities 66.0 64.1 72.8 61.9 65.0 63.8 67.6 67.8 66.8 67.9 child care 32.6 31.5 36.3 29.7 34.8 31.2 33.1 33.3 31.9 33.5 care of elderly parent 26.2 25.2 29.7 25.1 24.6 25.2 25.8 25.6 28.4 24.7 my physical health 40.4 39.4 44.2 38.1 41.1 39.9 39.6 39.1 41.3 39.3 review/promotion process 44.4 46.2 37.8 47.4 47.3 46.9 42.8 43.1 43.6 42.2 subtle discrimination 25.7 26.6 22.6 25.1 26.2 28.8 25.6 24.1 24.2 28.3 personal finances 60.6 60.1 62.2 59.5 56.1 61.3 61.2 58.9 59.0 65.2 committee work 54.3 54.1 55.0 54.7 52.3 52.7 56.6 54.9 59.8 56.9 faculty meetings 47.7 47.2 49.3 47.4 45.3 47.5 47.7 46.6 52.4 46.5 colleagues 56.1 57.1 52.7 59.3 54.2 56.6 56.0 56.1 54.6 56.5 students 56.6 54.2 65.2 53.1 50.4 54.2 57.7 56.7 55.9 59.7 research or publishing demands 49.7 60.3 11.8 72.7 71.6 52.7 48.0 52.3 51.3 40.9 inst procedures & 'red tape' 68.2 68.4 67.4 71.8 61.3 71.3 62.6 60.2 65.5 64.0 teaching load 67.7 66.5 72.2 61.1 63.7 69.1 71.8 68.6 71.9 75.6 children's problems 33.4 31.6 39.5 30.4 32.0 32.3 32.2 31.8 30.5 33.5 marital friction 25.1 24.5 27.1 24.2 27.0 24.6 23.3 23.7 22.7 23.2 time pressures 84.5 84.6 84.2 84.7 86.9 82.0 87.4 86.4 87.3 88.6 lack of oersonallife 80.7 80.6 81.3 79.4 82.4 78.8 84.2 83.2 84.0 85.5
Still Want to Be CoUege Professor?
definitely yes 48.4 48.1 49.4 44.8 53.6 47.1 51.6 50.2 53.0 52.5 probably yes 33.3 33.1 33.9 33.8 30.4 33.5 32.8 33.5 31.8 32.6 not sure 11.2 11.3 10.9 12.1 10.7 U.5 9.9 10.4 10.3 9.2 probably no 5.6 5.9 4.6 7.4 3.9 6.1 4.5 4.8 3.8 4.5 definitely no 1.5 1.6 1.2 1.9 1.3 1.8 1.1 1.1 1.0 1.2
(5) Includes those marking "somewhat" or "extensive."
Two-year Colleges Public Private
55.5 59.1 17.7 18.2 47.1 57.0 76.3 79.5 42.3 36.2 72.8 83.1 45.0 51.4 80.8 87.6 61.1 68.6 37.2 40.3
32.7 35.8 53.7 55.1 13.7 9.1
72.6 76.4 36.1 39.7 29.8 28.4 44.5 39.1 37.8 38.3 23.0 16.0 61.7 70.4 54.6 62.2 49.2 50.3 52.9 50.4 65.3 63.8 11.6 16.1 67.6 64.7 72.1 74.6 39.8 34.7 27.0 28.5 83.9 88.7 81.2 83.0
49.6 46.1 33.7 36.8 10.9 12.1 4.6 4.1 1.2 0.9

.po
WEIGHTED NATIONAL NORMS FOR FULL-TIME UNDERGRADUATE FACULTY, 1992-1993
Four-vear CoU ALL FACULTY ALL Universities All Non-
Institutions 4-vear 2-vear Public Private Public Private sectarian Catholic Protestant Field of Highest Degree Held
agriculture 1.4 1.6 0.9 3.6 0.3 0.9 0.4 0.2 0.0 0.8 architecture/urban planning 0.5 0.5 0.7 1.2 0.0 0.1 0.1 0.3 0.0 0.1 bacteriology, molecular biology 1.0 1.0 0.9 1.2 1.0 0.8 0.9 0.7 1.2 1.0 biochemistry 0.5 0.6 0.5 0.7 0.7 0.4 0.6 0.7 0.5 0.6 biophysics 0.1 0.1 0.1 0.1 0.1 0.0 0.1 0.2 0.2 0.1 botany 0.7 0.8 0.4 0.8 0.5 0.9 0.8 0.7 0.5 1.2 marine life sciences 0.1 0.2 0.1 0.1 0.0 0.2 0.2 0.2 0.2 0.1 physiology, anatomy 0.7 0.8 0.3 1.0 0.7 0.6 0.7 0.6 0.9 0.6 zoology 1.3 1.4 0.8 1.5 1.2 1.5 1.2 1.1 0.8 1.6 general, oth biological science 1.4 1.1 2.3 1.4 0.8 1.1 1.0 1.2 1.0 0.8 accounting 1.7 1.8 1.4 1.5 1.7 1.9 2.1 1.7 2.6 2.3 finance 0.7 0.7 0.8 0.5 1.0 0.7 0.8 0.6 1.3 0.7 marketing 0.9 1.0 0.6 0.8 1.3 0.9 1.0 0.8 2.1 0.8 management 2.1 1.8 3.4 1.5 1.9 1.7 2.4 2.2 3.4 2.0 secretarial studies 0.1 0.0 0.3 0.0 0.0 0.0 0.0 0.0 0.0 0.0 general, other business 1.0 0.7 1.8 0.5 1.1 0.8 0.8 0.6 1.3 0.8 computer science 1.2 1.2 1.3 0.8 1.3 1.2 1.5 1.7 1.8 1.2 business education 1.1 0.5 3.1 0.3 0.1 1.0 0.4 0.3 0.1 0.6 elementary education 1.1 1.2 1.0 0.8 0.5 1.7 1.2 0.8 1.1 1.8 educational administration 1.3 1.2 1.7 0.5 0.7 1.8 1.5 0.9 2.1 1.8 educational psych, counseling 1.1 0.9 1.7 0.8 0.4 1.1 1.0 1.1 1.0 0.9 higher education 1.7 1.2 3.3 1.0 0.6 1.6 1.2 0.8 2.0 1.2 music or art education 0.5 0.5 0.6 0.3 0.3 0.8 0.5 0.4 0.3 0.7 physical or health education 3.0 3.0 3.3 2.6 0.7 4.2 2.7 2.3 1.8 3.6 secondary education 1.2 1.0 1.8 0.8 0.4 1.6 0.9 0.8 0.5 1.1 special education 0.7 0.8 0.5 0.7 0.1 1.3 0.7 0.6 0.5 0.9 general, other education fields 3.7 3.2 5.7 2.6 1.2 4.4 3.3 2.6 3.7 3.9 aeronautical, astronautical eng 0.2 0.2 0.0 0.5 0.0 0.2 0.1 0.2 0.0 0.1 chemical engineering 0.4 0.5 0.1 1.2 0.2 0.2 0.1 0.2 0.1 0.0 civil engineering 0.8 1.0 0.3 1.8 0.8 0.6 0.3 0.6 0.3 0.0 electrical engineering 1.3 1.2 1.3 1.8 1.5 0.9 0.8 1.4 0.8 0.1 industrial engineering 0.4 0.4 0.2 0.8 0.3 0.3 0.1 0.2 0.1 0.1 mechanical engineering 0.9 0.9 1.0 1.6 1.0 0.6 0.4 0.7 0.3 0.0 nuclear engineering 0.1 0.1 0.0 0.2 0.1 0.1 0.0 0.1 0.0 0.0 general, other engineering field 0.8 0.9 0.7 1.6 0.4 0.6 0.4 0.7 0.2 0.1 ethnic studies 0.0 0.0 0.0 0.0 0.0 0.0 0.0 0.0 0.0 0.0 art 2.2 2.4 1.7 2.1 1.3 2.4 3.2 4.4 1.7 2.3 dramatics or speech 2.2 2.4 1.5 2.3 2.0 2.6 2.6 2.6 1.3 3.4 music 2.9 3.4 1.1 3.3 2.6 3.7 3.5 2.9 1.7 5.3 other fine arts 0.7 0.8 0.4 0.6 0.9 0.6 1.3 2.1 0.4 0.8 forestrv 0.1 0.1 0.1 0.4 0.0 0.0 0.0 0.0 0.1 0.1
Two-year Colleges Public Private
1.0 0.0 0.7 0.7 0.9 1.3 0.5 0.7 0.1 0.3 0.4 0.3 0.1 0.0 0.3 0.2 0.7 1.4 2.2 3.8 1.4 1.9 0.7 1.0 0.6 1.3 3.4 3.6 0.3 0.0 1.7 3.5 1.3 0.7 3.0 4.8 1.0 1.5 1.6 3.5 1.7 1.3 3.5 0.8 0.6 0.6 3.2 3.6 1.9 1.1 0.5 0.4 5.8 4.4 0.0 0.3 0.1 0.0 0.3 0.0 1.4 0.3 0.2 '0.0 1.1 0.0 0.0 0.0 0.7 0.3 0.0 0.0 1.7 1.2 1.5 0.7 1.0 3.3 0.4 0.6
.... ~ 0.0

.pI-'
WEIGHTED NATIONAL NORMS FOR FULL-TIME UNDERGRADUATE FACULTY, 1992-1993
Four-vear ColI ~
ALL FACULTY ALL Universities All Non-Institutions 4-vear 2-vear Public Private Public Private sectarian Catholic Protestant
Field of Degree (continued) geology 0.6 0.8 0.1 0.9 0.4 1.1 0.2 0.2 0.2 0.2 dentistry 0.2 0.1 0.4 0.2 0.0 0.1 0.0 0.0 0.0 0.0 health technology 0.1 0.0 0.2 0.1 0.0 0.1 0.0 0.0 0.1 0.0 medicine or surgery 0.3 0.3 0.2 0.8 0.0 0.0 0.1 0.0 0.0 0.2 nursing 3.4 2.0 8.2 2.0 0.6 2.2 2.6 2.1 4.8 2.0 pharmacy, pharmacology 0.3 0.4 0.1 0.7 1.0 0.1 0.1 0.3 0.0 0.0 therapy (speech,physical,occup) 0.5 0.5 0.2 0.7 0.4 0.7 0.3 0.4 0.2 0.1 veterinary medicine 0.1 0.1 0.1 0.1 0.0 0.1 0.1 0.1 0.0 0.1 general, other health fields 0.8 0.6 1.3 0.8 0.1 0.8 0.4 0.3 0.7 0.5 home economics 0.4 0.5 0.2 0.7 0.1 0.6 0.2 0.1 0.1 0.4 English language & literature 6.8 6.2 8.8 4.5 7.0 6.8 7.6 6.9 8.4 8.0 foreign languages & literature 0.5 0.5 0.4 0.5 0.7 0.3 0.6 0.6 0.6 0.5 French 0.8 1.0 0.3 0.9 1.0 0.9 1.1 1.2 1.0 1.1 German 0.5 0.6 0.1 0.8 1.0 0.4 0.7 0.9 0.4 0.6 Spanish 1.1 1.2 0.6 0.8 1.7 1.3 1.4 1.4 0.7 1.8 other foreign languages 0.6 0.7 0.2 0.8 1.2 0.2 0.9 1.2 0.5 0.7 history 3.7 4.1 2.0 3.2 5.8 4.3 4.4 4.7 4.1 4.3 linguistics 0.7 0.7 0.4 1.1 1.5 0.3 0.4 0.4 0.6 0.2 philosophy 1.5 1.7 0.5 1.2 3.0 1.4 2.4 2.1 4.1 1.9 religion & theology 1.3 1.5 0.5 0.3 3.9 0.4 4.0 2.7 5.1 5.0 general, other hwnanities fields 1.0 1.1 0.6 1.2 1.5 0.7 1.2 1.6 0.9 1.1 journalism 0.6 0.7 0.3 0.7 1.0 0.8 0.5 0.5 0.4 0.7 law 0.8 0.7 1.0 0.5 1.4 0.8 0.6 0.7 0.9 0.4 law enforcement 0.2 0.1 0.6 0.1 0.0 0.3 0.1 0.1 0.0 0.1 library science 0.3 0.2 0.5 0.2 0.1 .0.3 0.3 0.3 0.2 0.4 mathematics and/or statistics 5.8 5.7 6.3 5.8 5.3 6.0 5.5 5.3 5.5 5.6 military science 0.0 0.0 0.0 0.0 0.0 0.0 0.0 0.0 0.0 0.0 astronomy 0.1 0.1 0.1 0.2 0.0 0.1 0.2 0.3 0.0 0.2 atmospheric sciences 0.1 0.1 0.0 0.2 0.0 0.1 0.0 0.0 0.0 0.0 chemistry 3.1 3.3 2.2 3.0 3.8 3.0 3.9 4.0 4.0 3.6 earth sciences 1.0 1.2 0.5 1.7 0.3 1.2 0.6 0.9 0.2 0.5 marine sciences 0.1 0.1 0.0 0.1 0.0 0.1 0.1 0.0 0.1 0.1 physics 2.3 2.5 1.8 2.9 3.2 1.8 2.3 2.8 1.5 2.2 general, other physical sciences 0.1 0.1 0.2 0.1 0.0 0.1 0.2 0.2 0.1 0.1 clinical psychology 0.6 0.8 0.2 0.9 0.7 0.7 0.7 0.5 0.5 1.0 counseling & guidance 0.7 0.5 1.2 0.3 0.3 0.7 0.6 0.4 0.8 0.7 experimental psychology 1.2 1.4 0.3 1.6 1.6 1.3 1.3 1.6 1.2 1.1 social psychology 0.6 0.7 0.2 0.6 0.5 0.7 0.8 0.9 1.2 O.S 2eneral other DsvchololZV 1.1 1.1 1.2 0.9 1.4 1.2 1.1 1.0 1.2 1.1
Two-year Colleges Public Private
0.1 0.2 0.4 0.0 0.2 1.2 0.1 0.7 8.1 10.1 0.1 0.0 0.2 0.2 0.1 0.0 1.3 0.8 0.2 0.0 8.8 8.2 0.4 0.6 0.3 0.3 0.1 0.0 0.6 0.8 0.2 0.0 1.9 3.6 0.4 0.2 0.6 0.0 0.2 5.0 0.6 1.0 0.3 0.7 1.0 1.8 0.6 0.3 0.5 0.5 6.4 4.2 0.0 0.0 0.1 0.0 0.0 0.0 2.3 1.4 0.5 0.0 0.0 0.0 1.9 0.3 0.2 0.0 0.2 0.0 1
1.2 1.6 0.4 0.0 0.2 0.0 1.3 0.3J

~ N
WEIGHTED NATIONAL NORMS FOR FULL-TIME UNDERGRADUATE FACULTY, 1992-1993
Four-vear Coil ~
ALL FACULTY ALL Universities All Non-Institutions 4-vear 2-vear Public Private Public Private sectarian Catholic Protestant
Field of Degree (continued) anthropology 0.8 0.9 0.4 1.0 1.2 0.7 1.0 1.3 0.6 0.7 archaeology 0.1 0.1 0.0 0.1 0.1 0.1 0.1 0.2 0.1 0.1 economics 2.7 3.2 1.2 3.1 5.8 2.4 3.1 3.4 3.7 2.4 political science, government 2.3 2.8 0.8 2.1 6.5 2.4 2.5 3.0 2.3 2.0 sociology 2.1 2.3 1.2 2.6 2.8 2.0 2.0 1.8 2.6 1.9 general, other social sciences 0.9 0.8 1.2 0.9 1.2 0.8 0.6 0.5 0.7 0.8 social work, social welfare 0.7 0.7 0.6 0.5 0.3 1.0 0.8 0.6 0.7 1.0 building trades 0.1 0.0 0.2 0.0 0.0 0.0 0.0 0.0 0.0 0.0 data processing, computer prog 0.2 0.1 0.3 0.1 0.0 0.2 0.1 0.2 0.1 0.0 drafting/design 0.1 0.0 0.2 0.0 0.0 0.0 0.0 0.1 0.0 0.0 electronics 0.1 0.0 0.4 0.0 0.0 0.0 0.0 0.0 0.0 0.0 industrial arts 0.3 0.3 0.4 0.4 0.1 0.5 0.1 0.2 0.0 0.0 mechanics 0.1 0.0 0.6 0.0 0.0 0.0 0.0 0.0 0.0 0.0 other technical 0.3 0.2 0.8 0.1 0.0 0.3 0.1 0.3 0.0 0.0 other vocational 0.3 0.1 1.0 0.1 0.0 0.2 0.0 0.0 0.0 0.1 women's studies 0.0 0.0 0.0 0.0 0.1 0.0 0.0 0.0 0.0 0.0 all other fields 1.3 1.3 1.2 1.6 1.7 1.3 0.9 1.1 1.0 0.6
Department of Current Faculty Appointment
agriculture 1.7 2.0 0.8 4.7 0.2 1.1 0.2 0.2 0.0 0.3 architecture/urban planning 0.5 0.5 0.4 1.3 0.0 0.1 0.2 0.4 0.0 0.0 bacteriology, molecular biology 0.4 0.5 0.1 0.6 0.5 0.5 0.3 0.1 0.4 0.5 biochemistry 0.2 0.2 0.1 0.3 0.0 0.1 0.1 0.1 0.1 0.1 biophysics 0.0 0.1 0.0 0.1 0.0 0.0 0.0 0.0 0.0 0.0 botany 0.1 0.1 0.1 0.2 0.2 0.1 0.1 0.1 0.3 0.1 marine life sciences 0.1 0.1 0.0 0.1 0.0 0.1 0.1 0.1 0.1 0.0 physiology, anatomy 0.4 0.3 0.6 0.5 0.2 0.2 0.2 0.2 0.1 0.2 zoology 0.3 0.3 0.0 0.4 0.2 0.4 0.1 0.1 0.1 0.1 general, oth biological science 4.1 3.9 4.7 3.4 3.7 4.0 4.7 4.4 4.3 5.3 accounting 2.3 2.1 2.7 1.9 2.4 2.2 2.2 2.0 3.6 1.9 finance 0.6 0.7 0.1 0.7 1.1 0.7 0.8 0.5 1.5 0.7 marketing 0.9 1.1 0.5 0.9 1.4 1.1 1.0 0.9 1.6 0.7 management 2.4 2.4 2.3 1.7 3.4 2.4 3.1 2.7 5.4 2.2 secretarial studies 0.6 0.1 2.5 0.0 0.0 0.1 0.1 0.2 0.0 0.2 ~eneral. other business 1.7 ----- 1.3 ~.3 0.5 I.J 1.5 2.0 .. ~1.2 -----.2.1 -.28
Two-year Colleges Public Private
0.4 0.3 0.0 0.3 1.2 1.6 0.8 0.3 1.3 0.6 1.2 1.2 0.6 0.0 0.2 0.0 0.3 0.0 0.2 0.0 0.4 0.0 0.5 0.0 0.6 0.0 0.8 0.3 1.0 0.2 0.0 0.0 1.2 1.6
0.9 0.0 0.4 0.6 0.1 0.0 0.1 0.0 0.0 0.0 0.0 0.4 0.0 0.4 0.6 1.9 0.0 0.4 4.8 3.1 2.7 3.4 0.1 0.0 0.5 1.1 2.2 4.9 2.5 1.4 3.3 2.1

~ w
WEIGHTED NATIONAL NORMS FOR FULL-TIME UNDERGRADUATE FACULTY, 1992-1993
Four-vear Coil -ALL FACULTY ALL Universities All Non-Institutions 4-vear 2-vear Public Private Public Private sectarian Catholic Protestant
Current Department (continued) computer science 1.9 1.8 2.2 1.4 1.6 2.1 2.1 2.1 2.8 1.8 business education 0.4 0.4 0.6 0.2 0.1 0.7 0.3 0.2 0.5 0.4 elementary education 1.3 1.7 0.2 0.8 0.6 2.8 1.7 1.0 2.3 2.2 educational administration 0.2 0.3 0.0 0.2 0.1 0.4 0.3 0.2 0.1 0.6 educational psych, counseling 0.4 0.4 0.2 0.7 0.4 0.5 0.1 0.0 0.1 0.2 higher education 0.2 0.2 0,2 0.1 0.1 0.3 0.2 0.2 0.3 0.3 music or art education 0.1 0.2 0.1 0.0 0.2 0.3 0.2 0.2 0.0 0.2 physical or health education 3.4 3.4 3.3 3.1 0.8 4.6 3.4 2.9 2.5 4.5 secondary education 0.6 0.8 0.0 0.6 0.3 1.2 0.6 0.3 0.5 1.1 special education 0.5 0.6 0.2 0.5 0.0 1.0 0.3 0.3 0.4 0.3 general, other education fields 1.8 2.0 1.2 1.7 0.8 2.7 1.8 1.5 2.3 1.9 aeronautical, astronautical eng 0.1 0.1 0.0 0.3 0.0 0.1 0.0 0.0 0.0 0.0 chemical engineering 0.4 0.5 0.0 1.2 0.2 0.1 0.1 0.1 0.1 0.0 civil engineering 0.8 0.9 0.4 1.9 0.8 0.4 0.3 0.7 0.2 0.0 electrical engineering 1.1 1.2 0.8 1.9 1.6 0.6 0.8 1.4 0.7 0.1 industrial engineering 0.2 0.3 0.0 0.7 0.1 0.1 0.0 0.1 0.1 0.0 mechanical engineering 1.1 1.2 0.9 2.2 1.1 0.5 0.6 1.2 0.3 0.0 nuclear engineering 0.0 0.0 0.0 0.1 0.0 0.0 0.0 0.0 0.0 0.0 general, other engineering field 1.0 1.0 1.1 1.8 0.5 0.8 0.2 0.5 0.0 0.0 ethnic studies 0.0 0.0 0.0 0.0 0.0 0.0 0.0 0.1 0.0 0.0 art 2.5 2.7 1.6 2.6 1.9 2.8 3.2 4.3 1.9 2.5 dramatics or speech 2.1 2.4 1.0 2.4 1.5 2.5 2.7 2.7 1.0 3.7 music 3.1 3.S 1.3 3.4 2.6 3.9 3.6 2.9 1.7 5.6 other fine arts 0.5 0.6 0.4 0.3 0.9 0.5 0.9 1.6 0.4 0.2 forestry 0.1 0.2 0.0 0.5 0.0 0.0 0.0 0.0 0.0 0.0 geology 0.6 0.8 0.1 1.1 0.2 1.0 0.1 0.1 0.1 0.2 dentistry 0.3 0.1 0.7 0.3 0.0 0.1 0.0 0.0 0.0 0.0 health technology 0.3 0.1 1.1 0.2 0.1 0.2 0.1 0.1 0.1 0.0 medicine or surgery 0.2 0.3 0.0 0.8 0.0 0.0 0.0 0.0 0.0 0.1 nursing 3.9 2.6 8.7 2.8 0.8 2.7 3.2 2.4 6.3 2.6 pharmacy, pharmacology 0.3 0.4 0.0 0.7 1.1 0.1 0.1 0.3 0.0 0.0 therapy (speech,physical,occup) 0.6 0.7 0.3 1.0 0.3 0.8 0.2 0.2 0.7 0.0 veterinary medicine 0.0 0.0 0.1 0.1 0.0 0.0 0.0 0.0 0.0 0.0 general, other health fields 1.2 0.9 2.4 0.9 0.1 1.3 0.5 0.7 0.5 0.4 home economics 0.7 0.8 0.2 1.3 0.1 1.1 0.2 0.1 0.2 0.4 English language & literature 7.9 7.0 11.1 5.2 8.3 7.6 8.3 7.6 8.9 8.7 foreign languages & literature 2.1 2.5 0.6 2.3 2.0 2.5 3.1 3.0 2.8 3.3 French 0.3 0.4 0.0 0.3 0.7 0.2 0.5 0.6 0.3 0.4 German 0.3 0.3 0.0 0.5 0.8 0.1 0.3 0.4 0.1 0.3 Spanish 0.4 O.S 0.1 0.4 1.4 0.3 0.5 0.5 0.2 0.6 other foreign languages 0.4 0.5 0.1 0.5 1.5 0.2 0.6 0.9 0.3 0.4
Two-year Colleges Public Private
2.1 3.2 0.5 2.5 0.1 1.3 0.0 0.0 0.2 0.0 0.2 0.0 0.1 0.0 3.2 5.1 0.0 0.0 0.2 0.4 1.3 0.9 0.0 0.0 0.0 0.0 0.4 0.0 0.9 0.4 0.0 0.0 0.9 0.0 0.0 0.0 1.1 0.0 0.0 0.0 1.6 1.3 1.0 1.1 1.2 3.4 0.4 0.0 0.0 0.0 0.1 0.0 0.7 0.0 1.0 3.0 0.0 0.4 8.6 9.7 0.0 0.0 0.3 0.5 0.1 0.0 2.2 4.8 0.2 0.0
11.3 8.3 0.6 0.4 0.0 0.5 0.0 0.0 0.1 0.5 0.1 0.0

~ ~
WEIGHTED NATIONAL NORMS FOR FULL-TIME UNDERGRADUATE FACULTY, 1992-1993
Four-vear con ALL FACULTY ALL Universities All Non-
Institutions 4-vear 2-vear Public Private Public Private sectarian Catholic Protestant Current Department (continued)
history 3.3 3.8 1.6 3.2 5.3 3.7 3.9 3.8 4.0 4.0 linguistics 0.2 0.2 0.1 0.2 0.8 0.0 0.0 0.0 0.0 0.0 philosophy 1.4 1.6 0.4 1.2 2.8 1.2 2.3 2.0 3.8 2.0 religion & theology 1.2 1.4 0.3 0.1 4.0 0.1 4.1 2.5 5.6 5.2 general, other humanities fields 1.3 1.1 1.9 0.9 0.6 0.9 1.8 2.5 1.2 1.3 journalism 0.9 1.0 0.3 1.0 2.3 0.9 0.5 O.S 0.6 0.4 law 0.2 0.2 0.2 0.2 0.4 0.2 0.1 0.2 0.1 0.1 law enforcement 0.6 0.3 1.3 0.1 0.7 0.6 0.1 0.2 0.1 0.0 library science 0.3 0.2 0.4 0.1 0.0 0.3 0.3 0.3 0.2 0.4 mathematics and/or statistics 6.4 5.9 8.1 5.4 5.4 6.5 6.2 5.5 5.5 7.3 military science 0.0 0.0 0.0 0.0 0.0 0.1 0.1 0.1 0.1 0.0 astronomy 0.1 0.1 0.0 0.3 0.0 0.0 0.1 0.2 0.0 0.0 atmospheric sciences 0.0 0.1 0.0 0.1 0.0 0.0 0.0 0.0 0.0 0.0 chemistry 3.0 3.3 2.0 2.8 3.5 3.1 4.1 3.8 4.3 4.2 earth sciences 0.9 1.1 0.3 1.6 0.3 1.3 0.6 0.9 0.1 0.5 marine sciences 0.1 0.1 0.0 0.2 0.0 0.0 0.0 0.0 0.0 0.1 physics 2.0 2.2 1.4 2.3 2.9 1.9 2.1 2.9 1.4 1.7 general, other physical sciences 0.4 0.2 1.1 0.2 0.0 0.3 0.3 0.4 0.4 0.2 clinical psychology 0.3 0.4 0.1 0.7 0.5 0.2 0.2 0.1 0.3 0.2 counseling & guidance 0.3 0.2 0.5 0.2 0.1 0.4 0.2 0.2 0.1 0.2 experimental psychology 0.6 0.7 0.0 1.1 0.8 0.5 0.5 0.7 0.3 0.5 social psychology 0.1 0.2 0.0 0.2 0.2 0.1 0.2 0.2 0.2 0.2 general, other psychology 2.1 2.1 1.9 0.9 2.1 2.9 2.8 2.7 2.6 3.0 anthropology 0.6 0.7 0.2 0.8 0.9 0.6 0.5 0.9 0.1 0.3 archaeology 0.0 0.0 0.0 0.0 0.0 0.0 0.0 0.1 0.0 0.0 economics 2.2 2.6 1.1 2.5 5.1 1.9 2.5 3.1 2.3 1.9 political science, government 2.1 2.5 0.2 1.9 5.9 2.1 2.5 3.0 1.8 2.2 sociology 2.0 2.3 0.9 2.6 2.6 1.9 2.3 1.8 3.1 2.5 general, other social sciences 2.0 1.5 3.7 1.0 1.5 2.0 1.4 1.4 1.2 1.6 social work, social welfare 0.6 0.6 0.4 0.4 0.2 0.9 0.8 0.6 0.5 1.2 building trades 0.2 0.0 0.6 0.1 0.0 0.0 0.0 0.0 0.0 0.0 data processing,computer prog 0.5 0.2 1.6 0.1 0.0 0.3 0.2 0.3 0.3 0.1 drafting/design 0.2 0.1 0.6 0.1 0.0 0.1 0.1 0.2 0.0 0.0 electronics 0.4 0.1 1.7 0.0 0.0 0.2 0.0 0.1 0.0 0.0 industrial arts 0.2 0.2 0.2 0.2 0.0 0.4 0.1 0.2 0.0 0.0 mechanics 0.3 0.0 1.2 0.0 0.0 0.1 0.0 0.0 0.0 0.0 other technical 0.8 0.5 2.0 0.3 0.0 0.7 0.7 1.5 0.0 0.0 other vocational O.S 0.1 1.8 0.1 0.1 0.1 0.0 0.1 0.0 0.0 women's studies 0.1 0.1 0.0 0.1 0.0 0.0 0.1 0.1 0.0 0.0 all other fields 2.0 2.0 2.3 2.1 1.7 2.1 ..... ~ 2.3 1.6 .. - 0.9
Two-year Colleges Public Private
1.5 2.8 0.1 0.0 0.5 0.0 0.0 4.5 1.9 2.7 0.3 0.7 0.1 1.2 1.4 0.4 0.4 0.0 8.3 5.1 0.0 0.2 0.0 0.0 0.0 0.0 2.0 1.5 0.3 0.0 0.0 0.0 1.4 0.7 1.2 0.4 0.1 0.0 0.5 0.2 0.0 0.0 0.0 0.2 1.9 2.4 0.2 0.3 0.0 0.0 1.1 1.1 0.3 0.0 0.9 0.6 3.8 1.7 0.4 0.0 0.7 0.0 1.6 1.1 0.6 1.4 1.7 1.4 0.2 0.0 1.3 0.0 2.1 0.0 1.8 0.5 0.0 0.0 2.4 1.6

National Normative Data for
the 1992-93 HERI Faculty Survey
Male Faculty
45


.p.. '-J
WEIGHTED NATIONAL NORMS FOR FULL-TIME UNDERGRADUATE FACULTY, 1992-1993
Four-vear Coli ~
MALE FACULTY ALL Universities All Non-Institutions 4-vear 2-vear Public Private Public Private sectarian Catholic Protestant
Number of ResDondents 19790 17720 2070 2679 2152 6720 6169 2623 1301 2245 Age as of Deeember 31,1992
less than 30 1.7 1.7 1.8 1.5 1.6 1.9 1.7 1.3 2.1 2.0 30 to 34 7.0 7.6 4.5 8.1 7.3 7.2 7.7 8.3 6.7 7.4 35 to 39 11.3 11.9 8.8 12.5 11.0 10.3 13.9 13.4 11.2 15.8 40 to 44 14.3 14.2 15.0 1304 15.0 14.0 15.4 14.4 17.7 15.4 45 to 49 17.7 16.7 22.5 15.2 17.2 17.7 17.1 18.6 16.1 15.7 50 to 54 19.3 18.5 22.9 17.8 16.4 20.6 17.6 16.5 15.8 19.8 55 to 59 14.8 14.8 14.7 15.8 11.4 16.0 12.9 13.3 12.8 12.5 60 to 64 10.2 10.9 7.2 11.8 13.0 9.6 10.1 lOA 11.3 9.2 65 to 69 3.0 3.2 1.8 3.4 6.0 2.0 3.2 3.5 5.4 2.0 70 or more 0.6 0.6 0.8 0.5 1.2 0.7 0.4 0.4 0.8 0.2
Academic Rank professor 40.2 41.1 36.3 45.2 41.6 38.4 37.8 41.7 27.9 37.7 associate professor 27.2 28.7 20.3 28.8 30.3 27.9 29.0 28.1 34.8 27.5 assistant professor 22.2 23.7 15.3 21.3 23.1 24.8 26.5 24.0 31.4 27.2 lecturer 1.6 1.8 0.8 1.9 2.2 Z.2 0.7 0.8 0.7 0.7 instructor 8.0 4.1 25.3 2.3 2.1 6.1 5.0 4.2 4.3 6.5 other 0.9 0.6 2.0 0.5 0.7 0.6 0.9 I.l 1.0 0.6
Administrative Title not applicable 76.2 76.0 76.9 80.1 79.1 75.6 68.0 71.9 69.5 62.5 director or coordinator 9.2 9.8 6.7 10.5 9.2 9.6 9.3 8.6 10.6 9.6 department chair 9.9 9.2 13.2 4.1 7.4 9.9 18.0 14.9 15.5 22.9 dean 0.2 0.3 0.0 0.1 0.0 0.5 0.4 0.2 0.7 0.5 associate or assistant dean 0.4 0.5 0.2 0.5 0.8 0.4 0.4 0.4 0.3 0.4 vice-pres, provost, vice-chane 0.1 0.1 0.1 0.1 0.0 0.1 0.2 0.2 0.2 0.0 president. chancellor 0.0 0.0 0.0 0.0 0.0 0.0 0.0 0.0 0.1 0.0 other 3.9 4.1 2.9 4.7 3.4 3.9 3.8 3.8 3.2 4.0
Principal Activity administration 3.8 4.0 3.0 4.3 2.7 4.4 3.3 3.2 3.7 3.3 teaching 91.0 89.9 95.7 81.9 93.0 93.9 95.1 94.7 9504 95.3 research 4.2 5.2 0.1 12.5 3.7 1.0 0.6 1.2 0.3 0.2 services to clients and patients 0.5 0.4 0.7 0.8 0.1 0.3 0.3 004 0.2 0.3 other 0.5 0.5 0.6 0.6 0.5 0.4 0.7 0.5 0.5 1.0
Racial Background (1) White/Caucasian 91.5 90.8 94.7 91.4 92.0 88.8 92.2 92.9 93.8 90.5 Aftican American/Black 2.7 2.8 2.3 1.9 1.2 4.8 2.1 1.1 0.8 4.0 American Indian 1.2 1.2 1.2 1.5 0.4 1.5 0.7 0.7 0.5 0.9 Asian American/Asian 4.2 4.8 1.5 5.7 4.5 4.5 4.0 4.1 3.5 4.0 Mexican American/Chicano 0.5 0.6 0.5 0.5 0.7 0.6 0.4 0.6 0.2 0.4 Puerto Rican 0.2 0.2 0.3 0.2 0.1 0.2 0.3 0.3 0.2 0.3 other Latino 0.9 0.9 0.7 0.8 2.1 0.7 0.8 1.2 0.8 0.3 Qtbe:r 1.6 1.5 1.7 1.5 1.4 1.7 1.4 1.7 1.7 1.1
(1) Percentages will sum to more than 100 if any respondents checked more than one category.
Two-year Colleges Public Private 1921 149
1.7 4.5 4.0 14.1 8.3 18.4
14.9 17.1 22.6 19.2 23.5 12.1 15.0 9.8 7.4 4.1 1.8 0.6 0.8 0.0
36.9 24.7 20.4 18.9 14.8 24.1 0.9 0.0
25.1 29.1 1.9 3.2
77.7 62.4 6.5 9.8
12.8 20.5 0.0 0.6 0.2 0.0 0.0 1.3 0.0 0.0 2.8 5.4
2.7 7.9 96.0 90.2
0.1 0.0 0.6 1.3 0.6 0.6
94.7 95.3 2.3 2.6 1.3 0.6 1.6 0.0 0.4 2.1 0.3 0.0 0.7 0.0 1.8 0.0

"""" (X)
WEIGHTED NATIONAL NORMS FOR FULL-TIME UNDERGRADUATE FACULTY, 1992-1993
Four-vear con . MALE FACULTY ALL Universities All Non-
Institutions 4-vear 2-vear Public Private Public Private sectarian Catholic Protestant Higbest Degree Earned
bachelor's (BA, B.S., etc.) 2.4 1.0 8.6 0.7 0.7 1.1 1.5 1.6 1.4 1.5 master's (MA, M.S., etc.) 23.3 15.4 58.9 9.8 9.0 20.0 21.3 21.3 19.6 22.2 LL.B.,J.D 0.7 0.7 1.1 0.4 1.2 0.8 0.6 0.4 1.2 0.6 M.D., D.D.S. (or equivalent) 0.4 0.4 0.3 1.0 . 0.0 0.1 0.1 0.1 0.1 0.2 other first professional 0.5 0.5 0.7 0.5 0.6 0.3 0.7 0.8 0.6 0.7 Ed.D 4.7 5.0 3.5 3.5 2.2 7.9 4.3 3.2 3.4 6.1 Ph.D 61.4 72.1 12.8 80.6 82.1 63.8 65.4 67.1 67.7 62.2 other degree 4.0 3.6 5.9 2.5 3.0 4.4 4.5 3.7 4.8 5.4 none 2.6 1.3 8.3 1.0 1.2 1.6 1.5 1.9 1.3 1.2
Field of Highest Degree (2) agriculture or forestry 2.0 2.1 1.5 4.6 0.3 1.2 0.5 0.3 0.1 1.1 biological sciences 6.5 6.5 6.3 7.2 5.6 6.6 5.7 5.3 5.5 6.3 business 6.9 6.4 9.3 4.9 7.1 6.5 8.2 6.4 13.6 8.0 education 12.1 10.4 19.3 7.7 4.4 15.3 10.8 9.0 9.2 13.9 engineering 6.8 7.0 6.0 11.9 5.2 4.9 3.2 5.6 2.7 0.4 English 5.8 5.3 7.6 4.1 5.8 6.0 6.2 5.8 7.7 6.0 health related 1.7 1.7 1.8 2.8 1.5 1.3 0.6 0.6 0.7 0.5 history or political science 7.1 7.8 4.0 5.7 12.9 7.9 8.4 8.9 7.4 8.2 humanities 7.4 8.3 3.6 6.2 14.3 5.3 13.1 11.5 15.9 13.6 fme arts 9.1 9.6 6.8 9.9 6.6 9.8 10.7 11.6 5.1 12.1 mathematics or statistics 6.6 6.5 7.0 6.9 5.7 6.7 6.2 5.9 5.9 6.7 physical sciences 9.8 10.3 7.3 11.5 9.1 9.8 9.8 11.0 7.7 9.1 social sciences 11.9 12.7 8.3 12.4 15.6 12.2 12.1 12.9 14.0 10.3 other technical 2.3 1.7 5.0 1.2 1.6 2.1 1.9 2.4 2.1 1.2 other non-technical 4.0 3.6 6.1 3.0 4.4 4.5 2.6 2.7 2.4 2.4
Year Higbest Degree Earned 1954 or earlier 2.2 2.0 3.2 2.1 3.2 1.5 1.9 2.2 2.0 1.6 1955 to 1959 3.4 3.5 2.6 4.4 6.2 2.1 2.9 3.1 3.7 2.2 1960 to 1964 9.2 9.2 9.1 12.0 9.9 7.0 7.9 9.1 6.6 7.2 1965 to 1969 16.0 15.5 17.9 16.8 14.5 16.0 13.3 14.1 13.2 12.4 1970 to 1974 19.2 19.1 19.6 18.8 17.3 20.6 18.1 19.5 18.2 16.4 1975 to 1979 14.1 14.0 14.7 12.3 14.5 14.5 15.7 14.3 15.8 17.5 1980 to 1984 13.7 13.7 13.3 12.4 12.6 14.6 15.3 14.7 15.0 16.2 1985 to 1989 14.4 14.7 13.1 14.1 14.3 14.1 16.8 16.1 15.4 18.3 1990 to 1992 7.9 8.2 6.5 7.1 7.4 9.7 8.0 7.0 10.0 8.4
Degree Currently Working Toward bachelor's (BA, B.S., etc.) 0.9 0.1 4.1 0.1 0.0 0.3 0.1 0.1 0.0 0.2 master's (M.A., M.S., etc.) 3.8 1.6 13.4 0.9 0.8 2.0 2.7 1.9 2.3 3.8 LL.B.,J.D 0.1 0.2 0.1 0.1 0.7 0.1 0.1 0.1 0.3 0.0 M.D., D.D.S. (or equivalent) 0.2 0.1 0.5 0.0 0.3 0.3 0.1 0.2 0.0 0.0 other first professional 0.1 0.1 0.2 0.0 0.0 0.1 0.3 0.1 0.5 0.4 Ed.D 2.0 1.3 4.8 0.3 1.1 1.9 2.3 2.3 1.9 2.4 Ph.D 10.1 9.0 15.2 4.4 6.4 12.3 12.8 11.2 14.0 14.4 other degree 1.9 1.5 3.3 1.4 0.7 1.9 1.7 1.2 1.0 2.6 none 80.8 86.0 58.4 92.9 89.9 81.2 80.0 83.0 80.0 76.2
(2) Recategorization of this item from a longer list is shown in The American College Teacher
Two-year Colleges Public Private
8.6 8.4 59.5 49.2
1.0 2.2 0.2 1.9 0.7 0.0 3.5 3.3
12.2 22.9 5.8 8.0 8.5 4.1
1.5 0.0 6.1 10.6 9.1 13.7
19.4 17.9 6.3 2.0 7.8 4.0 1.8 2.0 3.9 5.3 3.1 12.6 6.7 10.1 7.0 6.2 7.6 2.0 8.4 6.9 5.2 1.3 6.2 5.5
3.3 2.0 2.7 1.3 9.4 3.5
18.4 9.2 19.9 13.2 14.6 16.4 13.2 15.2 12.5 23.9 6.0 15.2
4.4 0.0 13.4 13.3 0.1 0.0 0.5 0.0 0.3 0.0 4.9 4.3
14.4 29.0 3.3 2.8
58.8 50.6

.po. \0
WEIGHTED NATIONAL NORMS FOR FULL-TIME UNDERGRADUATE FACULTY, 1992·1993
Four-year Colleges MALE FACULTY ALL Universities All Non-
Institutions 4-year 2-year Public Private Public Private sectarian Catholic Protestant Department of Current Faculty Appointment (2)
agriculture or forestry 2.4 2.6 1.3 5.8 0.2 1.5 0.2 0.3 0.1 0.3 biological sciences 6.3 6.2 6.7 6.5 5.3 6.3 5.9 5.1 5.1 7.3 business 8.9 8.3 11.3 6.0 10.4 8.8 10.5 8.1 18.2 9.8 education 7.1 7.5 5.3 6.1 2.8 11.0 7.1 5.7 6.8 9.1 engineering 6.6 6.8 5.3 12.6 5.2 3.7 3.0 5.6 2.3 0.1 English 6.6 6.0 9.4 4.6 7.0 6.6 6.8 6.1 8.1 7.0 health related 2.0 2.0 2.2 3.1 1.6 1.8 0.7 1.0 1.1 0.2 history or political science 6.4 7.2 2.8 5.5 11.8 6.9 7.7 7.9 7.1 7.7 humanities 7.2 8.1 3.4 5.8 13.5 5.2 13.4 12.1 16.0 13.9 fme arts 9.3 10.0 6.3 10.3 6.8 10.3 11.0 11.7 4.9 12.9 mathematics or statistics 6.9 6.6 8.0 6.4 6.0 6.8 7.0 6.0 5.5 8.8 physical sciences 9.3 9.8 7.2 10.4 8.2 10.0 9.3 10.5 7.9 8.6 social sciences 11.3 11.6 9.9 10.7 13.9 11.8 11.5 12.3 10.6 10.9 other technical 5.0 3.1 13.2 2.4 1.9 4.3 3.4 4.2 4.2 1.9 other non-technical 4.7 4.1 7.6 3.9 5.2 4.9 2.5 3.3 2.2 1.6
Year Appointed to Current Position
1954 or earlier 1.3 1.3 1.3 1.3 2.1 1.0 1.4 1.3 1.6 1.4 1955 to 1959 1.6 ·1.8 0.8 1.9 3.0 0.9 2.6 3.1 2.8 1.8 1960 to 1964 5.8 6.1 4.4 6.4 8.0 4.9 6.4 7.3 6.8 5.0 1965 to 1969 17.3 16.5 20.8 17.9 15.0 17.6 13.4 15.6 11.1 11.6 1970 to 1974 14.5 13.9 17.3 14.2 13.7 15.8 10.5 10.8 10.2 10.4 1975 to 1979 11.5 11.3 12.3 12.5 10.8 10.3 11.3 11.7 12.5 10.2 1980 to 1984 12.8 12.6 13.4 12.4 12.3 12.0 14.3 14.4 14.7 13.9 1985 to 1989 19.1 19.7 16.2 19.4 18.8 18.8 22.3 20.7 21.6 24.7 1990 to 1992 16.0 16.6 13.5 14.0 16.3 18.6 17.9 15.1 18.8 21.0
Tenured? yes 65.0 64.7 66.1 70.1 66.5 64.2 55.5 59.7 58.3 49.1 no 35.0 35.3 33.9 29.9 33.5 35.8 44.5 40.3 41.7 50.9
Year Received Tenure 1954 or earlier 0.2 0.2 0.4 0.1 0.2 0.2 0.1 0.1 0.3 0.1 1955 to 1959 0.4 0.4 0.2 0.5 0.9 0.1 0.3 0.4 0.3 0.3 1960 to 1964 2.2 2.5 1.1 2.6 3.8 1.4 3.4 3.9 3.4 2.7 1965 to 1969 11.3 11.5 10.7 13.9 11.2 9.4 10.3 12.2 8.5 8.6 1970 to 1974 22.7 21.5 28.3 20.9 21.0 24.6 17.2 17.9 19.6 14.7 1975 to 1979 18.9 19.1 18.2 18.9 17.9 20.7 17.2 16.9 15.3 18.7 1980 to 1984 16.1 16.3 15.1 16.9 16.3 15.2 17.1 16.5 15.1 19.1 1985 to 1989 17.2 17.4 16.4 16.5 18.3 16.0 21.2 20.1 24.0 21.5 1990 to 1992 10.9 11.3 9.5 9.8 10.3 12.4 13.1 12.0 13.5 14.4
Primary Interest 37.7 43.2 very heavily in teaching 35.3 26.8 72.9 15.7 17.8 34.9 37.9 33.7
leaning toward teaching 38.1 41.6 22.6 36.0 43.2 45.1 44.7 44.3 45.3 44.9 leaning toward research 23.6 28.0 3.8 42.1 34.5 18.2 16.1 20.3 16.0 11.0 very heavily in research 3.0 3.5 0.7 6.1 4.5 1.8 1.3 1.8 1.0 0.9
(2) Recategorization of this item from a longer list is shown in The American College Teacher
Two-year Colleges Public Private
1.3 0.0 6.6 8.2
ILl 14.7 5.1 7.7 5.5 0.7 9.7 4.8 2.0 5.4 2.8 3.4 3.0 12.3 6.1 9.7 8.1 5.2 7.4 3.4
10.0 7.8 13.3 12.0 7.7 4.8
1.4 0.0 0.8 0.0 4.5 2.0
21.6 5.3 18.0 4.9 12.3 12.0 13.7 7.9 15.6 28.3 12.1 39.5
68.4 27.1 31.6 72.9
0.4 0.0 0.3 0.0 1.2 0.0
10.9 2.5 28.4 21.6 18.5 4.8 15.0 21.7 16.2 24.5 9.1 25.0
73.6 59.3 22.0 33.6 3.7 5.8 0.6 1.3

\J1 o
WEIGHTED NATIONAL NORMS FOR FULL-TIME UNDERGRADUATE FACULTY, 1992-1993
Four-year Colleges MALE FACULTY ALL Universities All Non-
Institutions 4-vear 2-vear Public Private Public Private sectarian Catholic Protestant Salary is Based On
9/10 months 79.2 78.8 80.9 79.8 78.4 SO.3 75.0 73.3 75.6 77.0 11112 months 20.S 21.2 19.1 20.2 21.6 19.7 25.0 26.7 24.4 23.0
Base Salary in Thousands for: Faeulty on 9/10 Mo Contracts
less than 20 0.4 0.4 0.3 0.4 0.4 0.3 0.5 0.4 0.2 0.7 20 to 29 9.1 7.9 14.2 4.8 2.6 10.4 12.4 7.6 6.3 21.1 30 to 39 27.4 26.3 32.4 23.S 15.7 29.5 31.9 24.6 34.9 39.1 40 to 49 29.1 29.6 26.8 28.8 23.3 32.6 29.4 29.9 33.3 26.9 50 to 59 19.2 19.2 19.0 20.8 21.7 18.6 15.9 20.8 17.1 9.4 60 to 69 9.3 9.9 6.5 11.3 19.1 7.4 6.3 9.9 6.2 1.9 70 to 79 3.5 4.2 0.6 6.6 9.9 O.S 2.4 4.0 1.6 0.7 80 to 89 1.4 1.7 0.1 2.3 5.1 0.2 0.9 1.9 0.3 0.1 90 to 99 0.4 0.5 0.0 0.7 1.2 0.0 0.3 0.5 0.2 0.0 100 to 124 0.2 0.3 0.0 0.5 0.8 0.1 0.1 0.2 0.1 0.0 125 to 149 0.0 0.0 0.1 0.0 0.2 0.0 0.0 0.0 0.0 0.0 150 or more 0.0 0.0 0.0 0.0 0.0 0.0 0.0 0.0 0.0 0.0
Faculty on 11112 Mo Contracts less than 20 0.7 0.5 1.7 0.0 1.9 0.0 1.0 0.2 1.6 2.0 20 to 29 7.3 6.4 11.9 1.1 1.4 7.2 15.3 12.2 10.6 22.0 30 to 39 25.0 22.0 39.7 10.2 18.9 23.5 38.5 36.6 39.5 40.7 40 to 49 24.6 23.8 2S.4 18.8 32.5 25.1 25.2 25.8 25.6 24.1 50 to 59 19.0 20.1 13.7 26.S 15.6 20.6 12.0 12.8 16.8 8.6 60 to 69 12.8 14.6 3.7 21.0 15.5 14.7 5.1 7.7 4.0 1.9 70 to 79 5.0 5.8 1.0 7.8 5.8 6.8 1.6 2.8 O.S 0.1 80 to 89 2.9 3.4 0.0 6.6 3.7 1.9 0.7 1.0 0.5 0.3 90 to 99 1.5 1.8 0.0 3.6 3.9 0.2 0.3 0.4 0.5 0.0 100 to 124 0.9 1.1 0.0 2.9 0.2 0.0 0.3 0.5 0.0 0.2 125 to 149 0.2 0.2 0.0 0.7 0.0 0.0 0.0 0.0 0.2 0.0 150 or more 0.2 0.2 0.0 0.5 0.6 0.0 0.0 0.0 0.0 0.0
Father's Education 8th grade or less 18.8 18.3 21.0 lS.7 14.8 19.9 17.0 16.0 19.1 17.2 some high school 11.5 10.7 15.1 10.4 11.3 10.9 10.4 9.4 13.1 10.5 completed high school 23.8 22.3 30.2 21.2 20.2 24.2 22.5 21.3 24.2 23.3 some college 13.4 13.6 12.5 13.8 12.9 13.8 13.5 14.8 11.7 12.8 graduated from college 12.7 13.4 9.2 13.9 13.8 12.5 14.0 14.9 12.9 13.3 attended grad/prof school 4.7 5.1 3.2 4.8 6.9 4.8 5.1 5.4 4.1 5.1 attained advanced delZfee 15.2 16.5 9.0 17.1 20.1 14.0 17.5 IS.3 15.0 17.8
Mother's Education 8th grade or less 13.8 13.5 15.1 13.5 10.7 14.7 13.1 12.1 15.6 13.3 some high school 10.8 10.3 13.0 10.2 10.6 11.2 8.8 9.3 11.0 7.1 completed high school 34.8 33.9 39.1 32.6 33.5 34.9 34.6 34.7 36.0 33.7 some college 15.9 16.6 12.6 16.8 15.9 16.4 17.0 16.0 15.2 19.1 graduated from college 14.8 15.4 12.3 16.4 17.1 13.3 16.1 16.7 14.0 16.3 attended grad/prof school 3.4 3.5 3.2 3.2 4.8 3.2 3.7 3.9 3.0 3.8 attained advanced delZfee 6.5 6.8 4.8 7.3 7.4 6.2 __ ~ 6.7 __ ~ 7-----L __ 5.L 6.7
Two-year Colleges Public Private
82.3 55.4 17.7 44.6
0.3 2.2 13.6 31.3 31.8 47.3 27.2 18.0 19.6 1.1 6.7 0.0 0.6 0.0 0.1 0.0 0.0 0.0 0.0 0.0 0.1 0.0 0.0 0.0
1.0 6.2 9.1 30.7
38.3 49.0 30.7 12.5 15.5 1.6 4.2 0.0 1.1 0.0 0.0 0.0 0.0 0.0 0.0 0.0 0.0 0.0 0.0 0.0
21.4 13.7 15.1 14.9 30.0 33.8 12.4 13.8 9.2 9.0 3.1 4.2 8.9 10.7
15.3 11.4 13.4 6.1 38.6 48.1 12.5 14.0 12.3 11.8 3.2 3.3 4.8_ 5.3

V1 ......
WEIGHTED NATIONAL NORMS FOR FULL-TIME UNDERGRADUATE FACULTY, 1992-1993
Four-vear con MALE FACULTY ALL Universities All Non-
Institutions 4-vear 2-vear Public Private Public Private sectarian Catholic Protestant Marital Status
married (currently) 81.9 82.0 81.6 84.2 76.7 82.1 81.1 83.4 72.8 82.1 separated 1.4 1.2 2.4 1.4 1.1 1.5 0.7 0.7 0.8 0.7 single (never married) 8.0 8.4 6.0 6.9 13.5 6.8 10.7 8.2 19.1 9.9 single (with partner) 1.7 1.7 1.7 1.3 2.5 1.9 1.6 2.2 1.4 0.8 single (divorced) 6.3 6.0 7.7 5.5 5.5 7.1 5.4 5.0 5.3 6.0 sinille (widowed) 0.6 0.6 0.7 0.7 0.5 0.6 0.5 0.6 0.7 0.4
Spouse's or Partner's Education 8th grade or less 0.1 0.1 0.2 0.1 0.2 0.2 0.1 0.0 0.1 0.1 some high school 0.3 0.2 0.6 0.2 0.1 0.3 0.2 0.3 0.3 0.0 completed high school 4.2 3.7 6.4 3.6 3.1 4.2 3.5 3.1 4.7 3.5 some college 13.3 12.1 18.6 11.8 9.9 13.8 11.1 11.5 11.3 10.5 graduated from college 23.2 22.3 27.1 22.5 19.5 22.1 23.9 23.4 19.4 26.4 attended grad/prof school 10.4 10.5 10.1 9.6 9.4 11.0 11.6 11.3 9.0 13.2 attained advanced degree 38.4 40.7 27.8 43.0 44.8 38.8 37.8 40.9 36.7 34.2 does not aDDlv 10.1 10.3 9.3 9.1 13.1 9.6 11.9 9.4 18.5 12.0
Number of Children Aged: Ot04 Years
none 74.0 73.9 74.6 73.1 72.8 74.9 74.3 74.7 77.5 72.0 one 19.8 20.0 18.8 20.6 20.2 19.4 20.2 20.0 16.8 22.2 two 5.7 5.6 .6.1 5.8 6.7 5.3 5.3 5.0 5.4 5.5 three 0.4 0.4 0.4 0.6 0.3 0.4 0.3 0.3 0.2 0.3 four or more 0.0 0.0 0.1 0.0 0.0 0.0 0.0 0.0 0.0 0.0
5to 1l Years none 60.6 61.4 56.9 62.5 65.3 59.3 60.5 60.5 66.8 57.4 one 24.1 23.5 26.7 23.0 21.7 25.0 23.3 23.4 19.2 25.1 two 12.9 12.7 14.0 12.2 9.5 13.3 14.3 14.2 12.2 15.5 three 2.1 2.1 2.1 2.1 2.7 2.2 1.6 1.7 1.4 1.7 four or more 0.3 0.3 0.2 0.3 0.8 0.2 0.3 0.2 0.4 0.3
13 to 17 Years none 65.7 67.1 59.4 67.6 68.4 64.8 68.9 68.1 74.9 66.9 one 25.7 24.8 30.0 25.2 22.0 26.4 23.1 23.4 18.2 25.3 two 7.5 7.1 9.3 6.3 7.9 7.5 7.4 8.0 5.9 7.3 three 1.0 1.0 1.1 1.0 1.4 1.2 0.5 0.4 1.0 0.4 four or more 0.1 0.1 0.2 0.0 0.3 0.2 0.1 0.2 0.0 0.0
18 Years or Older none 37.7 39.2 31.0 36.9 46.0 36.8 43.1 41.5 49.9 42.0 one 14.3 14.1 15.3 13.5 12.6 16.3 12.4 13.0 12.4 11.7 two 25.0 24.1 29.0 25.9 17.8 24.7 23.4 24.1 14.0 27.0 three 12.8 12.9 12.6 14.7 10.4 12.3 12.1 13.0 11.0 11.5 four or more 10.2 9.7 12.1 9.0 13.1 9.8 8.9 8.5 12.6 7.8
Two-year Colleges Public Private
81.4 84.5 2.4 2.1 6.1 4.5 1.6 2.5 7.7 6.4 0.7 0.0
0.2 0.0 0.6 0.0 6.5 4.9
18.7 16.8 27.3 22.3 9.6 19.6
27.7 29.7 9.5 6.7
75.5 61.4 18.3 26.4 5.7 11.1 0.4 1.1 0.1 0.0
57.0 55.5 26.9 24.4 13.9 16.1 2.0 3.9 0.2 0.0
59.4 59.8 30.S 23.S 9.0 13.8 1.0 3.0 0.2 0.0
30.2 47.2 15.1 17.6 29.4 20.8 12.7 9.9 12.4 4.4

--
WEIGHTED NATIONAL NORMS FOR FULL-TIME UNDERGRADUATE FACULTY, 1992-1993
Four-year Colleges MALE FACULTY ALL Universities Two-year Colleges
Institutions 4-vear 2-vear AIl Non-
Public Private Public Private sectarian Catholic Protestant Public Private General Activities
held academic admin position 43.2 44.1 39.2 40.8 49.8 43.9 46.4 46.2 47.9 45.9 38.9 45.91 award for outstanding teaching 35.4 35.9 33.0 38.6 34.9 34.0 35.1 34.5 34.1 36.2 33.1 31.8 spouse or partner an academic 32.4 31.5 36.3 30.7 24.3 34.7 32.1 31.5 27.7 34.7 36.2 37.0 commute a long distance to work 16.8 15.4 23.1 11.1 19.9 18.0 15.7 13.1 23.8 15.1 23.2 21.3 researchlwriting on women 15.1 16.4 9.5 15.3 22.1 14.7 17.6 18.2 18.1 16.7 9.4 11.1
1
spouselpartner work in same city 54.3 58.9 59.1 53.0 61.156.5 58.4 48.3 61.6 59.7 48.2 48.8 reslwriting on racelethnicity 19.4 20.8 12.8 18.2 24.2 22.1 21.5 21.1 20.9 22.2 12.6 16.5 born in the U.S.A 87.8 86.3 94.7 84.1 83.6 88.2 88.5 88.2 89.1 88.6 94.7 94.0 am a U.S. citizen 94.2 93.3 98.0 94.8 94.7 94.6 94.9 94.891.8 91.6 98.0 98.0 interrupted career for hlthlfam 3.9 3.6 5.1 2.9 4.5 3.5 4.4 4.3 5.1 4.3 4.9 7.9 sexually harassed at this inst 3.0 2.8 4.3 2.3 2.3 3.7 2.3 2.0 3.1 2.3 4.5 0.0 olan workinll bevond aile 70 35.9 38.0 26.3 39.4 45.0 34.2 37.8 37.1 41.8 36.9 25.3 45.5
General Activities in the Last Two Years
had one or more finn job offers 26.5 26.1 28.4 23.6 27.7 27.3 27.3 24.6 26.0 31.4 27.2 50.8 developed a new course 67.4 75.7 76.3 78.1 73.869.0 70.0 64.3 67.6 74.7 63.6 77.0 considered early retirement 31.8 30.3 38.4 30.8 25.3 33.7 26.8 28.0 27.3 25.2 39.3 21.7 consideredleavinllacademe 33.9 34.1 32.9 35.1 30.5 35.2 32.4 32.8 28.9 33.5 32.5 41.1
Teaching Activities in the Last Two Years
\J1 N taught honors course 20.1 21.8 12.2 23.6 28.2 18.4 20.1 20.7 22.7 18.1 12.1 14.5
taught interdisciplinary course 34.1 35.4 28.2 32.3 37.5 32.2 44.4 48.7 34.9 43.4 27.6 38.8 taught ethnic studies course 6.0 9.5 7.4 10.4 10.6 10.2 10.3 4.8 5.5 taught women's studies course
7.2 7.8 4.8 2.0 4.0 4.2 3.6 3.92.3 2.4 1.4 1.8 2.8 1.3 2.2
team-taught a course 29.3 36.9 40.3 30.2 35.732.0 33.0 27.3 35.5 29.1 26.7 37.8 worked w/students on res project 67.8 73.2 42.0 81.7 73.2 67.6 67.1 70.1 65.4 63.9 41.8 45.2 attd racial/cultural workshop 33.0 29.8 47.3 22.1 27.0 34.0 38.0 36.9 38.7 38.9 48.1 33.5 attd women'slminorities workshop 19.4 17.6 27.6 17.7 25.3 23.3 24.9 27.911.9 21.0 28.1 19.1 held fac senate/council office 25.1 25.0 25.5 21.6 24.7 27.8 26.5 25.3 32.8 25.0 26.0 16.6 used funds for research 62.8 56.3 42.1 45.0 51.5 42.3 37.9 13.3 13.3 served as a paid consultant
45.0 51.8 13.3 48.0 49.8 39.6 54.0 55.2 47.3 43.2 44.4 44.7 40.9 40.0 31.5
attd teachinll enhance workshop 39.4 46.0 51.5 55.4 52.0 55.7 59.5 61.3 60.0 Researeb Working Environment
work essentially alone
49.9 47.4 61.2
66.1 65.2 70.4 55.1 68.1 69.4 74.0 71.8 72.9 77.4 69.9 78.8 work with one or two colleagues 37.3 26.7 25.2 20.3 22.6 21.9 16.626.9 28.6 18.7 18.9 14.7 member of larller grOUP 7.Q __6.2 __10.2 '----7.6__ 5.2 5.4 5.7 5.6 5.2 6.0 11.2 6.5

WEIGHTED NATIONAL NORMS FOR FULL-TIME UNDERGRADUATE FACULTY, 1992-1993
Four-year Colleges MALE FACULTY ALL Universities Two-year Colleges
Institutions 4-vear 2-vear All Non-
Public Private Public Private sectarian Catholic Protestant Public Private HOURS PER WEEK SPENT ON: Scheduled Teaching
none 0.2 0.3 0.5 0.6 0.0 0.1 0.6 I to 4
0.5 0.60.4 0.4 0.2 3.0 3.1 4.2 1.9 2.3 1.7 3.2
5 t08 5.6 6.5 1.8 11.2 8.0
16.0 19.0 25.2 14.2 13.6 4.4 9.7 9to 12
48.2 48.626.8 31.7 4.6 27.2 34.2 49.9 45.0 42.2 58.9 41.9 11.2 22.5
13 to 16 34.2 39.2 11.8
19.8 21.2 17.2 18.1 27.6 32.9 29.4 17 to 20
17.4 14.1 32.7 7.3 6.0 7.3 8.2 7.9 4.5 10.3 27.5 17.9
21 to 34 9.4 5.5 27.0 3.7 1.4
1.5 1.1 20.6 10.9 35 to 44
5.5 2.3 20.1 3.3 2.9 2.4 1.6 4.1 0.5 0.2 1.5 0.2 0.1 0.4 0.2 0.2 0.1 0.2 1.2 5.8
45 or more 0.4 0.0 Preparing for Teaching
none
0.1 0.0 0.1 0.1 0.1 0.1 0.00.1 0.1 0.4
0.2 0.3 0.4 0.1 0.2 0.3 0.0 1 t04
0.4 0.30.3 0.3 0.3 11.3 7.8 7.2 6.7 8.1 5.6 5.68.4 8.6 7.5 7.3 11.0
5 t08 26.8 25.2 21.5 19.2 19.5 19.8 18.6 22.0 22.1 9to 12
23.1 23.3 22.0 25.4 24.4 24.2 26.9 23.4 25.6 30.1
13 to 16 26.1 26.2 25.9 27.8 26.9
18.5 12.3 17 to 20
15.9 17.6 18.0 17.0 17.1 15.2 17.617.2 17.0 18.2 10.9 12.2 15.6 17.8 17.0 17.8 18.9 14.4 10.6
21 to 34 14.0 14.0 14.2
5.6 7.9 9.6 11.5 10.7 11.9 12.4 9.4 11.2 35 to 44
8.6 8.4 9.5 1.8 2.3 2.4 2.4 2.3 1.4 2.1
45 or more 1.6 1.7 1.4 1.1 1.8
0.3 0.5 0.6 0.8 0.7 0.3 1.1 0.9 0.60.6 0.5 0.9 \JI Advising/Counseling ofStudentsW
none 4.2 1.0 2.2 2.4 2.0 2.2 2.8 2.2 3.2 1 t04
2.7 2.8 2.3 56.4 63.0
5 t08 54.6 58.7 58.2 59.0 59.357.1 57.2 56.8 59.2 55.6 31.7 28.7 29.2 30.0 27.5 31.6 21.2
9to 12 26.0 33.429.6 29.3 31.0
8.6 7.8 7.7 6.8 8.5 7.1 8.5 13 to 16
7.8 7.9 7.2 7.4 7.4 2.1 1.6 1.2 2.2
17 to 20 1.8 1.6 1.8 1.3 1.41.7 1.8 1.3
0.8 0.7 0.7 0.5 0.6 0.6 0.2 0.5 0.6 21 to 34
0.7 0.7 0.5 0.4 0.6
35 to 44 0.3 0.3 0.4 0.3 0.2 0.3 0.2 0.3 0.3 0.2
0.0 0.0 0.0 0.0 0.0 0.0 0.0 0.4 0.6 45 or more
0.1 0.0 0.4 0.1 0.0
Committee Work and Meetings none
0.0 0.0 0.0 0.0 0.00.0 0.0 0.1 0.0 0.0
4.6 4.9 4.5 5.1 5.4 6.5 9.2 1 t04
5.1 4.7 6.6 4.4 5.9 73.6 74.0
5 to 8 72.0 72.4 72.3 70.6 73.471.7 71.2 73.7 70.3 69.8
19.6 19.9 18.8 18.6 19.1 19.6 17.7 16.1 14.9 9 to 12
18.6 19.2 16.0 3.5 3.2 3.2 3.6 2.9 3.2 1.3
13 to 16 4.2 3.33.5 3.7 3.1
0.3 0.0 17 to 20
0.6 0.6 0.7 0.6 0.30.7 0.8 0.3 1.2 0.6 0.3 0.3 0.3 0.2 0.1 0.3 0.2 0.2 0.0
21 to 34 0.3 0.3 0.2
0.1 0.0 35 to 44
0.0 0.1 0.1 0.1 0.0 0.2 0.10.1 0.1 0.1 0.0 0.0 0.0 0.0 0.0 0.0 0.6
45 or more 0.0 0.0 0.1 0.0 0.0
0.0 0.0 0.1 0.0 0.0 0.0 0.0 0.0 0.00.0 0.1 0.0

\.TI .&:'-
WEIGHTED NATIONAL NORMS FOR FULL-TIME UNDERGRADUATE FACULTY, 1992-1993
Four-vear CoU _. -_.- --
MALE FACULTY ALL Universities All Non-Institutions 4-vear 2-vear Public Private Public Private sectarian Catholic Protestant
HOURS PER WEEK SPENT ON: Other Administration
none 37.4 36.6 40.5 36.3 38.6 37.0 35.4 37.3 36.1 32.8 1 to 4 38.4 38.3 38.6 40.3 38.0 36.7 37.7 39.0 36.7 36.6 5 t08 11.6 11.8 10.8 12.4 10.9 10.8 12.6 11.0 14.2 13.9 9 to 12 5.5 5.7 4.5 4.5 5.9 6.5 6.3 6.0 5.3 7.1 13 to 16 2.8 3.0 1.9 2.7 2.5 3.3 3.3 2.7 3.3 3.9 17 to 20 2.2 2.3 1.9 1.7 2.0 2.8 2.6 2.2 2.0 3.2 21 to 34 1.7 1.8 1.4 1.6 1.1 2.3 1.6 1.3 2.3 1.7 35 to 44 0.3 0.3 0.4 0.2 0.5 0.4 0.4 0.4 0.0 0.6 45 or more 0.2 0.2 0.0 0.2 0.5 0.2 0.1 0.1 0.0 0.3
Research and Scholarly Writing none 20.6 13.2 56.0 6.5 6.5 17.6 21.6 18.2 19.1 27.0 1 t04 30.0 29.9 30.7 19.7 23.7 36.9 39.9 37.3 37.2 44.6 5to 8 18.5 20.6 8.4 19.6 22.5 21.7 19.6 21.6 22.8 15.7 9 to 12 12.1 14.0 3.0 17.0 18.0 11.8 9.9 11.3 11.2 7.7 13 to 16 7.1 8.4 1.1 12.4 11.5 5.5 4.3 5.3 5.5 2.4 17 to 20 5.9 7.0 0.5 11.6 9.4 3.9 2.7 3.2 2.8 2.0 21 to 34 3.9 4.7 0.3 8.7 6.1 1.8 1.4 2.2 1.4 0.5 3S to 44 1.3 1.6 0.0 3.3 1.9 0.4 0.3 0.5 0.0 0.1 4S or more 0.5 0.6 0.0 1.1 0.5 0.2 0.2 0.4 0.1 0.0
Creative Products & Performances none 70.5 71.5 66.3 73.7 77.3 68.8 68.7 70.3 72.0 65.2 1 t04 18.0 16.8 23.5 15.6 12.7 18.7 17.9 16.0 18.6 19.8 5to8 5.2 5.1 5.6 4.3 4.1 5.6 6.0 5.9 4.9 6.7 9 to 12 2.8 2.9 2.4 2.7 2.9 2.7 3.3 2.8 2.0 4.4 13 to 16 1.3 1.4 0.8 1.3 1.8 1.4 1.5 1.7 0.8 1.6 17 to 20 1.1 1.2 0.7 0.9 0.6 1.6 1.2 1.5 0.8 1.1 21 to 34 0.8 0.9 0.5 0.9 0.5 0.8 1.1 1.2 0.9 1.0 3S to 44 0.2 0.2 0.2 0.2 0.0 0.3 0.1 0.1 0.0 0.1 4S or more 0.2 0.2 0.1 0.2 0.1 0.1 0.2 0.4 0.0 0.1
Consultation with CHents or Patients
none 79.9 80.3 78.6 79.5 83.4 79.4 81.0 82.1 79.7 80.3 1 t04 14.5 14.5 14.4 14.9 11.3 16.0 13.1 12.8 12.6 13.6 S t08 3.3 3.1 4.0 3.2 3.1 2.8 3.4 2.9 4.4 3.6 9 to 12 1.2 1.2 1.5 1.1 1.5 1.0 1.4 1.2 1.6 1.4 13 to 16 0.3 0.3 0.6 0.3 0.2 0.1 0.5 0.5 0.3 0.5 17 to 20 0.3 0.3 0.5 0.3 0.2 0.3 0.3 0.2 0.6 0.2 21 to 34 0.2 0.2 0.3 0.4 0.1 0.2 0.2 0.0 0.6 0.3 35 to 44 0.1 0.1 0.1 0.1 0.1 0.1 0.1 0.0 0.2 0.1 45 or more 0.1 0.1 0.1 0.1 0.0 0.0 0.1 0.2 0.0 0.1
Two-year Colleges Public Private
40.9 34.0 38.6 38.4 10.9 9.6 4.2 8.9 1.8 3.4 1.9 2.3 1.4 2.0 0.4 1.4 0.0 0.0
56.4 47.8 30.1 40.8 8.4 7.8 3.0 3.0 1.1 0.0 0.6 0.0 0.3 0.7 0.0 0.0 0.0 0.0
66.5 63.5 23.2 28.1 5.7 4.2 2.4 1.4 0.7 2.1 0.7 0.7 0.5 0.0 0.2 0.0 0.1 0.0
78.5 79.0 14.4 15.2 4.0 3.7 1.5 2.1 0.6 0.0 0.5 0.0 0.3 0.0 0.1 0.0 0.1 0.0

VI VI
WEIGHTED NATIONAL NORMS FOR FULL-TIME UNDERGRADUATE FACULTY, 1992-1993
Four-vear CoU J
MALE FACULTY ALL Universities All Non· Institutions 4-vear 2-vear Public Private Public Private sectarian Catholic Protestant
HOURS PER WEEK SPENT ON: CommuoitylPubUc Service
none 33.4 33.8 31.9 37.5 38.7 28.4 33.5 37.4 33.5 28.6 I t04 52.5 52.S 52.4 50.4 46.8 56.2 53.5 52.1 52.3 55.8 5 t08 10.1 9.9 11.0 8.5 10.2 11.3 9.8 8.6 10.9 10.7 9 to 12 2.9 2.7 3.8 2.7 2.9 2.8 2.4 1.4 2.5 3.5 13 to 16 0.5 0.6 0.3 0.5 0.9 0.6 0.5 0.3 0.3 0.7 17 to 20 0.3 0.3 0.4 0.3 0.3 0.4 0.3 0.1 0.5 0.5 21 to 34 0.1 0.1 0.0 0.1 0.2 0.1 0.1 0.1 0.0 0.1 35 to 44 0.0 0.0 0.1 0.1 0.0 0.0 0.0 0.0 0.0 0.0 45 or more 0.1 0.1 0.1 0.1 0.0 0.1 0.0 0.1 0.0 0.0
Outside Counsultillg or Freelance Work
none 60.0 59.5 62.6 55.5 54.6 62.3 64.4 62.8 62.3 67.3 1 t04 28.8 29.7 24.7 32.8 31.1 28.4 25.6 26.6 27.1 23.7 5t08 7.2 7.3 6.8 8.5 10.0 5.7 6.3 6.5 6.5 6.0 9to 12 2.4 2.3 3.1 2.2 2.9 2.4 2.0 2.3 2.5 1.4 13 to 16 0.8 0.7 1.0 0.6 1.0 0.6 0.8 0.9 0.7 0.8 17 to 20 0.5 0.4 1.0 0.4 0.1 0.4 0.5 0.5 0.7 0.5 21 to 34 0.2 0.1 0.4 0.0 0.2 0.1 0.2 0.2 0.1 0.2 35 to 44 0.1 0.0 0.2 0.0 0.1 0.1 0.1 0.0 0.0 0.1 45 or more 0.0 0.0 0.2 0.0 0.0 0.0 0.1 0.1 0.0 0.0
Household/Child Care Duties none 18.4 18.7 17.0 21.0 18.0 19.8 13.5 13.8 17.8 11.2 I t04 20.3 20.6 19.0 20.7 20.3 19.7 21.9 21.6 20.3 23.0 5t08 23.5 23.5 23.5 21.4 25.3 23.7 25.8 25.0 24.4 27.6 9to 12 16.2 16.3 15.8 16.1 15.8 15.8 17.7 18.2 14.4 18.6 13 to 16 8.6 8.3 9.9 8.0 7.5 8.4 9.0 9.5 8.8 8.6 17 to 20 6.4 6.2 7.3 5.9 6.1 6.9 5.5 5.3 7.0 5.2 21 to 34 4.0 3.9 4.2 4.1 4.3 3.6 4.0 4.5 4.6 3.2 35 to 44 1.3 1.3 1.4 1.6 1.1 1.0 1.4 1.3 1.2 1.5 45 or more 1.3 1.2 1.9 1.2 1.6 1.1 1.0 1.0 1.2 1.1
Number of Days Spent OtT-Campus for Professional Activities
none 12.6 11.3 18.6 7.8 12.0 13.8 12.7 10.8 14.1 14.4 1 t02 15.1 12.7 25.8 9.3 9.8 15.4 16.1 15.2 18.6 16.0 3 t04 22.8 21.5 28.7 17.0 20.2 23.9 26.0 24.4 23.8 29.0 5 to 10 31.1 33.3 21.1 35.5 34.0 32.1 31.3 33.7 30.1 28.8 11 to 20 12.5 14.3 4.4 20.5 15.0 10.8 9.1 10.6 9.2 7.2 21 to 50 4.4 5.1 1.2 7.8 6.5 3.0 3.2 3.5 3.3 2.7 50+ 1.4 1.6 0.3 2.1 2.5 1.0 1.6 1.6 1.0 1.7
Two-year Colleges Public Private
31.7 35.1 52.2 55.8 11.3 6.1 3.8 2.2 0.4 0.0 0.4 0.7 0.0 0.0 0.1 0.0 0.1 0.0
62.9 58.7 24.8 23.7 6.9 5.3 2.9 6.0 0.9 2.8 1.0 0.7 0.4 1.4 0.1 0.7 0.1 0.7
17.1 14.0 18.9 21.6 23.5 23.2 15.6 19.6 10.0 8.4 7.5 3.0 4.2 3.4 1.3 3.0
1 1.8 3.8 I
18.2 25.7 26.4 14.9 28.7 28.8 20.9 23.7 4.4
4':1 1.2 1.9 0.3 0.6

VI 0'
WEIGHTED NATIONAL NORMS FOR FULL-TIME UNDERGRADUATE FACULTY, 1992-1993
Fow--vear eon -MALE FACULTY ALL Universities All Non-
Institutions 4-vear 2-vear Public Private Public Private sectarian Catholic Protestant NUMBER OF: Articles in Academic or Professional Journals
none 24.7 17.0 58.8 8.7 9.5 22.3 27.1 22.7 23.5 34.1 1 to 2 16.7 15.4 22.8 9.2 12.2 20.0 20.3 18.8 22.6 21.1 3 t04 12.6 13.3 9.4 8.9 12.4 16.4 16.4 14.1 19.0 18.0 5 to 10 17.1 19.9 4.8 19.4 22.9 20.1 18.5 19.6 17.9 17.3 11 to 20 12.2 14.3 2.4 17.7 18.9 11.9 9.8 12.9 9.3 6.2 21 to 50 11.4 13.7 1.4 23.9 15.2 7.1 6.1 8.8 5.7 2.9 50+ 5.3 6.4 0.3 12.2 8.9 2.3 1.9 3.0 1.9 0.6
Chapters in Edited Volumes none 63.4 57.7 88.6 44.9 42.4 69.7 69.2 63.7 69.7 75.9 !to 2 18.7 21.3 7.0 23.8 23.9 19.3 18.6 20.0 20.2 16.0 3 t04 9.2 10.8 2.0 15.8 15.5 6.1 7.2 9.4 6.0 5.0 5 to 10 5.8 6.8 1.4 9.9 13.1 3.2 3.6 5.0 2.6 2.4 11 to 20 2.1 2.5 0.4 3.9 4.4 1.1 1.0 1.4 1.4 0.3 21 to 50 0.6 0.7 0.2 1.4 0.5 0.3 0.3 0.3 0.1 0.3 50+ 0.2 0.2 0.2 0.3 0.2 0.2 0.1 0.2 0.1 0.1
Boo~,Manuals,Monographs none 51.2 48.4 63.6 43.3 36.8 54.1 54.8 51.3 55.2 58.8 1 t02 30.0 31.0 25.7 31.0 35.8 29.8 30.2 31.5 29.0 29.2 3 t04 10.6 11.5 6.6 14.2 14.1 9.0 9.4 10.5 9.2 8.0 5 to 10 6.1 6.7 3.1 8.8 9.1 5.2 4.2 4.9 5.1 2.9 11 to 20 1.4 1.6 0.7 1.7 3.1 1.3 0.9 1.2 0.7 0.6 21 to 50 0.5 0.5 0.2 0.8 0.8 0.3 0.4 0.5 0.6 0.3 50+ 0.2 0.2 0.1 0.2 0.4 0.3 0.1 0.1 0.2 0.1
Exhibitions or Performances Presented
none 83.0 83.1 82.6 85.4 86.0 81.5 80.1 79.3 86.4 78.3 1 t02 3.8 3.4 5.4 2.8 3.0 3.6 4.2 4.2 3.0 4.7 3 t04 2.3 2.2 2.8 1.8 2.4 2.3 2.5 2.2 2.5 2.8 5 to 10 1.9 1.7 2.9 1.0 1.2 2.2 2.1 2.4 1.8 1.9 11 to 20 1.6 1.7 1.5 1.3 1.2 1.9 2.1 2.2 1.8 2.0 21 to 50 2.2 2.3 2.0 2.1 0.9 2.7 2.7 3.6 1.7 2.1 50+ 5.2 5.7 2.8 5.5 5.3 5.8 6.3 6.2 2.8 8.1
Professional Writings Accepted or PubUshed in Last Two Years
none 38.6 30.7 73.2 21.8 20.5 38.0 40.1 36.1 39.4 45.4 1 t02 25.1 27.0 17.0 22.8 29.9 29.3 28.6 28.1 29.8 28.6 3 t04 17.6 20.6 4.5 25.2 24.5 16.8 16.6 19.0 18.1 13.1 5 to 10 13.2 15.5 3.3 21.8 19.4 10.4 10.5 12.5 9.4 8.6 11 to 20 3.2 3.7 1.1 5.0 3.3 3.0 2.6 2.9 2.3 2.5 21 to 50 1.4 1.6 0.3 2.4 1.0 1.5 1.0 1.1 0.4 1.1 50+ 0.9 0.9 0.5 1.0 1.3 1.0 0.6 0.4 0.6 0.8
Two-year Colleges Public Private
58.9 56.0 22.6 27.4 9.4 9.5 5.0 2.6 2.4 3.2 1.4 0.7 0.3 0.6
88.6 89.5 7.0 7.1 2.0 2.1 1.5 1.3 0.5 0.0 0.3 0.0 0.2 0.0
63.5 65.4 25.5 29.2 6.9 2.6 3.2 0.6 0.7 1.3 0.2 0.9 0.1 0.0
83.1 73.3 5.2 10.3 2.7 3.9 2.8 3.3 1.5 1.3 1.9 3.9 2.8 3.9
73.6 66.1 16.8 20.0 4.4 5.4 3.2 5.2 1.2 0.0 0.3 1.3 O.S 1.9

\JI '-I
WEIGHTED NATIONAL NORMS FOR FULL-TIME UNDERGRADUATE FACULTY, 1992-1993
--
MALE FACULTY ALL Universities All Non-Four-vear Col1
Jlnstitutions 4-vear 2-vear Public Private Public Private sectarian Catholic Protestant NUMBER OF COURSES TAUGHT IN: General Education
none 49.8 51.5 42.2 64.3 47.6 46.3 42.7 49.3 47.0 33.1 one 21.5 24.0 10.2 22.2 31.9 22.7 24.7 26.3 17.2 26.1 two 13.9 14.4 11.9 9.3 15.4 17.1 17.2 14.0 IS.3 20.4 three 7.3 6.6 10.2 3.0 3.6 9.0 9.9 6.8 11.7 12.8 foW' 3.5 2.5 8.4 1.0 0.8 3.3 4.1 2.7 4.4 5.5 five or more 4.0 1.0 17.2 0.2 0.7 1.7 1.5 1.0 1.4 2.1
Other BA or BS Undergraduate Credit Courses
none 9.0 6.5 22.1 6.7 7.9 6.1 6.1 6.6 6.2 5.5 one 28.0 32.0 6.9 42.5 40.3 24.8 21.2 22.3 20.6 20.0 two 28.6 30.9 16.4 32.6 34.2 27.9 31.1 33.8 28.7 28.9 three 18.0 18.2 17.0 12.9 14.6 21.7 23.6 22.7 24.3 24.3 foW' 9.6 8.7 14.3 3.4 2.0 14.1 12.5 10.0 16.3 13.8 five or more 6.9 3.7 23.4 1.9 1.1 5.4 5.6 4.5 3.9 7.6
Non-BA Credit Courses (develop-mental or remedial)
none 91.1 94.6 76.3 96.5 94.1 93.7 93.1 92.7 94.7 93.0 one 4.4 3.3 9.0 2.5 3.7 3.9 3.5 3.7 2.7 3.7 two 1.6 0.8 5.3 0.2 1.3 0.8 1.4 1.9 1.4 0.7 three 1.3 0.7 3.9 0.5 0.8 0.6 1.0 1.2 0.4 1.0 foW' 0.7 0.4 2.1 0.1 0.0 0.5 0.8 0.4 0.8 1.4 five or more 0.9 0.3 3.4 0.2 0.0 0.5 0.2 0.2 0.0 0.2
Graduate Courses none 57.9 51.9 98.0 32.9 42.2 62.9 80.4 79.5 67.8 88.0 one 34.4 39.4 1.3 55.4 50.4 29.2 15.1 16.2 24.0 9.1 two 6.0 6.8 0.3 8.8 6.7 6.2 3.7 3.5 7.4 2.2 three 1.2 1.4 0.2 2.1 0.5 1.3 0.5 0.4 0.5 0.5 foW' 0.3 0.3 0.0 0.5 0.2 0.2 0.2 0.1 0.1 0.2 five or more 0.2 0.2 0.2 0.4 0.0 0.2 0.2 0.3 0.2 0.0
Professional Goals Noted as Very Important or Essential
engage in research 57.9 66.2 20.4 78.3 76.3 56.9 54.9 59.5 56.2 48.6 engage in outside activities 48.8 48.6 49.S 47.4 44.1 50.8 49.8 48.9 48.4 51.7 provide services to the cmty 38.8 37.2 46.1 33.9 33.7 41.4 37.9 33.6 40.8 41.9 participate in conun/admin work 26.3 25.1 31.5 20.7 24.3 29.1 26.8 23.3 30.8 29.2 be a good colleague 81.8 81.2 84.0 78.9 81.3 82.1 83.9 82.3 83.4 86.0 be a li!ood teacher 98.6 98.4 99.5 97.5 98.6 98.8 99.0 99.1 99.0 99.0
Faculty Expects Students to (3) think for themselves 79.8 80.4 77.0 79.6 84.1 79.6 81.0 82.9 82.4 78.0 work cooperatively w/oth stoots 43.7 41.9 51.6 37.0 39.3 46.2 44.8 44.6 41.1 46.9 openly challenge ideas 45.9 46.2 44.2 43.5 48.6 47.9 46.8 48.2 50.3 43.5 compete for grades 9.9 9.7 10.4 10.1 8.5 11.2 7.3 6.6 7.4 8.2 seek frequent feedback 32.S 30.9 39.5 28.5 27.3 34.8 30.6 30.1 31.7 30.7 work independently 45.9 46.4 43.6 47.1 44.4 47.5 44.6 45.0 44.9 44.1
(3) Percentage responding "agree strongly" only.
Two-year Colleges Public Private'
42.3 39.1 10.1 12.5 11.5 IS.4' 10.1 11.9 8.5 5.9
17.5 12.1 i
22.4 17.51 6.9 8.3
16.2 19.1 16.9 17.0 14.1 16.8 23.5 21.31
75.9 83.31 9.3 4.S 5.2 7.2 3.9 3.6 2.2 0.01 3.6 1.2
98.0 97.2 1.2 2.8 0.3 0.0 1
0.2 0.0 0.0 0.0 0.2 0.01
I
19.6 35.7 49.1 56.3 46.0 47.01
31.3 35.4 83.9 87.0 99.6 97.21
76.11 77.1 51.5 53.2 44.0 48.8 10.2 13.7 39.3 43'~1 43.9 39.2

\J1 00
WEIGHTED NATIONAL NORMS FOR FULL-TIME UNDERGRADUATE FACULTY, 1992-1993
ALL Universities ., .-
MALE FACULTY All Non-Four-vear ColI
Institutions 4-vear 2-vear Public Private Public Private sectarian Catholic Protestant Evaluation Metbods Used in Most or All Undergraduate Counes
multiple-choice mid-terms/finals 32.6 29.5 45.9 30.S IS.4 34.7 25.4 18.7 29.2 31.9 essay mid-tennslfinals 42.0 44.3 31.6 37.8 57.0 43.4 49.3 47.2 55.4 49.1 short-answer mid-terms/finals 37.5 38.1 34.7 38.9 3S.0 37.3 38.0 34.2 39.S 41.7 quizzes 40.4 37.6 53.0 38.7 26.6 41.3 36.0 32.1 37.4 40.2 weekly essay assignments 15.2 14.7 17.8 13.4 16.6 14.4 16.0 16.1 16.3 15.7 student presentations 25.4 26.6 20.5 23.2 28.5 27.0 30.4 30.8 28.2 30.8 tennlresearch papers 31.1 33.2 21.8 30.7 41.6 31.5 35.0 34.9 38.8 33.5 stdnt evals of each others' work 9.2 9.4 S.3 7.9 10.8 9.9 10.1 10.7 9.3 9.9 grading on a curve 21.6 23.5 13.5 28.5 23.9 19.9 20.5 21.7 22.7 lS.1 comrLetency-based Nading 54.3 54.7 52.9 54.0 61.1 54.0 53.3 53.7 51.7 53.4
Instruction Metbods Used in Most or AU Undergraduate Courses
class discussions 66.4 65.7 69.7 58.5 71.1 6S.3 70.4 69.9 70.8 71.0 computer/machine-aided instruct 14.3 13.1 19.4 11.7 12.5 15.1 12.9 12.1 14.0 13.2 cooperative learning 25.3 24.7 27.7 19.5 26.0 27.1 28.5 27.2 28.8 29.9 experiential learning/field stud 16.4 16.3 16.8 14.9 17.5 17.0 16.9 16.8 16.4 17.1 teaching assistants 9.0 10.5 2.2 17.3 15.2 4.6 5.6 7.3 2.1 5.3 recitals or demonstrations 18.7 IS.4 20.2 IS.7 18.1 18.7 17.3 lS.3 16.1 16.7 group projects 18.1 18.4 16.6 17.0 19.7 IS.9 19.1 18.5 21.8 18.5 independent projects 34.2 35.1 30.6 33.5 36.6 35.5 35.9 37.2 33.9 35.3 extensive lecturing 59.4 59.9 57.0 67.1 60.3 56.3 53.5 50.6 58.9 54.4 multiple drafts of written work 11.4 11.6 10.5 7.8 14.6 12.8 14.3 13.8 15.0 14.7 readings on racial/ethnic issues 11.0 11.3 9.8 9.7 15.9 10.7 12.2 12.0 11.0 13.1 readings on women/gender issues 9.9 10.2 8.6 8.6 14.3 9.0 12.4 12.2 11.0 13.3 student -developed activities 15.7 15.2 IS.3 15.5 12.6 16.7 13.6 12.0 14.0 15.5 student-selected tooics 8.0 8.1 7.4 7.1 8.4 S.7 S.5 8.4 7.6 9.1
Goals for Undergraduates Noted as Very Important or Essential
develop ability to think clearly 99.1 99.2 98.5 99.1 99.3 99.2 99.4 99.3 99.4 99.6 increase self-directed learning 90.9 91.2 89.9 90.7 89.6 91.9 91.9 91.8 91.1 92.3 prepare for employment 64.9 62.6 75.1 61.0 51.8 6S.6 61.6 58.2 62.3 65.6 prepare for graduate education 54.5 55.6 49.2 54.0 54.6 55.3 59.7 56.6 57.5 64.5 develop moral character 54.3 53.2 59.4 44.3 56.0 55.2 63.4 58.1 63.4 69.9 provide for emotional developmnt 35.2 33.5 42.7 27.6 32.0 35.6 41.1 36.1 39.5 48.2 prepare for family living 17.5 15.8 25.0 10.7 16.7 18.0 20.3 17.0 18.2 25.5 teach classics of western civ 30.5 32.0 23.9 27.6 37.5 31.7 36.6 33.4 40.9 38.4 help develop personal values 59.1 57.7 65.1 49.9 58.9 59.6 67.3 62.1 67.4 73.7 enhance out-of -class experience 41.0 39.8 46.0 36.1 35.2 43.3 43.2 40.0 42.9 47.4 enhance self-understanding - 62.0 _6O.8_~7~ _~4.1 __ ----.S2.2 "-----_64.4 __ 67.1 __ 63.4 __ 67.2 ___ lUi
Two-year Colleges Public Private
45.8 47.6 31.4 35.5 34.4 38.7 53.0 54.3 17.9 16.0 19.9 32.0 21.1 34.2 8.2 10.4
13.4 16.3 53.4 44.6
69.6 72.3 19.4 18.5 27.7 26.0 16.S 17.3 2.1 2.6
19.9 26.1 16.5 19.2 30.1 40.2 56.7 62.3 10.4 12.9 9.7 11.4 8.6 9.1
18.4 17.0 7.1 12.4
98.5 98.7 89.8 91.0 75.1 76.0 49.5 44.1 58.4 7S.8 42.0 56.0 24.7 30.7 23.7 26.6 64.4 78.6 45.5 56.5 66.9 7Q~

V1 '-0
WEIGHTED NATIONAL NORMS FOR FULL-TIME UNDERGRADUATE FACULTY, 1992-1993
Four-year Colleges MALE FACULTY ALL Universities All Non- Two-year Colleges
Institutions 4-vear 2-vear Public Private Public Private sectarian Catholic Protestant Public Private Po6tical Orientation I far left 4.1 4.6 2.1 4.3 6.1 3.9 5.3 7.0 4.3 3.7 2.2 0.7
liberal 35.9 37.9 26.8 39.8 42.3 34.2 37.9 39.4 39.7 35.3 27.0 23.9 middle-of-the-road 36.0 35.2 39.4 35.6 33.4 36.8 33.0 31.5 35.3 33.7 39.9 30.1 conservative 23.4 21.7 30.7 19.8 17.6 24.5 23.1 21.5 20.4 26.4 30.1 42.7 farrililit 0.6 0.6 0.9 0.5 0.5 0.6 0.6 0.6 0.3 0.9 0.8 2.7
Agrees Strongly or Somewhat abolish death penalty 40.6 42.5 32.1 42.6 51.9 36.6 46.2 47.9 50.7 42.1 32.6 23.91 national health care plan needed 83.2 83.8 80.6 84.8 85.7 82.3 83.5 84.7 85.6 80.9 81.4 65.4 abortion should be legal 76.5 77.3 72.5 83.9 72.3 76.2 70.9 76.1 62.6 68.3 73.4 55.5 prohibit racist/sexist speech 48.9 47.4 55.6 44.6 45.7 49.1 50.7 47.9 52.3 53.4 55.1 66.0 West Civ foundation ofUG curric 58.8 59.4 56.2 57.0 63.4 60.0 60.0 56.7 67.8 60.5 56.1 58.3 college can ban extreme speakers 28.1 26.8 33.8 22.0 30.2 26.4 33.5 29.8 33.6 38.0 33.0 49.0 college increases earning power 24.2 21.0 38.4 20.9 15.1 24.9 18.1 19.0 18.1 17.0 39.0 27.2 diversity yields undprep stdnts 34.1 33.2 38.6 34.2 30.6 35.9 28.4 28.4 32.2 26.7 38.8 35.1 coIl should help solve soc probs 64.1 64.5 62.1 62.5 65.4 65.2 66.4 64.2 68.0 68.4 62.0 64.4
Agrees Strongly or Somewhat fac interested in students' prob 74.4 72.1 84.3 58.4 79.3 74.9 86.7 82.4 85.8 92.5 83.8 92.7 fac sensitive to minority issues 73.6 73.0 76.4 68.6 78.0 72.9 77.8 76.9 74.8 80.3 76.5 73.3 people don't respect each other 30.4 30.7 28.8 33.3 23.9 33.1 26.5 28.2 26.6 24.4 29.0 24.9 students well prep academically 24.6 27.2 13.1 21.1 51.7 21.4 32.7 35.9 22.1 33.8 12.9 16.8 Stdnt Aff staff supported by fac 58.0 58.0 58.0 54.7 62.8 55.4 64.6 63.7 62.1 67.0 57.4 69.3 fac committed to welfare of inst 80.5 79.3 85.6 72.6 87.7 77.4 88.6 87.9 85.2 91.2 85.6 86.2 courses incl minority perspect 38.2 38.2 38.3 33.4 39.7 41.3 40.4 41.2 36.4 41.4 38.8 28.0 low trust btwn minoritiesladmin 37.3 39.4 28.4 47.7 34.3 36.5 33.0 36.1 29.2 30.9 28.8 21.1 fac interest in stdnts acad prob 78.8 77.1 86.7 64.9 83.2 79.4 90.4 88.7 88.3 93.4 86.4 91.4 a lot of racial conflict here 13.4 14.3 9.3 21.5 7.6 12.7 8.8 9.3 9.0 8.0 9.4 6.5 courses incl feminist perspect 32.7 33.4 29.6 31.5 37.7 31.4 37.4 40.7 35.3 34.2 30.4 14.6 faculty of color treated fairly 88.4 88.1 90.0 87.1 89.9 88.2 88.4 88.3 89.5 88.0 90.3 84.8 women faculty treated fairly 87.8 86.8 92.0 84.6 89.5 86.6 89.3 89.7 91.0 87.8 92.0 92.3 administrators act in good faith 64.0 63.5 66.4 58.9 67.0 62.6 70.5 69.8 70.0 71.6 66.0 72.1 unionization enhances teaching 29.5 26.2 43.8 25.0 23.6 30.2 23.2 24.7 28.4 19.0 44.7 27.2 tenure is an outmoded conceot 36.4 35.9 38.9 34.9 36.3 36.9 35.6 36.6 32.4 36.0 38.4 47.4
Issues Noted as Being of High or Highest Priority
promote intellectual development 78.9 78.9 78.5 74.4 85.4 76.9 86.0 85.3 85.3 87.3 78.5 79.1 help students understand values 50.6 50.1 52.7 33.9 69.5 46.9 71.2 63.2 76.3 78.6 51.7 71.5 hire more minority faculty/admin 45.7 46.6 41.7 47.3 43.7 50.9 40.1 46.0 34.2 35.4 42.8 21.7 devel community among stdnts/fae 45.5 44.8 48.4 32.2 52.6 45.0 61.2 57.3 57.2 67.9 47.7 61.2 dev leadership ability in stdnts 41.4 41.1 42.3 31.2 46.8 42.9 51.7 49.4 48.7 56.0 41.9 49.8 hire more women faculty/admin 44.2 45.5 38.7 46.8 46.7 46.2 41.3 45.6 40.5 36.3 39.4 25.8 involvement in community svcs 28.7 29.2 26.3 17.1 50.0 26.1 42.5 36.9 47.5 47.1 25.9 34.0 teach students how to change soc 25.5 25.4 25.6 17.2 36.2 26.5 31.5 28.9 31.8 34.5 25.5 26.8 increase/maintain inst prestige 68.1 69.2 62.9 72.4 75.7 63.7 69.1 69.4 67.9 69.2 62.7 66.0 hire faculty 'stars' 19.9 22.4 9.1 35.8 24.7 14.2 11.3 12.4 10.4 10.4 9.0 10.9 recruit more minority students 51.4 53.0 44.2 54.0 53.0 52.8 51.7 56.1 48.5 47.8 45.0 29.4 enhance inst's national image 58.7 64.0 35.4 73.3 75.2 51.7 61.5 67.7 52.9 57.8 35.0 41.8 create multi-cultural environ 49.1 49.3 48.3 45.1 58.4 48.5 52.4 56.3 51.9 47:1._49.3 29.5 --

(j\
o
WEIGHTED NATIONAL NORMS FOR FULL-TIME UNDERGRADUATE FACULTY, 1992-1993
Four-vear Coil MALE FACULTY ALL Universities All Non-
Institutions 4-vear 2-vear Public Private Public Private sectarian Catholic Protestant Percentage Noting Attributes as: Very Descriptive of Institution
easy to see fae outside ofe hour 40.9 39.5 46.9 27.5 42.4 40.3 57.0 54.8 54.7 60.7 great confonnity among students 26.9 29.3 16.4 24.5 35.2 28.2 35.7 31.1 40.1 39.3 most students are very bright 8.9 10.4 2.0 4.8 29.8 7.2 13.7 20.6 4.8 9.4 faculty at odds with admin 17.9 17.9 17.9 18.1 13.3 20.6 15.7 16.6 21.5 11.8 faculty respect each other 30.9 29.3 37.8 23.7 37.3 26.2 39.0 36.2 36.7 43.6 most stdnts treated like numbers 5.5 5.8 4.4 10.0 2.9 4.8 1.8 2.4 1.8 1.1 social activities overemphasized 10.7 12.4 3.2 15.1 11.7 10.0 12.3 11.5 9.9 14.2 little studentlfaculty contact 3.3 3.5 2.4 5.0 2.4 3.3 1.8 2.2 1.3 1.6 inst committed to minorities 32.7 31.7 37.5 27.2 32.7 34.3 34.4 33.3 35.8 35.0 intercoll sports overemphasized 21.1 23.9 8.6 39.6 11.8 19.5 11.6 9.5 11.7 14.2 stdnts don't socialize regularly 3.3 2.4 7.2 1.9 0.7 4.1 1.3 1.5 1.7 0.9 fac rewarded for good teaching 9.9 10.2 8.8 5.5 17.7 8.2 17.0 19.7 13.8 15.1
Not Descriptive of Institution easy to see fac outside ofc hour 9.8 10.5 6.9 15.4 8.7 9.8 4.3 5.9 4.2 2.4 great confonnity among students 16.7 15.1 23.7 16.6 14.9 15.2 12.7 16.1 12.0 8.8 most students are very bright 45.6 42.4 60.3 47.4 22.2 49.5 34.1 27.8 49.4 34.7 faculty at odds with admin 32.9 32.8 33.5 30.0 38.6 31.3 36.4 34.1 31.6 41.4 faculty respect each other 6.9 7.4 4.8 8.2 5.9 8.2 5.3 6.6 4.8 4.0 most stdnts treated like numbers 69.7 68.4 75.3 50.6 81.3 70.3 88.1 86.2 85.5 91.5 social activities overemphasized 58.9 54.6 78.1 50.6 50.1 60.7 54.0 57.2 62.5 46.1 little student/faculty contact 69.8 68.8 74.1 56.6 78.3 69.5 82.8 81.4 79.3 86.1 inst committed to minorities 10.4 11.0 7.9 11.4 10.8 10.4 11.2 10.5 12.4 11.4 intercoll sports overemphasized 52.1 46.9 74.8 28.0 56.6 53.5 62.7 68.9 61.0 55.8 stdnts don't socialize regularly 69.5 74.7 46.6 76.5 83.4 66.5 79.7 79.6 72.9 83.0 fac rewarded for flood teachinfl 41.3 40.0 46.9 47.2 25.8 44.6 28.9 27.7 30.9 29.4
Aspects of Job Noted as Very Satisfactory or Satisfactory (4)
salary and fringe benefits 41.1 39.3 48.9 32.7 51.3 39.1 44.0 48.5 45.3 37.8 oppty for scholarly pursuits 47.3 47.9 44.6 54.9 55.9 39.8 44.2 47.9 44.4 39.5 teaching load 53.0 54.2 47.6 61.8 60.2 47.1 49.4 54.6 50.0 42.7 quality of students 36.7 39.2 25.5 34.2 58.6 34.5 43.9 49.9 32.5 41.7 working conditions 66.1 66.9 62.6 67.5 76.4 62.2 68.2 73.3 65.8 62.8 autonomy and independence 82.9 83.3 81.2 84.0 86.3 80.2 85.3 87.9 84.9 82.4 prof relations w/other faculty 71.2 70.2 76.0 68.0 70.6 69.5 74.5 73.0 73.6 76.9 social relations w/other faculty 58.9 58.1 62.6 55.2 60.7 58.3 61.4 57.6 60.6 66.4 competency of colleagues 65.9 65.7 66.6 63.3 70.0 63.1 71.5 71.0 67.9 73.8 visibility for jobs 39.2 39.3 38.9 41.8 47.9 34.5 37.9 39.7 33.9 37.5 job security 73.8 73.3 76.0 74.6 76.5 71.9 71.3 72.6 73.3 68.8 undergraduate course assignments 78.3 78.1 79.5 78.4 79.2 76.2 79.8 82.4 79.7 76.5 graduate course assignments 72.4 73.0 49.2 75.3 75.2 68.3 70.7 70.3 73.2 69.1 relationships with admin 52.5 52.3 53.3 48.9 54.5 52.2 56.9 56.0 56.8 58.2 overall iob satisfaction 68.7 67.S 74.0 64.7 72.4 65.S 72.4 73.8 71.7 71.0
(4) Respondents marking "not applicable" are not included in tabulations.
Two-year Colleges Public Private
46.3 58.4 15.9 25.1
1.9 3.9 18.1 14.1 37.0 54.2 4.4 3.6 3.0 6.5 2.5 1.3
37.7 33.3 8.5 11.4 7.5 0.6 8.6 13.7
6.7 10.0 23.9 19.7 60.7 53.2 33.1 41.2 4.9 4.3
74.7 86.4 78.4 72.8 73.6 82.9 7.9 9.2
75.0 72.1 45.4 68.6 47.1 43.1
49.3 40.5 45.1 36.4 47.8 44.3 25.4 27.2 63.0 55.0 81.6 74.5 75.9 78.6 62.4 67.2 66.3 71.9 39.2 34.0 76.9 61.1 79.9 71.4 51.1 22.9 53.0 58.0 74.4 66.7

Q'\ ......
WEIGHTED NATIONAL NORMS FOR FULL-TIME UNDERGRADUATE FACULTY, 1992-1993
Four-vear con ~
MALE FACULTY ALL Universities All Non-Institutions 4-vear 2-vear Public Private Public Private sectarian Catholic Protestant
Penonal Goals Noted as Very Important or Essential
become authority in own field 62.3 64.5 52.7 74.0 65.7 59.1 56.2 57.9 54.2 55.0 influence political structure 16.5 16.3 17.4 14.1 19.4 17.1 16.S 15.8 IS.4 17.2 influence social values 40.2 39.7 42.3 32.1 45.1 41.1 47.3 44.3 47.5 51.0 raise a family 77.5 77.4 78.0 79.4 72.1 77.4 77.0 78.4 70.5 7S.1 be very well-off financially 38.1 36.9 43.6 40.2 33.9 38.3 30.7 32.1 31.4 28.5 help others in difficulty 64.9 63.7 70.3 59.4 63.2 65.7 68.3 64.0 68.9 73.4 be involved in environ clean-up 3S.9 37.7 44.0 36.9 29.4 42.2 36.7 34.3 35.4 40.3 develop philosophy oflife 7S.8 7S.5 SO. 1 75.5 79.8 79.3 81.4 77.9 84.9 84.0 promote racial understanding 60.6 61.0 58.7 54.9 63.1 63.3 66.3 63.6 67.2 69.2 obtain recog from colleagues 47.7 50.7 34.4 59.S 53.7 45.1 42.5 44.3 45.3 38.9
Amount of Stress Experienced in the Last Two Yean
extreme 2S.6 29.0 26.9 30.1 28.0 28.3 28.7 29.2 27.9 28.5 moderate 55.6 55.7 54.8 55.1 57.2 54.8 57.5 56.S 57.9 58.2 little 15.S 15.3 18.3 14.8 14.S 16.S 13.8 14.0 14.2 13.3
Sources of Stress (5) household responsibilities 61.4 60.3 66.6 58.1 60.9 59.8 64.3 64.3 63.0 64.9 child care 31.3 30.6 34.5 29.3 32.5 30.4 32.2 32.2 30.9 32.7 care of elderly parent 24.7 24.1 27.3 24.4 23.2 24.3 24.0 24.7 26.0 22.2 my physical health 37.8 36.8 42.6 35.6 39.2 36.8 37.1 36.3 39.2 37.2 review/promotion process 41.5 43.3 33.9 44.3 43.3 44.6 39.4 39.1 42.3 38.3 subtle discrimination 19.6 19.9 18.1 18.5 18.8 22.5 18.7 17.2 17.0 21.5 personal fmances 59.3 58.6 62.4 57.8 54.0 60.0 60.6 57.8 59.5 64.7 committee work 51.9 52.2 50.S 53.1 50.7 50.4 54.3 52.S 55.2 55.7 faculty meetings 46.0 45.9 46.5 46.5 43.2 46.1 46.0 44.8 48.6 46.2 colleagues 53.9 55.1 4S.7 57.4 52.2 54.6 53.7 54.7 51.0 53.7 students 53.2 51.3 61.7 50.2 47.2 51.3 55.4 53.9 52.8 58.5 research or publishing demands 50.2 5S.9 11.1 71.8 69.9 49.8 45.2 49.7 50.7 37.0 inst procedures & 'red tape' 68.6 68.5 68.7 72.0 59.6 71.9 62.2 59.7 64.6 64.3 teaching load 64.2 63.4 67.7 57.9 60.1 66.9 69.1 65.5 68.3 73.9 children's problems 32.8 31.9 37.1 31.0 30.9 32.4 33.0 32.1 31.1 35.1 marital friction 25.8 25.2 28.3 24.9 26.8 25.7 23.8 23.3 24.4 24.1 time pressures 80.9 81.7 77.5 82.0 84.4 78.9 84.0 82.7 83.1 86.0 lack of oersonallife 76.1 76.7 73.8 76.1 79.0 74.5 79.7 79.0 77.7 81.6
Still Want to Be CoUege Professor?
definitely yes 49.4 49.1 50.7 46.4 55.1 47.5 52.8 51.2 55.6 53.5 probably yes 32.6 32.7 31.8 33.3 30.2 33.1 32.7 34.1 31.1 31.7 not sure 10.7 10.6 10.7 11.3 9.9 11.3 8.9 9.1 8.1 8.9 probably no 5.6 5.7 5.1 6.9 3.3 6.1 4.2 4.4 3.8 4.2 definitely no 1.8 1.8 1.6 2.1 1.5 2.0 1.4 1.2 1.3 1.6
(5) Includes those marking "somewhat" or "extensive.»
Two-year Colleges Public Private
52.3 5S.6 17.2 20.6 41.8 52.S 77.6 84.4 44.0 35.8 69.8 SO.4 43.9 44.9 79.9 83.6 58.4 63.5 34.5 33.0
26.6 33.4 54.8 53.8 18.6 12.9
66.2 74.4 34.1 42.3 27.5 22.2 42.9 36.4 34.0 31.0 18.3 14.0 61.9 71.5 50.5 56.2 46.4 4S.3 49.0 44.8 61.8 59.7 10.8 17.3 69.1 62.2 67.9 65.2 37.1 37.3 27.9 35.6 77.2 83.8 73.8 74.5
50.9 47.S 31.5 38.5 10.8 9.1 5.2 4.0 1.6 0.8

aN
WEIGHTED NATIONAL NORMS FOR FULL-TIME UNDERGRADUATE FACULTY, 1992-1993
Four-year Colleges MALE FACULTY ALL Universities All Non-
Institutions 4-vear 2-vear Public Private Public Private sectarian Catholic Protestant Field of Highest Degree Held
agriculture 1.9 2.0 1.4 4.2 0.3 1.1 0.5 0.3 0.0 1.0 architecturelurban planning 0.6 0.5 1.1 1.4 0.0 0.1 0.2 0.3 0.0 0.1 bacteriology, molecular biology 1.0 1.0 0.8 1.3 1.1 0.8 1.0 0.7 1.0 1.3 biochemistry 0.6 0.6 0.5 0.8 0.5 0.5 0.5 0.7 0.5 0.5 biophysics 0.1 0.1 0.1 0.1 0.2 0.1 0.1 0.1 0.1 0.1 botany 0.9 0.9 0.5 0.9 0.6 1.1 0.8 0.7 0.6 1.1 marine life sciences 0.2 0.2 0.1 0.1 0.0 0.3 0.1 0.2 0.0 0.1 physiology, anatomy 0.7 0.8 0.4 1.0 0.8 0.8 0.6 0.5 1.2 0.6 zoology 1.6 1.7 1.1 1.6 1.6 1.9 1.4 1.2 1.2 1.7 general, oth biological science 1.5 1.2 2.9 1.4 0.9 1.1 1.1 1.3 0.9 0.9 accoWlting 1.8 1.8 1.6 1.5 1.5 1.9 2.4 1.8 3.7 2.4 finance -0.8 0.8 1.0 0.6 1.1 0.9 0.9 0.7 1.6 0.9 marketing 1.0 1.1 0.8 0.9 1.5 1.1 1.3 0.9 2.9 1.0 management 2.3 1.9 4.2 1.5 1.8 1.9 2.7 2.4 3.7 2.7 secretarial studies 0.0 0.0 0.0 0.0 0.0 0.0 0.0 0.0 0.0 0.0 general, other business 0.9 0.7 1.7 0.4 1.3 0.8 0.9 0.5 1.7 1.0 computer science 1.3 1.3 1.3 0.9 1.5 1.3 1.6 1.8 2.1 1.1
business education 0.6 0.3 2.1 0.2 0.1 0.5 0.2 0.2 0.0 0.4 elementary education 0.6 0.7 0.3 0.5 0.2 1.1 0.5 0.4 0.3 0.7 educational administration 1.2 1.0 1.7 0.4 0.8 1.6 1.4 0.9 1.9 1.7 educational psych, coWlSeling 0.8 0.7 1.6 0.7 0.2 0.7 0.9 0.9 0.8 0.8 higher education 1.4 0.9 3.9 0.6 0.5 1.2 1.0 0.8 1.0 1.2 music or art education 0.5 0.5 0.7 0.3 0.3 0.8 0.6 0.5 0.2 0.8 physical or health education 2.9 2.6 3.8 2.1 0.6 4.1 2.6 2.3 1.7 3.3 secondary education 1.0 0.9 1.1 0.8 0.3 1.4 0.9 0.7 0.5 1.2 special education 0.4 0.5 0.2 0.4 0.1 0.7 0.3 0.2 0.1 0.6 general, other education fields 2.6 2.4 3.8 1.8 1.2 3.2 2.6 2.0 2.6 3.2 aeronautical, astronautical eng 0.3 0.3 0.1 0.6 0.0 0.3 0.1 0.3 0.0 0.0 chemical engineering 0.6 0.7 0.1 1.5 0.2 0.3 0.2 0.3 0.2 0.1 civil engineering 1.2 1.3 0.5 2.3 1.0 0.9 O.S 0.8 0.5 0.0 electrical engineering 1.8 1.7 2.2 2.3 2.0 1.3 1.2 2.0 1.2 0.1 industrial engineering 0.5 0.5 0.3 0.9 0.4 0.4 0.1 0.2 0.2 0.1 mechanical engineering 1.3 1.2 1.7 2.1 1.2 0.8 0.5 1.0 0.4 0.0 nuclear engineering 0.1 0.1 0.0 0.2 0.0 0.2 0.1 0.1 0.1 0.0 general, other engineering field 1.1 1.1 1.1 2.0 0.4 0.8 0.5 0.9 0.2 0.1 ethnic studies 0.0 0.0 0.0 0.0 0.0 0.0 0.0 0.0 0.0 0.0 art 2.3 2.4 2.0 2.2 1.4 2.5 3.2 4.3 2.0 2.4 dramatics or speech 2.4 2.5 1.7 2.5 1.9 2.7 2.8 2.7 1.4 3.6 music 3.2 3.6 1.5 3.4 2.6 4.1 3.8 3.1 1.6 5.7 other fine arts 0.5 0.5 0.5 0.5 0.7 0.4 0.7 1.2 0.2 0.4 forestrY 0.2 0.2 0.1 OA· _ 0.0 0.0 0.0 0.0 0.1 0.1
Two-year Colleges Public Private
1.5 0.0 1.0 1.3 0.7 2.0 0.4 1.3 0.1 0.7 0.5 0.0 0.1 0.0 0.4 0.0 1.1 0.7 2.7 5.9 1.5 2.9 1.0 0.7 0.8 1.6 4.1 5.1 0.0 0.0 1.6 3.5 1.3 1.3 2.1 2.6 0.3 0.9 1.5 5.5 1.7 0.0 4.1 0.7 0.8 0.0 3.8 4.7 1.1 0.7 0.2 0.0 3.8 2.9 0.0 0.7 0.1 0.0 0.6 0.0 2.3 0.7 0.3 0.0 1.8 0.0 0.0 0.0 1.1 0.7 0.0 0.0 2.1 1.4 1.7 1.3 1.3 5.4 0.5 0.7 0.1 0.0

0\ V.>
WEIGHTED NATIONAL NORMS FOR FULL-TIME UNDERGRADUATE FACULTY, 1992-1993
Four-vear CoU ~
MALE FACULTY ALL Universities All Non-htstitutions 4-vear 2-vear Public Private Public Private sectarian Catholic Protestant
Field of Degree (continued) geology 0.8 0.9 0.1 1.1 0.4 1.3 0.2 0.2 0.2 0.2 dentistty 0.1 0.1 0.2 0.2 0.0 0.1 0.0 0.0 0.0 0.0 health technology 0.0 0.0 0.1 0.0 0.0 0.1 0.0 0.0 0.0 0.0 medicine or surgery 0.3 0.3 0.2 0.8 0.0 0.0 0.1 0.0 0.0 0.2 nursing 0.1 0.1 0.3 0.1 0.0 0.1 0.1 0.1 0.1 0.0 pharmacy, pharmacology 0.4 0.4 0.1 0.7 1.0 0.1 0.1 0.2 0.0 0.0 therapy (speech,physical,occup ) 0.3 0.3 0.2 0.4 0.3 0.4 0.1 0.2 0.1 0.0 veterinary medicine 0.1 0.1 0.2 0.1 0.0 0.1 0.1 0.1 0.0 0.0 general, other health fields 0.4 0.3 0.7 0.4 0.1 0.5 0.2 0.0 0.4 0.2 home economics 0.1 0.1 0.1 0.0 0.0 0.1 0.1 0.0 0.0 0.2 English language & literature 5.8 5.3 7.6 4.1 5.8 6.0 6.2 5.8 7.7 6.0 foreign languages & literature 0.4 0.4 0.4 0.4 0.7 0.3 0.4 0.4 0.3 0.4 French 0.5 0.6 0.2 0.6 0.5 0.5 0.8 0.9 0.7 0.8 German 0.5 0.6 0.0 0.7 1.0 0.4 0.6 0.7 0.6 0.5 Spanish 0.7 0.8 0.3 0.6 1.1 0.9 0.8 1.0 0.0 0.9 other foreign languages 0.5 0.6 0.1 0.6 1.0 0.2 0.9 1.0 0.7 0.8 history 4.3 4.7 2.9 3.3 6.2 5.0 5.4 5.5 4.9 5.6 linguistics 0.4 0.5 0.3 0.6 1.1 0.2 0.3 0.4 0.5 0.2 philosophy 1.8 2.0 0.9 1.4 3.4 1.7 2.8 2.3 5.9 2.1 religion & theology 1.6 1.8 0.8 0.3 4.1 0.5 5.3 3.5 6.4 7.0 general, other hwnanities fields 0.8 0.9 0.6 1.0 1.3 0.6 1.1 1.4 0.8 0.9 journalism 0.6 0.7 0.3 0.5 0.9 0.9 0.7 0.6 0.5 0.8 law 0.9 0.8 1.2 0.5 1.6 1.0 0.7 0.7 1.2 0.5 law enforcement 0.3 0.1 0.9 0.0 0.0 0.4 0.1 0.0 0.1 0.1 library science 0.1 0.1 0.2 0.1 0.0 0.1 0.1 0.1 0.1 0.2 mathematics and/or statistics 6.6 6.5 7.0 6.9 5.7 6.7 6.2 5.9 5.9 6.7 military science 0.0 0.0 0.0 0.0 0.0 0.0 0.0 0.0 0.0 0.0 astronomy 0.2 0.2 0.1 0.2 0.0 0.1 0.2 0.3 0.0 0.2 atmospheric sciences 0.1 0.2 0.0 0.3 0.0 0.1 0.0 0.1 0.0 0.0 chernistty 3.8 4.0 3.2 3.6 4.2 3.7 4.8 5.1 4.7 4.6 earth sciences 1.4 1.5 0.8 2.1 0.4 1.6 0.8 1.3 0.2 0.6 marine sciences 0.1 0.1 0.1 0.1 0.0 0.1 0.1 0.1 0.1 0.1 physics 3.3 3.3 2.8 3.9 4.0 2.6 3.3 3.8 2.4 3.2 general, other physical sciences 0.2 0.1 0.2 0.2 0.0 0.1 0.2 0.3 0.0 0.2 clinical psychology 0.7 0.8 0.2 0.9 0.7 0.7 0.8 0.7 0.5 1.0 counseling & guidance 0.6 0.4 1.2 0.2 0.2 0.6 0.5 0.3 0.6 0.6 experimental psychology 1.4 1.6 0.3 1.8 1.8 1.5 1.3 1.4 1.3 1.0 social psychology O.S 0.6 0.2 0.5 0.5 0.7 0.9 1.1 1.2 0.6 general other Dsvcholol!V 1.0 0.9 1.2 0.9 1.1 1.1 0.7 0.8 0.7 0.6
Two-year Colleges Public Private
0.1 0.0 0.2 0.0 0.1 0.0 0.1 1.3 0.3 0.0 0.1 0.0 0.2 0.0 0.2 0.0 0.8 0.7 0.1 0.0 7.8 4.0 0.4 0.7 0.2 0.0 0.0 O.O! 0.3 0.7 0.1 0.0 2.8 4.6 0.3 0.01 1.0 0.0 0.3 9.3 0.6 2.0 0.3 1.4 1.1 2.2 0.9 0.7 0.2 0.0 7.0 6.2 0.0 0.0 0.1 0.0 0.0 0.0 3.3 1.4 0.8 0.0 0.1 0.0 2.9 0.7 0.2 0.0 0.2 0.0 1.2 1.3 0.4 0.0 0.2 0.0 1.2 0.71

'" .po
WEIGHTED NATIONAL NORMS FOR FULL-TIME UNDERGRADUATE FACULTY, 1992-1993
- - - -- - Q~~~~
MALE FACULTY ALL Universities All Non-Four-vear con
Institutions 4-vear 2-vear Public Private Public Private sectarian Catholic Protestant Field of Degree (continued)
anthropology 0.7 0.8 0.5 0.9 1.1 0.6 0.8 1.2 O.S 0.4 archaeology 0.1 0.1 0.0 0.1 0.1 0.1 0.2 0.3 0.0 0.1 economics 3.4 3.8 1.7 3.6 6.3 3.1 3.9 4.0 5.6 3.0 political science, government 2.8 3.2 1.1 2.4 6.7 2.9 3.0 3.4 2.S 2.7 sociology 2.2 2.4 1.3 2.7 2.6 2.2 2.1 2.1 3.2 1.7 general, other social sciences 0.8 0.7 1.4 0.5 0.9 0.8 0.6 0.4 0.3 1.0 social work, social welfare 0.5 0.5 0.4 0.4 0.2 0.8 0.3 0.5 0.1 0.3 building trades 0.1 0.0 0.4 0.0 0.0 0.0 0.0 0.0 0.0 0.0 data processing, computer prog 0.2 0.1 0.4 0.0 0.0 0.2 0.1 0.2 0.0 0.0 drafting/design 0.1 0.0 0.2 0.0 0.0 0.0 0.0 0.0 0.0 0.0 electronics 0.1 0.0 0.7 0.0 0.0 0.0 0.0 0.0 0.0 0.0 industrial arts O.S 0.4 0.8 0.4 0.1 0.7 0.1 0.3 0.0 0.1 mechanics 0.2 0.0 1.1 0.0 0.0 0.0 0.0 0.0 0.0 0.0 other technical 0.4 0.2 1.1 0.2 0.0 0.4 0.2 0.4 0.0 0.0 other vocational 0.3 0.1 1.0 0.1 0.0 0.2 0.1 0.1 0.0 0.1 women's studies 0.0 0.0 0.0 0.0 0.0 0.0 0.0 0.0 0.0 0.0 all other fields 1.2 1.2 1.3 1.3 1.8 1.1 0.7 0.9 0.6 O.S
Department of Current Faculty Appointment
agriculture 2.2 2.4 1.3 5.2 0.2 1.5 0.2 0.3 0.1 0.3 architecturelurban planning 0.6 0.6 0.6 1.5 0.0 0.1 0.2 0.4 0.0 0.0 bacteriology, molecular biology 0.5 0.6 0.1 0.8 0.6 0.6 0.3 0.1 0.4 0.7 biochemistry 0.2 0.2 0.1 0.4 0.0 0.1 0.1 0.1 0.2 0.1 biophysics 0.1 0.1 0.0 0.2 0.0 0.0 0.0 I 0.0 0.0 0.0 botany 0.1 0.2 0.0 0.2 0.2 0.1 0.2 0.1 0.3 0.1 marine life sciences 0.1 0.1 0.1 0.1 0.0 0.2 0.0 0.0 0.1 0.0 physiology, anatomy 0.4 0.3 0.8 0.6 0.2 0.2 0.1 0.2 0.0 0.2 zoology 0.3 0.4 0.0 0.5 0.3 0.5 0.1 0.1 0.0 0.2 general, oth biological science 4.5 4.3 5.5 3.8 4.0 4.7 5.0 4.5 4.1 6.0 accounting 2.4 2.2 3.1 1.8 2.4 2.3 2.6 2.2 4.8 2.2 finance 0.8 0.9 0.2 0.8 1.2 0.9 1.1 0.7 2.0 1.1 marketing 1.1 1.2 0.6 1.0 1.6 1.3 1.1 1.0 2.0 0.9 management 2.8 2.7 3.2 1.8 3.5 2.8 3.4 3.1 6.9 2.2 secretarial studies 0.1 0.0 0.4 0.0 0.0 0.0 0.0 0.0 0.0 0.0 2eneral. other business 1.8 1.3 3.9 0.5 1.8 1.5 2.2 1.1 2.S 3.5
Two-year Colleges Public Private
O.S 0.0 1
0.0 0.7 1.6 2.2 1.1 0.7 1.4 0.7 1.4 1.3 0.5 0.0 0.4 0.0 O.S 0.0 0.3 0.0 0.7 0.0 0.8 0.0 1.1 0.0 1.2 0.0 1.1 0.0 0.0 0.0 1.3 1.3
0.01 1.3 0.6 0.7 0.2 0.0 0.1 0.0 0.0 0.0 0.0 0.7 0.0 0.7 0.7 2.7 0.0 0.71 5.6 3.4 3.0 3.6 0.2 0.0 0.5 1.6 3.0 7.4 0.4 0.0 4.0 2.1

0'\ \JI
WEIGHTED NATIONAL NORMS FOR F1JLL-TIME UNDERGRADUATE FACULTY, 1992-1993
Four-vear CoIl ~
MALE FACULTY ALL Universities All Non-Institutions 4-vear 2-vear Public Private Public Private sectarian Catholic Protestant
Current Department (continued) computer science 2.2 2.1 2.6 1.7 1.8 2.4 2.4 2.3 3.8 1.8 business education 0.3 0.2 0.4 0.1 0.2 0.3 0.4 0.1 0.7 0.5 elementary education 0.7 0.9 0.0 0.5 0.4 1.7 0.6 0.4 0.5 0.8 educational administration 0.2 0.3 0.0 0.2 0.2 0.4 0.2 0.3 0.2 0.2 educational psych, COWlSeling 0.3 0.4 0.2 0.6 0.2 0.3 0.1 0.0 0.2 0.1 bigher education 0.1 0.1 0.1 0.0 0.0 0.2 0.2 0.2 0.0 0.3 music or art education 0.1 0.2 0.1 0.0 0.2 0.3 0.2 0.3 0.1 0.2 physical or health education 3.2 3.1 4.1 2.5 0.6 4.4 3.4 2.8 2.6 4.6 secondary education 0.6 0.7 0.0 0.6 0.3 1.1 0.5 0.2 0.4 1.0 special education 0.3 0.4 0.0 0.3 0.0 0.7 0.1 0.1 0.1 0.2 general, other education fields 1.2 1.4 0.3 1.3 0.7 1.6 1.4 1.3 2.0 1.2 aeronautical, astronautical eng 0.1 0.2 0.0 0.4 0.0 0.1 0.0 0.0 0.0 0.0 chemical engineering 0.5 0.6 0.0 1.5 0.3 0.2 0.1 0.2 0.2 0.0 civil engineering 1.1 1.2 0.6 2.4 1.0 0.5 0.5 0.8 0.4 0.0 electrical engineering 1.6 1.6 1.4 2.5 2.0 0.9 1.2 2.0 1.1 0.1 industrial engineering 0.3 0.4 0.1 0.8 0.1 0.2 0.1 0.1 0.1 0.0 mechanical engineering 1.5 1.6 1.5 2.8 1.3 0.7 0.9 1.7 0.4 0.0 nuclear engineering 0.0 0.0 0.0 0.1 0.0 0.0 0.0 0.0 0.0 0.0 general, other engineering field 1.3 1.2 1.7 2.1 0.6 1.1 0.4 0.8 0.0 0.0 ethnic studies 0.0 0.0 0.0 0.0 0.0 0.0 0.0 0.0 0.0 0.0 art 2.6 2.7 2.1 2.6 1.8 2.8 3.2 4.4 1.8 2.5 dramatics or speech 2.3 2.5 1.2 2.5 1.6 2.6 2.8 2.7 1.1 3.9 music 3.4 3.8 1.9 3.5 2.6 4.4 4.0 3.1 1.4 6.3 other fine arts 0.5 0.4 0.6 0.2 0.8 0.3 0.7 1.2 0.6 0.2 forestry 0.2 0.2 0.0 0.6 0.0 0.0 0.0 0.0 0.0 0.0 geology 0.8 0.9 0.0 1.4 0.3 1.2 0.2 0.1 0.2 0.2 dentistry 0.1 0.1 0.2 0.2 0.0 0.0 0.0 0.0 0.0 0.0 health teclmology 0.2 0.1 0.7 0.1 0.0 0.1 0.0 0.0 0.1 0.0 medicine or surgery 0.2 0.3 0.0 0.8 0.0 0.0 0.0 0.0 0.0 0.0 nursing 0.1 0.1 0.3 0.2 0.0 0.1 0.1 0.1 0.2 0.0 pharmacy, pharmacology 0.4 0.5 0.0 0.7 1.2 0.1 0.1 0.3 0.0 0.0 therapy (speech,physical,occup) 0.4 0.4 0.1 0.5 0.2 0.6 0.1 0.1 0.5 0.0 veterinary medicine 0.1 0.0 0.1 0.1 0.0 0.0 0.0 0.0 0.0 0.0 general, other health fields 0.8 0.6 1.5 0.6 0.1 1.0 0.3 0.5 0.3 0.1 home economics 0.2 0.2 0.1 0.4 0.0 0.3 0.0 0.0 0.0 0.1 English language & literature 6.6 6.0 9.4 4.6 7.0 6.6 6.8 6.1 8.1 7.0 foreign languages & literature 1.6 1.9 0.4 1.8 1.3 1.9 2.4 2.5 2.2 2.4 French 0.2 0.2 0.0 0.2 0.3 0.1 0.3 0.3 0.2 0.4 German 0.3 0.3 0.0 0.4 0.9 0.1 0.3 0.4 0.1 0.2 Spanish 0.3 0.3 0.0 0.1 1.2 0.3 0.2 0.3 0.0 0.2 other foreim lanm82es 0.3 0.4 0.0 ~4~_ 1.1 0.1 0.5 0.7 0.2 0.4
Two-year Colleges Public Private
2.5 3.8 0.4 0.9 0.0 0.0 0.0 0.0 0.2 0.0 0.2 0.0 0.1 0.0 3.9 6.8 0.0 0.0 0.0 0.0 0.4 0.0 0.0 0.0 0.0 0.0 0.7 0.0 1.4 0.7 0.1 0.0 1.6 0.0 0.0 0.0 1.8 0.0 0.0 0.0 2.1 1.4 1.1 2.1 1.7 5.5 0.6 0.0 0.0 0.0 0.0 0.0 0.2 0.0 0.6 2.0 0.0 0.7 0.3 0.0 0.0 0.0 0.1 0.0 0.1 0.0 1.3 4.7 0.1 0.0 9.7 4.8 0.4 0.7 0.0 0.0 0.0 0.0 0.0 0.0 0.0 0.0

0'\ 0'\
WEIGHTED NATIONAL NORMS FOR FULL-TIME UNDERGRADUATE FACULTY, 1992-1993
- - - - .- ---.::.~---
MALE FACULTY ALL Universities All Non-Four-vear Coil
Institutions 4-year 2-vear Public Private Public Private sectarian Catholic Protestant Current Department (continued)
history 4.0 4.3 2.5 3.3 5.8 4.5 4.8 4.5 4.9 5.0 linguistics 0.2 0.2 0.0 0.3 0.8 0.0 0.0 0.1 0.0 0.0 philosophy 1.8 2.0 0.8 1.5 3.2 t6 2.8 2.2 5.5 2.2 religion & theology 1.4 1.7 0.4 0.1 4.3 0.1 5.3 3.2 6.7 7.3 general, other hwnanities fields 1.2 1.0 1.8 1.0 O.S 0.9 1.6 2.4 1.0 0.9 jownalism 0.9 1.0 0.3 0.9 2.3 0.9 O.S 0.6 O.S 0.4 law 0.2 0.2 0.1 0.2 0.4 0.2 0.1 0.1 0.0 0.1 law enforcement 0.7 0.4 2.1 0.1 0.7 0.8 0.1 0.2 0.1 0.1 library science 0.1 0.1 0.2 0.1 0.0 0.2 0.2 0.1 0.1 0.3 mathematics and/or statistics 6.9 6.6 8.0 6.4 6.0 6.8 7.0 6.0 5.5 8.8 military science 0.0 0.1 0.0 0.0 0.0 0.1 0.1 0.1 0.1 0.0 astronomy 0.1 0.2 0.1 0.3 0.0 0.0 0.1 0.2 0.0 0.1 atmospheric sciences 0.1 0.1 0.0 0.2 0.0 0.0 0.0 0.0 0.0 0.0 chemistry 3.7 3.9 2.8 3.3 3.8 3.9 5.0 4.9 4.9 5.1 earth sciences 1.3 1.4 0.4 1.9 0.4 1.8 0.7 1.1 0.1 O.S marine sciences 0.1 0.1 0.0 0.2 0.0 0.0 0.1 0.0 0.0 0.2 physics 2.8 2.9 2.1 2.9 3.7 2.7 2.9 3.7 2.1 2.3 general, other physical sciences 0.5 0.3 1.8 0.2 0.0 0.4 0.4 0.5 0.5 0.2 clinical psychology 0.4 0.5 0.0 0.8 0.6 0.2 0.2 0.2 0.4 0.2 cmmseling & guidance 0.2 0.2 0.5 0.2 0.1 0.2 0.2 0.2 0.2 0.2 experimental psychology 0.7 0.9 0.0 1.3 1.0 0.5 0.5 0.7 0.2 0.4 social psychology 0.1 0.2 0.0 0.1 0.3 0.1 0.3 0.3 0.2 0.2 general, other psychology 2.0 1.9 2.1 0.9 1.7 2.8 2.4 2.4 1.9 2.7 anthropology 0.7 0.7 0.4 0.9 1.0 0.6 0.5 0.8 0.2 0.3 archaeology 0.0 0.0 0.0 0.0 0.0 0.0 0.1 0.1 0.0 0.0 economics 2.8 3.1 1.3 2.9 5.6 2.4 3.1 3.6 3.2 2.4 political science, government 2.4 2.9 0.3 2.2 6.0 2.5 2.9 3.3 2.2 2.7 sociology 2.2 2.4 1.1 2.7 2.4 2.2 2.4 2.1 3.4 2.2 general, other social sciences 1.9 1.3 4.2 0.6 1.2 2.1 1.4 1.4 0.8 1.7 social work, social welfare 0.4 0.4 0.2 0.4 0.1 0.7 0.4 0.4 0.1 0.4 building trades 0.2 0.0 1.0 0.0 0.0 0.0 0.0 0.0 0.0 0.0 data processing,computer prog 0.4 0.2 1.6 0.1 0.0 0.4 0.3 0.4 0.3 0.1 drafting/design 0.2 0.1 0.9 0.1 0.0 0.1 0.2 0.4 0.0 0.0 electronics 0.6 0.1 2.8 0.1 0.0 0.3 0.1 0.1 0.0 0.0 industrial arts 0.3 0.3 0.3 0.2 0.0 O.S 0.1 0.3 0.0 0.0 mechanics 0.4 0.0 2.1 0.0 0.0 0.1 0.0 0.0 0.0 0.0 other technical 0.9 O.S 2.7 0.3 0.0 0.9 O.S 1.0 0.0 0.0 other vocational 0.4 0.1 1.7 0.1 0.0 0.2 0.0 0.0 0.0 0.0 women's studies 0.0 0.0 0.0 0.0 0.0 0.0 0.0 0.0 0.0 0.0 all other fields 1.7 1.6 1.8 _1.2 1.7 1.7 1.3 1.9 1.4 0.6
Two-year Colleges Public Private
!
2.4 3.41 0.0 0.0 0.8 O.Oj 0.0 8.2 1.7 3.41 0.2 1.41 0.1 1.4 2.2 0.71 0.2 0.01 8.1 5.21 0.0 0.0 0.1 0.01 0.0 0.01 2.9 1.4 0.4 0.01 0.0 0.0 2.2 1.4 1.8 0.7 0.0 0.0 0.5 0.0
1 0.0 0.0 0.0 0.01 2.1 2.7 0.4 0.01 0.0 0.0 1.3 1.61 0.3 0.01 1.1 0.7 4.3 2.71 0.2 0.0 1.1 0.01 1.6 0.71 0.8 2.7 2.8 2.71 0.3 0.0 2.2 0.01 2.9 0.0 1.8 0.01 0.0 0.0
1.8 1.41

National Normative Data for
the 1992-93 HERI Faculty Survey
Female Faculty
67


0'\ \0
WEIGHTED NATIONAL NORMS FOR FULL-TIME UNDERGRADUATE FACULTY, 1992-1993
Four-vear con -FEMALE FACULTY ALL Universities All Non-Institutions 4-vear 2-vear Public Private Public Private sectarian Catholic Protestant
Number of ResDondents 9981 8309 1672 1 111 798 3210 3190 1276 839 1075 Age as of December 31, 1992
less than 30 3.3 3.2 3.4 3.5 2.3 3.2 3.3 2.9 1.4 5.1 30 to 34 10.0 10.7 8.1 12.5 10.3 8.3 12.6 14.9 10.7 11.0 3S to 39 15.0 16.0 12.7 18.5 16.3 14.4 15.5 16.6 12.6 16.3 40 to 44 20.8 20.7 21.0 19.6 23.7 20.8 20.5 21.1 20.6 19.9 45 to 49 19.7 18.5 22.6 17.9 22.4 18.7 17.5 16.5 16.7 19.3 50 to 54 14.8 14.3 16.2 12.5 11.0 16.8 13.7 12.7 15.9 13.5 55 to 59 9.4 9.4 9.3 9.4 7.5 10.2 9.0 7.7 11.4 8.9 60 to 64 4.7 4.8 4.6 4.1 3.2 5.5 5.1 6.1 5.1 3.9 65 to 69 1.9 2.0 1.6 1.8 3.1 1.9 2.2 1.1 4.3 2.0 70 or more 0.4 0.3 0.4 0.2 0.3 0.3 0.6 0.4 1.5 0.1
Academic Rank professor 15.1 14.4 16.8 13.4 13.9 14.4 15.8 17.0 15.4 14.6 associate professor 23.0 24.5 19.5 26.0 27.6 22.5 24.7 26.5 25.8 21.9 assistant professor 35.8 41.7 21.8 43.2 42.8 39.1 43.6 41.3 43.5 46.3 lecturer 4.3 5.7 1.1 6.4 7.0 7.1 2.2 3.0 1.4 1.9 instructor 20.1 12.6 37.7 10.9 6.6 15.5 12.4 10.2 12.8 14.8 other 1.7 1.0 3.2 0.1 2.1 1.3 1.3 2.0 1.1 0.5
Administrative Title not applicable 77.7 78.2 76.4 82.2 82.3 77.9 73.0 75.9 69.9 71.9 director or coordinator 10.7 10.8 10.5 10.9 10.0 11.0 10.8 8.9 12.2 12.0 department chair 6.6 6.0 8.1 1.8 3.6 6.2 11.0 10.2 12.5 10.8 dean 0.2 0.3 0.1 0.1 0.1 0.3 0.6 0.2 0.3 1.2 associate or assistant dean 0.4 0.5 0.2 0.4 0.5 0.7 0.5 0.5 0.5 0.4 vice-pres, provost, vice-chanc 0.0 0.0 0.1 0.0 0.0 0.0 0.1 0.2 0.0 0.0 president, chancellor 0.0 0.0 0.0 0.0 0.0 0.0 0.0 0.0 0.0 0.0 other 4.3 4.1 4.7 4.7 3.5 3.8 4.1 4.1 4.7 3.7
Principal Activity administration 2.9 2.9 3.1 2.4 1.7 3.1 3.5 2.9 3.7 4.2 teaching 93.9 93.5 94.9 90.0 95.2 94.9 94.7 95.5 95.1 93.6 research 1.5 2.1 0.0 6.1 2.1 0.3 0.3 0.3 0.1 0.5 services to clients and patients 0.8 0.7 1.1 0.7 0.6 0.7 0.7 0.7 0.6 0.9 other 0.8 0.8 0.9 0.7 0.3 1.1 0.7 0.6 0.6 0.8
Radal Background (I) White/Caucasian 91.4 89.8 95.2 93.8 92.7 85.3 91.0 93.4 95.9 84.9 African American/Black 4.8 5.7 2.6 2.1 2.6 9.7 5.2 2.3 1.1 11.4 American Indian 1.4 1.4 1.4 0.9 1.0 2.0 1.3 1.7 0.9 1.1 Asian American/Asian 2.2 2.6 1.1 2.7 3.2 2.7 2.2 2.6 2.3 1.7 Mexican American/Chicano 0.3 0.3 0.3 0.3 0.7 0.4 0.2 0.4 0.1 0.1 Puerto Rican 0.3 0.3 0.2 0.2 0.3 0.7 0.1 0.0 0.1 0.1 other Latino 1.2 1.3 1.0 1.0 2.5 1.5 1.0 1.3 1.0 0.7 other 1.2 ~ .... 0.7 1.1 1.9 1.4 1.5 1.6 0.3 2.2
(1) Percentages will sum to more than 100 if any respondents checked more than one category.
Two-year Colleges Public Private! 1485 187
3.2 5.5 7.8 12.9
12.3 18.1 21.3 15.5 23.2 14.9 16.4 14.0 9.2 11.1 4.7 4.4 1.6 3.0 0.4 0.6
17.1 12.5 19.7 16.4 21.3 28.2
1.0 1.4 37.6 38.7 3.2 2.9
77.4 62.8 10.3 12.5 7.5 16.0 0.1 1.0 0.2 0.0 0.1 0.0 0.0 0.0 4.5 7.8
2.9 5.4 95.1 92.2 0.0 0.0 1.1 1.4 0.9 1.0
95.0 98.5 2.6 1.5 1.5 0.5 1.2 0.0 0.3 0.0 0.2 0.0 1.0 0.5 0.8 0.0

-..,J
o
WEIGHTED NATIONAL NORMS FOR FULL-TIME UNDERGRADUATE FACULTY, 1992-1993
Four-year Colleges FEMALE FACULTY ALL Universities All Non-
Institutions 4-vear 2-vear Public Private Public Private sectarian Catholic Protestant Higbest Degree Earned
bachelor's (B.A., B.S., etc.) 4.6 2.3 10.0 1.7 1.0 2.3 3.5 5.4 1.1 2.9 master's (M.A., M.S., etc.) 42.0 31.2 67.7 25.7 16.5 35.8 35.9 32.9 36.3 39.1 LL.B.,J.D 0.5 0.4 0.7 0.4 0.7 0.2 0.4 0.7 0.4 0.1 M.D., D.D.S. (or equivalent) 0.3 0.3 0.2 0.7 0.0 0.2 0.1 0.1 0.1 0.1 other first professional 0.6 0.6 0.5 0.5 0.4 0.7 0.6 0.7 0.2 0.8 Ed.D 5.4 6.9 2.0 7.2 2.7 9.3 4.7 3.6 5.4 5.4 Ph.D 38.6 52.1 6.5 58.5 74.4 44.6 47.9 51.0 49.5 43.0 other degree 3.9 3.8 3.9 3.6 2.2 4.2 4.2 3.2 4.2 5.3 none 4.2 2.4 8.4 1.8 2.0 2.7 2.8 2.5 2.7 3.3
Field of Highest Degree (2) agriculture or forestry 0.5 0.6 0.3 1.8 0.0 0.3 0.1 0.1 0.0 0.2 biological sciences 4.3 4.4 4.1 5.3 3.4 3.3 5.3 5.5 5.1 5.0 business 5.6 4.9 7.1 4.4 6.7 4.8 5.0 5.0 6.7 3.7 education 23.0 21.2 27.1 18.8 6.8 28.8 18.1 14.7 18.6 21.7 engineering 0.7 0.8 0.6 1.7 1.4 0.3 0.5 0.8 0.5 0.2 English 9.1 8.6 10.3 5.7 11.2 8.8 10.3 9.3 9.5 12.1 health related 13.7 10.3 21.8 13.3 4.5 10.1 9.5 8.9 12.8 7.9 history or political science 3.5 4.5 1.2 3.9 10.0 3.8 4.0 4.9 4.9 2.4 hwnanities 8.5 10.6 3.4 11.2 19.8 6.8 12.3 13.5 11.1 11.7 fine arts 7.3 9.0 3.4 8.4 7.4 8.6 10.8 13.9 4.9 11.1 mathematics or statistics 4.1 3.6 5.4 2.2 3.8 4.4 4.0 4.1 5.0 3.4 physical sciences 2.4 2.6 1.8 2.2 3.3 2.6 3.0 2.9 3.9 2.4 social sciences 10.5 12.0 6.8 12.2 16.8 10.6 12.3 11.2 12.4 13.5 other teclmical 1.5 1.2 2.2 0.7 0.8 1.3 1.6 1.8 1.6 1.4 other non-teclmical 5.3 5.6 4.5 8.3 4.2 5.7 3.2 3.4 2.9 3.2
Year Highest Degree Earned 1954 or earlier 1.4 0.8 2.8 0.4 0.5 1.2 1.0 1.5 0.4 0.7 1955 to 1959 1.7 1.5 2.0 1.6 1.4 1.5 1.4 1.4 2.4 0.8 1960 to 1964 3.3 3.2 3.7 3.0 4.0 2.7 3.7 3.1 4.3 4.1 1965 to 1969 7.2 6.3 9.5 6.7 5.0 6.3 6.2 5.9 6.3 6.6 1970 to 1974 12.0 12.0 12.1 11.4 12.2 13.1 10.8 10.8 11.2 10.5 1975 to 1979 15.8 15.0 17.8 12.6 17.6 16.2 14.9 16.0 14.5 13.9 1980 to 1984 19.2 18.6 20.7 17.2 20.1 18.5 19.6 19.8 21.0 IS.5 1985 to 1989 24.7 26.3 20.8 26.3 23.5 25.6 28.4 27.7 26.8 30.5 1990 to 1992 14.6 16.3 10.7 20.8 15.8 14.7 13.S 13.8 13.1 14.4
Degree Currently Working Toward bachelor's (B.A., B.S., etc.) 0.9 0.1 2.7 0.0 0.0 0.3 0.0 0.0 0.2 0.0 master's (M.A., M.S., etc.) 8.8 4.1 20.0 3.0 0.8 4.1 6.2 9.1 3.4 5.0 LL.B.,J.D 0.2 0.3 0.1 0.2 0.5 0.4 0.3 0.3 0.0 0.4 M.D., D.D.S. (or equivalent) 0.3 0.1 0.7 0.0 0.0 0.2 0.2 0.0 0.2 0.5 other fIrst professional 0.3 0.3 0.3 0.3 0.6 0.0 0.5 0.6 0.0 O.S Ed.D 5.S 5.1 6.4 5.1 0.8 5.9 5.6 7.1 6.8 3.1 Ph.D 19.6 20.8 16.9 13.4 14.7 24.1 26.0 19.2 25.7 33.6 other degree 3.8 2.9 5.7 3.2 1.8 3.4 2.4 2.7 1.8 2.4 none 60.6 66.3 47.3 74.9 SO.8 61.6 58.8 61.0 62.0 54.2
(2) Recategorization ofthls item from a longer list is shown in The American College Teacher
Two-year Colleges Public Private!
10.0 10.6 68.4 57.4 0.6 2.0 0.2 0.0 0.5 0.5 1.9 3.5 6.1 12.3 3.7 6.9 8.5 6.8
0.3 0.0 4.0 5.1 7.0 8.8
27.2 26.4 0.6 0.0
10.2 12.6 21.8 22.1
1.1 2.5 3.5 3.0 3.5 2.8 5.6 2.1 1.7 2.0 6.9 5.0 2.1 3.0 4.5 4.7
2.9 1.6 2.0 2.3 3.9 0.5 9.4 11.2
12.3 9.2 18.1 13.4 20.5 22.9 20.4 25.8 10.5 13.2
2.6 3.6 19.7 24.1 0.0 1.2 0.7 1.2 0.3 1.2 6.7 2.5
17.1 12.8 5.4 9.2
47.5 44.2

........
......
WEIGHTED NATIONAL NORMS FOR FULL-TIME UNDERGRADUATE FACULTY, 1992-1993
Four-vear ColI ~
FEMALE FACULTY ALL Universities All Non-Institutions 4-vear 2-vear Public Private Public Private sectarian Catholic Protestant
Department of Current Faculty Appointment (2)
agriculture or forestry 0.8 1.0 0.2 3.1 0.0 0.4 0.1 0.0 0.0 0.3 biological sciences 4.0 3.9 4.3 3.8 3.3 3.3 4.9 5.0 5.5 4.3 business 7.8 6.2 11.6 4.8 8.9 6.3 6.5 6.2 8.2 5.6 education 13.2 15.7 7.0 13.4 5.3 22.0 12.8 9.5 12.4 17.0 engineering 0.6 0.7 0.4 1.7 1.5 0.1 0.3 0.4 0.3 0.0 English 10.8 9.7 13.3 7.2 12.5 9.8 11.2 10.8 10.0 12.4 health related 16.5 12.7 25.6 17.5 5.1 12.1 11.2 9.5 16.9 9.3 history or political science 3.1 4.1 0.5 3.8 9.5 3.3 3.8 4.3 4.0 3.1 hwnanities 7.9 9.7 3.6 8.8 18.7 6.2 12.6 13.4 11.7 12.2 fine arts 7.2 9.0 2.8 9.5 7.4 8.6 9.7 11.9 5.3 10.3 mathematics or statistics 5.4 4.2 8.3 2.3 3.3 5.6 4.6 4.4 5.7 4.0 physical sciences 2.4 2.8 1.7 2.3 3.4 2.5 3.3 3.2 3.8 3.1 social sciences 10.0 11.2 7.3 10.8 14.3 10.2 11.8 11.4 10.6 13.1 other technical 3.3 2.0 6.6 1.1 1.4 2.0 3.1 4.9 1.9 1.7 other non-technical 7.1 7.1 6.9 9.7 5.5 7.6 4.2 5.1 3.8 3.6
Year Appointed to Current Position
1954 or earlier 0.9 0.9 0.8 1.0 0.3 1.1 0.8 0.6 1.6 0.4 1955 to 1959 0.4 0.5 0.1 0.8 0.3 0.2 0.7 0.6 1.2 0.6 1960 to 1964 2.1 2.6 1.0 2.1 2.0 2.8 3.2 2.6 2.5 4.4 1965 to 1969 6.4 6.4 6.3 6.0 6.6 7.5 5.3 5.8 6.2 4.2 1970 to 1974 9.6 8.3 12.8 7.8 10.3 10.0 5.5 6.9 4.5 4.5 1975 to 1979 11.2 10.7 12.4 10.3 10.1 11.4 10.1 10.2 11.6 8.9 1980 to 1984 15.1 14.2 17.1 13.8 13.9 13.1 16.5 18.4 16.4 14.4 1985 to 1989 26.9 27.3 25.9 27.4 27.5 26.0 28.9 26.7 30.3 30.6 1990 to 1992 27.4 29.0 23.5 30.8 28.8 27.9 29.0 28.2 25.7 32.0
Tenured? yes 42.4 39.2 50.0 40.6 39.0 42.6 33.1 35.0 33.8 30.5 no 57.6 60.8 50.0 59.4 61.0 57.4 66.9 65.0 66.2 69.5
Year Received Tenure 1954 or earlier 0.1 0.1 0.2 0.2 0.1 0.1 0.1 0.3 0.0 0.0 1955 to 1959 0.2 0.2 0.0 0.5 0.1 0.2 0.1 0.0 0.2 0.2 1960 to 1964 0.7 1.0 0.0 0.8 0.3 0.7 2.1 0.9 1.0 4.7 1965 to 1969 4.3 5.0 2.9 4.2 4.3 6.1 4.3 3.7 6.0 3.8 1970 to 1974 12.5 12.6 12.4 12.8 12.9 13.3 10.7 9.6 9.9 12.8 1975 to 1979 16.8 16.3 17.8 16.8 18.3 17.5 12.7 15.3 12.0 9.7 1980 to 1984 20.0 20.6 18.8 20.1 20.9 21.5 19.3 19.0 21.0 18.3 1985 to 1989 24.5 23.4 26.6 23.9 24.7 20.4 28.0 31.0 25.9 25.5 1990 to 1992 20.9 20.7 21.3 20.7 18.4 20.3 22.6 20.2 24.0 24.9
Primary Interest very heavily in teaching 47.0 35.7 73.4 25.0 21.2 42.8 42.4 38.0 44.3 46.2 leaning toward teaching 36.2 41.5 23.7 42.2 42.1 39.9 42.8 43.2 41.0 43.6 leaning toward research 15.2 20.5 2.7 29.4 31.2 15.9 13.8 16.9 13.8 10.0 very heaYilY in rc::searcb__ _ ______ ~ ___ 2,_3_ __ 0.2 _ __ 3.4_ 5.4 ---1.4 --- 1.1 1.9 0.9 0.2
(2) Recategorization of this item from a longer list is shown in The American College Teacher
Two-year Colleges Public Private
0.2 0.0 4.3 3.8
11.6 10.9 6.6 13.1 0.4 0.0
13.4 12.2 25.5 25.9
0.4 2.2 3.6 4.5 2.8 2.8 8.5 5.0 1.7 1.6 7.4 5.3 6.5 8.2 7.1 4.5
0.9 0.6 0.1 1.0 1.0 1.1 6.2 7.4
13.2 7.6 12.6 10.6 16.9 19.8 25.9 25.7 23.3 26.2
52.1 21.2 47.9 78.8
0.2 0.0 0.0 0.0 0.0 0.0 2.5 14.5
12.5 9.9 17.7 22.1 19.0 11.8 26.6 26.8 21.5 14.9
74.1 63.3 23.0 33.0 2.7 3.2 0.1 0.5

"'-l N
WEIGHTED NATIONAL NORMS FOR FULL-TIME UNDERGRADUATE FACULTY, 1992-1993
Four-vear CoU ~ .....• FEMALE FACULTY ALL Universities All Non-
Institutions 4-vear 2-vear Public Private Public Private sectarian Catholic Protestant Salary Is Based On
9/10montbs 78.8 78.9 78.4 83.6 76.1 80.4 72.7 66.5 75.8 77.5 11112 months 21.2 21.1 21.6 16.4 23.9 19.6 27.3 33.5 24.2 22.5
Base Salary in Thousands for: Faculty on 9110 Mo Contracts
less than 20 1.9 1.6 2.6 2.7 1.6 1.1 1.1 1.2 1.3 1.0 20 to 29 25.1 23.5 28.7 20.8 12.1 26.1 27.1 19.3 21.0 39.4 30 to 39 41.8 42.6 40.0 42.8 31.3 43.6 45.1 40.6 50.0 46.4 40 to 49 20.2 20.2 20.3 21.4 24.7 19.7 17.8 24.2 20.3 9.4 50 to 59 7.6 8.0 6.6 8.2 15.3 7.0 6.4 9.9 5.3 3.5 60 to 69 2.6 3.2 1.4 2.8 11.6 2.3 1.7 3.3 1.7 0.2 70 to 79 0.6 0.7 0.3 1.0 2.1 0.1 0.6 1.4 0.2 0.1 80 to 89 0.1 0.1 0.0 0.0 0.9 0.0 0.0 0.1 0.0 0.0 90 to 99 0.0 0.1 0.0 0.2 0.0 0.0 0.0 0.1 0.0 0.0 100 to 124 0.1 0.1 0.0 0.1 0.4 0.1 0.0 0.0 0.0 0.0 125 to 149 0.0 0.0 0.0 0.0 0.0 0.0 0.1 0.0 0.2 0.1 150 or more 0.0 0.0 0.1 0.1 0.0 0.0 0.0 0.0 0.0 0.0
Faculty on 11/12 Mo Contracts less than 20 1.5 0.7 3.3 0.0 0.0 0.3 1.6 1.4 2.2 1.7 20 to 29 20.6 18.2 26.3 12.9 2.9 18.1 26.7 20.4 21.7 40.8 30 to 39 40.8 41.2 39.7 30.5 38.0 44.0 46.5 42.8 53.2 48.0 40 to 49 22.1 23.8 18.2 29.5 35.4 23.6 16.4 22.5 14.8 7.3 50 to 59 9.9 10.1 9.4 17.6 15.0 8.6 5.2 8.0 3.2 1.9 60 to 69 3.6 3.8 3.1 3.6 6.3 4.2 2.8 3.7 4.1 0.4 701079 0.6 0.9 0.0 1.9 1.9 0.3 0.4 0.8 0.0 0.0 80 to 89 0.2 0.3 0.0 1.1 0.0 0.2 0.1 0.2 0.0 0.0 90 to 99 0.0 0.1 0.0 0.0 0.6 0.0 0.0 0.0 0.0 0.0 100 to 124 0.1 0.2 0.0 0.8 0.0 0.0 0.0 0.0 0.0 0.0 125 to 149 0.1 0.2 0.0 0.8 0.0 0.0 0.1 0.2 0.0 0.0 150 or more 0.4 0.6 0.0 1.4 0.0 0.7 0.2 0.0 0.9 0.0
Father's Education 8th grade or less 13.7 13.1 15.2 11.8 7.9 16.4 11.6 11.2 14.2 10.3 some high school 9.6 8.4 12.5 8.0 7.0 9.2 8.1 8.3 9.9 6.8 completed high school 23.5 21.2 29.1 20.9 17.1 22.6 21.0 19.8 22.3 21.4 some college 15.4 15.8 14.6 15.5 13.5 16.8 15.4 12.7 14.8 19.0 graduated from college 15.0 15.8 13.0 17.7 19.8 13.7 15.2 14.5 15.8 15.7 attended grad/prof school 5.8 6.4 4.4 6.3 6.8 5.4 7.9 9.1 7.5 6.8 attained advanced degree 16.9 19.4 11.1 19.8 27.9 15.9 20.7 24.4 15.4 20.0
Mother's Education 8th grade or less 8.7 8.1 10.3 6.5 6.7 9.7 8.0 7.9 8.9 7.4 some high school 10.1 9.3 12.3 9.0 8.0 10.9 7.7 7.3 9.9 6.5 completed high school 32.5 30.4 37.4 29.9 25.3 31.6 31.0 30.7 33.7 29.6 some college 17.9 18.2 17.1 17.4 20.8 18.1 18.3 16.6 17.2 21.1 graduated from college 16.7 18.1 13.5 20.8 15.9 15.5 19.6 19.6 18.5 20.2 attended grad/prof school 5.4 6.2 3.6 7.5 6.4 5.3 6.0 7.1 5.5 5.0 attained advanced degree 8.6 9.8 5.8 9.0 16.8 8.8 9.5 10.6 6.3 10.2
Two-year Colleges Public Private
79.6 62.2 20.4 37.8
2.5 3.7 28.1 41.3 39.6 47.0 20.9 8.0 6.9 0.0 1.5 0.0 0.3 0.0 0.0 0.0 0.0 0.0 0.0 0.0 0.0 0.0 0.1 0.0
2.9 6.6 25.3 33.2 39.1 44.8 19.0 12.6 10.4 1.4 3.3 1.4 0.0 0.0 0.0 0.0 0.0 0.0 0.0 0.0 0.0 0.0 0.0 0.0
15.1 16.7 12.6 11.9 29.4 24.7 14.6 15.6 13.2 10.3 4.2 7.6
11.0 13.2
10.4 8.3 12.3 12.2 37.6 34.5 17.1 16.3 13.1 19.7 3.4 6.8 6.1 2.2

'-I W
WEIGHTED NATIONAL NORMS FOR FULL-TIME UNDERGRADUATE FACULTY, 1992-1993
Four-year Colleges FEMALE FACULTY ALL Universities All Non-
Institutions 4-vear 2-vear Public Private Public Private sectarian Catholic Protestant Marital Status
married (currently) 62.0 59.1 68.8 58.5 62.3 58.1 59.8 59.2 53.3 65.0 separated 1.6 1.4 1.9 1.5 1.7 1.2 1.6 1.5 1.3 1.8 single (never married) 16.6 19.1 10.5 19.9 15.6 18.1 21.0 18.9 29.2 17.9 single (with partner) 4.2 4.8 2.8 4.7 6.9 3.7 5.7 7.9 4.5 4.1 single (divorced) 13.1 13.1 13.0 13.8 11.6 15.4 9.6 10.8 8.9 8.7 single (widowed) 2.6 2.5 3.0 1.5 1.9 3.4 2.3 1.7 2.9 2.5
Spouse's or Partner's Edueation 8th grade or less 0.2 0.1 0.3 0.0 0.3 0.1 0.1 0.1 0.0 0.1 some high school 0.6 0.4 1.0 0.4 0.1 0.5 0.2 0.3 0.3 0.2 completed high school 3.4 2.1 6.3 1.1 1.6 3.0 2.1 1.7 2.8 2.1 some college 8.5 6.6 13.0 5.3 2.9 8.7 6.3 6.2 5.1 7.2 graduated from college 12.6 10.7 17.2 9.6 7.9 12.6 10.1 10.7 9.9 9.5 attended grad/prof school 9.0 8.7 9.7 8.2 8.5 8.8 9.1 9.5 8.8 8.9 attained advanced degree 44.1 47.4 36.6 48.8 59.6 42.1 48.8 50.4 42.7 50.9 does not apply 21.6 24.1 15.8 26.5 19.0 24.1 23.4 21.3 30.4 21.1
Number of Children Aged: Oto4 Years
none 84.4 84.4 84.5 85.7 78.4 85.9 82.9 80.2 85.7 84.3 one 12.1 12.4 11.2 11.2 18.0 11.2 13.5 15.7 11.0 12.6 two 3.3 3.0 4.2 3.0 3.0 2.8 3.2 3.4 3.1 3.0 three 0.1 0.2 0.0 0.2 0.5 0.1 0.2 0.3 0.2 0.1 four or more 0.0 0.1 0.0 0.0 0.0 0.1 0.1 0.3 0.0 0.0
Sto 12 Years none 69.3 71.6 63.4 74.2 64.1 71.2 72.0 72.7 71.4 71.5 one 19.8 18.8 22.6 17.3 22.1 19.2 18.5 17.7 17.2 20.4 two 9.6 8.4 12.8 7.6 12.3 8.2 8.0 7.6 9.5 7.4 three 1.1 1.2 1.0 0.9 1.4 1.2 1.3 1.5 1.8 0.7 four or more 0.2 0.2 0.2 0.1 0.0 0.2 0.2 0.5 0.0 0.1
13 to 17 Years none 73.1 76.7 64.0 82.0 75.9 73.3 76.0 78.1 75.4 74.0 one 20.1 17.6 26.3 14.2 18.0 19.8 18.1 16.9 18.2 19.5 two 6.1 5.0 8.8 3.6 5.5 5.8 S.4 4.7 5.8 6.0 three 0.4 0.3 0.7 0.2 0.6 0.4 0.2 0.0 0.4 O.S four or more 0.3 0.3 0.1 0.0 0.0 0.7 0.2 0.3 0.3 0.0
18 Years or Older none 53.8 58.8 42.4 64.1 62.6 53.2 59.8 62.5 65.0 53.4 one 14.6 13.6 17.0 11.7 14.0 15.7 12.6 12.2 10.6 14.3 two 17.8 15.9 22.4 14.8 14.4 17.5 IS.1 14.3 12.5 17.6 three 7.9 7.1 9.8 5.7 5.8 7.8 8.1 6.4 6.0 11.5 four or more 5.8 4.6 8.4 3.7 3.2 5.8 4.4 4.6 5.9 3.2
Two-year Colleges Public Private
68.8 68.4 2.0 1.0
10.3 13.1 2.9 2.0
13.1 11.9 2.9 3.6
0.3 0.0 1.0 1.1 6.3 7.6
13.2 11.3 17.1 19.4 9.7 9.4
36.8 33.3 15.7 17.8
84.9 78.5 10.8 17.6 4.3 3.9 0.0 0.0 0.0 0.0
63.5 61.5 22.5 25.1 12.9 11.7 0.9 1.7 0.2 0.0
63.8 68.1 26.6 21.9
8.7 10.0 0.8 0.0 0.1 0.0
42.2 44.7 17.2 14.7 22.1 27.7 9.9 7.3 8.6 5.7

'" "'"
WEIGHTED NATIONAL NORMS FOR FULL-TIME UNDERGRADUATE FACULTY, 1992-1993
Four-year Colleges FEMALE FACULTY ALL Universities All Non-
Institutions 4-vear 2-vear Public Private Public Private sectarian Catholic Protestant General Activities
held academic a.dm.in position 31.0 32.9 26.7 28.4 35.4 32.9 36.7 34.0 41.8 36.4 award for outstanding teaching 30.8 31.6 29.1 31.8 31.6 32.3 30.3 26.8 33.0 32.6 spouse or partner an academic 33.4 36.3 26.9 40.2 34.3 34.1 36.1 39.3 30.4 36.0 commute a long distance to work 23.2 22.6 24.8 19.8 25.0 24.4 22.2 IS.4 26.3 23.7 research/writing on women 35.5 42.1 20.0 41.2 52.4 38.6 44.2 47.8 39.8 42.9 spouse/partner work in same city 47.6 47.6 47.6 49.1 56.7 44.3 47.1 46.2 44.8 49.7 reslwriting on racelethnicity 24.3 28.4 14.6 26.3 34.3 28.4 28.6 26.8 26.1 32.5 born in the U.S.A 91.9 90.2 95.8 89.7 86.5 90.8 91.1 89.0 91.9 92.9 am a U.S. citizen 96.0 94.9 98.6 94.1 93.4 95.4 95.4 94.3 97.4 95.4 interrupted career for hlthlfam 27.1 24.6 33.2 22.6 25.0 24.6 26.3 23.8 25.2 30.1 sexually harassed at this inst 15.0 16.0 12.8 18.2 16.8 16.3 12.8 13.6 ILl 12.9 plan workin2 bevond a2e 70 30.0 33.6 21.6 34.0 41.9 29.4 36.1 37.3 40.3 31.8
General Activities in tbe Last Two Years
had one or more ftrm job offers 37.0 37.3 36.4 36.8 32.7 39.2 36.9 35.5 37.2 38.4 developed a new course 69.7 72.8 62.5 71.2 80.2 67.5 79.4 79.9 82.5 76.8 considered early retirement 26.8 26.5 27.4 26.8 18.7 30.0 24.1 24.3 23.2 24.4 considered leavin2 academe 37.5 40.0 31.8 43.1 38.6 38.6 39.0 36.S 39.7 41.1
Teaching Activities in tbe Last Two Years
taught honors course 14.1 16.3 8.7 19.3 23.5 11.5 17.0 15.7 17.6 lS.1 taught interdisciplinary course 30.8 33.7 23.4 29.7 40.0 29.5 41.5 46.3 36.4 39.2 taught ethnic studies course 9.1 10.8 4.8 8.3 12.4 10.3 13.6 13.0 12.6 14.9 taught women's studies course 14.0 17.3 5.8 15.0 24.9 14.7 20.6 23.9 13.5 21.5 team-taught a course 41.5 40.8 43.0 41.5 36.5 37.6 46.2 46.7 44.3 47.0 worked w/students on res project 53.9 61.7 34.0 69.8 68.0 56.3 58.0 59.7 54.3 58.5 attd racial/cultural workshop 53.4 49.8 61.7 40.3 47.2 51.4 58.4 52.7 64.3 61.0 attd womenfslminorities workshop 32.3 31.8 33.5 24.2 38.3 30.7 38.8 37.0 41.0 39.6 held fac senate/council office 21.9 22.4 20.6 16.6 19.2 25.3 25.6 24.8 28.3 24.8 used funds for research 32.7 41.6 9.8 49.7 53.1 35.3 37.3 42.4 35.0 32.7 served as a paid consultant 40.1 43.5 31.6 48.5 47.3 43.5 36.4 35.1 40.0 35.5 attd teachin~ enhance workshop 65.3 62.6 71.7 55.3 62.1 65.1 66.9 64.1 67.9 69.4
Research Working Environment work essentially alone 62.6 64.7 57.3 59.8 66.2 63.8 70.6 70.7 66.9 73.1 work with one or two colleagues 27.6 29.5 22.9 35.5 29.8 29.4 22.9 23.8 25.2 20.2 member oflarger I!.tOUp 9.8 5.9 19.8 4.7 4.0 6.8 6.5 5.5 7.9 6.7
Two-year Colleges Public Private
25.8 38.7 28.6 36.3 26.8 28.2 24.7 26.3 20.1 17.6 48.1 41.4 14.7 13.1 95.9 94.9 98.7 97.9 33.3 31.3 13.3 5.8 21.5 24.1
35.5 48.2 62.1 69.3 27.8 21.6 31.3 39.2
8.5 11.0 23.1 28.6 4.9 3.5 5.9 4.5
43.1 42.9 33.9 36.3 62.7 46.1 34.6 15.5 20.7 17.9 9.9 9.0
31.7 31.2 71.8 70.0
56.8 64.6 23.1 19.5 20.1 15.9

...... VI
WEIGHTED NATIONAL NORMS FOR FULL-TIME UNDERGRADUATE FACULTY, 1992-1993
Four-vear con -FEMALE FACULTY ALL Universities All Non-
Institutions 4-vear 2-vear Public Private Public Private sectarian Catholic Protestant HOURS PER WEEK SPENT ON: Scheduled Teaching
none 0.2 0.2 0.1 0.3 0.5 0.1 0.2 0.1 0.5 0.1 1 t04 4.8 5.5 3.0 7.9 4.9 4.4 4.7 5.7 4.4 3.7 5 t08 20.1 25.6 7.1 38.4 47.3 15.0 19.0 24.6 15.7 14.7 9to 12 33.9 41.7 15.2 35.0 35.3 46.7 44.1 40.9 49.8 44.1 13 to 16 22.0 16.7 34.8 9.6 8.0 22.1 19.8 16.3 20.1 23.8 17 to 20 11.8 6.7 24.1 5.9 2.5 7.1 8.5 8.9 6.2 9.5 21 to 34 6.3 3.1 13.8 2.5 1.2 4.0 3.1 2.9 2.6 3.7 35 to 44 0.8 0.4 1.7 0.4 0.1 0.6 0.3 0.1 0.4 0.5 45 or more 0.1 0.2 0.1 0.2 0.0 0.1 0.2 0.4 0.1 0.1
Preparing for Teaching none 0.4 0.3 0.4 0.6 0.5 0.1 0.3 0.3 0.3 0.2 1 t04 5.8 5.5 6.5 6.4 3.4 5.6 5.1 6.5 3.3 4.8 5 t08 20.0 20.3 19.1 20.2 20.7 21.7 18.4 20.4 17.3 16.9 9to 12 24.9 24.5 25.7 27.6 23.0 24.1 22.4 22.4 25.4 20.6 13 to 16 17.5 17.6 17.3 16.9 19.4 16.7 19.0 17.0 21.3 19.8 17 to 20 16.0 16.2 15.5 17.6 16.2 15.6 15.4 13.3 15.9 17.6 21 to 34 11.5 11.5 11.5 9.0 12.7 11.7 13.4 14.1 12.8 13.1 35 to 44 2.8 3.0 2.2 1.4 3.1 3.2 4.4 4.4 2.7 5.6 45 or more 1.2 1.0 1.8 0.4 1.1 1.2 1.4 1.8 1.0 1.3
Advising/Counseling of Students none 2.1 2.2 1.8 3.4 0.6 1.8 2.0 2.3 2.1 1.5 1 t04 51.8 51.0 53.5 57.9 46.6 48.4 49.1 51.7 54.4 42.6 5t08 31.8 32.0 31.4 27.6 39.0 32.8 33.0 32.2 31.2 35.2 9to 12 9.9 10.3 9.2 7.7 11.0 11.1 11.5 10.4 8.0 15.3 13 to 16 2.5 2.6 2.3 1.6 2.0 3.5 2.5 1.9 2.7 3.0 17 to 20 1.2 1.3 1.0 1.4 0.4 1.7 1.0 1.1 1.1 0.9 21 to 34 0.5 0.5 0.6 0.3 0.3 0.6 0.6 0.2 0.2 1.4 35 to 44 0.1 0.1 0.2 0.0 0.0 0.1 0.1 0.1 0.3 0.0 45 or more 0.1 0.1 0.1 0.1 0.0 0.1 0.0 0.0 0.0 0.1
Committee Work and Meetings none 3.5 3.8 2.9 4.7 5.7 3.6 2.5 3.0 2.3 2.1 lt04 69.0 67.4 72.9 65.0 67.6 69.7 66.6 69.7 61.1 66.6 5 t08 21.7 22.5 19.8 22.2 22.0 20.3 26.1 23.0 30.4 26.7 9 to 12 4.3 4.8 3.2 6.3 3.8 4.6 4.1 3.7 5.0 3.9 13 to 16 0.9 1.0 0.7 1.4 0.6 1.3 0.4 0.3 0.7 0.4 17 to 20 0.3 0.3 0.3 0.4 0.2 0.3 0.3 0.2 0.4 0.2 21 to 34 0.1 0.1 0.1 0.1 0.0 0.1 0.1 0.1 0.0 0.2 35 to 44 0.0 0.0 0.0 0.0 0.0 0.0 0.0 0.0 0.0 0.0
~()I"more 0.1 0.0 0.2 0.0 0.0 0.0 0.0 0.0 0.1 0.0
Two-year Coll~es Public Private
0.1 0.5 3.0 3.6 6.9 9.1
14.4 27.0 34.8 35.2 25.0 12.0 14.1 9.9 1.7 2.7 0.1 0.0
0.5 0.0 6.5 6.8
19.0 21.2 26.0 22.0 17.0 21.6 15.3 17.6 11.6 9.2 2.3 0.5 1.9 1.0
1.8 2.11 53.8 48.7 31.0 37.5 9.3 7.7 2.3 2.5 1.0 1.0 0.6 0.5 0.2 0.0 0.1 0.0
3.0 1.0 73.0 71.6 19.5 23.7 3.1 3.2 0.7 0.5 0.3 0.0 0.1 0.0 0.0 0.0 0.2 0.0
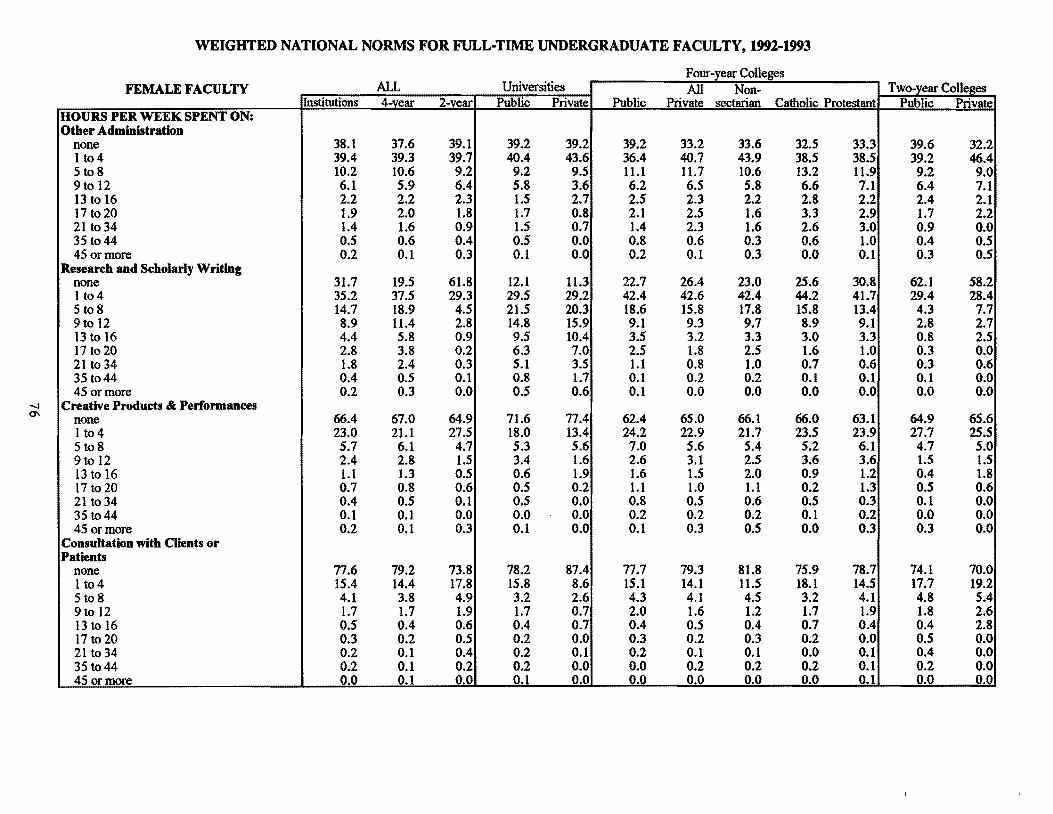
'-I 0\
WEIGHTED NATIONAL NORMS FOR FULL-TIME UNDERGRADUATE FACULTY, 1992-1993
Four-vear CoU - ._ ......... - - -- .. _ .. - _.- ._. g .. - -
FEMALE FACULTY ALL Universities All Non-Institutions 4-vear 2-vear Public Private Public Private sectarian Catholic Protestant
HOURS PER WEEK SPENT ON: Other Administration
none 38.1 37.6 39.1 39.2 39.2 39.2 33.2 33.6 32.5 33.3 lt04 39.4 39.3 39.7 40.4 43.6 36.4 40.7 43.9 38.5 38.5 5 t08 10.2 10.6 9.2 9.2 9.5 11.1 11.7 10.6 13.2 11.9 9 to 12 6.1 5.9 6.4 5.8 3.6 6.2 6.5 5.8 6.6 7.1 13 to 16 2.2 2.2 2.3 1.5 2.7 2.5 2.3 2.2 2.8 2.2 17 to 20 1.9 2.0 1.8 1.7 0.8 2.1 2.5 1.6 3.3 2.9 21 to 34 1.4 1.6 0.9 1.5 0.7 1.4 2.3 1.6 2.6 3.0 35 to 44 0.5 0.6 0.4 0.5 0.0 0.8 0.6 0.3 0.6 1.0 45 or more 0.2 0.1 0.3 0.1 0.0 0.2 0.1 0.3 0.0 0.1
Research and Scholarly Writing none 31.7 19.5 61.8 12.1 11.3 22.7 26.4 23.0 25.6 30.8 1 t04 35.2 37.5 29.3 29.5 29.2 42.4 42.6 42.4 44.2 41.7 5 to 8 14.7 18.9 4.5 21.5 20.3 18.6 15.8 17.8 15.8 13.4 9to 12 8.9 11.4 2.8 14.8 15.9 9.1 9.3 9.7 8.9 9.1 13 to 16 4.4 5.8 0.9 9.5 10.4 3.5 3.2 3.3 3.0 3.3 17 to 20 2.8 3.8 0.2 6.3 7.0 2.5 1.8 2.5 1.6 1.0 21 to 34 1.8 2.4 0.3 5.1 3.5 1.1 0.8 1.0 0.7 0.6 35 to 44 0.4 0.5 0.1 0.8 1.7 0.1 0.2 0.2 0.1 0.1 45 or more 0.2 0.3 0.0 0.5 0.6 0.1 0.0 0.0 0.0 0.0
Creative Products & Performanees none 66.4 67.0 64.9 71.6 77.4 62.4 65.0 66.1 66.0 63.1 I t04 23.0 21.1 27.5 18.0 13.4 24.2 22.9 21.7 23.5 23.9 5 t08 5.7 6.1 4.7 5.3 5.6 7.0 5.6 5.4 5.2 6.1 9 to 12 2.4 2.8 1.5 3.4 1.6 2.6 3.1 2.5 3.6 3.6 13 to 16 1.1 1.3 0.5 0.6 1.9 1.6 1.5 2.0 0.9 1.2 17 to 20 0.7 0.8 0.6 0.5 0.2 1.1 1.0 1.1 0.2 1.3 21 to 34 0.4 0.5 0.1 0.5 0.0 0.8 0.5 0.6 0.5 0.3 35 to 44 0.1 0.1 0.0 0.0 0.0 0.2 0.2 0.2 0.1 0.2 45 or more 0.2 0.1 0.3 0.1 0.0 0.1 0.3 0.5 0.0 0.3
Consultation with Clients or Patients
none 77.6 79.2 73.8 78.2 87.4 77.7 79.3 81.8 75.9 78.7 1 t04 15.4 14.4 17.8 15.8 8.6 15.1 14.1 11.5 18.1 14.5 5to8 4.1 3.8 4.9 3.2 2.6 4.3 4.1 4.5 3.2 4.1 9 to 12 1.7 1.7 1.9 1.7 0.7 2.0 1.6 1.2 1.7 1.9 13to16 0.5 0.4 0.6 0.4 0.7 0.4 0.5 0.4 0.7 0.4 17t020 0.3 0.2 0.5 0.2 0.0 0.3 0.2 0.3 0.2 0.0 21 to 34 0.2 0.1 0.4 0.2 0.1 0.2 0.1 0.1 0.0 0.1 35 to 44 0.2 0.1 0.2 0.2 0.0 0.0 0.2 0.2 0.2 0.1 45 or more 0.0 0.1 0.0 0.1 0.0 0.0 0.0 0.0 0.0 0.1
Two-year Colleges Public Private
39.6 32.2 39.2 46.4 9.2 9.0 6.4 7.1 2.4 2.1 1.7 2.2 0.9 0.0 0.4 0.5 0.3 0.5
62.1 58.2 29.4 28.4 4.3 7.7 2.8 2.7 0.8 2.5 0.3 0.0 0.3 0.6 0.1 0.0 0.0 0.0
64.9 65.6 27.7 25.5 4.7 5.0 1.5 1.5 0.4 1.8 0.5 0.6 0.1 0.0 0.0 0.0 0.3 0.0
74.1 70.0 17.7 19.2 4.8 5.4 1.8 2.6 0.4 2.8 0.5 0.0 0.4 0.0 0.2 0.0 0.0 0.0

......
......
WEIGHTED NATIONAL NORMS FOR FULL-TIME UNDERGRADUATE FACULTY, 1992-1993
Four-vear Coli -- .-
FEMALE FACULTY ALL Universities All Non-Institutions 4-vear 2-vear Public Private Public Private sectarian Catholic Protestant
HOURS PER WEEK SPENT ON: CommunitylPubUc Service
none 27.2 28.3 24.6 32.3 34.9 22.5 29.9 39.4 23.3 23.4 1 t04 59.4 58.2 62.2 54.0 54.9 62.4 58.0 51.6 63.1 61.9 5 t08 9.9 10.2 9.3 10.3 8.0 11.6 8.8 7.4 9.8 9.7 9 to 12 2.5 2.4 2.6 2.4 1.8 2.6 2.4 1.0 2.2 4.1 13 to 16 0.5 0.5 0.6 0.7 0.0 0.6 0.5 0.2 1.1 0.4 17 to 20 0.3 0.2 0.5 0.1 0.0 0.2 0.3 0.3 0.3 0.2 21 to 34 0.1 0.1 0.1 0.0 0.4 0.0 0.1 0.2 0.2 0.0 3S to 44 0.0 0.0 0.1 0.0 0.0 0.0 0.0 0.0 0.0 0.0 4S or more 0.1 0.1 0.1 0.2 0.0 0.1 0.0 0.0 0.0 0.1
Outside Counsulting or Freelance Work
none 65.6 63.6 70.6 61.6 61.7 62.9 67.3 71.7 65.7 63.4 1 t04 26.7 29.2 20.8 31.9 31.0 30.0 24.7 21.4 '25.7 27.8 S t08 4.7 4.5 5.2 3.6 5.6 4.3 5.3 4.8 6.0 5.4 9 to 12 1.7 1.6 1.9 2.2 1.0 1.5 1.4 0.9 1.5 2.0 13 to 16 0.8 0.7 0.9 0.6 0.2 0.7 1.0 0.7 1.0 1.3 17 to 20 0.3 0.2 0.5 0.1 0.3 0.3 0.2 0.4 0.1 0.1 21 to 34 0.1 0.1 0.1 0.0 0.1 0.0 0.1 0.1 0.0 0.1 35 to 44 0.0 0.0 0.1 0.0 0.0 0.1 0.0 0.0 0.0 0.0 45 or more 0.0 0.0 0.0 0.0 0.0 0.0 0.0 0.0 0.0 0.0
HouseholdlChHd Care Duties none 4.8 5.4 3.5 6.7 3.1 5.7 4.4 4.3 4.6 4.4 1 t04 12.8 14.2 9.4 12.4 11.4 15.4 15.4 15.0 18.3 14.0 5 t08 20.1 21.5 16.8 21.5 20.2 21.3 22.3 23.9 20.2 21.9 9to 12 17.9 17.6 18.5 17.3 19.7 17.2 17.6 17.5 17.6 17.7 13 to 16 11.7 11.2 12.9 11.5 10.7 11.5 10.6 8.S 10.8 12.8 171020 11.1 10.0 13.6 10.9 9.9 10.2 8.6 9.0 8.2 8.4 21 to 34 8.9 8.3 10.3 8.0 10.5 7.7 8.6 9.4 6.4 9.0 35 to 44 5.6 5.1 6.7 5.0 6.2 4.8 5.1 4.3 5.1 5.9 4S or more 7.3 6.8 8.3 6.6 8.2 6.3 7.4 7.9 8.9 5.8
Number of Days Spent Oft'-Campus for Professional Activities
none 12.4 11.6 14.3 9.0 13.3 12.8 12.2 14.2 10.5 11.0 1 to 2 17.4 13.7 25.9 10.2 9.5 15.8 16.0 16.2 16.9 15.2 3 t04 29.0 26.9 33.8 22.9 24.3 27.6 31.3 27.5 31.8 35.5 5 to 10 28.8 32.7 19.6 37.3 34.7 30.8 29.7 28.9 28.6 31.S 11 1020 9.3 11.0 5.1 14.9 13.0 10.1 7.4 9.2 7.9 5.0 21 to 50 2.6 3.3 1.1 5.2 4.3 2.0 2.7 3.0 3.8 1.7 50+ 0.5 0.7 0.1 0.5 1.0 0.8 0.6 1.1 O.S 0.1
Two-year Colleges Public Private
24.5 26.4 62.2 62.1 9.4 7.9 2.6 2.6 0.6 0.5 0.5 0.0 0.1 0.5 0.1 0.0 0.1 0.0
70.5 72.3 20.7 22.2 5.3 3.8 2.0 0.5 0.9 0.6 0.6 0.0 0.1 0.5 0.1 0.0 0.0 0.0
3.4 5.6 9.0 15.8
16.6 19.5 18.5 18.5 13.1 9.7 14.1 6.3 10.3 10.0 6.8 5.3 8.2 9.3
14.2 16.2 25.9 27.2 34.0 31.2 19.7 18.0 5.0 7.0 1.2 0.0 0.1 0.5
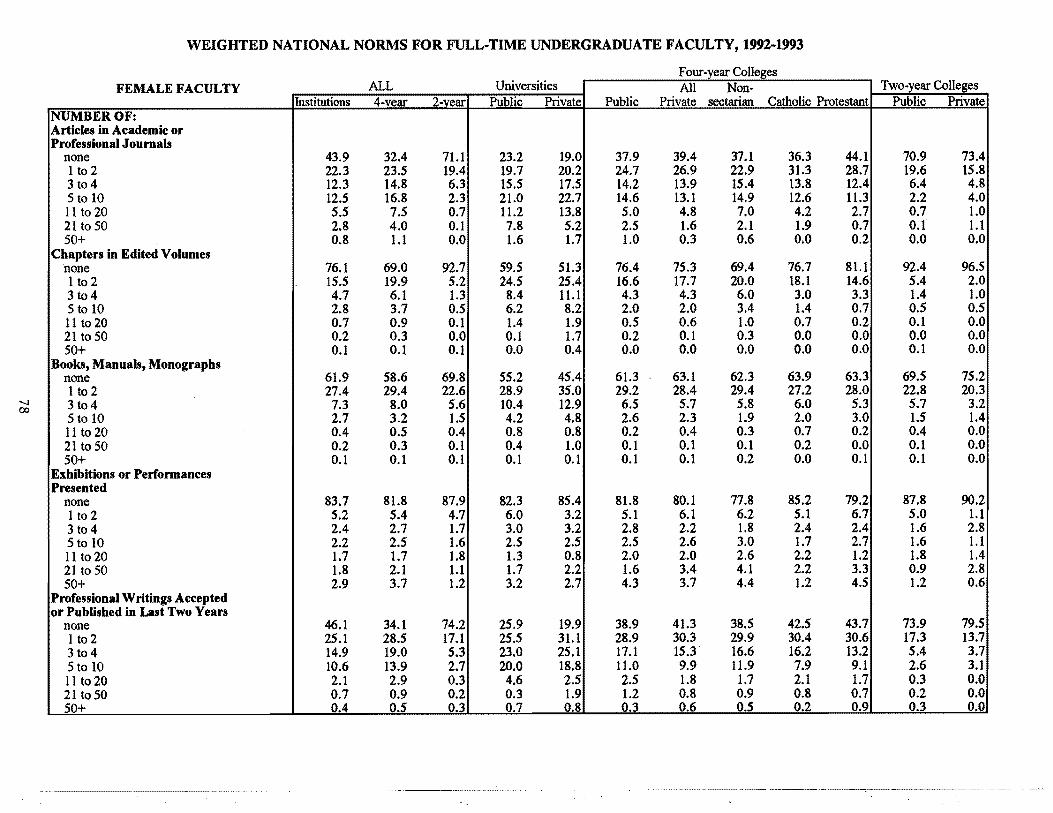
WEIGHTED NATIONAL NORMS FOR FULL-TIME UNDERGRADUATE FACULTY, 1992-1993
Four-year Colleges ALL Universities Two-year Colleges All Non-
Institutions 4-vear 2-vear FEMALE FACULTY
Public Private NUMBER OF: Articles in Academic or Professional Journals
none
Public Private Public Private sectarian Catholic Protestant
70.9 73.4 1 to 2
37.9 39.4 37.1 36.3 44.123.2 19.043.9 32.4 71.1 24.7 26.9 22.9 31.3 28.7 19.6 15.8
3 to 4 22.3 23.5 19.4 19.7 20.2
6.4 4.8 5 to 10
14.2 13.9 15.4 13.8 12.412.3 14.8 6.3 15.5 17.5 2.2 4.0
II to 20 14.6 13.1 14.9 12.6 11.312.5 16.8 2.3 21.0 22.7
0.7 1.0 21 to 50
5.0 4.8 7.0 4.2 2.711.2 13.85.5 7.5 0.7 0.1 1.1
50+ 2.5 1.6 2.1 1.9 0.72.8 4.0 0.1 7.8 5.2 1.0 0.3 0.6 0.0 0.2 0.0 0.0
Chapters in Edited Volumes none
0.8 1.1 0.0 1.6 1.7
92.4 96.5 1 to 2
76.4 75.3 69.4 76.7 81.159.5 51.376.1 69.0 92.7 5.4 2.0
3 t04 16.6 17.7 20.0 18.1 14.615.5 19.9 5.2 24.5 25.4 4.3 4.3 6.0 3.0 3.3 1.4 1.0
5 to 10 4.7 6.1 1.3 8.4 11.1
0.5 0.5 11 to 20
2.0 2.0 3.4 1.4 0.76.2 8.22.8 3.7 0.5 0.1 0.0
21 to 50 0.5 0.6 1.0 0.7 0.20.7 0.9 0.1 1.4 1.9
0.0 0.0 50+
0.2 0.1 0.3 0.0 0.00.2 0.3 0.0 0.1 1.7 0.1 0.0
Books,Manuab,Monographs none
0.0 0.0 0.0 0.0 0.00.0 0.40.1 0.1 0.1
69.5 75.2 1 to 2
61.3 63.1 62.3 63.9 63.361.9 58.6 69.8 55.2 45.4 22.8 20.329.2 28.4 29.4 27.2 28.028.9 35.027.4 29.4 22.6
...... 6.5 5.7 5.8 6.0 5.3 5.7 3.27.3 8.0 5.6 10.4 12.93104co 2.6 2.3 1.9 2.0 3.0 1.5 1.4
11 to 20 2.7 3.2 1.5 4.2 4.85 to 10
0.2 0.4 0.3 0.7 0.2 0.4 0.0 21 to 50
0.8 0.80.4 0.5 0.4 0.1 0.0
50+ 0.1 0.1 0.1 0.2 0.00.2 0.3 0.1 0.4 1.0
0.1 0.0 Exhibitions or Performances Presented
none
0.1 0.1 0.2 0.0 0.10.1 0.1 0.1 0.1 0.1
87.8 90.2 1 to 2
81.8 80.1 77.8 85.2 79.282.3 85.483.7 81.8 87.9 5.0 1.1
3 to 4 5.1 6.1 6.2 5.1 6.76.0 3.25.2 5.4 4.7
1.6 2.8 5 to 10
2.8 2.2 1.8 2.4 2.43.0 3.22.4 2.7 1.7 1.6 1.1
11 to 20 2.5 2.6 3.0 1.7 2.72.2 2.5 1.6 2.5 2.5
1.8 1.4 21 to 50
2.0 2.0 2.6 2.2 1.21.3 0.81.7 1.7 1.8 0.9 2.8
50+ 1.6 3.4 4.1 2.2 3.31.7 2.21.8 2.1 1.1 4.3 3.7 4.4 1.2 4.5 1.2 0.6
Professional Writings Accepted or Published in Last Two Years
none
3.2 2.72.9 3.7 1.2
38.9 41.3 38.5 42.5 43.7 73.9 79.5 1 to 2
25.9 19.946.1 34.1 74.2 17.3 13.7
3 t04 28.9 30.3 29.9 30.4 30.625.1 28.5 17.1 25.5 31.1
5.4 3.7 5 to 10
17.1 15.3 16.6 16.2 13.223.0 25.114.9 19.0 5.3 2.6 3.1
11 to 20 11.0 9.9 11.9 7.9 9.120.0 18.810.6 13.9 2.7
0.3 0.0 21 to 50
2.5 1.8 1.7 2.1 1.74.6 2.52.1 2.9 0.3 1.2 0.8 0.9 0.8 0.7 0.2 0.0
50+ 0.3 1.90.7 0.9 0.2
0.3 0.00.3 0.6 O.S 0.2 0.90.7 0.80.4 0.5 0.3
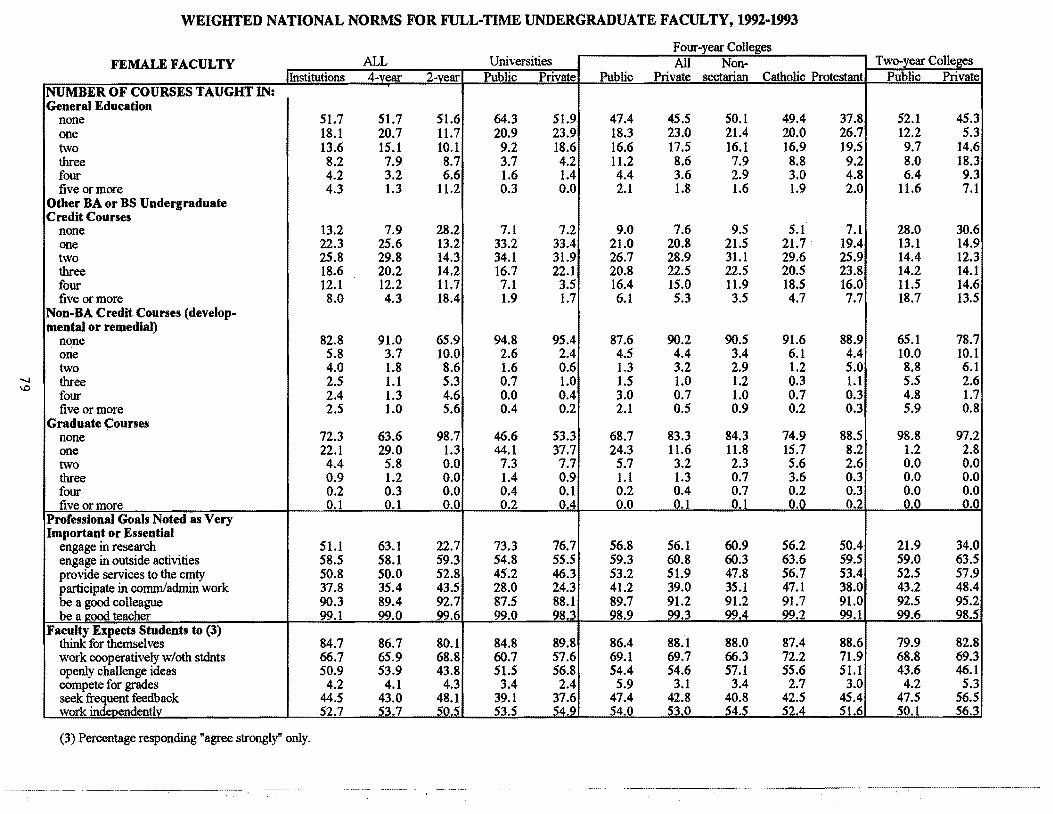
WEIGHTED NATIONAL NORMS FOR FULL-TIME UNDERGRADUATE FACULTY, 1992-1993
Four-vear con ALL Universities
~
Two-year Colleges All Non-ITnstitutions 4-vear 2-vear
FEMALE FACULTY Public Private sectarian Catholic Protestant Public Private
NUMBER OF COURSES TAUGHT IN: General Education
none
Public Private
52.1 45.3 one
64.3 51.9 47.4 45.5 50.1 49.4 37.851.7 51.7 51.6 12.2 5.3
two 18.3 23.0 21.4 20.0 26.720.9 23.918.1 20.7 11.7 16.6 17.5 16.1 16.9 19.5 9.7 14.6
three 9.2 18.613.6 15.1 10.1
11.2 8.6 7.9 8.8 9.2 8.0 18.3 four
3.7 4.28.2 7.9 8.7 4.4 3.6 2.9 3.0 4.8 6.4 9.3
five or more 4.2 3.2 6.6 1.6 1.4
11.6 7.1 Other BA or BS Undergraduate Credit Courses
none
2.1 1.8 1.6 1.9 2.04.3 1.3 11.2 0.3 0.0
9.0 7.6 9.5 5.1 7.17.1 7.213.2 7.9 28.2 28.0 30.61 one 21.0 20.8 21.5 21.7· 19.4 13.1 14.9 two
22.3 25.6 13.2 33.2 33.4 26.7 28.9 31.1 29.6 25.9 14.4 12.325.8 29.8 14.3 34.1 31.9
16.7 22.1 20.8 22.5 22.5 20.5 23.8 14.2 14.1 four
18.6 20.2 14.2three 11.5 14.6
five or more 7.1 3.5 16.4 15.0 11.9 18.5 16.012.1 12.2 11.7
18.7 13.5 Non-BA Credit Courses (developmental or remedial)
none
8.0 4.3 18.4 1.9 1.7 6.1 5.3 3.5 4.7 7.7
65.1 78.7 one
94.8 95.4 87.6 90.2 90.5 91.6 88.982.8 91.0 65.9 2.6 2.4 4.5 4.4 3.4 6.1 4.4 10.0 10.1
two 5.8 3.7 10.0
8.8 6.11.3 3.2 2.9 1.2 5.04.0 1.8 8.6 1.6 0.6 '-.J 1.5 1.0 1.2 0.3 1.1 5.5 2.60.7 1.02.5 1.1 5.3three\0
4.8 1.7 five or more
3.0 0.7 1.0 0.7 0.32.4 1.3 4.6 0.0 0.4four 2.1 0.5 0.9 0.2 0.3 5.9 0.8
Graduate Courses none
0.4 0.22.5 1.0 5.6
98.8 97.2 one
68.7 83.3 84.3 74.9 88.572.3 63.6 98.7 46.6 53.3 24.3 11.6 11.8 15.7 8.2 1.2 2.8
two 22.1 29.0 1.3 44.1 37.7
5.7 3.2 2.3 5.6 2.6 0.0 0.0 three
7.3 7.74.4 5.8 0.0 1.1 1.3 0.7 3.6 0.3 0.0 0.0
four· 0.9 1.2 0.0 1.4 0.9
0.0 0.0 five or more
0.2 0.4 0.7 0.2 0.30.2 0.3 0.0 0.4 0.1 0.0 0.1 0.1 0.0 0.2 0.0 0.0
Professional Goals Noted as Very Important or Essential
engage in research
0.2 0.40.1 0.1 0.0
21.9 34.0 engage in outside activities
56.8 56.1 60.9 56.2 50.473.3 76.751.1 63.1 22.7 59.0 63.5
provide services to the cmty 59.3 60.8 60.3 63.6 59.554.8 55.558.5 58.1 59.3
52.5 57.9 participate in cornmladmin work
53.2 51.9 47.8 56.7 53.450.8 50.0 52.8 45.2 46.3 41.2 39.0 35.1 47.1 38.0 43.2 48.4
be a good colleague 28.0 24.337.8 35.4 43.5
92.5 95.2 be a ~ood teacher
89.7 91.2 91.2 91.7 91.090.3 89.4 92.7 87.5 88.1 99.6 98.5
Faculty Expects Students to (3) think for themselves
98.9 99.3 99.4 99.2 99.199.0 98.399.1 99.0 99.6
86.4 88.1 88.0 87.4 88.6 79.9 82.8 work cooperatively wloth stoots
84.8 89.884.7 86.7 80.1 69.1 69.7 66.3 72.2 71.9 68.8 69.3
openly challenge ideas 66.7 65.9 68.8 60.7 57.6
54.4 54.6 57.1 55.6 51.1 43.6 46.1 compete for grades
50.9 53.9 43.8 51.5 56.8 5.9 3.1 3.4 2.7 3.0 4.2 5.3
seek frequent feedback 3.4 2.44.2 4.1 4.3
47.4 42.8 40.8 42.5 45.4 47.5 56.5 work indeoendentlv
39.1 37.644.5 43.0 48.1 50.1 56.353.5 54.9 54.0 53.0 54.5 52.4 51.652.7 53.7 50.5
(3) Percentage responding "agree strongly" only.

00 o
WEIGHTED NATIONAL NORMS FOR FULL-TIME UNDERGRADUATE FACULTY, 1992-1993
Four-year Colleges FEMALE FACULTY ALL Universities All Non-
Institutions 4-vear 2-vear Public Private Public Private sectarian Catholic Protestant Evaluation Methods Used in Most or AU Undergraduate Courses
multiple-choice mid-terms/finals 41.8 36.8 53.5 41.1 18.6 41.0 32.5 26.3 36.1 37.5 essay mid-termslfmals 41.1 46.5 28.4 43.0 62.0 42.8 50.0 45.1 52.7 54.0 short-answer mid-terms/finals 35.0 36.6 31.1 38.2 39.3 35.6 35.6 31.9 36.5 39.4 quizzes 42.0 38.3 50.6 37.3 34.3 39.6 38.9 34.8 38.9 43.8 weekly essay assignments 22.7 21.5 25.6 17.9 25.0 21.4 24.0 23.3 22.0 26.1 student presentations 39.5 43.8 29.2 42.1 49.6 39.9 49.1 47.7 47.8 51.6 tennlresearch papers 34.3 38.7 24.1 39.9 49.4 33.5 41.1 40.8 42.7 40.4 stdnt evals of each others' work 18.2 19.8 14.4 20.3 19.6 19.3 20.1 19.5 19.0 21.6 grading on a curve 10.6 12.5 6.2 15.7 19.6 9.5 10.6 11.7 10.8 9.3 comnetencv-based fi!J"adinli!' 58.5 58.1 59.5 59.5 64.0 56.7 56.5 55.5 57.5 57.0
Instruction Methods Used in Most or AU Undergraduate Courses
class discussions 77.2 78.8 73.4 76.8 83.7 76.8 82.1 82.5 79.0 83.7 computer/machine-aided instruct 19.9 15.7 29.8 13.7 12.5 17.0 17.0 15.7 13.3 21.0 cooperativeleanring 48.5 49.3 46.4 45.3 49.2 49.2 53.9 52.2 55.1 55.0 experientialleanringlfield stud 27.4 28.8 24.2 27.6 28.5 28.5 30.8 26.9 33.6 33.3 teaching assistants 5.7 6.9 2.9 11.3 13.2 3.5 4.6 6.7 3.3 3.0 recitals or demonstrations 23.3 22.9 24.1 21.8 17.0 24.7 23.7 23.7 21.9 24.9 group projects 27.2 29.9 20.9 28.2 32.4 29.4 31.7 31.2 31.2 32.6 independent projects 43.5 47.2 34.7 50.1 53.2 43.4 47.5 46.3 46.4 49.8 extensive lecturing 41.0 39.7 44.0 47.4 40.6 37.6 34.1 32.4 35.7 35.1 mUltiple drafts of written work 20.1 21.5 16.6 18.0 29.2 21.1 23.1 23.6 18.8 25.4 readings on racial/ethnic issues 24.3 26.6 18.6 25.3 34.9 23.6 29.4 27.3 23.3 36.0 readings on women/gender issues 23.5 26.4 16.7 25.8 39.2 21.5 29.6 29.5 22.9 34.4 student-developed activities 20.2 21.3 17.7 19.4 21.4 22.8 21.1 20.7 19.9 22.4 student-selected tonics 13.9 15.3 10.4 15.2 14.9 16.1 14.6 13.8 16.1 14.4
Goals for Undergraduates Noted as Very Important or Essential
develop ability to think clearly 99.7 99.7 99.7 99.9 99.6 99.6 99.6 99.6 99.8 99.6 increase self -directed leanring 95.0 95.4 94.0 94.8 92.8 95.7 96.6 96.5 97.5 96.2 prepare for employment 76.0 72.2 84.8 72.6 55.0 77.8 70.1 62.8 76.3 74.5 prepare for graduate education 56.3 59.3 49.4 56.7 56.6 59.6 62.5 55.9 64.0 69.3 develop moral character 63.0 60.5 68.7 51.2 62.7 62.0 67.6 62.9 71.9 70.1 provide for emotional developmnt 49.4 46.6 56.1 38.2 44.8 48.4 53.4 48.1 53.4 59.7 prepare for family living 24.0 22.0 28.8 16.1 17.4 24.4 26.4 21.9 27.0 31.3 teach classics of western civ 25.6 28.9 17.7 24.1 36.6 28.6 31.8 30.2 33.6 32.5 help develop personal values 67.7 65.9 71.9 55.3 68.4 67.2 74.4 70.0 76.2 78.5 enhance out-of-class experience 49.1 48.1 51.4 43.5 41.0 50.6 51.9 45.9 51.8 59.0 enhance self-understandinli!' 75.5 74.3 78.5 68.0 71.1 76.4 78.9 76.6 78.2 82.3
Two-year Colleges Public Private
53.1 58.6 28.1 32.0 31.3 28.5 50.6 50.9 25.8 22.5 28.3 42.1 23.8 27.2 14.3 14.7 6.4 4.1
59.9 53.6
73.4 72.7 30.1 24.6 46.8 41.4 24.1 26.1 2.8 3.1
24.0 24.6 20.6 25.2 34.2 41.0 43.7 48.9 16.3 20.3 19.0 13.8 17.0 12.6 17.3 22.8 10.4 10.6
99.8 99.5 94.1 93.1 84.6 87.0 49.2 52.1 67.8 82.4 55.2 69.3 28.3 37.2 17.3 24.7 70.9 86.2 50.6 62.5 78.1 84.4

CX) .....
WEIGHTED NATIONAL NORMS FOR FULL-TIME UNDERGRADUATE FACULTY, 1992-1993
FEMALE FACULTY ALL Universities All Non-Institutions 4-vear 2-vear Public Private Public Private sectarian Catholic Protestant
Politieal Orientation far left 4.4 5.7 1.2 5.4 8.2 4.6 6.8 9.5 3.9 5.7 liberal 46.1 49.9 37.1 53.2 56.8 45.8 49.6 50.8 50.3 47.9 middle-of-the-road 32.8 30.1 39.3 28.7 25.8 33.4 28.3 26.5 35.7 25.4 conservative 16.5 14.1 22.1 12.4 9.0 16.0 15.0 13.2 10.1 20.6 farrimt 0.2 0.2 0.3 0.3 0.2 0.2 0.2 0.1 0.1 0.4
Agrees Strongly or Somewbat abolish death penalty 45.8 49.4 37.4 48.1 59.9 44.8 53.6 54.S 57.1 50.1 national health care plan needed 85.4 87.1 81.4 86.2 91.9 86.3 87.6 89.1 89.1 84.8 abortion should be legal 81.5 84.0 75.7 87.5 88.1 84.1 78.7 81.9 73.7 78.2 prohibit racist/sexist speech 65.8 64.4 69.2 62.4 62.5 65.2 66.1 62.8 68.0 68.6 West Civ foundation ofUG cumc 45.1 45.2 45.0 43.0 49.9 45.5 45.2 41.6 53.2 44.1 college can ban extreme speakers 24.2 22.1 29.2 15.0 20.8 22.0 30.1 24.3 31.4 36.1 college increases earning power 22.9 18.8 32.7 16.8 12.7 24.6 14.9 14.0 15.8 IS.5 diversity yields undprep stdnts 21.9 19.7 27.2 19.6 15.2 22.4 17.5 19.0 17.9 15.4 coli should helD solve soc Drobs 70.0 73.1 62.7 72.5 75.4 71.3 75.3 71.9 74.8 79.8
Agrees Strongly or Somewbat fac interested in students' prob 81.6 78.4 88.9 66.4 80.3 79.1 89.5 84.8 92.6 93.0 fac sensitive to minority issues 71.3 68.7 77.3 64.8 64.9 68.4 74.6 72.1 73.4 78.4 people don't respect each other 33.4 34.7 30.4 38.8 28.4 35.8 31.0 34.7 26.4 29.6 students well prep academically 26.2 29.9 17.3 26.4 47.6 25.9 33.1 34.7 30.4 33.1 Stdnt Aff staff supported by fac 63.6 62.9 65.0 62.6 64.1 60.9 65.7 63.6 69.8 65.3 fac committed to welfare of inst 83.8 81.9 88.1 75.3 85.0 80.6 89.8 88.1 91.1 90.9 courses incl minority perspect 43.7 43.1 45.0 38.3 41.0 43.9 47.7 47.7 43.5 50.4 low trust btwn minoritiesladmin 36.9 41.3 26.7 49.9 47.3 37.9 35.1 41.7 28.1 32.3 fac interest in stdnts acad prob 82.4 79.3 89.8 66.9 84.7 78.8 91.1 90.0 91.0 92.4 a lot of racial conflict here 16.0 19.0 9.1 27.3 16.1 17.2 13.9 18.4 8.9 11.9 courses incl feminist perspect 29.1 30.9 24.9 29.6 34.3 26.7 37.1 40.1 35.8 34.4 faculty of color treated fairly 81.9 79.0 88.6 77.6 75.2 80.2 80.2 78.2 84.5 79.6 women faculty treated fairly 68.1 65.0 75.5 58.9 61.5 64.7 73.2 75.5 77.3 67.9 administrators act in good faith 65.1 64.3 67.0 59.1 61.9 63.7 71.4 69.8 72.9 72.2 unionization enhances teaching 35.8 31.6 45.1 30.6 28.8 34.0 30.1 31.1 28.3 30.2 tenure is an outmoded conceot 48.5 49.0 47.3 53.0 49.4 48.4 45.3 45.9 49.3 41.8
Issues Noted as Being ofHigb or Higbest Priority
promote intellectual development 80.6 79.8 82.6 73.8 82.7 79.4 85.7 87.1 85.2 84.4 help students understand values 55.3 54.9 56.0 36.1 69.7 51.4 74.5 69.3 81.0 76.1 hire more minority faculty/admin 48.4 48.7 47.5 47.3 42.9 54.4 44.2 48.6 36.3 44.5 devel community among stdntslfac 52.5 50.9 56.2 34.1 52.5 51.6 67.0 61.8 68.8 72.0 deY leadership ability in stdnts 48.4 48.5 48.3 36.2 51.4 49.0 59.8 58.1 59.0 62.3 hire more women faculty/admin 38.1 39.4 35.0 38.5 38.0 41.9 37.4 40.8 33.2 36.2 involvement in community svcs 36.4 37.6 33.7 21.9 60.9 33.8 51.2 42.9 57.1 56.9 teach students how to change soc 32.8 33.2 31.9 23.6 41.9 34.1 38.8 37.4 40.5 39.2 increase/maintain inst prestige 70.6 72.1 67.2 73.2 81.3 68.8 72.2 76.0 70.2 69.1 hire faculty 'stars' 21.5 24.9 13.5 36.0 35.0 20.0 16.5 18.5 14.0 16.0 recruit more minority students 53.0 55.5 47.1 S2.9 53.7 57.6 55.9 60.5 53.7 52.1 enhance inst's national image 55.7 63.0 38.8 69.6 81.7 54.2 61.7 69.4 53.7 58.2 create multi-cultural environ 54.5 54.9 53.8 48.2 57.6 57.3 57.5 61.1 57.9 530
Two-year Colleges Public Private
1.3 0.0 37.8 26.8 39.1 42.9 21.6 29.8 0.3 0.5
37.7 32.3 82.0 72.9 76.1 68.6 69.2 68.8 44.2 57.1 28.3 41.5 33.1 27.0 27.2 27.4 62.5 66.4
88.4 97.0 76.9 83.1 30.8 23.8 16.9 23.6 65.0 64.8 ' 87.7 92.8 45.2 42.6 26.9 22.7' 89.4 95.4 9.3 5.8
25.0 22.9i 88.7 88.1 75.2 79.6 66.1 79.5 46.5 24.~ 46.9 52.6
82.3 87.61
54.9 73.5 48.9 27.1 55.5 66.41 47.2 63.8 36.0 20.7 32.9 45.4i 31.4 38.9 66.5 77.7 13.0 21.1 47.7 38~ 38.0 50.4 54.5 ~.O

(Xl N
WEIGHTED NATIONAL NORMS FOR FULL-TIME UNDERGRADUATE FACULTY, 1992-1993
Four-year Colleges FEMALE FACULTY ALL Universities All Non-
Institutions 4-vear 2-vear Public Private Public Private sectarian Catholic Protestant Pereentage Noting Attributes as: Very Descriptive of Institution
easy to see fac outside ofc hour 37.0 37.9 34.9 26.4 43.2 32.7 55.4 54.9 56.8 55.1 great conformity among students 23.7 29.1 11.0 27.1 38.3 25.4 33.1 29.9 32.0 37.6 most students are very bright 9.0 11.5 3.2 9.0 26.3 7.8 14.1 21.8 7.3 9.5 faculty at odds with admin 16.2 16.4 15.6 15.0 14.6 17.9 16.4 17.7 19.0 13.2 faculty respect each other 34.4 30.8 42.9 24.1 36.1 27.5 40.7 38.2 43.2 42.0 most stoots treated like numbers 3.6 4.3 1.8 8.8 2.1 3.4 1.5 2.1 1.6 0.8 social activities overemphasized 7.7 10.1 2.1 13.1 13.7 7.4 9.6 9.4 5.8 12.4 little studentlfaculty contact 2.3 2.5 1.8 4.1 1.2 2.2 1.6 1.8 1.6 1.3 inst committed to minorities 32.5 29.1 40.3 20.5 27.6 32.0 34.7 33.3 34.5 36.6 intercoII sports overemphasized 15.3 19.1 6.5 36.9 15.4 14.2 8.7 7.3 8.3 10.8 stoots don't socialize regularly 2.9 2.2 4.6 1.5 0.9 3.6 1.4 1.1 1.4 1.8 fac rewarded for good teaching 9.9 10.8 8.0 5.1 17.1 8.4 17.8 17.4 17.4 18.6
Not Descriptive of Institution easy to see fac outside ofe hour 9.8 10.1 9.2 14.9 9.4 10.8 4.3 6.0 4.4 2.3 great conformity among stUdents 22.0 17.3 33.0 16.1 15.2 17.9 18.7 23.7 16.3 14.3 most students are very bright 41.8 36.1 55.0 37.6 21.1 42.0 31.6 26.5 40.8 31.3 faculty at odds with admin 35.0 34.0 37.3 32.1 34.7 33.7 36.1 31.8 38.1 40.0 faculty respect each other 6.8 7.9 4.4 10.5 6.8 8.0 5.4 6.6 3.6 5.2 most stoots treated like numbers 78.9 76.3 84.8 57.1 83.8 78.3 91.0 88.6 91.3 93.8 social activities overemphasized 70.2 62.6 87.9 55.6 50.9 70.6 62.6 63.7 73.3 53.9 little studentlfaeulty contact 77.9 75.9 82.6 62.8 81.5 76.0 87.9 87.3 86.0 90.0 inst committed to minorities 12.1 13.5 8.7 15.7 14.1 11.6 13.9 14.3 13.0 14.0 intercoll sports overemphasized 60.9 53.0 79.4 29.2 52.7 60.4 67.5 72.5 66.5 62.2 stoots don't socialize regularly 67.1 75.5 47.7 79.5 84.4 67.1 79.9 77.1 73.1 88.0 fac rewarded for 200d teachinfl 41.9 40.5 45.0 48.1 27.4 46.0 29.3 28.6 30.0 29.7
Aspects of Job Noted as Very Satisfactory or Satisfactory (4)
salary and fHnge benefits 40.1 35.8 50.3 29.9 44.0 34.1 41.6 47.4 42.2 34.3 oppty for scholarly pursuits 39.0 37.9 41.7 43.2 40.2 34.3 36.8 38.3 36.7 35.1 teaching load 49.4 49.0 50.3 55.9 48.7 46.2 45.6 49.5 45.6 41.2 quality of students 4S.s 48.4 38.5 45.s 61.3 44.5 52.6 57.8 47.0 50.4 working conditions 64.5 64.4 64.7 63.5 68.2 63.8 64.9 67.5 65.8 61.1 autonomy and independence 82.2 82.5 81.5 83.2 84.0 80.9 83.4 84.3 82.3 83.2 prof relations w/other faculty 73.8 71.5 79.1 64.0 69.6 74.4 76.1 75.1 76.6 77.0 social relations w/other faculty 64.3 61.5 70.9 54.5 63.7 65.0 63.4 63.9 65.6 61.2 competency of colleagues 69.7 67.7 74.4 62.1 67.8 68.0 73.3 72.9 73.8 73.3 visibility for jobs 38.0 37.6 39.2 39.5 41.8 35.2 37.2 39.6 33.6 36.7 job security 63.7 59.1 74.6 56.3 54.8 61.8 60.0 61.1 64.4 55.5 undergraduate course assignments 77.1 76.2 79.6 73.7 74.0 76.8 78.9 80.0 77.2 78.8 graduate course assignments 66.8 68.1 48.1 68.5 69.2 67.8 66.5 66.4 66.0 67.2 relationships with admin 55.8 56.2 54.7 54.0 53.5 57.2 58.1 56.8 58.5 59.3 overall iob satisfaction 71.5 68.2 79.4 64.2 68.7 69.0 71.1 71.1 70.8 71.3
(4) Respondents marking "not applicable" are not included in tabulations.
Two-year Colleges Public Private
33.5 54.7 9.9 27.4 3.1 4.6
16.2 6.6 41.6 62.4
1.9 0.5 1.9 5.3 1.9 1.0
39.9 45.6 6.3 10.4 4.9 0.6 7.8 11.4
9.3 8.1 34.4 12.9 55.7 45.4 36.4 50.0 4.5 2.1
84.0 95.8 88.7 75.8 82.0 91.3 8.4 13.3
79.5 78.6 46.5 64.8 45.6 36.2
50.7 44.3 42.1 37.1 50.5 47.4 38.9 32.8 64.5 67.0 81.4 82.4 79.1 80.5 70.5 77.7 74.2 76.9 38.9 43.5 74.9 69.4 79.6 79.3 45.2 67.7 54.2 62.6 79.4 7S~

00 w
WEIGHTED NATIONAL NORMS FOR FULL-TIME UNDERGRADUATE FACULTY, 1992-1993
Four-vear Coll ~
FEMALE FACULTY ALL Universities All Non-Institutions 4-vear 2-vear Public Private Public Private sectarian Catholic Protestant
Penonal Goals Noted as Very Important or Essential
become authority in own field 61.0 61.6 59.8 66.8 63.3 60.6 56.7 58.4 54.9 55.9 influence political structure 22.4 24.2 18.2 22.3 26.0 24.7 25.1 26.3 26.5 22.8 influence social values 54.7 54.6 54.8 48.5 58.9 54.5 60.0 59.8 59.4 60.4 raise a family 65.8 62.2 74.4 60.0 65.6 63.0 61.9 60.4 56.8 67.2 be very well-off financially 33.0 30.1 39.8 30.3 25.5 33.7 26.5 27.1 23.5 27.7 help others in difficulty 75.1 74.1 77.6 69.4 72.2 75.5 77.6 75.2 77.2 80.7 be involved in environ clean-up 46.5 46.2 47.3 44.4 36.9 48.8 47.5 45.1 49.4 49.0 develop philosophy oflife 83.4 83.7 82.7 79.4 82.9 85.4 86.0 83.4 87.4 88.1 promote racial understanding 70.1 72.1 65.4 65.8 74.2 73.2 76.4 74.7 77.3 77.9 obtain recoil from colleallUes 47.6 50.2 41.5 54.6 61.0 48.6 43.8 48.1 44.1 38.6
Amount of Stress Experienced in the Last Two Yean
extreme 46.1 48.2 41.0 48.8 54.8 45.2 49.7 51.7 45.4 50.2 moderate 48.2 46.4 52.3 46.0 41.2 48.5 45.8 43.7 51.3 44.4 little 5.7 5.3 6.7 5.2 4.0 6.3 4.6 4.6 3.4 5.4
Sourees of Stress (5) household responsibilities 76.2 74.0 81.2 74.0 78.3 72.8 74.3 75.5 72.3 74.2 child care 35.2 33.7 38.7 30.8 42.3 32.9 35.0 35.6 33.4 35.4 care of elderly parent 29.4 28.0 32.9 27.3 29.3 27.1 29.4 27.5 31.8 30.0 my physical health 46.1 46.1 46.3 45.9 47.4 46.8 44.6 45.5 44.4 43.8 review/promotion process 50.6 53.8 43.2 57.5 60.0 52.2 49.7 51.8 45.4 50.3 subtle discrimination 39.2 43.7 28.8 46.4 49.9 43.0 . 39.4 39.5 34.7 42.5 personal finances 63.2 63.8 61.9 65.0 63.0 64.0 62.4 61.5 58.3 66.2 committee work 59.6 59.1 60.8 59.6 57.6 57.7 61.1 59.4 66.5 59.5 faculty meetings 51.4 50.7 53.0 50.1 51.8 50.6 51.1 50.6 57.7 47.0 colleagues 60.9 62.0 58.1 65.3 60.6 61.1 60.5 59.4 59.9 62.4 students 64.0 61.5 69.9 62.1 60.8 60.8 62.1 63.0 60.4 62.3 research or publishing demands 48.8 64.0 12.7 75.6 77.2 59.2 53.6 58.1 52.3 49.2 inst procedures & 'red tape' 67.5 68.2 65.7 71.0 66.7 70.1 63.2 61.1 66.7 63.3 teaching load 75.4 74.3 78.2 71.5 75.5 74.0 77.2 75.7 77.1 79.1 children's problems 34.5 31.0 42.7 28.6 35.6 32.1 30.4 30.9 29.7 30.1 marital friction 23.5 22.7 25.5 21.9 27.8 22.2 22.4 24.6 20.2 21.3 time pressures 92.4 92.0 93.1 93.2 95.0 89.1 94.0 94.4 93.2 94.1 lack of~ersonallife 90.8 90.6 91.4 89.8 93.2 88.6 93.1 92.4 93.0 93.9
Still Want to Be CoUege Professor?
definitely yes 46.1 45.4 47.7 39.7 48.8 46.2 49.1 47.9 49.2 50.5 probably yes 34.8 34.0 36.6 35.4 31.2 34.3 33.1 32.1 32.9 34.5 not sure 12.4 12.9 11.2 14.8 13.2 12.1 12.0 13.3 13.4 9.6 probably no 5.7 6.5 3.8 8.8 5.9 6.0 5.1 5.8 4.0 5.1
~dini.telv no 1.0 1.1 0.7 1.4 0.9 1.3 0.6 0.9 0.6 0.3
(5) Includes those marking "somewhat" or "extensive."
Two-year Colleges Public Private
59.8 59.6 18.4 15.6 54.4 61.6 74.5 74.0 40.0 36.6 77.1 86.1 46.5 58.4 82.0 91.9 64.8 74.0 41.1 48.1
41.1 38.6 52.1 56.5
6.8 4.9
81.3 78.6 38.9 36.8 32.8 35.1 46.6 41.9 43.0 46.1 29.5 18.1 61.4 69.2 60.2 68.7 53.1 52.5 58.2 56.5 70.0 68.3
1
12.6 14.7 65.6 67.5 77.7 84.8 43.4 31.9 25.8 20.6 93.1 94'~1 91.3 92.4
47.9 44.6 1
36.7 34.9 10.9 15.2 3.8 4.2 0.7 1.0

()) ~
WEIGHTED NATIONAL NORMS FOR FULL-TIME UNDERGRADUATE FACULTY, 1992-1993
Four-vear CoIl ~
FEMALE FACULTY ALL Universities All Non-Institutions 4-vear 2-vear Public Private Public Private sectarian Catholic Protestant
Field of Highest Degree Held
agriculture 0.5 0.6 0.2 1.7 0.0 0.3 0.1 0.1 0.0 0.2 architecture/urban planning 0.3 0.3 0.2 0.7 0.0 0.2 0.0 0.1 0.0 0.0 bacteriology. molecular biology 1.0 0.9 1.2 0.8 0.6 1.0 0.8 0.6 1.6 0.5 biochemistry 0.5 0.5 0.5 0.3 1.1 0.2 0.7 0.7 0.5 0.9 biophysics 0.0 0.1 0.0 0.0 0.0 0.0 0.2 0.4 0.2 0.0 botany 0.5 0.5 0.3 0.6 0.1 0.3 0.8 0.8 0.4 1.3 marine life sciences 0.1 0.1 0.1 0.2 0.1 0.0 0.2 0.3 0.4 0.0 physiology, anatomy 0.5 0.6 0.3 0.9 0.6 0.3 0.7 0.9 0.6 0.5 zoology 0.6 0.8 0.3 1.2 0.2 0.5 0.9 0.8 0.3 1.3 general, oth biological science 1.2 1.0 1.5 1.3 0.7 1.0 0.9 1.1 1.1 0.5 accoWlting 1.6 1.7 1.2 1.5 2.4 1.8 1.6 1.5 1.0 2.2 fmance 0.4 0.4 0.4 0.3 0.8 0.3 0.4 0.3 0.9 0.2 marketing 0.5 0.6 0.4 0.6 0.7 0.6 0.6 0.6 1.0 0.2 management 1.7 1.5 2.4 1.3 2.2 1.3 1.6 1.7 3.0 0.6 secretarial studies 0.2 0.0 0.8 0.0 0.0 0.0 0.0 0.0 0.0 0.1 general, other business 1.1 0.7 2.0 0.8 0.6 0.8 0.7 0.9 0.9 0.4 computer science 1.0 0.9 1.2 0.3 0.7 1.0 1.3 1.4 1.2 1.3 business education 2.1 1.1 4.5 0.8 0.0 2.1 0.6 0.3 0.2 1.1 elementary education 2.3 2.5 2.0 1.8 1.3 3.2 2.7 1.7 2.2 4.1 educational administration 1.6 1.5 1.6 0.7 0.3 2.3 1.7 1.0 2.4 2.1 educational psych, COWlSeling 1.6 1.5 1.7 1.3 1.0 2.0 1.2 1.4 1.2 1.0 higher education 2.2 2.1 2.6 2.3 0.9 2.5 1.5 0.8 3.3 1.2 music or art education 0.4 0.4 0.4 0.2 0.1 0.7 0.4 0.3 0.4 0.4 physical or health education 3.4 3.8 2.5 4.5 1.2 4.6 2.9 2.5 2.1 4.1 secondary education 1.6 1.2 2.7 0.7 0.5 1.9 0.9 1.0 0.5 0.9 special education 1.5 1.7 0.9 1.4 0.2 2.5 1.4 1.7 1.0 1.5 general, other education fields 6.2 5.3 8.2 5.1 1.1 7.0 4.7 3.9 5.3 5.4 aeronautical, astronautical eng 0.0 0.0 0.0 0.0 0.0 0.0 0.0 0.0 0.0 0.1 chemical engineering 0.1 0.1 0.0 0.3 0.0 0.0 0.0 0.0 0.0 0.0 civil engineering 0.1 0.1 0.0 0.4 0.0 0.0 0.1 0.2 0.0 0.0 electrical engineering 0.1 0.1 0.2 0.1 0.1 0.0 0.1 0.1 0.2 0.0 industrial engineering 0.2 0.2 0.1 0.2 0.2 0.2 0.1 0.3 0.0 0.0 mechanical engineering 0.1 0.1 0.0 0.2 0.3 0.0 0.1 0.1 0.2 0.0 nuclear engineering 0.0 0.0 0.0 0.0 0.4 0.0 0.0 0.0 0.0 0.0 general, other engineering field 0.2 0.2 0.1 0.4 0.4 0.1 0.2 0.2 0.2 0.1 ethnic studies 0.0 0.0 0.0 0.0 0.0 0.0 0.0 0.1 0.0 0.0 art 1.9 2.2 1.3 2.0 1.0 2.0 3.1 4.9 1.4 2.3 dramatics or speech 1.9 2.2 1.2 1.7 2.4 2.3 2.3 2.4 1.1 2.9 music 2.2 2.9 0.5 2.9 2.6 2.9 3.0 2.6 1.9 4.3 other fine arts 1.1 1.4 0.2 1.1 1.4 1.1 2.3 3.9 0.6 1.6 forestry 0.0 0.0 0.0 0.1 0.0 0.0 0.0 0.1 0.0 0.0
Two-year Colleges Public Private
0.2 0.0 0.2 0.0 1.2 0.5 0.5 0.0 0.0 0.0 0.3 0.6 0.1 0.0 0.3 0.5 0.2 2.1 1.5 1.5 1.2 1.0 0.4 1.3 0.4 1.0 2.4 2.0 0.8 0.0 1.9 3.5 1.3 0.0 4.3 7.0 1.9 2.1 1.6 1.5 1.6 2.6 2.7 1.0 0.3 1.3 2.5 2.6 2.8 1.6 1.0 0.8 8.4 5.9 0.0 0.0 0.1 0.0 0.0 0.0 0.2 0.0 0.2 0.0 0.1 0.0 0.0 0.0 0.1 0.0 0.0 0.0 1.3 1.1 1.3 0.0 0.5 1.1 0.2 0.6
1
0.1 0.0

00 \J1
WEIGHTED NATIONAL NORMS FOR FULL·TIME UNDERGRADUATE FACULTY, 1992·1993
Four-vear Colt -FEMALE FACULTY ALL Universities All Non-Institutions 4-vear 2-vear Public Private Public Private sectarian Catholic Protestant
Field of Degree (continued) geology 0.3 0.3 0.2 0.3 0.3 0.5 0.1 0.1 0.1 0.1 dentistry 0.3 0.1 0.7 0.2 0.0 0.1 0.0 0.1 0.0 0.0 health technology 0.2 0.1 0.4 0.2 0.1 0.0 0.0 0.0 0.2 0.0 medicine or surgery 0.2 0.2 0.2 0.6 0.0 0.0 0.1 0.0 0.0 0.4 nursing 10.6 7.1 18.7 8.2 2.5 7.0 7.7 6.6 11.4 6.4 phannacy. phannacology 0.3 0.4 0.0 0.6 0.9 0.2 0.1 0.3 0.0 0.0 therapy (speech,physical,occup) 0.8 1.1 0.2 1.6 0.7 1.2 0.5 1.0 0.3 0.1 veterinary medicine 0.0 0.1 0.0 0.1 0.1 0.0 0.0 0.0 0.0 0.1 general, other health fields 1.6 1.4 1.9 2.0 0.3 1.5 1.0 0.9 1.0 1.0 home economics 1.3 1.7 0.4 3.0 0.4 1.9 0.4 0.3 0.2 0.8 English language & literature 9.1 8.6 10.3 5.7 11.2 8.8 10.3 9.3 9.5 12.1 foreign languages & literature 0.6 0.7 O.S 0.7 0.8 0.4 1.0 1.1 1.0 0.8 French 1.4 1.9 0.4 1.9 2.7 1.7 1.8 2.0 1.4 1.9 German 0.5 0.7 0.2 0.9 1.0 0.3 0.8 1.2 0.2 0.6 Spanish 1.8 2.1 0.9 1.2 3.4 2.0 2.7 2.4 1.7 3.8 other foreign languages 0.7 0.9 0.3 1.3 2.1 0.2 0.8 1.5 0.2 0.5 history 2.2 2.8 0.9 2.8 4.3 2.6 2.4 2.8 2.9 1.7 linguistics 1.1 1.3 0.6 2.5 2.8 0.7 0.5 0.5 0.7 0.3 philosophy 0.6 0.9 0.0 0.5 1.6 0.5 1.6 1.7 1.6 1.6 religion & theology 0.5 0.7 0.0 0.1 3.2 0.0 1.6 1.1 3.4 0.9 general, other humanities fields 1.2 1.$ 0.5 2.0 2.1 0.9 1.5 2.0 1.0 1.4 journalism 0.6 0.8 0.2 1.4 1.2 0.6 0.3 0.2 0.2 0.6 law 0.6 0.5 0.8 0.4 0.9 0.5 0.5 0.7 0.5 0.2 law enforcement 0.1 0.1 0.1 0.2 0.0 0.1 0.1 0.1 0.0 0.1 library science 0.7 0.6 0.8 0.5 0.2 0.8 0.6 0.6 0.4 0.9 mathematics and/or statistics 4.1 3.6 5.4 2.2 3.8 4.4 4.0 4.1 5.0 3.4 military science 0.0 0.0 0.0 0.0 0.0 0.0 0.0 0.0 0.0 0.0 astronomy 0.0 0.0 0.0 0:0 0.0 0.0 0.1 0.2 0.0 0.1 atmospheric sciences 0.0 0.0 0.0 0.0 0.1 0.0 0.0 0.0 0.0 0.0 chemistry 1.4 1.6 0.9 1.2 2.3 1.4 2.0 1.7 3.0 1.6 earth sciences 0.3 0.3 0.1 0.6 0.1 0.2 0.3 0.2 0.3 0.3 marine sciences 0.1 0.1 0.0 0.1 0.0 0.2 0.0 0.0 0.0 0.1 physics 0.3 0.2 0.4 0.0 0.4 0.2 0.3 O.S 0.3 0.1 general, other physical sciences 0.1 0.0 0.1 0.0 0.1 0.0 0.1 0.1 0.2 0.1 clinical psychology 0.5 0.7 0.2 0.7 0.7 0.7 0.5 0.2 0.5 0.9 counseling & guidance 0.9 0.7 1.2 0.5 0.3 1.0 0.7 0.4 1.1 0.9 experimental psychology 0.9 1.1 0.4 1.1 0.9 0.9 1.4 1.9 1.1 1.1 social psychology 0.6 0.8 0.2 1.2 0.5 0.7 0.7 0.6 1.2 0.4 !Zeneral other 'Psychology 1.5 1.6 1.3 1.1 2.5 1.5 1.8 1.5 1.9 2.1
Two-year Colleges Public Private
0.2 0.5 0.8 0.0 0.3 2.4 0.2 0.01
18.6 20.6 0.1 0.0 0.2 0.5 0.0 0.0 2.0 1.0 0.5 0.0
10.2 12.6 0.5 0.5 0.4 O.S 0.2 0.0 0.9 1.0 0.3 0.0 0.8 2.5 0.6 0.51 0.0 0.0 0.0 0.$ 0.6 0.0 0.3 0.0 0.8 1.$ 0.1 0.0 0.8
1.0
1
5.6 2.1 0.0 0.0 0.0 0.0 0.0 0.0 0.9 1.5 0.1 0.01 0.0 0.0 0.5 0.0 0.1 0.0 0.2 0.0 1.2 1.8 0.4 0.0 0.2 0.01 1.4 0.0

00 CI'
WEIGHTED NATIONAL NORMS FOR FULL-TIME UNDERGRADUATE FACULTY, 1992-1993
- ------~:-::~:~--~-
FEMALE FACULTY ALL Universities All Non-Four-vear con
Institutions 4-vear 2-vear Public Private Public Private sectarian Catholic Protestant Field of Degree (continued)
anthropology 0.9 1.2 0.2 1.2 1.6 0.9 1.3 1.6 0.6 1.5 archaeology 0.0 0.1 0.0 0.0 0.1 0.1 0.1 0.1 0.2 0.0 economics 1.2 1.5 0.7 1.3 3.9 1.0 1.4 2.0 1.1 0.9 political science, government 1.3 1.7 0.3 1.0 5.7 1.3 1.6 2.1 2.0 0.7 sociology 1.7 2.0 1.1 2.3 3.7 1.4 1.8 1.1 1.9 2.5 general, other social sciences 1.1 1.2 0.9 2.0 2.2 0.7 0.7 0.5 1.3 0.5 social work, social welfare 1.1 1.3 0.7 0.7 0.3 1.7 1.7 1.0 1.5 2.7 building trades 0.0 0.0 0.0 0.1 0.0 0.0 0.0 0.0 0.0 0.0 data processing,computer prog 0.1 0.1 0.1 0.1 0.0 0.1 0.1 0.1 0.2 0.0 drafting/design 0.0 0.0 0.1 0.0 0.0 0.0 0.1 0.2 0.0 0.0 electronics 0.0 0.0 0.0 0.0 0.0 0.0 0.0 0.0 0.0 0.0 industrial arts 0.0 0.0 0.0 0.1 0.0 0.0 0.0 0.0 0.0 0.0 mechanics 0.0 0.0 0.0 0.0 0.0 0.0 0.0 0.0 0.0 0.0 other technical 0.2 0.1 0.4 0.0 0.0 0.1 0.0 0.1 0.0 0.0 other vocational 0.4 0.2 0.9 0.3 0.1 0.3 0.0 0.0 0.0 0.0 women's studies 0.0 0.0 0.0 0.0 0.2 0.0 0.1 0.1 0.0 0.0 all other fields 1.6 1.7 1.1 2.4 1.5 1.7 1.3 1.6 1.6 0.7
Department of Current Faculty Appointment
agriculture 0.7 1.0 0.2 2.9 0.0 0.3 0.1 0.0 0.0 0.3 architecture/urban planning 0.3 0.3 0.2 0.8 0.0 0.1 0.1 0.3 0.0 0.0 bacteriology, molecular biology 0.2 0.2 0.1 0.2 0.1 0.3 0.2 0.1 0.3 0.2 biochemistry 0.1 0.1 0.0 0.1 0.1 0.1 0.1 0.2 0.0 0.1 biophysics 0.0 0.0 0.0 0.1 0.0 0.0 0.0 0.0 0.0 0.0 botany 0.1 0.1 0.1 0.2 0.2 0.1 0.1 0.0 0.2 0.0 marine life sciences 0.1 0.1 0.0 0.3 0.1 0.1 0.1 0.2 0.1 0.0 physiology, anatomy 0.3 0.2 0.5 0.3 0.0 0.2 0.2 0.2 0.2 0.2 zoology 0.1 0.1 0.0 0.2 0.0 0.1 0.1 0.1 0.1 0.1 general, oth biological science 3.1 2.9 3.5 2.4 2.7 2.4 4.2 4.3 4.5 3.7 accounting 2.0 1.9 2.2 2.3 2.5 1.9 1.4 1.4 1.7 1.2 fmance 0.2 0.3 0.0 0.1 0.9 0.2 0.2 0.2 0.6 0.0 marketing 0.7 0.8 0.5 0.7 0.9 0.8 0.7 0.8 1.1 0.3 management 1.6 1.8 1.2 1.2 3.2 1.5 2.3 2.0 3.3 2.1 secretarial studies 1.7 0.2 5.2 0.0 0.0 0.3 0.4 0.5 0.0 0.6 ~eneral. other busine~_ 1.6 1.2 2.4 0.5 1.4 1.6 ~ J_.4~ 1.5 ---- 1.3
Two-year Colleges Public Private
0.2 0.6 0.0 0.0 0.7 1.0 0.3 0.0 1.2 0.5 0.9 1.1 0.8 0.0 0.0 0.0 0.1 0.0 0.1 0.0 0.0 0.0 0.0 0.0 0.0 0.0 0.3 0.5 1.0 0.5 0.0 0.0 1.1 1.8
0.2 0.0 0.1 0.5 0.1 0.0 0.0 0.0 0.0 0.0 0.1 0.0 0.0 0.0 0.4 1.0 0.0 0.0 3.6 2.7 2.2 3.1 0.0 0.0 0.5 0.5 1.1 2.1 5.4 2.9
_2.5 2.2

00 .......
WEIGHTED NATIONAL NORMS FOR FULL-TIME UNDERGRADUATE FACULTY, 1992-1993
Four-vear Coli -FEMALE FACULTY ALL Universities All Non-
Institutions 4-vear 2-vear Public Private Public Private sectarian Catholic Protestant Current Department (continued)
computer science 1.3 1.1 1.7 0.3 1.1 1.4 1.6 1.6 1.5 1.7 business education 0.8 0.7 1.0 0.3 0.0 1.5 0.2 0.3 0.1 0.2 elementary education 2.7 3.7 0.4 1.8 1.3 5.4 4.0 2.S 5.0 5.0 educational administration 0.2 0.3 0.0 0.1 0.1 0.3 . 0.5 0.0 0.0 1.4 educational psych, counseling 0.5 0.6 0.2 0.8 1.0 0.7 0.1 0.1 0.0 0.3 higher education 0.4 0.4 0.3 0.3 0.3 0.6 0.4 0.2 0.6 0.4 music or art education 0.1 0.2 0.1 0.0 0.1 0.4 0.0 0.0 0.0 0.1 physical or health education 3.7 4.3 2.3 4.9 1.4 5.1 3.3 3.0 2.5 4.4 secondary education 0.7 1.0 0.1 0.9 0.2 1.3 0.8 0.6 0.7 1.3 special education 0.9 1.1 0.3 1.2 0.0 1.6 0.7 1.0 0.7 0.4 general, other education fields 3.2 3.5 2.4 3.0 0.9 5.0 2.7 2.0 2.9 3.4 aeronautical, astronautical eng 0.0 0.0 0.0 0.0 0.0 0.0 0.0 0.0 0.0 0.0 chemical engineering 0.1 0.1 0.1 0.2 0.0 0.0 0.0 0.0 0.0 0.0 civil engineering 0.1 0.1 0.0 0.2 0.0 0.0 0.1 0.2 0.0 0.0 electrical engineering 0.1 0.1 0.1 0.1 0.4 0.0 0.0 0.0 0.2 0.0 industrial engineering 0.0 0.1 0.0 0.2 0.1 0.0 0.0 0.0 0.0 0.0 mechanical engineering 0.1 0.2 0.1 0.2 0.5 0.0 0.1 0.2 0.2 0.0 nuclear engineering 0.0 0.0 0.0 0.0 0.0 0.0 0.0 0.0 0.0 0.0 general, other engineering field 0.3 0.3 0.2 0.8 0.5 0.0 0.0 0.1 0.0 0.0 ethnic studies 0.0 0.1 0.0 0.0 0.0 0.1 0.1 0.2 0.0 0.0 art 2.2 2.7 1.0 2.5 2.3 2.7 3.0 4.0 2.1 2.6 dramatics or speech 1.8 2.2 0.8 2.2 1.1 2.2 2.5 2.6 0.9 3.4 music 2.3 2.9 0.7 3.3 2.6 2.7 2.9 2.4 2.1 4.1 other fine arts 0.7 0.9 0.1 0.6 1.3 0.9 1.2 2.6 0.2 0.2 forestry 0.1 0.1 0.0 0.2 0.0 0.0 0.0 0.0 0.0 0.0 geology 0.2 0.3 0.1 0.2 0.0 0.5 0.0 0.1 0.0 0.0 dentistry 0.6 0.3 1.4 0.7 0.0 0.2 0.0 0.1 0.0 0.0 health technology 0.7 0.3 1.7 0.4 0.2 0.2 0.2 0.4 0.1 0.0 medicine or surgery 0.2 0.3 0.1 0.9 0.0 0.0 0.1 0.0 0.1 0.2 nursing 12.3 9.1 19.9 11.2 3.5 8.7 9.5 7.4 15.1 8.1 pharmacy, pharmacology 0.2 0.3 0.0 0.5 0.9 0.0 0.1 0.2 0.0 0.0 therapy (speech,physical,occup) 1.1 1.3 0.6 2.3 0.6 1.3 0.4 O.S 0.9 0.0 veterinary medicine 0.0 0.0 0.1 0.0 0.0 0.0 0.0 0.1 0.0 0.0 general, other health fields 2.1 1.4 3.6 1.7 0.1 1.9 1.0 1.1 0.7 0.9 home economics 1.8 2.4 0.4 4.1 0.5 2.9 0.5 0.2 0.6 0.9 English language & literature 10.8 9.7 13.3 7.2 12.5 9.8 11.2 10.8 10.0 12.4 foreign languages & literature 3.1 4.1 0.8 4.1 4.4 3.7 4.3 4.1 3.6 5.2 French 0.6 0.8 0.1 0.7 2.2 0.4 0.9 1.4 0.4 0.6 German 0.2 0.3 0.0 0.7 0.3 0.0 0.4 0.6 0.0 0.3 Spanish 0.8 1.0 0.3 1.4 2.1 0.5 0.9 0.8 0.5 1.3 other foreil!ll lan2Ualles 0.6 0.8 0.2 0.8 2.9 0.3 0.8 1.5 0.3 0.3
Two-year Colleges Public Private
1.6 2.5 0.7 4.3 0.2 2.8 0.0 0.0 0.2 0.0 0.3 0.0 0.1 0.0 2.3 3.3 0.1 0.0 0.3 0.9 2.5 1.9 0.0 0.0 0.1 0.0 0.0 0.0 0.1 0.0 0.0 0.0 0.1 0.0 0.0 0.0 0.3 0.0 0.0 0.0 1.0 1.1 0.9 0.0 0.6 1.2 0.1 0.0 0.0 0.0 0.1 0.0 1.4 0.0 1.5 4.1 0.1 0.0
19.9 20.0 0.0 0.0 0.6 1.1 0.1 0.0 3.5 4.8 0.4 0.0
13.4 12.2 0.9 0.0 0.0 1.1 0.0 0.0 0.3 1.0
L-_____ 0.2 0.0

00 00
WEIGHTED NATIONAL NORMS FOR FULL-TIME UNDERGRADUATE FACULTY, 1992-1993
FEMALE FACULTY ALL Universities All Non-Institutions 4-vear 2-vear Public Private Public Private sectarian Catholic Protestant
Current Department (continued) history 1.8 2.5 0.4 2.7 3.7 2.1 2.3 2.2 2.9 2.0 linguistics 0.1 0.1 0.1 0.0 0.8 0.0 0.0 0.0 0.0 0.0 philosophy 0.5 0.7 0.0 0.3 1.4 0.4 1.4 1.3 1.3 1.5 religion & theology 0.5 0.8 0.0 0.1 3.2 0.0 1.6 0.8 3.9 0.9 general, other humanities fields 1.5 1.2 2.1 0.7 1.2 0.9 2.3 2.8 1.6 2.1 journalism 0.8 1.0 0.3 1.4 2.3 0.8 0.4 0.3 0.8 0.3 law 0.1 0.1 0.2 0.1 0.3 0.0 0.1 0.2 0.2 0.0 law enforcement 0.2 0.2 0.3 0.1 0.7 0.2 0.1 0.1 0.1 0.0 library science 0.5 0.5 0.7 0.1 0.1 0.7 0.7 0.8 0.3 0.7 mathematics and/or statistics 5.4 4.2 8.3 2.3 3.3 5.6 4.6 4.4 5.7 4.0 military science 0.0 0.0 0.0 0.0 0.0 0.0 0.0 0.1 0.0 0.0 astronomy 0.0 0.0 0.0 0.0 0.0 0.0 0.0 0.0 0.0 0.0 atmospheric sciences 0.0 0.0 0.0 0.0 0.1 0.0 0.0 0.0 0.0 0.0 chemistry 1.4 1.7 0.9 1.2 2.8 1.4 2.2 1.4 3.3 2.3 earth sciences 0.3 0.3 0.1 0.6 0.0 0.2 0.3 0.4 0.0 0.5 marine sciences 0.1 0.1 0.1 0.2 0.1 0.0 0.0 0.0 0.0 0.0 physics 0.3 0.3 0.3 0.1 0.4 0.2 0.5 1.0 0.2 0.2 general, other physical sciences 0.2 0.1 0.2 0.0 0.0 0.2 0.2 0.3 0.3 0.1 clinical psychology 0.2 0.2 0.2 0.4 0.2 0.1 0.1 0.0 0.3 0.1 counseling & guidance 0.4 0.3 0.5 0.0 0.1 0.7 0.2 0.2 0.0 0.2 experimental psychology 0.3 0.5 0.0 0.6 0.3 0.3 0.6 0.8 0.4 0.5 social psychology 0.2 0.3 0.0 0.6 0.1 0.1 0.1 0.1 0.1 0.0 general, other psychology 2.4 2.7 1.7 1.0 3.4 3.1 3.6 3.4 3.6 3.9 anthropology 0.5 0.7 0.0 0.8 0.6 0.7 0.5 1.0 0.0 0.2 archaeology 0.0 0.0 0.0 0.0 0.0 0.0 0.0 0.0 0.0 0.0 economics 1.1 1.3 0.7 1.3 3.4 0.8 1.3 1.9 0.9 0.8 political science, government 1.2 1.7 0.1 1.1 5.8 1.2 1.5 2.1 1.1 1.1 sociology 1.6 2.0 0.6 2.4 3.3 1.3 2.2 1.1 2.7 3.1 general, other social sciences 2.2 1.9 2.9 2.4 2.5 1.7 1.5 1.4 1.7 1.4 social work, social welfare 1.0 1.1 0.5 0.7 0.4 1.3 1.6 0.9 1.0 2.9 building trades 0.0 0.0 0.1 0.1 0.0 0.0 0.0 0.0 0.0 0.0 data processing,computer prog 0.6 0.1 1.7 0.1 0.0 0.2 0.2 0.2 0.3 0.0 drafting/design 0.1 0.0 0.3 0.0 0.0 0.0 0.0 0.0 0.0 0.0 electronics 0.0 0.0 0.2 0.0 0.0 0.0 0.0 0.0 0.0 0.0 industrial arts 0.0 0.1 0.0 0.1 0.0 0.0 0.0 0.0 0.0 0.0 mechanics 0.0 0.0 0.1 0.0 0.0 0.0 0.0 0.0 0.0 0.0 other technical 0.6 0.4 1.0 0.2 0.1 0.2 1.1 2.7 0.0 0.0 other vocational 0.6 0.1 1.8 0.2 0.2 0.1 0.0 0.1 0.0 0.0 women's studies 0.1 0.2 0.0 0.6 0.1 0.0 0.1 0.4 0.0 0.0 all other fields 2.9 2.8 3.1 3.5 1.4 2.9 2.3 3.2 1.9 1.7
Two-year Colleges Public Private
0.3 2.2 0.1 0.01 0.0 0.0 0.0 0.5 2.1 1.9 0.3 0.0 0.1 1.0 0.3 0.0 0.7 0.0 8.5 5.0 0.0 0.5 0.0 0.0 0.0 0.0 0.8 1.6 0.1 0.0 0.1 0.0 0.3 0.0 0.3 0.0 0.2 0.0 0.5 0.5 0.0 0.0 0.0 0.5 1.7 2.1 0.0 0.6 0.0 0.0 0.7 0.5 0.1 0.0 0.6 0.5 3.0 0.6 0.6 0.0 0.1 0.0 1.7 1.6 0.3 0.0 0.2 0.0 0.0 0.0 0.1 0.0 1.1 0.0 1.9 1.0 0.0 0.0
3.2 1.9

Appendix A
1992 Faculty Survey Instrument
89


--1992 Faculty Survey Higher Education Research Institute, UCLA -======================~------------------------~----------------------~-
DIRECTIONS Your responses will be read by an optical mark reader. Your observance of these few directions will be most appreciated. • Use.9!!!Y a black lead pencil (No.2 is ideal). • Make heavy black marks that fill the oval. • Erase cleanly any answer you wish to change. • Make no stray markings of any kind. EXAMPLE: Will marks made with a bali-point
or felt-tip pen be properly read? o Yes .No
1. What Is your principal activity in your current position at this institution? (Mark one)
o Administration
o Teaching
o Research
o Services to clients and patients
o Other
2. Are you considered a full-time employee of your institution for at least nine months of the current academic year? (Mark one)
aYes 0 No
3. What is your present academic rank?
o Professor
o Associate Professor
o Assistant Professor
o Lecturer
o Instructor
o Other
4. What is your administrative title?
o Not applicable
o Director, coordinator, or administrator of an institute, center, lab, or speciallyfunded program
o Department Chair
o Dean
o Associate or Assistant Dean
o Vice-President, Provost, Vice-Chancellor
o President, Chancellor
o Other
5. Your sex:
o Male 0 Female
6. Your marital status:
o Married (currently)
a Separated
o Single (never married)
o Single (with partner)
a Single (divorced)
o Single (widowed)
7. If you were to begin your career again, would you still want to be a college professor?
o Definitely yes
o Probably yes
o Not sure
a Probably no
o Definitely no
8. Racial/Ethnic group: (Mark.2ll that apply)
o White/Caucasian
o African American/Black
o American Indian
o Asian American/Asian
o Mexican American/Chicano
a Puerto Rican American
a Other Latino
o Other
9. Do your interests lie primarily in teaching or research?
o Very heavily in research
o In both, but leaning toward research
o In both, but leaning toward teaching
o Very heavily in teaching
10. Which of these statements applies to your current research or scholarly endeavors? (Mark one)
o I am essentially working alone
a I am working with one or two colleagues
o I am a member of a larger group ~ I ~ <I s~C§
11. On the following list, :.$'" please mark: (Mark if ;;, if !2.!l§. in each column) ~tJ,41 4 if Bachelor's (B.A., B.S., etc.) ..... 0 ... 0 Master's (M.A., M.S., etc.) ...... 0 ... 0 LL.B., J.D. . ................. 0 ... 0 M.D., D.D.S. (or equivalent) .... 0 ... 0
Other first professional degree beyond B.A. (e.g., D.D., D.V.M.).O ... O
Ed.D ........................ 0 ... 0 Ph.D ........................ 0 ... 0 Other degree ................ 0 ... a None ....................... 0 ... 0
12. During the past two years, have you engaged in any of the following activities? (Mark.Q!!!l for each item) Yes No
Taught an honors course ......... 0 ... 0 Taught an interdisciplinary course .. 0 ... 0 Taught an ethnic studies course ... 0 ... 0 Taught a women's studies course .. 0 ... 0 Team-taught a course ............ 0 ... 8
Worked with students on a research project ............... 0 ... 0
Attended a racial/cultural awareness workshop ........... 0 ... 0
Participated in a faculty seminar to integrate women's and minorities' perspectives in regular courses .. 0 ... 0
Held a faculty senate or council office .................. 0 ... 0
Used intra- or extramural funds for research ............. (~ ... 0
Served as a paid consultant ....... C) ... 0
Participated in a teaching enhancement workshop ........ 0 ... 0
91
13. In the two sets of ovals shown below, please -mark the most appropriate code from the _ fields listed on the back of the accompanying leHer. (Please see example on back of -accompanying letter) -
Major of highest
degree held
ClDClD
14. In the set of ovals to the right, please mark the dollar value of your base institutional salary, rounded to the nearest $1,000 (Note: Amounts above $199,000 should be marked "199").
Department of current faculty appointment
ClD
®® ®® @(f>
<DID CD® (J)([)
®® The above salary is based on: ® (!) o 9/10 months 0 11/12 months
15. In the four sets of ovals below, please mark the last two digits of the year of each of the following:
Year of birth
®® CD CD ®® (DC[)
@® ();)(])
®® (J)C1)
®® ®<D
Year of appointment at
present institution
@@
Year of highest degree now held
®® CD<D ®CD C[)<l)
®<I> ®® ®eD C1)C1)
®® ®®
Year tenure was awarded
Are you tenured?
@@ CD CD mID <D(]) @<I> (IHI)
(])(I)
C1)rn ®ID ®®
aVes
ONo
• • •••• •
------------------------. -------------------------------

-----------------
NOTE: If you are now between terms (quarters, semesters, trimesters), on leave, or in an Interim term, please answer questions 16 and 17 as they apply to the full term most recently completed at this institution.
16. During the present term, how many hours per week on the average do you actually spend in connection with your present position on each of the following activities?
(Mark ~ for each activity)
Preparing lor teaching (including reading student papers and grading) ........ .
Advising and counseling of students .... 0 0 0 0 0 0 Committee work and meetings ......... 000000000 Other administration ................. 000000000
- Research and scholarly writing ........ 000000000 -------------------------------------
Creative products/performances ....... 00 0 0 0 0 0 0 0 Consultation with clients/patients ....... 0 0 0 0 0 0 Community or public service .......... 0 0 00 0 0 Outside consultinglfreelance work ...... 0 Householdlchildcare duties ........... 0 00
17. How many of the following courses are you teaching this term? (Mark ~ for each item)
General education courses. . . . . . . . . . . . . . . . .. . ® CD (I) @ ® ® Other BA or BS undergraduate credit courses ...... ® CD (}) <D CD G Non-BA credit courses (developmental/remedial) .... ® CD (}) <D CD IS±)
Graduate courses ............................ ® (j) CV <D @ IS±)
18. Indicate the importance to you of each of the following:
(Mark ~ for each item)
Education Goals for Undergraduate Students: Develop ability to think clearly ...................... @ ID @ <ID
Increase desire and ability to undertake self-directed learning .............................. (E) ID @ ®
Prepare students lor employment after college ........ @ ID @ ® Prepare students lor graduate or advanced education ... (E) ® @ em Develop moral character .......................... (E) ID @ ® Provide for students' emotional development ..... . . . . . @ <ID Prepare students for family living ................... @ ® Teach students the classic works of Western civilization .
Help students develop personal values ............. .
Enhance the out-of-class experience of students ....... (!) ID @ <ID Enhance students' sell-understanding ............... (E) ID @ ®
Personal/Professional Goals: - Engage in research ............................. (E) ® @ CID - Engage in outside activities ....................... (E) ID @ CID - Provide services to the community .... . . . . . . . . . .. .. (E) ® @ ® - Participate in committee or other administrative work .. , (E) ® @ ® - Be a good colleague ............................ (E) ID@® - Be a good teacher .............................. (E) ®@® -- • •••• • • 92
For questions 19-24, please mark only .2!!! response for each question.
19. How many articles have you / , / ':" / "! I~ If /! /.z / published in academic or ;I ~ ., '" ... '" lIS
professional journals? ....•..........•. 0 oe 0 000
20. How many chapters have you published In edited volumes? ..•....... 0 ole 0000
21. How many books, manuals, or monographs have you written or edited, alone or in collaboration? ....•.• 0 ole 0000
22. How many of your exhibitions or performances in the fine or applied arts have been presented? ............. 00100000
23. How many of your professional writings/performances have been published or presented in the last two years? ............................ 0000000
24. About how many days during the past (1991-92) academic year were you away from campus tor professional activities (e.g., professional meetings, speeches, consulting)? ......•..•.•..•........... 0 00 01010 0
25. What is the highest level of education reached by your spouse/partner and your parents?
(Mark one in each column)
8th grade or less ........................ .
Some high school .................................. <I> ® eM)
Completed high school . , . . .. . ...................... (j) ® (II)
Some college .............................. (j) ® <II)
Graduated from college ............................. (j) ® <II> Attended graduate or professional school ............... <I> ® <II> Attained advanced degree ........................... <I> ® <II> Does not apply (No spouse or partner) . . . . . . . . . . . . . .. . 1,;<1>:::;.1,......1--1
26. For each of the following items, please mark either Yes or No.
J Ii Have you ever held an academic administrative post? ...... 0 ... 0 Have you ever receil/ed an award for outstanding teaching? . 0 ... 0 Is your spouse or live-in partner an academic? ............ 0 ... 0 Do you commute a long distance to work? ............... 0 ... 0 Has any of your research or writing focused on women? .... 0 ... 0 Does your spouse/partner work in the same city? .......... 0 ... 0
Has any of your research or writing focused on racial or ethnic minorities? ....................... 0 ... 0
Were you born in the USA? .... ................ 0 ... 0 Are you a U.S. citizen? .. , ........................... 0 ... 0
Have you ever interrupted your professional career for more than one year for health or family reasons? ........ 0 ... 0
Have you been sexually harassed at this institution? ....... 0 ... 0 Do you plan on working beyond age 70? ................ 0 ... 0
During the Last Two Years, Have You:
Received at least one firm job offer? .. .......... 0 .. 0 Developed a new course? . . . . . . .. .............. 0 ... 0 Considered early retirement? ......................... 0 ... 0 Considered leaving acedeme for another job? ............ 0 ... 0

27. Indicate how important you believe each priority listed below is at your college or university.
(Mark ~ for each activity)
To promote the intellectual development of students , . , .. , ..... , .. , , , ....... , . , ........ , .. m (I) <D CD
To help students examine and understand their personal values .........•..........•........ .:<D (!) ill CD
To hire more minority faculty and administrators ........... <D CD ill CD
To develop a sense of community among students and faculty ............................... ill <D ill CD
To develop leadership ability among students ............ <D <D ill CD To hire more women faculty and administrators ........... <D <D ill CD
To facilitate student involvement in community service activities ................................. ill <D ill CD
To help students learn how to bring about change in American society . , .......... , ............ ill <D ill CD
To increase or maintain institutional prestige ............. <D <D ill (j) To hire faculty "slars· . . . . . . . . . . . . . . . . . . . . . . . . . . .. . .. <D <D ill To recruit more minority students ......... • ...•....••. <D CD ill (j) To enhance the institution's national image .. . ......... <D <D <D (D
To create a diverse multi-cultural campus environment ..... ill <D ill CD
28. How would you characterize your political views? o Far Left
o Liberal
o Middle-ol-the-road
o Conservative
o Far Right
29. How much stress have you experienced over the past two years? o Extreme
o Moderate
o Little
30. Please indicate the extent to which each of the following has contributed to your stress during the last two years.
(Mark one for each item)
Managing household responsibilities .............. , ....... (E) ® ® Child care ........................................... (E) ® ® Care 01 elderly parent .................................. (E) ® ® My physical health .................................... (E) ® ® Review/promotion process ........................ ... . (E) ® ® Subtle discrimination (e.g., prejudice, racism, sexism) ......... (E) ® ® Personal finances ....................•................ (E) ® ® Committee work ................. , .... , ............... (E) ® ® Faculty meetings ...... .. . ...... ,.. . ............ , .. (E) ® ® Colleagues ........ . ...... , ....... , ................. (E) ® ® Students ........... ,.......... . ....... , .......... (E) ® ® Research or publishing demands ......... , ............... (E) aD ® Institutional procedures and 'red tape' ...................... aD ® (i!I)
Teaching load ............ , .................... , .. ,., .(E)®® Children'S problems ................................... (E) ® ® Marital friclion .. , ................. " .................. (E) ® ® TIme pressures ... , .......... , ................. , ...... «(HID ® Lack 01 personal time .................................. (E) ® ®
93
31. How satisfied are you with the following aspects of your job?
(Mark ~ for each item)
Salary and fringe benefits ...................... i(i) ®i(fll <ID a Opportunity for scholarly pursuits ................ (i) ® ® <ID a Teaching load ....... ,'. , ................. , .. (i) ® @ <ID a Quality of students ................. , ..... " .. (i) ®@<ID a Working conditions (hours, location) .............. (i) ® @ <ID a Autonomy and independence ... , . . . . . . . . . .. . .. (i) ® @ <ID a Professional relationships with other faculty ..... , .. (i) (S) @ <ID a Social relationships with other faculty ........ , .... (i) aD (jJ) <ID a Competency 01 colleagues .......... , .......... (i) (S) @ (ID a
Visibility for jobs at other institutions/organizations ... (i) ® (Jl) (ID a
Job security .......,........................ (Il) ® (jJ) (ID a
Undergraduate course assignments ............. (Il) ® (jJ) (ID 0 Graduate course aSSignments .................. (Il) (S) @ (ID a
32. Below are some statements about your current college. Indicate the extent to which you agree or disagree with each of the following.
(Mark one for each item)
(IDa
(IDa
Faculty are interested in students' personal problems .. , ill (3) (2) CD Most faculty are senSitive to the issues of minorities ... , ill (3) <V CD
-----------------------------People here don't treat each other with enough respect .. ill (3) (2) CD -
Faculty feel that most students are well-prepared -academically ................................. ill <D (2) CD -Student Affairs staff have the support and respect -of faculty . . . .. .. . . . . . . .. .. .. ... . ..... , ..... <D (3) <V CD -Faculty are committed to the weHare of this institution ... ill (3) <V CD -Many courses include minOrity group perspectives •.... <D (3) <V CD
There is little trust between minority student groups and campus administrators ...................... <D (3) <V (j)
Faculty here are strongly interested in the academic problems of undergraduates ........•............ ill (3) (2) CD
There is a lot of campus racial conflict here ........... <D (2) CD Many courses include feminist perspectives ........... ill (3) (2) CD Faculty of color are treated fairly here ............... <D (3) (2) CD Women faculty are treated fairly here ................ <D (3) <V CD Administrators here act in good faith ................ <D rn CD CD
33. In my courses, I expect students to:
(Mark ~ for each item)
Compete with each other for grades ......... ".' ..
Seek frequent feedback on their performance. . . ..... .
Work independently .............. , . , ........... .
• • •••• •
----------------------------

---------------------
34. Indicate how well each of the following describes your college or university.
(Mark one for each item)
It is easy for students to see faculty outside of regular office hours ................... .
There is a great deal 01 conformity among the students ..... (y) ® ® Most of the students are very bright .................... CD ® <ID
The faculty are typically at odds with campus administrators .................................. .
Faculty here respect each other ...................... .
Most students are treated like "numbers in a book" ....... .
Social activities are overemphasized
There is little or no contact between students and faculty ..
This institution is genuinely committed to helping minority students succeed ......................... .
Intercollegiate sports are overemphasized ............... (y) (I) <ID Students here do not usually socialize with one another .... OD @ ® Faculty are rewarded for being good teachers ............ OD (I) <ID
- 35. How many children do you have in the following age ranges: - 0-4 years ...................................... @ CD (2) <D ~ - 5-12years ..................................... @CD(2)<D~
- 13-17 years .................................... @ CD (2) <D ~ - 18 years old or older ............................. @ <D <V <D ~ -----
36. In how many of the undergraduate courses that you teach do you require each of the following?
(Mark one for each item)
. - Evaluation Methods: ----- Weekly essay assignments ........................ . - Student presentations ............................. .
- Term/research papers ....... : ..................... .
_ Student evaluations of each others' work ............... . ---- Instructional Techniques/Methods: - Class discussions ..............•................... - Computer or machine-aided instruction ................ . - Cooperative learning (small groups) ................... . - Experiential learning/Field studies .................... . --- Group projects .................................. ..
- Independent projects .............................. .
- ExtenSive lecturing ................................ .
- Multiple drafts of written work ........................ .
- Readings on racial and ethnic issues .................. . - Readings on women and gender issues . . . . . . ........ . - Student-developed activities (aSSignments, exams, etc.) .... @ - Student-selected topics for course content ............... ® -- §.o ••••• o.o •• o ••• oo - DO NOT MARK IN THIS AREA -- • •••• • • 94
37. Please indicate your agreement with each of the following statements.
(Mark one for each item)
The death penalty should be abolished ................. (i) <D (2) <D
A national health care plan is needed to cover everybody's medical costs .......................... (i) <D (2) <D
Abortion should be legal ............................. (i) (j) CV <D Racist/sexist speech should be prohibited on campus ...... ill <D (2) <D
Western civilization and culture should be the foundation of the undergraduate curriculum ..................... ill <D (2) <D
College officials have the rig hi 10 ban persons with extreme views from speaking on campus .............. <D <D (2) <D
The chief benefit of a college education is that it increases one's earning power ....................... (i) <D CV <D
Promoting diversity leads to the admission of too many underprepared students ........................... CD <D CV <D
Colleges should be actively involved in solving social prOblems ..... . . . .. . . . .. . . . . . . .. .. . . . .. . .. .. . <D <D CV <D
Faculty unionization has enhanced the teaching/ learning process ............. .............. .. .. <D (j) (V <D
Tenure is an outmoded concept ....................... <D (j) (2) <D
38. Indicate the importance to you personally of each of the following:
(Mark ~ for each item)
Helping others who are in difficulty ..................... aD
Obtaining recognition from my colleagues for contributions to my special field ...................... aD (il) @
ADDITIONAL QUESTIONS: If you received additional questions, mark answers below:
.®@@@aD ~®@@@<iD &®®©@<iD
.OO@©@<iD .OO@©@<iD ~®®©@<iD 41.®@@@<iD 4S.®@©@<iD 48.®@©@<iD 42.®@@@<iD
~ en L!)
'r"I Please return your completed questionnaire in the postage-paid envelope to: THANK C\J
Higher Education Research Institute 5100 N. Roxboro Road, Durham, Ne 27704
YOUI rl
R6(l24-HERI-54321

Appendix B
The Precision of the Nonnative Data
95


Appendix B
The Precision of the Normative Data
A common question asked about sample surveys relates to the precision of the data, which is
typically reported as the accuracy of a percentage "plus or minus x percentage points." This figure,
which is known as a confidence interval, can be estimated for items of interest if one knows the
response percentage and its standard error.
Given the large normative sample, the calculated standard error associated with any particular
response percentage will be small (as will its confidence interval). It is important to note, however,
that traditional methods of calculating standard error assume conditions which, as is the case with
most sample survey data, do not apply here. There are also sources of error unrelated to sampling
variability which should be considered in comparing data across normative groups, across related
item categories, and over time. These concerns include:
1) Traditional methods of calculating standard error assume that the analytical sample was selected through simple random sampling. Given the complex, stratified design of this survey, where the normative estimates are based on responses of faculty at participating institutions, it is likely that the actual standard errors will be somewhat larger than the standard error estimates produced through traditional computational methods.
2) The wording of some questions in the survey instrument, the text and number of response options, and their order of presentation may be different for different faculty surveys. We have found that even small changes can produce large order and context effects. Given this, the ~ wording of items on the survey instrument (which is produced as Appendix A) should be examined carefully prior to making comparisons across survey years.
Although it is impractical to report statistical indicators for every percentage in every normative
group, it is important for those who are interested to be able to estimate the precision of the data.
Toward this end, Table B 1 provides estimates of standard errors for norms groups of various sizes
and for different percentages, while Table B2 provides confidence interval estimates.
For example, the normative data indicates that 18.2 percent of all faculty reported that they had
taught an honors course within the past two years, To obtain an estimate of the standard errorl , we
would first choose the column that most closely corresponds to that percentage, or "20%",2 Next,
lCalculated by V X%(1~-X%) , where x is the percentage of interest and N is the population count from Table 1.
2Since the distribution of, the standard errors are symmetrical around the 50 percent mid-point, for percentages over 50 simply subtract the percentage from 100 and use the result to select the appropriate column. For example, if the percentage we were interested in was 59, 100 - 59 percent yields 41, so we would use the column labeled '40%'.
97

select the row corresponding most closely to the unweighted sample size of the comparison group
to find the appropriate standard error. The last column in Table 1 shows that the unweighted
number of faculty from all institutions is 29,771. Thus, with a sample size of about 30,000 and a
percentage that is close to 20, the estimated standard error would be .23.
Table Bl Estimated Standard Errors of Percentages (or Norms Groups of Various Sizes
Unweighted size P!,;f!;; !,;n tag!,; of nonns &!:ouI!s 1% 5% 10% 15% 20% 25% 30% 35% 40% 45% 50%
500 .44 .97 1.34 1.60 1.79 1.94 2.05 2.13 2.19 2.22 2.24 1,000 .31 .69 .95 1.13 1.26 1.37 1.45 1.51 1.55 1.57 1.58 2,000 .22 .49 .67 .80 .89 .97 1.02 1.07 1.10 1.11 1.12 3,000 .18 .40 .55 .65 .73 .79 .84 .87 .89 .91 .91 4,000 .16 .34 .47 .56 .63 .68 .72 .75 .77 .79 .79 5,000 .14 .31 .42 .50 .57 .61 .65 .67 .69 .70 .71
10,000 .10 .22 .30 .36 .40 .43 .46 .48 .49 .50 .50 25,000 .06 .14 .19 .23 .25 .27 .29 .30 .31 .31 .32 301000 .06 .13 .17 .21 .23 .25 .26 .28 .28 .29 .29
NOTE: Assumes simple random sampling.
To obtain an estimate of the confidence interval at the 95% probability level, follow a similar
procedure to look up the correct value in Table B2. We would again use the value in the fifth data
column ("20%") in the last row, or .5. In practical terms, this confidence interval means that if we
were to replicate this survey a number of times, we would expect to find that 95 times out of 100
between 17.7 percent and 18.7 percent of the faculty would report teaching honors cour~es within
the past two years.
Table B2 Estimated Confidence Intervals for Percentages and Normative Groups of Various Sizes
Unweighted size P!,;f!;;!,;nlag!'; of nonns &!:ouI!s 1% 5% 10% 15% 20% 25% 30% 35% 40% 45% 50%
500 .9 1.9 2.6 3.1 3.5 3.8 4.0 4.2 4.3 4.4 4.4 1,000 .6 1.4 1.9 2.2 2.5 2.7 2.8 3.0 3.0 3.1 3.1 2,000 .4 1.0 1.3 1.6 1.8 1.9 2.0 2.1 2.1 2.2 2.2 3,000 .4 .8 1.1 1.3 1.4 1.5 1.6 1.7 1.8 1.8 1.8 4,000 .3 .7 .9 1.1 1.2 1.3 1.4 1.5 1.5 1.5 1.5 5,000 .3 .6 .8 1.0 1.1 1.2 1.3 1.3 1.4 1.4 1.4
10,000 .2 .4 .6 .7 .8 .8 .9 .9 1.0 1.0 1.0 25,000 .1 .3 .4 .4 .5 .5 .6 .6 .6 .6 .6 30,000 .1 .2 .3 .4 .5 .5 .5 .5 .6 .6 .6
NOTE: Calcuated by multiplying the estimated standard error by the critical value of t at the .05 probability level, or 1.96. To calculate the confidence interval at the 99% probability level the critical t value is 2.56.
98

Appendix C
Participants in the 1992 HERI Faculty Survey
99


Appendix C
Participants in the 1992 HERI Faculty Survey
The following list shows the institutions participating in the 1992 HERI faculty survey,
along with their participation status in the 1989-90 survey. Please note that this list of participants
excludes a substantial number of institutions that participated in the 1989 faculty but did not
participate in the current survey. A participation status of 'N' indicates that the institution was
included in the national nonns, while a status of 'P' indicates participation without inclusion in the
nonnative data.
Detennination of whether or not an institution was included in the national nonnative
sample was accomplished by comparing the number of full-time undergraduate teachers who
responded to the survey to the number of full-time faculty at that institution as reported to the U.S.
Department of Education in the 1990-91 IPEDS survey of Salaries of Full-Time Instructional
Faculty. A two-year or four-year college was included in the normative data if the number of HERI
surveys totaled at least 35 percent of the total IPEDS population of full-time faculty. Because the
IPEDS survey does not distinguish between undergraduate and graduate faculty, the requirment for
universities was slightly more liberal, with 25 being the target percentage.
Inclusion in the nonnative sample should not be confused with response rate. An
institution's response rate depends on the number of sampled faculty who returned a usable survey
instrument. If the institution sampled only a small proportion of its full-time undergraduate
faculty, it might not meet the nonnative requirements even though it had a very high rate of
response.
101


Particigated Particiooted Institution State Tvne 1992 1989 Institution State T~ 1992 1989
Abilene Christian University TX Nonsectarian 4-yr N P Carthage College WI Protestant 4-yr N Agnes Scott College GA Protestant 4-yr N N Cayuga County Cmty College NY Public 2-yr N Alma College 1\11 Protestant 4-yr N N Central Missouri State University MO Public 4-yr N N American University DC Private U N N Central Washington University WA Public4-yr N N Anderson College SC Private 2-yr N N Chadron State College NE Public4-yr N N Andrew College GA Private 2-)T N Charleston University SC Public4-yr N Antioch University OH Nonsectarian 4-yr N N Christopher Newport College VA Public 4-yr N Arkansas State University AR Public 4-yr N Cincinnati Bible College & Sem OH Protestant 4-yr P Atlanta College of Art GA Nonsectarian 4-yr N Clark Atlanta University GA Protestant 4-yr P Atlantic Union College MA Protestant 4-yr P P Clarkson College NE Nonsectarian 4-yr N Augsburg College MN Protestant 4-yr N Clarkson University NY Nonsectarian 4-yr N Augustana College IL Protestant 4-yr N N Clemson University SC PublicU N
Cleveland Institute of Art OH Nonsectarian 4-yr N Barry University FL Catholic 4-yr N N Cleveland Institute of Music OH Nonsectarian 4-yr P Barton County Cmty College KS Public 2-yr N Cloud County Cmty College KS Public 2-yr N N Bates College ME Nonsectarian 4-yr N Coker College SC Nonsectarian 4-yr N Baylor University TX Private U N N College of Mount Saint Joseph OH Catholic 4-yr N
I-' Bellarmine College KY Catholic 4-yr N College of Saint Mary NE Catholic 4-yr N N 0 Belmont University TN Protestant 4-yr N College of Saint Scholastica MN Catholic 4-yr N w
Beloit College WI Nonsectarian 4-yr N N College of Southern Idaho ID Public 2-yr N Bennett College NC Protestant 4-yr N Colorado College CO Nonsectarian 4-yr N N Bentley College MA Nonsectarian 4-yr N Columbia Union College MD Protestant 4-yr N Berkeley College of Business NJ Private 2-yr N P Columbia-Greene Cmty College NY Public 2-yr N Bethel College ~ Protestant 4-yr N Columbus College GA Public 4-yr N N Black Hills State University SD Public 4-yr N N Conception Seminary College MO Catholic 4-yr N N Bowdoin College ME Nonsectarian 4-yr N Concord College WV Public 4-yr N Brigham Young University UT Private U N Concordia College MI Nonsectarian 4-yr N N Broome Cmty College NY Public 2-yr N Concordia College MN Protestant 4-yr N Butler University IN Private U N Concordia Teachers College NE Protestant 4-yr N N
Coppin State College MD Public 4-yr P P Caldwell College NJ Catholic 4-yr N Cornell College IA Protestant 4-yr N California Baptist College CA Protestant 4-yr N Corning Cmty College NY Public 2-yr N California Lutheran University CA Protestant 4-yr N N Creighton University NE Private U N California State U-Bakersfield CA Public4-yr N N California State U-Los Angeles CA Public4-yr P N Dakota State University SD Public 4-yr N Calvin College 1\11 Protestant 4-yr P N Davenport College of Business 1\11 Private 2-yr N Canisius College NY Catholic4-yr N N David Lipscomb University TN Protestant 4-yr N Cape Cod Cmty College MA Public 2-yr N Davis and Elkins College WV Protestant 4-yr N N Caribbean University PR Nonsectarian 4-yr P Denison University OH Nonsectarian 4-yr N N Carleton College MN Nonsectarian 4-yr N N Detroit College of Business MI Nonsectarian 4-yr N

ParticiQated ParticiQated Institution State T~ 1992 1989 Institution State T~ 1992 1989
DePauw University IN Protestant 4-yr N N Harrisburg Area Cmty College PA Public 2-yr N Dominican College of Blauvelt NY Catholic 4-yr N Harry S Truman College IL Public 2-yr P Dominican College of San Rafael CA Catholic 4-yr N Harvey Mudd College CA Nonsectarian 4-yr N N Drury College MO Nonsectarian 4-yr N N Hiram College OH Nonsectarian 4-yr N Dutchess Cmty College NY Public 2-yr N N Hofstra University NY Private U N
Hudson Valley Cmty College NY Public 2-yr P Earlham College IN Protestant 4-yr N N Huntington College IN Protestant 4-yr N N East Texas Baptist University TX Protestant 4-yr N East Texas State University TX Public 4-yr N N Illinois College IL Nonsectarian 4-yr N Eastern Washington University WA Public 4-yr N N Imperial Valley College CA Public 2-yr N Eckerd College FL _ Protestant 4-yr N N Indiana University Southeast IN Public4-yr N N Edgewood College WI Catholic 4-yr N N Indiana Voc-Tech Coll-Eastcentral IN Public 2-yr N Edison State Cmty College OH Public 2-yr N IAUPR-Aguadilla PR Nonsectarian 4-yr P Empire State College NY Public 4-yr N N IAUPR-Arecibo PR Nonsectarian 4-yr P Erie Cmty College North (Amherst) NY Public 2-yr N IAUPR-Barranquitas PR Nonsectarian 4-yr P Erskine College SC Protestant 4-yr N IAUPR-Bayamon PR Nonsectarian 4-yr P Evergreen State College WA Public 4-yr P N IAUPR-Fajardo PR Nonsectarian 4-yr P
...... IAUPR-Guayama PR Nonsectarian 4-yr P 0 Fitchburg State College MA Public 4-yr P IAUPR-Metropolitan PR Nonsectarian 4-yr P .p..
Flagler College FL Nonsectarian 4-yr P IAUPR-Ponce PR Private 2-yr P Fordham University NY Private U P IAUPR-SchoolofLaw PR Nonsectarian 4-yr P Fort Hays State University KS Public 4-yr N P Framingham State College MA Public 4-yr N N Jackson State Cmty College TN Public 2-yr N Free Will Baptist Bible College TN Protestant 4-yr N Jefferson Cmty College NY Public 2-yr N Fulton-Montgomery Cmty College NY Public 2-yr N Jewish Theological Sem of America NY Protestant 4-yr P
John B Stetson University FL Protestant 4-yr N N Garden City Cmty College KS Public 2-yr N John Brown University AR Nonsectarian 4-yr N P George Washington University DC Private U P Joliet Cmty College IL Public 2-yr P Georgetown College KY Protestant 4-yr N Juniata College PA Nonsectarian 4-yr N N Georgetown University DC Private U N N Georgia Institute of Technology GA Public 4-yr P P Kansas City Kansas Cmty College KS Public 2-yr N N Golden Gate University CA Nonsectarian 4-yr P Keiser College of Technology FL Private 2-yr N Grand Valley State University MI Public 4-yr N N Kenyon College OH Nonsectarian 4-yr N Greensboro College NC Protestant 4-yr N Kettering College of Medical Arts OH Private 2-yr N Guilford College NC Protestant 4-yr N N King College TN Protestant 4-yr N Guilford Technical Cmty College NC Public 2-yr N King's College PA Nonsectarian 4-yr N N Gustavus Adolphus College MN Protestant 4-yr N Kirtland Cmty College MI Public 2-yr N N
Knox College IL Nonsectarian 4-yr N N Hagerstown Junior College MD Public 2-yr N Hampshire College MA Nonsectarian 4-yr N N Lakeland College WI Protestant 4-yr N

Partici(!ated Partici(!ated Institution State Tvoe 1992 1989 Institution State T~ 1992 1989
Lawrence Technological University MI Nonsectarian 4-yr P New York State CoIl of Ceramics NY Public 4-yr P Lebanon Valley College PA Protestant 4-yr N N Niagara County Cmty College NY Public 2-yr N Lewis and Clark College OR Nonsectarian 4-yr P North Adams State College MA Public 4-yr N Lincoln University MO Public 4-yr N N North Seattle Cmty College WA Public 2-yr N Lock Haven U of Pennsylvania PA Public 4-yr N Northampton Cmty College PA Public 2-yr N N Longwood College VA Public 4-yr N N Northeast Missouri State U MO Public 4-yr N N Lord Fairfax Cmty College VA Public 2-yr N Northeastern University MA Private U N N Louisiana State U-Eunice LA Public 2-yr N Northern Illinois University IL PublicU N N Loyola Matymount University CA Private U N Northern Nevada Cmty College NY Public 2-yr N Lycoming College PA Protestant 4-yr N Northern State University SO Public4-yr N
Northwest ColI of the Assem of God WA Protestant 4-yr N Madonna University MI Catholic 4-yr N Northwestern College IA Protestant 4-yr N N Malone College OH Protestant 4-yr N N Northwestern University IL PrivateU P P Manhattan College NY Catholic 4-yr N Maritime College NY Public 4-yr N N Occidental College CA Nonsectarian 4-yr N N Marquette University WI Private U N N Ocean County College NJ Public2-yr N Master's College CA Protestant 4-yr N Ohio Dominican College OH Catholic 4-yr N
..... Menlo College CA Nonsectarian 4-yr N Onondaga Cmty College NY Public 2-yr N 0 Mercy College NY Nonsectarian 4-yr N P Orange COMty Cmty College NY Public2-yr N l/1
Merrimack College MA Catholic 4-yr N Otterbein College OH Protestant 4-yr N P Metropolitan Cmty College NE Public 2-yr N Michigan State University MI PublicU P Pace University NY Nonsectarian 4-yr P P Mid-Plains Cmty College NE Public 2-yr N Pacific Lutheran University WA Protestant 4-yr N Mills College CA Nonsectarian 4-yr N Peace College NC Private 2-yr N Minneapolis Coli of Art and Design MN Nonsectarian 4-yr N Phila Coll of Textiles & Science PA Nonsectarian 4-yr P Mohave Cmty College AZ Public 2-yr N Philadelphia College of Bible PA Nonsectarian 4-yr N Monmouth College NJ Nonsectarian 4-yr N N Pitzer College CA Nonsectarian 4-yr N N Monroe Cmty College NY Public 2-yr N Point Loma Nazarene College CA Protestant 4-yr N N Montreat-Anderson College NC Private 2-yr N Point Park College PA Nonsectarian 4-yr N Morehouse College GA Nonsectarian 4-yr P P Presbyterian College SC Protestant 4-yr N N Mount Aloysius Junior College PA Private 2-yr N Mount Holyoke College MA Nonsectarian 4-yr N Richland Cmty College IL Public 2-yr N MOMt Saint Mary College NY Nonsectarian 4-yr N Rochester Institute of Technology NY Nonsectarian 4-yr N P MOMt Vernon Nazarene College OH Protestant 4-yr N Rockford College IL Nonsectarian 4-yr N N Mount Wachusetts Cmty College MA Public 2-yr N Rollins College FL Nonsectarian 4-yr N N Muhlenberg College PA Protestant 4-yr N Rowan-Cabarrus Cmty College NC Public 2-yr N
Navarro College TX Public 2-yr N Sacred Heart University CT catholic 4-yr N N Nebraska Wesleyan University NE Nonsectarian 4-yr N Saint Ambrose University IA Catholic 4-yr N Neumann College PA Nonsectarian 4-yr N Saint Edward's University TX Catholic 4-yr N N

Partici~ated Particil!ated Institution State T~ 1992 1989 Institution State Tvoe 1992 1989
Saint John Fisher College NY Catholic 4-yr N N SUNY College-Geneseo NY Public4-yr N P Saint Joseph's University PA Catholic 4-yr N SUNY College-New Paltz NY Public 4-yr N Saint Mary College KS Catholic 4-yr N N SUNY College-Old Westbwy NY Public4-yr N Saint Mary-of-the-Woods College IN Catholic 4-yr N N SUNY College-Oneonta NY Public 4-yr N Saint Norbert College WI Catholic 4-yr N N SUNY College-Oswego NY Public 4-yr P N Saint Paul's College VA Protestant 4-yr N SUNY College-Potsdam NY Public4-yr N N Saint Peter's College NJ Catholic 4-yr N SUNY College-Purchase NY Public 4-yr N Sam Houston State University TX Public 4-yr N SUNY Inst of Technology-UticalRome NY Public 4-yr P Santa Clara University CA Private U N P SUNY-Albany NY PublicU P Schenectady County Cmty College NY Public 2-yr N SUNY-Binghamton NY PublicU P N Seton Hill College PA Catholic 4-yr P N SUNY-Buffalo NY PublicU P P Shepherd College WV Public 4-yr_ N SUNY -Health Sci Ctr-Syracuse NY Public4-yr P Shippensburg U of Pennsylvania PA Public 4-yr N N SUNY -Stony Brook NY Public U N Shorter College GA Protestant 4-yr N Skidmore College NY Nonsectarian 4-yr N P Tarleton State University TX Public 4-yr N Slippery Rock U of Pennsylvania PA Public 4-yr N Taylor University IN Nonsectarian 4-yr N N Smith College MA . Nonsectarian 4-yr N N Texas Tech University TX PublicU N
...... South Dakota Schl of Mines & Tech SD Public 4-yr N Thomas More College KY Catholic 4-yr N N 0 South Dakota State University SD PublicU N Tompkins Cortland Cmty College NY Public 2-yr N (J'\
South Florida Cmty College FL Public 2-yr N N Southeast Missouri State U MO Public 4-yr N U of the Ozarks AR Protestant 4-yr N Southeastern Louisiana University LA Public 4-yr N U of the South TN Protestant 4-yr N Southern Illinois U-Edwardsville IL Public4-yr N N U of the Virgin Islands VI Public4-yr P Southern University-New Orleans LA Public 4-yr N U of Arkansas-Fayetteville AR PublicU N Southern Utah University UT Public4-yr N U of Charleston WV Nonsectarian 4-yr N Southwest Texas State University TX Public4-yr N U of Delaware DE PublicU N P Southwestern Oklahoma State U OK Public 4-yr N U of Findlay OH Protestant 4-yr N N Southwestern University TX Protestant 4-yr N N U of Illinois-Chicago IL Public 4-yr P N Spartanburg Methodist College· SC Private 2-yr N U of La Verne CA Protestant 4-yr N St Louis College of Pharmacy MO Nonsectarian 4-yr N N U of Maine-Farmington ME Public 4-yr N Sullivan County Cmty College NY Public 2-)T N U of Maine-Fort Kent ME Public 4-yr N SUNY A & T College-Cobleskill NY Public4-yr N N U of Maryland College Park MD PublicU N SUNY A & T College-Morrisville NY Public 2-yr N U of Maryland Eastern Shore MD Public 4-yr N SUNY ColI of Technology-Alfred NY Public 2-yr P N U of Michigan-Dearborn MI Public 4-yr N P SUNY CoIl of Technology-Canton NY Public 2-yr N N U of Montevallo AL Public4-yr N SUNY Coli of Technology-Delhi NY Public 2-yr N U of North Carolina-Asheville NC Public 4-yr N SUNY College of Optometry NY Public 4-yr P U of North Dakota NO PublicU N SUNY College-Brockport NY Public4-yr N P U of Pittsburgh-Bradford PA Public4-yr N SUNY College-Cortland NY Public 4-yr N U of Puerto Rico-Rio Piedras PR PublicU P SUNY College-Fredonia NY Public4-yr N U ofRicbmond VA Nonsectarian 4-yr N N

ParticiJ2ated ParticiJ2ated Institution State Tm 1992 1989 Institution State Tvne 1992 1989
U of Rio Grande OH Nonsectarian 4-yr N Woodbwy University CA Nonsectarian 4-yr N P U of Saint Thomas MN Catholic 4-yr N Worcester Polytechnic Institute MA Nonsectarian 4-yr N U of San Diego CA Private U N N U of San Francisco CA Catholic 4-yr N U of Science and Arts of Oklahoma OK Public4-yr N U of Scranton PA Catholic 4-yr N U of South Alabama AL Public4-yr N U of South Carolina-Spartanburg SC Public 4-yr N N U of South Dakota SD PublicU N U of Southern Mississippi MS Public4-yr N U of Tennessee-Chattanooga TN Public4-yr N U of Texas-Dallas TX Public 4-yr P U of Texas-EI Paso TX Public 4-yr P U of Texas-San Antonio TX Public 4-yr P Ulster County Cmty College NY Public 2-yr N Union University TN Protestant 4-yr N Universidad Interamericana de PR PR Nonsectarian 4-yr P N
...... US Military Academy NY Public4-yr N 0
'" Virginia Wesleyan College VA Protestant 4-yr N N
Washington State Cmty College OH Public 2-yr N Wayne State College NE Public4-yr N Weber State University UT Public 4-yr N Wesleyan University CT Nonsectarian 4-yr N N West Chester U of Pennsylvania PA Public4-yr N N West Texas State University TX Public4-yr N West Virginia Inst ofTecbnology WV Public 4-yr N West Virginia University WV PublicU N West Virginia Wesleyan College WV Protestant 4-yr N Westchester Cmty College NY Public 2-yr N N Western Carolina University NC Public4-yr N N Western Connecticut State U CT Public4-yr N Westmont College CA Nonsectarian 4-yr N N Wheaton College IL Nonsectarian 4-yr N N Whitman College WA Nonsectarian 4-yr N William Rainey Harper College IT.. Public2-yr N N Willmar Cmty College MN Public 2-yr N Wilmington College OH Protestant 4-yr N Wofford College SC Protestant 4-yr N N


Higher Education Research Institute Current Publications List
May, 1993
The American Freshman: Twenty-Five Year Trends ($25.00) Q Summarizes trends in the CIRP survey data between 1966 and 1990. The report's essay highlights academic skills and preparation, demographic trends, high school activities and experiences, education and career plans, and student attitudes and values. September, 1991/192 pages.
The American College Teacher Provides an informative profile of teaching faculty at American colleges and universities. Teaching, research activities and professional development issues are highlighted along with issues related to job satisfaction and stress.
National Norms for 1989-90 HER! Faculty Survey report. December,1990/104 pages $12.00 0
National Norms for 1992-93 HER! Faculty Survey report. May, 1993/109 Pages $20.00 0
The Black Undergraduate ($8.00) Q Current Status & Trends in the Characteristics 0/ Freshmen This study examines changes in the characteristics of black college freshmen during the past two decades. A wide variety of characteristics of black college freshmen are considered in the study: family background, academic experience in high school, reasons for attending college, finanical aid, choices of majors and careers, expectations for college, self-concept, values, attitudes, and beliefs. August, 1990/22 pages.
Predicting College Student Retention ($8.00) Q Comparative National Data/rom the 1982 Freshman Closs A practical guide for colleges interested in using registrar' s data to predict student retention. Focus is on the entering freshmen class of 1982 using results from the 1986 Follow-up Survey. March, 1989/110 pages.
The Courage and Vision to Experiment ($10.00) Q Hampshire College, 1970-1990 Summarizes the results of a study of Hampshire College, an experimenting liberal arts institution located in Amherst, Massachusetts. Through an analysis of alumni outcomes, the report emphasizes how the lessons learned from the innovative approach used at Hampshire can be translated to the higher education community at large. January, 1991/190 pages.
To Order:
The American College Student Provides information on the college student experience two and four years after college entry. Student satisfaction, talent development, student involvement, changing values and career development, and retention issues are highlighted along with normative data from student responses to the HERI Follow-up Surveys.
1991 report Normative data for 1987 and 1989 freshmen. August, 19921214 pages $15.00 Q
1990 report Normative data for 1986 and 1988 freshmen. October, 1991/196 pages $15.00 Q
1989 report Normative data for 1985 and 1987 freshmen. October, 1991/216 pages $15.00 Q
1988 report Normative data for 1984 and 1986 freshmen. August, 19901210 pages $15.00 Q
1987 report Normative data for 1983 and 1985 freshmen. September, 1989/130 pages $15.00 Q
1985 report Normative data for 1981 and 1983 freshmen. March, 1989/44 pages $14.00 Q
The American Freshman Provides national normative data for fIrst-time, full-time entering college freshmen.
~ ~ ~ ~ 1966 7.50 Q 1980 7.50 Q 1967 7.50 Q 1981 7.50 Q 1968 7.50 Q 1982 7.50 Q 1969 7.50 Q 1983 8.25 Q 1970 7.50 Q 1984 8.25 Q 1971 7.50 Q 1985 8.50 Q 1972 7.50 Q 1986 12.95 (out of stock) 1973 7.50 Q 1987 15.00 Q 1974 7.50 Q 1988 17.00 Q 1975 7.50 Q 1989 19.00 Q 1976 7.50 Q 1990 19.00 Q 1977 7.50 Q 1991 20.00 Q 1978 7.50 Q 1992 20.00 Q 1979 7.50 Q
(i) Photocopy this list, and indicate the publications you wish to receive by checking the appropriate boxes. C2> Please add $3.00 per book to the total for shipping and handling, books are shipped fIrst-class. @ Attach a personal or institutional check (o! institutional purchase order) to this list and return to:
Higher Education Research Institute, UCLA Graduate School of Education, 405 Hilgard Avenue, Los Angeles, CA 90024


