the aid debate - faculty support sitefaculty.ucr.edu/~jorgea/econ184/aid.pdf · the aid debate the...
TRANSCRIPT

ECON 184
The Aid Debate
The Aid Debate February 25, 2010 1

Contents
1 Definitions and background 3
1.1 Type of aid (by source) . . . . . . . . . . . . . . . . . 4
1.2 Official Development Assistance (ODA) . . . . . . . . 5
1.3 Alternative classifications . . . . . . . . . . . . . . . . 6
2 Main actors and players 7
3 Trends 15
4 Aid and economic growth 26
The Aid Debate February 25, 2010 2

1 Definitions and background
The Aid Debate February 25, 2010 3

1.1 Type of aid (by source)
• Private
– Non-governmental organizations (NGOs)
– Churches
– Individuals
– Companies
– Foundations
• Official (ODA)
– Bilateral; country-to-country
– Multilateral: UN, World Bank, IMF, etc. . .
The Aid Debate February 25, 2010 4

1.2 Official Development Assistance (ODA)
• ODA includes all official aid.
• . . . minus military aid and loan repayments
The Aid Debate February 25, 2010 5

1.3 Alternative classifications
• By type of flow
– Goods
– Cash grants
– Concessional finance.
• By recipient
– Governments
– Individuals
– Institutions
• By aim
– Development and growth
– Political evolution
– Emergency relief or stabilization after economic shocks
The Aid Debate February 25, 2010 6

2 Main actors and players
• Bilateral
– USAID
– DFID
The Aid Debate February 25, 2010 7

The Aid Debate February 25, 2010 8

The Aid Debate February 25, 2010 9

• Multilaterals
– World Bank Group
– International Monetary Fund
– African Development Bank
The Aid Debate February 25, 2010 10

– UN Agencies
The Aid Debate February 25, 2010 11

The Aid Debate February 25, 2010 12

Aid target
Source: Moss (2007)
The Aid Debate February 25, 2010 13

Millennium Development Goals
Source: Moss (2007)
The Aid Debate February 25, 2010 14

3 Trends
The Aid Debate February 25, 2010 15

Trends in total aid
0
10
20
30
40
50
60
70
80
90
100
1975
1976
1977
1978
1979
1980
1981
1982
1983
1984
1985
1986
1987
1988
1989
1990
1991
1992
1993
1994
1995
1996
1997
1998
1999
2000
2001
2002
2003
2004
Bil
lio
n U
S$
0.00
0.05
0.10
0.15
0.20
0.25
0.30
0.35
0.40
% o
fG
NI
Percent of donor GNI
(right-hand scale)
Real value (constant 2004
US$) (left-hand scale)
Nominal value (current US$)
(left-hand scale)
Figure 1. Global ODA 1975-2004
Source: OECD/DAC database
Source: Radelet (2006)
The Aid Debate February 25, 2010 16

Aid in Africa
Total flows of aid to Africa (constant 2006 dollars)
-
5,000,000,000
10,000,000,000
15,000,000,000
20,000,000,000
25,000,000,000
30,000,000,000
35,000,000,000
40,000,000,000
1960
1962
1964
1966
1968
1970
1972
1974
1976
1978
1980
1982
1984
1986
1988
1990
1992
1994
1996
1998
2000
2002
2004
2006
Source: Easterly (2008).
The Aid Debate February 25, 2010 17

Africa vs rest of the worldAid to Gross National Income in Africa and Other Developing Countries
0
2
4
6
8
10
12
14
16
18
20
1960
1962
1964
1966
1968
1970
1972
1974
1976
1978
1980
1982
1984
1986
1988
1990
1992
1994
1996
1998
2000
2002
2004
Aid
to
Gro
ss
Nati
on
al In
co
me
(%
)
Africa
Non-Africa
The Aid Debate February 25, 2010 18

Africa vs rest of the world
Source: Moss (2007).
The Aid Debate February 25, 2010 19

Recipients of aid (Radelet, 2006)
The Aid Debate February 25, 2010 20

Table 1. Major Aid Recipients, 2004Total ODA (millions US$)
1. Iraq 4,658
2. Afghanistan 2,190
3. Viet Nam 1,830
4. Ethiopia 1,823
5. Congo, Dem. Rep. 1,815
6. Tanzania 1,746
7. China 1,661
8. Egypt 1,458
9. Pakistan 1,421
10. Bangladesh 1,404
Aid as % ofThe Aid Debate February 25, 2010 21

10. Bangladesh 1,404
Aid as % of
recipient GNI
1. Sao Tome & Principe 67
2. Guinea-Bissau 64
3. Micronesia 47
4. Eritrea 42
5. Timor-Leste 42
6. Marshall Islands 41
7. Burundi 39
8. Afghanistan 35
9. Sierra Leone 32
10. Malawi 31
The Aid Debate February 25, 2010 22

10. Malawi 31
Aid per capita (US$)
1. Nauru 1368
2. Mayotte 1226
3. Palau 978
4. Marshall Islands 852
5. Tuvalu 801
6. Micronesia, Fed. States 719
7. Cook Islands 438
8. Dominica 417
9. Palestinian Adm. Areas 337
10. Cape Verde 298
Source: OECD 2005 Development Cooperation Report
The Aid Debate February 25, 2010 23

Table 2. Official aid receipts by region, 2004
Billionsof US$
Percentof GNI
$ perperson
Sub-Saharan Africa 26.0 5.3 35.8
South Asia 6.8 0.8 4.7
East Asia & Pacific 6.9 0.3 3.7
Europe & Central Asia 11.9 0.7 25.1
Middle East & North
Africa 10.5 1.7 35.0
Latin America &
Caribbean 6.9 0.4 12.6
Low income 34.0 2.8 14.5
Lower middle income 23.4 0.6 9.6
Upper middle income 6.8 0.2 11.7
Source: World Development Indicators online
The Aid Debate February 25, 2010 24

Top African recipients
Source: Moss (2007)
The Aid Debate February 25, 2010 25
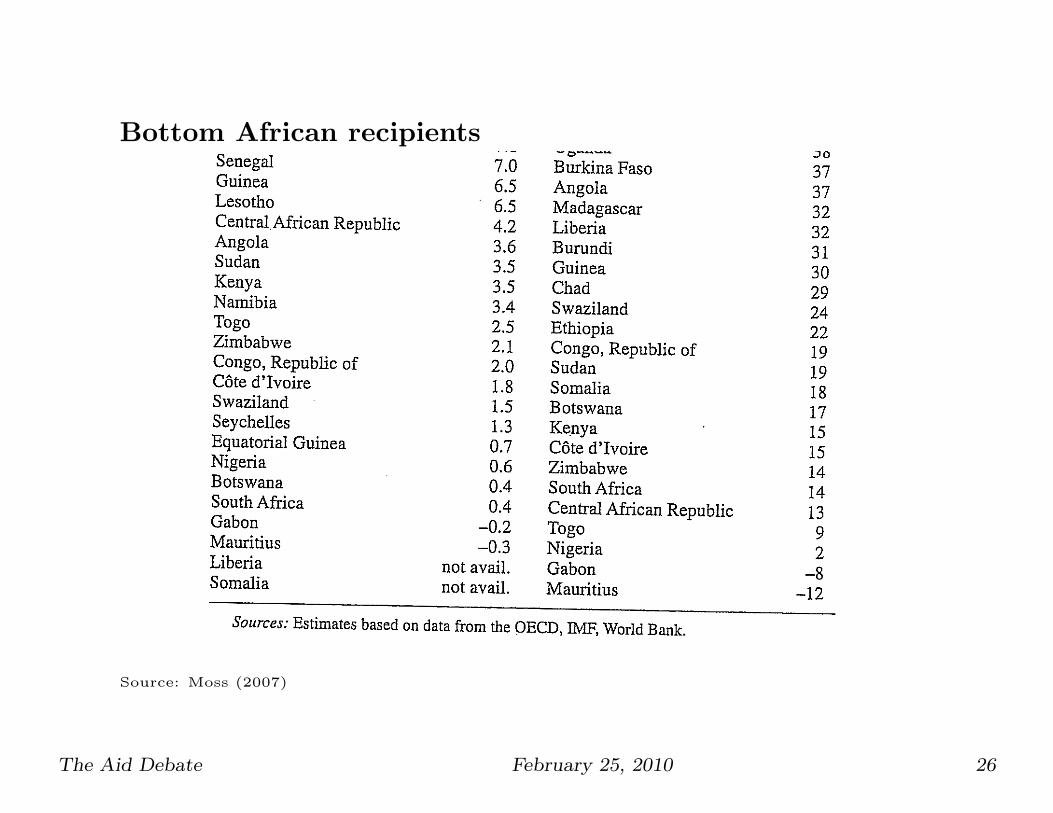
Bottom African recipients
Source: Moss (2007)
The Aid Debate February 25, 2010 26

4 Aid and economic growth
The Aid Debate February 25, 2010 27

The Solow model again
• Framework to justify aid.
• Let’s go back to the Solow model
The Aid Debate February 25, 2010 28

d+n
sf(k)/k
k* k
• In this model there is a unique equilibrium
The Aid Debate February 25, 2010 29

Multiple equilibria
Several factors can create multiple equilibria in this model.
1. Variable saving rate
• Suppose that s = s(y, r)
• s is the saving rate, y is income and r is the interest rate
(MPK)
• Thus, s = s(k) and it’s not longer a constant.
• This leads to a new curve
The Aid Debate February 25, 2010 30

n+d
s(k)f(k)/k
k* k*** k** capital
• Economies are identical except for their initial conditions.
• There is no global equilibrium. There are two local ones.
The Aid Debate February 25, 2010 31

2. Non-convexities
• Assume that s is fixed, just like in the original Solow model.
• Non-convexities arise when the APK is nonlinear due to
technical reasons.
• Or when there are two technologies available.
• . . . but firms can only use one at a time.
• In both cases the s f(k)k will follow the pattern shown above.
The Aid Debate February 25, 2010 32

Poverty traps?Table 1: International Disparities in GDP per Worker
Country Population(m, 2000) R1960 R2000
USA 275 1 1
United Kingdom 60 .69 .69
Argentina 37 .62 .40
France 60 .60 .76
Italy 58 .55 .84
South Africa 43 .47 .34
Mexico 97 .44 .38
Spain 40 .40 .68
Iran 64 .30 .30
Colombia 42 .27 .18
Japan 127 .25 .60
Brazil 170 .24 .30
Turkey 67 .17 .24
Philippines 76 .17 .13
Egypt 64 .17 .21
Korea, Republic of 47 .15 .57
Bangladesh 131 .10 .10
Nigeria 127 .08 .02
Indonesia 210 .08 .14
Thailand 61 .07 .20
Pakistan 138 .07 .11
India 1016 .06 .10
China 1259 .04 .10
Ethiopia 64 .04 .02
Mean .29 .35
Median .21 .27
Notes:
- R is GDP per worker as a fraction of that in the USA.
The Aid Debate February 25, 2010 33

Figure 2: Output Per Worker: 1960 versus 2000
TWN
BWA
HKG
KOR
SGP
THA
CYPJPN
CHN
ROM
MUSMYS
PRT
IDN
ESP
PAK
GRC
COG
AUTITA
IND
SYR
FIN
GABTUR
ISR
BEL
DOM
FRA
EGY
LSO
BRA
NOR
MAR
LKA
PAN
MWI
NPL
BGD
IRN
CHL
GBR
USA
DNK
TTO
NLDSWE
AUS
GNB
CAN
MEX
ZWE
JOR
ECU
GTM
UGA
NAM
CIV
PHL
BFA
FJI
GMB
PNG
ZAF
GUY
TZA
URY
PRY
KENGHA
COL
ARG
ETH
SLVCRI
BEN
GINHND
CMR
BDI
TGO
JAM
RWA
BOL
PER
MRT
SEN
TCD
MOZMDG
ZMB
MLI
VEN
NER
NGA
NIC
CAFAGO
ZAR
.2.4
.6.8
1Log G
DP
per
work
er
rela
tive t
o U
SA
, 2000
.2 .4 .6 .8 1Log GDP per worker relative to USA, 1960
Relative GDP per worker
Source: Durlauf et. al (2005)
The Aid Debate February 25, 2010 34

In his calculation, Quah uses per capita GDP relative to the world average over the pe-
riod 1962 to 1984 in a sample of 118 countries. Relative income is discretized into state
space S := {1, 2, 3, 4, 5} consisting of 5 “bins”, with states corresponding to values for
relative GDP of 0–0.25, 0.25–0.5, 0.5–1, 1–2 and 2–∞ respectively. The transition ma-
trix P = (pij ) is computed by setting pij equal to the fraction of times that a country,
finding itself in state i, makes the transition to state j the next year. The data is assumed
to be stationary, so that all of the transitions can be pooled when calculating transition
probabilities. The result of this calculation [Quah (1993, p. 431)] is
P =
0.97 0.03 0.00 0.00 0.00
0.05 0.92 0.03 0.00 0.00
0.00 0.04 0.92 0.04 0.00
0.00 0.00 0.04 0.94 0.02
0.00 0.00 0.00 0.01 0.99
.
Th M k h i d b P i il h b di i h h h
Azariadis & Stachurski (2005) Handbook of Economic Growth, Chapter 5: Poverty Traps
The Aid Debate February 25, 2010 35

The Aid Debate February 25, 2010 36

334 C. Azariadis and J. Stachurski
The Aid Debate February 25, 2010 37

Correlates
The Aid Debate February 25, 2010 38

Aid and growthFigure 2. Foreign aid and growth, 1994-2004
-4
-2
0
2
4
6
8
10
0 5 10 15 20 25 30 35 40
ODA % of GDP
GD
P p
er
ca
pit
a g
row
th,
%
Source: Radelet (2007)
The Aid Debate February 25, 2010 39

Aid and growth
Source: Moss (2007)
The Aid Debate February 25, 2010 40

Burnside and Dollar, 2002
• Is the effect of aid on growth conditional of economic policies?
• Do donor governments and agencies allocate more aid to
countries with good policies?
• These two are important question and BD (2002) try to answer
them both.
The Aid Debate February 25, 2010 41

Empirical strategy
• To answer the first question, the authors will estimate the
following equation
git = α+ βAIDit + θPolicyit + γXit + ηt + ϵit (1)
• git is the percapita growth rate of country i in period t.
• AID is AIDGDP
• Policy and index of “good” policies (budget surplus, inflation
and openness).
• Xit are controlled variables.
git = α+βAIDit+θPolicyit+γ(AIDit×Policyit)+γXit+ηt+ϵit(2)
• Question: can we obtained unbiased parameters for β? What
about γ?
The Aid Debate February 25, 2010 42

Data sources
• New data from the World Bank on aid.
• Sample of 56 countries and six four-year time periods from
1970-73 to 1990-93.
• There are 21 African countries.
• All major aid recipients in other regions are included.
• They also concentrate on lower income countries: those with
GDP percapita lower than $1,900 in 1970.
• The sample is then reduced to 40 countries.
The Aid Debate February 25, 2010 43

Empirical strategy
• The authors recognize the “endogeneity” of aid.
• Two questions for you:
– How can aid be endogenous?
– How could you solve this problem?
The Aid Debate February 25, 2010 44

Empirical strategy (II)
• The authors will use instrumental variables.
• The key idea is that AID is endogenous.
• They also created an index for “good” policies.
Policy = 1.28+6.85×Budget surplus−1.40×Inflation+2.16×Openness.
• However, they will treat the policy index as exogenous. Do you
agree?
The Aid Debate February 25, 2010 45

Variables
The Aid Debate February 25, 2010 46

Results
The Aid Debate February 25, 2010 47

The Aid Debate February 25, 2010 48

The Aid Debate February 25, 2010 49

What explains aid?
• Now the focus is on the variables that correlate with aid.
• The new equation is
AIDit = α2 + λPolicyit + πXit + ψt + uit (3)
The Aid Debate February 25, 2010 50

Correlates of aid
The Aid Debate February 25, 2010 51

Big impacts on policy
The Aid Debate February 25, 2010 52

New evidence
• Easterly, Levine and Roodman (2004) collected more data.
• BD data ended in 1993 while ELR expanded it to 1997
The Aid Debate February 25, 2010 53

The Aid Debate February 25, 2010 54

Partial association (BD)
The Aid Debate February 25, 2010 55

The Aid Debate February 25, 2010 56

Sources
• Radelet, S. (2006) “A Primer on Foreign Aid” CGD Working
Paper 92.
• Easterly, W. (2008) “Can the West Save Africa?” NBER
Working Paper 14636.
• Burnside and Dollar (2000) “Aid, Policies, and Growth”,
American Economic Review, 90(4): 847-868, September.
• Easterly, W.; R. Levine and D. Roodman (2004) “Aid, Policies,
and Growth: Comment” American Economic Review, 94(3):
774-780.
The Aid Debate February 25, 2010 57