the accretion mechanism in low-power radio galaxies. arxiv
TRANSCRIPT

arX
iv:0
805.
3920
v1 [
astr
o-ph
] 2
6 M
ay 2
008
Astronomy & Astrophysics manuscript no. 9810 October 11, 2021(DOI: will be inserted by hand later)
The accretion mechanism in low-power radio galaxies.
Barbara Balmaverde1, Ranieri D. Baldi2 and Alessandro Capetti1
1 INAF - Osservatorio Astronomico di Torino, Strada Osservatorio 20, I-10025 Pino Torinese, Italye-mail: [email protected]: [email protected]
2 Universita di Torino, Via P. Giuria 1, I-10125, Torino, Italye-mail: [email protected]
Abstract. We study a sample of 44 low-luminosity radio-loud AGN, which represent a range of nuclear radio-powerspanning 5 orders of magnitude, to unveil the accretion mechanism in these galaxies. We estimate the accretionrate of gas associated with their hot coronae by analyzing archival Chandra data, to derive the deprojected densityand temperature profiles in a spherical approximation. Measuring the jet power from the nuclear radio-luminosity,we find that the accretion power correlates linearly with the jet power, with an efficiency of conversion from restmass into jet power of ∼ 0.012. These results strengthen and extend the validity of the results obtained by Allenand collaborators for 9 radio galaxies, indicating that hot gas accretion is the dominant process in FR I radiogalaxies across their full range of radio-luminosity.We find that the different levels of nuclear activity are driven by global differences in the structure of the galactichot coronae. A linear relation links the jet power with the host X-ray surface brightness. This implies that asubstantial change in the jet power must be accompanied by a global change in its ISM properties, driven forexample by a major merger. This correlation provides a simple widely applicable method to estimate the jet-powerof a given object by observing the intensity of its host X-ray emission.To maintain the mass flow in the jet, the fraction of gas that crosses the Bondi radius reaching the accretion diskmust be & 0.002. This implies that the radiative efficiency of the disk must be η . 0.005, an indication thataccretion in these objects occurs not only at a lower rate, but also at lower efficiency than in standard accretiondisks.
Key words. galaxies: active, galaxies: jets, galaxies: elliptical and lenticular, cD, galaxies: ISM
1. Introduction.
A fundamental problem in studying the physics of activegalactic nuclei (AGN) identifying the mechanism that con-trols the level of activity. More generally, we need to de-termine why nuclear activity occurs in active galaxies butnot in quiescent galaxies, and whether there is a disconti-nuity in the physical properties of these two galaxy classes.Addressing these points is also important in light of theprominent role that AGN feedback plays in the process ofgalactic evolution. Furthermore, AGN activity is relatedto the growth, via accretion, of supermassive black holes(SMBH); the clear evidence for a co-evolution of SMBHand host galaxies, represented by the connections betweengalaxy physical properties and SMBH mass, implies thatthe accretion process in AGN has a powerful influence ongalaxy evolution.
Several comparisons between the properties of activeand quiescent galaxies have been performed with in at-
Send offprint requests to: B. Balmaverde
tempts to isolate the quantities that correlate most sig-nificantly with the level of nuclear activity. We limitourselves to radio-loud galaxies in this paper. Since theresearch of for example Auriemma et al. (1977) it hasbeen known that the probability of an object to havea radio luminosity above a certain threshold is propor-tional to its optical luminosity. This was confirmed bystudies of the bivariate radio/optical luminosity functionof early-type galaxies (Best et al. 2005; Mauch & Sadler2007). Objects of a given optical luminosity can be as-sociated with radio sources spanning a large range of ra-dio power. Several authors explored the role of environ-ment in setting the level of radio-emission. The fractionof radio-loud AGN is largely independent of the localgalaxy density, but a dependence is found on the larger-scale environment (Best 2004). A statistical trend linksthe amount of dust measured from the absorption fea-tures, seen in their optical images, and radio-power (e.g.de Ruiter et al. 2002). Valentijn & Bijleveld (1983) founda positive correlation between the X-ray luminosity of the
2 Balmaverde et al.: The accretion mechanism in radio galaxies
hosting cluster and the radio-luminosity of the dominantcluster galaxy. Similarly, Burns (1990) showed that cen-tral, massive galaxies in clusters or groups of galaxies witha cooling flow are more likely to be radio-loud AGN thangalaxies of similar mass that are not centered on a coolingflow, suggesting that concentrated cooling atmospherescan stimulate radio-loud AGN activity. These studies pro-vide statistically important results, but it is still impos-sible to ascertain from any of these measurements, on anobject-by-object basis, whether a galaxy hosts an activenucleus. This implies that we cannot yet associate an ob-servable quantity and, consequently, physical process withthe level of nuclear activity.
Substantial progress was reported by Allen et al.(2006). They studied 9 nearby, low-power radio galaxies,selecting objects with well-defined cavities in X-ray emit-ting gas, which were cospatial with the radio-lobes: thesecavities were most likely inflated by radio-jets. They wereable to estimate the jet, kinetic power required to inflatethe cavities. On the other hand, it was possible, using thesame X-ray images, to estimate the amount of hot gasavailable for accretion onto the SMBH. This analysis re-vealed a significant correlation between the accretion rateand jet power, which had a dispersion of only 0.16 dex.This represents not only an accurate and powerful methodto predict the AGN energy output, but implies that spher-ical hot-gas, accretion, associated with the hot corona, isthe main energy source powering the active nucleus.
We extend the analysis performed by Allen et al.(2006) to two samples of galaxies that host radio-loudnuclei of relatively low-power, which cover almost fiveorders of magnitude in radio-power. The comparison ofaccretion properties across the widest possible range ofluminosity is clearly the next crucial step in unveilingthe connections (and diversities) between galaxies show-ing different levels of nuclear activity. We examine datafor the sample of 29 early-type “core” galaxies, selectedby Balmaverde & Capetti (2006), and for the sample of33 FR I radio galaxies, which were extracted from the 3Csample as defined in Chiaberge et al. (1999); in the com-bined set of galaxies 44 have observational data in theChandra archive (more details of the sample selection aregiven in Sect. 2). With respect to Allen et al. (2006) we es-timated the jet power using a relation between radio-coreluminosity and jet kinetic power derived by Heinz et al.(2007). This relation provides a straightforward, robustmeasure of the jet power (with an rms error of 0.4 dex),based only on the core power, and enables the numberof objects for which accretion and jet power can be com-pared, to be increased. Furthermore, the range of radio-power that can be studied covers almost five orders ofmagnitude; this corresponds to the full range of radio-luminosity of FR I, spanning from the faintest level ofdetectable activity in radio galaxies up to include galaxieswhose radio-emission exceeds the luminosity marking thetransition between FR I and FR II objects.
2. Sample selection and data preparation
In Capetti & Balmaverde (2005), we focused on a sam-ple of luminous, nearby early-type galaxies to study thelink between their host properties and the active nucleus.We used archival HST observations to analyze their sur-face brightness profiles and to separate these early-typegalaxies into core and power-law galaxies on the basisof the slope of their nuclear brightness profiles, follow-ing the Nuker scheme (Lauer et al. 1995). We obtained asub sample of 29 “core” galaxies (hereafter CoreG), that isgalaxies for which the surface-brightness profiles were fit-ted with a double power-law of innermost slope γ ≤ 0.3. InBalmaverde & Capetti (2006) we demonstrated that theCoreG hosted a radio-loud nucleus and that they couldbe considered to be miniature radio galaxies. In fact, theyare drawn from the same population of early-type galax-ies as the FR I hosts, according to of the surface bright-ness profiles, and distributions of optical luminosities andblack-hole masses, they differ from “classical” FR I ra-dio galaxies only in terms of their lower level of nuclearactivity.
We combine these CoreG with a sample of low-luminosity radio galaxies of morphology FR I extractedfrom the 3C catalogue of radio-sources (Bennett 1962) ina way defined by Chiaberge et al. (1999). Three galaxies(namely 3C 270, 3C 272.1, and 3C 274) are in commonbetween the two samples1. All 9 galaxies (with the excep-tion of NGC 507) considered by Allen et al. (2006) are incommon with our combined FR I/CoreG sample.
We searched for Chandra observations available in thepublic archive up to August 2007 and found data for 22 ofthe 33 objects belonging to the FR I sample: with respectto the sample considered by Balmaverde et al. (2006), wewere able to add three sources observed, 3C 264, 3C 293,and 3C 442. We found data for 24 of the 29 CoreG:with respect to (Balmaverde & Capetti 2006) newly ob-tained observations were found for UGC 0968, UGC 7797,UGC 8745. All together, we consider 44 galaxies that havea range of nuclear radio-power covering 5 orders of mag-nitude. The information on the Chandra observations andbasic data for these galaxies are presented in Table 1.
We reduced all data using the Chandra Data analy-sis CIAO v3.4, with the CALDB version 3.3.0. We repro-cessed the data from level 1 to level 2 in the standard way,that is using the CIAO tool acis process events, removingbad pixels and applying pixel and PHA randomization.When possible, we improved the rejection of cosmic eventsfor VFAINT mode observations. We rejected time inter-vals corresponding to high background levels and we fil-tered by selecting a standard set of ASCA grades (02346).
We modeled the spectra obtained using XSPEC ver-sion 12.3.0. We used only events filtered between 0.3 and 8keV for our analysis and rebinned the spectrum to a min-imum of 20 counts per bin to ensure that a χ2 statisticscould be applied.
1 For simplicity, we include these sources in Table 1 in theFR I sample.

Balmaverde et al.: The accretion mechanism in radio galaxies 3
Table 1. Basic data and Chandra observations log.
Name Chandra summary Basic DataObs. Id Exp. time D Log ν Lcore σ MK Log (MBH/M⊙)
3C 028 3233 50.38 666.7 <38.86 – -25.71 8.993C 031 2147 44.98 67.15 39.40 278 -25.65 8.703C 066B 828 45.17 83.68 39.90 – -26.42 9.323C 075 4181 21.78 91.0 39.30 301 -25.71 8.843C 078 3128 5.23 112.1 40.88 271 -26.18 8.613C 083.1 3237 95.14 98.65 39.10 – -26.84 9.513C 084 3404 5.86 69.31 42.10 259 -26.08 8.583C 189 858 8.26 165.8 40.54 – -26.22 9.233C 264 4916 38.33 85.46 39.91 271 -25.17 8.67
3C 270 834 35.18 29.69 39.22 309 -25.10 8.72b
3C 272.1∗ 803 28.85 14.11 38.57 282 -24.53 9.00b
3C 274∗ 1808 14.17 17.38 39.90 333 -25.39 9.53b
3C 293 5712 3.10 174.1 40.29 185 -25.36 8.143C 296 3968 50.08 96.99 39.62 299 -26.17 8.803C 317 890 37.23 134.3 40.64 216 -26.09 8.263C 338∗ 497 19.72 118.7 39.96 310 -26.50 8.893C 346 3129 46.69 569.3 41.74 – -26.03 9.143C 348 1625 15.00 544.9 40.36 – -26.13 9.193C 438 3967 47.9 907.7 41.14 – -26.47 9.343C 442 6392 33.13 103.1 38.12 – -24.39 8.403C 449 4057 29.56 67.46 39.06 253 -24.96 8.543C 465 4816 50.16 118.1 40.37 356 -26.64 9.14
UGC 0968 6778 15.14 32.39 36.94 253 -25.39 8.54
UGC 5902 1587 31.9 12.68 35.83 207 -24.25 8.00b
UGC 6297 2073 39.0 13.63 36.46 224 -23.68 8.33UGC 7203 3995 5.13 31.89 37.44 184 -24.08 7.98UGC 7386 398 1.43 10.72 38.38 238 -22.97 8.43UGC 7629∗ 321 40.1 12.53 37.73 291 -25.09 8.78UGC 7760∗ 2072 55.14 5.227 37.30 253 -21.86 8.54UGC 7797 6785 15.19 29.77 38.05 224 -24.61 8.33UGC 7878∗ 323 53.05 14.83 36.90 203 -24.43 8.16
UGC 7898 785 37.35 16.41 37.46 336 -25.34 9.30b
UGC 8745 6787 15.18 27.95 37.81 232 -25.07 8.39UGC 9706∗ 4009 30.79 25.28 37.31 238 -25.06 8.43UGC 9723 2879 34.18 13.79 36.92 159 -23.82 7.73NGC 1316 2022 30.23 20.64 37.82 228 -25.99 8.36NGC 1399 319 56.66 16.23 37.20 344 -24.75 9.07NGC 3557 3217 371.99 38.09 37.94 273 -25.70 8.67NGC 4696∗ 1560 85.84 36.89 38.65 254 -25.69 8.55
NGC 5128 463 19.6 5.2 39.05 120 -24.64 8.38b
NGC 5419 4999 15 53.92 38.42 332 -26.14 9.02
IC 1459 2196 60.17 19.97 39.38 306 -24.70 9.18b
IC 4296 3394 25.4 48.17 39.46 336 -25.69 9.04
NGC 507∗ 2882 44.21 65.02 36.45 310 8.688 8.89
Basic data and Chandra observations log for the radio galaxies of the 3C/FR I and CoreG sample (with the addition ofNGC 507). Objects from the Allen’s sample (marked with *). Column description: (1) name, (2) Chandra observationalidentification number, (3) exposure time [ks], (4) distance [Mpc], (5) nuclear radio luminosity (5GHz) [erg s−1], (6) stellar
velocity dispersion [km s−1] from the HyperLeda database, (7) total K band galaxy’s absolute magnitude from 2MASS (exceptfor 7 sources, see Sec. 3.3), (8) logarithm of black-hole mass in solar unity (see text for details).
We adopt Ho=75 km s−1 Mpc−1 and qo=0.5.
3. Calculation of the Bondi accretion rates
Under the assumption of spherical symmetry and negligi-ble angular momentum, the accretion rate onto a SMBH
can be estimated by the Bondi (1952) approximation as:
MB = π λ cs ρB rB2
where λ takes the value of 0.25 for an adiabatic index 5/3,cs is the sound speed in the medium (cs =
√
Γ k T /µmp),
rB = 2GMBH
cs2 is the Bondi accretion radius, and ρB is thegas density at that radius, (ρ = 1.13nemp), so that
4 Balmaverde et al.: The accretion mechanism in radio galaxies
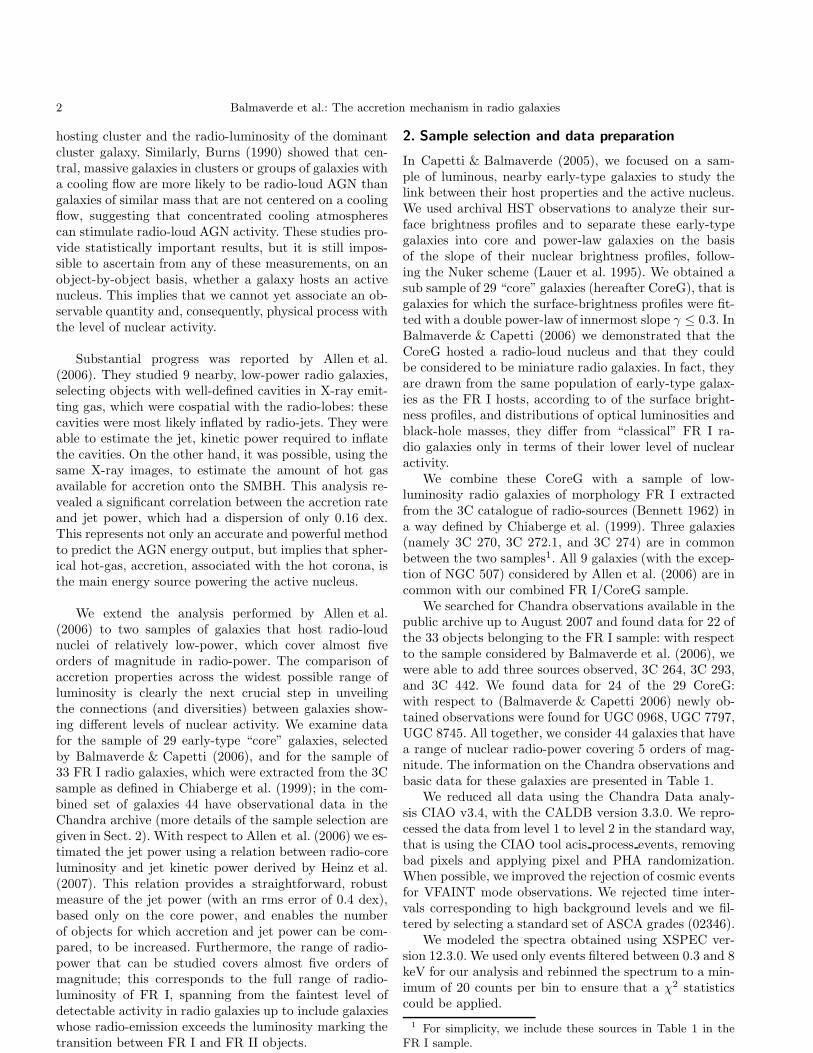
Fig. 1. Example of the procedure followed to determine the Bondi power for NGC 7898: in the leftpanel, we show the spectrum extracted in four annuli, centered on the nucleus, that was modeled with aPROJECT*PHA(MEKAL+POWERLAW) law; in the right panel, we show the corresponding deprojected tempera-ture profile of the annuli.
MB =4.52πλG2mp
( Γµmp
)3/2ne M
2BH (kT )−3/2
The calculation of the Bondi accretion rate then re-quires the measurement of three quantities: the electrongas density at the Bondi radius, the gas temperature atthe same radius, and the mass of the central black hole.
Unfortunately not even the Chandra telescope, whichprovides presently the highest angular resolution in X-rays, is able to resolve the accretion radius in most galax-ies. Different strategies have been devised to estimate thegas and temperature density at the accretion radius. Forexample, Gliozzi et al. (2003) fitted the electron densityprofile with a model of gas in isothermal, hydrostatic equi-librium in spherical symmetry. Hardcastle et al. (2007) de-rived the Bondi power for radio galaxies from the 3CRRcatalogue, adopting density and temperature values com-parable to that typically measured (ρ = 5 105 m−3 andkT = 0.7 keV) in nearby FR I. However, the results ofAllen et al. (2006) indicated strong departures from equi-librium profiles and large variations in the central gasdensities, suggesting that the accretion rates derived withthese assumptions can be affected by large errors.
In this work, we determine the Bondi accretion ratefollowing the same technique as Allen et al. (2006) andBırzan et al. (2004), which is described in detail below.Briefly, we deproject the temperature and electron densityprofile, assuming spherical symmetry. We then extrapo-late the measured density to the accretion radius and de-scribe the density profile with a power-law, assuming that
the temperature is constant inside the innermost measure-ment radius. Given the temperature, the electron densityat the accretion radius, and the black-hole mass, we cal-culate the Bondi accretion.
3.1. The IGM temperature profile
To characterize the thermal and emissivity properties ofthe intergalactic hot gas, we extract the spectrum in fourannuli (see Fig. 1, left panel) centered on the peak of X-rayemission. Since a X-ray point source associated with theAGN is present in most galaxies, we extract the spectrumof the IG medium avoiding the innermost region within aradius of 1.′′5. The outer radius is set to where the diffuseemission reaches the background level.
To measure the dependence of temperature on radius,we deproject the spectra by assuming spherical symmetryand using the PROJECT model in XSPEC. This modelprojects prolate ellipsoidal shells onto elliptical annuli, cal-culating the projection matrix of each of the overlyingshells onto the area of each annulus and computing thetotal projected emission on that annulus. The fitting oc-curs simultaneously for all annuli and, after completion,the model provides the best-fitting temperature and abun-dance values in each shell (Fig. 1, right panel). We adopta single-temperature plasma model (MEKAL) and fore-ground absorption (PHABS), taking into account projec-tion effects, that is the model PROJECT*PHA(MEKAL).The hydrogen column density was tied between annuli andallowed to vary. With this fitting procedure we determine
Balmaverde et al.: The accretion mechanism in radio galaxies 5
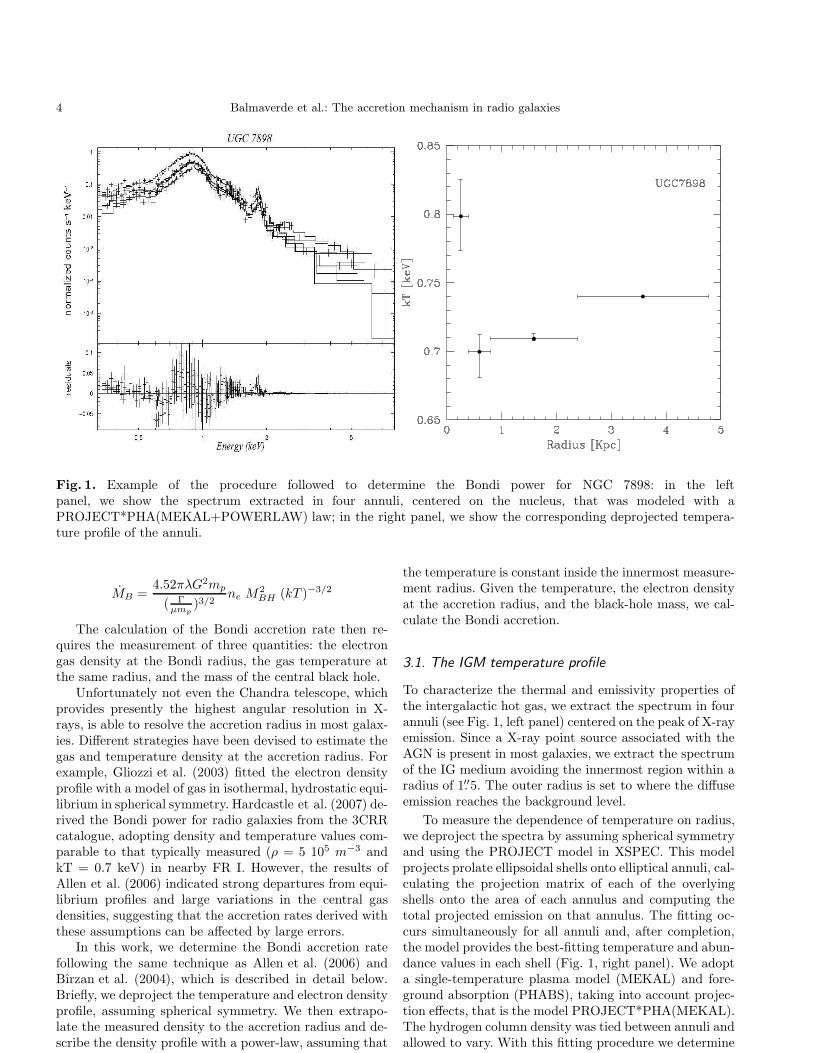
Fig. 2. Example of the procedure followed in this work to determine the Bondi power for NGC 7898: in the left panel,we present the X-ray surface brightness profile of the galaxy; in the right panel, we show the derived deprojectedelectron density profile and the power-law extrapolation used to estimate its value at the Bondi radius (marked witha diamond).
the deprojected profile of temperature. We then assumethat the temperature measured inside the innermost an-nulus (usually bound between 1.′′5 and 5′′ in radius) is agood estimate of the temperature at the Bondi radius (seeTable 2).
3.2. The electron density profile
We determine the X-ray surface brightness profile (SBP)extracting, the counts in a series of circular annuli cen-tered on the central AGN (see Fig. 2, left panel, for anexample; all SBP are shown in the Appendix A (Fig. A.1).When present, we mask the X-ray jet and other unrelatedsources; we then subtract the background measured farfrom the source of interest. To avoid contamination fromnon-thermal emission due to the central AGN, we excludethe inner 1.5 arcsec region. When a point source is present,we use the PSF libraries to create an image of the PSF forthe specific observation. We normalize it to the source fluxin a circle of 1 arcsec centered on the peak of the emissionand subtract the wings of the PSF brightness profile fromthe profile of the source.
As a general rule, we extract the X-ray counts from 4annuli in the first 5 arcsec, then increase the size of theextraction region outward. For weaker sources, we use acoarser sampling of the brightness profile to maintain suf-ficient signal-to-noise ratio. The next step is to deprojectthe observed SBP, to derive the number of counts emit-ted per unit volume as a function of radius. Assumingspherical symmetry, the counts contribution provided by
each spherical shell to the inner ones can be determined bypure geometric considerations, following the calculation byKriss et al. (1983). Briefly, we express the observed SBPas a matrix product between the deprojected count rate inthe spherical shell and a weight matrix, defined as the por-tion of volumes of each overlying shell seen in projectionon each annulus.
Our aim is to compare the observed counts per unitvolume, with the theoretical value expected for a ther-mal plasma of a specific electron density and metal abun-dances. The XSPEC fitting model provides us with thevalue of the thermal normalization and the model pre-dicted count rates (deprojected) in each of the annuli.Comparing these values with the counts per unit volumeobtained by deprojecting the SBP, we adjust the thermalnormalization to recover the counts emitted in each of thecircular annuli used for the spatial analysis. The densitywas then calculated from the normalization of the ther-mal component, assuming ne = 1.2nH (for a fully-ionizedgas). The definition of the thermal normalization is
K =10−14
4πD2A(1 + z)2)
∫
nenpdV
where z is the redshift of the source, DA is the angular-diameter distance at that redshift, ne and np are the elec-tron and proton number-density, respectively, and the in-tegration is performed over the volume of the projectedshells. Assuming a uniform density distribution along theshell, we invert this equation to solve for the electron den-sity. Iterating this procedure for each spherical shell, we

6 Balmaverde et al.: The accretion mechanism in radio galaxies
obtain the electron density profile (see Fig. 2, right panel,for an example; all profiles are shown in the Appendix A,Fig. A.2).
To estimate the gas density at the accretion radii, weperform a fit on the innermost points of the density profilein a power-law form, ne(r) ∼ r−α, following Allen et al.(2006) and as explained in more detail in Sect. 3.5.
3.3. The black-hole mass
The mass of the central black hole can be determined invarious ways: when available, we prefer to use the BH massestimates obtained from direct gas or stellar dynamicalmeasurements listed in Marconi & Hunt (2003).
Otherwise, we derive the SMBH masses usingthe stellar velocity dispersion (from the HyperLedadatabase database). We apply the relation derived byTremaine et al. (2002):
log (MBH/M⊙)=8.13 + 4.02 log (σ / 200 km s−1)
which has an intrinsic dispersion of about 0.23 dex.Alternatively, for the 7 objects for which velocity disper-sion measurement is unavailable, we estimate the SMBHmass using the K-band absolute total magnitude (from2MASS data archive2) by using the relation derived byMarconi & Hunt (2003):
log (MBH/M⊙) = 8.21 + 1.13 (log LK -10.9).
The observed scatter in this case is ∼ 0.5 dex.
3.4. Error budget
The uncertainties in the results of the deprojection wereestimated using a Monte Carlo simulations. We perturbedrandomly each point of the SBP with a Gaussian distri-bution of the perturbations, which had an amplitude de-termined by the error bar. We obtained 1000 different re-alizations of the SBP. Each of them was deprojected, andwe evaluated, in each shell, the mean value of the countsrate and the scatter. Then we propagate the errors in thecalculation of the electron density, taking into account theerrors in the counts rate and in the temperature measure-ment at the accretion radius.
Another source of uncertainty is associated with theextrapolation of the electron density to rB. This is relatedto the uncertainties in the parameters of the power-lawfit describing the density behavior but also to the choiceof the range of radii to be included. We evaluated thedifferences in ne, repeating the extrapolation using from3 to 6 points of the electron density profile. The adoptedvalue for ne is the average value of these measurements andits uncertainty spans the full range given by the overlapof each individual error bar. This method is graphicallyexplained in Fig. 3.
2 For 3C 066B, 3C 075, 3C 083.1, 3C 338, 3C 449, and3C 465 the K band luminosity is converted from H-band(Donzelli et al. 2007), assuming H - K = 0.21 and for 3C 442 weconvert the V-band luminosity from Smith & Heckman (1989),assuming V - K = 3.30
Fig. 3. Example of the procedure followed to determinethe density at the Bondi radius in the case of 3C 83.1.The dotted (dashed-dotted) line represents the best-fitlinear relation to the density profile obtained by usingthe innermost 3 (6) density measurements, while the dia-mond (star) is its extrapolation to the Bondi radius. Theadopted value for ne is the filled circle at rB.
Concerning uncertainties in the black-hole mass deter-mination, we assume conservatively an error of a factor 3(0.5 dex), regardless of the method used.
The final error in PB is estimated by propagating theerrors of all relevant quantities. We note that since theBondi accretion power is tied to the electron density, re-lated in turn to radius via the value of α, the effectivedependence of PB on the black-hole mass is not simplyfrom M2
BH , but from M2−αBH . Given that the mean α value
estimated (see Table 2) is 1, the propagated uncertaintyis essentially linear with the black-hole mass error.
3.5. Accretion rate estimates and data quality
The methods presented in the previous sections were ap-plied to every source of our sample to estimate the accre-tion power. However, the quality of the data is clearly notalways sufficient to obtain a measure of PB at a level ofaccuracy adequate for our purposes. In the following, wedescribe the quality criteria that we adopted to decide theinclusion or exclusion of a given galaxy from the analysis.
Quality criterion W: weak sources
The first criterion is based on the detection of a sufficientnumber of photons to obtain a reliable estimate of temper-ature and to perform the density deprojection. We requireat least 100 counts in the region used for the temperatureestimate and the presence of at least 5 bins in the sur-face brightness profile. For this reason, we discard 3C 075,3C 78, 3C 189, 3C 293, 3C 442, and UGC 7203. The countsin the X-ray image of UGC 7203, only marginally in excessof the background level, are insufficient to measure even
Balmaverde et al.: The accretion mechanism in radio galaxies 7
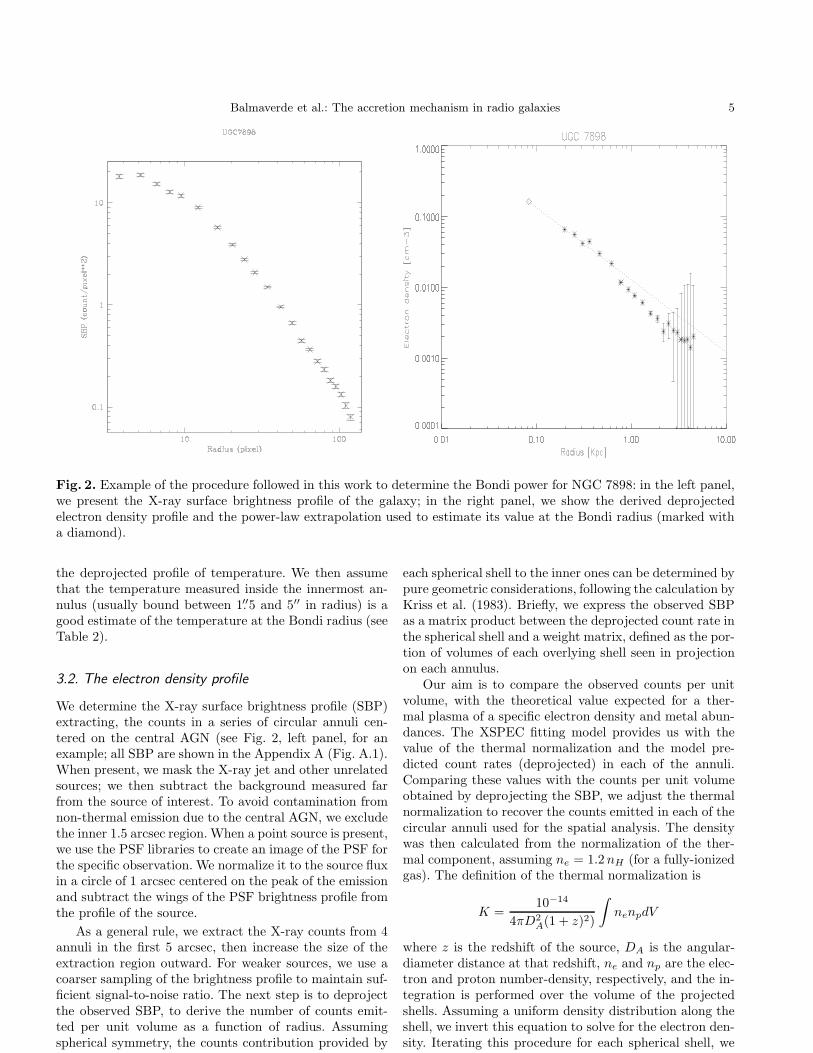
Table 2. Measured Bondi accretion rates and jet power.
Name Flag rB rmin/rB α KT ne MB PB Pj S1kpc
[pc] [keV] [cm−3] [10−3M⊙yr−1] [1043 erg s−1]
3C 028 R 19 101 1.70±0.06 < 3.3 -3.263C 031 E 21 36 0.82±0.08 7.9 -3.533C 066B 69 11 1.2+0.1
−0.3 0.42±0.08 0.35+0.26−0.16 350 390(± 31%) 17.8 -3.72
3C 075 W 41 22 0.57±0.07 6.7 -4.193C 078 W 11 96 1.19±0.08 87.7 -2.743C 083.1 131 7 1.6+0.4
−0.1 0.66±0.06 0.92+0.57−0.48 2100 1300(± 26%) 4.9 -3.79
3C 084 C – – 637.0 -2.533C 189 W 91 17 0.62±0.09 50.5 -3.013C 264 E 29 26 0.52±0.08 18.1 -3.323C 270 32 9 1.2+0.3
−0.2 0.55±0.02 5.4+3.3−3.1 460 260(± 31%) 5.9 -3.72
3C 272.1 * 30 – 0.55+0.19−0.18 0.71±0.05 0.92+0.99
−0.47 85 49(+30%−29%
) 1.5±0.46 -4.05
3C 274 * 117 – 0.00+0.10−0.10 0.80±0.01 0.166+0.036
−0.032 240 145(+28%−40%
) 3.4±1.67 -2.95
3C 293 W – – 33.6 -3.453C 296 32 28 1.7+0.3
−0.2 0.66±0.03 42+42−29 4000 2280(± 37%) 11.3 -3.21
3C 317 C – – 59.4 -3.40
3C 338 * 20 – 0.50+0.07−0.06 1.3±0.7 0.96+0.38
−0.29 55 30.9(+34%−26%
) 1.6±0.47 -2.84
3C 346 E 55 94 0.84±0.05 354.9 -2.713C 348 R 34 339 1.5±0.1 37.7 -2.113C 438 R 13 815 1.41±0.09 133.8 -2.403C 442 W 6 17 1.42±0.11 1.0 -4.153C 449 18 32 1.4+0.4
−0.2 0.64±0.08 18+15−14 530 302(± 38%) 4.6 -4.04
3C 465 42 27 1.4+0.1−0.3 1.11±0.02 12+8
−4 2500 1400(± 25%) 38.3 -3.14
UGC 0968 E 21 10 0.56±0.04 0.15 -4.44UGC 5902 E 8 7 0.44±0.05 0.024 -5.39UGC 6297 7 9 0.9+0.1
−0.7 1.08±0.36 4.0+7.0−1.5 21 4.8(± 51%) 0.067 -5.48
UGC 7203 W – – 0.33 –UGC 7386 23 4 1.8+0.5
−0.3 0.39±0.10 4.2+5.0−3.2 160 89(± 43%) 1.5 -5.35
UGC 7629 * 36 – 0.36+0.12−0.12 0.70±0.16 0.82+0.52
−0.29 110 61.7(+25%−23%
) 0.81±0.23 -4.10
UGC 7760 * 17 – 0.83+0.08−0.08 0.67±0.09 1.26+3.48
−0.81 44 23.4(+22%−21%
) 0.16±0.04 -5.18
UGC 7797 E 10 29 0.71±0.08 0.88 -4.84UGC 7878 * 10 – 0.31+0.09
−0.09 0.54±0.11 0.42+0.26−0.15 47 1.95(± 24%) 0.030±0.008 -4.02
UGC 7898 83 2.4 1.0+0.1−0.2 0.80±0.02 0.16+0.05
−0.04 110 65(± 24%) 0.34 -3.61UGC 8745 15 22 1.7+0.2
−0.5 0.54±0.11 39+56−25 750 420(± 45%) 0.60 -4.75
UGC 9706 * 19 – 0.35+0.26−0.21 0.67±0.09 0.33+0.56
−0.20 13 7.08(+43%−40%
) 0.074±0.026 -3.50
UGC 9723 R 2.5 101 0.73±0.07 0.14 -5.19NGC 1316 E 14 13 0.54±0.06 0.61 -3.94NGC 1399 44 4 1.0+0.1
−0.2 0.88±0.01 2.3+1.1−0.8 490 280(± 28%) 0.22 -3.96
NGC 3557 52 3 1.1+0.5−0.5 0.30±0.09 1.1+1.2
−0.7 190 105(± 41%) 0.74 -4.94
NGC 4696 * 16 – 0.63+0.30−0.30 0.81±0.05 1.58+4.27
−1.13 3.4 25.1(+56%−55%
) 0.79±0.30 -3.97
NGC 5128 C – – 4.5 -4.61NGC 5419 E 45 11 0.78±0.11 1.6 -3.76IC 1459 80 2.4 1.5+0.4
−0.2 0.63±0.03 0.91+0.48−0.44 53 300(± 24%) 7.7 -4.44
IC 4296 59 8 1.6+0.1−0.2 0.62±0.02 9.7+4.5
−3.5 3000 1700(± 20%) 8.7 -3.45
NGC 0507 * 37 – 1.1+0.04−0.04 0.74±0.04 3.43+2.89
−1.70 450 257(± 9%) 10.2±3.37 -3.77
Summary of the measured Bondi accretion rates and power of the FR I, CoreG, and Allen sample (marked with *). Columndescription: (1) name, (2) quality flag, (3) Bondi accretion radius in parsec, (4) ratio between the minimum radius reached byCHANDRA resolution rmin and rB , (5) the logarithmic slope of the density profile, (6) temperature at the accretion radius[keV], (7) electron number density at the accretion radius [cm−3], (8) Bondi accretion rate [M⊙yr−1], (9) predicted Bondi
accretion power [1043 erg s−1], (10) radio jet power [1043 erg s−1] (the error on PJ is assumed to be 0.4 dex, the dispersion ofthe Heinz et al. (2007) relation linking it to the core power except for the Allen et al. objects for which we used their
published values), (11) logarithm of the surface brightness at 1 kpc, S1kpc [counts s−1 arcsec−2].
its brightness profile. These 6 sources are marked with aW (weak) quality flag in Table 2.
Quality criterion C: complex morphologies
In some cases, the X-ray galaxy morphology is quite com-plex, far away from the assumption of spherical symmetry
8 Balmaverde et al.: The accretion mechanism in radio galaxies
on which we based the deprojection technique. This isthe case for three galaxies, namely 3C 084 (Perseus A),3C 317, and NGC 5128 (Cen A) as it can be seen fromtheir respective Chandra images published in the litera-ture (Fabian et al. 2000; Blanton et al. 2003; Kraft et al.2000). These sources are marked with a C (Complex) qual-ity flag in Table 2.
Quality criterion R: large rmin/rB ratio
The Bondi radius of most galaxies in our sample is typi-cally between 10 - 100 pc, which is always unresolved byChandra data, with the only exception of UGC 7629 (akaNGC 4472). However, in some cases, the ratio betweenthe minimum radius at which we are able to measure theelectron density, rmin, and rB is quite large, preventinga reasonable extrapolation of the density profile. For ex-ample, in 3C 348, the density at a Bondi radius of 34 pcshould be obtained from a measurement at ∼ 10 kpc. Allgalaxies (namely 3C 028, 3C 346, 3C 348, 3C 438, as wellas the core galaxy UGC 9723) with rmin/rB > 100 areexcluded from the analysis at this level, and marked witha R flag.
Quality criterion E: large extrapolation errors
We required that the error in the extrapolation of thelogarithm of the electron density to the accretion radius,as described in Sect. 3.4, must be smaller 1. We discardedfor this reason 3C 31, 3C 264, and 3C 346 in the FR Isample and UGC 968, UGC 5902, UGC 7797, NGC 1316,and NGC 5419 among the CoreG (all marked with an E).
We note that the errors in ne of the remaining sourcesare substantially smaller than the adopted threshold andits precise value is therefore not important. Similarly, wealso verify that all sources excluded by the R criterionwould also fall into this flag category, since the extrap-olation over a factor of 100 in radius always produces alarge error in PB, which indicate that the limit chosen forrmin/rB is not important.
To summarize, we have 6 FR I sources and 8 CoreG forwith an accurate estimate of the accretion power at theBondi radius, reported in Table 2, to be added to the 9sources of the Allen et al. sample, for a total of 23 objects.
4. The jet kinetic power
Several estimators of jet kinetic power in radio galax-ies have been devised. A widely used method is basedon the link between extended radio emission and jetpower (Rawlings & Saunders 1991; Willott et al. 1999)that however suffers from substantial uncertainties (e.g.variations in environment, long-term time variability ef-fects), which are particularly severe when dealing withindividual objects. Furthermore, the connection betweenextended radio emission and Pj is calibrated only for FR IIradio galaxies and cannot be simply extrapolated to FR I.
Results from X-ray studies with CHANDRA andXMM-Newton demonstrated the ability of a jet asso-ciated with an active galactic nucleus to blow cavitiesor ‘bubbles’ in the surrounding X-ray emitting-gas (e.g.Boehringer et al. 1993; Fabian et al. 2000; Forman et al.2005). These surface brightness depressions associatedwith radio sources provide us with the most robustand precise estimation of the jet kinetic power (e.gChurazov et al. 2002), assuming that the jet energy in-flates these bubbles at the sound speed.
Measuring the pressure and density of the gas insidethe X-ray bubbles, we can calculate the work done bythe jet on the surrounding medium to inflate the cavi-ties (W ∝ pV ). There are different sources of uncertaintyin the measurements of cavity energy: the projected bub-ble size and the shape and composition of the containedplasma. The energy output is probably underestimatedfor adiabatic losses, cavity disruption, undetected cavi-ties, and the omission of shock energy (e.g. Nusser et al.2006; Binney et al. 2007). All these factors provide an un-certainty in the jet power of at least a factor of a few.Unfortunately, only a limited number of objects clearlyshows surface brightness depressions associated with a ra-dio source.
Heinz et al. (2007) derived a relation between the ra-dio core luminosity Lν and the jet kinetic power Pj us-ing a sample of 15 galaxies that showed jet-driven X-ray cavities. The slope of the relation is determined bytheoretical assumption about the jet emission, modeledby a power-law spectrum, while the normalization is ob-tained empirically. The possible drawbacks of this ap-proach are related to nuclear variability (as opposed tothe time-averaged value obtained from the X-ray cavities)and Doppler boosting. Nonetheless, they showed that asignificant relation between these two quantities exists inthe form:
Pj = P0
(
Lν
L0
)12
17
where P0 is a constant which has a value 1.0+1.3−0.6 1044
erg s−1, when L0 is fixed at L0 = 7 1029 ergHz−1 s−1.This relation then provides us with a simple and ratherrobust (with a scatter of 0.4 dex) estimate of the totaljet power based only on the measure of the core power, aquantity available for all sources of our sample, with theonly exception of 3C 028.
We note that since the research by Heinz et al. (2007),two further measurements of Pj based on X-ray cavitieshave been published (Shurkin et al. 2007). These two ob-jects (namely NGC 1399 and NGC 4649) closely followthe Pj - Lcore relation, providing further support of itsvalidity. Given the good agreement we do not need to re-estimate the value of P0.
Balmaverde et al.: The accretion mechanism in radio galaxies 9
Table 3. Correlations summary
Var. A Var. B N. objects r ρ P(ρ) Slope q rms
PB Pj 23 0.84 0.76 3×10⁻⁵ 1.10±0.11 -1.91±0.20 0.40P∗
B P∗j 9 0.94 0.93 0.0003 1.33±0.11 -2.18 0.20
kT Pj 23 -0.04 -0.08 0.73 -1.25±0.66 -0.06 0.82ne Pj 23 0.34 0.29 0.18 1.13±0.21 -0.17 0.77
MBH Pj 23 0.59 0.60 0.002 2.01±0.23 -17.6 0.66MBH Pj 44 0.46 0.48 0.001 2.05±0.20 -17.4 0.94S1kpc Pj 43 0.73 0.72 8×10⁻⁸ 1.17±0.11 4.89 0.67
Col. (1) and (2) the correlated variables; Col. (3) the number of objects used; Col. (4) the linear correlation coefficient r; Col.(5) the Spearman’s rank correlation ρ and (6) the probability of no correlation between the variables; Col. (7) the slope of thecorrelation; Col. (8) the intercept q; Col. (9) the rms scatter from the correlation. * : PB-Pj relation using only data from the
9 objects in Allen et al. (2006).
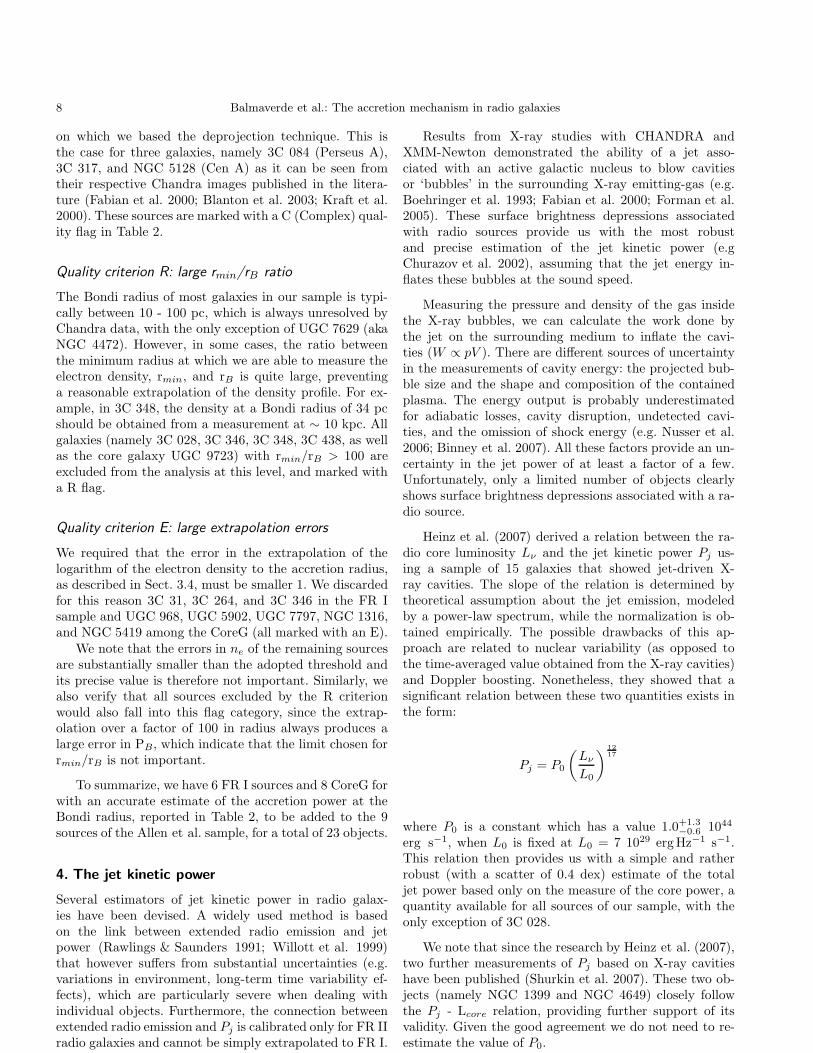
Fig. 4. Bondi accretion power versus jet power. The starsrepresent FR I objects, the circles are the CoreG and thetriangles represent the objects from Allen et al. sample.We also plot the best-fit linear relation(solid line).
5. Results
5.1. The connection between jet and accretion power
The estimated accretion rates at the Bondi radius in thegalaxies of our sample are in the range from ∼ 3 × 10⁻⁴−
4 × 10⁻¹ M⊙ year−1, corresponding to an available accre-tion power of ∼ 2 × 1042 − 2 × 1045erg s−1
In Fig. 4, we compare the estimated jet power andBondi accretion power for the 23 objects for which wewere able to measure this quantity3. The Bondi accretionpower and the jet power are strongly correlated, with a
3 With respect to Allen et al. we exchanged the variables onthe two axis and used PB = MBc2 directly without any as-sumption about the efficiency of conversion of rest mass intoenergy.
Spearman’s rank coefficient of ρ = 0.76. The probabilitythat this is produced by from a random distribution isonly 3×10⁻⁵. The linear correlation coefficient is insteadr = 0.84 (see Table 3 for a summary of the statistical anal-ysis). The best-fit linear relations were derived to be thebisectrix of the fits using the two quantities as indepen-dent variables; this followed the suggestion of Isobe et al.(1990) and is the preferable for problems that require thesymmetrical treatment of the variables. The best-fit linearrelation, weighted for the errors of both the quantities, is
log(Pj) = (1.10±0.11)×log(PB) - 1.91±0.20
in 1043 erg s−1 units. The rms dispersion of the data fromthe fit is 0.4 dex. Therefore, the jet power is, within theuncertainties, linearly related to the Bondi rate over 3 or-ders of magnitude with a scatter of less than a factor of 3.Unfortunately, all but 6 FR I had to be excluded from theanalysis of the density profile (due partly to the presence ofbright point sources and to a larger than average distance)and this prevents being able explore the behavior of thePB vs Pj relation at the high end of radio luminositiesof the sample. The efficiency of the conversion betweenaccretion and jet power is 1.2+0.7
−0.4 %. We note that theslope found by Allen et al. corresponds, in our notation,to 1.30±0.34 with a normalization of 2.2+1.0
−0.7 % for Pj =1043 erg s−1, consistent within 1 sigma confidence levelwith our values.
Since the Bondi accretion rate depends on the black-hole mass, the central gas density and temperature, it isimportant to assess whether the relation between Pj andPB, discussed above, is driven mostly by only one of thesequantities. To estimate these dependences, we comparethe jet power with each of these variables separately.
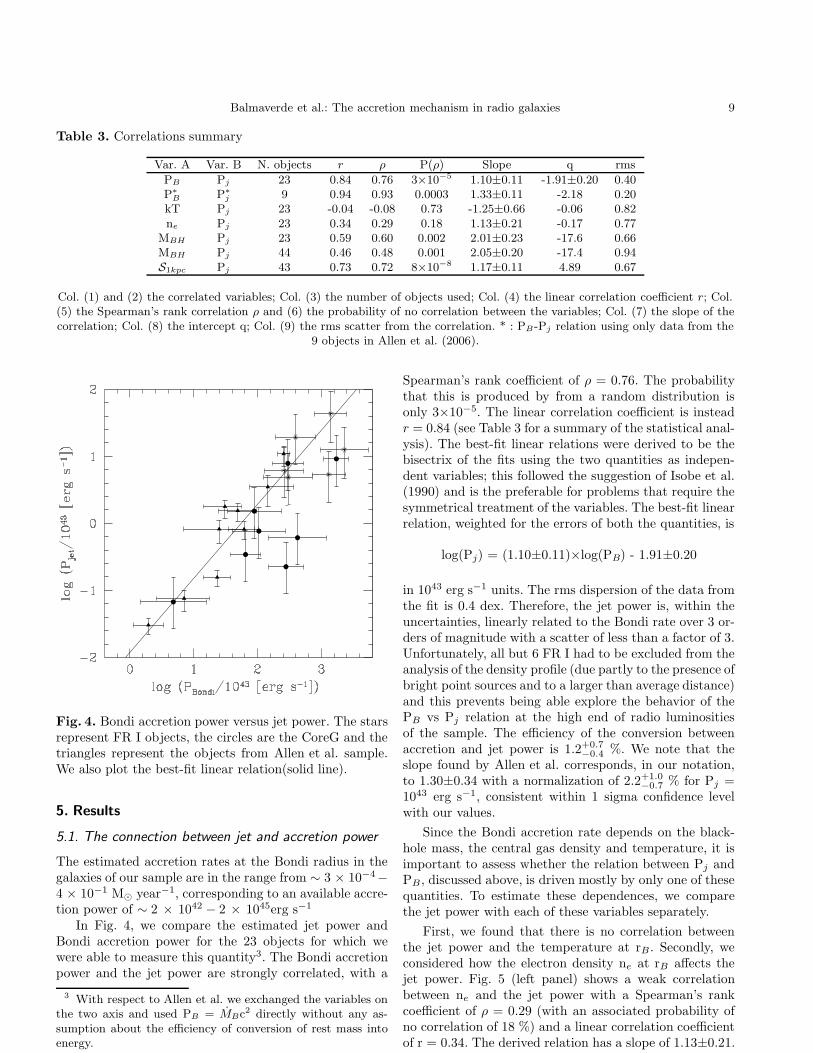
First, we found that there is no correlation betweenthe jet power and the temperature at rB. Secondly, weconsidered how the electron density ne at rB affects thejet power. Fig. 5 (left panel) shows a weak correlationbetween ne and the jet power with a Spearman’s rankcoefficient of ρ = 0.29 (with an associated probability ofno correlation of 18 %) and a linear correlation coefficientof r = 0.34. The derived relation has a slope of 1.13±0.21.

10 Balmaverde et al.: The accretion mechanism in radio galaxies
Thirdly, we correlated Pj with the black-hole massesof the 23 objects for which we were able to estimate theaccretion rate: Fig. 5 (middle panel) shows a correlationwith a slope ∼2 and a rms scatter of 0.66 dex. However, wecan consider the measurements of mass for all 44 galaxiesin the sample, regardless of the possibility to estimate PB.In particular, this enables us to include the strongest ra-dio sources, radically changing the picture. The strengthof the correlation between MBH and Pj is strongly re-duced (see Table 3 and Fig. 5, right panel) using the en-tire sample. Most importantly, we find objects at a givenblack-hole mass with Pj differing by 3 orders of magni-tude and indeed the rms scatter of the residual is almostof 1 order of magnitude. This result was presented inCapetti & Balmaverde (2005) where we discussed this is-sue using the same sample but without the further require-ment of the availability of Chandra data: while CoreGdefine a correlation between MBH and Lcore (and conse-quently with Pj), FR I radio galaxies have much largerradio core luminosities at the similar value of MBH whichproduces a large scatter in the Pj-MBH plane.
We conclude that the jet power shows a connection tothe Bondi accretion rate, which is stronger than those toMBH , ne, or T separately. This indicates that Pj vs PB
is the primary relation that does not descend from any ofthese quantities separately.
5.2. Jet power and surface brightness profiles
The analysis presented in the previous Section revealedthe presence of a strong correlation between the jet powerand the central properties of the galaxy, in particular withthe gas density and black-hole mass. However, radio galax-ies of different power differ also ion terms of the globalproperties of their X-ray emitting hot coronae.
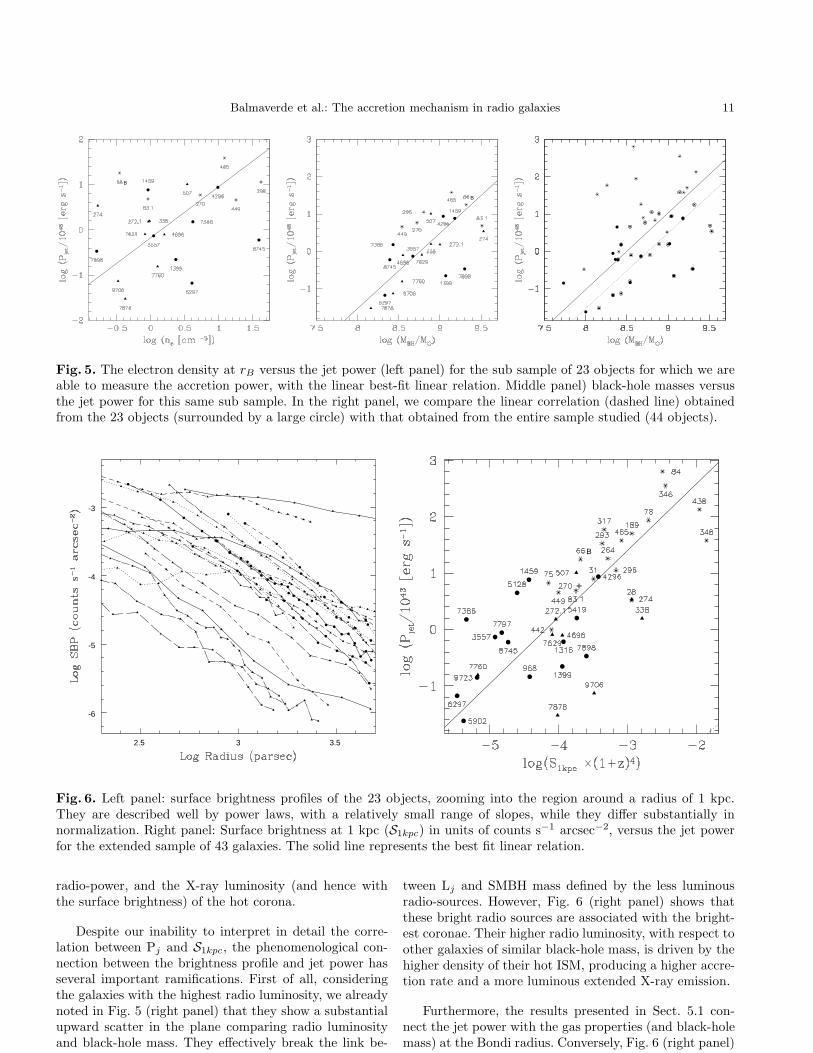
These differences are clearly evident in a comparisonof their surface brightness profiles (shown in Fig. 6 forthe sub sample of 23 galaxies with estimated PB). TheirSBP are described well by power-laws, with a relativelysmall range of slopes (<∆logS/∆logr>= -1.7±0.6)4 whilethey differ substantially in normalization. The remainingsources of the sample show a similar behavior with an evenincreased range of intensity5. To quantify these differences,we estimated the value of the surface brightness at 1 kpc,(hereafter S1kpc) a radius accessible for almost all galaxies,by interpolating locally the profile with a power-law. Thegalaxies of our sample cover 3.5 orders of magnitude inS1kpc (see Table 2).
The intensity of the brightness profile at 1 kpc turnsout to be strongly correlated with the radio-jet power (seeFig. 6, right panel). The correlation coefficient of this re-lation is 0.73, the rms is 0.67, and the Spearman rank co-
4 The average slope corresponds to the large scale behaviorof an isothermal β model with β = 0.45
5 Only the galaxy UGC 7203, showing extended emissiononly marginally in excess of the background level, is excludedfrom this analysis
efficient is 0.72. The probability, associated with this rankvalue, that this is produced by a random distribution is8×10−8. The slope of the correlation is 1.17±0.11.
A significant advantage of this approach, based sim-ply on the surface brightness profile, is the possibility ofincluding in the analysis also galaxies for which the datawere of insufficient quality to estimate the electron den-sity at the Bondi radius. In particular, this enables us toextend the range of jet power probed to 4.5 orders of mag-nitudes. This is due to two reasons. As already noted, onthe one hand, the most luminous radio galaxies did not, ingeneral, have reliable density profiles due to the contam-ination of the nuclear source and to their average largerdistance (e.g. 3C 84 and 3C 346). On the other hand, wefind that the objects with the lowest radio luminosity cor-respond to hot coronae of lower surface brightness, whichwere then excluded from the analysis due to insufficientcount rates in their X-ray images (e.g. UGC 5902 andUGC 9723).
Therefore, the jet power of a given object can be pre-dicted with an rms uncertainty of only a factor of 5 bylooking at the intensity of the X-ray emission producedby the galactic hot corona.
Since the brightness profiles are directly related to thegas electron density, the large range of brightnesses ob-served reflects the different distributions of hot gas in thecenters of these galaxies. A link between brightness profileand jet power is expected because the electron density isone of the critical parameters that, with the BH mass, de-termine the accretion flow. It must however be noted that,in the case of Bremsstrahlung emission, the expected de-pendence is in the form Pj ∝ S1kpc
0.5. 6
This suggests that our assumption of simple homol-ogy in the hot coronae, described only by the normal-ization of the brightness profile, is probably an over-simplification. Other variables can influence the relationbetween Pj and S1kpc, for example, a dependence of theSBP shape (e.g. its core radius or outer slope) on lumi-nosity. There is an indication of the existence of a fun-damental plane for the X-ray emitting gas, linking thetemperature with the surface brightness and half-light (inX-ray) radius (Diehl & Statler 2005). It is likely that amore robust parametrization of the hot corona properties,not simply its intensity at a fixed radius, might reveal aneven stronger link with the AGN properties, but this isbeyond the scope of this paper.
An alternative explanation for the steeper than ex-pected dependence between brightness profile and jetpower originates in a result described by Best et al.(2005). They found that the total mass of gas coolingwithin an isothermal hot corona is Mcool ∝ LX/T andthat this has the same dependence on black-hole massas the radio-loud AGN fraction Mcool ∝ M1.5
BH. This im-plies that a linear relation exists between the cooling rate,
6 We tested that the inclusion of the effects on temperatureof the count rates produces a marginal improvement in thecorrelation, but leaves the slope unchanged.
Balmaverde et al.: The accretion mechanism in radio galaxies 11
B
B
Fig. 5. The electron density at rB versus the jet power (left panel) for the sub sample of 23 objects for which we areable to measure the accretion power, with the linear best-fit linear relation. Middle panel) black-hole masses versusthe jet power for this same sub sample. In the right panel, we compare the linear correlation (dashed line) obtainedfrom the 23 objects (surrounded by a large circle) with that obtained from the entire sample studied (44 objects).
2.5 3 3.5
-6
-5
-4
-3
B
Fig. 6. Left panel: surface brightness profiles of the 23 objects, zooming into the region around a radius of 1 kpc.They are described well by power laws, with a relatively small range of slopes, while they differ substantially innormalization. Right panel: Surface brightness at 1 kpc (S1kpc) in units of counts s−1 arcsec−2, versus the jet powerfor the extended sample of 43 galaxies. The solid line represents the best fit linear relation.
radio-power, and the X-ray luminosity (and hence withthe surface brightness) of the hot corona.
Despite our inability to interpret in detail the corre-lation between Pj and S1kpc, the phenomenological con-nection between the brightness profile and jet power hasseveral important ramifications. First of all, consideringthe galaxies with the highest radio luminosity, we alreadynoted in Fig. 5 (right panel) that they show a substantialupward scatter in the plane comparing radio luminosityand black-hole mass. They effectively break the link be-
tween Lj and SMBH mass defined by the less luminousradio-sources. However, Fig. 6 (right panel) shows thatthese bright radio sources are associated with the bright-est coronae. Their higher radio luminosity, with respect toother galaxies of similar black-hole mass, is driven by thehigher density of their hot ISM, producing a higher accre-tion rate and a more luminous extended X-ray emission.
Furthermore, the results presented in Sect. 5.1 con-nect the jet power with the gas properties (and black-holemass) at the Bondi radius. Conversely, Fig. 6 (right panel)
12 Balmaverde et al.: The accretion mechanism in radio galaxies
sets a link between the global properties of the hot coro-nae and the level of AGN activity. The implication of thisresult is that a substantial variation in the jet power in agiven galaxy must be accompanied by a global change inits ISM properties. This can only occur when a dramaticevent, such as a major merger, takes place. This is an in-dication that the accretion flow is stable over significanttimescales and that, most likely, the long-term level ofjet power remains stable over the interval between majormergers.
Finally, the correlation between Pj and S1kpc providesus with a simple and rather robust method to estimate thejet power, with an accuracy of better than a factor of ∼ 5,based only on the measurement of the brightness of the hotgas at a fixed radius, 1 kpc for the sample considered here.Clearly, this is applicable to X-ray data of relatively poorquality and/or spatial resolution that would not enablea full spectral fitting and deprojection down to a spatialscale comparable to the Bondi radius. Indeed, this alreadyfound a useful application in the context of this work, asit enabled us to understand the properties of the brightFR I. We expect to be able to use this method also, forexample, for more distant (and hence more powerful) radiogalaxies.
6. Constraints on the accretion process and on its
radiative efficiency
In Balmaverde & Capetti (2006), we noticed that theX-ray nuclei of CoreG have luminosities of typicallyL/LEdd ∼ 10−6 − 10−9 expressed in fraction of theEddington luminosity. Furthermore, the tight correlationsbetween radio, optical, and X-ray nuclear emission arguein favor of a jet origin for the nuclear emission. In FR Iradio galaxies, the dominant contribution from jet emis-sion is confirmed directly by the high polarization of theiroptical nuclei (Capetti et al. 2007). This implies that theobserved nuclear emission does not originate in the ac-cretion process and the values reported above should beconsidered as upper limits.
These results add to the already vast literature report-ing emission corresponding to a very low fraction of theEddington luminosity associated with accretion onto su-permassive black holes. This prompted the idea that inthese objects accretion occurs not only at a low rate butalso at a low radiative efficiency, such as in the AdvectionDominated Accretion Flows (ADAF, Narayan & Yi 1995).The ADAF models have been rather successful in model-ing the observed nuclear spectrum in several galaxies, suchas e.g. the Galactic Center and NGC 4258 (Narayan & Yi1995; Lasota et al. 1996). However, even ADAF mod-els over-predict the observed emission in the nuclei ofnearby bright elliptical galaxies (Di Matteo et al. 2000;Loewenstein et al. 2001; Pellegrini 2005).
This suggested the possibility that a substantial frac-tion of the mass included within the Bondi’s accretionradius might not actually reach the central object, thusfurther reducing the radiative emission from the accretion
process. This may be the case in the presence of an out-flow (Advection Dominated Inflow/Outflow Solutions, orADIOS, Blandford & Begelman 1999) or strong convec-tion (Convection Dominated Accretion Flows, or CDAF,Quataert & Gruzinov 2000) in which most gas circulatesin convection eddies rather than accreting onto the blackhole. These arguments apply also to the galaxies con-sidered here, since the available accretion powers deter-mined in the Sect. 3 exceed by several orders of magnitudethe observed nuclear X-ray luminosities LX . More quan-titatively, the comparison of the values of LX reportedin Balmaverde & Capetti (2006) and Balmaverde et al.(2006) and PB correspond to typical ratios of LX / PB
∼ 10−4 − 10−5.In the case of the radio-loud objects considered here,
we have further information that can be used to constrainthe properties of the accretion process, related to the pres-ence of jets. In fact the mass flowing along the jet, mj,cannot exceed the mass rate at the radius of accretiondisk, mdisk. The jet power, for a matter-dominated jet,can be expressed as Pj ∼ Γmjc
2 where Γ is the jet Lorentzfactor. If we denote with f the fraction of gas crossingthe Bondi radius that actually reaches the accretion disk(that is mdisk = fmB) and since the correlation betweenjet and Bondi power gives us
Pj ∼ 0.012 mBc2
the condition mj < mdisk translates into a lower limit tof as
f > 0.012 Γ−1
Assuming the estimate of jet Lorentz for FR I radio galax-ies, Γ ∼ 5, derived from Giovannini et al. (2001) this limitbecomes
f & 0.0024
Numerical simulations performed by Zanni et al. (2007)suggest that plasma within the accretion disk can be chan-neled into the jet with a rather high efficiency, mj ∼
0.2− 0.55 mdisk from which f ∼ 0.01.On the other hand, the correlation between the nuclear
X-ray luminosities and the radio-core luminosities derivedin (Balmaverde & Capetti 2006) sets a limit to the diskemission as
log(LX) < 1.40 + log(νLR)
The X-ray luminosity can be expressed as
LX = ηxmdiskc2 = ηxfmBc
2 = 0.012−1ηxfPj
where ηx is the efficiency of conversion of rest mass into en-ergy radiated within the 2-10 keV band. Taking advantageof the link between radio-core luminosity and jet powerdiscussed in Sect. 4, we obtain:
logLX = 24.84 + log(ηxf) + 12/17 logLR
leading to
log(ηxf) < 5/17 logLR − 13.74
The limit on ηxf is most stringent for the objects of lowerradio luminosity. For example, for LR = 1027 erg/s/Hz 7
7 corresponding to log νLR = 36.7

Balmaverde et al.: The accretion mechanism in radio galaxies 13
this corresponds to ηxf < 1.6 × 10⁻⁶. When combined tothe limit of f obtained above, this implies
ηx < 1.3× 10⁻⁴ Γ ∼ 6.5× 10⁻⁴
To derive the total disk radiative efficiency we have toestimate the bolometric correction corresponding to the 2-10 keV band. This is a complex task, since little is knownabout the spectral energy distribution of our sources and,in addition, their broad-band nuclear spectrum is dom-inated by jet emission. Marconi et al. (2004) estimatedbolometric corrections at different levels of luminosity byusing suitably-built AGN templates and found that the2-10 keV bolometric correction decreases with decreas-ing luminosity, down to ∼ 8 for a bolometric luminos-ity of ∼ 1042 erg s−1. By adopting this value, we derivea bolometric disk radiative efficiency of η . 0.005. Thislimit is substantially smaller than the ‘canonical’ value of0.1 and of the estimates derived from matching the massfunction of local SMBH with the AGN relics, η ∼ 0.08(Marconi et al. 2004; Shankar et al. 2007). This is an in-dication that accretion in these objects occurs not only ata smaller rate, but also at lower efficiency than in standardaccretion disks.
7. Summary and conclusions
We have presented our results concerning the connectionbetween the accretion rate of hot gas, estimated in theBondi’s spherical approximation, and the jet power in asample of low-luminosity radio galaxies. The sample wasformed by combining radio galaxies with FR I morphologyextracted from the 3C catalogue and early-type galaxieswith a ‘core’ optical brightness profile. Galaxies of this lat-ter sub sample have been shown to represent “miniature”radio galaxies, being drawn from the same population ofearly-type galaxies as the FR I hosts and differing from“classical” FR I radio galaxies only in a lower level of nu-clear activity. This combined FR I/CoreG sample coversthe full range of radio-luminosity of FR I, spanning fiveorders of magnitude.
In the Chandra public archive, there were observationsavailable for 44 objects of the sample. These data wereused to derive profiles of X-ray brightness and of gas tem-perature that, once deprojected, provided a measurementof the electron gas density at the Bondi radius. When com-bined with the mass of the central black hole, these valuesprovided us with an estimate of the accretion rate of hotgas, PB. The quality and/or spatial resolution of the datawas sufficient to obtain a measure of PB at a level of ac-curacy adequate for our purposes for a sub sample of 23galaxies.
To estimate the jet power, we took advantage of anempirical relation linking the jet kinetic power, Pj , to theradio-core luminosity. This method freed us from the needof detecting X-ray cavities inflated by a radio jet to mea-sure its power and enabled us to estimate Pj with an rmserror of 0.4 dex for all galaxies in our sample.
We found that a tight, linear relation links the accre-tion with the jet power whose normalization sets the effi-ciency of the conversion between accretion and jet powerto ∼ 1.2%. These results strengthen and extend the valid-ity of the results obtained by Allen et al. (2006) based onthe analysis of 9 low-luminosity radio galaxies.
In addition, we found that the jet power is closely con-nected also with the surface brightness of the X-ray emis-sion, measured at the fixed radius of 1 kpc. This is a simplequantity to measure; it was therefore possible to considerin the analysis all galaxies, including those for which thedata were of insufficient quality to estimate the Bondi ac-cretion rate. This method could be extended to objects ofthe highest radio luminosity, which did not provide use-ful estimates of PB, showing that they are associated withthe brightest coronae. This implies that the different levelsof radio luminosity are not only associated with nuclearquantities (such as the gas density and black-hole mass)but also to global differences in the structure of the galac-tic hot coronae. A substantial change in the jet power mustbe accompanied by a global change in its ISM properties,driven e.g. by a major merger.
At the estimated accretion rates at the Bondi radius,MB, even ADAF models substantially over-predict the ob-served X-ray nuclear emission suggesting that a substan-tial fraction of the mass crossing the Bondi radius doesnot reach the central object. On the other hand, the massrate at the outer radius of the accretion disk must be suffi-cient to maintain the mass flow along the jet. This requiresthat at least a mass fraction of & 0.0024MB reaches theaccretion disk. The X-ray nuclear luminosity correspond-ing to this accretion rate does not exceed the observedluminosities of the nuclear X-ray sources (having assumeda bolometric correction of 8 for the 2-10 keV band) onlywhen the radiative disk efficiency is η . 0.005, substan-tially smaller than the ‘canonical’ value of 0.1. This is anindication that accretion in these objects occurs not onlyat a smaller rate, but also at lower efficiency than in stan-dard accretion disks.
The picture which emerges is that the accretion of hotgas associated with the host galaxy corona represents thedominant process of fueling for FR I radio galaxies acrosstheir full range of radio luminosity, spanning from thefaintest level of detectable activity to radio-luminositiesmarking the transition between FR I and FR II objects.The differences of AGN power across this wide range ofluminosity are determined by the available supply of gas,which we found to be closely related to the global prop-erties of the hot corona. These results provide a strongevidence for the presence of a feedback process linking thehost galaxy with the active nucleus since the same hot gasthat provides the supply to the supermassive black holeis also the repository of the kinetic energy liberated intothe ISM by the jets. Clearly, it will be of great interestto explore how the hot gas content is connected to theevolution of the host galaxy and to its merger history.
Another interesting issue is the fate of the gas withinthe Bondi accretion radius. While on the one handm the
14 Balmaverde et al.: The accretion mechanism in radio galaxies
spherical accretion provides, a posteriori, a good descrip-tion of gas inflow in the central regions of these activegalaxies, only a small fraction of the gas is allowed toreach the accretion disk.
At small radii, the spherical inflow must thereforebreak and the bulk of the accreting gas must be removedfrom its large-scale motion toward the central black hole.The (almost) linear relation between jet power and accre-tion rate indicates that the efficiency of this mechanismmust have only a very weak dependence on the amountof accreting gas. Apparently, also the fraction of gas ulti-mately launched into the relativistic jet is essentially in-dependent of the jet power. Accounting for this complexphenomenology represents an important challenge if wewant to preceed in our understanding of the process ofaccretion and jet formation in active nuclei.
A crucial question that must also be addressed is whichmanifestation of an active nucleus can be supported by hotaccretion. Although the galaxies considered span a largerange of radio power, it is important to establish whetherhot accretion is sufficient to power FR II radio galaxiesof even higher luminosity or, alternatively, above somethreshold an additional source of fuel, possibly associatedwith an ISM phase of lower temperature. The results pre-sented here refer only to radio-loud AGN that channel asignificant fraction of the accretion power into jet kineticenergy. However, hot accretion might also be important inpowering radio-quiet AGN. We will explore this possibilityin a forthcoming paper.
Acknowledgements. We acknowledge the usage of theHyperLeda database (http://leda.univ-lyon1.fr).
References
Allen, S. W., Dunn, R. J. H., Fabian, A. C., Taylor, G. B., &Reynolds, C. S. 2006, MNRAS, 372, 21
Auriemma, C., Perola, G. C., Ekers, R. D., et al. 1977, A&A,57, 41
Balmaverde, B. & Capetti, A. 2006, A&A, 447, 97 (BC06)Balmaverde, B., Capetti, A., & Grandi, P. 2006, A&A, 451, 35Bennett, A. S. 1962, MmRAS, 68, 163Best, P. N. 2004, MNRAS, 351, 70Best, P. N., Kauffmann, G., Heckman, T. M., et al. 2005,
MNRAS, 362, 25Binney, J., Bibi, F. A., & Omma, H. 2007, MNRAS, 377, 142Bırzan, L., Rafferty, D. A., McNamara, B. R., Wise, M. W., &
Nulsen, P. E. J. 2004, ApJ, 607, 800Blandford, R. D. & Begelman, M. C. 1999, MNRAS, 303, L1Blanton, E. L., Sarazin, C. L., & McNamara, B. R. 2003, ApJ,
585, 227Boehringer, H., Voges, W., Fabian, A. C., Edge, A. C., &
Neumann, D. M. 1993, MNRAS, 264, L25Bondi, H. 1952, MNRAS, 112, 195Burns, J. O. 1990, AJ, 99, 14Capetti, A., Axon, D. J., Chiaberge, M., et al. 2007, A&A, 471,
137Capetti, A. & Balmaverde, B. 2005, A&A, 440, 73 (CB05)Chiaberge, M., Capetti, A., & Celotti, A. 1999, A&A, 349, 77Churazov, E., Sunyaev, R., Forman, W., & Bohringer, H. 2002,
MNRAS, 332, 729
de Ruiter, H. R., Parma, P., Capetti, A., Fanti, R., & Morganti,R. 2002, A&A, 396, 857
Di Matteo, T., Quataert, E., Allen, S. W., Narayan, R., &Fabian, A. C. 2000, MNRAS, 311, 507
Diehl, S. & Statler, T. S. 2005, ApJ, 633, L21Donzelli, C. J., Chiaberge, M., Macchetto, F. D., et al. 2007,
ApJ, 667, 780Fabian, A. C., Sanders, J. S., Ettori, S., et al. 2000, MNRAS,
318, L65Forman, W., Nulsen, P., Heinz, S., et al. 2005, ApJ, 635, 894Giovannini, G., Cotton, W. D., Feretti, L., Lara, L., & Venturi,
T. 2001, ApJ, 552, 508Gliozzi, M., Sambruna, R. M., & Brandt, W. N. 2003, A&A,
408, 949Hardcastle, M. J., Evans, D. A., & Croston, J. H. 2007,
MNRAS, 376, 1849Heinz, S., Merloni, A., & Schwab, J. 2007, ApJ, 658, L9Isobe, T., Feigelson, E. D., Akritas, M. G., & Babu, G. J. 1990,
ApJ, 364, 104Kraft, R. P., Forman, W., Jones, C., et al. 2000, ApJ, 531, L9Kriss, G. A., Cioffi, D. F., & Canizares, C. R. 1983, ApJ, 272,
439Lasota, J.-P., Abramowicz, M. A., Chen, X., et al. 1996, ApJ,
462, 142Lauer, T. R., Ajhar, E. A., Byun, Y.-I., et al. 1995, AJ, 110,
2622Loewenstein, M., Mushotzky, R. F., Angelini, L., Arnaud,
K. A., & Quataert, E. 2001, ApJ, 555, L21Marconi, A. & Hunt, L. K. 2003, ApJ, 589, L21Marconi, A., Risaliti, G., Gilli, R., et al. 2004, MNRAS, 351,
169Mauch, T. & Sadler, E. M. 2007, MNRAS, 375, 931Narayan, R. & Yi, I. 1995, ApJ, 444, 231Nusser, A., Silk, J., & Babul, A. 2006, MNRAS, 373, 739Pellegrini, S. 2005, ApJ, 624, 155Quataert, E. & Gruzinov, A. 2000, ApJ, 539, 809Rawlings, S. & Saunders, R. 1991, Nature, 349, 138Shankar, F., Weinberg, D. H., & Miralda-Escude’, J. 2007,
ArXiv e-prints, 710Shurkin, K., Dunn, R. J. H., Gentile, G., Taylor, G. B., &
Allen, S. W. 2007, ArXiv e-prints, 710Smith, E. P. & Heckman, T. M. 1989, ApJ, 341, 658Tremaine, S., Gebhardt, K., Bender, R., et al. 2002, ApJ, 574,
740Valentijn, E. A. & Bijleveld, W. 1983, A&A, 125, 223Willott, C. J., Rawlings, S., Blundell, K. M., & Lacy, M. 1999,
MNRAS, 309, 1017Zanni, C., Ferrari, A., Rosner, R., Bodo, G., & Massaglia, S.
2007, A&A, 469, 811
Appendix A:
Balmaverde et al.: The accretion mechanism in radio galaxies 15

16 Balmaverde et al.: The accretion mechanism in radio galaxies

Balmaverde et al.: The accretion mechanism in radio galaxies 17
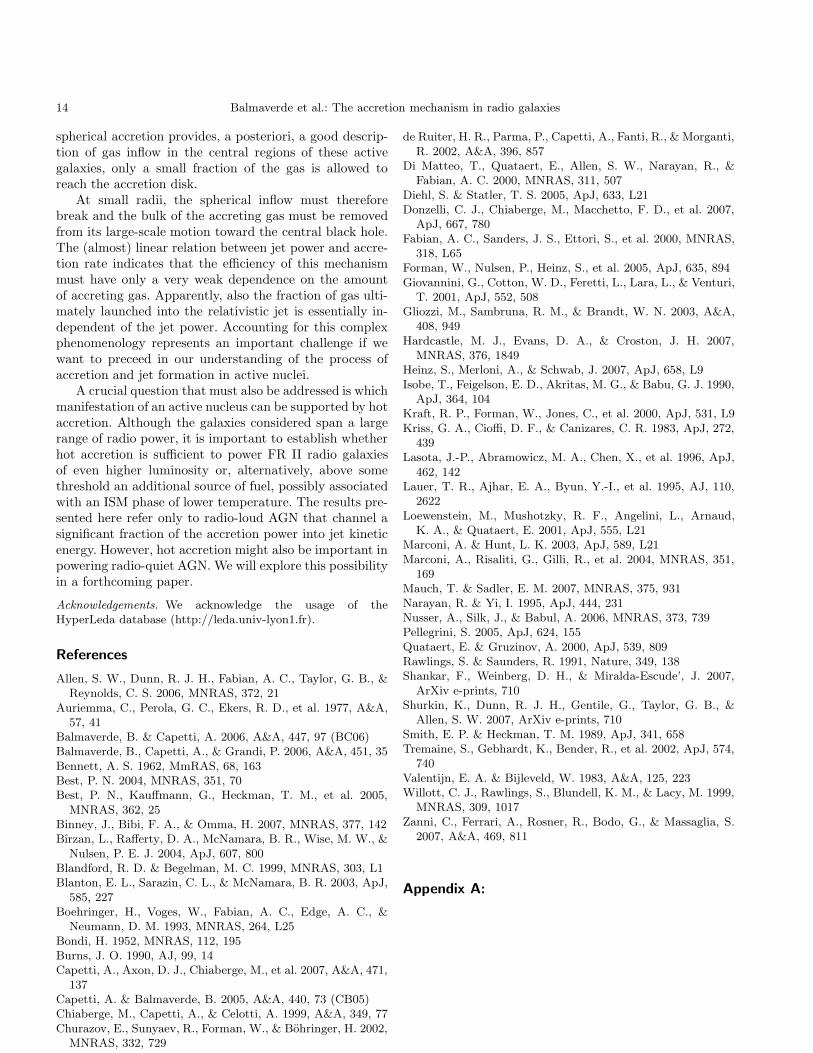
Fig.A.1. The X-ray surface brightness profiles of the 43 galaxies of the sample, having excluded UGC 7203.

18 Balmaverde et al.: The accretion mechanism in radio galaxies
Balmaverde et al.: The accretion mechanism in radio galaxies 19
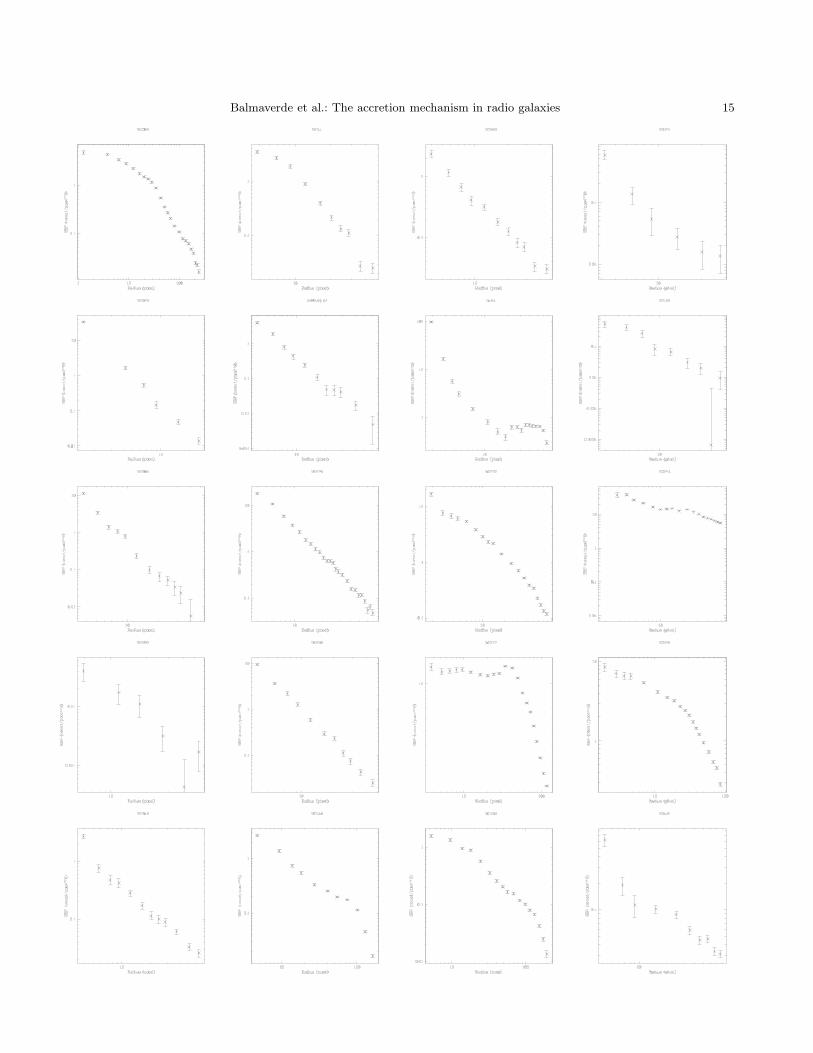
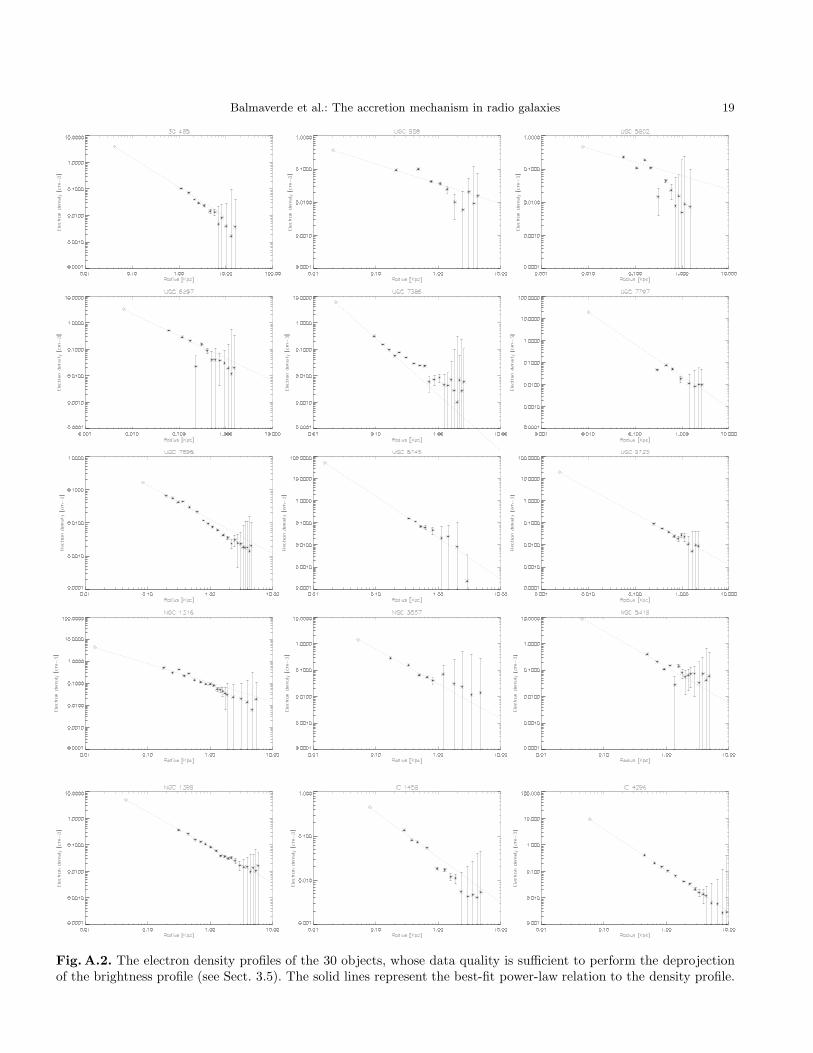
Fig.A.2. The electron density profiles of the 30 objects, whose data quality is sufficient to perform the deprojectionof the brightness profile (see Sect. 3.5). The solid lines represent the best-fit power-law relation to the density profile.